u.s. consumer spending outlook presented to: global insight spring outlook seminar chicago, illinois...
Post on 18-Dec-2015
216 views
TRANSCRIPT

U.S. Consumer Spending Outlook
Presented to:Global Insight Spring Outlook Seminar
Chicago, IllinoisMay 26, 2004
Presented by:Sara Johnson
Managing Director,Global Macroeconomics Group
Copyright © 2003 Global Insight, Inc.

Copyright © 2004 Global Insight, Inc. 2
U.S. Consumer Spending Keeps Growing!
• The recession that began in March 2001 was the first on record without a decline in real consumer spending.
• Low interest rates, tax cuts, and appreciating home values supported durable goods spending as unemployment rose.
• By mid-2002, job losses and depleted equity wealth caused households to restrain spending growth.
• More federal tax cuts and a stock market rally gave consumers a second wind in the summer of 2003.
• A solid rebound in employment and rising net worth will spark 4.0% growth in real consumer spending in 2004.
• But total spending will soon decelerate as tax cuts end and interest rates rise.

Copyright © 2004 Global Insight, Inc. 3
Retail Sales—A Great Start to 2004
Jan. Feb. March April %chya
Total Retail Sales 0.5 1.0 2.0 -0.5 8.0
Motor Vehicles -2.8 2.2 2.4 -1.8 3.6
Home Furnishings 1.2 0.6 1.4 0.7 9.8
Electronics & Appliances 0.0 0.9 1.0 0.8 12.4
Building Materials 0.6 0.4 11.0 -0.7 20.4
Health & Personal Care 0.6 -0.5 1.9 -0.1 6.8
Apparel 2.1 0.9 0.8 -2.0 8.2
General Merchandise 1.0 1.4 0.4 -0.8 7.2
Food & Beverage Stores 1.8 -0.5 0.7 0.5 4.2
Food Service Places 2.1 1.0 0.6 -0.1 10.9
(Percent change)
%chya = percent change from April 2003 to April 2004

Copyright © 2004 Global Insight, Inc. 4
Real Consumer Spending and Confidence
0
1
2
3
4
5
6
7
1999 2000 2001 2002 2003 2004 2005 2006 2007 2008
75
80
85
90
95
100
105
110
Real Consumption Growth Consumer Sentiment
(Annual percent change) (Michigan Index, 1966=100)
Copyright © 2004 Global Insight, Inc. 5
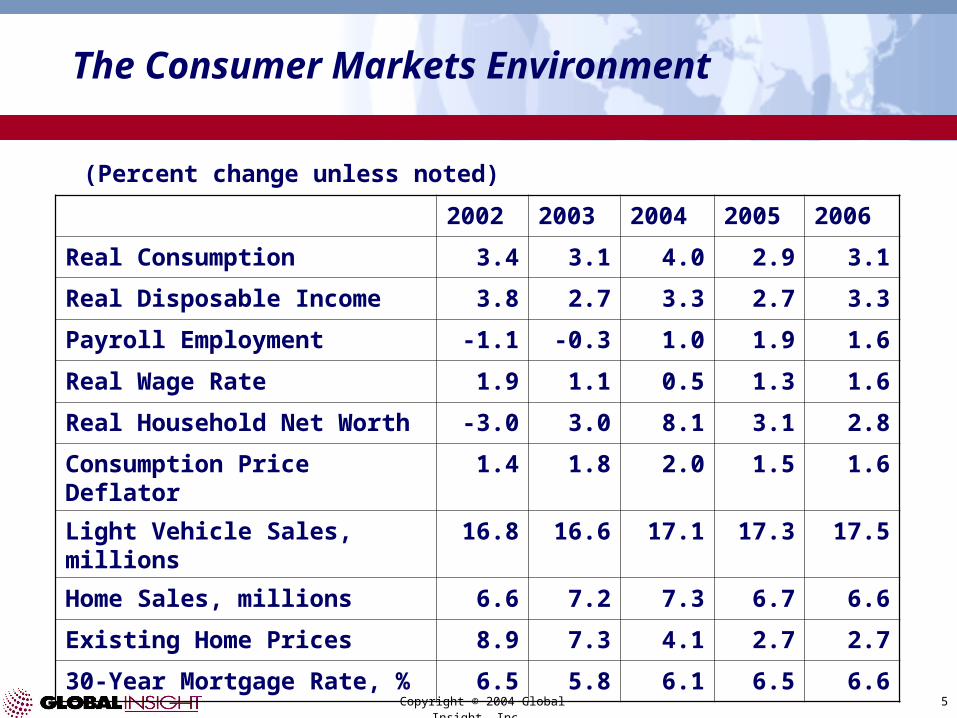
The Consumer Markets Environment
2002 2003 2004 2005 2006
Real Consumption 3.4 3.1 4.0 2.9 3.1
Real Disposable Income 3.8 2.7 3.3 2.7 3.3
Payroll Employment -1.1 -0.3 1.0 1.9 1.6
Real Wage Rate 1.9 1.1 0.5 1.3 1.6
Real Household Net Worth -3.0 3.0 8.1 3.1 2.8
Consumption Price Deflator 1.4 1.8 2.0 1.5 1.6
Light Vehicle Sales, millions 16.8 16.6 17.1 17.3 17.5
Home Sales, millions 6.6 7.2 7.3 6.7 6.6
Existing Home Prices 8.9 7.3 4.1 2.7 2.7
30-Year Mortgage Rate, % 6.5 5.8 6.1 6.5 6.6
(Percent change unless noted)

Copyright © 2004 Global Insight, Inc. 6
Disposable Income Supports Consumer Spending
-1
0
1
2
3
4
5
6
1990 1992 1994 1996 1998 2000 2002 2004 2006 2008 2010
Real Consumption Real Disposable Income
(Percent change)

Copyright © 2004 Global Insight, Inc. 7
When Will Employment Regain Its 2000-01 Peak?
2001-032004200520062007-09
Copyright © 2004 Global Insight, Inc. 8
Shifting Patterns in Consumer Finances
• Rising employment and real wage income will drive the continuing expansion in consumer spending.
• Federal tax cuts have boosted disposable income growth for three years. Now tax burdens are likely to rise.
• With both stock prices and home prices rising, household net worth has rebounded from its summer 2002 low. But a low saving rate will limit asset accumulation.
• Debt service burdens and the household financial obligations ratio have decreased since late 2001. Rising interest rates will forestall further improvement.
• Bankruptcies and credit card delinquencies have peaked and will begin to decline as the job market improves.
Copyright © 2004 Global Insight, Inc. 9
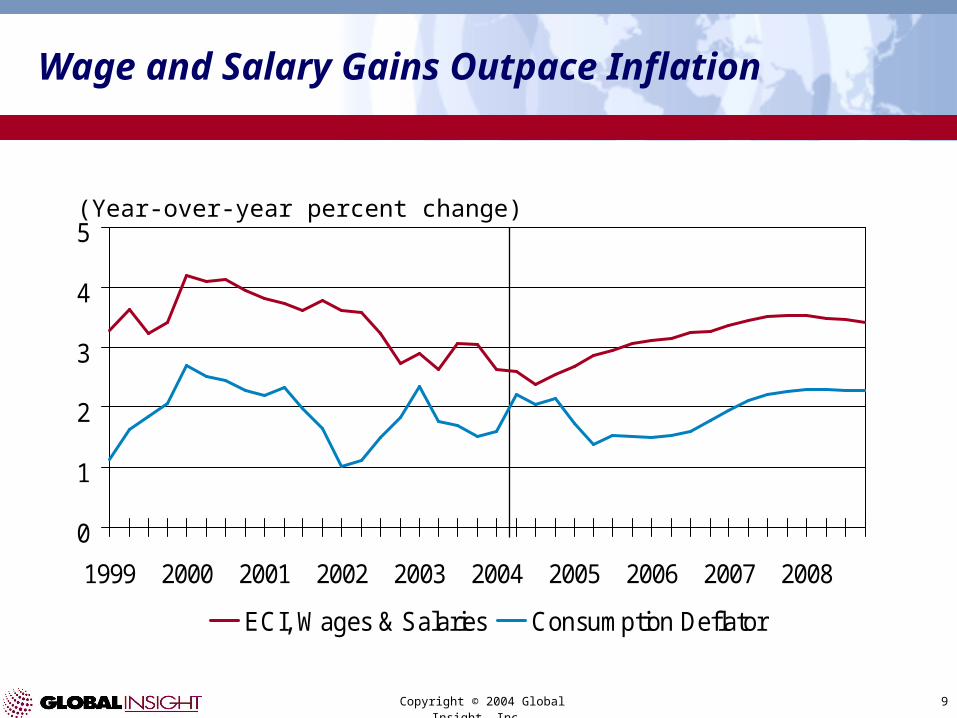
Wage and Salary Gains Outpace Inflation
(Year-over-year percent change)
0
1
2
3
4
5
1999 2000 2001 2002 2003 2004 2005 2006 2007 2008
ECI, Wages & Salaries Consumption Deflator

Copyright © 2004 Global Insight, Inc. 10
The Saving Rate Remains Low, Limiting the Recovery in Household Net Worth
0
2
4
6
8
10
12
1980 1984 1988 1992 1996 2000 2004 2008
3.5
4.0
4.5
5.0
5.5
6.0
6.5
Saving Rate Household Net Worth/Disposable Income
(Percent of disposable income) (Ratio to disposable income)
Copyright © 2004 Global Insight, Inc. 11
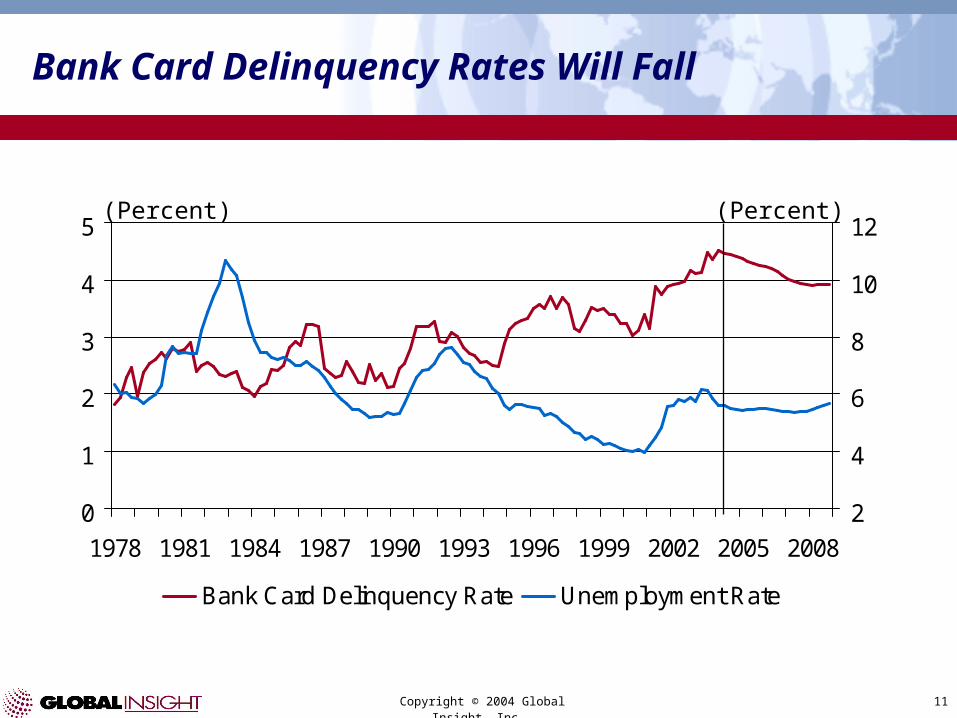
Bank Card Delinquency Rates Will Fall
0
1
2
3
4
5
1978 1981 1984 1987 1990 1993 1996 1999 2002 2005 2008
2
4
6
8
10
12
Bank Card Delinquency Rate Unemployment Rate
(Percent) (Percent)

Copyright © 2004 Global Insight, Inc. 12
Shifts in Consumer Spending on Essentials
0
5
10
15
20
25
30
1960 1965 1970 1975 1980 1985 1990 1995 2000 2005 2010
Food Energy Medical Housing Services
(Percent of total consumption)
Copyright © 2004 Global Insight, Inc. 13
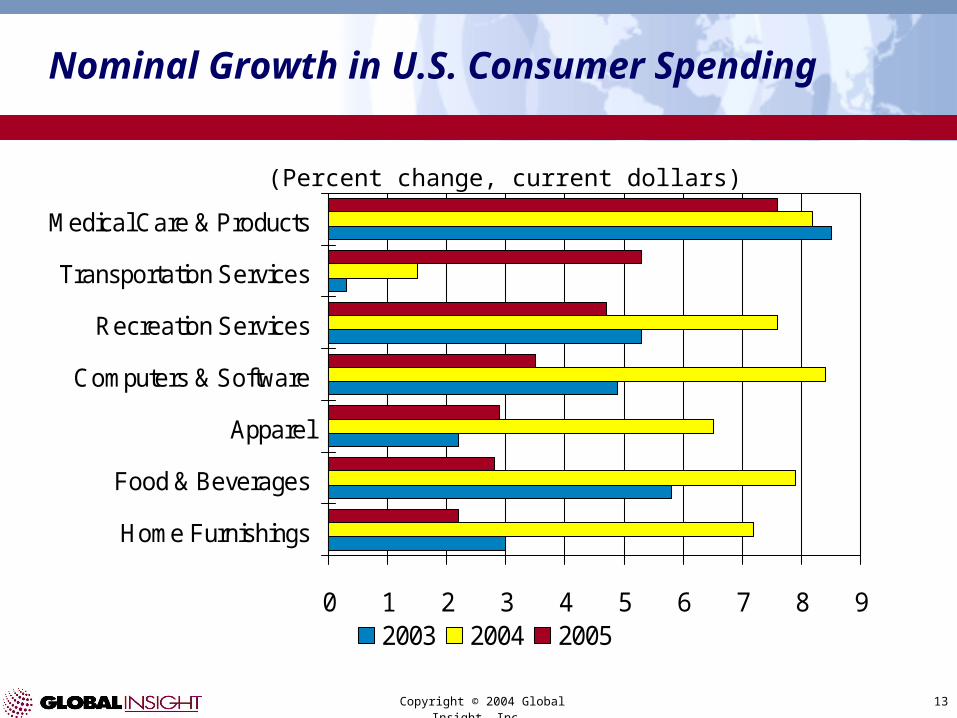
0 1 2 3 4 5 6 7 8 9
Home Furnishings
Food & Beverages
Apparel
Computers & Software
Recreation Services
Transportation Services
Medical Care & Products
2003 2004 2005
(Percent change, current dollars)
Nominal Growth in U.S. Consumer Spending

Copyright © 2004 Global Insight, Inc. 14
-4 -2 0 2 4 6 8 10
Motor Vehicles
Home Furnishings
Food & Beverages
Apparel
Recreation Services
Transportation Services
Medical Care & Products
2003 2004 2005
(Percent change, 2000 dollars)
Real Growth in U.S. Consumer Spending
Computers and Software: 28% in 2003, 24% in 2004, 20% in 2004

Copyright © 2004 Global Insight, Inc. 15
Real Spending on Home Furnishings Follows Housing Investment
-20
-15
-10
-5
0
5
10
15
20
1986 1989 1992 1995 1998 2001 2004 2007
Consumption of Home Furnishings Residential Investment
(Year-over-year percent change, 2000 dollars)
Copyright © 2004 Global Insight, Inc. 16
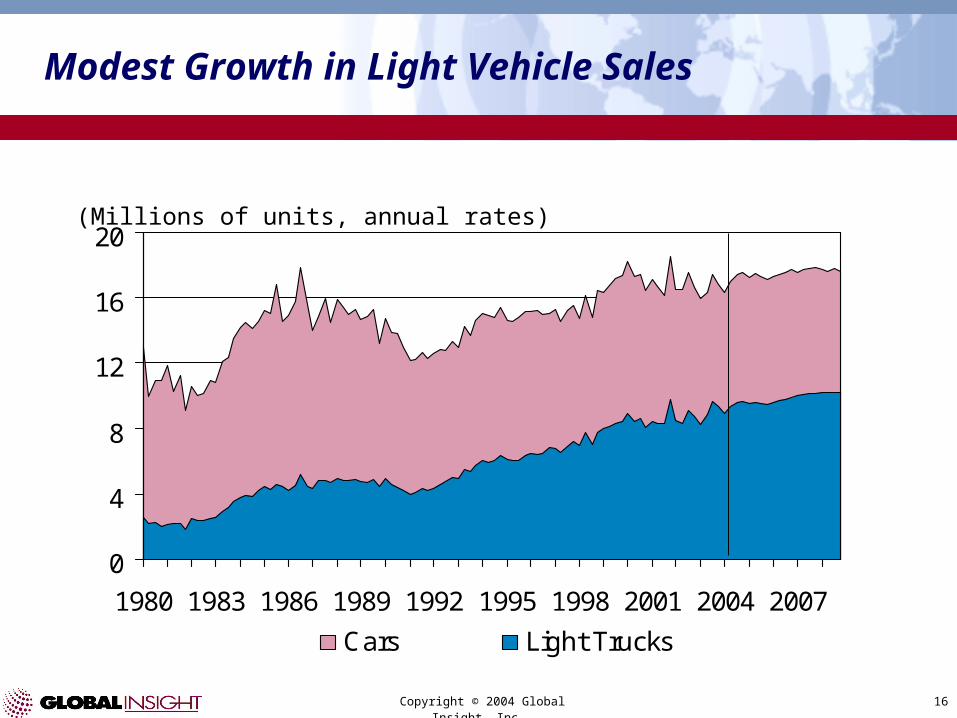
Modest Growth in Light Vehicle Sales
(Millions of units, annual rates)
0
4
8
12
16
20
1980 1983 1986 1989 1992 1995 1998 2001 2004 2007
Cars Light Trucks

Copyright © 2004 Global Insight, Inc. 17
Light Vehicle Sales Are Sensitive to Oil Prices
15.5
16.0
16.5
17.0
17.5
18.0
18.5
1999 2000 2001 2002 2003 2004 2005 2006 2007
Baseline $40 Oil Scenario
(Millions of units, annual rates)
Copyright © 2004 Global Insight, Inc. 18
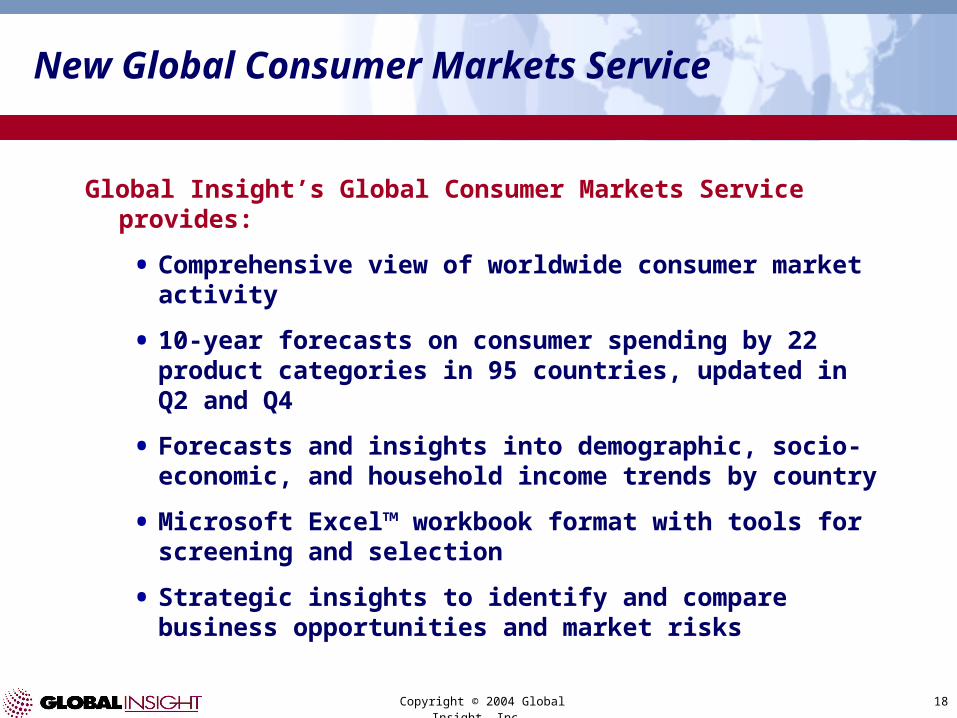
Global Insight’s Global Consumer Markets Service provides:
• Comprehensive view of worldwide consumer market activity
• 10-year forecasts on consumer spending by 22 product categories in 95 countries, updated in Q2 and Q4
• Forecasts and insights into demographic, socio-economic, and household income trends by country
• Microsoft Excel™ workbook format with tools for screening and selection
• Strategic insights to identify and compare business opportunities and market risks
New Global Consumer Markets Service

Copyright © 2004 Global Insight, Inc. 19
Country Coverage
North America
Canada
United States
Mexico
Latin America & Caribbean
Argentina
Belize
Bolivia
Brazil
Chile
Colombia
Costa Rica
Cuba
Ecuador
El Salvador
Guatemala
Honduras
Nicaragua
Panama
Paraguay
Peru
Puerto Rico
Uruguay
Venezuela
Western Europe
Austria
Belgium
Cyprus
Denmark
Finland
France
Germany
Greece
Iceland
Ireland
Italy
Luxembourg
Malta
Netherlands
Norway
Portugal
Spain
Sweden
Switzerland
United Kingdom
Eastern Europe
Azerbaijan
Belarus
Bulgaria
Croatia
Czech Republic
Estonia
Hungary
Kazakhstan
Latvia
Lithuania
Poland
Romania
Russia
Slovakia
Slovenia
Turkmenistan
Ukraine
Uzbekistan
Middle East & North Africa
Algeria
Egypt
Israel
Jordan
Kuwait
Morocco
Saudi Arabia
Tunisia
Turkey
United Arab Emirates
Sub-Saharan Africa
Côte D'Ivoire
Ghana
Nigeria
South Africa
Kenya
Tanzania
Uganda
Asia
Bangladesh
China
Hong Kong
India
Indonesia
Iran
Japan
South Korea
Malaysia
Pakistan
Philippines
Singapore
Sri Lanka
Taiwan
Thailand
Viet Nam
Oceania
Australia
New Zealand
Copyright © 2004 Global Insight, Inc. 20
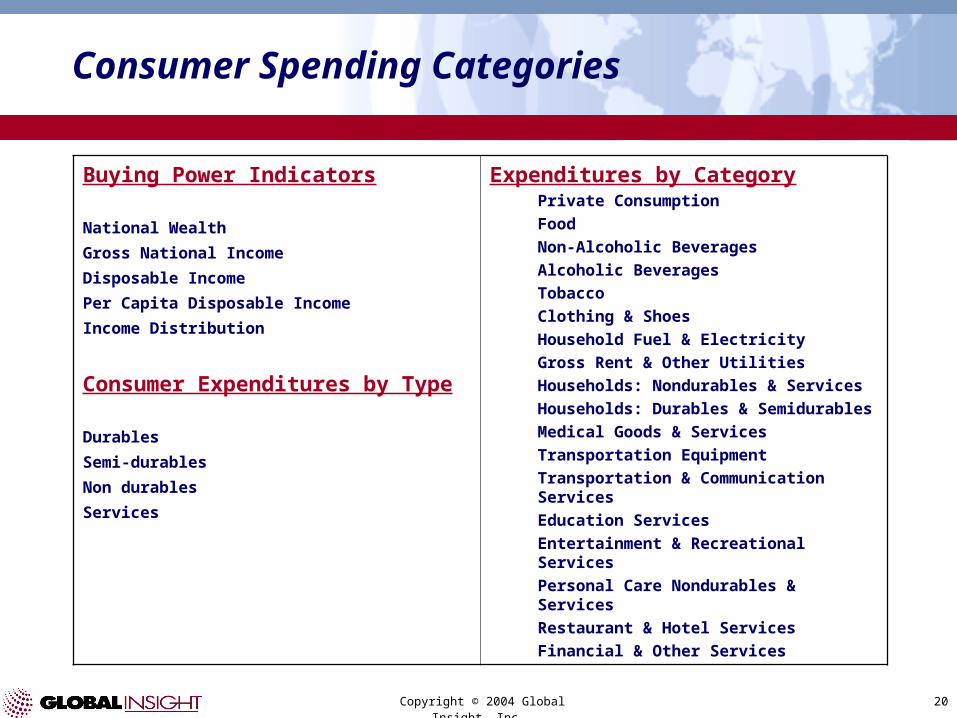
Consumer Spending Categories
Buying Power Indicators
National Wealth
Gross National Income
Disposable Income
Per Capita Disposable Income
Income Distribution
Consumer Expenditures by Type
Durables
Semi-durables
Non durables
Services
Expenditures by CategoryPrivate Consumption
Food
Non-Alcoholic Beverages
Alcoholic Beverages
Tobacco
Clothing & Shoes
Household Fuel & Electricity
Gross Rent & Other Utilities
Households: Nondurables & Services
Households: Durables & Semidurables
Medical Goods & Services
Transportation Equipment
Transportation & Communication Services
Education Services
Entertainment & Recreational Services
Personal Care Nondurables & Services
Restaurant & Hotel Services
Financial & Other Services
Copyright © 2004 Global Insight, Inc. 21
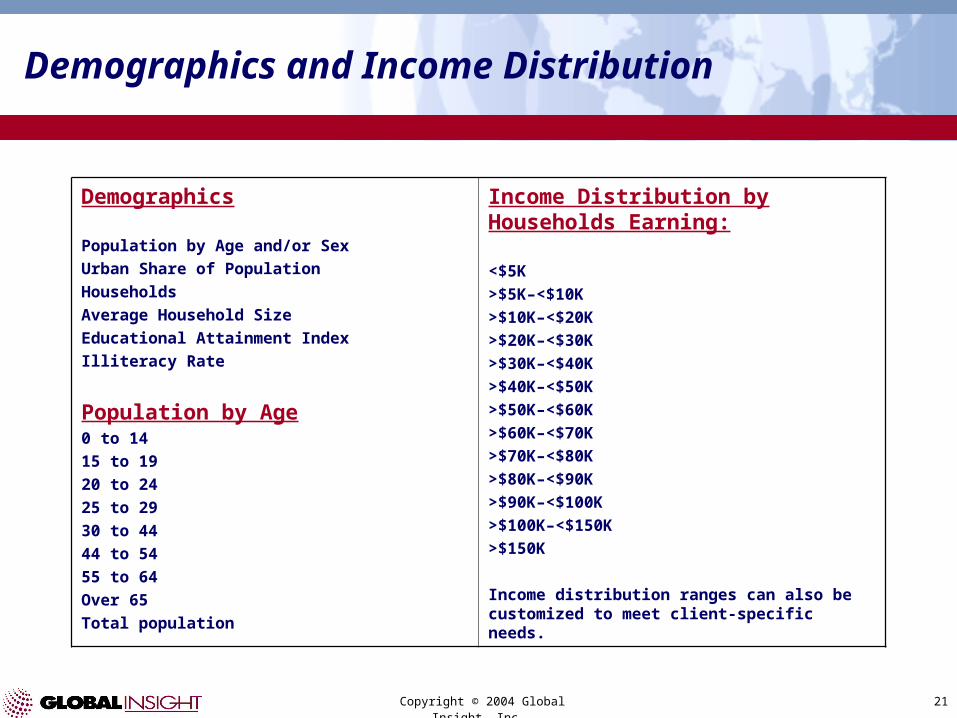
Demographics and Income Distribution
Demographics
Population by Age and/or Sex
Urban Share of Population
Households
Average Household Size
Educational Attainment Index
Illiteracy Rate
Population by Age0 to 14
15 to 19
20 to 24
25 to 29
30 to 44
44 to 54
55 to 64
Over 65
Total population
Income Distribution by Households Earning:
<$5K
>$5K–<$10K
>$10K–<$20K
>$20K–<$30K
>$30K–<$40K
>$40K–<$50K
>$50K–<$60K
>$60K–<$70K
>$70K–<$80K
>$80K–<$90K
>$90K–<$100K
>$100K–<$150K
>$150K
Income distribution ranges can also be customized to meet client-specific needs.
Copyright © 2004 Global Insight, Inc. 22
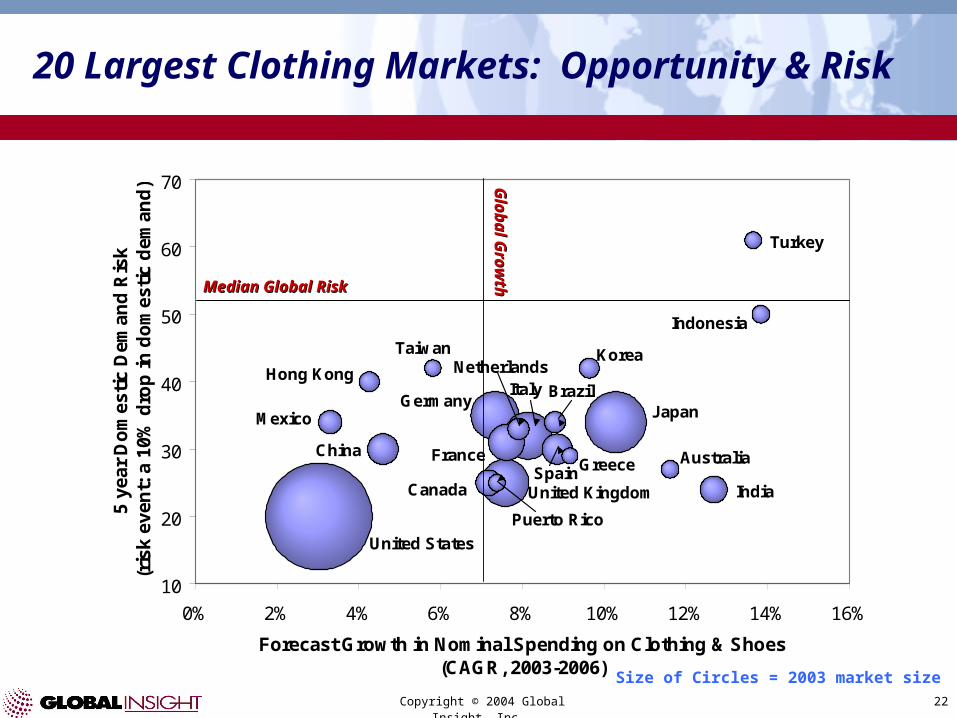
20 Largest Clothing Markets: Opportunity & Risk
Size of Circles = 2003 market size
Greece
Taiwan
Turkey
Puerto Rico
Australia
Indonesia
Hong KongKorea
Brazil
Netherlands
Mexico
Canada IndiaSpain
China France
United Kingdom
ItalyGermany
Japan
United States
10
20
30
40
50
60
70
0% 2% 4% 6% 8% 10% 12% 14% 16%
Forecast Growth in Nominal Spending on Clothing & Shoes(CAGR, 2003-2006)
5 ye
ar D
om
esti
c D
eman
d R
isk
(ris
k ev
ent:
a 1
0% d
rop
in d
om
esti
c d
eman
d)
Median Global RiskMedian Global Risk
Global G
rowth
Global G
rowth

Copyright © 2004 Global Insight, Inc. 23
500
505
510
515
520
525
530
535
1991 1993 1995 1997 1999 2001 2003 2005 2007 2009
The Number of Young Children Peaked in 1996
(Millions of children under 5 years old)
Top Declining Markets
2003 to 2010 absolute increase (millions)
China -7.71India -3.12Russia -0.77Korea -0.46Ukraine -0.41
Top Growing Markets
2003 to 2010 absolute increase (millions)
Pakistan 2.94Nigeria 2.36Uganda 1.28Egypt 0.92United States 0.59

Copyright © 2004 Global Insight, Inc. 24
The World’s Growing Middle Class
0
200
400
600
800
1994 1997 2000 2003 2006 2009 2012 2015 2018
25
30
35
40
45
Number of Middle Class Households Percent of Total Households
Note: “World” is the aggregate of 95 countries covered in Global Insight’s Global Consumer Model
(Percent of total)(Millions of households)

Copyright © 2004 Global Insight, Inc. 25
0
25
50
75
100
125
2003 2010
The 15 Largest Markets in 2010: Households Earning $10,000 or More
(Millions of households with income > $10,000 (1997$))
Source: Global Insight’s Global Consumer Model (incorporating U.N. and World Bank data)

Copyright © 2004 Global Insight, Inc. 26
Ranking of Markets by Number of Households Earning $10,000 or More
Number of households with income >US $10,000 ( 1997$)
1993 2003 2010 2020
U.S. U.S. U.S. U.S.
Japan Japan Japan China
Germany Germany China Japan
France China Germany Germany
U.K. France France Brazil
Italy U.K. U.K. France
Brazil Italy Brazil U.K.
Russia Brazil Italy Russia
Spain S. Korea Mexico Mexico
S. Korea Mexico Russia ItalySource: Global Insight’s Global Consumer Model (incorporating U.N. and World Bank data)