u.s. deepwater port study physical coast and port … · 2013-03-08 · cargo name of port...
TRANSCRIPT

INSTITUTE FOR
WATER RESOURCES
[tJ
DEPARTM CORPSS
1 HE ARMY 11J
NEERS
Volume III of V
U.S. DEEPWATER PORT STUDY
PHYSICAL COAST AND PORT CHARACTERISTICS,
AND SELECTED DEEPWATER PORT ALTERNATIVES
August 1972 IWR Report 72-8

INSTITUTE FOR WATER RESOURCES
The Institute for Water Resources is the focal point of efforts to improve U. S. Army Corps of Engineers' planning for the development and management of the nation's water and related land resources, particularly as national objectives are affected by changing public values. Through in-house and contract stud-ies, the Institute identifies emerging planning issues and re-quirements; evaluates planning efficiency and effectiveness; develops applications to Corps' planning of analytical and pro-jectional techniques and planning management systems; and formulates the bases for improved Corps ' planning policies and procedures. In concert with the Office, Chief of Engineers, it advises and assists Corps' agencies in utilizing such tech-niques and carrying out suchprocedures. Finally, it evaluates and recommends improvements in the professional develop-ment program for Corps' planners; develops training programs; and conducts training.
The Institute welcomes your comments and suggestions on its program and publications.
K. B. COCVER Brigadier General, USA Director
,.. 1 ) """j,
J.S. DEEPWATER PORT STUDY: PHYSICAL COAST AND PORT CHARACTERISTICS, AND SELECTED DEEP WATER PORT ALTERNATIVES

Volume III of V
U.S. DEEPWATER PORT STUDY
Physical Coast and Port Characteristics) and Selected Deepwater Port Alternatives
August 1972 IWR Report 72-8

CONTENTS
ANNEX B. RECONNAISSANCE SURVEY OF U.S. COASTAL AREAS, PORTS AND PORT FACILITIES 1
ANNEX C. DESIGN CRITERIA, ENGINEERING REQUIREMENTS, AND COST ESTIMATES OF DEEPWATER PORT ALTERNATIVES SELECTED FOR DETAILED ANALYSIS 195
ANNEX B. RECONNAISSANCE SURVEY OF U.S. COASTAL AREAS, PORTS AND PORT FACILITIES

CONTENTS
INTRODUCTION 3
B-1. RECONNAISSANCE SURVEY OF THE NORTH ATLANTIC COAST 5
B-2. RECONNAISSANCE SURVEY OF THE SOUTH ATLANTIC COAST 57
B-3. RECONNAISSANCE SURVEY OF THE GULF COAST 85
B-4. RECONNAISSANCE SURVEY OF THE SOUTH PACIFIC COAST 135
B-5. RECONNAISSANCE SURVEY OF THE NORTH PACIFIC COAST 171
2 .

INTRODUCTION
This annex contains reconnaissance surveys of U.S. coastal areas, ports, and port facilities. For this purpose the coast has been subdivided into the fol-lowing five coastal zones:
1. North Atlantic coast -- Maine through Virginia
2. South Atlantic coast -- North Carolina through Atlantic coast of Flordia
3. Gulf coast -- gulf coast of Florida through Texas
4. South Pacific coast -- California
5. North Pacific coast -- Oregon and Washington.
The primary function of these surveys in relation to the objectives of the U.S. Deepwater Port Study is to provide background data relevant to the selection of deepwater port alternatives for detailed analysis, and for the identification of other possible alternatives including other possible deepwater ports.
The attached subannexes B-1 through B-5 present the following information for each of the five coastal zones:
1. A general description of the physical char-acteristics of the coastline and of the major harbors and port areas, including water depths, distance
3.

4.
contour lines at depths of 60-, 90-, and 120-feet, and longitudinal cross sections of major channels from the major facilities to a depth of 120 feet.
2. Data on the volumes of imports and exports for 1968 and 1969, and intracoastal receipts and ship-ments for 1969 and 1970 of the study commodities by individual port, i.e., crude petroleum and petroleum products, iron ore, alumina, bauxite, coal, phosphate rock, and grains and soybeans and soybean meal.
3. Detailed descriptive information on major harbors and channels, including graphic presentation of harbor and port configuration, and the locational characteristics of ports, major bulk commodity handling and storage facilities, channels, and physical con-straints such as bridges and tunnels.

ANNEX B-1. RECONNAISSANCE SURVEY OF THE NORTH ATLANTIC COAST

CONTENTS
I. DESCRIPTION OF COAST AND PORT LOCATIONS 7
New England 7 Middle Atlantic Coast 14
II. FOREIGN AND COASTAL MOVEMENTS, BY PORT, OF THE SIX STUDY COMMODITIES 19
III. MAJOR HARBORS AND CHANNELS 25
New York Harbor 35 Delaware River Harbors 38 Hampton Roads Harbor 39 Baltimore Harbor 39
IV. PHYSICAL OBSTACLES TO CHANNEL ENLARGEMENT 41
Bridges and Tunnels 41 Bedrock 41 Tides 41
APPENDIX A 45
6.

I. DESCRIPTION OF COAST AND PORT LOCATIONS
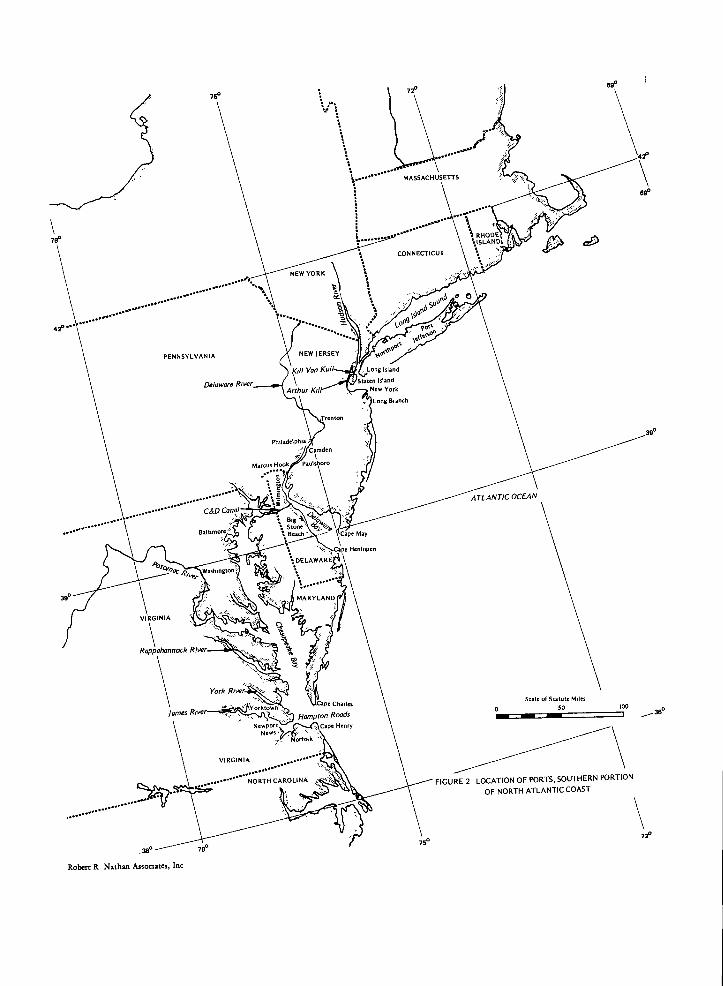
The north Atlantic region extends from Maine (Canadian border, near 45 0 latitude) to Virginia (boun-dary with North Carolina, near 36° 45' latitude). It is subdivided into the New England and Middle Atlantic coasts. These two coastal regions are depicted in fig-ures 1 and 2.
New England
The coast of New England is, for the most part, exceedingly rugged and uneven, and covered with dense forests. There are long and rocky headlands with deep narrow bays between them. In a direct line, it is a little over 200 miles along the coast of Maine from the New Hampshire boundary to Eastport, but the actual shore-line of Maine, including all the windings and the shores of the islands, is about 2,000 miles long. From Boston southward toward Cape Cod the shores are rocky in places, but along the cape there are long stretches of sandy beach.
The southern shores of New England are irregular. The branches of Narragansett Bay in Rhode Island and the bays and tidal river channels of Connecticut are much like those of Cape Cod.
The entire coastline of Connecticut is protected from the sea by various islands. To the east of the Plum Island and Fishers Island chain is Block Island Sound, which itself is protected from the sea by the southerly fork of Long Island and by Block Island. Thus
7.

72° 69°
CANADA
75° 45°
Eastpor
Mach.,
Bangor
......
Penobscot Rive
Searsport
Belfast
MAINE
Bath
45°
Portland
5.
N.
NEW HAMPSHIRE Portsmouth ATLANTIC OCEAN 42°
Gloucester
......... ............ Salem
MASSACHUSETTS BostonMC
Cape Cod
Plymouth
Thames_River;
Fall River PI New Bedford
Fairhaven
Melvd le Newport
Block Island Sound
HOusatOnic
..1F1'awyen...,,
London
Island
INew
"
".•
tog
, , Bridgeport
.... . ,s.7,5-tarnfordc-
t. / . • •, .
...........
42° ....... nd Montauk Point
NEW YORK
Scale of Statute Mlles
50 100
39°
FIGURE I LOCATION OF PORTS, NORTHERN PORTION OF NORTH ATLANTIC COAST
Robert R Nathan Associates, Inc 5 75° 72°
039° I
76° 72°
t
4
........
17.‘' MASSACHUSETTS
69°
78°
..
........
. ..
CONNECTICUT
NEW YORK
4 -------
....... 'm ,n 1 •
..........
........
PENNSYLVANIA NEW JERSEY
Kill Van Kull
Arthur Kill
, Long Island
Staten Island New York
Long Branch
Delaware River
Trenton
39°
Phtladelphia //Camden
Paulsboro Marcus Hook
1 g ...... ATLANTIC OCEAN
C&D Canal
.............
BalUmore, Cape May
longton -■.„
Gt
MARYLAND 39°
VIRGINIA
Rappahannock River
York River.
1 lames Rive
^ Yorktown
Newport News ,
100 Scale of Statute Miles
SO
Rorfol k
VIRGINIA ........
...........
............... N.".ORTFICAROLINA FIGURE 2 LOCATION OF PORTS, SOUTHERN PORTION
OF NORTH ATLANTIC COAST
. . ...
76°
Robert R. Nathan Assoctaws, Inc

10.
three-fourths of the coast is protected by Long Island, and one-fourth is protected to a lesser degree by an island chain. These protected waters offer ships smoother navigation than do the waters to the south of Long Island.
The Connecticut coastline's geographic conforma-tion differs from the rest of the Atlantic coastline. It is also unique in that it extends almost east and west, while the bulk of the Atlantic coastline of the United States runs northeasterly and southwesterly.
The principal bulk commodity ports of New England are Portland and Boston. Other ports are Searsport, Maine; Portsmouth, New Hampshire; Fall River, Massachu-setts; Providence, Rhode Island; and New London, New Haven, and Bridgeport, Connecticut. Table 1 shows project channel depths for these ports and the number of waterfront facilities present at the time of the latest publication by the Board of Engineers for Rivers and Harbors (BERH).
Figure 3 shows distances from the shoreline (in nautical miles) to water depths of 60, 90, and 120 feet. The distance at each location can be found by drawing a horizontal line to the graph from the location being considered on the map. On the same horizontal line the various distances are found. For example, for a loca-tion at the shore in latitude 43°, south of Portsmouth, New Hampshire, 60-, 90-, and 120-foot water depths are found at distances of 2, 4, and 5 nautical miles, respec-tively, off the coast. The method of graph construction is shown in figure 4. The distance between each shore location was 5 minutes in latitude; hence, 12 locations per latitude were used. The entire coast was turned counterclockwise 37° in order to arrive at a projecting axis which is more or less parallel to the coastline.
It should be noted that (1) the configuration of the coast of Maine is an approximation, since it is im-possible to show all indentations on the scale used; (2) the distances to the coasts bordering Cape Cod Bay and Long Island Sound could not be presented because

11.
Table 1. Channel Depths and Waterfront Facilities in Principal New England Ports
Project—depth (ft.)
Number of w facil
Total oilS/
terfront ties ./
General cargo
Name of port
Searsport, Maine 35 5 3 1
Portland, Maine 452//35 54 14 4
Portsmouth, New Hampshire 35 22 5 1
Boston, Massachusetts 40 156 29 17
Fall River, Massa- chusetts 35 15 7 1
Providence, Rhode Island 35 23 9 2
New London, Connecti- cut 33 36 8 1
New Haven, Connecti- cut 35 40 16 2
Bridgeport, Connecti- cut 35 29 12
Total 380 103 29
a/ In main channel(s) only, at mean low water. b/ Piers, wharves and docks described in Port Series publications. c/ Crude oil and/or petroleum products. d/ Serving two facilities only.
Source: Searsport, Portland, and Portsmouth -- Board of Engineers for Rivers and Harbors, Port Series 1, 1964; Boston -- Port Series 3, 1967; All others -- Port Series 4, 1964.

1111LEME
MEMAELEIMENEEAEN
IIi
• .4 hr
Flz1=1=i=1=11=1=1;1 • IIIIIIIIIIIIIII I IIIIIIIIMIIIII III
1 IIIIIIIIIIIIIIII
•••••••••■:EIMENEE 1•1•11•••••••111167=MINIEME I ME
IIIIIIIIIIIIIM 11111 IIIIIIIIIIIMIr L L
EMEMEMEMEMEMITE4WEEMEMI ) miummommirmm ,‘ MEM MEMMEMMEEMW■ lunicammi illmmomsrummx.ws I Mum MIIIMINEMEMEMMEARta u••••Ell IMEM11/2••••• Elm MEMIUMEMEME
EMEEMMEMEIrEE • I ti milmmammanweiimum Immi 'f imm•••ormwima••• •IMI
ISEIMESEME211119•11:ENOW114111 EMI AMMEMEMEMEMEWMETrEMIIIMMI
IIMIIIMMINEPRESIMMINIEMEMEEEM MEI MWNEMEMEMEMESEMEMEMEMMEMEMEI
qmMqUENMEVEMEMEMEMMEMMEMI . I kilimammumalawffimmum EEKMEMENEEMEP4MEMMEMOWEEMEMEI
mummesamwommaximommumummi 'AIIIMMIMIENEKEEIMMEMILS911 1/01••••••••mmmm•
:AMMEME1OV;0030MMEEELzMIIMMEMEMEMEMEMEME
itigniTinganaral= ==••■••;::::::::= = EMI= •111 •• tl•••••
•• WV- MOO 0 IP Alli*IiinaiDIBMERLIMMINNMEMMMEMINILMRIERMkaVIME 111111211WWW1111111111111 IIIIIIIIIIINIIIIIIIIRM
=•111•MPIGIIIIMIN =VW EMEMIIMEMEEPGEZEIMEMEENIIMMEMENIMMEMIll■ IIIIMEMEMEEMEIPSIMIE. Etig••••••21•11MMEREME••••••■••••••••••••••= •••••151MEMEREISMEIM WIESEMEIMEMEMEEliaNIMAISITISMZEMENAIMMEMEMEMEMEIMMENIMEMEMBIBM=Mb... MENEEMEEKENEMEMEMEMEMMEMEMENEmmEMEMMEMMENEMEMMEMEMEMEMMEME EMEMEMEWEEMMEMESWIIMEMEMENEMEMEMEMMMEMMEMEMMEMEMEMEMC2WEEM!EMMEM-MEMEMPEMOWAMUM MEMEMENMEEMEMEMEMEMEMMEMEMOMEMPEMREEMEMP — EIPIEKEINEMEEMEMPIEMESEWSEENERIEMI•••••••••••■•••••■•••111111••••■•• EW4IIMMEMEMEEMENERMEMEOPOWNEEEMMEMEMMEMEMEMNIMMIRIMMIEMEOPIRLIMMEME EVWEEMENEEMEMMEMEETMKANOWENEmmuMEMEMMEMEmmommEMEEKEEWEwmEMEME ■■••••••••111NMEMEMEMEW.:57:1•41.10RVEWI4111111•1••=FIENIPMEIMMIIIIM
IIIIIII IIIIIIiiiiiiiiiiiiiiii RAMEMEEMENEEMMEM
1111111 111111 • MME• ••ME••MMEMEMEMEE m.•
1111111111111111 EEMIIIMMEMEM •MEEMEIMEE••
Note Contour line data taken f om C&GS chart 1000 1 111111111111 II
IIIII.. 1111111111111111111 IIIIIIm. ... MI min MUMEMEIIII NM 11 Mil UNIUM =MEM NE , l MUM •MU
I 11111111111111111111 i __ FIGURE 3 DISTANCES BETWEEN COASTL NE AND 60, 90- AND 120-FOOT CONTOUR LINES,
NORTH ATLANTIC COAST
Robert R Nathan Associates, Inc
AMEMEMEMPAMMEMEMEEFEEMAMEAL
111111111ENSI EMEMENEEME
NIMEMEMPGIIMer-MEMIGenMAN
EEEMEWEEME EMONEWSEME r-TIM11 EMEMEMEMPI
inummAmmkgmemAmrimmummommammommilimmimump •kommimmummum 1,1110;111DINMI1111111111111111111111111111A ISILt°11111111111 MEMEMEMENAMEWiEMMEMPENVEMEMMEMENEEEMEEMEMEMEME , MEOPMEMPMIamEMEME
mplammumaammmimmummimmummommummimmumill mmilimaulomm mum o mmmommow.winsommummmummommimmummmimmm immmummgmmilumm
mummommammt-ruammummaiummmommummommmimm • EMIPM:AMEMEMEMEME MEMEMEMMEMEELiAMEMEMEMEMMEMENEEMEMEMEEMMEMEME IEMI6nEEMEMMEMEMEM
imalmnfintlImmillimmoillimilli 1 EEMEMPEEm0—mEMMEM MEMIL,VIMIESEEMEME
IIIIII11111111161 11/11111111
EMOMMEMEM aa ME 00/NOMNEMEM prim
• UMUNNINNI WOMEMENEW 2.12 1.PE ummommumEE -A N.._ .. . IP - AA
EMMOMMEEM aa wm 114/WINEhAVEMEMMEEM EH UMW= MgkO2MNMNEWgWpq-EmmgMmmmmmmmmmmmmmmmmmmmmmmummmmwmmmmnmm

<1.) C 'Z A o U
.3.) C = 4. trl rd o U Coastline and deepwater contour lines
as shown on maps Coastline and deepwater contour lines
as shown on graphs
FIGURE 4. METHOD OF GRAPH CONSTRUCTION

14.
they are obstructed in the graph by the Atlantic coast-lines of Cape Cod and Long Island; (3) the interruption of the coastline by such bays as Long Island Sound and New York, Delaware, and Chesapeake Bays causes interrup-
• ion of the schematic coastline; (4) when islands are present off the coast, distances are measured to loca-tions on the Atlantic coasts of these islands and not to the shoreline behind them (as, for example, in the case of the islands surrounding Nantucket Sound); and (5) the graph does not show the distances between the 60-, 90-, and 120-foot contour lines, since the minimum distances to a location on shore are measured on dif-ferent bearings, as shown in figure 4.
Of primary significance to the study of deepwater ports are the irregularity of the depth contour lines and the comparatively few locations where the 60- and 90-foot depths are found less than 5 miles from shore. This occurs along the New England coast in Maine (near the Canadian border at Eastport, Machias, Bangor, Sears-port and Belfast); at Portsmouth and Boston; and at Nar-ragansett Bay (Providence).
Middle Atlantic Coast
The middle Atlantic coast extends from New York through Virginia (see figure 2). Nearly all the land bordering the sea is low and sandy. This coastal bor-der area includes many large cities as well as numerous resorts and beaches.
The principal bulk commodity ports of the middle Atlantic coast are New York, Philadelphia, Paulsboro, Marcus Hook, Baltimore, and Hampton Roads (Norfolk and Newport News). Table 2 shows the channel depths of these ports and the number of waterfront facilities present at the time of the latest surveys by BERH. Table 3 presents a breakdown of all facilities of New York Harbor by main waterway.
Analysis of the depth contour lines in figure 3 shows that the location with the most favorable access to the 60- and 90-foot depths is off the northern coast

Table 2. Channel Depths and Waterfront Facilities in Principal Ports of Central Atlantic Coast
Project depth/ (ft.)
Number of waterfront f
Total 0112/
acilities b
General cargo
Name of port
Coal Iron ored/ Grain
New York, N.Y., N.J 45/35 1,160 277 34 0 1 157 Wilmington, Del./ 40 38 13 0 1 1 Marcus Hook and Chester, Pa.f/ 40 31 8 1 -- __ -- Paulsboro, N.J./ 40 13 6 0 -- -- 1 Philadelphia, Pa 40 141 21 8 -- 2 30 Gloucester and Camden, N J 40 49 12 0 ,-- -- 2
Trenton, N.J.!!' 40/35 -21 10 2 1 -- 1 Hampton Roads, Va./ 45/40 235 13 4 0 2 16 Baltimore, Md 42 227 25 9 1 3 33
Total 1,915 385 58 3 8 241
a/ In main channel(s) only, at mean low water. b/ Piers, wharves and docks described in Port Series publications. C/ Crude oil and/or petroleum products. d/ Berths handling "ores" excluded. e/ Including Delaware City, Pigeon Point, Edge Moor and Claymont, Del., and Deep-water Point, Oldmans Point and Logan Township, N.J. f/ Including Eddystone, Darby Creek and Essington, Pa. 21 Including Thomson Point and Mantua Creek, N.J. h/ Including Cornwells Heights, Tullytown, and Penn Manor, Pa., and Beverly, Burlington, Roebling, Fieldsboro and Duck Island, N.J.
continued--

16.
Table 2. Channel Depths and Waterfront Facilities in Principal Ports of Central Atlantic Coast
continued--
i/ Including Norfolk and Newport News.
Source: New York -- Board of Engineers for Rivers and Harbors, Port Series 5, 1965; Philadelphia, Gloucester and Camden -- Port Series 7, 1967; Hampton Roads -- Port Series 11, 1971 (pres-ently under preparation); Baltimore -- Port Series 10, 1966; all others -- Port Series 8, 1966.

48/45, 40, 30 260 40, 35, 30, 20 227 15 30
21 38 57 18 4 0
15, 12, 10 86 37 0 0
Table 3. Channel Depths and Waterfront Facilities in the Port of New York, N.Y. and N.J.
17.
Number of facil
waterfront ities
Oil
Name of river or bay
Project depth./ (ft.)
General cargo
Total Deep draft Total
Hudson River East Riverb/ Harlem River Long Island Sound2/...,
Upper New York Bay 45-602/ 136 10 32 40
d/ The Narrows 50-80— 28 2 9 9 Kill Van Kull 352/ 66 17 0 0 Newark Bay, Passaic and Hackensack Rivers 35 ' , 30 e 127 52 12 12
Arthur Kill 35t/ 110 43 0 0 Raritan and South Rivers 25 17 6 0 0
Lower New York Bay, Northeast part 20, 18 66 27 0 0
Lower New York Bay, Sandy Hook Bay 35 7 1 0 0
Total 1 1,160 277 109 157
a/ At mean low water. 12/ Including Buttermilk Channel and Newtown Creek. c/ Including Bronx River, Westchester and Eastchester Creeks and Flushing Creek. 1/ Available depths without dredging. e/ Increased by 2 feet in case of rock.
74 20 2

18.
of New Jersey near Long Branch. Other favorable loca-tions to the 60-foot depth in particular are off the coasts of Long Island, Delaware Bay, and Virginia.

II. FOREIGN AND COASTAL MOVEMENTS, BY PORT, OF THE SIX STUDY COMMODITIES
Table 4 shows U.S. waterborne imports and exports of the study bulk commodities by port for the north At-lantic coastal zone for 1968 and 1969. Table 5 shows similar data on the waterborne coastal trade in these commodities.
In New England, the movement consists almost en-tirely of receipts from foreign and domestic sources of crude petroleum and petroleum products. However, only one small petroleum refinery is located in New England, and 1968 and 1969 imports of over 21 million tons of crude petroleum, all through Portland, Maine, were in transit to refineries in Canada. All other imports were petroleum products (16.6 million and 19.0 million tons in 1968 and 1969). However, there were substantial re-ceipts of petroleum products from domestic sources (37.5 million tons and 38.7 million tons in 1968 and 1969, respectively). The movement of dry bulk commodities is confined almost entirely to receipts of coal from domes-tic sources.
It is apparent from the wide distribution of im-ports and domestic receipts of petroleum products among the ports, and from their relative proportions, that these receipts are essentially oriented to local rather than broad regional requirements. The four leading ports in terms of volume of foreign imports and domestic receipts of petroleum products in 1969 were Boston (18.5 million tons), New Haven (7.8 million tons), Providence (7.7 million tons), and Portland (4.9 million tons).
19.

-- _- _- _- _- 13 6
-- _- _- _- _-
•■•
-- 13
-- 25
53 60 53 85
21,029 1,469
11,942 6,326 3,433
44,199
22,912 2,451
11,063 8,275 4,540
49,241
Table 4. U.S. Waterborne Exports of Domestic and Foreign Merchandise and General Imports of Selected Bulk Commodities, North Atlantic Coast, 1968 and 1969
(In thousands of short tons)
Exports Imports Total all study comm. Total ,
grains Coal Phosphate rock
Petroleum productsh/ Port/area
Total Crude oil Iron ore Bauxite Alumina Total
1969 1968 I 1969 196q 1969 1968 11969 1968 1 1969 19681 1969 1968 1 1969 1968] 1969 196811969 19681 1969 1968 1 1968 1969
New England Bangor, Maine Searsport, Maine Belfast, Maine Bath, Maine Portland, Maine/ Portsmouth, New Hampshire Gloucester, Massachusetts Salem, Massachusetts Boston, Massachusetts Plymouth, Massachusetts
New Bedford, Massachusetts Fall River, Massachusetts Newport, Rhode Island Providence, Rhode Island Melville, Rhode Island New London, Connecticut New Haven, Connecticut Bridgeport, Connecticut Total
56 100 -- -- --
606 708 -- -- --
380 318 -- -- --
112 --------
22,571 22,177 -- -- --
626 644 -- -- -- / d/ d/ 1/ --
524 ;-60 -- -- --
6,864 7,785 d/ d/ --
35 385 -- -- --
693 429 -- d/ --
254 693 -- -- --
15 --
1,616 1,973 -- (1/ --
228 d/
550 962 -- -- --
2,331 1,988 -- -- --
774 1,354 -- -- --
38,235 40,267 d/ d/ d/
-- -- -- -- 56 100 -- -- -- -- 593 701 -- -- -- -- 380 318 -- -- -- -- 112 -- -- -- 21,478 21,060 1,093 1,117 -- -- -- -- 626 644 d/ d/ -- -- -- -- -- -- -- -- 524 660 d/ 1 60 4 6,803 7,780 -- -- -- -- 35 385 -- d/ -- -- 693 429 -- -- -- 150 254 543 -- -- d/ -- 15 44 -- d/
__ -- 1,616 1,973
d/ -- 35 -- 193 47 -- -- -- -- 550 962 -- -- -- -- 2,331 1,988 -- -- -- -- 774 1,354 d/ 1 21,573 21,214 16,648 19,045
56 100 - 606 707 - 380 318
112 --
-
-
-22,571 22,177
626 644
- 524 660 -
-
- 6,863 7,784
35 385 - 693 429 - 254 693
15 44 -
-
- 1,616 1,973
228 47
550 962 -- 2,331 1,988
774 1,354 -- 38,234 40,265
New York New York, New York Albany, New York Total
Delaware Bay area
Philadelphia, Pennsylvania Camden, New Jersey Paulsboro, New Jersey Marcus Hook, Pennsylvania Wilmington, Delaware Total
Chesapeake Bay area Baltimore, Maryland Alexandria, Virginia Washington, D.0 Richmond, Virginia Cape Charles, Virginia Newport News, Virginia Norfolk, Virginia Total
Total, north Atlantic coast.
42,139 39,884 46 397 3 6 3 59 45 10,502 8,747 31,538 31,066 d/ d/ 40 27 -- -- 42,080 39,840 742 1,016 266 138 -- 266 138 -- 476 878 476 878
42,881 40,900 312 177 7 3 6 3 325 183 10,502 8,747 32,014 31,944 0/ 1/ 40 27 -- -- 42,556 40,718
22,179 23,653 854 363 295 378 1 d/ 1,150 741 9,345 9,052 1,123 1,540 10,561 12,295
1,471 2,451 -- d/ -- -- 2 -7 2 1/ 54 94 1,394 2,170 21 187
11,942 11,085 d/ 16 --6 d/ 22 8,117 7,446 3,825 3,617 d/_-
6,326 8,275 7- -- -- -- -- -- __
-- 5,797 7,405 529 870 -_
--
3,433 4,540 -- -- -- -- -- -- -- -- 3,334 4,313 46 167 -- --
45,351 50,004 854 379 295 384 3 d/ 1,152 763 26,647 28,310 6,917 8,364 10,582 12,482
18,560 19,185 1,090 874 2,442 2,659 19 2/ 3,551 3,533 537 488 3,981 4,522 10,374 10,542 117 101 -- -- 15,009 15,653
V -- -- -- d/ -- -- -- d/ -- -- -- -- -- -- -- -- -- -- -- -- -- -- 0/ -- d/
-_
-- -- -- .7- d/ -- -- -- -- -- -- d/ d/ -- -- -- 2/
__ -- -- -- -- -- __ __ __ __ __ -- -- d/ __ __ __ __ __ __
10,209 12,174 3 2 7,573 9,375 -- -- 7,576 9,377 2,201 2,341 140 350 342 106 --------2,683 2,797
28,808 32,568 2,241 1,549 24,410 27,669 68 -- 26,719 29,218 4/ -- 2,087 3,347 -- -- 3 3 -- -- 2,090 3,350
57,577 63,927 3,334 2,425 34,375 39,703 87 0/ 37,796 42,128 2,718 2,829 6,208 8,219 10,716 10,648 120 104 -- -- 19,782 21,800
184,044 195,098 4,500 2,981 34,677 40,091 96 3 39,273 43,075 61,460 61,100 61,787 67,572 21,298 23,130 226 222 -- -- 144,771 152,024
Note: Individual items may not add to totals due to rounding. 12/ Includes food grains (wheat, rice, rye), feed grains (barley, corn, oats, cereals, n.e.c.), and soybeans and mill products. 12/ Includes gasoline, jet fuel and kerosene, distillate fuel oils, and residual fuel oils. c/ For crude oil, 1968 and 1969, Includes Inbound in-transit shipment (SA-305-IT). a/ Less than 500 short tons.
Source: U.S. Department of Commerce, Bureau of the Census, U.S. Waterborne Exports of Domestic and Foreign Merchandise, SA-705; U.S. Waterborne General Imports of Merchandise, SA-305; and U.S. Waterborne General Imports of Inbound In-Trantit Merchan-dise, SA-305-IT, 1968 and 1969.

7 ities
Rect. Shipt.
926 4 916 11 -- 245 18 1546 --
3,832 1,030 3,874 933 41 824 6 995 54 -- 263 -- -- -- -- 545 15 3051 --
10,723 1,983 12,267 1,998 --
46 36 45 14
2,702 143 1,875 96
-- Coal
New York
Port of New York, N.Y.'
Hudson River, N.Y
Hempstead Harbor, N.Y Huntington Harbor, N.Y Great South Bay, N.Y Port Jefferson, N.Y Total
Delaware Bay area
Delaware River, Trenton, N.J to the sea/
Wilmington Harbor, Delaware Total
Chesapeake Bay area Baltimore Harbor and Channels Maryland
Nanticoke River, Del. and Md Washington Harbor, D.C./ Potomac River below Wash., D.C
Hampton Roads, V1rginia2/
James River, VirginiaS/ York River, Virginia Total
Total, north Atlantic coast
New England Penobscot River, Maine Searsport Harbor, Maine Portland Harbor, Maine
Portsmouth Harbor, New Hampshire Beverly Harbor, Massachusetts Salem Harbor, Massachusetts Port of Boston, Massachusetts/ New Bedford and Fairhaven Harbor, Massachusetts
Fall River Harbor, Massachusetts Providence River and Harbor, Rhode Island
New London Harbor, Connecticut Thames River, Connecticut Connecticut River below Hartford, Connecticut
New Haven Harbor, Connecticut Housatonic River, Connecticut Bridgeport Harbor, Connecticut Norwalk Harbor, Connecticut Stamford Harbor, Connecticut Total
Table 5. U.S. Domestic Waterborne Coastal Receipts and Shipments of Selected Bulk Commodities, North Atlantic Coast, 1969 and 1970
(In thousands of short tons)
Total all study commodities Crude oil Petroleum products / Dry bulk commod
Port/area 1969 1970 1969 1969 1970 1970 1969
Rect. IShipt. Rect. IShipt. Rect. IShipt. Rect. IShipt. Rect. IShipt. Rect.1Shipt.1Commodity Rect.IShipt1 Commodity
1970
-- -- 926 4 916 11 -- -- -- 189 18 154 6 56 -- -- 3,791 1,030 3,874 933 -- -- -- 824 6 995 54 -- -- -- 263 -- -- -- -- -- -- 333 15 305 1 212 -- Coal 15 -- 10,723 1,831 12,252 1,998 -- 152 Coal
46 36 45 14 -- 1,953 143 1,875 96 749 -- Coal
5,710 669 5,590 358 305 -- 325 -- 5,405 669 5,265 358 -- -- -- -- -- --
299 1,536 697 1,320 -- -- -- -- 299 1,536 697 1,320 -- -- -- -- -- --
659 d/ 504 -- -- -- -- -- 223 d/ 244 -- 436 -- Coal 260 -- Coal
4,236 3 3,700 10 -- -- -- -- 4,236 3 3,700 10 -- -- --
5,769 1,025 5,909 1,409 -- -- -- -- 5,769 1,025 5,909 1,409 -- -- -- -- -- --
1,009 -- 748 -- -- -- -- -- 251 -- 312 -- 758 -- Coal 436 -- Coal
1,512 324 1,350 195 -- -- -- -- 1,512 324 1,350 195 -- -- -- -- -- --
957 -- 989 -- -- -- -- -- 168 -- 208 -- 789 -- Coal 781 -- Coal
646 -- 594 -- -- -- -- -- 601 -- 592 -- 45 -- Coal 2 -- Coal
40,903 6,792 40,512 6,405 346 -- 340 -- 37,512 6,640 38,693 6,405 3,045 152 1,479 .-
I
21,352 16,888 27,409 13,745 9,453 36 10,002 -- 10,377 14,967 16,733 12,262 -- 2/ Phos. rock -- d/ Iron ore 15 9 Grainsf/ 19 9 Grains/
1,507 1,876 Coal 655 1,474 Coal
2,141 956 3,081 579 -- -- -- -- 2,141 3 3,077 4 -- 947 Coal „ -- d/ Iron ore -- 6 Grains -' 4 -5 Grains/ -- -- -- -- 570 Coal
1,259 -- 1,051 6 -- -- -- -- 1,259 -- 1,051 1 -- 5 Coal
116 -- 34 -- -- -- -- -- 116 -- 34 -- -- -- -- -- -- --
275 -- -- -- -- -- -- -- 275 -- -- -- -- -- -- -- -- --
1,688 165 2,714 167 -- -- -- -- 1,688 165 2,714 167 -- -- -- -- -- --
26,831 18,009 34,289 14,497 9,453 36 10,002 -- 15,856 15,135 23,609 12,434 1,522 2,838 678 2,063
1
23,844 4,498 33,650 5,070 18,583 27 26,709 150 5,227 4,471 6,914 4,915 23 -- Phos. rock 16 -- Phos. rock -- d/ Grainsf/ -- 5 Grainsf/ 11 7- Coal 11 -- Coal
65 -- 20 -- -- -- -- -- 65 -- 20
23,909 4,498 33,670 5,070 18,583 27 26,709 150 5,292 4,471 6,934 4,915 34 d/ 27 5
2,305 115 4,002 189 49 -- 62 -- 2,053 62 3,793 1091 202 -- Phos. rock -- -- --
1 53 Grainsf/ d/ 80 Grains" -- 2/ Iron ore 117 -- Phos. rock!
-- 5 -- d/ -- -- -- -- -- -- -- -- -- 5 Grainsf/ -- d/ Grains/ -
11 -- -- -- -- -- -- -- 11 -- -- -- -- -- -- -- -- --
232 -- 263 -- -- -- -- -- 232 -- 263 -- -- -- -- -- -- --
1,302 2,586 1,730 706 -- -- 35 -- 1,249 41 1,609 29 521 1-0 =7.1. 1s
pck 86 =Znsicick 11
-- 2,535 Coal :: 666 Coal
18 -- 15 2 -- -- -- -- 18 -- 15
386 1,515 641 1,162 248 22 414 -- 138 1,493 227 1,162 -- -- -- -- -- --
4,254 4,221 6,651 2,059 297 22 511 -- 3,701 1,596 5,907 1,302 256 2,603 233 757
95,897 33,520 115,122 28,031 28,679 85 37,562 150 62,361 27,842 75,143 25,056 4,857 5,593 2,417 2,825
a/ Includes 2911, gasoline; 2912, Jet fuel; 2913, kerosene; 2914, distillate fuel oil; and 2915, residual fuel oil. Ej Includes grains; 1011, iron ore and concentrates; 1051, bauxite and other aluminum ores and concentrates; 1121, coal and lignite; and 1471, phosphate rock. C/ Consolidated report. sy Less than 500 short tons. e/ Excludes Hudson River (lower section), New York. 1/ Includes 0105, rice; 0106, sorghum grains; 0107, wheat; 0111, soybeans; 0102, barley and rye; 0103, corn; 0104, oats; and 2049, grain mill products, n.e.c.
Source: Department of the Army, Corps of Engine,irs, Waterborne Commerce of the United States, Part I, "Waterways and Harbors, Atlantic Coast," 1969 and 1970.

22.
As shown in table 5, these and other ports also shipped petroleum products in coastal trade (6.4 million tons in 1970), indicating that they do serve to a limited extent as transshipment or distribution points for other nearby ports.
In the New York Harbor area the movement again is composed almost entirely of petroleum receipts from foreign and domestic sources (47.8 million tons of petro-leum products and 18.2 million tons of crude petroleum in 1969 of total imports and coastal receipts of 67.5 million tons). Most of the remainder is coastal receipts of coal. There is a substantial volume of shipments in coastal trade of petroleum products, indicating substan-tial redistribution in the port area of receipts from both foreign and domestic sources. In fact, for 1969, the port of New York is reported to have shipped in coastal trade more petroleum products than it received, indicating that some part of its shipments was imported petroleum products. Reported receipts of petroleum products in coastal trade in other ports in the New York area were probably from the port of New York.
In the Delaware River and Bay area, the bulk com-modity movement is similarly dominated by the receipt of petroleum from foreign and domestic sources (in 1969, 46.9 million tons of crude and 13.7 million tons of products). In addition, there are substantial imports of foreign ore (12.3 million tons in 1969). The rela-tively greater proportion of crude petroleum over petroleum products reflects the importance of the Dela-ware River and Bay area as a center for petroleum re-fining.
In the Chesapeake Bay area, the bulk commodity movement is dominated by the export of coal (39.7 mil-lion tons in 1969, of which 2.7 million tons was through Baltimore and the balance through Hampton Roads ports), and the import of iron ore into the port of Baltimore (10.5 million tons in 1969). Relatively small petroleum refineries in Baltimore and on the York River in the Lower Chesapeake Bay area account for some receipts of crude petroleum (0.5 million and 3.1 million tons, respectively, in 1969).
23.
The largest movement of grains in the north At-lantic is through the Chesapeake Bay area (2.4 million tons in 1969, of which 1.5 was through Norfolk and 0.9 through Baltimore).

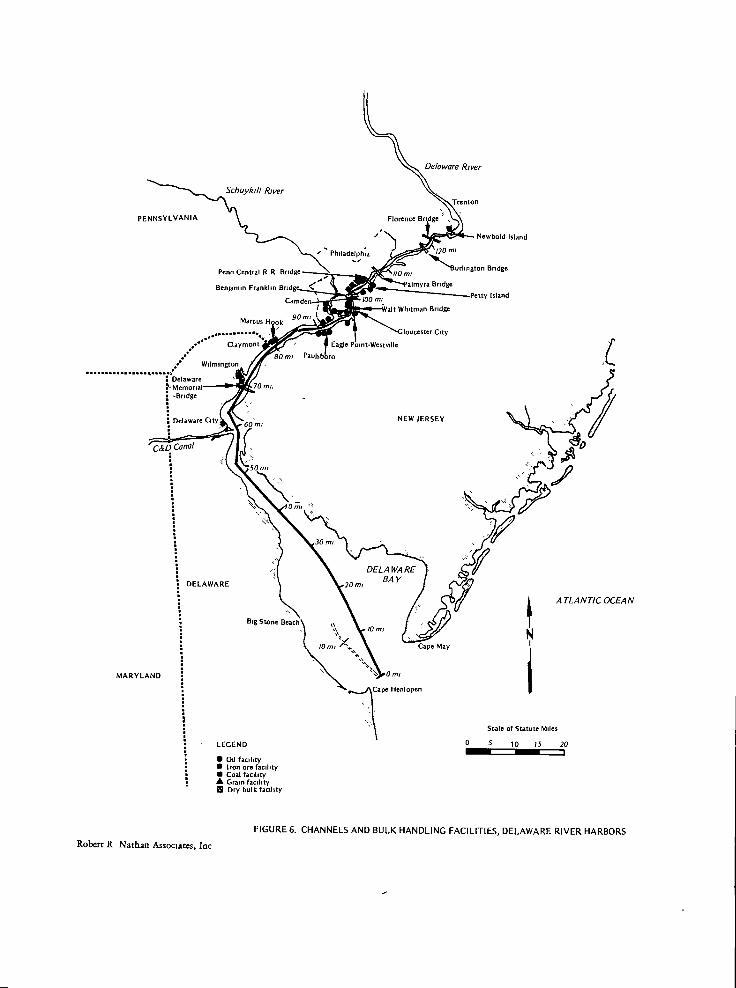
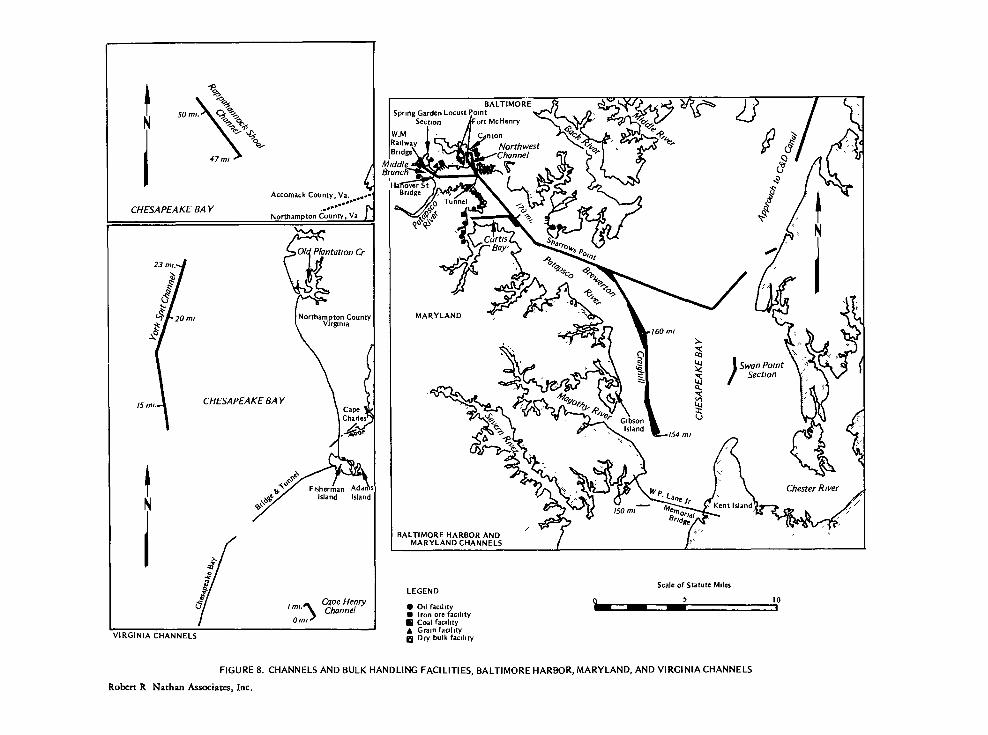
III. MAJOR HARBORS AND CHANNELS
This section reviews the major channels to New York, the Delaware River ports, Baltimore and Hampton Roads. The locational characteristics of these channels are depicted in figures 5 through 9, and longitudinal cross sections are presented in figures 10 and 11. The project dimensions of the major channels are presented in table 6.
The longitudinal cross sections graphically de-pict the fact that the principal New York channels are naturally shallow throughout most of their entire length and have had to be dredged to their present depths. Further deepening would require dredging throughout most of their lengths.
The situation in the Delaware River and Bay is similar, with the natural depth being less than 40 feet for almost all of its 130-mile length. However, at the lower end of the bay, within a distance of 5 miles to the ocean, depths sharply increase to over 100 feet. This is followed by a sharp decrease to depths of approx-imately 50 feet, but the surface area of these shallower depths is relatively narrow, and channels for deeper ocean-going vessels can be provided with a relatively limited amount of dredging.
The Chesapeake Bay channels to Baltimore, in con-trast to those of the Delaware Bay, are naturally below 50 feet deep for most of their 160-mile length, and are below 75 feet for three-quarters of their length. Bal-timore Harbor itself, however, is quite shallow.
25.

Bayonne grid .`'"'"1-10-0-1—,1 338 sal
Staten Island Rapid Transit Bridg
Goethals Brid Elizabeth
lj
NEW JERSEY Rahway River
AMA/CA BAY
Uo.ttr
lain Ship Channel Ambrose Channel Perth
Amboy
Raritan Rr anThoy'
Morgan RARITAN BAY ATLANTIC OCEAN
LEGEND
• Oil facility Sandy Hook Bay
nchorage Channel
BROOKLYN
Hudson River
Manhattan East River
0
YORK BAY
Outerbridge crossing
New York and
New Jersey Channels
NEW JERSEY
Scale of Statute Miles
0 I 2 3 4 5 1=1M1----■=a-g■
LOWER NEW
FIGURES CHANNELS AND OIL HANDLING FACILITIES ALONG NEW YORK AND NEW JERSEY CHANNELS
Robert R Nathan Associates, Inc
Penn Central R R Bridge urlington Bridge
Benjamin Franklin Bridg
Camden
/10
almyra Bridge
Petty Island
0 5 10 15 20 1■1=1■=1
PENNSYLVANIA
Delaware River
Trenton
Florence Br
Schuykill River
Newbold Island
120 ml
. 90 mi MUCUS Hoo k
................
Claymont
/Z-Eromi Paulsbbro Wilmington
: Delaware Memorial
! -Bridge
Delaware City
alt Whitman Bridge
loucester City
Eagle Pinnt-Westville
70 mi.
60.Mi
C&D Canal
50 mi
0 mi
Big Stone Beach\
/0 m. Cape May
Cape Henlopen
ATLANTIC OCEAN
Scale of Statute Miles
••• Philadelphia
NEW JERSEY
DELAWARE
MARYLAND
LEGEND
• Oil facility • Iron ore facility • Coal facility • Grain facility a Dry bulk facility
FIGURE 6. CHANNELS AND BULK HANDLING FACILITIES, DELAWARE RIVER HARBORS
Robert R Nathan Associates, Inc

PENNSYLVANIA ...........
MARYLAND NEW JERSEY
op '0 0
Baltimore
Baltimore Harbor Channels
DELAWARE BAY
Annapolis
Cape May
Cape Henlopen
Patuxent River
Potomac River
CO
VC
z 0 Rappahannock River
VIRGINIA appahannock Shoal Channel
ATLANTIC OCEAN
York River -\\
York River Entranc
YorkSpit Channel h
Gape 41,,T Chirles
Scale of Statute Miles
Thimble Shoal Channel
>"1-Cape Henry Channel Cape Henry
Yorktown
James River
NewPOrt Ne
Hampton Roads
Portsmouth
FIGURE 7 LOCATION OF CHANNELS AND HARBORS, CHESAPEAKE BAY Robert R Nathan Associates, Inc
LEGEND
• Oil refinery
OIC Plantation Cr
Northampton County Virginia
CHESAPEAKE BAY Cape Charles
5
nu" Cqoe Henry Channel
)"'I4‘ Fisherman Ada s
Island Island
0 Int
-Po -0 -5
50 mi.qV%
-> is
\47 nu 1,
CHESAPEAKE BAY
Accomack County, . •
Northampton County, Va
BALTIMORE Spring Garden Locust Point
Section Afort McHenry
W.M Railway Bridge'
Middle Brancfi _
Ha over St
0 Tunnel aSCA
nton
Northwest Channel
— CBay, iirtts
Po,
MARYLAND
160 ml
" Glson tv. Island
154 m/
Chester River
l'a^e Ir 1-50 /771— --
anc7geria), Kent Island
BALTIMORE HARBOR AND MARYLAND CHANNELS
VIRGINIA CHANNELS
LEGEND
• Oil facility • Iron ore facility • Coal facility • Grain facility ▪ Dry bulk facility
Scale of Statute Miles
5 10
10115
FIGURE 8. CHANNELS AND BULK HANDLING FACILITIES, BALTIMORE HARBOR, MARYLAND, AND VIRGINIA CHANNELS
Robert R Nathan Associates, Inc.

HAMPTON Fort
IMonroe
• ---
Hampton Roads Bridge-Tunnel
Thimble Shoal Channel ATLANTIC OCEAN ,
2 5.° 1
I ------- Area \
Craney Island Reach Disposal
Port Norfolk Reach----7-
Midtown Tunnel-.
Newport News Channel,'
Norfolk Harbor Reach
Far-7 Island
,•••
• {, Eastern Branch
17'
VIRGINIA BEACH •
VIRGINIA
7„1
BAY . 0 mi
0 Brood
En 6•••>sttl "
▪
•C'
CHESAPEAKE
Li
• Oil facility • Grain facility • Iron ore facility • Coal facility Albemarle and Chesapeake Canal Dismal Swamp
Canal I,
r NEWPORTV \-- 1?..-
<c, NEWy 0 A t-
, ,
Lafayette River
.:
, , ` NORFOLK • Lamobierts .. \ "I
.:' .•.• '''... ''',.
„
.2:.
Downtown Tunnel
Southern Branch Channel , •:. ',- PORTSMOUTH ,• 44 _ :
Norfolk and Portsmouth Belt Line Railroad Bridg•
I Jordan Bridge ' ' .:..... • ,
' %./:- US 13 Highway Bridge
LEGEND
e- Entrance Reach Entrance Reach
Western Branch
PORTSMOUTH
Southern Branch
v 1
• ailroad Bridge
orfolk and Western Railroad Bridge
0
Scale of Statute Miles
5 10
FIGURE 9 CHANNELS AND BULK HANDLING FACILITIES, HAMPTON ROADS HARBORS Robert R. Nathan Associates, Inc.

MOMMEMMEMMIIMEMMEMEMMEMMIMIUMMIIMMEMEMMEMEMEMMMEMMEMMEMMEMEMMEMMEMMIUMMEMMMEMEMMEMMEMMMEMMEMMEMMEMMEMMMEMMEMOIMMINIMMEMMEMMEMMIM MMEMMEMEMEMEMEMEMICOMEMMEMMINIMMEMEMMEMMEMMEMMOMMMINIMEMEMMEMMENEMMEMMEMEMMIMMEMMEMEMMMEMEMEMM MMEMEMMEMMEMEMEMINIMMEMMEMMEMMEMMINIMMMEMEMMINIMMINUMMEMEMMEMENMEMMEMMEMEMMIUMMMEMMEMERNUMEMMEMMEM 1111111111M11••••••••••••■111 MMEMMEMMINIMME:MMEMEMEMMEMMEMMEMMEMEMOMMEMMEMEMMININIMMINIMMEMMUMMEMMEMMEMMENNIMMEMMEMMINIMMMEMMEMEM 11••••••••••••••••••11111111111 ■1111111 MEMMEMEMINIMMWZMEMEMMEMMEMEMEMMEMMEMOMMEMEMEMMIMPIIMMENIMEMMUMMEMEMMEMMEMEMENIMMEMEMEMEWIMMINMEMEMM 111111•••••••••••••••••• ■1111 IIMMEMEMEMEMEM.grqMOIMMEMMEMMEMEMMEMMENOMMEMMEMEMENUPMMIIMMINIMEMEMMMEMMEMEMEMMEMMEMMEMMEMEMMUMMOIMMEMMEMM MMIIMMEMEMIIMMOMMEMMOMMEMMEMM MEMEMMIIMMEMMEXIPMEMEMMEMMEMMEMEMEMEMIIMMEMMEMMMEMUMMEMMEMMEMMEMEMMEMMEMEMEMOMMUMMEMERCIIMMEMEMMEM MEMEMEMMEMMEMEMEMMIUMMEMEMMIN MMEMMINIMMEMMEWAMMEMMEMMEMMEMMEMEMMEMEMMEMMEMEIMAMMEMMEMENNMEMMEMMEMEMEMEMENNIMMEMEMMEWIMMEMMEMEMM •••••••••••••• ■••••■••1111111111 momminuommormwAmmommmommommummommommiummommommommmmommmrnminummommommnimmEmmomm ••••••••••••••••••••■lIl MIIMMEMEMMEMEWMIMMEMMOMMEMEMMEMMEMEMEMMOMMEMMEMEMEAMMEMEMEMMEMMIMMOMMEMMEMMEMMEMEMMMEMMERMEMMEMMEMEM •••••••••••••••111111••• ■• immummommmiummmommummummummommimmummommommummiummommEmmummummommismommommomm Nommommunum■N MEMMEMMEMMINIHMIMMEMMEMEMOMMEMEMMEMEMEMEMMEMMEMMEOMMEMMEMMEMEMMEMEMMEMMEMIMMEMEMMI NIMMEME=2 ,121g1011: MIIMMEMEREMMEMMEMMEMEMEMMENNU MOMMEMOMMEMEWLEMMEMMEMEMMINIMMEMMEMMEMMEMMEMMEMMLIMMEMEMMUMMEMMEMMEMMEMEMMEMEMMEMMINIMMPOMMIMMENIMM MIIIMMEMMUMMEMEMEMINIMEMEMMEMME 113/141M111.441111175111•••••••fffirn111111111111111151•••••••Fri•MMERAMMEMPil•••••••11/ 71M111•••••=111111••••■PROMMIIIIMMEINErnmrammtrun■m immummilmummumuummmommommummimmumm....mmommommomm....m.........mmommommomm......mmm
•.......now......mion■rn
immommimmunummomminimmummmummummummilmommommimmmommigimmimummommimmimmoimmomm. mimmommimmimmommilimmommomm MINIMPlom"411111WIIIMNOMEMADI:WT14114.141.111181111111MEMMEMMEMMEMOIMMEMINIMMESPNWM140:21UMMEMMEMMIUMINELUMMINAMMEM MEMMEMMEMEMMEMMEMMEMMEMMEMEN EMI TIMw RIIIMMAAWIWIDICCOMMIIMA:OZTIMME -91Ammemommummammgmava..immiummommilmmmommomm mom IiirAMME•••M•••••EMEMMIMME•ME nommom••••••m--quirommom. mummommommommommommim IIIMMEL■■mlmelmAUMMEMMEMEMMIIMMEMMEMMEMMEMMEMMEMMEMMEMMEMMEMEMEMMEMMommallMMEMEMMEW mffmmasrumamomi nm MEMMOMMEMMEMMEMMEMMEMEMOMME MIUMMEMINIMMIMOMMMEMMEMMEMEMEMMEMMEMMINIMMIMMEMEMEMMEMMEMMINIMMEMAMMEMIWAIR=UMMEMNIIMMWEIMMICWIMEWii EMMEMMIIMMMEMEMNIMMMEMEMMEMMIIM IIIIII••••••IIIIMMBMM••••••••IMINIMIMIIIIIIIIIUI•••••••••••••••••••••••••••••••gglIllIll rIIIIpf/INNNIMIIIIII isid'ANIIIIIIMMMMIIIIII••■•NlIllIll MMEMMEMEMINIMMOMMIVERMEMMEMMOWNOMMEMMEMMEMEMWOMIWOMMOMIMMEWSEMMEMMOMMEMMCAMMUM- ME • wommummummommummrsommimmmEmmommi MMOM••M•NMEMMEMO•MKEW•••ME••IEWINVEMMEMMEMMEWUMMIMEWAIMOMMUMAMEMMEMEMOIMM MITITMM MO MfilimmoWIMANTIESErEITIg..mmEMEMMEMMEMMMEMEN 11111••••••11111111MMEMIUMWIPE:111•11111•Mill•••••••FMUM111111QMIIIMIMMIMINIMIIIMILMillIkLM1111111•11•111111•15 1114■ ••1111111 111••• ••••••1110,•••••:511111•■•■• MMEMMEMEMMEMEMEMOMMniMMENWMEMEMMURIMOVIIMEMMITIMEMEMMENWININIMMEMMEMMEMMMMEMEMMEMIUMMEMOMMIMMEMMIM MMEMMEMPMENOMMMENRIIMEMMMEMEM EffEERRINOMMINIMMEMOIERMEMIIIMMEMAMMEMMEINIMMOAAMMEMAMMEMMEMAWIMMEMEMEMMEMMEMIMMEMMEMMEMMIUMMIIMMITCOMMENIPINaMMEMIEMIMOMMEMMOMMEM mmommummommmommommommomiummommomatimmommommommumunimmommummlummommommummommmitm.m mom MEMMINIMMEMMENIMMLE■MMEMPOI 1 IM MEMMEMMIIMMUNMEMMEMMEMMEMEMENNIMIMMEMPWRIPPRIPMNIMMIVIIMPONMENIMPMEMPROPIMMIMMEMEMMIUMAMMMEMOHMIN IMAM MEMMEMNEMMENNEMEMOMMMEMMEN
IUII U' MMEEMMIIMMEIMMEMMEMMEMEMMIMME MEMEMMEMMIIMMOIMMEMEMMOMMEMMEMMEMMEMMERMEMEMMOMMEMMEMEMEMINIMMEMMEMEMMEMMEMMEMEMMEMEMMEMMISMEMMMEMEMEM MMIMIMMEMMEMMEMMMEMMEMMEMMEMM
II 11111111111111111111111111111111111Mell I mummummommomm ommomminimmummommommommommimmEmmmummEmmommmemnrimmmemmimmorwarmmimmommmommm mommommommem . mom mmmmmmmmmmmmmmmmm immummommilimmummimmmommummommommsmommmmmummummmuninummimmommommummommummommommommm •••mi•mo••••nwoo):+:2 111'4 4 ...; o 1 I4' &U U11-'I 211 4 ..........mumwommunommoma '11E1 I ',I 114'11141: 1 10111••••••••••••••••••■11 MEMMEMEMMEMEMMEMMEMEMMI -2 • M••MEMEMMUNIMM•M••••EM•MMEMIMME•E•••MP••raii ammumummummolimmomm mommommommmommlimw---mmuniatammunummummEmmommummommummommommummommor -mummommomm. mmommommommummummmmomm EMMEMMEMMONMEMEMMINIMEMEMINIMPOPMEWIMMOMMINIMMEMMEMEMENEMMEMEMMIIMMEMMEMEMMEMMEMEMMEMM IIIIIMMENEMEM IIMMEMMEMMINIMMEMMEMMEMMEMMEM •••••••••••••••!/•••••11111rillMailliiii=i11111•111111111••••••••••••••••••••••••••••••••••••••••1 111111MMINNWITieZallidON• mommummommummmummommmom mmommommummammummirAummmommommommommumummimmommommommommommommummunimmumummundm mmumunrnmmum ■N mommonnimmuunnAm....ammommoommummommunnommomarmrincommxmaumum lummmumanom m MMEMMEMMOOMMINMEMMEMMUMMOMMEMMIMMEMMEMMEMEMEMEMMEMMEMMEMMEMMEMMEMMEMMEMMMEMREMTBCAUVINNMITOMPIIMMENNOMM IM111111••••••••• ■•••••■• mmommommommummumummumilimmimmommommommommommummommommummilimmommunimmilarmimmum diannummomm•■•
I mmommommulommommm ommommualammommummommimmrnmilmmilmmmmommumummrnmEmmummirmanummmumm wimmummum■E mummummommommommommummimmommommommummummimmmommommumummommumummommommommumm mmummommommmim immumummommmommommommommimmommommommummummommommummummommEmmummummommommuumm mommummommilmommummommomm MMEMMOMMEWTRIIMMURPOMEMMEMMEMMIMMEMEMEMEMEMMINMEMMEMEMMEMMEMMIUMMEMMEMEMMIUMMEMEMEMMEMMUNIUMMIIMM MEMMEMEMEMMEMEMMINIMMEMMENNE 1111111MMEMMEMIONJAIWIRAMMEMMEMEMMEMMEMEMMEMMEMMEMIMMEMEMMEMOMMEMENEMMEMMEMMEMENIMEMEMMEMEMMEMUMMEMMIMM MEMMEMMEMMEMEMMEMMEMMEMMEMEM MMEMMEMMEMIIMMEMMEMMEMINIMMEMMEMEMMEMMEMMEMMIAMMEMMEMMEMMEMMEMMAMMEMMEMMEMEMMEMEMOIMMMEMENEMENUMMEMMEMM MI111111111111111111•111111•••••• ■• 111••••••••••••••••••••••••••••••••••••••••111111111111••••••••••••••••••••••••••••111111111111111111:YMMMI0114111M114111MEALIL ..WAIIII: 11111111111111111111111M 11111•1111■111111= OINIMMEMEMEMMEMMEMMEMMEMEMEMMEMMEMMEMEMENIUMMEMEMEMMEMMEMOMMEMEMMEMEMINIMMIMMEMWMIMMAMMIMMEMSIMMOMM Iiiilliiii1111111••••••••••••■•
i MEMMEMEMMEMMOMMEMMEMEMOMMOMMINMEMMEMMEMMEMEMNIMMEMMEMMEMMEMOM MMEMMEMEM •••••••••••••••••••MEMMEMMEMMEMME ••■•• MEMMEMEMEMMEMEMEMEMMEMMEMEMMMEMMEMMMEMMEMMEMMEMEMMEMMEMMEMMOMMEMMMMMEMMEMOMEMMEMMEMMEMMMM •••UMMEM•EMM•MEMEMM•MMEMMEMME MMEMMEMEMMEMMEMMEMMEMEMEMMEMEMMEMMEMMEMEMMEMMEMEMOINMEMMEMMEMMORNMUMMEMMEMMEMENMMEMMEMMEMM •••••••••••••••••••••■••
1111•••••••••••••••••••••••••••••••••••••••••••••••••••••••••••••••••••••••••••••••••••••••••• 111111111111111.1111•••••••••••••••••••••■••• MMINIMMEMMEMMEMOMMEMEMINIMMMEMMMOMMEMMEMMEMMEMINMEMMEMOAMMINIMMEMMEMMEMMMMEMMEMMEMEMMEMMEMEMMIMMEMEMEMMUMMEMIIMMOMMEMMEMEMEMEMEM MEMMEMMOIMEMMMINNOMMMMEMMEMENMEMMIMMEMEMOMMEMMEMEMMEMMEMNIMMEMMEMMEMMEMMOMMEMMEMEMMEMMUMMEINIMEMEMMEMMEMEMMEMEMEMMEMOMMEMMEMM 1111111••••••••••••••••••••••••••••••••••••••••••••••••••••••••••••••••••••••••••••••••••••••••••••••••••••••••••••••••••••••••■•
FIGURE II LONGITUDINAL CROSS SECTIONS OF CHESAPEAKE BAY CHANNELS Robert R Nathan Associates, Inc.

mommmiummmumommommommommommommEmmilmmommommommomminimmmummmmommommiummommmommommommommommmornmommommmommomm lummommmumommmommummommommummommimmommmmomommommimummumummEmmommummommopmmEmmemmommumummummommommommommm MEMM10214 4DNX.ZNM • EHMFUJEK 21.12.2MEIOMMEMMEMINIMMEMEMMEWMVADC4r=711C 111./U41 MMC- ICINIPC4MMEMMEMEMMOMME MMEMMEMEMMMEMMIIMMEMMEMMEMMEMEMMINIMMEMEMMIMMEMMEMEMIMMEMMEMMIMMEMEMMMMEMMEMEMMEMEMEMMMEMEMEMMMINIMMEMMEMEMMEMOMMOMMEMEMM MEMOMMEMEMMIMMIMMMINMEMMMEMM-741MEMEMMIMMEMMEMEMMEMEMEMINNIMMEMEMEMMEMEMOMEMMIMIIMMEMEMMEM MM P MM IIIMMVOMMEMMEMMINUMMOMMEMMEMEM MMEMMEMMEMEMEMMAIMMEMWMMAIMMEMIIMIMMEMMEMEMMEMMEMMEMEMMEMEMEMMEMEMMIOMMEIMMOMMEMAMEM MM 4 MM MEMAIMMEMEMMINIMMEMMEMMMINUMM mmummommommi:mmilmommomommammarlimmmummommommommommommommommmommummos.ummom ,Jmommwm•••••••••o••••••u IIMMEMMEMEMMEMMIKAMMMEMPMEMEWAIMMAMMIMMEMMEMMEMEMMUMMEMMMEMMEMIMMMINIMMIUMMMEMVAIMMJEMEMIWAMMEMMEMEMMEMEMMEMINIMMIMOMMEM mmommommommeimmommommoommamosammommommommommommmiminmummommommommiminwamicammmomnommmmoi••••••••••••••••• mmummommommmomquimm MMMMM mmammtvasimummommummummmommimmommummummommumelniumwammo mmmmm mmom•••••••m•••••u•momm••• milmmmommommommommimm=mom mm Q mm mt_mumuommmommommommommommommmommommommommomm3smicAmmomm=momm7Ammosimmummimmommum immommommmommoommonwilimultimmipummmummommommommommummommmommumommumma%••EA••••m••••••i•••••••••••••••• MMMMMMEMMMMMMMMtMMMMMWMMW.MMWMMMMMNMMMMMNNMMMMMMMMMMMMMMNMMMMMMMMMMMMMMMMW1MMMFdMMMMMWIIMMMMtMMMMMMMNMMMMMMNMMMMMMMM mmmmmmmmmmmwmmmmmmmmmnmmmmmmmmmmmmmmmimmmmmmmmmmmmmmmmmmmmmmmmmmmmmmmmmmmmmmmmmmummmmmnmmmmmnmmmmmmmmmmmmmmmmmmmmmmm mommommummurummoirmmumromom.vmwmFoomrwvolrmwamvpinammommommimmommummelmmorimmionmmommrAmmommommommommummom MMEMMIMEMMIUMMEMM INFPWMPVIMMEMMEMWAMMOIMMIMIMMEMEMMEMMIMMEMEMMEMMEMMEMEMEMUMMEMEMMMEMMEMEMEMMEMOWWWA'IV , illflaYAIW'MUGO'N4 mommommommilimmumaaommagiammirammumalmommummilimmummommummomommommimmommommilmomumumwilmimmimmimumeAmm mommommommommomusulmzummommogammiromm.immly:w:mouLoopommumummmommommommommimmar:.meulq.naumwmmkiimmwmnrowirovrwimmom •••••1111111111111111•111111111MIIIIIIIMME mm Pi m E:Wr/IIBE2I•2MMMM•MMMUIMMMMMMNMMrllMMMIMnnlliMn•MMgila2IMPMMMEMMM MEMMEMMEMMEIMMEaummUMMOMMOMMNUMMAWMEmpsuMEWnMOMMTWAMIMMEMMEMMEMEMENVOMMONUMME&UMEMEUMMEMMEMMEMMAIDIUMOMMIRMAPRIMOIREMOMEM mmilmmommommommommommommpAmmommmummmmomminemmuasmaum=ummommommo mmmmm m mmmmmmmmmmmmmmmmmmmmmm mormieurimemiztammom MEMMEMMEMMEIMAMME, - Immommerummommommummommunimmmummommimmormom mmmmmmmmmm Lar-mommillamommommommommiumm milmommmom - mmorup immolulmommommommummommummommommummowm -limr.:mm immi m -% w yea ommommmmum immommommo mow" liemmummommummummumilmmommommor -gm ir mmomummilmmommommm IIMMEMMMOMMIMMEMEMMMEMMIUMMEMOIMMI AMMEMEMMIMMEMEMMINOMMEMEMEMMEMEMV` MMOIMMEMEMEMMMIIMEMMEMMEMMOMMEMEMEMEMMEMMEM MEMMEMEMINIMMEMEMEMMEMMEMOMMIUMMIAMMIMMENEMMEMEMMMIMMMEMMEMMEMMEMMEMMIONMMINIMMIVAMMEMMEMEMMEMMEMMMilmialMEMEMEMMEMMOMME 111111111••••••••••••••••••••••••••• 1111111111•111111101111111••••••••••••••••••••••••••••••••••111M111111111111111•••••••••••••••••111111••••• ■••••• ••••••••••1111111111111111111111111••••••••••••••11/1111••••110••••••••••••••••••••••••••••••• ■•••=1•••••••••••M•111111111111MMEMMIIIIIIIMMI MIBMWINIMIIIHUMMINIIMIMMOMM•1111111MME11111•■•••••••1111111111•1•11111111•••••••••11111111111111111111•11111111111:411111111•••••••••••••••••1■•••••••••••••••••• ••••••••••••••••••••••••••••••••••••PTWIMIIIIIIMMIIIMIUMMENIMMEMINIMMIMIMM•1111MMIRIMOMMEIMMIINIMMII MEMOMMOMMOMMMEMIIMMINIMEMMEMMEMMEMMIUMEMMWOMMEMEMEMPNO mmm P m umwmammumommommommommummommommmmusammommilimmommommommomm MIIMMEMMEMEMMIEMMUMMUMMIMMEMEMEMMEMEMMEMOWEEMEMOINOMMINAIMOIMMEMMISMEMMEMMEMEMMEMMIUMMMEMMEMMEMMEMMEMMEMEMEMMEMMENIMM 11111 111•••••••••••••••••••••••••••••••••••1111111111111011111111111•1111111111•111111•1111111111111•••••••••••••••••••••••••••••••••••••••• ■••••••••••••••• ••••••••1111111111111••••••••••••••••••••••••••••••••11•••••■••••••••••••••••111111111•111111MM111111111•1111111111111111111111111111••••••••••1•111111•111111111M1111111111 •••••••••••••••••••••■••••••••••••••••••••••IMM•11111111111111111111111••••••••••••• ■•••••••••••••••••••••••••••1111111111111WIIIMIIMMII 111111111111111MMIMMIIIIIIMIEMEM••••••••••n•••••••••••••••1111111111111••••••••••••••••111111111111111111111•111111111111111MMINEMMUMIMMIMININ •••••••M1111111111111111111111111111111111111111111111111 11111111111••••••%•••••••••••••••191111111111111••••••••••••••••••••••••••••••••••••••111111111111111111•11111•11111111111MM 111111•••••••••••••••••••••••••••••• ■■ 111111111,M11111111•Mg111111•Z••••••••••••••••111111111111MMIUNIMM•11111111•••••••••••••••••••••■•••••• 111 111111111111111111•111 11111111111111•111•11111MMEMMIII:•■••••MMAIIIMPF:11111111•••••••••■••••••••••1••••••••••11111111111•111111111••••••••••••11111111•1•111111M 11••••••••IIIIIIIIIIIIIIIIIIIIIIIIIIIIIIIIIIIIIIMIMIIIIIwIIIIIM•;Mff•IsMrn•Itr.IIIIIIIIIIMBIIIMMMM•IMIIIIIIIIMMMMMMIIIMMIIIMIIIIIIINMMMMIIIII•••••••INIMIM immommEmmommalimmommmommommooRm ommmlimmAmmuh,eammommommommommummommommmommummommommommummommommommommommm inumgrommaummummummumEmmann6-..msflrammimmtrainmommommosmor.mmummomummummummom mom mism-mommomommninrimemammummrsisEmmammmummummumminumummmomomamminmernms moo mownmminmomommL.EN:AmmTa4•••••nr.imainnatamiummommummuumEmmmommummommommumom ismossmummimommome mm N mm iirm7woorommo:F.4.asamnruiniummommumrummommumunimmommummummeas mommom-mommommonnormizwammo.:mpemenrimm••••mumnimmimemmomunimummimmumumom mmmmmmmmMMMmpMmimmmmmpmmmmmmmmmmmmnmnmmmmnmmmnmmmmnwmmmmmmmmmmmmmmmmmmmmmmmnmmmwrmmmmmmmmmmmmmmmmmmmmmmmmmmmmmmmmmmm Inumminmmmo-immummommnourairerm: :or !mow:minimum' w immummummummourim= =am; x : oNSIIIIIINIEMPM111111111111111111•11111111•••••• mommmummmimillimmummiglimmammummilmmimminsimmumnimmommummuummimummmarmummomminwlwaimmommummilmommm mmmmommumgmaulmommommwommommEmminimmummommimmummommmmummommommamommommimmeminnmemmimun.mmmiwilmarAivmm • mEmm•mmom•o•pormummo mmummilmom mommommommEmmommilr-ummmommommommummummmummimmimmommimmommummommummommammommommmommommummumummummm ••••u••••••• -- ■mierlimr Nummommillow-m mmmmm mmoomplimmomummilimmummommummenummumummrnmommimmommum mmummummommommr , ■4111., NI, MUIP - -"OMPRIEW 41.-Tem-Nmymmmarmmummommoommumminimmumummommums
•r_Aarmarnmmimmummmumummommmummommommum MEMMINIMMEMMUMMEMMMEMOIMEMERMIMMEMEMMEMMIMMEMMEMMEMMEMMEMEMEMEMEMEMEMMEMMEMMEMMEMK m iri mm MEMMEMMEMMOMMEMMIMMOMMEMEMEMMOM MMEMMEMMEMMEMMEMMINIMMUMMEMMEMMIMEMMIMMEMMENIMMINUMMEMEMEMEMMEMMEMMEMEMMOMMEMERMOMMINIMMEMMEMMEMOMMEMEMEMMEMMEMMEMM MMEMMEMEMMOMMMEMMMEMMEMMEMMEMMEMEMMIMMEMMEMMEMMEMMEMMEMENWOMMEMMEMMEMMEMEMEMINIMMIAMMIMMEMMEMEMMEUVIMMEMEMMIUMMEMM MMIIIMMEMOMMUMMIOMMOMMEMMEMEMMUNIMMMEMMEMEMMEMEMMEMINIMMEMEMMEMMEMMIUMMEMEMMEMEMEMPAMMEMMIMMIMENNIMMUMMEMMEMMEMOIMEMMEM OMMEMEMMEMMEMEMSMEMEMEMMEMMEMEMEMMEMEMMEMMEMMENEMMEMMEMMEMMINIMMEMEMMEMMEMMEMMEMENVIIMEMEMMWITLTIMA mmmm WEEMEMMMEMMMEMMEMM immummummommommimmumommunammummummummommommommommommommumummommummrnmsammaimmoommommummommommimmommom OMMIIMMENIMMEMMIMMEMMOIMMMOZWANZIAZIAMKNOFIUNNEWAAMINIMMEMMIOMMEMEMMEMMEMMEMMEMMMEMMEMMPMEMMENNEMMEMMEMMOMMERMEMEMEMEMMMEM MMEMMEMMEMMEMMIMMINIMMEMEMMIOOMMENIMMINIMMMEMMEMMEMMEMMEMMEMEMOIMMOMMEMMOMMEMMINIMMEMEMBIGMEMMWOMMEMMOMMEMOMMEMMIOMMEMMENN MIOMMEMEMEMMEMMOMOMMIOMMEMMEMMEMOMMIMMEMEMEMMEMMEMMEMEMMEMMEMMEMEMMEMMMEMMIMMIUMMEMMOMMIMMEMEMMMINIMMEMMEMWMINMEMMEMME MMEMMIIMMEMEMEMMIMMEMMEMEMMEMMEMMEMEMMEMMEMMEMMEMMEMMEMMEMEMEMMEMMEMEMMIUMMEMMOMMMIMMEMMEMMENNIMEMMEMMEMMEZEMMEMMIUMN MEMEMMEMEMMEMMEMMEMMEMMEM MMMMMMMMMMMMMMMMMMMMMMMMMMMMMMMMMMMMMMMMMMMMMMMMMMMMMMM MW4MMEMMEM MMMMM MIIMMIIIMMOMMEMMEMENMEMMIOM IIIMMIMMEMMEMMEMMEMEMEMMEMEMMEMEMMEMMMOMMEMMEMMEMMEMMEMMEMEMMOMMEMMEMMEMMEMMINIMMEMMEMMEMMEMEMMIUMMINIMMENMEMEMMEMMEMMEMME MEMMEMMEMMEMEMMIMMEMMEMMEMEMMIMMINMEMMEMIUMMEMEMEMINIMINIMMEMMMEMINIMMINIMMEMMIMMEMMEMEMEMEMMEMMEMMIUMMIUMMEMMEMMUMMEMMIO MMEMMEMMIOMMESMEMMEMMEMIIMMMEMMEMOMOMMEMOMMEMMEMEMMEMMEMMEMMEMMEMMEMMENEMMMEMMEMEMEMMIUMMEMMEMMIOMMIOMMEMMEMEMEMEMEMEMMIMME MEMMEMMEMEMEMMEMEMMEMEMEMEMIMMENOMUMMEMMEMMEMMEROMMIUMMEMMEMEMMEMMEMMOMMEMMEMMEMMEMMIUMMUMMEMMEMEMMEMMIUMINMEMMEME MEMMEMMEMEMMEMMEMMEMEMIONMEMMEMMEMENNIETEMMEMMEMMIMMIWOMMIIMMEMMEMEMMEMMMMMEMMEMMEMEMMEMMIIMMIMIMMIMMIMMEMMEMMIUMMME ummommommumommummommommommisimmowmommommommummummummommommomminommummommommommommummummommommummomme mommommummummimmimmommummommommumommommommommommommummumommommumminsimmummummmmummommummummommm immommoommummumommimmommummumgmemmommummummommmummummmmummimummommummummmmummimmommumummimum MEMMEMEMERMICIMMEMEMEMMINIMMEMMEMEMIUMWAIMEMEMMEMMEMEMMEMINIMMINIMMEMEMEMMMEMMIMEMEMEMEMEMMEMMEMEMMIIMMEMEMEMEMMEMMMEMEMEMM MEMMEMMEMENNUMMEMEMMXIMMEMMEMEMINIMIUMMEMMEMMEMINIMMEMEMMEMMEMMEMMEMEMMINMEMMEMMEMMEMMEMMINIMINIMOMMEMMEMEMMEMMEMEMMEMMEM MEMMIIMMEMEMEMMEMMEMMEMMEMEMENINUMMEAMMIEMMIMMEMEMMOMMEMMEMEMMEMEMMEMEMMEMMEMMEMEMEMEMEMEMMEMOMMIUMMIMMEMMEMEMEMMOMM MUMMEMMEMEMIIMMEMOMMEMMENEMMEMMEMMEMEWAIMMEMPRIZZLEAqtneNiMMEMMOMMINNEMMEMMEMMEMIMMEMEMIMMOMMIMMEMEMEMMEMMENNEMMEMEMEM MEMEMMIUMMEMMEMMEMMEMMEMEMMEMSEMINIMMUMMEMMESMEMMOMMIUMMOMMEMMEMMEMUMMIMMEMMEMEMMEMMEMMMENIMMEMOMMEMMEMEMMIUMMEMMIMM MMEMMEMMEMMEMMIIMMMEMMEMEMMIMMIMMEMEMMIMMENUMEMMEMEMMEMMIMMEMEMETMIVAIMMENMEMMEMEMEMMEMMEMMEMMIMMEMEMEMEMEMMEMEMMEMMEM MMUMMEMMUMEWMMIIMMERMIMEMMEMMINIMEMMIONEWOMMINMEMENOMMENOMEMMILMEMPUMMMEMINIMMEMMMEMMEMMEMMEMEMEMINIMEMMEMMEMEMMUMMINIMMM milmmummommmumni ummumpummulimmvvilmom ,ommimmilmom.vmmimmunimmommomminmummummommommommummummum inimmommommommoimmomminummummommimmmismommimmummommmimmompommommummumuummommmommEmmummumminmomm mummommummummimmommommommommumminmrnmemmommommummommommommummommommommommommumummommommommommmum mimmummommimmummommommimmommommommummmmommommommommommummommommommommommommumummilimmonommumummomm mummommommommommummummilimommummommummommilimmoommumminummimmommommimmmornmEmmommommoommumm mmommommommommummommmommmommommemmommEn!smommmommummommommommunimmummummommEmmommommommummommmmummommim MMINIMMEMMEMEMEMMIUMMEMMEMMEMMIOMMILIPOMMIIMMIMINWIMEMEMEMINIMMEMEMMEMEMMINIMMEMEMMIUMMEMMEMMEMEMMEMMIMMEMEMEMEMMMIOMMINNIM IMMEMEMMEMMEMMMOMMENIMMINIMMINIMMENNWIWMPIGNMPAMMIMMEMMIUMMIIMMEMMIUMMIIMMEMMEMEMEMMIMMEMEMMEMEMMEMMEMMEMMIUMMIMMIMM mommumummimminummommmummummommmommaPummummommommommummommummummommommommommmummmommummmummommunum mummummommiummummummummummommommienanommilmmuirommosummommummommommmummummummummommommommommmmumm
IMMEMEMEMENIMMEMMUMEMMEMMEMEMEMINIMEMMEMEETWVAMEMMOWlinimEMMAMMEAMMINENEMEMMEMMEMMEMMEMMEMEMEMMMEMMEMMEMMEMOMMEMMEMEMEM smummummommommommummommommummommeitimmiviummmummmommommimmimmimommumommummommommmummommomm MIIIMMEMMEMEMMIMMNINUNOWIMUPWNEMEMMENEMMEMMEMMUCEMMEMMEMMEMEMEMIUMMOMOOMMEMMEMEMMEMMEMMEMMEMEMENNEMMISMINMEMMMEMEMEMEMMEMEM IIMMEMMEMMMEMEMMIPAWLW&INaNTAVIIMMEMEMMEMEMEMMUOMMEMMEMEMMEMMEMMEMMEIMMEMOIMMIMMEMEMEMMEMMEMEMMEMEMMEMMEMMEMEMMEMMEMEMMEMMM IMMEMINIMMEMEMMIMMUMMINIMOMSWINIMMMR4PMMISPENIMMEMMEMMEMMEMMEMEMMEMEMEWOMMEMEMEMMEMEMMEMEMINIMMOMMEMMINEMMEMEMEMEMEMMEM mommoommommommus:moo:mmummims-Awneklaimmummompomminimmommumminummammommommommommommommummmommommummommum Immo mommummommommommummommommummommummommumminummummunnumminimmimmommommommommummommm =WM MMEMMIOMMINIMMOMMEMMIMMEMMEMMEMMISMOMMIIMMEMEMMEMEMMEMEMEMMEMEMEMMEMEMEMEMMIMMOMMIMMEMMEMMEMOMMMEMMEM
=MEM •••••11•1•MMEMMEM ENNE
FIGURE 10 LONGITUDINAL CROSS SECTIONS OF NEW YORK AND DELAWARE CHANNELS Robert It Nathan Associates, Inc.

35 ./ 26.6 30.7 500 - b/ 7.1-37.82/
35
16.2-46.9V d/
140 1,000 2.1 2.4 e/
35 550 1 14.1 22.4-36.5 - 4 d/
45 2,000 35 800
8.9 10.2 0.0-10.2
6.2 7.1 0.0-7.1
fe1 VoV lei
40f/ 800V,
140 400-/ 35 300
1,000 1,000
800 800 750
42 42 42 42 37
45 1,000
45 1,500
45 800
45 1,500
45 800
40 750 ,
140 450T/ n/
35 250-
11.4 2.0 4.8 3.7 2.6 4.2 4.4 3.1
2.1-13.5 18.5-20.5 20.5-25.3 20.5-24.2k/ 24.2-26.8 - 26.8-31.0 31.0-35.4 35.4-38.5
9.9 1.7 4.2 3.2 2.3 3.6 3.8 2.7
83.7 20.4 4.8
96.5 23.5 5.5
7.5-104.0 104.0-127.5 127.5-133.0
0.9 9.0 4.6
17.3 9.5
1.0 0.0-1.0
10.4 13.5-23.9
5. 46.0-51.3 1/ 19.9-3h/ 155-175 -
11.0 14.5-25.5
Table 6. Project Dimensions of Major Channels on the North Atlantic Coast
Location / Depth Width Length
Name of channel Naut. miles
Stat. miles
Stat. miles Feet
New York, N.Y. and N.J. Ambrose Channel Sandy Hook and Bayside Channel New York and New Jersey Channels
East River Channel
Delaware Bay and River, Del., N.J. and Pa. Philadelphia to sea Philadelphia to Trenton
Baltimore, Md. Cape Henry Channel York Spit Channel Rappahannock Channel Baltimore Harbor Channels . York River Entrance Channell/
Hampton Roads, Va. Thimble Shoal Channel Entrance Reach Newport News Channel Norfolk Harbor Reach Craney Island Reach Port Norfolk Reach/ Southern Branch Channel
continued--

34.
Table 6. Project Dimensions of Major Channels on the North Atlantic Coast
continued--
a! 37 feet in rock. EY 6
•
00 feet through Lower New York and Raritan Bay; 800 feet through Kill Van Kull. c/ Approach through Sandy Hook and Bayside Channel. d/ Approach through Ambrose Channel. e"/ Locally wider. Y/ 37 feet deep on east side between mile 96.0 (Eagle Point, N.J.) and mile 104.0 (Allegheny Ave., Phil.). 1/ 1,000 feet wide from deep water in Delaware Bay to Ship John Light; 1,000 to 1,200 feet wide at various bends; 500 feet wide through Horseshoe Bend (approxi-mately mile 95) and 400 feet wide through Philadelphia Harbor. h/ Not including the three branch channels in Curtis Bay, Riddle Branch and Northwest Channel. i/ Approximate location near Locust Point.
jj T
•
o Yorktown, Virginia. k/ At Lamberts Point. I/ I
•
ncluding Town Point Reach. E/ 375 feet between Belt Line and N&W Railroad Bridges, thence 250 to 500 feet. n/ Locally wider, up to 500 feet.

36.
Long Island. Nearly five whole counties in New Jersey are included within the area known as the port of New York. New York Harbor is divided into the Lower Bay (Outer Harbor) and Upper Bay (Inner Harbor) by the Nar-rows.
Outer Harbor
Lower Bay, Jamaica Bay, Raritan Bay and their entrance channels form the Outer Harbor. The Lower Bay is triangular in shape with the apex extending inland for 12 miles; for a length of about 6 miles the bay is open to the sea. Jamaica Bay is an indentation in the south shore of Long Island. Raritan Bay lies west of Lower Bay between the southern end of Staten Island and the New Jersey shore. Channels in the Outer Harbor are as follows:
Ambrose Channel, providing the principal entrance to New York Harbor, extends from the sea to deep water south of the Narrows. Main Ship, Sandy Hook, and Bay-side Channels are located south of Ambrose Channel.
New York and New Jersey Channels extend from deep water northwest of Sandy Hook, through the Lower Bay and Raritan Bay to Perth Amboy, and thence through Arthur Kill, Lower Newark Bay, and Kill Van Kull to deep water in the Upper Bay.
All channels in the Lower Bay are marked with lights, ranges, and buoys; the buoys include the bell, whistling, and lighted types.
Inner Harbor
The Inner Harbor consists of the Upper Bay, Low-er Hudson River, East River, Long Island Sound, and tri-butary waterways. To the east, the tributary waterways are Gowanus Creek, Newtown Creek, Harlem River, Bronx River, Westchester Creek, Flushing Bay and Creek, and East Chester Creek; to the west, the Kill Van Kull, Arthur Kill, Newark Bay, Passaic River, and Hackensack River. The Inner Harbor is connected with the Outer Harbor by the Narrows, a natural channel having a width

35.
The materials dredged in maintaining the Ambrose Channel, the New York and New Jersey Channels, the Sandy Hook Channel, and the southern portion of the East River Channel are disposed of in the Atlantic Ocean. The dis-posal area for the northern portion of the East River Channel is located in Long Island Sound. In general the disposal areas for the Delaware River are 5 to 10 miles from the dredging site, and are located either on shore or on islands between the river banks. The disposal areas for the channel through Delaware Bay and for all channels in the Chesapeake Bay run parallel to the chan-nels. The disposal area for the channels in Hampton Roads is at Craney Island.
New York Harbor
The Port of New York Authority District, comprised of 17 counties, embraces parts of New Jersey within an approximate 25-mile radius of the Statue of Liberty, a total of 1,500 square miles. It has a frontage of 755 miles measured along the shorelines of its navigable waterways, of which 460 miles are in New York and 295 miles are in New Jersey.
Large areas in the hinterland are reached by the New York State Barge Canal System, an inland waterway communication between Lakes Erie and Ontario on the west and the Hudson River and Lake Champlain on the east. Points are accessible on the Great Lakes and the St. Lawrence Seaway by way of the Hudson River and the Erie and Oswego Canals, and on the St. Lawrence River via the Hudson River and the Champlain Canal and Lake, the Riche-lieu River, and the Chambly Canal. Included in the port are areas contiguous to New York City extending westward beyond Newark, New Jersey, northward including the Pas-saic and Hackensack Rivers, and southward including the Raritan River up to New Brunswick, New Jersey, and South River to Madison, New Jersey. The southern boundary en-compasses Sandy Hook and includes the Atlantic Highlands in New Jersey, westward along the southern parts of Sandy Hook Bay and Raritan Bay. To the north, the port extends as far as Tarrytown, New York, on the Hudson River, and includes Port Chester, New York, on Long Is-land Sound; and to the east it includes Jamaica Bay on

37.
of about 3,500 feet and depths varying from 45 to 100 feet.
Upper Bay extends southerly from the junction of Hudson and East Rivers opposite the Battery, to the Nar-rows, a distance of about 5 1/2 miles. Anchorage Chan-nel, a continuation of Ambrose Channel, extends north-ward from the Narrows to the mouth of the Hudson River at the Battery. Bay Ridge and Red Hook Channels lie along the east shore of the Upper Bay and together with Buttermilk Channel, which lies between Governors Island and the Brooklyn shore, form an easterly channel along the Brooklyn waterfront from the Narrows to deep water in the East River.
Hudson River Channel, which is contiguous to the Weehawken-Edgewater Channel, extends from deep water in the Upper Bay to about 1 mile south of the George Wash-ington Bridge. The largest vessels entering the port of New York berth in the Hudson River; the channels are used also by vessels proceeding north to Albany, New York.
The East River is a tidal strait about 16 miles long and from 600 to 4,000 feet wide. It connects deep water at Governors Island in the Upper Bay with Long Island Sound at Throgs Neck, separating Long Island from the mainland.
Arthur Kill is a narrow body of water separating Staten Island, New York, from New Jersey. To the north it connects with the Kill Van Kull; to the south, with Raritan Bay. On the shores of the Arthur Kill are the cities of Perth Amboy, Carteret and Elizabeth, New Jersey, and Staten Island, New York. Kill Van Kull lies between Staten Island and Bayonne, New Jersey, and is the connecting link between the main harbor channel and Arthur Kill and Newark Bay.
Newark Bay is a tidal estuary about 1 mile wide and 6 miles long, situated west of Upper New York Bay. On the east side of the bay are Bayonne and Jersey City; on the west, Elizabeth and Newark. To the south it
38.
connects with the Kill Van Kull and Arthur Kill. The Hackensack and Passaic Rivers both flow south, joining Newark Bay at its northern extremity.
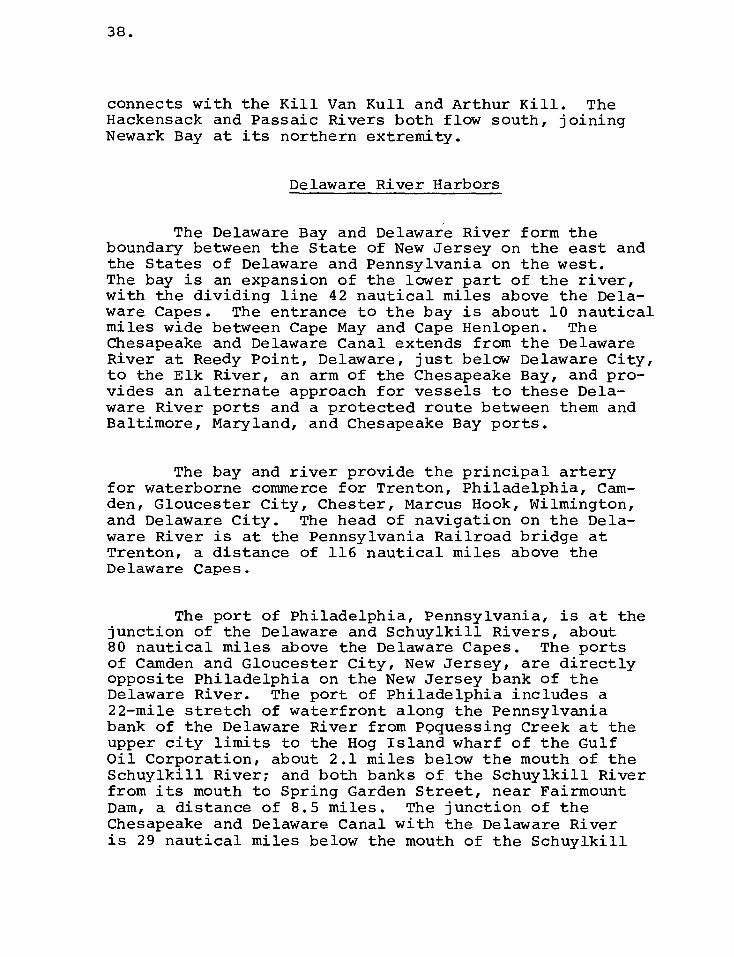
Delaware River Harbors
The Delaware Bay and Delaware River form the boundary between the State of New Jersey on the east and the States of Delaware and Pennsylvania on the west. The bay is an expansion of the lower part of the river, with the dividing line 42 nautical miles above the Dela-ware Capes. The entrance to the bay is about 10 nautical miles wide between Cape May and Cape Henlopen. The Chesapeake and Delaware Canal extends from the Delaware River at Reedy Point, Delaware, just below Delaware City, to the Elk River, an arm of the Chesapeake Bay, and pro-vides an alternate approach for vessels to these Dela-ware River ports and a protected route between them and Baltimore, Maryland, and Chesapeake Bay ports.
The bay and river provide the principal artery for waterborne commerce for Trenton, Philadelphia, Cam-den, Gloucester City, Chester, Marcus Hook, Wilmington, and Delaware City. The head of navigation on the Dela-ware River is at the Pennsylvania Railroad bridge at Trenton, a distance of 116 nautical miles above the Delaware Capes.
The port of Philadelphia, Pennsylvania, is at the junction of the Delaware and Schuylkill Rivers, about 80 nautical miles above the Delaware Capes. The ports of Camden and Gloucester City, New Jersey, are directly opposite Philadelphia on the New Jersey bank of the Delaware River. The port of Philadelphia includes a 22-mile stretch of waterfront along the Pennsylvania bank of the Delaware River from Poquessing Creek at the upper city limits to the Hog Island wharf of the Gulf Oil Corporation, about 2.1 miles below the mouth of the Schuylkill River; and both banks of the Schuylkill River from its mouth to Spring Garden Street, near Fairmount Dam, a distance of 8.5 miles. The junction of the Chesapeake and Delaware Canal with the Delaware River is 29 nautical miles below the mouth of the Schuylkill

39.
River. The dredged channel through the bay and river commences about 6.5 nautical miles inland from the capes.
The port of Wilmington is on the Christina River at the junction with the Delaware River, about 62 nauti-cal miles above the Delaware Capes.
Hampton Roads Harbor
Hampton Roads Harbor is located at the confluence of three tidal rivers -- the James, the Nansemond, and the Elizabeth. It has an area of 25 square miles and forms the approach to the ports of Newport News, Norfolk, Portsmouth, and Chesapeake.
Ships entering Hampton Roads from the sea follow a course between the capes and across the lower end of Chesapeake Bay via Thimble Shoal Channel, crossing the South Tunnel at the entrance of the Chesapeake Bay into the deep waters of Hampton Roads.
Two deepwater channels extend through Hampton Roads. One channel, 18 miles long, extends southward into Norfolk, Portsmouth, and Chesapeake via the Eliza-beth River and its southern branch. The other channel, 4.8 miles long, extends westward to Newport News and thence up the James River.
Baltimore Harbor
Baltimore Harbor is located on the lower Patapsco River near its junction with the west side of Upper Chesapeake Bay. It is 150 nautical miles north of the Chesapeake Capes, which form the entrance from the At-lantic Ocean to the bay.
The bay varies in width from 5 statute miles at Annapolis to 10 and 20 miles at the confluence with the Potomac and York Rivers, respectively. Its maximum depth varies from 35 feet at the confluence with the

40.
York River to 70 to 120 feet between statute miles 58 and 151. Ships entering Baltimore Harbor through the bay follow a course between the capes via Cape Henry Channel and continue, crossing the North Tunnel at the entrance of the Chesapeake Bay, via York Spit and Rap-pahannock Shoal Channels to the deeper part of the bay.
Vessels also have access to the port from the ocean by way of the Chesapeake and Delaware Canal and the Delaware Bay, a distance of 113 nautical miles. The canal extends from the Delaware River at Reedy Point, Delaware, to Back River, Maryland, thence down Back River to Elk River and the Chesapeake Bay. The Patapsco River enters Chesapeake Bay between North Point and Bod-kin Point, about 9.5 miles below Fort McHenry at Balti-more. The river is about 4.0 miles wide at its mouth, between North and Bodkin Points.
The port area of Baltimore includes the naviga-tion part of the Patapsco River below Hanover Street; the Northwest and Middle Branches; Curtis Bay and its tributary, Curtis Creek; and parts of Colgate, Bear, and Jones Creeks. The Northwest Branch, known locally as the Inner Basin, extends about 3.0 miles in a northwest-erly direction from Fort McHenry to its head at Calvert Street and varies in width from 1,200 to 3,000 feet. Middle Branch, also known locally as Spring Garden, ex-tends about 1.5 miles in a northwesterly direction from Ferry Bar past Hanover Street to the foot of Eutaw Street, and varies in width from 1,000 to 4,000 feet. Curtis Bay is an estuary, about 2.0 miles long and 0.7 mile wide, that is situated on the southwest side of the Patapsco River, 6.0 miles above the river's mouth.
Important waterfront bulk handling and/or general cargo facilities are located along the Patapsco River at Sparrows and Hawkins Points, Dundalk, Lower Canton, and Port Covington; on the west side of Curtis Bay; and on the Northwest Branch at Lazaretto Point, Upper Canton, and Locust Point.

IV. PHYSICAL OBSTACLES TO CHANNEL ENLARGE- MENT
Bridges and Tunnels
All relevant bridges and tunnels crossing the major channels have been listed in table 7.
Bedrock
Bedrock is encountered only in the New York and New Jersey channels. The elevation of the bedrock var-ies by location, but in the area between mile 24.0 and mile 35.5, rock occurs at the bottom of the channel.
Tides
Table 8 presents the mean tidal range at various major ports.
41.
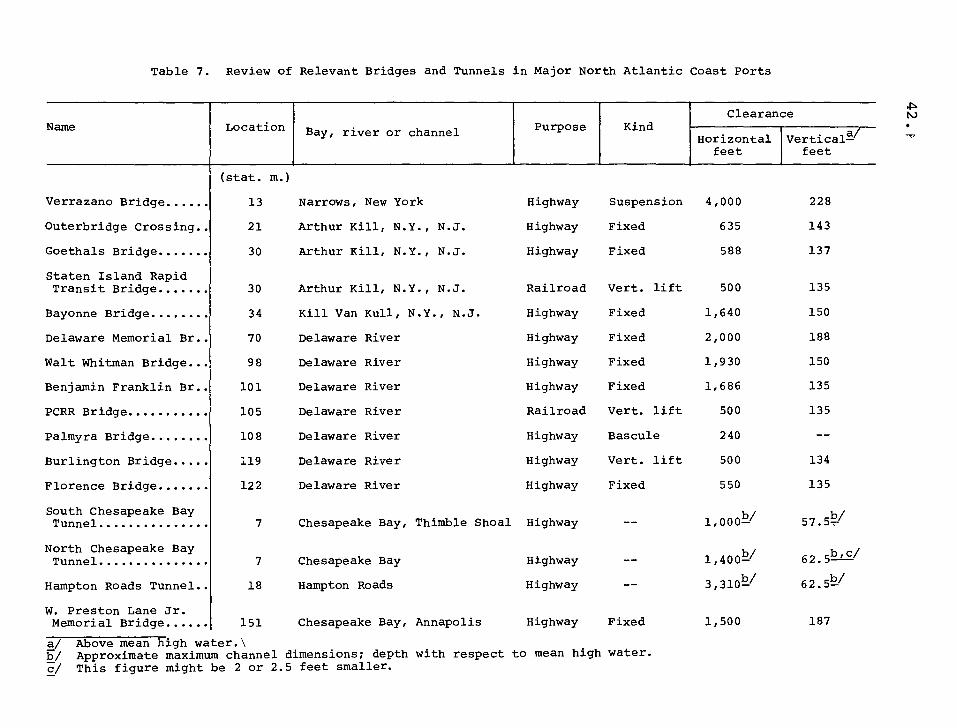
Table 7. Review of Relevant Bridges and Tunnels in Major North Atlantic Coast Ports
Clearan ce Name Kind Location Bay, river or channel Purpose
Horizontal feet
Vertical2,/ feet
Verrazano Bridge
Outerbridge Crossing
Goethals Bridge
(stat. m.)
13 Narrows, New York
21 Arthur Kill, N.Y., N.J.
30 Arthur Kill, N.Y., N.J.
Highway Suspension 4,000 228
Highway Fixed 635 143
Highway Fixed 588 137
Staten Island Rapid Transit Bridge
Bayonne Bridge
Delaware Memorial Br
Walt Whitman Bridge
Benjamin Franklin Br
PCRR Bridge
Palmyra Bridge
Burlington Bridge
Florence Bridge
South Chesapeake Bay Tunnel
North Chesapeake Bay Tunnel
Hampton Roads Tunnel..
W. Preston Lane Jr. Memorial Bridge
30 Arthur Kill, N.Y., N.J. Railroad Vert. lift 500 135
34 Kill Van Kull, N.Y., N.J. Highway Fixed 1,640 150
70 Delaware River Highway Fixed 2,000 188
98 Delaware River Highway Fixed 1,930 150
101 Delaware River Highway Fixed 1,686 135
105 Delaware River Railroad Vert. lift 500 135
108 Delaware River Highway Bascule 240 --
119 Delaware River Highway Vert. lift 500 134
122 Delaware River Highway Fixed 550 135
b/ 7 Chesapeake Bay, Thimble Shoal Highway -- 1,000— 57.5=
b/
b b
7 Chesapeake Bay Highway -- 1,400 / — 62.5 c/ —L-
b
18 Hampton Roads Highway -- 3,310 / — 62.5!'
151 Chesapeake Bay, Annapolis Highway Fixed 1,500 187
a/ Above mean high water.\ b/ Approximate maximum channel dimensions; depth with respect to mean high water. C! This figure might be 2 or 2.5 feet smaller. _

Mean range ' (feet) Location
New York
Sandy Hook
Arthur Kill and Kill Van Kull
Delaware River
Philadelphia to Liston Point, Delaware
Lewes, Delaware
Hampton Roads
Thimble Shoal
Sewells Point, Norfolk Harbor
Baltimore
Cape Henry
Fort McHenry
5.5-6.0
4.1
2.5
2.5
2.8
1.2
4.6
4.5
Table 8. Tidal Range Under Ordinary Conditions
V- Difference between mean high water and mean low water.
43.

APPENDIX A. REVIEW OF STUDIES ON CHANNEL DEEPENING AND PORT EXPANSION
1. North Atlantic Regional Water Resources Study, prepared by the North Atlantic Regional Water Resources Study Group, North Atlantic Division, Corps of Engineers, U.S. Army, for the National Atlantic Regional Water Re-sources Study Coordinating Committee, February 1972. This study contains 22 volumes, of which the following are of particular relevance to the deepwater port study: Appendix B -- Economic Base; Appendix C -- Climate, Meteorology and Hydrology; Appendix D -- Geology and Ground Water; Appendix G -- Land Use and Management; Appendix K -- Navigation; Appendix L -- Water Quality and Pollution; Appendix M -- Recreation; Appendix 0 -- Fish and Wildlife; Appendix Q -- Sediment and Erosion; Appendix S -- Legal and Institutional Environment; Ap-pendix T -- General Program and Alternatives; and Appen-dix U -- Coastal and Estuarine Areas.
2. Regional Harbor Analyses, memoranda to Divi-sion Engineer, North Atlantic Division. The district offices of New York, Philadelphia, Baltimore, and Nor-folk were requested to calculate the cost of deepening their main channels to 60 feet. All costs presented should be considered very rough, indicating the order of magnitude only. The following data were presented:
a. New York. The district office prepared esti-mates on cost and time for dredging the Ambrose and the New York and New Jersey Channels to a depth of 60 feet. These data are presented in appendix tables 1 through 4. It should be noted that the cost of dredging a portion of the New York and New Jersey Channels (between miles 24.0 and 35.5) beyond 45 feet was so high that no cost estimates were prepared beyond that depth.
45.

Anchorage Chann 7 a el—
0.3
0.7
0.9
1.2
1.5
1.8
2.2
Appendix table 1. Dredging Cost and Time of Ambrose and Anchorage Channels
(In millions of dollars and years)
Ambrose Channel
Dredging interval (feet) First
cost
Annual maint. cost
Time to
deepen First cost
Annual maint. cost
Time to
deepen
45-47 8 0.43 2.2 1 0.14
45-49 12 0.43 3.1 2 0.14
45-51 15 0.43 3.9 3 0.14
45-53 18 0.44 4.8 4 0.14
45-55 22 0.44 5.7 6 0.14
45-57 25 0.44 6.6 7 0.14
45-60 30 0.44 7.9 8 0.15
a/ Between Upper New York Bay and Ambrose Channel.
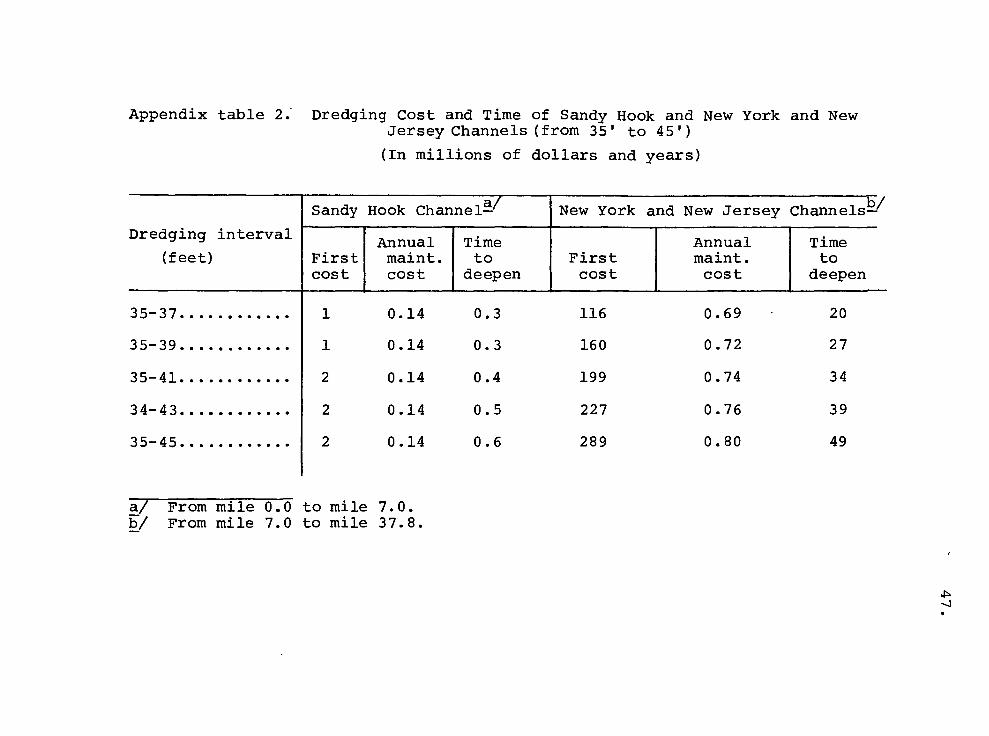
Appendix table 2; Dredging Cost and Time of Sandy Hook and New York and New Jersey Channels (from 35' to 45')
(In millions of dollars and years)
Sandy Hook Channel ' New York and New Jersey Channels— b/
Dredging interval
(feet)
35-37
35-39
35-41
34-43
35-45
Time to
deepen
1 0.14 0.3
1 0.14 0.3
2 0.14 0.4
2 0.14 0.5
2 0.14 0.6
First cost
116 0.69
160 0.72
199 0.74
227 0.76
289 0.80
Time to
deepen
20
27
34
39
49
First cost
Annual maint. cost
Annual maint. cost
a/ From mile 0.0 to mile 7.0. b/ From mile 7.0 to mile 37.8.

21 101
108
120
137
148
164
180
0.7
23
3
3
3
4
4
4
5
0.8
25 0.9
28 1.0
30 1. 1
33 1.2
36 1.3
0.61
0.62
0.62
0.64
0.65
0.66
0.66
0.14
0.14
0.14
0.14
0.14
0.14
0.14
Appendix table 3. Dredging Cost and Time of Sandy Hook and New York and New Jersey Channels (from 35' to 60')
(In millions of dollars and years)
Channels— b/ Dredging interval
(feet)
Sandy Hook Channel "
Time to
deepen
New York and New Jersey
Annual maint. cost
Time to
deepen First cost
Annual maint. cost
First cost
35-47
35-49
35-51
35-53
35-55
35-57
35-60
a/ From mile 0.0 to mile 7.0. b/ From mile 7.0 to mile 24.0, and from mile 35.5 to mile 37.8.

Appendix table 4. Dredging Cost and Time of New York and New Jersey Channels
(In millions of dollars and years)
Mile 7.0-mile 24.0 Mile 24.0-mile 35.5 Mile 35.5-mi Dredging interval
(feet) First cost
Annual maint. cost
Time to
deepen
First cost
Annual maint. cost
Time to
deepen
First cost I
Annual maint. cost
e 37.8
Time to
deepen
71 0.11 10
106 0.13 15
135 0.15 20
147 0.16 22
198 0.19 30
35-37
35-39
35-41
35-43
35-45
35-47
35-49
35-51
35-53
35-55
35-57
35-60
31 0.57 8
34 0.57 9
37 0.57 10
40 0.58 10
43 0.58 11
46 0.58 12
49 0.58 13
52 0.58 14
55 0.59 14
58 0.59 15
61 0.59 16
66 0.59 17
13 0.01 2
19 0.01 3
26 0.02 4
40 0.03 7
48 0.03 8
55 0.03 9
59 0.04 10
68 0.04 11
82 0.05 14
90 0.06 15
103 0.07 17
114 0.07 19

50.
The number of years required to deepen the chan-nels to the projected depths is based on dredging with the Essayons. All costs are based on August 1966 levels.
b. Delaware Bay and River to Philadelphia. No separate study of costs to dredge to 60 feet was under-taken, since dredging to 45 feet was estimated at $386 million and dredging to 50 feet at $713 million.
c. Baltimore. The District Office prepared estimates of first cost and time for deepening of all channels leading to the port of Baltimore by 2-foot increments. It should be noted that for depths in ex-cess of 49 feet, dredging in the Atlantic would be re-quired. Appendix table 5 presents the estimated values of first cost and time. All costs allow for an over-depth of 2 feet. All channel widths would remain the same. It should be noted that for depths greater than 49 feet in the Curtis Bay Channel, relocation of the Harbor Tunnel would be required. The cost of the tun-nel was $29 million when built in 1958.
d. Hampton Roads. The south tunnel of the Chesapeake Bay Bridge and Tunnel system will not allow dredging deeper than about 57 feet. Deepening the Thimble Shoal Channel to 55 feet was estimated at $80 to $100 million.
3. New York and New Jersey Channels: Information on Considered Plans of Improvement, Office of the Dis-trict Engineer, U.S. Army Engineer District, New York, Corps of Engineers, New York, New York, February 17, 1972. The plans consider a one-way deep-draft channel and an offshore common petroleum unloading terminal connected with the existing terminals by pipelines.
The one-way deep-draft channel has varying chan-nel dimensions for the various sections of the channel. The dimensions depend on the physical characteristics of the sections. The main restrictions of these di-mensions are caused by the presence of rock, which at certain locations in the Arthur Kill is found at a depth of 30 feet or less, and by the presence of the river banks. The estimated first costs are presented in appendix table 6.

Appendix table 5. Dredging Cost and Time of Baltimore Channels
(In millions of dollars and years)
Baltimore channels 42-45 42-47
Dredging interval (feet)
42-49 42-51142-53142-55142-57 42-60
Atlantic Ocean First cost Time Cape Henry First cost Time
York Spit First cost Time -
Rappahannock Shoal First cost Time
Main Ship First cost Time Curtis Bay First cost Time Middle Branch First cost Time
Total -fii-gt cost Time
0.1 1.6 3.0 4.3 6.4
0.1 0.4 0.8 1.0 1.5
0.8 1.3 1.8 2.7 3.9 5.1 6.8 9.2
0.2 0.3 0.4 0.7 0.9 1.2 1.6 2.2
14.4 23.2 32.2 39.0 51.2 60.1 70.8 85.6 3.4 5.4 7.6 9.2 12.1 14.3 16.7 20.0
2.4 3.8 5.3 6.8 8.3 10.0 12.2 15.3
0.5 0.8 1.1 1.4 1.7 2.0 2.5 3.2
18.5 26.0 33.4 41.4 50.0 59.0 68.4 82.6 5.2 7.3 9.3 11.5 13.9 16.4 19.1 23.0
1.0 1.5 1.9 2.4 2.9 3.3 3.8 4.4
0.3 0.4 0.5 0.7 0.8 0.9 1.1 1.3
1.7 2.5 3.1 3.9 4.7 5.5 6.2 7.4
0.5 0.7 0.8 1.1 1.3 1.5 1.8 2.1
38.8 58.3 77.7 96.3 122.6 146.0 172.5 210.9 10.1 15.1 19.7 24.7 31.1 37.1 43.8 53.3

Appendix Table 6. First Costs of One-Way Deep- Draft Channel
52.
First costs (mil. dol.)
Channel depth (feet)
38
40
42
45
For the offshore terminal, sites at or near Seguine Point, Hoffman Island, Gravesend Bay, Staple-ton, Red Hook and Constable Hook have been considered. Four pipelines would be required to serve all New York/ New Jersey terminals, one line for transporting crude oil, one for residual fuel, one for kerosene and high flash fuel, and the other for diesel and distillate fuel oils. Consideration was given to a dead-end system, as well as to a looped system, for delivery. The pipeline plans include a terminal for surge storage of products; however, no allowance was made for crude oil storage because direct pump-out via pipeline to the respective refineries is contemplated. A total of eight berths would be eventually required. The water depth at the terminal was set at 45 feet. The total first cost of this alternative was estimated at $180 million.
4. Feasibility Report: Delaware River, Phila-delphia to the Sea, Offshore Terminal, Department of the Army, Philadelphia District, Corps of Engineers, Phila-delphia, Pennsylvania, November 1969. This report con-siders nine plans of improvement. It studies the vari-ation of depth of the river channel from 40 feet (present depth) to 45 and 50 feet. It also considers an offshore terminal off Big Stone Beach in either 62 or 72 feet of water.
The estimated first costs of the various plans of improvements are as follow:
11
16
21
28
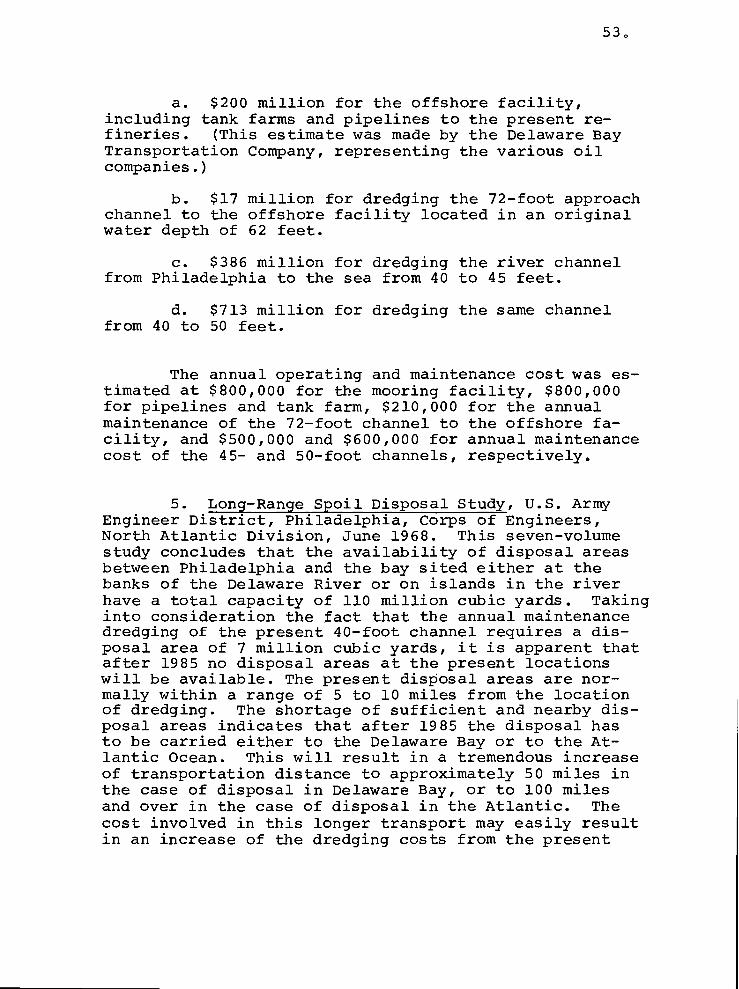
53.
a. $200 million for the offshore facility, including tank farms and pipelines to the present re-fineries. (This estimate was made by the Delaware Bay Transportation Company, representing the various oil companies.)
b. $17 million for dredging the 72-foot approach channel to the offshore facility located in an original water depth of 62 feet.
c. $386 million for dredging the river channel from Philadelphia to the sea from 40 to 45 feet.
d. $713 million for dredging the same channel from 40 to 50 feet.
The annual operating and maintenance cost was es-timated at $800,000 for the mooring facility, $800,000 for pipelines and tank farm, $210,000 for the annual maintenance of the 72-foot channel to the offshore fa-cility, and $500,000 and $600,000 for annual maintenance cost of the 45- and 50-foot channels, respectively.
5. Long-Range Spoil Disposal Study, U.S. Army Engineer District, Philadelphia, Corps of Engineers, North Atlantic Division, June 1968. This seven-volume study concludes that the availability of disposal areas between Philadelphia and the bay sited either at the banks of the Delaware River or on islands in the river have a total capacity of 110 million cubic yards. Taking into consideration the fact that the annual maintenance dredging of the present 40-foot channel requires a dis-posal area of 7 million cubic yards, it is apparent that after 1985 no disposal areas at the present locations will be available. The present disposal areas are nor-mally within a range of 5 to 10 miles from the location of dredging. The shortage of sufficient and nearby dis-posal areas indicates that after 1985 the disposal has to be carried either to the Delaware Bay or to the At-lantic Ocean. This will result in a tremendous increase of transportation distance to approximately 50 miles in the case of disposal in Delaware Bay, or to 100 miles and over in the case of disposal in the Atlantic. The cost involved in this longer transport may easily result in an increase of the dredging costs from the present

54.
$.40 per cubic yard to $1.50 in the case of disposal in the Delaware Bay or $2.50 and over in the case of dis-posal in the Atlantic. It is unnecessary to say that deeper dredging will augment the amount of annual main-tenance dredging and will accelerate the consumption of available nearby disposal areas.
6. Review Report: Baltimore Harbor and Channels, Department of the Army, Baltimore District Corps of En-gineers, Baltimore, Maryland, June 1969. This report considers dredging of the present 42-foot channels by 1-foot increments to a maximum of 50 feet. The estimated cost of deepening the Virginia channels (Rappahannock Shoal, York Spit and Cape Henry Channels) and Maryland channels (Main Shipping Channel, Curtis Bay Channel, and Northwest Branch and East Channel) is presented in ap-pendix table 7. Deepening to 50 feet was recommended.

Appendix table 7. Estimated First Cost of Virginia and Maryland Channels to Baltimore Harbor
(In millions of dollars)
Channe 1 depth (feet) Channel
Federal cost
Virginia Channels
York Spit Rappahannock Shoal Cape Henry
Maryland Channels
Main Shipping Channel 'Curtis Bay Channel Northwest Branch, East Chan-nel
Total Federal cost
Total Non-Federal cost
Total project cost
-7-1----48 —r4q
13 17 21 26 31 36 41 47
10 13 16 20 29 28 33 37
2 2 3 4 4 5 5 6
1 2 2 2 3 3 3 4
17 22 26 31 35 40 45 49_
15 20 23 28 31 36 39 43
2 2 2 2 3 3 4 4
0 0 1 1 1 1 2 2
30 39 47 57 66 76 86 96
1 2 3 3 3 3 3 4
31 41 50 60 69 79 90 100
43 44 45 46 50

ANNEX B -2 . RECONNAISSANCE SURVEY OF THE SOUTH ATLANTIC COAST

CONTENTS
I. DESCRIPTION OF COAST AND PORT LOCATIONS.. 59
II. FOREIGN AND COASTAL MOVEMENTS, BY PORT, OF THE SIX STUDY COMMODITIES 67
III. MAJOR HARBORS AND CHANNELS 73
IV. PHYSICAL OBSTACLES TO CHANNEL ENLARGEMENT 79
Bridges and Tunnels 79 Tides 79 Currents 82
APPENDIX A 83
58.

I. DESCRIPTION OF COAST AND PORT LOCATIONS
The south Atlantic coastline from Cape Hatteras, North Carolina, to Key West, Florida, can be divided in-to the following six distinct areas (figures 1 and 2):
1. From Cape Hatteras, North Carolina, to Cape Romain, South Carolina
2. From Cape Romain, South Carolina, to Jacksonville, Florida
3. From Jacksonville, Florida, to Cape Kennedy, Florida
4. From Cape Kennedy, Florida, to Lake Worth Inlet, Florida
5. From Lake Worth Inlet, Florida, to Miami, Florida
6. From Miami, Florida, to Key West, Florida.
The coastline from Cape Hatteras to Cape Romain is 240 nautical miles long and is characterized by three arc-shaped bays of nearly equal length and depth, named Raleigh Bay, Onsolow Bay, and Long Bay. The depth con-tour lines are closest to the coastline near Cape Hat-teras (approximately 2, 9, and 19 miles respectively for the 60-, 90-, and 120-foot lines) (figure 3). Moving southward, the contour line distances from the coast increase sharply until a point just south of Wilmington, North Carolina, where they reach a maximum of apprOki-mately 22, 37, and 55 miles, respectively. From that point to Cape Romain, they decrease to within a range of approximately 12 to 47 miles.
59.

78° 75°
Cape Henry
.......... .........
L.„ .... ............ ..
..........................................
VIRGINIA
,Cape Hatteras,
........
NORTH CAROLINA Eleaumont- ' Morehead 0
Cape Lookout
........................
Wilmington
Cape Fear
SOUTH CAROLINA
Georgetow2
ape Romain
ATLANTIC OCEAN 33°
750\
FIGURE I LOCATION OF PORTS, NORTHERN PORTION OF SOUTH ATLANTIC COAST
78°
30°
100 Scale of Statute Miles
50
Savannah&
GEORGIA
Brunswic
.............
....................... Jacksonvilletiq,
FLORIDA
el° Robert R Nathan Associates, Inc

84° 78° 81 °
24° Key Wes.1 ,0'
GEORGIA
;„' ..........
................................. 4. Jacksonville
............
30°
3CP
27°
Lake Worth Inlet
West Palm Beach
Scale of Statute Miles
0 50 27°
100
Port Everglades
Miami.
FIGURE 2 LOCATION OF PORTS, SOUTHERN SOUTH ATLANTIC COAST
A.- cLot" ,
as° _ 81° ---- 24° Robert R Nathan Associates, Inc

heo,
CHART 5 mummommommommumplramommimmullignmagglimmmillIIIIIIII
MmilMMIIMMM.""mmilmm5liiiiiiiiill1111111111111[11111111 I Iliiiiiiiiiiiilling a ',..
MMEMEMEMMUMMEMNIMMAMMOMMEMENIMMMEMEMMMENZIMENIC.4111mmii0=5MEMMOM 11111MEMMERMIEMWWWWWMUE SMEMMERMEMOMMEMEMOMMEMMORMMONNIMBhmmmomM MMEMMEMMEMMUMIMMWALIME MOMMMEMMEMMEMEMMWEEMMEMV■MommEWMEMME MIIIMMEMIUMMEIMMINIMMMum MMEMMEIRMIMMEMMUMMAMEMEMENAMMEMMOIMIKMMOIM MMEMMERWIMMEMMEMMAMEMMX MEMEMEEMEMOMMIIMMEMNIMEMEMMUMMUMMEMOMMEm
- minimmummitemm is MEMMEMENIAMMOMM•MM•NEREMM••MIWIUMSOMMIII■RM
MEMPCWEMEMMEMMINR WIUMMIMMENIIMMEMMEMMEMMEMEMMOMMAMMEMINEMMWMME
limmommlimmoompi mimmmummiummummumminsplemmilmilm!mwmmilm 11 MIAMMIMMIUMMIUMW • • eigIUMMEMEIMMEMMMEMMEMEMEMEMEMMIIMMEmormwdEMM
.- essmommugomminim mil mommilmimUnimmirnimmaimilimmismammimmilmma -uummummlimmmon NEMMENE••••••••••••••••=ba••••••••• • JAsumicamm•mwom MINIMMEmEMMEMMEMEMMENEMIIMMEMEMOMMOIMMUMMOCammE
MWMWEIMMEMMUMEM III ommommilmMOMMMEMMEMmaginimommimmommlimm mmirmimmilumum mommummimummummumnimmlimmememmommaimmilm -4•••••1111111111111•111tm mummommummimmumnimmomimmimmummommwmonsimmi •almommommonAr
3Nimmum mmimmummilmnimmimsammismommimmorms me MMOMMIUMPidNII MOMMMOM min milmiummiummmimmimmemunirmimirammommimm
mommlowasOMAC_a•iREE M ME MUMMOMMOMMMEMMEMEMMEMOMMOMMOMMIMMEME IIIMEMAINIMMUMINE WM MENUMIMMIIMMUMMEMMEMMEMEMVAMMILMOMMEMMEMEMM MIRNIIIMMINIMMIIMMIMMEMMEM WIMEMMINMEMMOMMEMEMMEMMENAMEMEmmeNIMOMMEMEMM REMIEMMEnSMEMMEMOMMEMMMEMEMOMMEMEMMOMMOMMEMMEMOMMENSIMMEBM■IIMMM
MM."411."..."1111111111111111111911111111111dre llirr."- 1 ••••••i1111111111111•1100111011101
111111111111111111111.1.11.1.111111111111111111111....1111PAMMII.111 1•1111111111MIIIIMMIIIMMIMI MIN11•111MMEIMINIEMMPP-.IIIIMIIII
111111 111121111111111111.1111.11111111111111111111111/11111111111.P= '111111•1111•1111•••••••••••••••••E-4 Mil•IIIMEMIMMISONINEEMIN VOMMIIMMEMMEMMEMEMEMOMMOMEMEMCMEMMEEMmm .17.104•11111•1111MINIMIMIWII•1111••• ■•=11111112111■•=1111•••11•1111
11011111111111111111111114111DIMM111111 I 1111011111111111111111110111111111011111 1 OININIMIIIIIIII11111011111111111 IMMIIMERMWMVIDAIWAVVOUMM Eite.d_ MEMMEMINEWMOMMOMEMMEMEMEMPAOMMEMEMOMMMEMMINIMMMMEMMMEM
1111111111111111111111111111 HIM I ........•. .. .............r.... .4, ..............., MMEME ME RXMAMIMMEMMMEREMM wimmRAri m
.
NE Ompinamminimmmammimmommimmimmr„. mommummommommummo mmillimmiMmEMIWINWILU•ME•M•M• M7,Q1 MEMMEMMIIMMEMMEMMEMM
1111191;1111; IN 1:1■••••••••1 11/11111/ i A I it 1111111111111013111111111111111111111111111111111 1 mommimm.immisminimummummommummilmrimmEmmommmummwmun 1•111111MIPMWENWINIIIIIMM1111••••• 1111111MIIMMUMMIIIIMMENIMINIMIIMMIllil NIONIIIMMMINIIIMMEMIMII •1111MMINNOIVAlf ,2•110111E:41001111EMPolasi: Pr- . p
Contour line data taken from C&GS charts 1001 and 1002 I ••• 1••• • • I MIN • M •
,:s6 1 DISTANCES BETWEEN COASTLINE AND 60, 90- AND 120 FOOT CONTOUR L NES, VII ITI-I ATI A AITIC MAC,- SOUTH ATLANTIC COAST
Robert R. Nathan Associates, Inc
Source: U. S. Deepwater Port Study, Volume 111 2 Institute for Water Resources, Report 72438

63.
The coastline from Cape Romain to Jacksonville is 200 nautical miles long and is characterized by num-erous islands and sounds.
There is a tendency for the contour lines to in-crease their distance from the coastline until they reach a point just north of Jacksonville where the dis-tances are roughly the same as they are at...Cape Romain.
The coastline from Jacksonville to Cape Kennedy is 125 nautical miles long, and has/no offshore islands. From Jacksonville to\a point just/north of Cape Kennedy the 60-foot depth line\ moves continuously closer to shore, reaching a distance of'approximately 2 miles at one point, and then incre,asing to approximately 10 miles opposite Cape Kennedy. The 90-foot and 120-foot con-tour lines decrease their ditance to shore in a ragged but continuous pattern, and at Cape Kennedy are both less than 20 miles/from the cOastline.
The coastline between Cape kennedy and Lake Worth Inlet is about 100 nautical miles long. It is similar in nature to the area around Cape Kennedy in that there is a lagoon along almost its entire length. From Cape Kennedy to Lake Worth Inlet, all contour lines move sharply closer to shore, reaching a distance of 1 nau-tical mile or less. From Lake Worth Inlet to Miami, a distance of approximately 60 nautical miles, the contour lines continue to stay very close to shore. The steep decline of the ocean bottom in this area is depicted graphically in figure 4, showing the longitudinal cross section of Port Everglades Channel, located just north of Miami.
The coastline from Miami to Key West is about 130 nautical miles long and is distinguished -by its numerous islands, known as the Florida Keys. The depth contour lines move out to over 10 miles and then decline to ap-proximately 5 miles along the keys. To the east and south are the Straits of Florida, running in a west-to-east direction at Key West and in a south-to-north di-rection at Miami. To the east at a distance of approxi-mately 120 miles is Andros Island, one of the Bahama Islands, and to the south is Cuba, at a distance of

CHART 6
mum= mimmmoommomumimommummmommommffim mummamomMommmummomuMmummmomm m:I:: MEM= MIMMOMMOMEMMEMEM MEMMOIMMEMMEMEMEIMMIMMEMMEMMEMEMMMMENMEMME MMIMM EMMIMMEM MMMEMMMIMMMIMEN MMMIMMEMMEMEMMUMM MEMMEMMOMMMUMEMEMMMEM MMEMM MUM =ME MMMWOMIJAMMEEMMEMEMBUgorWN MMUMMUMMEMMEMMOMIMMEM =MEM MMMEMMEMMMEMMME =ME= MMummuMMmummuMMM MMOMMUMMEMMEMMEMMOMMIMM =UM •••••••••••••••IIIII
p NI
MM ••• MUMMEMEM•MMEMMI
MI
MMEMMEMMMOMEMMEMMEEMEEEEM MMIMMMIUMMMEMME MO MUM EMEM MEMMAMMEMIMEMMEMEMMMEEMME
om M
mmmmmmommommo mm p WMUMMECOMM MUM MMEMVOIMMMWAMWOMIUM:XIMMM EMMMEMEMMEMMEM • MMUMNEM MnEMMEMEMMEMMEMM MUMMMEMMMEMMMUMME MEM MMUMEMENEEMMEME EMMEMEMMEMMMEMMM.MIMEM mum mum mmimmumummllil
•i mm•• 11111113:1:mommummmummommuum•mmic:i
mmmm mm mmummemi mum • • mpumm mmm mm mmmimmmummumummmummumm mom • mum mm MMEMMEMMEffil • NM MfAMMEMMEMM Mil MM. MMIMMIMMUMMEMMEMME MEM •
ME MMEMEMMEMEE MN mmammmummm • • mmummummummummomm mommummumillmomm mm mmm mum mmmmummummummmmummommommmummummommml MMOMEMERME EM • M:IIMEIMMOMEMEMEMEMMIIMIMI:IIIMENIM
mm
▪
mummmgmmummum IN m mm mumpummommmmummomm mm mumm mmommummummommm m mmilailinummom mmm orumammmmommmommommmmomommmoomm ammo= moommomommmo:xmocamumommommmolommimmommmomommommmumommo
oo :I mmmom MMIIMMEM.IMEMM MMMEMEl
MEIIMMEEMMMEE MEM MMMEMEMME0MMUMMEMMI MUM= ME MEM= MR _WIMP ME MEMUMEMMEM MEM MMUMUMMMEMMEMM ME
=MENEM MEM MEM= MINIMUM NWPOMMOMMONOMMMEMEMMEMMEMEMMEMEMMMEM MMEM MUM= MEM MEM= MEMMillimliii.T.T.= -mMEMMEMMEMMEMMIMMEMEMMMMEMEMEM•=ME
MME
I mmmmumm mmummmmmmemommom geummlmmmmumumm.mmommummummummmmmm mom mum mmm MEMMEmmEMMEMMI ROM
im EMMEMEMNMMEMMINEMEIMMENUMMEMM Minn
IMM
EMU MI= MMEMMEMIMMMMEMOMMEMMMEM MEMMEMMEMOMMEMEMSMA*MOMINNMEM ME= NUM MEM =MEM= BM MEMOMMKREMPMUMMRMEMMMEMEMMUMMEM MEM ME= MEM MEM MENEM ME
I MMMEMMEMMWOMMEMMUMEMMEMMEMMOWNEMINEMEMEMMEM Ern
MENEM= =MEM= MEMEMMENW6MMEMOMMEMMEMMEMMEMMWEMEMMEMEMMUMM MEM IMEMMMEMMEMMEMMMEMM
I MMEMMEMMEMIPMEMOMMEM MMEMMIMMEMEMEMMIMMEMMEMMEMM•=ME
MUMMEMMEMMEMMMEMM MIMMEMMEMMOMMMOMMME MMEMMMEMMEMMMOMMEMMEMMIMM1 MMME MMEMMEMMMEMMEMMEMml MmEMEMMMEMPMEMMEMME MEMMIMMIMMEMMEMMOMMMEMMMEM =ME MMOMMMUMMEMMEMEMM MMUMMKUMMWROMEMMEME MMEMERIEMEMMEMEMCEMMMEMM MR MMMEMMMUMMEIMMUM M MMUMMIMMIMMMENEMM MEIMMMUMMEIMMIMEMEMEMMUMMOMMEM MMEMMIMMEMEM EMMEN MMEMMEMEMEMMEMMEEM ME =MUM•MMEMOMMEMMEMMEMMEM
II MMIMMMONOMME MENEM MMUMMEMMUMMEMMEMM ME EM:IMME MMUMMEMMENEMEMMEMMM MMEMMEMMMEMMEMMEM MMEMMEMMEMMOMMOMMEM MEMMMIE.MMEMIMMOMMEMMEMMEMUMMME MEMEMMEMssmmommEn MMEMMEMMUMMmu rums mmmommoomommomommommo mmummmommmommommlimmmomonc4mmmoomomom mmummummIMMEMMOMEMMEMMEMMIIII MUMMEMEMEMMEME MMEMMEMMEMPEEMWEEME EMMEMMIMM•IMMMEMEMMEMMEMMEM MENMEMEMMEMMEMMEMI MEMMEMMEMEMMOMMEMME MMEMMMEMM IMMEMMEMMIMMOMMMIIII MEMMEMMEMEMME VEMIMMEMEM MMEMMEMMEMOMMMUMMENEMMEmuM MMUMMMEMMEMMMIIIIIIIMMMMEMMIMMMOMEMNEM MMEMMMEEMMUMMUMMEMMMMEMMEMME 11 MEMMEMMEMMUMME NM MEMMMEMMESOMM
MMM WANWIMMEMMEMEM:::IMMEMMMEMEMMEMMIIMM
:I E EMMEMMEEM MEMMEMMMEMPIMMMMILIVEMMEMEMM mmlymplawimmgEm III mu mmommormilmo om mmommommmommommo Tom o mmoomm mom mo mm ommmommmmommommommo mo oftisommililliimmommom mom mm moommom om • MEEMMMEMMWMUMMEMEMMEM mmilimmano mmmemmommommommommo
MESUMME
i moommmommiommommmommmmommmammommmumom mm mmmmogmmoommmmoommmmommmm
I mom mo MMMEMMEMMEMMM=MMIIMMM ilIM ME • MMEMMEMMIEVAMMEMMEMMIMMEME MOMlUM IIMMNOMMIMMEME MEM
l REM ME MMEMMUMMOMMEMMEMMUMEMUM
MI B
MEMMEMEMMEMMMMEM MEMMMOMmEMMEMM =MME M EMMEME MMEMMEMEMMEMENMMUM•
IIM
MEMMEMMIEMEMMEMME MMEMMMEMTEPMMEMMEMMEMMUMEMMMEMSMEMMEMMEMMEMMMEMMEMM EMMEN= =MEM ME MMEMMEMMEMMMEMMEMME MMmENMEMMEMMEEMNIMMIMMEMME MEM=
I MUMMMMEMMEMME ME MMEMMUMMEMMENNum MEM MMEMmEMMENEMMMOIM • ME MUM =MUM ME MMEMMEMMEMMEMMEMBEN MMEMIIMMEMEMMIMMEMMEMEMEM Mil=
MUUMMERMEMMEM MEM UMMERMMMUMMOIMUMMU =EMT CMEEMEMEEMMMEMMEM MEE MR moMMEMMOMmunimM EMMMMINEEMMEMIMMumnEEMOMErnaammanEMMEMEMMEMEMMEN EMMEN MEMMUMMOMMIEMMIMMUMEMEMMMFAUMOMMMEMMMIMMEMMEMEMEMMEMMEMMUMEMMEMMEMMIMMI MEMMMEMI:: MIME MEMMIMMIMMEMMENOM::IMME MEMMEMEMEMMIMMMEMIMMEMMEMMMOMMIMmi MEMEEMM MM mmil EMMEmmommmommmumm mom mumanIMMEEMMEEMMMENTIMMIniMM•En IMMOMME MUM. MEM mummommommummm mmmmEmmmommummmommmummmum mmm mliall
ml muumuu mum MMEMMUISIMMQ MumMIUMMUMMEMMOMMESUM MEM •
EmMMEMMEME MEM MEN EMMLIMMEMMENMEIMME EMMEME EMNIMMEMMEMME MENEM
EME:1MMEME EIMMEMMUMMIMEM MEI MMEMMEMMEAPrIMMOMMMIMUM
IMMEMMI
momo
MMMEMEMMEMMMILIMMEMMIMMMEM
:11M MMEMMEMMEMMINMEMMEMPI UMM EM= mcgcga ripubmal =mo m mom= oo ommoommommommommommommmmommommommmommmomm-LImm-====== . =mom mmommom mommomommmommommoommemommommommommomommoommommomommoommommomm :::immmommommmmmommmmmmommosammumommill:mom mmmmommmmommmmmmm mm mm mom mmommmommoommumommommommolimmommm • mom MMMIMMUMMEMMEMOIMM NEM MN
MMMEMMOMMEMMEMMEmmMOMEMMMFMAMOMME ME • MOMMMIMMEMMEMM • MIMM
MINIMMMENOMMIOMM mommummommimplumm mmilmom mommimmommummom so mm mmommommimmimmiumminommommemmimmm • mom MEM MMMUMMENMEMMEMM ME OM
MMOMMEMMEMMEME MEMMEMMEMMENE&MMHM MEMMUMMM::IMUMMIMMEMMEMMEMMIMMMEMMEMM OMMEMUMMMMIMIMMEMNINAMMEMMEMMUMMOMEMMEIMEEEM mmumEMMEMMIMEEMMEMMEEMMEI MEMIMMMEMM MMEmEmommMEMMEMMMUMENMEMMEMMEMM MOMMUMMEMMWMMEMMEMMOMMMM• MEM MN= MMEMEMMIMMEMMENMEMMOIMMIMMEMEMOMMEMMMEMEMMEMMIMMEMEMMINMMEMM MEM MUMMEMMEMMMOSEMMEMMEMMEMMEMMEMEMMEMEMMMEMEMMMEMEMMEMEMMEMMEMMMEMM MENEM EMMEMME MMMEMMEMMOMEMMEMMEMMIMMEMMMMEMMIMEMMIMMOIMMMMMEMMMU MMOMEMMMEMEll
IMMMMUmmEMEMMEMEMEMMEMEM
I MUMMER ME MREIMMEMEMMSOMEMMUMME MEM'
•I MEM MUMMER MOMMEMEMMMIIIIIMM
I MIMI. MMEMMEMIESIMMMUMEM •
=MEM ME MOM EMEI
MM
MMEMMEMMEMMUM:1:MEM • MEMEMMEMMEM•EMMMEMMMEM ME•M UM
MEM
D M ME MEM MEM MEMEMMEMMOMMEM MMMEMMEEMMEMMEMU MMEMEMMMOMMEM IIIM M
mi IME IMMIMMEM MEMEEMMEMEM MMERMEMMEMMMEMMMEMMOMMEMMUMIM KM
=MUM MN EMMIMMMIMMMEMMIMMEMMMEMEMMEMMIMMEMMEMEMMEMMMMEMEMMMEMME • MMIMMEM ME MENEM. MMEMMEMMEMMEMMEMEMMIM MUM
I 1:111MEMEMEMMUMMTMMIN =M I
IME ME MiNIMME MMMEMMEMMILIMMMEME I EMS WM OMEMMOMMEMUMME Una • - MmmoMMIMMERMUMMEMMommoMMEM MMEMMMm EMMEMMMEMEMMEM EMM Mn
a Mean low water. mmimmoMIIMMIIIMMINIIIMEMIIMIII•11•11111=K11111•11eMIIIMMINIMMMINIMIIKIIIINEWTET
...... mm ....11 I
mmanimmummilmilimmsumimmilmm iiummumminimmor nom 11. 11 - 111
nu........................ mimmimm
mumummummm
i....mmo . mu•mi
immulmimmummlima
minummilmmusimummm.mmum mu. mummumm mammiumm.
....... mom. mmummumum mommummimm immim.is u m.. .m01... .................. lim...............m......m.......... MMEMEMM MMEMMEMMEEMMEMMMEMMUMMEMMUMMEMEMMMOMMEMMEMEMMMEMMMEMMEMMEMMM
11101;11 LONGITUDINAL CROSS SECTIONS OF MAJOR SOUTH ATLANTIC COAST CHANNELS
Robert R. Nathan Associates, Inc.
Source: U. S. Deepwater Port Study, Volume III, Institute for Water Resources, Report 72-8
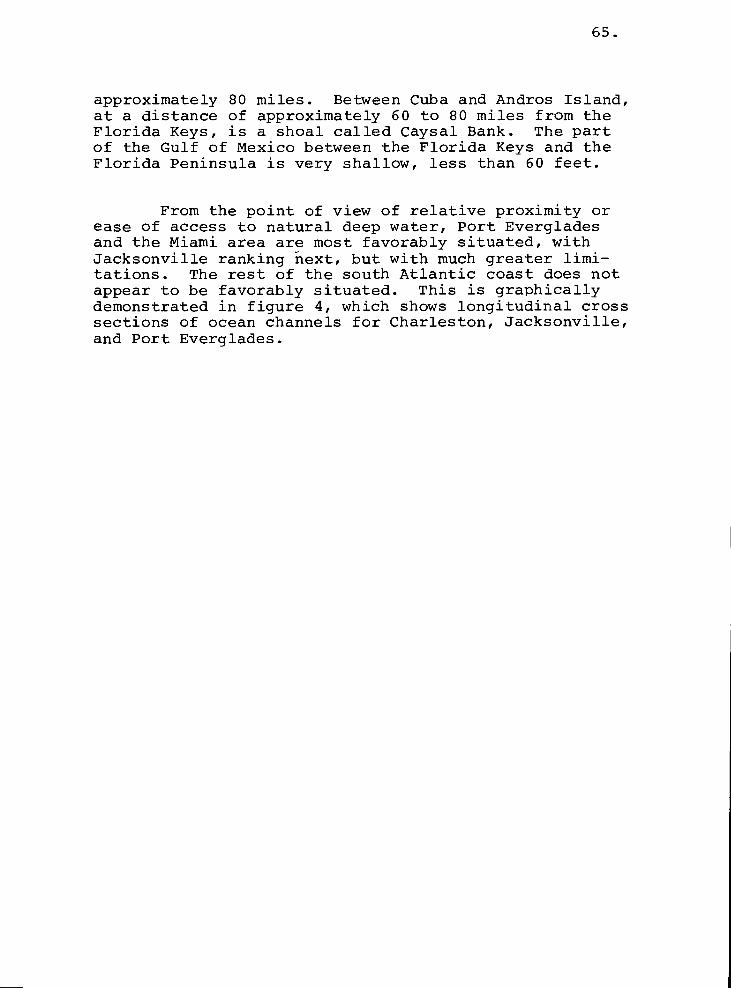
65.
approximately 80 miles. Between Cuba and Andros Island, at a distance of approximately 60 to 80 miles from the Florida Keys, is a shoal called Caysal Bank. The part of the Gulf of Mexico between the Florida Keys and the Florida Peninsula is very shallow, less than 60 feet.
From the point of view of relative proximity or ease of access to natural deep water, Port Everglades and the Miami area are most favorably situated, with Jacksonville ranking next, but with much greater limi-tations. The rest of the south Atlantic coast does not appear to be favorably situated. This is graphically demonstrated in figure 4, which shows longitudinal cross sections of ocean channels for Charleston, Jacksonville, and Port Everglades.

II. FOREIGN AND COASTAL MOVEMENTS, BY PORT, OF THE SIX STUDY COMMODITIES
The movement of bulk commodities at south Atlan-tic ports is dominated by receipts of petroleum products from both foreign and domestic sources (tables 1 and 2). Foreign imports consist principally of residual fuel oil; domestic receipts are principally motor fuel. Both foreign imports and domestic receipts are scattered among most of the ports on the south Atlantic, but the greatest concentration is in the ports of Charleston, South Carolina, and Jacksonville and Port Everglades, Florida.
In 1969, foreign imports of petroleum products equaled 9.4 million tons, of which 2.2 million tons went to Carolina ports, 0.8 million tons to Savannah, and most of the balance to Jacksonville and Port Everglades (2.7 and 1.7 million tons, respectively). Domestic water-borne receipts of petroleum products in 1970 were 14.2 million tons, of which 4.1 million tons went to Carolina ports, 3.2 million tons to Jacksonville, and 5.3 million tons to Port Everglades.
Because there is only one petroleum refinery 11' in the entire Atlantic coastal area ranging from North Carolina through Florida, the receipts of crude petrol-eum are minimal, as are related port requirements. There are no known plans for the development of addition-al refinery capacity, but it would be reasonable to
1/ It is located at Savannah and has a capacity of 6,900 barrels per day.
67.

1968 1969 1968 1969
Total
1969 19681
71 104
Table 1. U.S. Waterborne Exports and General Imports of Selected Bulk Commodities, South Atlantic Coast, 1968 and 1969
(In thousands of short tons)
Exports Imports
Port/area Phosphate rock
Total all study comm.
1968 1 1969
Total , grains'2(
Coal
19681 1969
Total
19681 1969
Crude oil
1968 11969
Petroleumt/ products
19681 1969
Iron ore
196811969
Bauxite
1968 11969
Alumina
Carolinas
Beaufort-Morehead City, N.0 140 362 --------69 258 69 258 53 17 18 87
Wilmington, N.0 506 662 -- c/ -- -- 3 -- 3 c/ -- -- 502 662 ------------502 662
Georgetown, S.0 340 -- -- -- 340 381 ------------340 381
Charleston, S.0 1,278 1,286 306 180 -- -- c/ -- 306 180 -- -- 947 1,087 -- -- 25 19 -- -- 972 1,106
Total 2,264 2,692 306 180 -- -- 72 258 378 438 53 17 1,807 2,217 -- -- 25 19 -- -- 1,885 2,253
Georgia and Florida
....„Savannah, Ga 680 882 5 6 c/ 5 6 7 45 644 797 -- -- 24 33 -- 675 875
Brunswick, Ga 3 3 ON °42 Jacksonville, Fla... 2,713 3,504 10 7 -- -- 907 811 917 818 7 -- 1,789 2,687 ------------1,796 2,687
Port Canaveral, Fla. 367 4 -- -- 367 654 ------------367 654
Fort Pierce, Fla.... c/
West Palm Beach, Fla 610 477 2 3 -- c/ 2 3 -- 608 474 -- 608 474
Port Everglades, Fla
Miami, Fla
Total
1,700 1,744 -- 2 -------- -- 2 5 -- 1,696 1,742
964 823 2 2 -- -- c/ c/ 2 2 19 27 942 794
7,037 8,088 19 20 2/ -- 907 815 926 835 38 72 6,049 7,148
-- 1,701 1,742
-- 961 821
24 33 -- -- 6,111 7,253
Total south Atlantic coast 9,301 10,780 325 200 c/ -- 979 1,073 1,304 1,273 91 89 7,856 9,365 -- 49 52 -- 7,996 9,506
Note: Individual items may not add to totals due to rounding. a/ Includes food grains (wheat, rice, rye), feed grains (barley, corn, oats, cereals, n.e.c.), and soybeans and mill products. b/ Includes gasoline, jet fuel and kerosene, distillate fuel oils, and residual fuel oils. c/ Less than 500 short tons.
Source: U.S. Department of Commerce, Bureau of the Census, U.S. Waterborne Exports of Domestic and Foreign Merchandise, SA-705, and U.S. Waterborne General Imports of Merchandise, SA-305, 1968 and 1969.

Rect. Commodity Shipt.
Total all study comm.
1969 1970
ct. Shipt. Rect. IShipt. Rect.
1969
Shipt. Rect. Rect. Shipt. Rect. Shipt. Commodity Rect.' Shipt.
58
Table 2. U.S. Domestic Waterborne Coastal Receipts and Shipments of Selected Bulk Commodities, South Atlantic Coast, 1969 and 1970
(In thousands of short tons)
a Petroleum " Crude oil b/
Dry bulk commodities-
1969 Port/area 1970 1969 1970 1969 1970
Shipt. Rect. IShipt.
240
1,453 -- 1,772 12 36
1,911 44 2,150 39 --
3,604 44 4,068 51 36
240
1,417 -- 1,772 12 --
1,911 27 2,150 39 d/ 17 Grains/ sy Grains/
3,568 27 4,068 51 d/ 17 d/
Carolinas
Morehead City Harbor, N.C
Port of Wilmington, N.0
Georgetown Harbor, S.0
Charleston Harbor, S.C. 2/
Total
146 146
Georgia and Florida
Savannah Harbor, Ga 1,274 68 1,359 80 165 -- 78 -- 1,109 68 1,281 80 --
Brunswick Harbor, Ga 58
Fernandina Harbor, Fla --
2 1 Grains/ 3 2 Grains!/
Jacksonville Harbor, Fla 3,191 112 3,240 190 -- -- 27 -- 3,189 23 3,210 51 I -- 88 Phos. rock -- 137 Phos. rock
Canaveral Harbor, Fla 182 , -- 223 -- -- -- -- -- 182 -- 223 --
Palm Beach Harbor, Fla -- -- 15 q/ -- -- -- -- -- -- 15 .3/ -- -- -- -- -- --
Port Everglades Harbor, Fla 5,375 347 5,386 597 -- 280 55 502 5,375 67 5,331 95 -- -- -- -- d/ Grains /
Miami Harbor, Fla 105 19 64 1 -- -- -- -- 105 19 64 1 / Grains/
Total 10,815 546 10,287 868 165 280 160 502 10,018 177 10,124 227 2 89 -- 3 139 --
Total south Atlantic coast.. 13,789 590 14,355 919 201 280 160 502 13,586 204 14,192 278 2 106 3 139
a/ Includes 2911, gasoline; 2912, Jet fuel; 2913, kerosene; 2914, distillate fuel oil; 2915, residual fuel oil. b/ Includes grains; 1011, iron ore and concentrates; 1051, bauxite and other aluminum ores and concentrates; 1121, coal and lignite; and 1471, phosphate rock. c/ Consolidated report. d/ Less than 500 short tons. el Includes 0102, barley and rye; 0103, corn; 0104, oats; 0105, rice; 0106, sorghum grains; 0107, wheat; 0111, soybeans; and 2049, grain mill products, n.e.c.
Source: U.S. Department of the Army, Corps of Engineers, Waterborne Commerce of the United States, Part I, "Waterways and Harbors, Atlantic Coast," 1969 and 1970.

70.
assume that, to the extent that such capacity were con-structed, it would be designed to meet essentially local and regional markets, and insofar as waterborne commerce is concerned, would chiefly result in the sub-stitution of crude petroleum receipts for petroleum product receipts.
At the present time, a substantial share of the consumption of motor fuels and light fuel oils in the south Atlantic region is supplied by the Plantation and Colonial Pipeline Companies, which move these products from the Texas and Louisiana area to Southeastern and Middle and North Atlantic States (see Annex A-2).
The only dry bulk commodity of any significance moving at south Atlantic ports is phosphate rock, which is exported through Beaufort-Morehead City, North Caro-lina, and from Jacksonville. However, as stated in Annex A-VII, exports of phosphate rock from these ports are not expected to grow significantly from recent levels, which in 1969 were 258,000 tons from Beaufort-Morehead and 811,000 from Jacksonville.
More recently, a new steel mill has been con-structed near Georgetown, South Carolina, and is bring-ing in foreign iron ore in quantities below a million tons. It is not expected that there will be any sig-nificant growth in the size of that operation in the foreseeable future.
Although the volume of petroleum receipts in the four-state area from both domestic and foreign sources can be expected to grow over time, as long as such re-ceipts are limited to local and regional requirements they are not expected to move in vessels requiring deep-draft channel and harbor facilities. This would like-wise appear to be true of dry bulk commodities. This judgment is confirmed by the American Association of Port Authorities Committee on Ship Channels and Harbors report of June 1970. This report, the result of a study in which all of the major south Atlantic ports participated, concluded that there was no need for a Federal regional survey to determine the need for and location of a very deep water channel (i.e., in excess

71.
of 55 feet) to serve the south Atlantic region. It was reported that all of the ports felt their needs could be met by channel depths in the 45-foot range for all foreseeable vessels .!/
1/ Ship Channel Capabilities for Merchant Vessels in United States Deepwater Seaports through the Year 2000, South Atlantic and Caribbean, The American Association of Port Authorities, Washington, D.C., June 1970.

III. MAJOR HARBORS AND CHANNELS
A list of south Atlantic ports and their project depths is given in table 3. Depths in the principal ports range from 35 to 38 feet. Dredging to the auth-orized depth of 38 feet at Jacksonville Harbor, Florida, from the present 34-foot depth is underway. In addition, a survey review report recommends an entrance channel of 42 feet and a harbor channel of 40 feet at the port of Morehead City, North Carolina.1/
Table 4 gives detailed channel dimensions for the ports of Charleston, Jacksonville, and Port Ever-glades. Figures 5, 6, and 7 show the locational char-acteristics of channels and bulk handling facilities in Charleston, Jacksonville and Port Everglades. Port Everglades has the greatest natural advantage for deep port development.
73.
1/ U.S. Army Corps of Engineers, Pamlico River and Morehead City Harbor, Review Report, U.S. Army Engineer District, Wilmington, Corps of Engineers, Wilmington, North Carolina, April 1970.

Project depth Harbor project
Morehead City Harbor, N.0
Wilmington Harbor, N C
Georgetown Harbor, S.0
Charleston Harbor, S.0
Port Royal Harbor, S.0
Savannah Harbor, Ga
Brunswick Harbor, Ga
Fernandina Harbor, Fla
Jacksonville Harbor, Fla
Canaveral Harbor, Fla
Fort Pierce Harbor, Fla
Palm Beach Harbor, Fla
Port Everglades Harbor, Fla
Miami Harbor, Fla
Key West Harbor, Fla
35
38
27
35
24
38
30
28
38
37
27
35
37
38
30
74.
Table 3. South Atlantic Coast Ports and Project Depths
(In feet)
Source: Regional Review of Deep-Draft Harbors on the South Atlantic Coast, Board of Engineers for Rivers and Harbors, May 1970.

Depth Width Length Location!/
Feet Naut. miles
Stat. miles Stat. miles
Name of channel
Charleston, S.C. Fort Sumter Range Mt. Pleasant Range Cooper River Channel
Jacksonville, Fla. Bar Channel St. John River Channel!/ Terminal Channel/ South Jacksonville Chan-nelh/
Port Everglades, Fla. Entrance Channel Approach Channel Turning Basin North extension of Turning Basin South extension of Turning Basin
b/ 35 1000- 35 1000c/-600 35 600-400
42LI/ 800 f/ 38 400 - 34 600
30 varies
40 500-300 37 300 37 1200
31 800-500
31 1200
9.0 10.4
1.6 1.8
11.3 13.0
2.4 2.8
17.4 20.0
1.7 2.0
2.5 2.9
0.43 0.50
0.46 0.54
0.40 0.46
0.20 0.23
0.20 0.23
(11.3)-(0.9) ( 0.9)- 0.9 0.9 -13.9
( 2.8)- 0.0 0.0 -20.0
20.0 -22.0
22.0 -24.9
(0.5)- 0.0 0.0 - 0.54
0.54 - 1.0
1.1 - 1.3
1.1 - 1.3
Table 4. Project Dimensions of Major Channels
a/ Figures in parentheses indicate offshore locations. b/ Maintained to a width of 800 feet. c/ Maintained to a width of 800-600 feet. d/ Locally to 40 feet. e/ Via Dame Point-Fulton Cutoff. f/ Locally wider up to 1,200 feet. 2/ To Commodore Point. h/ To Florida East Coast Railroad Bridge.

Goose Creek
Shipyard River Channe
LEGEND
• Oil facility
• Grain facility
Mt Pleasant Range
rt Sumter Range
Scale of Statute Miles
3 2 4 SEE INSET FOR CONTINUATION
OF FORT SUMTER RANGE
FIGURE 5 CHANNELS AND BULK HANDLING FACILITIES, CHARLESTON HARBOR, SOUTH CAROLINA
Robert R Nathan Associates, Inc

!•-•
Ft George River
'')Irare
Fort George Island
Blount 0 mi
Island 10 1711
Dame Point-Fulton Cutoff
Maypoft Basin
ATLANTIC OCEAN
JACKSONVILLE
%It
I
Scale of Statute Miles 2 3 4 5
LEGEND
• Oil facility CI Phosphate rock facility
Robert R Nathan Associates, Inc FIGURE 6 CHANNELS AND BULK HANDLING FACILITIES, JACKSONVILLE HARBOR, FLORIDA
St Elmo W John T Alsop
Acosta Bridge Bridge
Florida East Coast Railway Bridge-,
John E Mathews Bridge
Isaiah D Hart Bridge

„\
va% 1
I North Exten I Turrunr
Basin
Entrance Channel
1,500
LEGEND
• Oil facility
A \\
, South Extension
Turning 11A
I V.1% Basin
I A Ix - I
E FIGURE 7 CHANNELS AND BULK HANDLING
;FACILITIES, PORT EVERGLADES HARBOR, FLORIDA
Robert R Nathan Associates, Inc
ATLANTIC OCEAN
Scale in Feet 0 500 1,000 C••=1=====

IV. PHYSICAL OBSTACLES TO CHANNEL ENLARGEMENT
Bridges and Tunnels
Information on bridges and tunnels crossing the main ship channels of Charleston, South Carolina, and Jacksonville, Florida, is provided in table 5. It shows that no bridges or tunnels cross Jacksonville's main channel below mile 21.4; however, a tunnel crossing is under consideration. No bridges or tunnels cross the 1-mile-long channel of Port Everglades.
Information on the existence of rock is available only for the channel of Jacksonville. The information is provided in the Survey-Review Report on Jacksonville Harbor, Florida (1964), based on borings up to a depth of 50 feet. Upstream from mile 4 on various stretches the top of the rock formation is located between about 37 and 45 feet, but at some locations it is at depths of 50 feet and over. The hardness of the rock varies from place to place and is described in the boring logs presented in the Survey-Review Report on Jacksonville Harbor.
Tides
Table 6 presents the mean tidal range of the three main ports.
Strong northeasterly winds raise water levels about 2 feet at Mayport and Jacksonville. Strong south-westerly winds lower water about 1.5 feet at Mayport and 1.1 feet at Jacksonville.
79.

Cleara nce Location Bay, strait or channel Purpose Name Kind
Horizontal Vertical
Charleston, S.C.
Silas N. Pearman Bridge
Grace Memorial Bridge
Jacksonville, Fla.
John E. Mathews Bridge
Terminal Channel
Arlington Channel
Isaiah D. Hart Bridge
John T. Alsop Bridge
St. Elmo W. Acosta Bridge
Florida East Coast Railway Bridge
Seaboard Coast Line Railroad Bridge
(stat. m.) feet ----
6 Town Creek and Cooper River Highway
6 Town Creek and Cooper River Highway
Fixed, high-level 1,000 150
Fixed, high-level 1,000 150
Vertical lift
Railroad Bascule
Railroad Swing
705 152
376 86.2./
960 13512/
350 40c ' d/
174 5021.f/
5 /
c/ 1—
Highway
Highway
Highway
Highway
21.4 St. Johns River
22.0 St. Johns River
24.7 St. Johns River
24.86
24.9
0.1
St. Johns River
St. Johns River
Trout River
Fixed, high-level
Fixed, high-level
Vertical lift
195
55—f/
Table 5. Table of Relevant Bridges in South Atlantic Coast Ports
a7 At center. b/ 141 feet at center. c/ Closed position. 1/ 135 feet raised position. e/ 164 feet raised position. f/ Left and right openings.

2.5 2.3
Table 6. Tidal Range Under Ordinary Conditions
(In feet)
81.
Mean range ' Location
Charleston, South Carolina
Jacksonville, Florida
On the bar Mayport (mile 3.8) Fulton (mile 8.3) Dame Point (mile 11.5) Jacksonville (mile 19.3) Jacksonville (mile 24.9)
Port Everglades, Florida
At the entrance At the terminals
5.2
5.3 4.5 3.4 3.0 2.0 1.3
a/ Difference between mean high water and mean low water.

82.
Currents
Tidal currents are strong in St. John's River as far upstream as Jacksonville. Velocities in the channel at the strength of the current are about 2.9 knots near the mouth and about 2.3 knots at Jacksonville. Strong southeasterly winds increase the velocity of the ebbtide and decrease or may interrupt the flood. Crosscurrents of concern to navigators of deep-draft ships occur at three principal points along the main channel below Jacksonville. One is at the downstream end of Dame Point-Fulton Cutoff (mile 7) at its intersection with the old channel around Blount Island, almost opposite St. Johns Bluff. Another is opposite the mouth of Sisters Creek (mile 5) where the Intracoastal Waterway enters the river, and the third is off the end of the north jetty at the river mouth. Difficulty is exper-ienced at the first two points by ships proceeding up-stream during strong ebbtides. The strong southerly set of the ebb at those points, first across the bow and then the stern of a ship, makes it difficult to maintain steerageway into the succeeding cut. At the third point, northerly winds cause a strong southerly set on the floodtide.

APPENDIX A. REVIEW OF STUDIES ON CHANNEL DEEPENING AND PORT EXPANSION
1. Port Evervlades, Florida Study. A report is in progress studying the deepening of the 37-foot channel at Port Everglades, Florida, to 43 feet. The findings will be available within a few months.
2. Survey-Review Report on Jacksonville Harbor, Florida. U.S. Army Engineer District, Jacksonville, Corps of Engineers, Jacksonville, Florida, 1964. This report studies further dredging of the 34-foot channel to 37 and 38 feet. It deals only with the import of petroleum products because the phosphate rock facility was neither under construction nor in operation at that time. It recommends deepening of the channel up to 38 feet from the ocean to mile 24, as well as widening of various banks of the river channel. The deepening to 38-feet has been authorized to mile 20.0, and deepening of the first 10 miles of dredging is underway.
For further dredging the availability of suffi-cient disposal areas might become a problem. At this moment the spoil is disposed of parallel to the channel.
The first-cost estimate for dredging from 34 to 38 feet is $8.5 million (Federal) and $326,000 (non-Federal), totaling $8.8 million.
Estimated annual maintenance cost of the 38-foot channel is $57,000 (Federal) and $14,000 (non-Federal), totaling $71,000.
83.
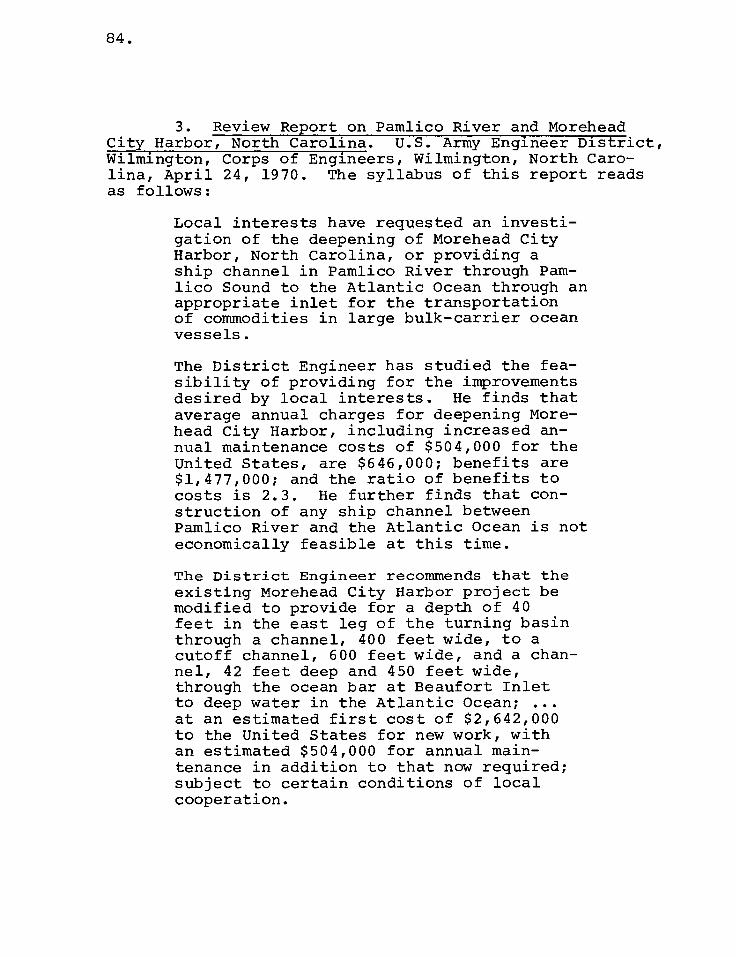
84.
3. Review Report on Pamlico River and Morehead City Harbor, North Carolina. U.S. Army Engineer District, Wilmington, Corps of Engineers, Wilmington, North Caro-lina, April 24, 1970. The syllabus of this report reads as follows:
Local interests have requested an investi-gation of the deepening of Morehead City Harbor, North Carolina, or providing a ship channel in Pamlico River through Pam- lico Sound to the Atlantic Ocean through an appropriate inlet for the transportation of commodities in large bulk-carrier ocean vessels.
The District Engineer has studied the fea-sibility of providing for the improvements desired by local interests. He finds that average annual charges for deepening More-head City Harbor, including increased an- nual maintenance costs of $504,000 for the United States, are $646,000; benefits are $1,477,000; and the ratio of benefits to costs is 2.3. He further finds that con-struction of any ship channel between Pamlico River and the Atlantic Ocean is not economically feasible at this time.
The District Engineer recommends that the existing Morehead City Harbor project be modified to provide for a depth of 40 feet in the east leg of the turning basin through a channel, 400 feet wide, to a cutoff channel, 600 feet wide, and a chan-nel, 42 feet deep and 450 feet wide, through the ocean bar at Beaufort Inlet to deep water in the Atlantic Ocean; ... at an estimated first cost of $2,642,000 to the United States for new work, with an estimated $504,000 for annual main-tenance in addition to that now required; subject to certain conditions of local cooperation.

ANNEX B-3. RECONNAISSANCE SURVEY OF THE GULF COAST
CONTENTS
I. DESCRIPTION OF COAST AND PORT FACILITIES 87
II. FOREIGN AND COASTAL MOVEMENTS, BY PORT, OF THE SIX STUDY COMMODITIES 95
III. MAJOR HARBORS AND CHANNELS 99
IV. TERMINAL FACILITIES 115
V. PHYSICAL OBSTACLES TO CHANNEL ENLARGEMENT 117
Bridges and Tunnels 117 Pipelines and Cables 120 Levees 120 Natural Obstacles 120 Tides 121
APPENDIX A 123
86.

I. DESCRIPTION OF COAST AND PORT FACILITIES
Figures 1, 2, and 3 show the shoreline configura-tion and port locations for the eastern, central, and western sections of the gulf coast area. They also in-dicate the principal port and harbor areas for which de-tailed channel and other relevant port data are presented. These areas are (1) Tampa-St. Petersburg; (2) Mobile; (3) Mississippi River ports; (4) Port Arthur and Beau-mont; (5) Houston, Galveston, Texas City, Baytown, and Freeport; (6) Port Lavaca; (7) Corpus Christi; and (8) Brownsville.
Figure 4 presents longitudinal cross sections for eight major gulf channels from the major facilities to a depth of 120 feet. Figures 5 and 6 show similar information for the eastern gulf coast and the central and western gulf coasts, respectively, in the form of distance and depth contour lines at 60-, 90-, and 120- foot depths. Of primary significance in terms of rela-tive natural advantages and disadvantages for deepwater port development is the substantial variation in dis-tance to deep water in the different coastal areas. Along the Florida coast, for example, the distance to the 60-foot line varies from approximately 40 miles in southern Florida to 15 miles at Tampa and to less than 5 miles at Panama City and Pensacola. At Mobile and Gulfport the distance is between 5 and 10 miles, and just south of the Mississippi River Delta it is less than 5 miles.
From that point there is a sharp increase in the distances to deep water along the Texas coast to a maxi-mum at Beaumont-Port Arthur of 35 miles to the 60-foot depth and 80 miles to the 120-foot depth. From
87.

90° 137° 84° 81 °
MISSISSIPPI
ALABAMA . . .. ..... GEORGIA
........ .............................................
... Jacksonville .......................................
..............
Mobile '....'
3
Panarna Ctty
Gape San Bias
teraiL 77—
oe—A-
■ Mississippi Sound Eape St. George
.1 \
Mississippi Delta
Breton Sound
handeleur Sound
/'
GULF OFMEXICO 27°
Boca Grande
Scale of Statute Mlles
50 100
81°
FIGURE I LOCATION OF PORTS, EASTERN GULF COAST
no°
Robert R Nathan Associates, Inc 87° 84°

33°
LOUISIANA
Avondale ALABAMA
MISSISSIPPI
TEXAS
FLORIDA
.....
Mobile
ISaliae River Charles Like dharl
° I Beaumont
Baton Rouge
cbol 21; brt, Destrehan
30° Mississippi River-Gulf Outlet 'Dart, Watenvay
•••• ••".r.}:"; Morgan Ct ty
, ••••• ..■■■
/ ) i s
1 1 1
/ i I /... /
%•,,,, k.. 1 \ 1
/ i •■••,.. ■ 1
,..
\ .. N'. 1
...S. ■ ■ \
St..... .■ .••■.1
MississlPPI Delta
'7)
j
\ 100
Scale of Statute Miles
50
GULF OF MEXICO safety
FIGURE 2 LOCATION OF PORTS, CENTRAL GULF COAST 1 v.
871, 86°
Robert R Nathan Associates, Inc

96° 93°
LOUISIANA
Lake Charles Lake
30° -I BeAUMCNIt
TEXAS ,..._ ,,,,#' 1
1 / -.. ... • _ \ 1
Matagorda Bay 'N, // k \ i
-, \
1 ‘
,„,../ -■%. \ ■
•-■.., `bk , /
\ 1P" ort Aransas
Port Lavaca
ssis
Corpus Christi
27° GULF OF MEXICO
Laguna Madre
Rio o
Grande
Scale of Statute Mules
0 50 100
MEXICO
FIGURE 3 LOCATION OF PORTS, WESTERN GULF COAST
on° 965
Robert R Nathan Associates, Inc Py go
27°

:NW MMMMMM •••• •••• MIA
EiL4133.1EMEERIIIISEE LIFT111111141
ER-211.11AILINIE
G. I,
ItS mask.. comm
12113111:1=Ragd:PLE
ER=
WIDE
1•111(o ;la lizi ir _
.1. • .1111 MEM; M
1:4=1PalE1
ILECIZECIRESEE 41,M
on o MM
■ 1•111111101,•• ro•••••101 INK
LCILIKELINDLEIRII1=1
ESItli±1717EEEel7In
Ef;1
Ef
•• ••:10.11:1 fa I: M OM 1
41:11111■1•/1 lAiiktiam MMM M111,,,410C W p MM r;011•11m...•.4 .
MEE ••• 21, • • MIN 11111P.AP.'04•11,7.
11111 A 1=117.R1:7=
211TECI7
•
ISORIZILMIr ••/
Z. Y411117
1 All M
11 ••••//iill•Oqo ,i%•:1 11155
will , ,. .I
••• •••• •••• In .U11 ,iwr. A `11'11111lill.
• ro: iitIlaili: .,43 milim ■1 . 11 II
. .... , MM • 7.117, .1111 '5 • 11
A 31 ••• •
Robcrt R Nathan Associates, Inc FIGURE 4 LONGITUDINAL GROSS ,11,1
9'1 /

tl •=1•1211•••• : WIIIVIggi MIIIMIIIIMINIII
1111111111
' InEriti
II
0
MEMENMENMEMEMENEMONMEMMENI i WMIIMMIMM M91111IIIIII EMMIUMMUMEMEMENPWWW111MMA MOM EEO V IMMOMMEMEMIORIM MENU AGSM MWEIMP0"--- •I•••=I•1I•
Wel
Illk ••El /
rin111191111111 111111111h ' lir 111111M= Jail il ,, Ilk7r1011111 •••••••••••••••1•111•11••••i•• Irommommommoulen■ram■■■
IMM:=1:LI:EXIIIII11.11 1111111115 immommommimmamminms . . Ammommommplimmurrammummilmomg, Illialigallffillillralli
NIL on ittmomin ammemmm ladamens•misrmi■ALE
MINA - . "
mo
11 0 , --.
, ISIIIIIII ■
4 .
mum. . IMWDOMOMMINME MN NNEMEMZUMEMMEMMINUNMEMNE MEM NMEEMIONIIIMMEMM , - •1•011•11••• •
*1.* • Irm
:! Ill . . III Pi
MOMMIKOWAWNRAMEMEMMWMINKOPUM - .7
IIIIIIIL - / ial 4
MMIIIMMINVORMUMNE. .-- 111111h111111111 OIMEMMENNIPEMMWEd ; Ill immompummompc IMPANEWAMMEIMPAM MENEMUI•mmilMAMI MMEMNEMEMMEre= ‘ ille IIIME■61=ENNIUMEA MMINCMME
• 111111111111.1=1111.111 111111111 111111119111111110.
11-10=111 11111111k lif p•
4
••11111MI:ZeiS1 MIN••1111M•1••11 .1.4
ottel c,a,hootjr Rine rcl4t4 Okled •rotnI'4(.4 4b4rtilq_O8.L1J
FIGURE 5 DISTANCES BETWEEN COASTLINE AND 60-, 90-, AND 120-FOOT CONTOUR LINES, EAS1 ERN GULF COAST
Robert R Nathan Associates, Inc.

I 11 IIIIIIIIIIIIIIIIIII IIIIIIIIIIIIIIIIIIIII PI 1 MP 1
••••.••••••• MN= KIM
•••••••••••••••••MMEMMEMUNETEMMOMEMM_ MOM • ME MN •••••••••••••••••••••••••••=g1MONMEMEmmO11MEN • mmnill 1111 111111111111111111111111P:1111111111111111 111
1111111111111 IMMIIM MIIIIIII11111111711191111111. IIIIIIIM .. Nhl i II
...........k...J •.irdm le Ellmorgrimi
i maiiiiiiiiimitigiggifiligliiiiiiiiii 0:limn I 111111111111,1111=1111111111111S111111111111111 11141111 •••••••••••••FA mom•••••• MoI•M••M•MMUUMM••••E•MMEMMME ••MO= •••■••••••••••••••••••••IIMI.r••=1•••■ •••••••••■••••••••••••••••1111ra IIII • •••••••••••MTO•11••1113••••••WMINEMISMIN
mE1 1
IIIiilligiliiiIMINIIIIiiilialmmao • 1•Am... ...... milmommommummEmmommucomm mommonmummimmill • milimmomm mmulmommummummommimmilmmummummummommommomm mmummilim EIMEENNEMEMMIIMFAMMEEMEMNIMMUMMEMEMEMMEMOMmliMMOMME MEMENNWm•
MN= MINEMEWMOMEEMEMEMMENNMEMMERMEMMUNEMEM10:20OMMMEMEMEMMINME
11 mu mmtramommommommommummommmummarimmximmimmosimmmmu••••m•• NM MRZEIMMUMMOMMUMNEEMEMEENMEIMMEMMEMOMEENIMORMEBEEMNENNE M•• WAIMEMMWMEMMEMEMEMMINMEMEERREEMMEMEENNEEMENOMMEMMIMMEMEMMEMME ME INNEMONNEEMEMEMENNINMEEMEMEEMEMOMMEMMIESIEMulmommEmmel====
11 EMEMMIIMOMMEMEMEMMUMEMIIIIIIIIIIIIIIIIIIIIIIIIIIMM•=111111111
101111111111P110••••••••••••••1111111.111 - 1 =MEM ••••••••••••••••••••••MailiAillfi ••••••••••rni•VMpalp•gm■M
•
111111111!!!!!!!;!!!!!!!!! !!!!!!;22111111iiii I i 1111111111911111d 1111111111111111111r" II:1111111 I
I 111111111 111111 11111111111111111111111111""....1 111111111iiiiirliNIMMER 111M71= 1 IIIIIIIIIp A
......... .............. ...7.............. IMMEMWAMEE INEMEMEMENIAMERIEMEMEMEIMMILMEMEMEEMIEMUK IMOMENW41E••••••=M•
11111111111111114111111111111111911E1111!5!!!!!!!!1 miumirmumm.asurammEmmumwmamommmarAmmamommalmommommsmo immlubo:licammompgammmummummEnummov,:ammminomminummimmEmmoram mommzemmommummmmmummmummulammommymmummmunmisommommommwm ••••■••••NIMEMEMEOMpirgaiCRIMMIWINOCRLOWIIIMO WAME MMW4EEMMNMMMMMMMEM.O.KMW2M&V!E5i.AMMMA -a=MEMNMMMVR:M.NWWn2i/===NNMNN mommuromwommommilmummobaomommommommommorbamaidommommommm MEMMEMMOMWIMMEMMEMEMEMMEMMIMIMMAMMEMEMMMMMMENNMEMEWUN MEMMEMEMM MMNIMMEMMUMMEMMEMMEMMMMUMENVONOMMEMMEMMEMEMMEMIIIIM ••MMEMEME MMEgiMMIWOMMUMMMEMMEMMMUMMIVEMMEMMEMMSNM M M •UMMMMMM MEMENMEMMOOMMEMMEMMEMMMUMMEMEMEMMINEMEMMIIM - MEILMENEMMEMMEMMEMEMI MMUMMEMMILIMMEMMEMZEMMEMMMEMEMEMMMEMEMMEMM MC . MEMANIMINNEMIMMUMMWM EMONMEMMILMMEMEMEnMEMMEEMMEMMEMELMENN I 1•■••••••■■••••••••• IMMIMMIMEMEMWOMMERNMEMEMEMIMIEMEMEEMEME IN m
111111111111 ea=
1111 M1111111111114 11111111111 11111111
Ifi ••••••••••••••••••F:-••••••••••••••••••m••• . ••••1 mm•••■••IIIIIIM
......p......... 1.: ...........,...........pr.....„......munn :;:::2:::::::::::: ::::::::::::::::=NIN immanumn ! NE MEN;tEMEMEMEMOMMEMEMEMUMEMMEMMEMEHEMEMWEN 11•1•••••••••••••••• MERMOMMEMOMMEMMUNIONMEEMPMEMMUMMEMOHEMEDI 1•■I•4••••••••• EMEWIENNWMEMAIMEMMOMMEEMMEMinlIMEHMENEC M
I=MEPILIIVIO MIWAIMEMEMMEEM2MMEMENENCIME2M ELNEMENg • C _______ EMNIMMUMWAMEMEMOMMEAMENIMMEMME MIHMOSIRM illic
cmililli
111 111111111111111111111111111111111111111111 1 MUMEMMEMMMEMEMMEMIMMUMILUMEMENEEHME =MEI =MEM EN MMU•MEMEMMEMEMENNEMUNIMEMEMUMEM _MNIMMI NEMNOMM EN IMMINEMMUMEMEMENNMEMEEMMENNEN MN MOM NUMMOMM
, ____ EMI 1111111111 I - •
I • . D
IST
AN
CES
BE
TW
EE
N C
OA
ST
LIN
E A
ND
60-
90-
AN
D 1
20-F
OO
T C
ON
TO
UR
LIN
ES
, WE
ST
ER
N G
UL
F C
OA
S

94.
Beaumont-Port Arthur southward there is a sharp decrease to approximately 12 miles for the 60-foot depth at Free-port, just south of Galveston-Houston, and further de-creases to 5 miles at Corpus Christi and about 3 miles at Brownsville.

II. FOREIGN AND COASTAL MOVEMENTS, BY PORT, OF THE SIX STUDY COMMODITIES
Table 1 shows imports and exports of our study commodities for 1968 and 1969 by individual port. Table 2 shows similar data for coastal waterborne movements in domestic trade for 1969 and 1970. For the gulf coast as a whole, foreign trade movements approximated 69 and 67 million tons in 1968 and 1969, respectively, of which approximately one-half was exports of grains and soybeans and meal. Two-thirds of these grain exports, or approx-imately 20 million tons, moved through ports on the Mis-sissippi River; most of the balance moved through Texas ports, principally Houston. Exports from grain shipping ports in the eastern gulf (Mobile and Pascagoula) were less than 10 percent of total gulf exports.
Phosphate rock, the only other export commodity of significance, moved entirely through the Florida ports of Boca Grande and Tampa, and most of this move-ment (92 percent in 1969) was handled by the latter port.
Next to grains, the largest single commodity flow was the import of bauxite, which in 1968 and 1969 ap-proximated 14 and 16 million tons, respectively. This import, however, was much less concentrated by port and port region than were grain exports, and imports in ex-cess of 2 million tons were handled at each of the fol-lowing ports: Port Lavaca and Corpus Christi, Texas; Gramercy and Baton Rouge, Louisiana; and Mobile, Ala-bama. As was pointed out in Annex A-4, this bauxite moved directly to processing plants at locations near the port areas.
95.

otal
196 338
361 252
687 1,221
81 106
247 251
7,448 7,275
9,020 9,443
-- _- _- _- _-
c/ -- Cl - - - - - - - - - - c/ -------- ---- -- -
--- --
9,579 9,261 8,770 7,630 31 82 12 7 8,813 7,719 126 -- 439 812 18 103 28 554 3.56 73 767 1,542
359 383 359 383 --------359 -- -- -- -- -- --
6,563 6,797 6,563 6,797 --------6,563 6,797 ------------ -- -- 84 60 -- -- 15 -- -- 84 45 -- -- -- ------ 84 45
2,282 3,634 -- 1,428 ------------2,282 2,206 -- -- 2,282 2,206
8,273 8,079 3,664 3,202 -- c/ -- -- 3,664 3,202 -- 127 2 -- 707 407 3,900 4,342 -- -- 4,609 4,876
2 -- 2 -- -- ------ 2 -- -- -- -- -- -- -- -- -- -- -- -- --
1 Cl 1 1 -- -- -- -- -- -- -- -- -------- --
574 596 574 595 -------- 1 ------ -- 1
27,717 28,810 19,933 20,050 31 82 12 7 19,976 20,139 126 127 525 858 725 510 6,210 7,102 156 73 7,742 8,670
Table 1. U.S. Waterborne Exports of Domestic and Foreign Merchandise and General Imports of Selected Bulk Commodities, Gulf Coast, 1968 and 1969
(In thousands of short tons)
Total all study comm.
Port/area Total Crude oil
Exports
Total grainsa/ Coal
Phosphate rock r
Imports
Pet./ Iron ore products
Bauxite Alumina
196811969 1968 1 1969 1968 1969 1968 1969 1968 1969 1968 1969 1968 1969 1968 1969 1968 1969 1968 1969 1968 1969
Eastern gulf coast Boca Grande, Fla
St. Petersburg, Fla Tampa, Fla Port St. Joe, Fla Panama City, Fla Pensacola, Fla Mobile, Ala Pascagoula, Miss Gulfport, Miss
Total
Central gulf coast Port Sulphur, La New Orleans, La St. Rose, La Destrehan, La Good Hope, La Gramercy, La Baton Rouge, La Avondale, La Morgan City, La Lake Charles, La
Total
909 1,050 -- ------ 712 712 712 712 -- -- 196 338 -- -- -- --
361 252 -- -- -- -- -- -- -- -- -- -- 361 252 -- -- -- --
9,491 9,419 c/ pi -- 2/ 8,804 8,198 8,804 8,198 -- -- 687 1,221 -- -- -- --
83 105 ---------- - 2 -- 41 23 40 83 -- -- -- --
248 251 1 --------- - 1 -- 164 100 83 151 -- -- -- --
1 3 1 1 -- --
8,693 8,266 1,244 991 2 1 -- -- 1,246 992 54 26 233 359 4,413 4,576 2,748 2,314
1,942 1,200 1,942 1,200 --------1,942 1,200 -------------- --
3 14 Cl 14 c/ c/ 3 -- --
21,731 20,560 3,190 2,208 2 1 9,519 8,910 12,711 11,119 259 149 1,600 2,404 4,413 4,576 2,748 2,314
Western gulf coast Orange, Texas 91 50 91 91 -- -- -- -- -- -- Port Arthur, Texas 396 415 229 90 -- c/ -- -- 229 90 c/ 78 167 246 -- -- -- 324
Beaumont, Texas 1,287 717 1,283 717 --------1,283 717 7- -- -- -- -- -- 4 --
Galveston, Texas 740 646 740 646 -- Cl -- -- 740 646 -- -- -- -- -- -- 0/ -- -- -- 0/ -- Houston, Texas 8,615 5,625 6,846 3,992 4 f 3 c/ 6,853 3,994 6 12 842 852 889 753 77 14 -- -- 1,764 1,631
Freeport, Texas 1 -- 1 -- -- -- -- -- 1 -- -- -- -- -- -- -- -- -------- --
Port Lavaca, Texas 2,623 3,090 -- -- -- -- -- -- -- -- -- -- -- -- -- -- 2,623 3,090 -- -- 2,623 3,090
Corpus Christi, Tex 3,798 4,870 1,327 1,360 ------- - 1,327 1,360 80 55 -- 39 -- -- 2,391 3,416 -- -- 2,471 3,510
Brownsville, Texas 1,975 2,155 193 307 --------193 307 1,713 1,847 -- -- -- -- 1,782 1,847
Total 19,526 17,568 10,710 7,162 4 2 3 2/ 10,717 7,164 1,799 1,992 1,082 1,137 889 753 5,041 6,520 -- -- 8,811 10,402
Total gulf coast 68,974 66,938 33,833 29,420 37 85 9,534 8,917 43,404 38,422 2,184 2,268 3,207 4,399 6,027 5,839 13,999 15,936 156 73 25,573 28,515
Note: Individual items may not add to total due to rounding. a/ Includes food grains (wheat, rice, rye), feed grains (barley, corn, oats, cereals, n.e.c.), and soybeans and mill products. E/ Includes gasoline, jet fuel and kerosene, distillate fuel oils, and residual fuel oils. Cl Less than 500 short tons.
Source: U.S. Department of Commerce, Bureau of.the Census, U.S. Waterborne Exports of Domestic and Foreign Merchandise, SA-705,
and U.S. Waterborne General Imports of Merchandise, SA-305, 1968 and 1969.
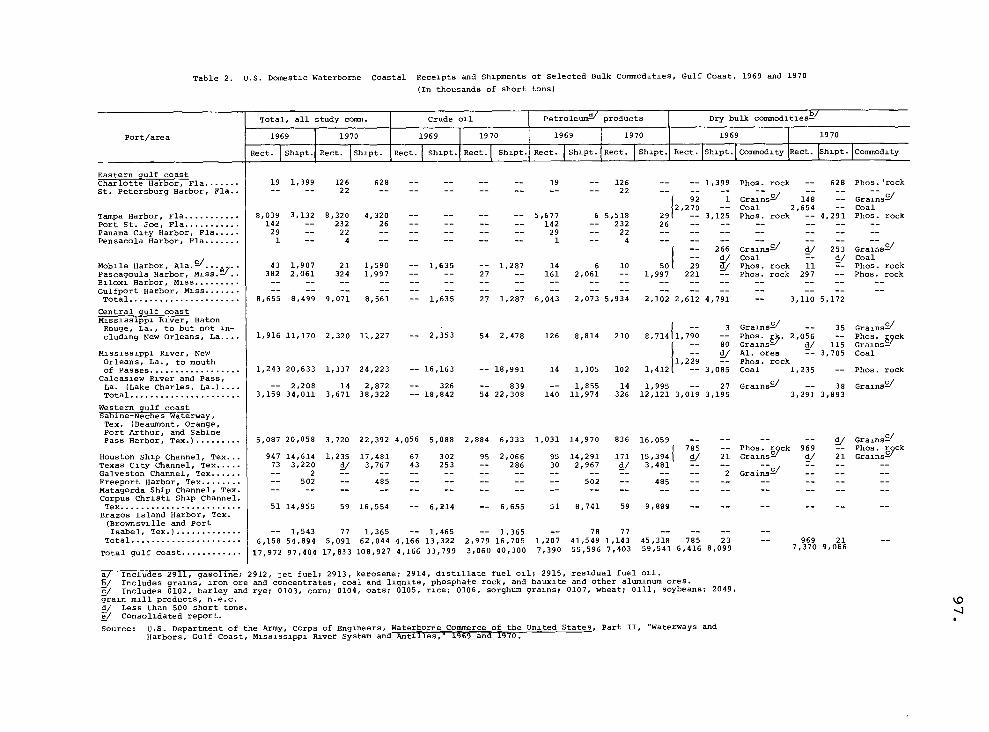
Rect. Shipt. Rect. Shipt. Rect. Shipt. Rect. Shipt. Rect. Shipt. Commodity
Eastern gulf coast Charlotte Ha'rbor, Fla St. Petersburg Harbor, Fla
Tampa Harbor, Fla Port St. Joe, Fla Panama City Harbor, Fla Pensacola Harbor, Fla
Mobile Harbor, Ala. 2/ Pascagoula Harbor, Miss.- Biloxi Harbor, Miss Gulfport Harbor, Miss Total
Central gulf coast Mississippi River, Baton Rouge, La., to but not in-cluding New Orleans, La
Mississippi River, New Orleans, La., to mouth of Passes Calcasiew River and Pass, La. (Lake Charles, La.) Total
Western gulf coast Sabine-Neches Waterway, Tex. (Beaumont, Orange, Port Arthur, and Sabine Pass Harbor, Tex.)
Houston Ship Channel, Tex Texas City Channel, Tex Galveston Channel, Tex Freeport Harbor, Tex Matagorda Ship Channel, Tex Corpus Christi Ship Channel, Tex Brazos Island Harbor, Tex. (Brownsville and Port Isabel, Tex.)
Total
Total gulf coast
19 1,399 126
8,039 3,132 8,320
142 -- 232
29 22
1 4
22
1,916 11,170 2,320 11,227
1,243 20,633 1,337 24,223
Grains- c/
Coal Phos. rock Phos. rock
Phos. rgck Grains2'
Grains -"
1/ Grains' Phos. rock
21 Grains2'
-- 969 d/
Table 2. U.S. Domestic Waterborne coastal Receipts and Shipments of Selected Bulk Commodities, Gulf Coast, 1969 and 1970
(In thousands of short tons)
Total, all study comm. a Petroleum/ Crude oil Dry bulk commodities-
Port/area 1970 1969 1969 1970 1969 1970 1969 1970 1969
Rect. Shipt. Rect. -F171ipt. Rect.IShipt.ICommodity
628 -- -- -- -- 19 -- 126 -- -- 1,399
22 -- -- --
92 1
2,270 --
4,320 -- -- -- -- 5,677 6 5,518 291 -- 3,125
26 -- -- -- -- 142 -- 232 26 -- -- -- -- -- -- -- 29 -- 22 -- -- -- -- __ __ __ -- 1 -- 4 - - -- --
43 1,907 21 1,590 -- 1,635 -- 1,287 14 6 10 382 2,061 324 1,997 -- -- 27 -- 161 2,061 -- -- -- -- -- -- -- -- -- -- -- -- -- -- -- -- -- -- -- -- -- -- --
8,655 8,499 9,071 8,561 -- 1,635 27 1,287 6,043 2,073 5,934 2,102 2,612 4,791
-- 2,353 54 2,478 126 8,814 210 8,714[1,79
-
0 --
-- 80 -- d/
1,229 -- -- 16,163 -- 18,991 14 1,305 102 1,412 -- 3,085
-- 2,208 14 2,872 -- 326 -- 839 -- 1,855 14 1,995 -- 27
3,159 34,011 3,671 38,322 -- 18,842 54 22,308 140 11,974 326 12,121 3,019 3,195
5,087 20,058 3,720 22,392 4,056 5,088 2,884 6,333 1,031 14,970 836 16,059 -- --
1 785 -- 947 14,614 1,235 17,481 67 302 95 2,066 95 14,291 171 15,3941 1/ 21 73 3,220 d/ 3,767 43 253 -- 286 30 2,967 d/ 3,481 -- -- -- 2
__ -- -- -- -- -- -- -- -- -- -- 2
-- 502 -- 485 -- -- -- -- -- 502 -- 485 -- -- -- -- -- -- -- -- -- -- -- -- -- -- -- --
51 14,955 59 16,554 -- 6,214 -- 6,655 51 8,741 59 9,899
-- 1,543 77 1,365 -- 1,465 -- 1,365 78 77 6,158 54,894 5,091 62,044 4,166 13,322 2,979 16,705 1,207 41,549 1,143 45,318 785 23 17,972 97,404 17,833 108,927 4,166 33,799 3,060 40,300 7,390 55,596 7,403 59,541 6,416 8,099
Phos. rock --
Gra;;s2/ 14; Coal 2,654 -- Phos. rock -- 4,291
--
Gra;:lsc/--
d/ 253 Coal d/ Phos. rock 11 7- Phos. rock 297 --
--
- 3,110 5,172
Grains2/ 35 Grains2/
Phos. r4. 2,056 -- Phos. Egck Grains 2' d/ 115 Grains- Al. ores 7- 3,705 Coal Phos. rock Coal 1,235 Phos. rock
Grains-" -- 38 Grains2/ 3,291 3,893
969 21 7,370 9,066
■■ •■
1 -- 266 - d/
50 29 a/
1,997 221 --
628 Phos.'rock
Grains=, Coal
Phos. rock
a/ Includes 2911, gasoline; 2912, jet fuel; 2913, kerosene; 2914, distillate fuel oil; 2915, residual fuel oil. 13/ Includes grains, iron ore and concentrates, coal and lignite, phosphate rock, and bauxite and other aluminum ores. c/ Includes 0102, barley and rye; 0103, corn; 0104, oats; 0105, rice; 0106, sorghum grains; 0107, wheat; 0111, soybeans; 2049, grain mill products, n.e.c. d/ Less than 500 short tons. e"/ Consolidated report.
Source: U.S. Department of the Army, Corps of Engineers, Waterborne Commerce of the United States, Part II, "Waterways and Harbors, Gulf Coast, Mississippi River System and Antilles," 1965 and 1970.
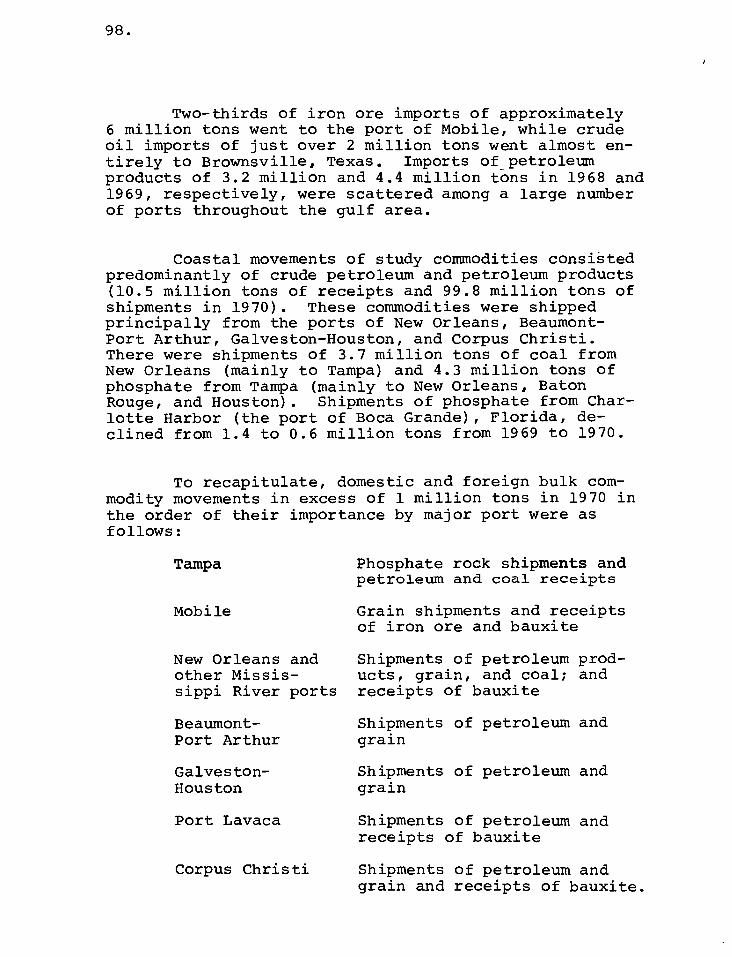
Tampa
Mobile
New Orleans and other Missis-sippi River ports
Beaumont-Port Arthur
Galveston-Houston
Port Lavaca
98.
Two-thirds of iron ore imports of approximately 6 million tons went to the port of Mobile, while crude oil imports of just over 2 million tons went almost en-tirely to Brownsville, Texas. Imports of petroleum products of 3.2 million and 4.4 million tons in 1968 and 1969, respectively, were scattered among a large number of ports throughout the gulf area.
Coastal movements of study commodities consisted predominantly of crude petroleum and petroleum products (10.5 million tons of receipts and 99.8 million tons of shipments in 1970). These commodities were shipped principally from the ports of New Orleans, Beaumont-Port Arthur, Galveston-Houston, and Corpus Christi. There were shipments of 3.7 million tons of coal from New Orleans (mainly to Tampa) and 4.3 million tons of phosphate from Tampa (mainly to New Orleans, Baton Rouge, and Houston). Shipments of phosphate from Char-lotte Harbor (the port of Boca Grande), Florida, de-clined from 1.4 to 0.6 million tons from 1969 to 1970.
To recapitulate, domestic and foreign bulk com-modity movements in excess of 1 million tons in 1970 in the order of their importance by major port were as follows:
Corpus Christi
Phosphate rock shipments and petroleum and coal receipts
Grain shipments and receipts of iron ore and bauxite
Shipments of petroleum prod-ucts, grain, and coal; and receipts of bauxite
Shipments of petroleum and grain
Shipments of petroleum and grain
Shipments of petroleum and receipts of bauxite
Shipments of petroleum and grain and receipts of bauxite.

III. MAJOR HARBORS AND CHANNELS
Table 3 gives depths, widths, and lengths of various channels in the major gulf coast harbors and waterways as identified by the Corps of Engineers. The alignment of these channels is shown in figures 7 through 16.
In general, depths of 40 feet prevail with the principal exception of Tampa (34 feet), Beaumont (36 feet), Freeport (36 feet), and Brownsville (36 feet). However, Corpus Christi and Freeport have authorized depths of 47 feet and 45 feet, respectively, for en-trance and harbor channels.
99.

30 450 40 800
11.4 13.1 17.5 20.1
Tampa, Florida Egmont Bar Channel Mullet Key Channel Tampa Bay Channel
h/ Gadsden Point Channel= Hillsborough Bay Channel/.. Port Sutton Channel Sparkman and Ybor Channel/ Port Tampa Channels2/
Mobile, Alabama Entrance Channel Main Ship Channel Mobile River Channel Theodore Ship Channel
Mississippi River South Pass Southwest Pass Head of passes to New Or
Port of New Orleans
New Orleans to Baton Rouge Mississippi River-Gulf Outlet
Table 3. Project Dimensions of Major Channels
Location' Depthl Width Length Name of channel
Feet Naut. miles
Stat. miles
Stat. miles
36 600 3.9 4.5 (7.2)-(2.7) 34 500 2.9 3.3 2.1 - 5.4 34 400 13.6 15.7 5.4 -21.1 34 400 3.1 3.6 21.1 -24.7 3440 6.6 7.6 24.7 -32.3 34SY 0 280LI/
1.5 1.8 32.3 -34.1 34 400f/ 3.1 3.6 32.3 -35.9 34 400 7.7 8.9 21.1 -30.0
42 600 1.4 1.6 (4.9)-(3.3) 40 400 25.2 29.0 1.5 -30.5 40 500-775 f/ 4.1 4.7 30.5 -35.2 40 400-300- 6.3 7.3 18.2 -25.5
(13.1)- 0.0 (20.1)- 0.0
40 1,000 75.2 86.7 0.0 -86.7 40 5001 14.9 17.2 86.7-103.9 35 1,500 40 500 112.4 129.6 103.9-223.5
36 500 65.3 75.4 0.0 -75.4
continued--

42 800 40 800 40 800-500 40 500f/ 40 500 36 200-250
36 400
12.8 14.7 (18.1)- (3.4)
3.0 3.4 (3.4)- 0.0
3.5 4.1 0.0 - 4.1
4.8 5.6 4.1 - 9.7
5.5 6.2 9.7 - 15.9
1.7 2.0 15.7 - 17.7
10.1 11.2 15.9 - 27.1
30 200 3.9 4.5 27.1 - 31.6
350f/ 36 16.6 18.3 27.1 - 45.4 30 200 8.1 9.3 31.6 - 40.9
42 800 4.2 4.9 (9.3)- (4.4) 42 800 1.4 1.6 (4.4)- (2.8) 40 800 2.4 2.8 (2.8)- 0.0 40 80O 0.8 1.0 0.0 - 1.0 f/ 40 400- 5.9 6.8 1.0 - 7.8
40 400 31.1 35.8 1.0 - 36.8 H o H
40 400-300f/
10.6 12.2 36.8 - 49.0 •
f/ 36 300- 3.3 3.8 49.0 - 52.8
continued--
Table 3. Project Dimensions of Major Channels continued--
Location!" Length Depth Width Name of channel
Feet Naut. miles
Stat. miles
Stat. miles
Sabine Lake, Texas Sabine Bank Channel Sea Bar Channel Sabine Pass Jetty Channel Sabine Pass Channel Port Arthur Canal Taylors Bayou Channel Sabine-Neches Canal to mouth of Neches River
Mouth Neches River to mouth Sabine River
Neches River Channel to Beaumont Sabine River Channel
Galveston Bay, Texas Entrance Channel Outer Bar Channel Inner Bar Channel Bolivar Roads Channel Texas City Channel Houston Ship Channel: Bolivar Roads to Carpen- ter Bayou
Carpenter Bayou to Sims Bayou
Sims Bayou to Houston Turning Basin

471-3/, 400g 4541/ 40021 v , 452' 350-375 .1
38 300 36 300-200
36 200 f/ 36 200-
471/ 1/ 700 47-45=1 700-600
m 45 /- 400
m/ 400 45m/
45- 400-39q1/
45E/ 300-
300 200 f/ 200- f/ 200-
2.9 3.3
0.8 0.9
2.3 2.7
2.7 3.1 10.8 12.4
7.4 8.5
1.1 1.2
6.0 7.2
1.5 1.7
18.5 21.3
1.5 1.7
5.6 6.5
5.0 5.8
1.9 2.2
2.2 2.5 12.4 14.3
2.1 2.4
(3.3) - 0.0 0.0 - 0.9 0.9 - 3.6
(3.1) - 0.0 0.0 -12.4
12.4 -20.9 20.9 -22.1
(6.8) - 0.4 0.4 - 2.1
2.1 -23.4
23.4 -25.1 25.1 -31.6 11.5 -17.3
(2.2) - 0.0 0.0 - 2.5 2.5 -16.8 4.0 - 6.4
38 36 36 36
Table 3. Project Dimensions of Major Channels continued--
Depth Width Length Location2/ Name of channel
Feet Naut. miles
Stat. miles
Stat. miles
Freeport, Texas Outer Bar Channel Jetty Channel Inland Channel
Matagorda Bay, Texas Sea Bar and Jetty Channel Matagorda Ship Channel Lavaca Bay Channel (from light 48 to 76)
Point Comfort Harbor Channel
Corpus Christi Bay Outer Bar Channel Jetty Channel Port Aransas-Corpus Christi Waterway: Bay section Inland section to Avery Point
From Avery Point to end La Quinta Channel
Brownsville, Texas Entrance Channel Laguna Madre Channel Brownsville Ship Channel Port Isabel Channel
continued--
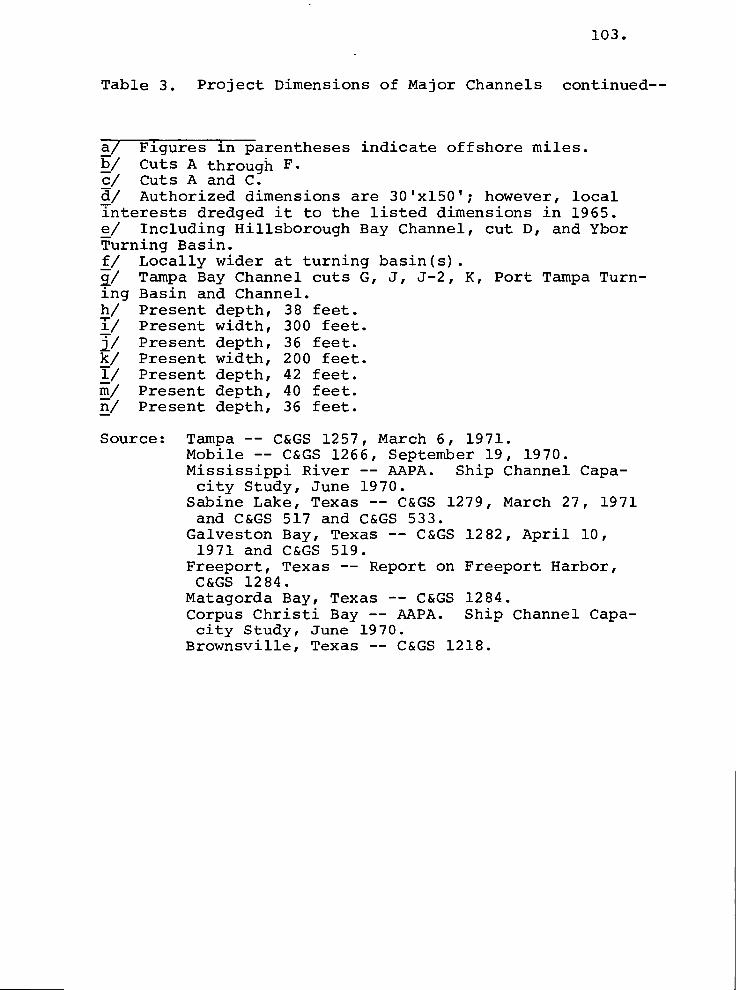
103.
Table 3. Project Dimensions of Major Channels continued--
a/ Figures in parentheses indicate offshore miles. b/ Cuts A through F. c/ Cuts A and C. a/ Authorized dimensions are 30'x150 1 ; however, local interests dredged it to the listed dimensions in 1965. e/ Including Hillsborough Bay Channel, cut D, and Ybor Turning Basin. f/ Locally wider at turning basin(s). 2/ Tampa Bay Channel cuts G, J, J-2, K, Port Tampa Turn-ing Basin and Channel. h/ Present depth, 38 feet. 1/ Present width, 300 feet. i/ Present depth, 36 feet. k/ Present width, 200 feet. 1/ Present depth, 42 feet. m/ Present depth, 40 feet. n/ Present depth, 36 feet.
Source: Tampa -- C&GS 1257, March 6, 1971. Mobile -- C&GS 1266, September 19, 1970. Mississippi River -- AAPA. Ship Channel Capa-city Study, June 1970.
Sabine Lake, Texas -- C&GS 1279, March 27, 1971 and C&GS 517 and C&GS 533.
Galveston Bay, Texas -- C&GS 1282, April 10, 1971 and C&GS 519.
Freeport, Texas -- Report on Freeport Harbor, C&GS 1284.
Matagorda Bay, Texas -- C&GS 1284. Corpus Christi Bay -- AAPA. Ship Channel Capa-city Study, June 1970.
Brownsville, Texas -- C&GS 1218.

bor Channel
5 C.L. Railroad Bridg
Sparkman Channel
East Bay OLD TAMPA
BAY
GULF OF MEXICO
Port Tampa Turning Basin
Port Tampa Channel
ST. PETERSBUR.G
Hillsborough Bay Channel
PORT MANATEE
Mullet Key Channel
Mullet
Key
5 M I *
Egmont Bar Channel
mi Egmont
Key
0 an
5 10 0
TAMPA
Scale of Statute Miles
LEGEND
• Oil facility 0 Phosphate rock facility
FIGURE 7. CHANNELS AND BULK HANDLING FACILITIES, TAMPA HARBOR, FLORIDA
Robert R Nathan Associates, Inc.

Railroad Brklae
Three Mile Creek
Bankhead Tunne
ochrane Bridge
Industrial Canal
ct: moen,g
Ho
-c
ers sland 04 Channel 11'
Mobile River '
) '211
Theodore Industrial Park
Theodore Ship Channel
Great Point Clear
MOBILE
Main Ship Channel
BON SECOUR BAY
Mississippi Sound Intracoastal Waterway
Dauphin Island Fort Morgan
0 mi.
I Sand Island
Entrance Channel/ mi
FIGURE 8. CHANNELS AND BULK HANDLING FACILITIES, MOBILE HARBOR, ALABAMA
LEGEND GULF OF
• Oil facility • Grain facility
Dry bulk facility Al Bauxite, alumina facility • Iron ore facility
Scale of Statute Miles
5 0 10
Mobile Point
MEXICO
Robert R Nathan Associates, Inc

Port Sulphur ks,..\,, Ni- \f‘ BRETON SOUND
‘
‘ 1 BARATARIA
1
It I BAY
I
GULF OF MEXICO
GARDEN ISLAND
BAY
Scale of Statute Miles
5 10 15 0 20 =
Robert R. Nathan Associates, Inc
FIGURE 9. MISSISSIPPI RIVER DELTA PASSES, LOUISIANA

7 I Lake Pontchartrain
Inner Harbor Navigational Canal Lock
Chef Menteur
Pass CHANDELEUR SOUND
CHANDELEUR ISLAND
BRETON SOUND GULF OF MEXICO
Scale of Statute Miles
5 10 15 20
NEW ORLEANS
LEGEND
• Grain facility a Dry bulk facility
Robert R Nathan Associates, Inc FIGURE 10 MISSISSIPPI RIVER DELTA, NEW ORLEANS AND VICINITY

17... aton Rouge R R and Highway Bridge
BATON ROUGE
230 /m..
Interstate Highway No 10 Bridge
Port Allen
220
240 nu
200 mi
LAKE PONTCHARTRAIN
Burnside
170 1.77
Paris Road Bridge
Gramercy
/60 ml
\93
a\ 00'1
\lot of,„03 /*-
150 ml /30 mi
ames Ascension-St Bridge
LEGEND
• Oil facility • Grain facility ESDry bulk facility RI Coal facility a Bauxite, alumina facility
/20 ml
80 mi
110 m/
Huey P Long Bridge /00 m/
Greater New Orleans Highway Bridge
Mississippi River-Gulf Outlet
Scale of Statute Miles
5 10 15 20
Robert R Nathan Associates, Inc
FIGURE 11 BULK HANDLING FACILITIES, MISSISSIPPI RIVER FROM NEW ORLEANS TO BATON ROUGE, LOUISIANA

LEGEND
• Oil facility A Grain facility
ORANGE. _ 40 9 nu.
074- 40 nu
K.G.S R.R Bridge
...•;>gi 45 4 mi. BEAUMONT
25 rm Sabine-Neches Canal
abine River
Neches River Channel
40 35 mi Rainbow Highway Bridge )("111---Sabine River Channel
35 nu
30 nu
PORT ARTHUR
Taylor Bayou Channel
See blowup Port Arthur Harbor Basins
/
st15g, /
oe">\ <eV
\(:t/
SABINE LAKE
/5 mt
20 mi
oley Avenue Highway Bridge'
Port Arthur Canal
10 nu.
Sabine Pass Channel
5 ml SABINE PASS
SABINE
Sabine Pass Jetty Channel
MI
Taylors Bayou Turning Basin
Sabine Neches Canal
East Turning West I L. Basin Turning Boni
Port Arthur 'Canal
Scale of Statute Miles 0 1 1 2
BLOWUP OF PORT ARTHUR HARBOR BASINS
Sea Bar Channel
GULF OF MEXICO ml
-10 ml.
Sabine Bank Channel
------ sone
Scale of Statute Miles
0 5 111/-11111E—M
Ac. r'
c Bank 45
Robert R Nathan Associates, Inc
FIGURE 12 CHANNELS AND BULK HANDLING FACILITIES, PORT ARTHUR, BEAUMONT, AND ORANGE HARBORS, TEXAS

Carpenter Bayou
HOUSTON 40 mi
BAYTOWN 45 nu
Washbian Tunnel
Sims Bayoil
Outer Belt Freeway Badge
Baytown-La Porte Tunnel
.••••
TEXAS CITY
Texas City Channel nn
LEGEND
• Oil facility • Grain facility ▪ Dry bulk facility
GALVESTON
. N. ■
1/
GULF OF MEXICO
Brazos River
FREEPORT
ti
Lt
Scale of Statute Miles
5 10 15
Robert R Nathan Associates, Inc
FIGURE 13 CHANNELS AND BULK HANDLING FACILITIES, TEXAS CITY,
BAYTOWN, HOUSTON AND FREEPORT HARBORS, TEXAS

ot
OINT COMFORT, -? . .i.c•sio
Light '76'-
PORT LAVACA',
Lavaca Bay Channe
ea Bar and jetty Channel
GULF OF MEXICO
Scale of Statute Miles LEGEND
0 5 10 15 20 A Bauxite, alumina facility
FIGURE 14 CHANNELS AND BULK HANDLING FACILITIES, PORT LAVACA HARBOR, TEXAS
Robert R Nathan Associates, Inc.

1 / ‘,. '' . ..,^1' 1 .C. ;-, 1 f---
'7 ' • •̀.4.? LAGUNA MADRE
tip LA QUINTA
Viola Turning
Basin
Tule Lake, Turning Basin
Avery Pt.
Cr Harbor Turning Basin ridge
NUECES BAY
La Quinta Channe
orpus Chnsh Turning Basin
orpus Christi Harbor Bridge
/5 'xi •
Ox
,/,‘■
00,0
5
20 mi
Port Aransas-Corpus Chnsh Waterway
/5mi /
%
%, CORPUS CHRISTI BAY
1
/ ?ix st%
Outer Bar and Jetty Channel
Industrial Canal
Tide Lake Channel
GULF OF MEXICO
Scale of Statute Miles
LEGEND
• Oil facility • Grain facility A Bauxite, alumina facility
CORPUS CHRISTI
Robert R Nathan Associates, Inc 0 1 2 3 4 5 10 —7=
Intracoastal Waterway
FIGURE 15 CHANNELS AND BULK HANDLING FACILITIES, PORT ARANSAS AND CORPUS CHRISTI HARBORS, TEXAS

-o
• X
mi PORT ISABEL
Port Isabel Channel
Entrance Channel
Laguna Madre Channel
Brownsville Ship Channel
15
BROWNSVILLE
MEXICO
Scale of Statute Miles
•A TEXAS GULF OF MEXICO
LEGEND 0 5 10 15 20
• Oil facility • Grain facility
Robert R. Nathan Associates, Inc.
FIGURE 16. CHANNELS AND BULK HANDLING FACILITIES, BROWNSVILLE HARBOR

115.
IV. TERMINAL FACILITIES
The locations of individual relevant bulk han-dling facilities in each major port are shown in fig-ures 7 through 16. Detailed descriptive information on these facilities and related storage facilities appear in the appropriate volume of the port series published by the U.S. Army Corps of Engineers.
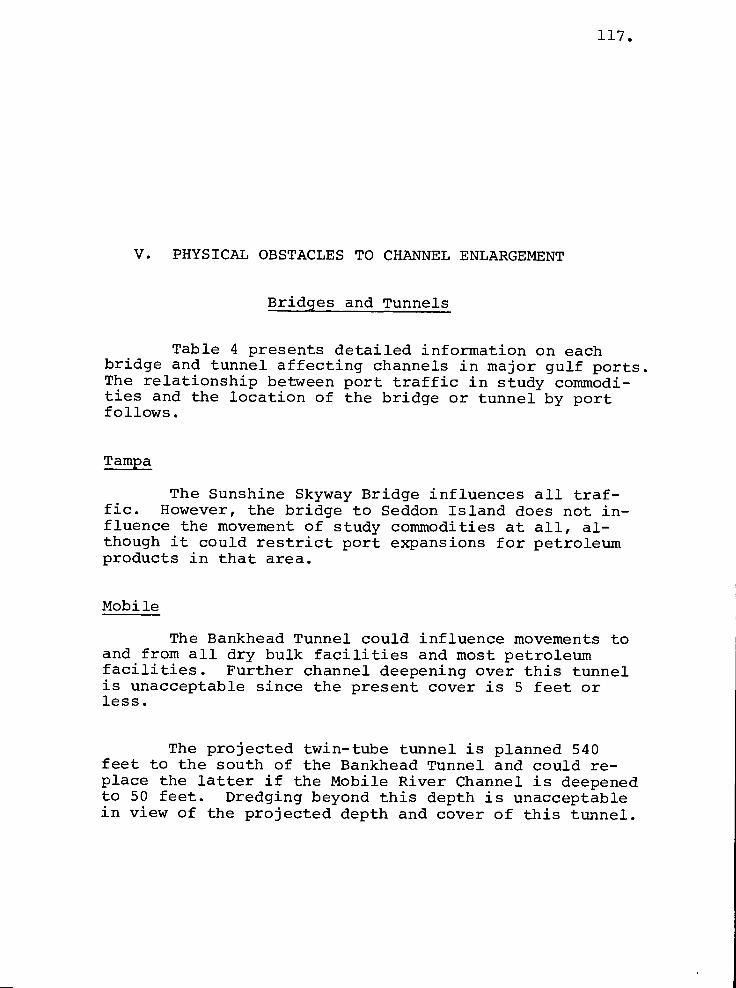
117.
V. PHYSICAL OBSTACLES TO CHANNEL ENLARGEMENT
Bridges and Tunnels
Table 4 presents detailed information on each bridge and tunnel affecting channels in major gulf ports. The relationship between port traffic in study commodi-ties and the location of the bridge or tunnel by port follows.
Tampa
The Sunshine Skyway Bridge influences all traf-fic. However, the bridge to Seddon Island does not in-fluence the movement of study commodities at all, al-though it could restrict port expansions for petroleum products in that area.
Mobile
The Bankhead Tunnel could influence movements to and from all dry bulk facilities and most petroleum facilities. Further channel deepening over this tunnel is unacceptable since the present cover is 5 feet or less.
The projected twin-tube tunnel is planned 540 feet to the south of the Bankhead Tunnel and could re-place the latter if the Mobile River Channel is deepened to 50 feet. Dredging beyond this depth is unacceptable in view of the projected depth and cover of this tunnel.

Sunshine Skyway Br Br. to Seddon la y Bankhead Tunnel—
Planned Twin Tube Tun Cochrane Br L & N Railroad Terminal Railroad Greater New Orleans Hwy. Br Huey P. Long Br
Ascension-St. James Bridge Baton Rouge Hwy. Br Baton Rouge Railroad & Hwy. Br
Paris Rd. Hwy. Br
Foley Avenue Br Rainbow Br Kansas City Southern Railroad Br
Bay Town Tunnel
Outer Belt Freeway Br Washburn Tunnel, Pasadena Corpus Christi Harbor Br
Upper Harbor Br
U.S. Hwy. 19 S.C.L. Railroad U.S. Hwy. 9 & I-10 I-10 U.S. Hwy. 31,90,98 Railroad Railroad
Expressway U.S. Hwy. 90 & RR. N.O.P.B.-
Highway State Hwy. 87
K.C.S. RR. Hwy. Hwy.
Hwy.
U.S. Hwy. 181 Hwy. and RR.
800 110
300 56 53
1,400 750
b/ c 151— -140
/— 5d/
b/ — f/ 4617)/
-42 57— -50
135h/ 10/ 4d/
i 170 /,- -150—j/ , 1531/-1332/
Fixed Bascule
-- --
Vert. lift Swing Swing
Fixed Fixed
Fixed Fixed
Fixed
664 600
138 172
h/ 145—
Table 4. Review of Relevant Bridges and Tunnels in Major Gulf Ports
Name Kind
Navigation
Horizontal clearance
opening
Vertical2/
clearance
Location Bay, river or channel Purpose for which used
11116 U.S. Hwy. 190 & RR. KiC.S.L. State Hwy. 47
(stat. m.)
7 Tampa Bay, Fla.
37 Garrison Chan., Tampa
33 Mobile River, Ala.
33 Mobile River, Ala.
36 Mobile River, Ala.
36 Three Mile Creek, Mobile
36 Three Mile Creek, Mobile
96 Miss. River, New Orleans
106 Miss. River, Jeff. Parish, La.
Miss. River, St. James
167 Parish, La.
229 Miss. River, B. Rouge
234 Miss. River, B. Rouge
69 Intracoastal WW/M.R.- G.O.
18 Sabine-Neches Can. ,Tex.
29 Neches River, Tex.
47 Neches River, Tex. 28 Houston Ship Ch., Tex. 40 Houston Ship Ch., Tex.
44 Houston Ship Ch., Tex. Corpus Christi Ship
23 Channel, Tex. 26 Tule Lake Ch., C.C.
feet
750 168-41-133V 1/ 1/ 500 172— -128d-
748 110i/-651/
Fixed Fixed
Vert. lift 200 --
Fixed
Fixed 300-400 138-116 Vert. lift 300 138
a/ At mean high water. b/ At the center. c/ At the side fenders. d/ In closed position. e/ The twin tunnel is planned 540 feet to the south. f/ At west edge of channel. g/ At the edges. h/ In raised position. T./ Average low water plane. 1/ 1927 high water.

119.
The Cochrane Bridge does not influence the move-ments of ocean vessels carrying study commodities. How-ever, it could restrict port expansions to the north.
The L&N and Terminal Railroad Bridges influence all movements to the Industrial Canal (Alabama State Docks Bulk Material Wharf).
New Orleans, Burnside, and Baton Rouge
Five bridges (Greater New Orleans Highway Bridge, Huey P. Long Bridge, Ascension-St. James Bridge, Baton Rouge Highway Bridge, and Baton Rouge Railroad and High-way Bridge) cross the Mississippi River between New Orleans and Baton Rouge. The vertical clearances of the first four bridges differ only slightly. The Baton Rouge Railroad and Highway Bridge is situated to the north of Baton Rouge and only influences traffic to and from one petroleum facility.
The Paris Highway Bridge crosses the traffic moving through the Mississippi River-Gulf Outlet to and from the port of New Orleans bulk facility.
Beaumont
Three bridges (the Foley Avenue Bridge, Rainbow Bridge and Kansas City Southern Railroad Bridge) cross the ship channel to Beaumont. Although the latter bridge at Beaumont does not presently affect the traffic movements of study commodities, it might influence planned port expansions to the north.
Houston
Two tunnels (the Bay Town Tunnel and Washburn Tunnel, Pasadena) cross the Houston Ship Channel, and one bridge, the Outer Belt Freeway Bridge, is presently under construction. The further bridges or tunnels are located above the mouth of the channel, the less they will influence the traffic.

120.
Corpus Christi
The Corpus Christi Harbor Bridge influences traf-fic to all facilities except four oil facilities and the Reynolds Metals dry bulk facility. The Upper Harbor Bridge influences traffic to two oil terminals and one grain terminal.
Other Ports
There are no bridges across the navigation chan-nels to Theodore Industrial Park, Pascagoula, Port Arthur, Galveston, Texas City, Freeport, Point Comfort, Port Aransas, La Quinta, and Brownsville. However, a bridge across the Bolivar Roads between Galveston and the Bolivar Peninsula is under consideration.
Pipelines and Cables
Numerous pipelines and cables cross the naviga-tion channels. Deepening the channels would require deepening or re-laying many of these, the costs of which would be borne by the various owners.
Levees
The distance between levees could become a con-finement for channel widening. This might be a con-straint for the Mississippi River-Gulf Outlet if widen-ing is required beyond 750 feet, although its banks are not occupied by industry and the channel lies in easily dredged earth. This could also be the case for the ship channel to Beaumont, which is very narrow in the upper part (approximately 500 to 600 feet wide).
Natural Obstacles
Some hard rock has been encountered during dredg-ing of the navigation channels or in executing core borings in the channels of Tampa. Here limestone was

121.
found, ranging in textural composition from soft and amorphous to very hard and crystalline. The fracture pattern is irregular. No rock was found in Mobile, New Orleans, Port Arthur and Beaumont, Texas City, Galveston, Freeport and Corpus Christi.
The Floridan aquifer is the source of all large ground-water supplies in the Tampa Bay area. The lime-stone forms the principal artesian aquifer.
Tides
Table 5 lists the mean range-1/ of the tides in all major gulf ports. From this tabulation, it is obvious that the tidal variation is insignificant from the standpoint of providing additional water depth in the channels.
1/ Mean range is the difference between mean high wa-ter and mean low water.

1.2 1.5
1. 1 0.7
1.6 1.3 1.3 1.0 0.1
l.5!" - 1.8 /2/
122.
Table 5. Tidal Range Under Ordinary Conditions
(In feet)
Mean range Location
Tampa Bay
Entrance to Tampa Harbor Port Tampa Tampa
Mobile Bay
Lower end Upper end
Mississippi River
Gulf New Orleans Baton Rouge
Sabine Lake
Sabine Pass Port Arthur Beaumont, Orange
Galveston Bay
Outer bar Galveston Harbor Texas City Baytown Houston
Freeport
Corpus Christi Bay
Aransas Pass Corpus Christi
Brownsville
Brazos Santiago
-67- Corps of Engineers. b/ Coast and Geodetic Survey.
1.3 1.5 1.8
1.5 1.0 0.5
b/ 1.12/ - 1.7— 1.0
1.4

123.
APPENDIX A. REVIEW OF STUDIES ON CHANNEL DEEPENING AND PORT EXPANSION
1. Port Sutton and Tampa Harbor, Florida, House Document No. 91-150, 91st Congress, 1st Session, Septem-ber 3, 1969. This document recommends that the main-tenance costs of the approximately 5,000-foot-long chan-nel between Hillsborough Bay Channel and Port Sutton would be borne by the Federal Government. This channel was dredged from 30 to 34 feet by local interests. The first cost would be $9,000, of which $7,000 represents aids to navigation and $2,000, financing the land cost; estimated average annual cost is $9,800. The last fig-ure is based on a 50-year economic life and an interest rate of 3 1/4 percent, resulting in $400, and in addi-tion an annual maintenance cost for dredging of $9,400.
The U.S. Department of Interior, Fish and Wild-life Service has no stated objections to the proposed maintenance work.
2. Survey-Review Report on Tampa Harbor, Florida, U.S. Army Engineer District, Jacksonville, Corps of En-gineers, Jacksonville, Florida, September 5, 1969. This report considers deepening of the present main and branch channels to 38-, 40-, 42-, and 44-foot water depths. It also considers the following alternative locations of port development:
a. Offshore berth (in excess of 8 to 10 miles offshore)
b. Port Manatee, which is located about 20 miles closer to the bay entrance

124.
c. Port Boca Grande, whose entrance to Char-lotte Harbor is about 60 miles south of the Tampa Bay entrance and about 95 miles closer to the Atlantic shipping lanes than the phosphate terminals at Tampa
d. Intraharbor alternatives. The report concludes that deepening the existing channels is economically more attractive than any of the aforementioned alternatives.
The report recommends that all main channels should be deepened 8 feet and widened 100 feet, whereas channels of secondary importance should be deepened only 4 to 6 feet.
The present project was completed in 1965 at a Federal cost of $22.4 million of new work and $5.4 mil-lion of maintenance. In addition, $2.8 million was spent on new work from public works funds, emergency relief funds, and contributed funds. The average annual maintenance cost in the period 1963-68 was $282,000.
The Big Bend, about 7 miles south of Port Sutton, a new terminal and industrial park, is now under devel-opment by the Tampa Electric Company and other private interests. New phosphate handling terminals were re-cently built between Port Sutton and East Bay at a cost of approximately $30 million. These new terminal de-velopments provide a greater centralization of terminals than has existed heretofore. Nearly 80 percent of deep-draft cargo tonnage will be concentrated in the areas adjacent to Hooker Point, East Bay, and Port Sutton. Present investment in marine terminals and industries at Tampa is estimated to total in excess of $250 million. New installations now in progress or recently completed will represent an additional investment of more than $350 million.
In this report, an under-keel clearance of 4 feet allowing for vessel squat, wind and wave action has been used. However, although the existing project depth is 34 feet and the draft of the vessel should not be in excess of 30 feet, vessels ranging in a fully

125.
loaded draft between 40 and 48 feet are already calling. Paragraph 48 states that "there is no basis to expect that tankers in excess of 48,000 DWT would be used for petroleum deliveries to Tampa, since the economy of this class of tankers is sufficiently attractive to warrant their use of these movements."
The estimated first cost to deepen the channels to indicated depths is approximately $71 million. The estimated annual maintenance cost would be $200,000 in addition to amounts presently required.
First cost is based on an average dredging cost per cubic yard of $.80 for the main channels, $1.00 for Hillsborough Bay Cut D Channel, $1.70 for Sparkman Channel, $2.30 for Ybor Channel, and $.90 for Port Tampa Channel and Basin. The estimated annual dredging costs for the above-mentioned channels are $192,000 for the main channels and $2,000 for each of the remaining channels. Of the total cost involved, 99.4 percent is Federal and 0.6 percent is non-Federal cost.
3. Tampa Harbor, Florida, House Document No. 91-401, 91st Congress, 2d Session, October 12, 1970. This House Document includes comments of the Board of Engineers for Rivers and Harbors, of the Office of Management and Budget, and of the Department of Natural Resources of the State of Florida on report no. 2 above.
The Office of Management and Budget notes that the recommended project includes 5 feet of additional depth for "safety and ease of navigation." It states that it has no basis for objecting to such clearance, noting that 3 feet is presently provided for the exist-ing channel depths, with a minimum reporting of vessel damage. The office states that it understands that the 5-foot clearance is mainly a value judgment based on minimum engineering and economic analysis and notes that the additional 2 feet will increase the project cost an estimated $30 million. The office states that the Corps of Engineers should determine more accurately the necessary requirements for navigational clearance before funds of this magnitude are expended.

126.
The comments of state and Federal agencies per-taining to dredging, spoil placement, pollution control, protection and improvement of marine and fresh water fish and wildlife resources, and other ecological considera-tions relating to modifications of Tampa Harbor are con-tained in Appendix D of the project report. Those com-ments with which the Department of Natural Resources of the State of Florida is in agreement are not unfavorable to the project.
The Corps of Engineers, therefore, has the obli-gation, with respect to further port improvements of Tampa Harbor, to
a. Justify the additional $30 million required for the additional 2 feet of under-keel clearance of vessels
b. Execute an environmental study show-ing the impact of former spoil areas on the environment.
In addition the Corps of Engineers was requested to present data on an offshore location more detailed than presented in report no. 2. Funds have not yet been appropriated to commence work on it.
The Board of Engineers for Rivers and Harbors notes that "the recommended project depth has been formulated with an allowance for the design vessel of 4 feet at mean high water to take care of vessel trim, squat, and clearance under the keel. This allows about 3 feet at mean low water. The Board believes that an allowance of at least 5 feet at mean low water is neces- sary for the safety and ease of navigation. Consequently, the Board concludes that a depth of 46 feet should be provided across Egmont Bar; channels 44 feet deep should be provided in the main channels in lieu of 42 feet; channels 42 feet deep should be provided in Hillsborough Cut D, Sparkman, and Port Tampa Channels; and a channel 40 feet deep should be provided in Ybor Channel. The total estimated first cost of this plan is $102,800,000, of which $101,920,000 is the Federal cost, including $860,000 for navigation aids." The total cost figure

127.
of $102.8 million was later re-estimated at $112 million. The estimated construction time is 10 years.
Two dredgers would execute the works, with a small dredge preceding a larger dredge. The small one would build up a containment dike parallel to the chan-nel. A 30-inch dredge with a 1-mile-long floating pipe-line would follow the small one and construct the chan-nel, dumping the dredged material behind the dikes. The estimated capacity of the 30-inch dredge is 1 million cubic yards per month, resulting in a cost of $.55 per cubic yard. The estimate was supervised by a Dutch dredging expert. The material dredged would be clay, sand, shells and limestone.
Dredging cost at Port Manatee was estimated at $.20 per cubic yard. Dredging cost at Port Sutton was estimated at $.50 per cubic yard, including removal of some limestone.
4. Mobile Harbor, Alabama (Theodore Ship Chan-nel), House Document No. 91-335, 91st Congress, 2d Ses-sion, May 6, 1970. The plan recommended in this docu-ment provides for an access channel 40 feet deep, 400 feet wide, and 5.3 miles long from the Mobile Ship Channel to the western shore of Mobile Bay, and a 40- foot-deep and 300-foot-wide land-cut channel 1.9 miles long to Theodore Industrial Park, with anchorage and turning basins. Some consideration was given to an alternative plan which would provide for an access channel the same as recommended but extending only to a turning basin near the shoreline, where port facili-ties would be constructed on land created by material dredged from the channel. This alternative would not include the recommended land-cut channel to the indus-trial park.
Both the recommended and alternative projects' total estimated costs are about the same, with the Federal share of the cost substantially greater in the recommended plan. The land-cut channel portion of the recommended plan, which maximizes net benefits, would eliminate double handling and transfer of commodities to and from a big iron plant at the industrial park.

128.
In view of the dependency of this portion of the project upon commerce from a single industry, the Bureau of the Budget suggests that further consideration should be given to the alternative plan during preconstruction planning of the project, if authorized.
The comments of the Department of the Interior include additional recommendations with respect to the impact of this project on the environment. The addition-al recommendations include:
a. Development of a model of Mobile Harbor enabling the study of the impacts of the project on fresh-water flows and existing tidal current patterns of the harbor
b. The location of spoil sites as feasible on upland areas not valuable as nursery areas for fish and wildlife
c. Compilation of a comprehensive plan of waste water collections, treatment, and disposal to be developed prior to con-struction.
The Department of Health, Education and Welfare comments that the detrimental effect of the proposed project on the shellfish harvesting industry is ex-pected to be minimal.
The first cost of the project was estimated at $9,164,000, of which $7.9 million is Federal cost and $1.3 million is non-Federal cost. The estimated annual operation and maintenance cost is $252,000, of which $10,000 is a non-Federal cost. The total cost to the Coast Guard for new installations would be $300,000, and an annual maintenance cost of $12,000 would be in-curred in addition to the above-mentioned figures.
Work on the latest modification of Mobile Harbor was completed in July 1965. As of June 30, 1968, total cost for the existing and prior projects was $32,139,000, of which $14,489,000 was for new work and $17,650,000 for maintenance. Maintenance during the last 5 years

129.
averaged $605,000 annually. During a portion of this period, the channel was maintained only to a depth of 36 feet. Maintenance of the 40 foot project averaged about $810,000 annually.
The State Docks Department has planned the con-struction of a modern public bulk material handling facility in the industrial park. The new plant report-edly will have an initial unloading capacity of 2,000 tons per hour. It will serve the iron ore reduction plant now under construction and will supplement the existing bulk handling plant on Mobile River in import-ing and distributing iron ore to steel mills located principally at Birmingham and Gadsden. Private ter-minals will be constructed by the Alabama Refining Com-pany for the handling of inbound crude oil and outbound products, and by McWayne Cast Iron Company for unloading oyster shell and coal and for loading pig iron. The prospective commerce of this industrial plant is mainly iron ore and secondary crude oil, pig iron, and petroleum products.
The two alternative plans considered in this docu-ment deal with four different water depths: 38, 40, 42, and 45 feet.
5. Review of Reports on Sabine-Neches Waterway, Texas, U.S. Army Engineer District, Galveston, Corps of Engineers, Galveston, Texas, March 1962, Revised May 18, 1962. This report requests deepening of the former 36- foot channels to Port Arthur and Beaumont and the exist-ing 30-foot Sabine River Channel to Orange to a depth of 40 feet. The 4-foot deepening of the channels serving Port Arthur and Beaumont was authorized, but the 10-foot deepening of the channel to Orange has not yet been authorized. The activities of the harbor of Orange are primarily related to chemical and shipbuilding industries, with some shipments of agricultural products.
The unit cost used for dredging ranges from $0.14 to $0.35 per cubic yard, based on 1962 levels. No borings or soil data are presented.

130.
6. Review of Reports on Galveston Harbor and Channel, Texas (Galveston Channel 40-foot project), U.S. Army Engineer District, Galveston, Corps of Engineers, Galveston, Texas, April 10, 1970. This report recom-mends deepening of the existing 36-foot channel by 4 feet. The estimated first cost is $1,600,000. The length of the 36-foot channel is 20,700 feet, or 4.1 statute miles. The results of 19 borings to a depth of 50 feet are presented. The unit cost used for dredging is $0.35.
7. Review of Reports on Texas City Channel, Texas (Industrial Canal), U.S. Army Engineer District, Galveston, Corps of Engineers, Galveston, Texas, Febru-ary 18, 1970. This report deals with the industrial barge canal which is located southwest of the Texas City Channel Turning Basin. The Federal project pro-vides for a canal 16 feet deep, 125 feet wide, and 1.6 miles long (between mile 7.5 and mile 9.2). In the past, local interests dredged this canal to a depth of 34 feet, a width of 200 feet, and a length of 9,908 feet (1.9 miles). This report recommends the channel dimensions to be 40 feet deep and 250 to 350 feet wide.
In addition to the deepening and widening of the Industrial Canal, the report also recommends widening of the Texas City Channel (figure 13) Turning Basin from 1,000 to 1,200 feet, and widening of the Texas City Channel from 400 to 600 feet from mile 0.0 to mile 1.8 and to 500 feet from mile 1.8 to mile 6.7.
The estimated first cost to the United States of all recommended new work, exclusive of navigation aids, is $1,625,000, excluding $60,000 that has already been expended for surveys and studies. The estimated increase in annual maintenance cost is $37,300, exclusive of nav-igation aids.
The report considers three plans. Plan I pro-vides a depth of 34 feet and a width of 200 to 250 feet; Plan II, a depth of 40 feet and a width of 250 to 350 feet; and Plan III, a depth of 40 feet and a width of 300 to 400 feet, allowing two-way traffic.
131.
8. Review of Reports on Freeport Harbor, Texas (45-foot project), U.S. Army Engineer District, Galves-ton, Corps of Engineers, Galveston, Texas, April 28, 1970. In general this report recommends deepening of the existing channel by 9 feet, and widening by 100 to 200 feet. This means that an entrance channel 47 feet deep and 400 feet wide is recommended, and the jetty and Brazos Port Channel are recommended to be 45 feet deep and 400 feet wide. Also, widening and deepening of turning basins is recommended. The estimated first cost to the United States of all recommended new work, exclusive of navigation aids, is $13,545,000, exclusive of $140,000 expended for surveys and studies. The es-timated increase in the annual maintenance and operation costs is $192,400, exclusive of navigation aids.
There are no bridges across the various channels of the Federal navigation project.
The total cost of the existing project to June 30, 1969, was $11,202,335. The maintenance cost of the channels during the period 1965-69 averaged $450,000.
9. Review of Reports on Port Aransas-Corpus Christi Waterway, Texas (45-foot project), U.S. Army Engineer District, Galveston, Corps of Engineers, Gal-veston, Texas, April 4, 1968. This document requests 5-foot deepening of the channel to Corpus Christi, 9- foot deepening of the La Quinta Channel, and some widening and extending of other channels.
The estimated total project costs, exclusive of navigation aids, is $20,682,000, of which approximately 80 percent is Federal cost. The annual maintenance is estimated to increase by $150,800.
The total cost of constructing the existing project to June 30, 1967, was $26,136,646. The total maintenance cost of the existing project to June 30, 1967, was $25,008,587. Annual maintenance cost for the project currently is estimated at $1,100,000 (April 1968), exclusive of jetty maintenance cost.

132.
The report anticipates that petroleum and petrol-eum products will continue to be the principal commodities moved over the waterway in the future years. Further-more, it expects the volume of grain to increase to over 5 million tons per annum (1975). Also, bauxite imports and movement of chemicals are anticipated in the future trade.
In lieu of future deepening the report considers lighterage of vessels as well as offshore structures.
With respect to these alternatives it observed the following:
The alternatives considered to some degree, at least, included lightering, a pipeline system to other Texas petroleum ports, a common loading terminal about 6-1/2 miles offshore in the Gulf of Mexico near Aransas Pass, and a common loading terminal just inshore from Aransas Pass near Harbor Is-land. The common loading terminals would include necessary pumping facilities and pipeline connections to the existing re-fineries at Corpus Christi and to the crude oil shipping terminals at Ingleside and Harbor Island. The inshore common loading terminal would include a large amount of storage facilities at Harbor Island.
Other than lightering, no true alternate to waterway improvements was found, since the prospective commerce in grain, ores, and chemicals is not adaptable to movement through common loading and terminal facil-ities. Lightering as an alternate was not investigated in detail, since it is known that this is a costly operation and there are many practical disadvantages to handling a variety of products in this manner. The construction of pipelines to other Texas ports was not investigated in detail as an alternate, since extensive changes in marketing relationships would be required and a cursory examination

133.
indicated prohibitive cost levels. The offshore and inshore common loading ter-minals were investigated in some detail. Between these two, it was found that the inshore terminal at Harbor Island, with channel improvement from the gulf to this point, would be less costly and much more practicable from a service standpoint. This facility was found, however, to have estimated first costs approximately twice as large as the estimated first costs for channel improvements and estimated annual charges over 3 times greater. In addi-tion to the unfavorable cost comparison, the facility would satisfy only a portion of the petroleum commerce needs, and the requirements of prospective commerce in grain, ores, and chemicals would remain unsatisfied.

ANNEX B-4. RECONNAISSANCE SURVEY OF THE SOUTH PACIFIC COAST

136.
CONTENTS
I. DESCRIPTION OF COAST AND PORT LOCATIONS.. 137
II. FOREIGN AND COASTAL MOVEMENTS, BY PORT, OF THE SIX STUDY COMMODITIES 143
III. MAJOR HARBORS AND CHANNELS 149
Los Angeles 154 Long Beach 155 San Francisco 155 Richmond 156 Ports on San Pablo Bay and Carquinez and Mare Island Straits 157
IV. MAJOR TERMINAL FACILITIES 159
Long Beach 159 Los Angeles 159 Richmond 160 San Pablo Bay and Carquinez Strait 160 Other Ports 160
V. PHYSICAL OBSTACLES TO CHANNEL ENLARGEMENT 163
Bridges 163 Tides 163
APPENDIX A 167

137.
I. DESCRIPTION OF COAST AND PORT LOCATIONS
Most of the California coast is mountainous, par-ticularly along the central and northern sections. Al-though the coast is characterized by much irregularity, the only large bay and river system is at San Francisco. There are a number of smaller bays, but of these only San Diego is both a naturally enclosed harbor and a well-developed port.
There are only three developed general port areas of economic significance on the coast of California: San Diego, the twin ports of Los Angeles and Long Beach, and the ports in the San Francisco Bay area. The location of these port areas and of other less important ports on the coast are shown in figures 1, 2, and 3.
The port of San Diego is situated on San Diego Bay about 96 miles southeast of Los Angeles and 10 miles north of the border between the United States and Mexi-co. The bay is about 15 miles long and from 1/4 to 2 1/2 miles wide.
The ports of Los Angeles and Long Beach are situ-ated on San Pedro Bay, about 23 miles from downtown Los Angeles and 1 mile from downtown Long Beach.
The San Francisco Bay area is about 423 miles north of Los Angeles. The bay area, entered through the Golden Gate, consists of several bodies of water, in-cluding San Francisco Bay, San Pablo Bay, Carquinez Strait, Suisun Bay, and the Sacramento and San Joaquin Rivers. As shown in figure 3, a number of individual ports are located along these several bodies of water.
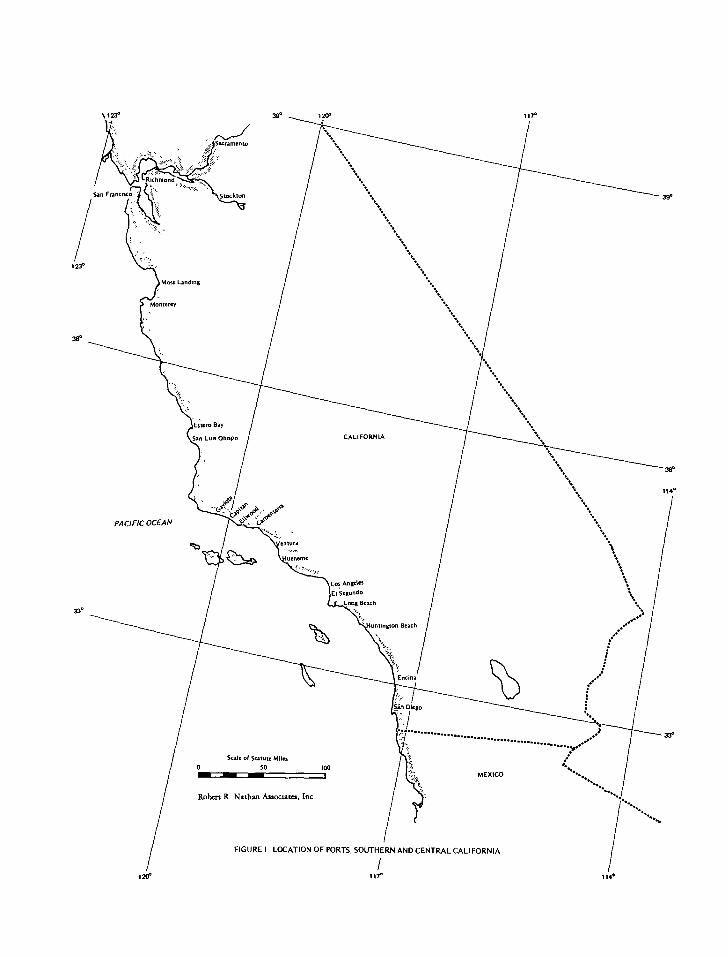
N123° 39* 120° 117°
Richmond
San Francisco
Suramento
Stockton 39°
123°
Moss Landing
Monterey
114°
PACIFIC OCEAN
Sin Diego
33°
.......
Scak of Statute Mlles
50 100 MEXICO
Robert R Nathan Associates, Inc
120°
FIGURE I LOCATION OF PORTS, SOUTHERN AND CENTRAL CALIFORNIA
117° 114°

123°
OREGON
..........
.............
....
...........
Crescent City
G", .............
........
Humboldt Bay
CALIFORNIA
`ci)
Scale of Statute Miles
0 50 100
San Francisco
......
. ......
120e
42°
39°
123° 120° 36o 117°
39°
36°
Robert R. Nathan Associates, Inc.
FIGURE 2. LOCATION OF PORTS, NORTHERN CALIFORNIA

123°00' 122°40' 38°20' 122°00' 122°20'
123°00'
38°C0'
// 121 °40'
Crockett.. 97.,,r9iff:nez Strait
Bcncs
Golden
37°40'
PACIFIC OCEAN
37°40' 37°20'
Scale of Statute Milec
37°20'
38°20._
122°40'
FIGURE 3 LOCATION OF PORTS, SAN FRANCISCO AND VICINITY
37°00'
Robert R Nathan Associates, Inc
122°20 122°00' 37°00' 121 040' 121 °20'

141.
Figure 4 shows that in general the 60-, 90-, and 120-foot depth contour lines are very close to the shore. At many stretches they are only 1 or 2 miles off the coast, and are never more than 5 miles distant except at the latitude of San Francisco Bay. Here a semicir-cular bar creates the only shallow spot in the entire offshore area, and the 60-, 90-, and 120-foot contour lines are respectively 3, 5 1/2, and 8 miles off the coast. At Hueneme and Moss Landing, submarine canyons exist in the offshore area, resulting in deep water close to the shore.

10 5 11 I 1•71111*11•1ff
ote: Contour line data taken from C&GS charts 5702, 5602, 5502, 5402, 5302 5202 and 5101.
•••••••••••••••••••••••••••••••••••••••••••••••••
• •••••••••• •••••••1: ••••1•111••••••••
••• • •
•v "MM.. IMPLI•••arrinir.11.1 PI ..1119 •••• Lis •
cs Z1.1•••• NM IIMI•••• •11•••• • ••••.: -dIMMOIMIIM ••1110••••••&1111•1••
MIMENMEMMLJWINIIMMI MEM IIIIIMEWMOmmommo ImmmmiloRMIA211111111•M • 11111••••••11•■•LI INNEN •••• 111• ••• .nr limo
••••••111111 mmim 11=1J'EMII I 111111111=11=1:111= ............ommill um .................0...... .............A 1 mmommimm•gsga mmm mom
mm mg 000 mmmmm0mmmmmmmmIMMMII mom MINIMMIE
1 2M-----
II 11 A 1111111111111111 I I • 00000001000000061MMININIMMIN
• v 1111111••• 111111111111MIMMINSUM••• r I! r
1111••••••••••• IMMENOPE1111:0:9NT. '••••••••••••
em•ummumm•m•m • uummommmo•m ••ammo••omm• •••■•••••••• •••FAIML-'311•91Er • .16
111111i1••••• ill•••••
•••••••• • 111•••••• 111•1011••••
.amm • M• me
ma mm am mm
•••••••• •••••••••••L
••• • o•m•0•••••00••••••0••••0 1••••••••••••••••••••••••• ••••••••••••111=1".11MMILLIMF1:1111 ••••••••••••••••••iiilliMIEZEMI •••••••••••••••••••■;1111••.• ••••••••••••••••••••0• MMEMMEMEMEMIMIKMIUMEMME MEMMOMMIMEMEMMEMMEMEMEO
Mk KEk
3e
NINO 111••■ MUHL
••••••X•••••••■ U.'• 11111P■ MM. •••••/1•IM •••015.149••• ••••TiAPCM• ••••111:4••••IL
%NM KIM ••• ••• ••• ••• ••• ••• ••• ••• EKE • EE ••• • EM ••• ••• ••• EOM ••• •••
FIGURE 4. DISTANCES BETWEEN COASTL NE AND 60-, 90- AND 120-FOOT CONTOUR LINES, SOUTH PACIFIC COAST
SAN
Robert R. Nathan Associates, Inc.

143.
II. FOREIGN AND COASTAL MOVEMENTS, BY PORT, OF THE SIX STUDY COMMODITIES
Table 1 shows the foreign import and export move-ments of our deepwater port study bulk commodities through ports on the south Pacific coast for 1968 and 1969. Table 2 shows similar data for coastal movements for 1969 and 1970. Total foreign exports of study com-modities were 0.8 million tons in 1968 and 1.1 million tons in 1969, of which over 90 percent was grain that moved principally through Long Beach and Sacramento. Total imports of commodities in 1969 were 10.3 million tons, of which 82 percent was crude oil and 17 percent was petroleum products, moving mainly through Los Angeles, Long Beach, and the San Francisco Bay ports. Other than grain, the largest dry bulk movement was about 100,000 tons of coal exports through Los Angeles and Long Beach in 1969. 1/
Coastal movements of study bulk commodities are over 99 percent crude petroleum and petroleum products, with the volume of both receipts and shipments being substantial. Most of these movements are believed to be intracoastal, but some originate or are destined for other coastal areas, including the gulf coast, Alaska, and Hawaii. In 1970 total receipts and shipments of crude petroleum were 18.4 and 1.5 million tons, respec-tively, and of petroleum products, 6.8 and 13.7 million tons, respectively. Consistent with the concentration of both refinery capacity and market demand in the San Francisco and Los Angeles areas, the bulk of both foreign
1/ There were also exports of 3 million tons of iron ore through Los Angeles and Long Beach.

Exports Imports
Port/area Total all study comm.
Totala/ grains "
Phosphate rock
Crude oil
b/ Pet.-
products Coal Total Iron ore Bauxite Alumina Total
1968 I 1969 19681 1969 196811969 196811969 196811969
Southern California
San Diego
Long Beach
Los Angeles
El Segundo
Total
28 45 9 9 8 19 -- -- 37 --
1,529 2,647 70 369 8 48 c/ -- 78 417 981 1,774 465 457 --
2,852 3,369 13 9 c/ 46 3 c/ 16 55 2,096 2,431 707 882 33
699 -- 699 617 -- 17 --
5,108 6,695 92 386 8 94 3 2/ 103 480 3,795 4,822 1,172 1,393 33
19 37
1,452 2,231
2,836 3,313
699 634
5,006 6,215
Northern California
Monterey
Redwood City
San Francisco
Alameda
Oakland
Sacramento
San Pablo Bay
Martinez
Crockett
Suisun Bay
Selby
Carquinez Strait
Richmond
Stockton
Eureka
Total
Total south Pacific coast
c/ -- c/ -- -- -- -- -- -- -- -- -- -- -- -- --
108 85 -------------- -- -- -- 108 85
44 689 42 15 -- 1 c/ -- 42 16 c/ 667 c/ 6 c/ -- 2 673
2 1 1 c/ -- -- c/ c/ 1 2/ c/ 1 -- -- -- -- -- -- -- -- S/ 1
2 3 2 3 -- -- c/ c/ 2 3 c/ -- -- -- -- -- -- -- -- -- c/ --
540 455 540 455 --------540 455 -- -- -- -- -- -- -- -- -- -- -- --
1,261 839 -------------- -- 1,261 833 -- 839
1,085 812 -------------- -- 836 560 250 252 ------------1,086 812
20 ' -- -- -- -- -- -- -- -- -- 20 -- -- -- -- -- -- -- -- -- 20 --
-- 80 -------------- -- -- 80 -- -------------- -- 80
-- 35 -------------- -- -- 35 -- -------------- -- 35
69 178 -------------- -- 26 178 43 ------------ -- 69 178
1,044 1,332 3 2/ 984 1,227 43 74 -- -- 14 31 -- -- 1,041 1,332
117 111 117 111 --------117 111 -- -- -- -- -- -- -- -- -- -- -- --
-- 54 -------------- -- -- 54 -- -------------- -- 54
4,292 4,674 705 584 -- 1 c/ c/ 705 585 3,127 3,635 444 423 c/ -- 16 31 -- -- 3,587 4,089
9,400 11,369 797 970 8 95 3 2/ 808 1,065 6,922 8,457 1,616 1,816 33 -- 22 31 -- -- 8,593 10,304
1969 1968 1969 1968 1968 1969 1969 1968 1969 1968 1969 1T613
6
6
Table 1. U.S. Waterborne Exports of Domestic and Foreign Merchandise and General Imports of Selected Bulk Commodities, South Pacific Coast (California), 1968 and 1969
(In thousands of short tons)
Note: Individual items may not add to totals due to rounding. a/ Includes food grains (wheat, rice, rye), feed grains (barley, corn, oats, cereals,n.e.c.), and soybeans and mill products. b/ Includes gasoline, jet fuel and kerosene, distillate fuel oils, and residual fuel oils. c/ Less than 500 short tons.
Source: U.S. Department of Commerce, Bureau of the Census, U.S. Waterborne Exports of Domestic and Foreign Merchandise, SA-705, and U.S. Waterborne General Imports of Merchandise, SA-305, 1968 and 1969.

Rect. Shipt. Rect. Shipt. Rect. Shipt.
Table 2. U.S. Domestic Waterborne Coastal Receipts and Shipments of Selected Bulk commodities, South Pacific Coast (California), 1969 and 1970
(In thousands of short tons)
Dry bulk commodities- b/
Crude oil a Petroleum /- products Total, all study comm.
- Port area 1970 1969 1970 1969 1970 1969 1970 1969
Rect. Rect. I Shipt. Rect. 1Shipt. Rect. I Shipt. Shipt.lCommodity Rect.IShipt. Commodity
Southern California
San Diego Harbor
Long Beach Harbor
Los Angeles Harbor
Total
Northern California
Suisun Bay Channel
Sacramento Rivers"
San Joaquin River /
San Francisco Harbor
Redwood City Harbor
Oakland Harbor
Richmond Harbor
San Pablo Bay
Carquinez Strait
Humboldt Harbor
Crescent City Harbor
Total
504 -- 621 5 -- -- -- -- 504 -- 621 --
c -- -- -- 20 -- Grains
/ - __ __ -- /
4,047 3,204 4,745 2,947 3,623 952 4,310 1,170 393 2,252 395 1,776 Ill -- Phos. rock 40 1 Grainsc -
c
4,527 4,973 4,857 5,099 2,505 120 2,433 240 2,022 4,853 2,424 4,859 d/ 4/ Grains/ si/ Grains2/
9,078 8,177 10,223 8,051 6,128 1,072 6,743 1,410 2,919 7,105 3,440 6,640 31 d/ -- 40 1 --
925 475 685 421 864 -- 618 -- 61 475 67 421 -- -- -- -- -- --
-- 127 -- 122 -- -- -- -- -- 6 121 Grains2/c/
-- 122 Grains-
226 -- 201 9 -- -- -- -- 111 -- 64 9 115 -- Phos. rock 137 -- Phos. rock
-- 55 -- 4 -- -- -- -- -- 54 -- 1 GrainsSi -- -- --
41 9 11 -- -- -- -- -- 41 9 11 -- -- -- -- -- -- --
145 263 39 258 -- -- -- -- 145 213 39 196 d/ 50 Graina d/ 62 Grains "
7,333 3,111 6,138 2,588 4,416 73 4,330 21 2,917 3,038 1,808 2,567 -- -- -- -- -- --
1,628 1,449 1,680 1,820 1,441 -- 1,399 -- 187 1,449 281 1,820 -- -- -- -- -- --
4,686 1,313 5,895 2,067 4,161 -- 5,348 26 525 1,313 547 2,041 -- -- -- -- -- --
296 -- 298 d/ -- -- -- -- 296 -- 298 -- -- -- --
219 -- 250 -- -- -- -- -- 219 -- 250 ------ -- -- -- --
15,499 6,802 15,197 7,289 10,882 73 11,695 47 4,502 6,557 3,365 7,058 115 172 -- 137 184 --
Total south Pacific 1 coast 124,577 14,979 25,420 15,340 17,010 1,145 18,438 1,457 7,421 13,662 6,805 13,698 146
a/ Includes 2911, gasoline; 2912, jet fuel; 2913, kerosene; 2914, distillate fuel oil; 2915, residual fuel oil. 17./ Includes grains; 1011, iron ore and concentrates; 1051, bauxite and other aluminum ores and concentrates; 1121, coal and 'ignite; and 1471, phosphate rock. c/ Includes 0102, barley and rye; 0103, corn; 0104, oats; 0105, rice; 0106, sorghum grains; 0107, wheat; 0111, soybeans; 2049, grain mill products, n.e.c. d/ Less than 500 short tons.
Consolidated report.
Source: U.S. Department of the Army, Corps of Engineers, Waterborne Commerce of the United States, Part IV, "Waterways and Harbors, Pacific Coast, Alaska and Hawaii," 1969 and 1970.
172 177 185

146.
trade and coastal petroleum movements are to and from the ports in the San Francisco Bay area and Long Beach and Los Angeles.
The comparatively small volume of coal and iron ore exports through Los Angeles and Long Beach are destined to Japan. According to information provided by the U.S. supplying company, shipments of both com-modities are expected to terminate in the next several years.
In addition to the traffic flows at ports which are shown in table 2, the Corps of Engineers reports a movement of 11.6 million tons of petroleum and petroleum products in 1970 at lesser ports, as shown in table 3. These data could not be incorporated in table 2 because they do not distinguish between foreign and domestic trade or between receipts and shipments. However, it is believed that all these movements are coastal except for the import of some foreign crude petroleum at El Segundo, a refinery location (see table 1).

147.
Table 3. Waterborne Traffic in Crude Petroleum and Major Petroleum Products at Lesser South Pacific
Coast Ports
(In thousands of short tons)
Port Crude petroleum
Petroleum products
Carpenteria
El Segundo
Estero Bay
San Luis Obispo
Ventura Harbor
Total
492.2
2,028.4
3,634.1
899.2
2,770.0
9,803.9
128.1
958.3
165.6
573.0
13.0
1,838.0
Source: U.S. Department of the Army, Corps of Engineers, Waterborne Commerce of the United States, Part IV, "Waterways and Harbors, Pacific Coast, Alaska and Hawaii," 1970.

149.
III. MAJOR HARBORS AND CHANNELS
Only the channels leading to the crude oil and petroleum handling berths of the four major ports or port areas will be reviewed. These ports or port areas are Long Beach, Los Angeles, Richmond, and San Pablo Bay/Carquinez Strait.
Table 4 shows the project dimensions of the ma-jor channels being considered. In both Long Beach and Los Angeles, local interests have dredged entrance and main channels to considerably greater than authorized project depths. Authorized depths for the Long Beach Channel, the entrance channel, and the Inner Harbor turning basin are all 35 feet, whereas actual depths are 62 feet, 55 feet, and 50 feet, respectively. In Los Angeles, the actual depth of both the entrance chan-nel and turning basin is 47 feet, whereas the author-ized depth is 40 feet in each instance. On the other hand, several of the main channels leading to the port of Richmond in the San Francisco Bay area are below the authorized depths.
Figure 5 presents longitudinal cross sections of the navigation channels leading to the four major harbors on the south Pacific coast. They graphically depict the steep decline in the channel depths offshore, with the exception of the shallow bar off the Golden Gate entrance.
Figure 6 presents the alignment of the channels to the harbors of Long Beach and Los Angeles. Figure 7 presents the alignment of the channels leading to the harbor of Richmond and those along the banks of San

35ai/ a 700
35F/ 300-500 1 , 100
400
2.2 2.5 0.0-2.5
1.1 1.3 2.5-3.8
0.3 0.3 3.8-4.1
1.1 1.3 4.1-5.4
Table 4. Project Dimensions of Major Channels, South Pacific Coast Ports
Width Length Depth
Feet Naut. miles
Stat. miles
Location
Stat. miles
Name of channel
Long Beach Long Beach Channel Long Beach Entrance Channel Turning Basin Inner Harbor Cerritos Channel
Los Angeles d/ Los Angeles Entrance Channel. 40-e-j 1,000 0.9 1.0 0.0-1.0 Los Angeles Turning Basin 40- 1,500 0.6 0.7 1.0-1.7 Los Angeles Main Channel 35 1,000 2.1 2.4 1.0-3.4
San Francisco Bay f Main Ship Channel 55-/ 2,000 2.1 2.4 (6.6)-(4.2) 2/ Richmond Channels: Southampton Shoal 35 600 1.9 2.2 11.6-13.8 Long Wharf Manufacturing h/ Area 45- 600-2,500 0.6 0.7 13.8-14.5 Inner Harbor Entrance 35 600 1.4 1.6 14.5-16.1 Inner Harbor Channel 35 500-1,150 2.0 2.3 16.1-18.4 Santa Fe Channel 30k' 0.3 0.4 18.4-18.8
45F. West Richmond Channel 0i/
600 2.2 2.5 12.5-15.0 Pinole Shoal Channel 45-/ 600 9.7 11.1 19.0-30.1
a/ Dredged to 62 feet by local interests. b/ Dredged to 55 feet by local interests. c/ Dredged to 50 feet by local interests. d/ Middle section dredged to 47 feet (width 500 feet) by local interests. e/ Dredged to 47 feet by local interests. f/ Presently 50 feet deep. 2/ Figures in parentheses indicate offshore locations. h/ Presently 35 feet deep. 17 Present natural depth is 36 feet.

OFFSHOREE4--- co --p NLAND STAT MI LE a I I e • I TAT MILES
MEMMIIIMEMMEMEMMEMMEMMEMEMIlliniMMIEMMEEMMEMEMMIIIIMIIMEMMENNIMMI1111111111 ••111•1111111•111111111=1•111111011111••01111 HIT111111111111111111111011111111111 1 1111•1111•1••111111111••••111110•11111121 .
1M 1111111111•=111111•011••••11111•11111111 dirviIIAI.II"Enbidill EN ................... ... 1 • • ..... • • .....................1 ............. 011.....E.
..........I.no ... ....... EMNIMMOMMINIMENNINNWQ ••••■•••••••••••••• [MIMI •••••••••••••••••••• 1.111.111111:111111711111111MMIlm • INIMMENNIONNEENMENNMIN IMMENNOMINNNOMMINOMIg MENNUMMEMMININEWMON MIN M • NM =MI
M Mil MMENNOMMMIIMEMI I MMONNIMENNIMOMMINIM I DO raMiElierallIE • NOMMINNIMMI NUM MINNEMMONNEMOMINNMIIIII MN IIMINNIM MENOMMEMMNIMMIN MINIIMENNNOMM MINMENNOMMENEMINNEn MIN MINIM MMMINIENNWIMEMN MOM MINNIMIMENN • immsmomminsmummmumw. m um minim mummummommis mom mogersims e immommommumwmumbe. lim•ilmo•mgromm•m••om•illimmum•om1•11
NEN:U.11A Nilo VII 0 INNNIIEMO. MIN • ■••••••••••••••=11••••• ••••••• KM. g 15u• .1 W:. • ••••■••••••••••TiP NNEUINIu
IM9111M•r••••••••••••MINNITth-EilaaRiiia ••••■••••••••••11 r ••
... ... ...........
E. .......... .... . ... . ....... pms I EINEM Nom imminumwmo a 1•••0••••••• •••••••••••=111 MENEM mmuummunnommomm ••••••1111111•M •••• ••• • • ■••• ■•••• SI NM= •••••••••••••••■••••••••••• •••••••••••• •••••■••■•••1111%•111aill •••••••M•NNUMMINNMINLIMMIIMMIMMMN•••••••••••••••M ••••••••••••••••••••
••• • •0•0•1••••••■••••••••••••••••••••••••••••r••• •••••••••••••NINIMUMINEMEMOIMMMINN••••••••••••••••••••ro•••• MENNEN ••••••••MIMINE• MEMOS 1101.1111••••••••••••••••••••••••• Rm rum umerminmaimiss •ca•••••••••••••••rnsmnommuul mom Immo •••••••••••••••••••••••••••••••• ■••••••••••••••••••••••••••••••• NNE IM••••••••••••■••••••••••••••••••••••••••••••••••••••••••••••• OM
I •••■••••••••••••••••••••••••••••••••••••••••••••••••••••••M•NNO ENO M IM IONM•••••••••••"1"MES 6;10 tne111M 4*CI• :100 I! I 4111••••••• •• •••■••••• 1111 MN •••••••••••••••••••••••••••••••••••••••••••••••••••••••••••••T MIN=
11111111.1.1.111111.1.11111111.111111111111111111111111.1.001rdiiiiillilliiiglirli0 •'htulla Ns exe 1.1 0 limmart Tillill•••••••• ••••••••••••111••••••!••••11•1 IONIE.1 OA 114S •••••••••••••••• MB ••••••••••••■••••••••••••••••■•••M•Romomgmm ••••••••••••••••••••••••••••••■••••••••••••••••••• •••••1•111•••
11
•••
11111111111111111111111111111111111111 110111
1 •••■•••••••••••••••••••••••••••••••••••••••••••••• ••••••••••■••••
Iiiiiiiiiiiiiiiiiiiiiiiiirilliiiiiiiiiiiiiiiiiiiiiiiiiiiiiiiiiiiiii RNMVINOVAZTMEIM;f wirelmwardmmummmummmummmommommommumummum mulmommil
111111111WIINIMIIIIIIIIIIIIIIIIIIIIIIIIIIIIIIIIIIIN VINMOKMOMPIMMENWPINNUMINOMMIMMENMEENNMENNEMINIMMINNMEIMENIMMEMUAMWOhNI MINIMMENNENNEWMINOWNIIIIMENNIMMIMENNIMMINIONNIMMENNIMMOMMENNENailmmmmpIR
111111111111F1111111111111111111111111111111111111111111111111111111 . MilmommmOmmimm1011MEMOmmonmomMINTIMEWEEMIENNUMMINIMOIMIMMEWMIMMIIMMMISM NIMMOMMINNIMMINIONMINIMAN11117.4'111METIMMOCMIMMENNIMMINNMENNMINIMMENNMENSIM 2U1W:WPCWIORIMENMEMMOUNNONNINIMMUNNOMMINNIMININNMOMMIN .. 1 MI111111111.1"11C111,31::alENIIIIIIIIIIIIIIIiiiiiiill .1111.111111EINI • illl il Mill MigniNNEEMMUMMI•111111111111 NIINN••••••••••MINIIMINIIIIM ITNI LIMINN INMIIIN••••■••••••=1•NNIPPIIIIMISEMNIMMIP NM (IIII I ; [GM El 011 ■1•••••••!11111111•1•11•11••• MINN IIII•••••••••••••••••11 afr/11111Z 14 Anil I ZI: I I • 11111111111VAIMIIIIMM1111111111111111111111111111111111 MINNIMMINEMONWNENNMENNNIMMINENNNWAMINMENNIMMINMENN 11111111111111=111111111111111111111111217411111 m................mgamin....11.................. ....11•=11111,41111111•••••11INIMMINI:TA XI • :4 41611VIMMIOVE giaqu iiimbimmiliiiiimmmilli
••••••■•••••••••••••••••••••••••••••••••••••••••••• FIGURE 5. LONGITUDINAL CROSS SECTIONS OF MAJOR SOUTH PACIFIC COAST CHANNELS
EL t
A = Golden Gate B = San Francisco Bay C = San Pablo Strait D = San Pablo Bay E = Carquinez Strait F Suisun Bay
ab a Zero-point is breakwater in case of Long Beach and Los Angeles and coastline in case of San Francis o Bay. b Mean lower low water
Zero-point is breakwater in case of Long Beach and Los Angeles and coastline in case of San Francis o Bay. Mean lower low water
Robert R. Nathan Associates, Inc.

LOS ANGELES
Center 91 Subsidencl
er.
Turning Basin Inner Harbor
Gerald Desmond Bridge
Cerritos Channel
'est Basin
.".." Long Beach :7
En ranee Channel
Vincent Thomas Brid
Basin , Six
Los Angeles Harbor Long Beach Harbor
*4:
Long Beach Channel
SAN PEDRO BAY
as
Scale of Statute Miles
1 2
nner Harbor - Channel No 2
LONG BEACH
Navy Harbor
Los Angeles fain Channel
Los Angeles Turning Basin
Los Angeles Entrance Channel PACIFIC OCEAN
LEGEND
• Oil facility • Grain facility
Robert R Nathan Associates, Inc
FIGURE 6 CHANNELS AND BULK HANDLING FACILITIES, LONG BEACH ARID LOS ANGELES HARBORS, CALIFORNIA

are Island Strait
SAN PABLO BAY es, Southern Pacific Railroad Bridge
30m;
Pinola Shoal Channel to% 15
40 mi
Semple Point Highway Bridges
Richmond -San Rafael Bridge
Santa Fe Channel
West Richmond Channel 1, \LCHMOND
'nner Harbor Channel
\7,41
MARTINEZ ighway Bridge
'
Southampton Shoal Channel Inner Harbor tntrance Channel
Golden Oath Bridge 1,,San Francisco-Oakland Bay Bridge
PACIFIC OCEAN OAKLAND
o
Go\del'
.5 0" _ SAN FRANCISCO
Main Ship Channel
77.5
LEGEND
• Oil facility
Scale uf Statute Mlles
0 1 2 3 4 5
FIGURE 7 CHANNELS AND BULK HANDLING FACILITIES RICHMOND, SAN PABLO BAY, CARQUINEZ STRAIT AND SUISUN BAY, CALIFORNIA Robert R Nathan Assotiates, Inc
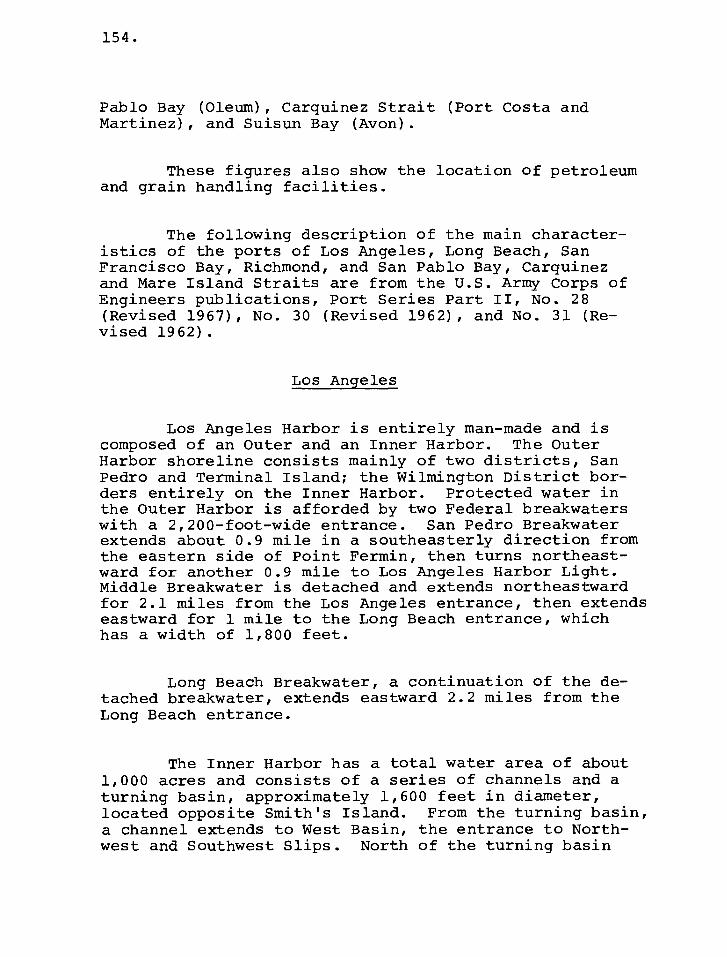
154.
Pablo Bay (Oleum), Carquinez Strait (Port Costa and Martinez), and Suisun Bay (Avon).
These figures also show the location of petroleum and grain handling facilities.
The following description of the main character-istics of the ports of Los Angeles, Long Beach, San Francisco Bay, Richmond, and San Pablo Bay, Carquinez and Mare Island Straits are from the U.S. Army Corps of Engineers publications, Port Series Part II, No. 28 (Revised 1967), No. 30 (Revised 1962), and No. 31 (Re-vised 1962).
Los Angeles
Los Angeles Harbor is entirely man-made and is composed of an Outer and an Inner Harbor. The Outer Harbor shoreline consists mainly of two districts, San Pedro and Terminal Island; the Wilmington District bor-ders entirely on the Inner Harbor. Protected water in the Outer Harbor is afforded by two Federal breakwaters with a 2,200-foot-wide entrance. San Pedro Breakwater extends about 0.9 mile in a southeasterly direction from the eastern side of Point Fermin, then turns northeast-ward for another 0.9 mile to Los Angeles Harbor Light. Middle Breakwater is detached and extends northeastward for 2.1 miles from the Los Angeles entrance, then extends eastward for 1 mile to the Long Beach entrance, which has a width of 1,800 feet.
Long Beach Breakwater, a continuation of the de-tached breakwater, extends eastward 2.2 miles from the Long Beach entrance.
The Inner Harbor has a total water area of about 1,000 acres and consists of a series of channels and a turning basin, approximately 1,600 feet in diameter, located opposite Smith's Island. From the turning basin, a channel extends to West Basin, the entrance to North-west and Southwest Slips. North of the turning basin

155.
between Mormon and Terminal Islands, the East Basin Chan-nel provides the approach to Slip No. 5 and East Basin. Cerritos Channel extends easterly from East Basin Chan-nel and connects the Inner Harbors of Los Angeles and Long Beach.
Most of the cargo handling and service facilities are concentrated in the Inner Harbor, which is about 3 3/4 miles from the breakwater entrance.
Long Beach
Long Beach Harbor is on the eastern part of San Pedro Bay. The distance between the entrances to Long Beach and Los Angeles Harbors is about 4 miles. Natur-al protection for San Pedro Bay is provided by the high-lands of San Pedro Hills and the island of Santa Cata-lina, which is about 25 miles distant.
Long Beach Harbor is made up of the Inner, Mid-dle, and Outer Harbors. Cerritos Channel, two dead-end channels, and a turning basin comprise the Inner Harbor. The Middle Harbor area consists of East and West Basins, separated by the Inner Harbor entrance channel and en-closed by a solid-fill mole and the outer extension of Pier A. The distance from the detached breakwater (Long Beach Harbor entrance) to the Inner Harbor turning basin is approximately 4 miles. The Outer Harbor consists of those harbor areas south of the Naval Base Mole and Pier A Extension. Pier F, Pier G, Pier Y, Pier J, and Pier A Extension enclose Basin Six and Southeast Basin. The 700-foot entrance (500-foot channel width) to the South-east Basin is approximately 1 3/4 miles from the Long Beach Breakwater entrance.
San Francisco
San Francisco is located on the northern portion of a peninsula which separates the southern part of San Francisco Bay from the Pacific Ocean; the city covers the width of the peninsula. The principal waterfront facilities of the port extend from Black Point on the

156.
north side around to India Basin on the east side of the peninsula, a distance of nearly 6 1/2 miles. The bay is more properly described as a series of connecting bays and harbors, of which South San Francisco Bay, San Fran-cisco Bay proper, and San Pablo Bay are the largest bodies of water. The entire bay system has an area of about 450 square miles, varying from deep water to tidal flats, with a shoreline of more than 200 miles.
San Francisco Bay proper is of generally deep water with depths up to 216 feet. Entrance to the bay from the Pacific Ocean is through a strait known as the "Golden Gate"; it varies in width from 1 to 3 miles and has maximum depths of almost 400 feet.
Outside the entrance to San Francisco Bay, a semicircular bar extends from a point about 1/2 nautical mile west of Point Bonita to a point approximately 3/4 nautical mile off shore, 3 nautical miles south of Point Lobos. The extreme seaward point of the bar lies about 5 miles south-southwest of Point Bonita. Except for the dredged portion of the Main Ship Channel, depths over the bar range from 31 to 36 feet near the southern end to the shallowest area near the northern end, known as Four Fathom Bank (Potatopatch Shoal), where depths of less than 24 feet exist.
The Golden Gate can be entered through one of 3 channels -- Bonita Channel, parallel to the coast north of Point Bonita; the Main Ship Channel, which crosses the bar from a southwest direction; and the South Chan-nel, parallel to the coast south of Point Lobos. The controlling depths are 39, 49, and 34 feet, respective-ly. The Main Ship Channel, under improvement by the Federal Government, is the one most frequently used.
Richmond
Richmond Harbor, California, is situated near the northern extremity of San Francisco Bay, on its eastern shore about 10 miles north of Oakland. The port area includes an Outer Harbor approximately 5 miles in length

157.
between Point San Pablo and Point Richmond, and an Inner Harbor extending from Point Richmond to and around Point Potrero, and thence to the inner end of Santa Fe Channel at Cutting Boulevard, Richmond, a distance of 3.75 miles. The Outer Harbor faces natural deep water in San Fran-cisco Bay; the Inner Harbor has been dredged from deep water in San Francisco Bay through shallow flats and marshlands. The shore and channel between Point Rich-mond and Point Potrero are protected by a 10,000-foot training wall extending in a westerly direction from its anchorage on Brooks Island opposite Santa Fe Channel.
Ports on San Pablo Bay and Carquinez and Mare Island Straits
San Pablo Bay connects with the northern extrem-ity of San Francisco Bay at a narrowing between Point San Pedro and Point San Pablo. On the east it connects with Carquinez Strait, and through this connection Sui-sun Bay and the Sacramento and San Joaquin Rivers are joined with the San Francisco Bay system. Mare Island Strait extends northwesterly from Carquinez Strait from a point near the confluence of the latter with San Pablo Bay. Mare Island Strait is in reality the estuary of the Napa River, a comparatively small stream draining the Napa Valley of the Coast Range Mountains.
The northern part of San Pablo Bay consists of low marshes intersected by numerous sloughs with a large area of shoal water and mudflats that bares at extreme low tides. The southern part is bolder, except for the area between Point San Pablo and Pinole Point, which is low and marshy for about 3 miles. Carquinez Strait is about 6 nautical miles in length; it extends in an east- erly direction and connects San Pablo Bay and Suisun Bay. For the first 3.5 miles it is a little less than 1/2 mile in width, then expands to a width of about 1 mile. It is deep throughout, with the exception of a small stretch of flats on the northern shore. Suisun Bay is a broad, shallow body of water with marshy shores and contains numerous marshy islands. Many of these islands have been reclaimed and a number are under cultivation. The Sacramento and San Joaquin Rivers enter Suisun Bay at Collinsville at the eastern end.

158.
The Federal navigation project for a deepwater channel from San Francisco Bay to Stockton, California (John F. Baldwin and Stockton Ship Channels), authorized by the 1965 River and Harbor Act, provides for the deep-ening of the Richmond Long Wharf maneuvering area to 45 feet and construction of a connecting channel, the West Richmond Channel, 45 feet deep, 600 feet wide and approx-imately 2.5 miles long through the west navigation open-ing of the Richmond-San Rafael Bridge. The overall project plan is contained in House Document 208, 89th Congress, 1st Session. Further actions, however, de-pend on the findings of the so-called "San Francisco Bay Area In-Depth Study," which was authorized pursuant to a resolution adopted by the Committee on Public Works, House of Representatives, on 19 October 1967 (Navigation-Docket No. 1635).
160.
Grain Elevators
The Los Angeles Harbor Grain Terminal owns and operates a waterside bulk grain handling and storage facility (located at the north side of East Basin Chan-nel). This facility has 13 steel silos with a total storage capacity of 410,000 bushels and is equipped to receive and ship grain and other bulk feed products -- primarily alfalfa pellets -- via rail cars, trucks, and vessels.
Richmond
Thirteen oil handling facilities at the port are equipped to received and/or ship petroleum products by water; three are located in the Outer Harbor, three at Point Richmond, and seven in the Inner Harbor.
San Pablo Bay and Carquinez Strait
Ten waterfront oil handling facilities are equip-ped to receive and/or ship petroleum products.
Other Ports
Oil Handling Facilities
In addition to the facilities mentioned above, there are oil handling and storage facilities in the port of Oakland-Alameda, most of which are located at the Outer Harbor.
Ten offshore petroleum terminals are in operation in the vicinity of Los Angeles and in the central coastal area between Los Angeles and San Francisco. Table 5 lists the location and water depth of these facilities.
159.
IV. MAJOR TERMINAL FACILITIES
Long Beach
Oil Handling Facilities _
Eight wharfs are used for receiving or shipping petroleum products. Six of these handle imports of crude oil for three companies.
Grain Elevators
The city of Long Beach, Harbor Department, owns a waterside grain elevator on the Basin Six side of Pier A. This elevator, operated by Koppel Bulk Terminal Com-pany, consists of 49 concrete silos and 23 interstices with a total capacity of 1,810,000 bushels. The eleva-tor is equipped to receive and ship grain via rail cars, trucks, and vessels. The combined loading rate of the spouts is 43,000 bushels of grain per hour.
Los Angeles
Oil Handling Facilities
Twenty-six waterfront facilities are equipped to handle petroleum products. Six of the oil companies operating waterfront facilities have pipeline connections between storage tanks at their waterfront locations and their inland refineries in the Los Angeles area.

161.
Table 5. Location and Water Depth of Offshore Petroleum Terminals
Location Water depth (feet)
Encia Huntington Beach El Segundo Ventura Carpenteria Ellwood Capitan Gaviota Estero Bay San Luis Obispo
Grain Elevators
Two grain elevators are located on the Oakland waterfront; each is operated in conjunction with adja-cent grain milling and processing plants. The storage capacities of the two plants are 1,125,000 and 525,000 bushels of grain.
Table 6 summarizes petroleum and grain storage at all major south Pacific coast ports.
40 50 58 42 60 60 32 36 36 32

162.
Table 6. Summary of Storage Capacities, South Pacific Coast Ports
(In millions)
Crude oil and pet. products
(bbl.) Port Grain
(bu.)
1.81 Long Beach
Los Angeles
Richmond
San Pablo Bay, Carquinez Strait, and Suisun Bay...
Oakland-Alameda
Total
3.0
10.0
20.1
17.8 /
51.9!" 3.46
1.0 1.65
a/ Excludes tank farms at Martinez and Avon.

163.
V. PHYSICAL OBSTACLES TO CHANNEL ENLARGEMENT
Bridges
Bridges which might be obstacles to harbor ex-pansion are listed in table 7 by port or port area. The table also provides detailed information on each bridge.
Tides
Table 8 presents the mean tidal range of the various ports.

nce
Vertical— a/
Clear Name Location Bay, strait or channel Purpose Kind
Horizontal
(stat. m.)
4 Inner Harbor Entrance Channel, Long Beach
4 Main Channel, Los Angeles
3 Golden Gate, San Francisco
15 San Francisco-San Pablo Bay
31 Carquinez Strait
31 Carquinez Strait
38 Carquinez Strait
38 Suisun Bay
Highway
Highway
Highway (U.S. 101)
Highway
Highway
Highway
Highway
Railroad
feet
155b/—
b c
1,150 185 /— -165 /—
b
4,028 232 1' — -214d/—
e/ 1,0007, 970-
1,030 1342/-147Y
1,000 1352/-146Y
400 135
135i/
Fixed
Fixed
Fixed
Fixed Fixed
Fixed
Fixed
Fixed
Vert. lift
526
185!/ 135f/
291
Gerald Desmond Bridge...
Vincent Thomas Bridge...
Golden Gate Bridge
Richmond-San Rafael Bridge
Sample Point Bridge (downstream)
Sample Point Bridge (upstream)
Benicia-Martinez Bridge
Southern Pacific Rail-road Bridge
Table 7. Review of Relevant Bridges in Major South Pacific Coast Ports
a/ At mean higher high water. IT,/ At the center. C/ At the sides. a/ At the north tower, and 211 feet at the south tower. e/ West opening in the main channel. T/East opening in the Richmond Outer Harbor. a/ South span. h/ North span. i/ In raised position.

3.8
5.7
7.2
6.0
5.8
3.5
165.
Table 8. Tidal Range Under Ordinary Conditions
Location Mean range 7 (feet)
San Pedro Bay
Long Beach/Los Angeles Harbor
San Francisco Bay
Fort Point
San Francisco Airport
Oakland Pier
Richmond
Stockton
a/ Difference between mean higher high water and mean lower low water.

167.
APPENDIX A. REVIEW OF STUDIES ON CHANNEL DEEPENING AND PORT EXPANSION
1. Co9prehensive Framework Study, California Region, Appendix XVII, Navigation, prepared by Califor-nia Region Framework Study Committee for Pacific South-west Inter-Agency Committee, Water Resources Council, June 1971. The purpose of this appendix is to survey the future needs for navigation facilities, both com-mercial and recreational, in the California region.
Estimates of future requirements for commercial navigation facilities were based upon projected quanti-ties and types of waterborne commerce likely to move through the region's ports and waterways to the year 2000.
2. Wave Statistics for Seven Deep Water Stations Along the California Coast, prepared by National Marine Consultants, Santa Barbara, December 1960. It presents the average annual sea and swell rises for seven differ-ent locations.
3. San Diego Harbor, California, House Document No. 365, 90th Congress, 2d Session, July 23, 1968. This document recommends widening of the entrance channel in the bends and deepening of the channel in the Central Bay to 40 feet from mile 7.0 to mile 8.84 and to 35 feet from mile 8.84 to mile 12.0. The total project first cost amounts to $11 million.
4. Los Angeles-Long Beach Harbors, Interim Re-view Report, U.S. Army Engineer District, Los Angeles,

168.
Corps of Engineers, Los Angeles, California, June 1971. This report recommends channel improvements as shown in appendix table 1, compared with the existing project and current actual channel dimensions.
5. Vertical Movement in Long Beach Harbor Dis-trict, Civil Engineering Division, Port of Long Beach, Long Beach, California, October 1970. The paper deals with the phenomenon of subsidence in the harbor area of Port Long Beach. It shows that during the period 1928- 70 a maximum subsidence of 29 feet was measured at a location indicated on figure 6 of this annex.
6. Latest Permit for Current Dredging in Long Beach Harbor, issued to Board of Harbor Commissioners, Port of Long Beach, by U.S. Army Engineer District, Los Angeles, Corps of Engineers, Los Angeles, California, October 22, 1969. Application was granted for a permit to construct dikes for the expansion of Piers G and J and to dredge 8,300,000 cubic yards of material in Long Beach Harbor.
7. Survey of Deepwater Harbor Program, South Pacific Division, letter from Division Engineer, South Pacific, to Chief of Engineers, 12 October 1967. This letter summarizes the findings of the district offices with respect to data and information on physical prob-lems associated with further deepening of harbors for 11 projects within the division. Eight of the 11 pro-jects are within the San Francisco Bay system, and to a large degree controlling depths are interrelated. The three other projects are Humboldt Harbor and Bay, Los Angeles-Long Beach Harbors and San Diego Harbor.
8. San Francisco Bay, California: Disposal of Dredge Spoil, Supplement I to Appendix V, Sedimenta-tion and Shoaling and Model Tests to Report of Survey on San Francisco Bay and Tributaries, California, U.S. Army Corps of Engineers, Committee on Tidal Hydraulics, December 1965. This study shows that the current average quantity of maintenance dredging performed annually by all interests amounts to about 11.0 million cubic yards inside the bay, and 1.2 million cubic yards at the Bar

Channel Existing Fed-eral project
Recommended Federal projecta/
b/ rrent- Cu
Depth Width Depth Width Length Depth Width
Long Beach
Long Beach Channel Entrance Channel Turning Basin Inner Harbor Cerritos Channel
Los Angeles
Los Angeles Entrance Channel
Los Angeles Turning Basin
Los Angeles Main Channel
Turning Basin Inner Harbor
East Basin and Cerritos Channel
West and East Basin
35 700 622/ 7002/ 14,0002/ 62 35 300-500 62 300-500 7,000 62
35 1,100 35
55 1,100 1,600 400 50 400 6,000
700 300-500
55 1,100 50 400
40 1,000 80
40 1,500 80
35 1,000 45
35 e/ 45
35 e/ 45 35 e/ 45
6,000
3,500
12,500
1,600 1,650
400-650 e/ e/
500
1,500
d/
d/
d/ J/
47
47
d/
d/
d/ d/
1,000
1,500
1,000
Appendix Table 1. Summary of Channel Dimensions, Los Angeles and Long Beach Harbor
(In feet)
a/ Dimensions recommended in interim report. E/ Due to dredging by local interests. C-/ Not shown in report. d/ Same dimensions as existing project. e/ Varying.

170.
Channel. Major improvements of the primary navigation channels from San Francisco Bar to the Port of Stockton, now under consideration, may increase the average annual maintenance quantities considerably. About 87 percent of the material removed from the navigation facilities is deposited overboard, i.e., into the water of the various bays without confining structures. The study also gives consideration to disposal behind banks.
The current unit cost of maintaining the chan-nels, slips and docks in the bay system is $.25. If the material removed from the Oakland project was hauled out to sea, the unit cost would increase by $.30.
9. Dredge Disposal Study for San Francisco Bay and Estuary, Preliminary Report on Main Ship Channel (San Francisco Bar), U.S. Army Engineer District, San Francisco, Corps of Engineers, San Francisco, California, June 1971. This report studies the adverse effects resulting from dredging and disposal operations prior to and concurrent with initital construction activities on the bar, and how to eliminate these ef-fects. The study programs included sampling, testing and analyzing the physical, biological and chemical properties of the Main Ship Channel and disposal site on the bar prior to, during and after dredging opera-tions. This report sets forth results of the study programs to date and outlines future studies to accumu-late necessary data to determine proper dredging and disposal procedures.

ANNEX B-5. RECONNAISSANCE SURVEY OF THE NORTH PACIFIC COAST

172.
CONTENTS
I. DESCRIPTION OF COAST AND PORT LOCATIONS.... 173
II. FOREIGN AND COASTAL MOVEMENTS, BY PORT, OF THE SIX STUDY COMMODITIES 179
III. MAJOR PORTS AND CHANNELS 183
IV. TERMINAL FACILITIES 191
APPENDIX A 193

173.
I. DESCRIPTION OF COAST AND PORT LOCATIONS
The coast of Oregon and Washington is interrupted at Astoria by a large river, the Columbia, and at Cape Flattery by a large bay system, the Strait of Juan de Fuca. Smaller bays located along the coast are Grays Harbor and Willapa Bay in Washington, and Coos Bay, Nehalem Bay, Tillamook Bay, and a number of others in Oregon (figure 1).
Figure 2 shows that in general the 60-, 90-, and 120-foot contour lines are very close to the shore. At many stretches south of the mouth of the Columbia River the distance is only 1 or 2 miles, whereas north of the mouth the distance varies between 3 and 7 miles up to Cape Flattery, where the 120-foot line is 1 mile off shore.
The ports of the Pacific Northwest can generally be grouped into the following geographical segments: ports on the Columbia River and its tributaries, ocean bay ports, and ports in Puget Sound and adjacent water entered via the Strait of Juan de Fuca. The Columbia River, one of the great North American rivers, is the navigable approach to river ports between its mouth and the head of ocean shipping navigation at Portland. Van-couver, Washington, on the Columbia River, and Portland, Oregon, are respectively about 106 and 110 miles from the Pacific; the latter port is situated on the Willa-mette River about 9 miles above its junction with the Columbia. Navigation by river craft is conducted for a considerable distance up the Columbia above Vancouver and for a comparatively limited distance up the Willa-mette above Portland. Figure 3 shows longitudinal cross sections of the Columbia and Willamette River channels.
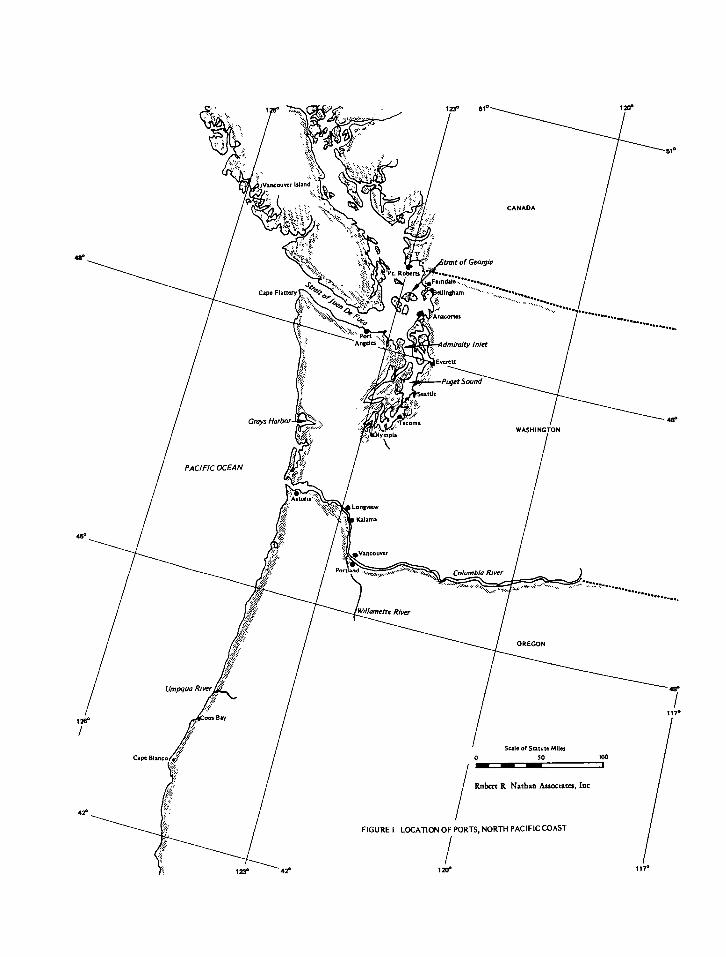
123° 51° 120•
51°
CANADA
trait of Georgia
... ...... Ferndek
. ellIngham • . ......
.... .....
Anacortes
........... •
dmlralty Inlet
Everett
Puget Sound--
Seatde
48°
ympla WASHINGTON
4e
Longview
Kalama
ggVancouver
Columbia River
. ............ .....
.......
OREGON
Umpqua River
Cape Blanco
Scale of Statute Mlles
50 100
Robert R Nathan Associates, Inc
42°
FIGURE I LOCATION OF PORTS, NORTH PACIFIC COAST
123° 42° 120° 117°

1111 • •
i! I 1A
NEM MEV Er'
MEM. NM EMI ••••••• MENEM.. MIMEO M•••••• • ll••••• 11•••••• NUMMI= MEM.. 1111•11•111 mm_ ., ...m MMUMmommmin1
EMNIIMENIMMINIMMEMEMEMEN EMU
1 IIMMEMENIMEEIMMEEINM
Mir1 •••••••••••••••••• 1111 ••••••••=111111111== nr mownrommimmummilm assigiesanuawrininnsummilm
• 141/21:Jil /01114%1111111•111/•••••••• _ 111••••••ICA/IM
galffigni
- 1-
n-----.,■nx%
I1
1 5
4
-
• 1
BE
1fi
MIHIRP
II
A
I I I
49 {
CIAIDIEDIZ
Note: Contour line data taken from C&GS charts 6102, 6002, 5902 5802 and 5702
FIGURE 2. DISTANCES BETWEEN COASTLINE AND 60-, 90-, AND 120-FOOT CONTOUR LINES, NORTH PACIFIC COAST
Robert R. Nathan Associates, Inc.

mummimmommummummimmumialmaiMmimmimummommummommomminummomummmummommommimmmumm • INIMMOOMMMEMEMMEMEMEMEMMEMEMMIPMEMEMMEMMEUMEMEMEMEGIOMMEMMEMMEMMEMMINIMMENEMMUMMEMMEMMEMMWMIEAYMSOMME mummommommommmummommimmomm••••ummommum•ism•mmimma•mo••u••a•milm•mmamm•mm•m•o•mumm MMEMEMMOMMEMINUMMEEMOMMEMIMINEWIFIMMEMMIMMUUMMEMINIMMIEMINIMMOMMEMIIIMMEMERMIMMEMME MOIMMEMMOMMEMMEMMEMOMMEMMIMMEM M EMEAIECAUMMOMMEMMMEMMEMMEMIONEWW A.M MEDMWAIM UMEMOMM URNINVAA IW MEMMEMMIUMME MIIMMEMMOMMUMMEMOMMUMMEMMEMMINIMMENEWIMEMMUMMEMMEMEMMEMEMMOMMEMEMEMMUMMEMEMENMEMMEMUMMOMMEMEMOMMOMME MMEMMEREMMIIMMEMMEMMEMMEMEMMEMMEMEMMILMEMOMMEMMEMEMIIMMEMMEMMEMELMMOMLAMMEMMEMMEMEMMELMMOMMMEMMEMMEMEMM MMEMEMMINIMMEMMEMEMMEMMEMEMMEMONMEMMENMENMEMIMMEMMEMMIIMMEMEMEMEMMEMIMMEMMEMEMINIMMEMEMMEMEMMEMMEMMEMM MMEMMEMMEMMEMMEMMEMMEMEMIUMNIMMEMMEMMEMEMMEMENIMMEMEMEMMUMMEMMEMMMEMMEMMMEMMEMMEMMOMMEMEMEMEMMOMOIM MMINIMMEMEMMEMMEMMEMEMEMMEMMODBMEMMEMMUMMEMMEMENMEMEMMEMMOMMEMMEMMEMEMMMEMANMEMMEMIMMEMMEMEMEMEMMEMME MMEMMOMMEMMEMMEMEMMEMMEMMENMWOMMWMVIAMMIMMEMMEMMENMEMMEMWAMIAMMIAWNIVAIWNLAMMEMMMEMMEMMINIMMEMMEMOMME IIIMMMENEREMMEMOMEMNImmimimmulMOS7AMMEMMENImmilMOMMEMOIMEMPEOWAMEMMIlimmUMMEmmunimmomMEMMEMMEMEMONME mmilIMMIummommummilMmummimmilMomminimmlimmommEMMENEEMMEMMEMmmommilimmkimmummENEMEMMIMENNErnmminimm mmilimminimmumminimmammrnimmulmmimmimmommelmmammilinmornimmummommommmummicogocznommiumm 1•11•••••••••••■••••••••••••••••••••••••••111111111MINIMMEIMMIMIMMINEMIMMIEMIIIWWW1111M3T3IF111731••• MIMMIMMINIMMEMMEMMEMEMMEMEMMEMOMMVEV'Wm -y4WIMMIP- -11WIMpvvv--y-mqMPWIRP"W'momv - Ir MAIWEINAMSWESNMEMM 1111111MO•M•M••N••MUM•OM••MIWIMP VfimgmorMUSIMIKVIAMMI6mismaALMammomommOtanflammumminummomMUMMIMMEmili MOMMEMMEMMINIMMOMMEMMEMEMEMEMIMANIMEMMRAMMOMMVAIMMEMUMMEMMAMMEMOIMMEMMIMMEMMINIMMEMMEMEMMEMEMEMEMMOMME MOMMEMMEMOMMOMMMEMOMMEMMEMMIWOMUMEMMEMEMOMMEMMOMMEMMEMMEMMEMMEMMEMMEMENMEMMEMMEMMEMMEMMEMMIMMEMMEM IIIMMEMEMEMMMEMMEMENMEMMEMMIMMINERMEMMOMMMOMMEMMEMEMMEMIUMMEMMEMEMEMMEMEMMEMMEMEMPNWOMOPENIMMIPPOMMENM INIMMEMEMMEMEMMIMMEMMEMMEMEMVAMMEMEMMEMMIMMEMMUMMEMEMMEMEMOMMEMMINIMMOMMEMMIMMEMMILeRIJUIMII:MOMME EMMIIMMINNIMNIMMANOMMEMMIIMETINIOMMEMOMMEMMOMMEMMOMMEMMEMEMMOMMEMMEMMEMMINIMMEMMEMENVIMMOCIMMEMEMMEMMEMM MEMEMMEMEMMEMMEMMEMOMMMEMSEIMMOMMMEMMIOMMOMMEMMOMMEMMMEMMEMMEMMEMEMEMMEMMEMEMEMEMEgirommEMEMOMM MMEMMIIMMEMMEMMIMEMMEMMIIMMEMOMEOMMEMOMMEMOMMEMOMMEMMEMMEMOMMEMMEMEMMOMMMEMMEMMEMMEmmillEMMEMEMMOMMII MEMINIMMEMEMMINIMEMMEMEMMEMMEMMOMMEMMIMMINIMMEMEMMENIUMIMMENIMEMMEMMEMOMMIMMEMMEMMILMWMNIMMIIMMEMMUMME IIMMEMMOMMEMMEMEMMINIMMEMEMMEMMEMMEMMEMMEMOMMOMMOMMEMMIMMINIMMEMMEMMEMMEMEMMEMMIOMMIMMIMEMMEMMEMINIMMEMM MEMMEMEMMEMMIIMMEMMEMIIMMMEMMOMNIIMMEMMEMEMMEMMEMMEMMEMEMMEMMEMMEMEMMEMMEMMEMMMEMEMMERA•M••EMIIM••••••E• MOMMEMEMIMMEMEMEMMEMMEMMEMMSNMEMMEMEMMEMOMMEMMEMMEMMEMMEMOMMEMMEMMMEMMEMMEMMEMMMEMMEMMEMMEMEMMEMMEM MOMMEMENMEMMIIMMEMEMMIMMINIMMEMMIMEMMEMMEMMEMMINIMMEMEMMEMEMOMMEMMEMMEMINIMEMAMMEMMEMMEMOMMEMOMMEMMEMEM MIMINIMUMMINIMMIMMINIMMEMINIMMEMMIMMOMENEMMIUMMINIMMONMEMMIMMIIMMIMMIMMIMUMEMWENUWAWNIINIMIM mummommummommummommommommommummummomminsmummommtmulawmigiuwar WIWITOMM771111MMEMM lummummmumnimmommummimmmummummommommummommommummormlimm.Ammilroaawaiiimmimaammom MEMMEMMEMEMMEMMIMMEMMMEMEMMEMEMMEMMEMEMMOMMINIMMEMMEMMEMEMEMMEMMINIMMEMMMEMNEMNimme ImMIMOMINIMMEMMEMEM
MMIMEIMMEMEMMEMEMMEMMEMMEMMEMMEMOMMEMMOMMMIMMEMMEMEMMIMMEMMEMMEMEMONIMMEMS MEMMEMMINIMMEMMOMME INIMMEIMMEMEMMEMMEMEMMEMININMEMMEMEMMEMMOMMEMEMEMMEMEMMOMMMOMMEMMMEMEMMMEMMINIIMMOMMT MERMEMMEMMEMM111111
MEM MommOMMIMMUMMEMNOMMINIMMEMMEMOMMEMMOMMEMIUMMEMNIOMMEMMIMMEMOMMEMMEMOMIMMERMUMMIMMEMINIMEMEMOMMM IIIMMEMEMMEMEMMINIMMEMEMEMOMMEMOIMMEMMEMEMEMOMMEMEMMEMEMEMMEMMEMMEMMEMMEMMEMM,04MMEMINi ■AMEMMEMOMMEMMOMME milmommimmommilmmilmmilimmimmimminummilmummimmummiminiummilummimmdarimmilmanimmommimmimmimm 1111111MMEMMEMMIMMEMEMEMEMMEMMEMMEMENMEMMEMOMMEMMEMEMINIMMOMMEMMIMMEMMIMMEMMEMMOMMEMMEMEMMINIMMMIMMEMEMM IMMEMMEMINMEMMEMEMMEMMEMMEMMINIMEMMINIMMOMMEMMEMEMMOMMEMEMMEMEMIMMEMMEMMEMMEMMOMMEMMEMMEMEMMEMEMEMMII MMEMMEMEMMEMEMEMNIMEMMEMMEMMEMMEMEMMEMMEMEMMEMMIIMMOMMEMMINIMMEMIMMEMMEMEMMEMMEMPIMERRMETTIMPW.PMEMMEM INIMMEMOMMIUMMEMMEMMEMMEMINIMMEMMEMEMMOMMMOMMEMMEMMEMMEMMMEMEMMEMMEMEMMMEMMMEMEMWIM414d4M141AVMAIMMEMM mommommummummommummummummummommummummommummommummommmummommmmmummummommms MIIMEMMOMMIIIMIIMMEEMMEMMEMEMINIMMEMOMMEMMEMEMEMONMEMMEMMENMEMMEMMEMIMMEMOMMEMMINIMEMMEMMMEMEMMINIMMEMEM •E••INIMM•M••MME•MM•• MEMENMEMMIMMEMMEMMEMMENOMMEMMEMEMEMMEMEMERNMEMEMMINIMMEMMMOMMEMMEMEMMOMEMMEMMEM
MOIMEMEMMOMMIMMENMEMMEMMEMMEMMEMMEMENEMMINIMMEMMEMMOMMEMEMEMOMMEMEMMEM MEMEMEMEMMINIMMEMMEMMEMMEMEMEMMIIMMEMMOMMINIMMEMINIMMEMMEMEMMINIMMEMMEMEM MEMMEMMEMMEMEMMEMENIMMEMEMMEMMEIMMEMEMMEMMIMEMMEMEMEMMEMMOMMEMMEMOM monsimmummonsmommummommimmumummummmummormommummommomum mommimmommommummommommummommommommommommmimmummom MINI•••MMO•MI••••••MME•M•••M•••M•••EN••••MI••INIM••M••MEM•NEMEMME•M••M MEMOMMEMMEMEMMEMEMOMMEMMEMEMMUMMEMMOMMEMMEMMEMEMMEMMEMMEMMEMOMMEMM MEMEMMEMOMMEMEMMEMEMMEMMEMEMMEMMEMEMEMMEMMMEMMIMMEMMMEMMEMMEMEMMIIMM IIIMMEMMEMOMMEMMEMIMMEMMEMMEMEMMEMEMEMMIIMMEMEMEMMINIMMEMEMOMMIIMMEMMEM MENIMMOIMMOMMEMOMMIMMEMEMEMEMMIIMMEMMEMMEMMMEMMEMMIMMEMMEMEMOMMEMMOMEM MEMMEMEMOMMMINUMMEMMEMEMIMMIIMUMMIMOMMEMMEMMINIMMEMEMMIMMEMINIMME .u.................................................................MOM MIIMMEMMEMOMMEMMEMME
MEMMEMMEMMEMEMOMMEM INIMMEMMEMOMMMUMMMEN MEMOMMINIMMEMMEMOMME
Robert R. Nathan Associates, Inc.
MMEMEMEMMIPMEM MIIMMEMEMEMMEM MOMMEMIMMONME
0 I 111401111 111161)11 I I I I II
a From Columba R ver mouth to Harrington Point (m le 24) b Upstream from Harrington Point.
FIGURE 3. LONGITUDINAL CROSS SECTION OF COLUMBIA RIVER CHANNELS
111111H- 1- 11 I I I I I I 11111111TTTTTTT

177.
The entrance to the Strait of Juan de Fuca is 683 nautical miles north of San Francisco, California. This strait is the connecting channel between the ocean and Admiralty Inlet extending southward to Puget Sound, and to passages extending northward to the inland waters of British Columbia and southeastern Alaska. The Strait of Juan de Fuca separates the southern shore of Vancouver Island, Canada, and the northern coast of the State of Washington. Throughout the length of Puget Sound, there are numerous channels around islands, and inlets branch-ing from the sound in all directions, particularly near its southern end.
The Strait of Juan de Fuca is approximately 80 nautical miles long and over 8 miles wide with depths in excess of 120 feet. For Admiralty Inlet these di-mensions are respectively 20 and 2 miles, and for Puget Sound, 40 and 1.5 miles. Port Angeles is located on the south side of the Strait of Juan de Fuca; the ports of Seattle and Tacoma, on the east side of Puget Sound; the port of Everett, on the east side of Possession Sound, a bay north of Puget Sound; and the ports of Anacortes and Bellingham, on the east side of Rosario Strait. The locations of these ports in relation to the mouth of the Strait of Juan de Fuca are given in table 1.
Table 1. Distance of Northwest Washington Ports from the Mouth of the Strait of Juan de Fuca
Port Distance (statute miles)
Port Angeles Everett Seattle Tacoma Anacortes Bellingham
The ocean bay ports of Coos Bay, Willapa River and Grays Harbor are of local significance only.
70 130 140 165 107 125

179.
II. FOREIGN AND COASTAL MOVEMENTS, BY PORT, OF THE SIX STUDY COMMODITIES
Table 2 shows waterborne exports and imports of our six study bulk commodities by port for 1968 and 1969, and table 3 shows comparable data for domestic waterborne coastal receipts and shipments for 1969 and 1970. Move-ment of the export commodities in foreign trade is limited to grains, which in both years approximated 6 million tons. Virtually all of these exports (5.4 mil-lion tons) moved through the Columbia River ports, with the balance moving principally through Tacoma and Seattle.
Of the import commodities, only alumina was of quantitative significance, accounting in 1969 for 1.8 million of a total of 2.5 million tons of imports of study bulk commodities. Imports in 1969 increased 700,000 tons over 1968.
Coastal movements in domestic trade were princi-pally petroleum products, which in 1970 accounted for 5.9 million tons out of a total of 6.6 million tons of receipts and for 1.5 million out of a total of 2.3 mil-lion tons of shipments. Almost all of the balance was crude petroleum.
Approximately half of the domestic waterborne receipts of petroleum products were received at Port-land, Oregon, and about one-quarter at Seattle, Washing-ton.

Exports Imports
Port/area
Columbia River area
Portland, Oregon
Astoria, Oregon
Longview, Wash
Kalama, Wash
Vancouver, Wash
Total
Northwest Washington
Port Angeles
Tacoma
Seattle
Everett
Bellingham
Total
Total, north Pacific coast
Total all study comm.
1968 1969
2,695 2,598 2,596 2,310
55 26 55 26
1,209 1,116 1,166 1,070
579 507 579 507
817 1,192 508 700
5,355 5,439 4,904 4,613
Total / grains-
196811969
Coal Phosphate
rock Total
196811969
Crude oil
Pet./ products
196811969 1968 11969
Iron ore Bauxite
1969 1968 1968 1969 1969 1968 1969 1968
Alumina Tot
1968 1 1969 1968 1968 1968
-- 2,596 2,310
-- 55 26
-- 1,166 1,070
-- 579 507
-- 508 700
-- 4,904 4,613
-- 20 17 -- 141 8 15 71 115 99 288
-- -- -- -- -- -- -- -- -- -- --
-- -- -- -- -- -- -- 43 46 43 46
-- -- -- -- -- -- -- -- -- -- --
-- -- -- -- -- 17 13 292 479 309 492
-- 20 17 -- 141 25 28 406 640 451 826
--
1,094 1,232 291 304 --
911 1,012 772 862 --
1 24
288 564 -- --
2,294 2,833 1,064 1,167 --
-- 291 304 353 371 65 20 -- 4 -- -- 385 533 803 928
-- 772 862 -- -- 139 150 ------------139 150
-- 1 --------------------24 -- 24
-- -- -- -- -- -- -- -- -- -- -- 288 564 288 564
-- 1,064 1,167 353 371 204 170 -- 4 -- -- 673 1,121 1,230 1,666
7,649 8,272 5,968 5,780 -- 5,968 5,780 353 371 224 187 -- 145 25 28 1,079 1,761 1,681 2,492
1
1969
Table 2. U.S. Waterborne Exports of Domestic and Foreign Merchandise and General Imports of Selected Bulk Commodities, North Pacific Coast, 1968 and 1969
(In thousands of short tons)
Note: Individual items may not add to totals due to rounding. a/ Includes food grains (wheat, rice, rye), feed grains (barley, corn, oats, cereals,n.e.c.), and soybeans and mill products. 13/ Includes gasoline, jet fuel and kerosene, distillate fuel oils, and residual fuel oils. C./ Less than 500 short tons.
Source: U.S. Department of Commerce, Bureau of the Census, U.S. Waterborne Exports of Domestic and Foreign Merchandise, SA-705, and U.S. Waterborne General Imports of Merchandise, SA-305, 1968 and 1969.

Dry bulk commodities " Crude oil a
Petroleum"
1969 1970 Port/area 1969 1970 1969 1970 1970 1969
Sect • Shipt. Rect. IShipt. Rect. IShipt. Recti Shipt. Rect. I Shipt. Rect. I Shipt. Rect.IShipt. Commodity {Rect.' Shipt. Commodity
20 -- 21 --
197 -- 173 36
-- -- -- -- -- -- -- --
15 -- 21 --
3,706 171 3,637 146
3,938 171 3,852 182
1/ 7
183 -- 188
253 5 260
436 5 455
- - -- -- -- 20 -- 21 --
- - -- -- -- 197 -- 173 --
__ __ -- -- -- -- -- -- __ __ -- -- -- -- -- -- - - -- -- -- 15 -- 21 --
363 -- 305 -- 3,343 127 3,332 126
363 -- 305 -- 3,575 127 3,547 126
1/ 7
183 -- 188
253 5 260
436 5 455
Total, all study comm.
2
-
0 Grains- d/
Columbia River areas/
Astoria, Oregon
Longview, Wash
Kalama, Wash
St. Helens, Oregon
Vancouver, Wash
Portland, Oregon
Total
Ocean Bay ports
Willapa River and Harbor and Naselle River, Wash
Grays Harbor and
Chehalis River, Wash
Coos Bay, Oregon
Total
Northwest Washington
Port Angeles Harbor
Port Townsend Harbor
Port Gamble Harbor
Olympia Harbor
Tacoma Harbor
Seattle Harbor
Everett Harbor and Snohomish River..
Anacortes Harbor..
Bellingham Bay and Harbor
Total
Total north Pacific coast
110 -- 128 -- -- -- -- -- 110 -- 128 -- -- -- -- -- -- --
20 -- 24 -- -- -- -- -- 20 -- 24 -- -- -- -- -- -- --
325 26 381 57 287 -- 258 -- 38 26 123 57 f/ --Iron ore -- --
f -1/ 1 Grains/ -- 1 Grain-54/
2,044 165 1,448 105 21 -- -- -- 2,023 164 1,448 104 ( 1/ Coal _ -- 1/ Coal _
9 9 --
219 1,675 352 1,985 -- 417 142 759 219 1,258 210 1,226
2,727 1,866 2,333 2,147 308 417 400 759 2,419 1,448 1,933 1,387 f/ 1 -_ -- 1
7,101 2,042 6,640 2,329 671 417 705 759 6,430 1,580 5,935 1,513 1/ 45 -- -- 57
- -- d/
20 Grains- e/
56-
d/ 44 Grains-
44
Table 3. U.S. Domestic Waterborne Coastal Receipts and Shipments of Selected Bulk Commodities, North Pacific Coast, 1969 and 1970
(In thousands of short tons)
27 Includes 2911, gasoline; 2912, )et fuel; 2913, kerosene; 2914, distillate fuel oil; and 2915, residual fuel oil. b/ Includes grains; 1011, iron ore and concentrates; 1051, bauxite and other aluminum ores and concentrates; 1121, coal and lignite, and 1471, phosphate rock. c/ Excludes ports of Bradford, Wauna, Beaver, Rainier, and Prescott. d/ Includes 0102, barley and rye; 0103, corn; 0104, oats; 0105, rice; 0106, sorghum grains; 0107, wheat; 0111, soybeans; and T049, grain mill products, n.e.c. e/ Includes 16,000 tons of aluminum ores shipped from Longview, Washington. T./ Less than 500 short tons.
Source- U.S. Department of the Army, Corps of Engineers, Waterborne Commerce of the United States, Part IV, "Waterways and Harbors, Pacific Coast, Alaska and Hawaii," 1969 and 1970.

183.
III. MAJOR PORTS AND CHANNELS
Only the channels leading to the crude oil and/or petroleum products and grain terminals of the six major ports will be reviewed. These ports are Portland, Long-view, Kalama, Vancouver, Tacoma, and Seattle.
1. Portland, Oregon. This port is located on the right bank of the Willamette River, about 8 nautical miles from the confluence with the Columbia River and about 97 nautical miles from the Pacific Ocean (figure 4). The port is located about 6 statute miles to the northwest of the business center.
2. Longview, Washington. Located on the right bank of the Columbia River, this port is situated about 58 nautical miles from the Pacific Ocean, just westward of the mouth of the Cowlitz River (figure 4).
3. Kalama, Washington. This port is also lo-cated on the right bank of the Columbia River. Its dis-tance to the mouth of the river is about 66 nautical miles (figure 4).
4. Vancouver, Washington. This is another port located on the right bank of the Columbia River. It is situated about 92 nautical miles from the Pacific Ocean, and is at the upstream limit of the Federal Project for the Columbia and Lower Willamette Rivers below Vancouver and Portland, Oregon. The main channel of the river passes between Vancouver and Hayden Island, a midriver island opposite the port (figure 4).

olumbia River
0 mi
Vancouver
St Johns Bridge 5
10 nu
Portland
Broadway-Bridge
S PAS 1Bridge
Willamette River
BLOWUP OF PORTLAND HARBOR
Bridge at Astoria
WASHINGTON
0
cle
65 mu
PACIFIC OCEAN A,-
Bridge at Longinew
OREGON
Kalama
Nehalem Bay
See insert Portland Habor ,
• 4 ,
Portland
Va
/0 mi
Tillamook Bay Scale of Statute Miles
0 5 10 15 =MEM
LEGEND
• Oil facility • Grain facility
FIGURE 4 CHANNELS AND BULK HANDLING FACILITIES, COLUMBIA AND WILLAMETTE RIVER HARBORS
Robert R Nathan Associates, Inc

185.
5. Tacoma, Washington. Tacoma Harbor is at the head of Commencement Bay, a southeasterly arm of Puget Sound. Tacoma is 25 nautical miles south of Seattle, Washington, and 143 nautical miles from the Pacific Ocean. The port district includes the entire area of Commencement Bay. From the ocean to the port, vessels traverse the Strait of Juan de Fuca, Admiralty Inlet, and Puget Sound. These waters are wide and deep.
Commencement Bay is bordered by hills on the southwest and northeast and by extensive tidal flats on the Puyallup River entrance between Point Brown and Point Defiance. It has an average width of 2 miles and a length of approximately 2.5 miles from Point Brown to the head of the bay. Most of the land bordering the bay is within the Tacoma city limits. The waters in Com-mencement Bay range in depth from 570 feet at the entrance to 100 feet at the head where they shoal abruptly to tidal flats. Eight waterways have been dredged in the tidal flats and the spoil used to fill adjacent land (figures 5 and 6).
6. Seattle, Washington. Seattle Harbor is at Elliott Bay, an easterly arm of Puget Sound, located near the middle of the sound. Seattle is 25 nautical miles north of Tacoma, Washington, and 125 nautical miles from the Pacific Ocean. From the ocean to the port, ves-sels traverse the Strait of Juan de Fuca, Admiralty In-let, and Puget Sound. These waters are wide and deep.
Elliott Bay is bordered by hills and by extensive tidal flats on the Duwamish River Delta on the southeast. The bay is about 6 miles wide at the entrance between West Point and Alki Point, has an average width of 2 miles, and a length of approximately 6 and 3 miles respectively from West Point and Smith Cove to the head of the bay. All land bordering the bay is within the Seattle city limits. The waters in Elliott Bay range in depth from 600 feet and over at the entrance to 70 feet at the head, where they shoal abruptly to tidal flats. Three waterways have been dredged in the tidal flats (figures 5 and 7).

123°30' 122°30' 122°00 121 °30' 123°00'
Strait of Georgia Bellingha
4W3o'
Stratt of Juan de Fuca •
CANADA .........
........ .......... .
...
UNITED STATES
I— 48°03' WOW
Marysville
Everett
MuksIteo
Edmonds
Kirkland 1
Bellevue
47°30' 47°30'
Tacoma
Scale of Statute Miles
5 10 15
Robert R Nathan Associates, Inc
47°00' - 47°00'
123°30' 121 °30'
FIGURES LOCATION OF PORTS, PUGET SOUND AND VICINITY
172°30' 122°00' 123°00'

Scale of Statute Miles
2 3
East Passage
LEGEND
• Oil facility • Grain facility
Robert R Nathan Associates, Inc.
'FIGURE 6. LOCATION OF BULK HANDLING FACILITIES, TACOMA HARBOR, WASHINGTON

LEGEND
• Oil facility • Grain facility
Scale of Statute Miles
12 3 4 5
PUGET SOUND
Robert R Nathan Associates, Inc
FIGURE 7 LOCATION OF BULK HANDLING FACILITIES, SEATTLE HARBOR, WASHINGTON

Willamette River, Ore.
River Channel
189.
The present status of the navigation channels to the Columbia River ports is given in table 4.
Table 4. Project Dimensions of Major Channels, North Pacific Coast
Name of channel Depth Width Length Location
--- ft.
Columbia River, Ore. and Wash.
- stat. miles ---
48 2,640 1.5 (1.5) 2/-0.0
40 6002/ 102.5 3.0-105.5
40 6001/ 11.62/ 101.5-113.1
Ocean Bar Channel.. b/ River Channels—
a/ Figures in parentheses indicate offshore locations. b/ Composed of a great number of bar channels of varying lengths. c/ Turning basin at Longview 1,200 feet wide and turning basins at Vancouver 800 feet wide. d/ Locally 1,900 feet wide. e/ From mouth to Broadway Bridge.

191.
IV. TERMINAL FACILITIES
Information on terminal and storage facilities for petroleum and petroleum products, grain, and bauxite at the six major ports and port areas is summarized here. The sources of these data are the relevant port series of the Corps of Engineers, all of which date back to the 1962-65 period.
The locations of grain and petroleum handling facilities in the major port areas are shown in figures 4, 6, and 7. There are five grain handling facilities at ports on the Columbia and Willamette Rivers, with storage capacity for 31.5 million bushels of grain. Three petroleum facilities are located at Longview and Vancouver, with storage capacity of approximately 0.5 million barrels.
At Tacoma, Washington, five oil handling facili-ties have a combined storage capacity of 2.4 million barrels, and two grain elevators have a combined stor-age capacity of approximately 5 million bushels.
In Seattle, 11 oil handling facilities with a combined storage capacity of more than 6 million bar-rels are owned by petroleum refiners and distributors. There are also two grain handling facilities with a combined storage capacity of 8.3 million bushels.
There is a refining capacity of approximately 265,000 barrels per day at three locations in northwest Washington (Ferndale, Anacortes, and Tacoma). In addi-tion, a large refinery is being constructed near Fern-dale by the Atlantic-Richfield Company.

192.
In the Pacific Northwest, there is an aluminum reduction capacity of approximately 1.5 million tons, about a third of which is located along the Columbia River, with the balance in Northwest Washington. Imports of alumina are for consumption by these plants.

193.
APPENDIX A. REVIEW OF STUDIES ON CHANNEL DEEPENING AND PORT EXPANSION
Coos Bay, Oregon, House Document No. 91-151, 91st Congress, 1st Session, September 3, 1969. This document recommends that the present channel system, 40 feet deep at mean lower low water across the outer bar and gradually reducing to 30 feet in the bay, be modified to 45- and 35-foot depths respectively at an estimated first cost of $9,100,000.
ANNEX C. DESIGN CRITERIA, ENGINEERING REQUIREMENTS, AND COST ESTIMATES OF DEEPWATER PORT ALTERNATIVES
SELECTED FOR DETAILED ANALYSIS

197.
CONTENTS
I. INTRODUCTION 199
II. GENERAL CONSIDERATIONS IN THE SELECTION OF ALTERNATIVES 203
Introduction 203 Summary of Alternatives Selected 216 Crude Oil 226 Dry Bulk 236
III. DESIGN CRITERIA FOR CRUDE PETROLEUM PORTS 241
Channels and Maneuvering Areas 241 Supertanker Berths 245 Pipelines Between Berths and Intermediate Storage 254
Intermediate Storage 261 Pipelines Between Intermediate Storage and Refineries 267
Transshipment Berths 270 Application of Design Criteria 271
IV. ENGINEERING REQUIREMENTS FOR CRUDE PETROLEUM PORTS 279
New York Area 279 Delaware Area 302 Mississippi Delta Area 340 Texas Area 357 Los Angeles-Long Beach Area 399 San Francisco Area 409 Bellingham-Ferndale (Washington) Area 430

198.
V. COST ESTIMATES OF CRUDE PETROLEUM PORTS 439
Unit Costs 439 Total Costs 471
VI. DESIGN CRITERIA FOR DRY BULK PORTS 483
Channels and Maneuvering Areas 483 Supercarrier Berths 484 Intermediate Storage 486 Transshipment Vessels 491
VII. ENGINEERING REQUIREMENTS FOR DRY BULK PORTS 493
Coal 493 Iron Ore 495 Grains 497 Description 500
VIII. COST ESTIMATES OF DRY BULK PORTS 519
Unit Costs 519 Total Costs 525
IX. COMBINATION OF CRUDE PETROLEUM AND DRY BULK PORTS 529
Delaware Bay Area 530 Mississippi Delta Area 533 Freeport, Texas Area 535
X. TEXAS-EAST COAST PETROLEUM PRODUCTS PIPELINE 537
Introduction 537 Throughputs and Selected Line Sizes 538 Horsepower Calculations 538 Installation Program 540 Cost 541

I. INTRODUCTION
This annex deals with the locational, engineering, and direct economic cost characteristics of the specific deepwater port alternatives that were selected for detailed analysis.
The commodities and the port and coastal areas for which deepwater ports needed to be considered in detail were determined on the basis of the volumes of present and projected flows between U. S. and foreign coastal zones of the commodities studied in Annex A, and evaluation of economic, institutional, and technical factors expected to have an influence on the size and capacity characteristics of vessels to be employed in the ocean transport of these commodities (Annexes E and F).
An understanding of the purposes and limitations of the selection of these alternatives and of the design and cost estimates is essential. The prime purpose of the selection was to provide a basis for a preliminary economic and environmental evaluation of specific and concrete deepwater port alternatives having capacity, locational, and engineering characteristics realistic-ally related to the indicated requirements. Therefore, the development of the design criteria and the deter-mination of the engineering requirements of specific alternatives in this annex are undertaken with the prime objective of providing a basis for the development of order-of-magnitude estimates of first costs and operation and maintenance costs essential to economic benefit-cost analysis.

200.
The selection was the result of a screening pro-cess which, in addition to the commodity flow data, took into account such factors as indicated vessel draft requirements; locations of bulk commodity production and consumption; coastal water depth characteristics; dif-ferent concepts of berths, transshipment and storage locations; and present or past proposals for deepwater port developments.
It was considered essential to the purposes of the study to demonstrate the environmental and economic characteristics of different locational and conceptual approaches to the provision of deepwater port facilities. Thus, on the Atlantic coast, for example, we study crude petroleum ports at locations in New York Harbor and Delaware Bay that are capable of supplying local as well as regional needs, with fixed berths and pipeline con-nections to refineries; monobuoys off the coast of northern New Jersey to supply regional needs, with pipe-line links to refineries; and fixed berths connected to an artificial island in the Atlantic Ocean off the Delaware Capes, with barge links to refineries. We also consider the supply of crude petroleum products to the east coast from refineries on the gulf coast, supplied with imported crude petroleum delivered through deep-water ports at different locations and employing differ-ent concepts. Thus a range of possible alternative solutions with varying engineering, geographic, economic, and environmental characteristics is evaluated.
The number of alternatives selected was limited arbitrarily by the time and resources available. Hence, not all alternatives meriting consideration were included. On the whole, the list of alternatives, in terms of locational and conceptual characteristics, would appear
V/
to include all or most of those suggested by existing refinery location patterns, by water depth conditions in the port and coastal areas, and by the state of the art of port design. But it does not, for example, in-clude the alternative of wholly new refinery centers where naturally deep water is more accessible. Examples of such areas are the State of Maine and the Eastern Shore of Maryland off Chesapeake Bay, where naturally deep water is available, but where access by deep-draft vessels is obstructed by stretches of shallower water

201.
and by the tunnel structures of the Chesapeake Bay Bridge and Tunnel. The exclusion of these and other possible alternatives does not imply that they may not have both environmental and economic merit equal or superior to some of the alternatives studied.
On the other hand, the alternative of deepening channels to existing east coast refinery centers to accommodate 70-foot draft vessels, as in the selected alternatives, was excluded. Studies made by the Corps of Engineers indicated that the economic costs, as well as the environmental problems and impacts, of such deepening would be so much higher than those of other possible deepwater port alternatives as to rule it out for further study.
In addition, one must understand the tentative character of the estimates of first costs and operation and maintenance costs of the deepwater port alternatives studied. First costs were estimated for the major pro-ject components included in the engineering design on the basis of best available information, mainly from secondary sources, as were costs of operation and main-tenance. The results should be regarded as order-of-magnitude estimates which serve the need of broad com-parative evaluation of the benefits and costs of the alternatives studied. Although they should be useful in determining the direction of further, more detailed studies, they would not satisfy the requirements of a feasibility study.

II. GENERAL CONSIDERATIONS IN THE SELECTION OF ALTERNATIVES
Introduction
The objective of the analysis in this annex is to determine the main technical components of various deepwater port alternatives, to present their physical requirements, and to establish a reasonably firm basis for estimating the first and the annual operating and maintenance costs of these alternatives.
The engineering aspects of this detailed analysis will deal with the selection of sites and with the determination of the number of berths; the dimensions of various maneuvering areas; the quantities -- if any -- to be dredged for these areas; the length of breakwaters and the volumes of sand fill required for island construction; the storage capacities and land acreages; the lengths and sizes of pipelines; the capa-city of booster pumps; and the lengths of conveyor belts and trestles.
Port Areas
In a study of this nature, a limited number of port areas can be considered. The selection of port areas was based on a combination of the port area's nearness to the existing waterfront facilities, its nearness to existing or projected refinery centers in the case of crude oil, and the characteristics of the deepwater contour lines in general.

204.
The following port areas will be considered for this detailed analysis:
East coast:
Area 1. New York Area 2. Delaware Bay Area 3. Chesapeake Bay
Gulf coast:
Area 4. Mississippi Delta Area 5. Texas
West coast:
Area 6. Los Angeles-Long Beach Area 7. San Francisco Area 8. Ferndale-Bellingham, Washington.
The numbering of the alternatives will be based on the numbering of these port areas. For example, the first, second and third alternatives in the New York area (area 1) will be numbered 1-1, 1-2, and 1-3, res-pectively.
Sites and Water Depths
The selection of sites will mainly be based on the characteristics of the deepwater contour lines in the considered port area. Therefore, it is not possible to select a specific site without determining in advance the required water depth. Even given a particular site and water depth, various alternatives are possible. For instance, the cost of more or less dredging can be weighed against the cost of shorter or longer pipelines or trestles, and the cost of a breakwater and artificial island in shallower or deeper water can be weighed against the cost of longer or shorter trestles or sub-marine pipelines, etc. The close relationship between site and water depth makes it impossible to separate one from the other.
The selection of sites and water depths will also be based on present and past proposals for deepwater port developments in the considered port areas. Such

205.
developments are or were proposed or are under serious consideration off Long Branch, New Jersey; in and off the Delaware Bay; at Hampton Roads; in the Mississippi Delta; off Texas; and at Los Angeles-Long Beach and off Moss Landing, California.
Berths
Various types of crude oil berths exist. However, fixed berths are most commonly used for inland harbors, whereas single buoy moorings are used at various off-shore locations. Fixed berths have been the only type of berth for dry bulk handling until recently. Now some monobuoys are in operation, handling iron ore in slurry form. Other types of crude oil berths are the conventional buoy moorings and single pile moorings. A description of these different types of berths is pre-sented below.
Fixed Berths
Fixed berths can be one-sided sea islands (margi-nal berths) or double-sided sea islands (island piers). Island piers can be considered only if sufficient man-euvering space at either side of the pier is available.
A fixed berth consists of the following basic components:
1. A central unloading platform which would carry the required unloading arms, piping, and metering.
2. Breasting dolphins, spaced at such distances to allow berthing of tankers in the applicable tanker range and capable of absorbing the breasting energy at the assumed approach velocity of the maximum specified vessel. Two secondary dolphins would be required when the range in the length of the tankers served includes smaller tankers that could not otherwise be supported on their parallel sides.
3. Four mooring dolphins located along the lon-gitudinal axis of the sea island. If tankers with a

206.
large range of lengths are to be served, two more moor-ing dolphins would be required. The mooring and breast-ing dolphins are normally interconnected by catwalks to provide easy access by personnel handling the mooring lines.
A typical layout of a double-sided sea island is depicted in figure 1.
Berthing and deberthing would generally be ef-fected with the aid of tugs. For a maximum-size vessel of 300,000 d.w.t., the total bollard pull of the tugs should be approximately 90 tons. A 2,000-horsepower tug with Kort-nozzles propelling arrangement has a bol-lard pull of about 28 tons. The minimum number of tugs required would therefore be three 2,000-horsepower tugs.
Fixed berthing structures do not consist of stan-dard manufactured components.
A helicopter landing deck could be located on one of the outer mooring dolphins protruding over the side. It should be supported by cantilevered steel truss construction so as not to interfere with the mooring lines. A helicopter deck is required for the evacuation of injured personnel or for use during other emergencies.
If the sea island is not connected by trestle to the shore or to an offshore storage area, a launch land-ing for personnel would be required at one of the outer mooring dolphins.
The adequacy of a fixed structure solution de-pends on the average weather, sea, and current condi-tions in the area under consideration. Waves higher than 6 feet and winds with a velocity of 24 knots and over, will suspend berthing and deberthing operations, whereas currents not parallel to the axis of the berth will increase the difficulty of these maneuvers. Wind speeds in excess of 37 knots will suspend unloading operations because of the forces on the unloading equip-ment.

ELEVATION
lop
SCALE IN FEET
OUTER MOORING DOLPHIN
CATWALK
INNER MOORING DOLPHIN
MANIFOLD AND UNLOADING ARMS ON UNLOADING PLATFORM
SUPERTANKER
INNER MOORING DOLPHIN
BREASTING DOLPHIN BREASTING DOLPHIN
PLAN
GANGWAY
OUTER MOORING DOLPHIN
LIGHT
11661 Fir •01.Pro- Elm
mr.
FIGURE 1. FIXED BERTH LAYOUT ROhert R Nathan Associates, Inc
iiIIiiiiii
6 1"6 0
AL
MIS rAk 510 WrA Mak tam P■- ■■
CHART DATUM ,Aor. 11PA 2010
SIOVA CAIKS MUD LINE
LADEN
NOTE BREASTING DOLPHINS NOT SHOWN.
CROSS SECTION
SCALE IN FEET 0 IW
CHART DATUM
MUD LINE

209.
No attempt will be made in this study to evaluate the above-mentioned conditions for the various deepwater ports selected for detailed analysis. When fixed berths are considered, it will be assumed that the weather, sea, and current conditions are such that this type of berth is feasible without the construction of breakwaters.
Single Buoy Moorings
Single buoy moorings (SBM's), also referred to as monobuoys, consist of a buoy mooring designed to resist the loads from tankers attached to it with bow mooring lines. Tankers will always be aligned with the resultant of current, wind, and wave forces. Therefore, a minimum of force caused by these elements is trans-mitted to the mooring. The buoy is generally kept in position with chains that are anchored to piles.
The oil is transferred from the midship tanker manifold to the buoy through floating hoses. When not in operation, these hoses are normally allowed to swing free on the water surface. However, newly designed hoses are able to sink to the sea bottom when out of use to reduce the damage caused by adverse wave condi-tions. When tankers are moored, the hoses are pulled alongside the tanker by a launch which remains in attendance during oil transfer. Raising of the hoses to the tanker's manifold is generally done by the ship's gear.
The hoses are connected to a swivel on the buoy, which allows the hoses to rotate 360 degrees. The oil is transferred from the buoy to the submarine line by sub-marine hoses. Buoyancy chambers keep these hoses in a lazy S-curve, which allows movement of the buoy.
SBM's with accessories may be purchased as stan-dard manufactured equipment. A typical single buoy mooring installation is depicted in figure 2.
SBM installations have been in operation at var-ious locations throughout the world. Experience with

, ///.ftCHA IN
FLOATING HOSES
TANKER MANIFOLD
CONCRETE SINKER
••■ I • ,
V .
PIPE SWIVEL MANIFOLD 7
-1--
\\
41, Si
SUBMARINE PIPELINE
CONCRETE SINKER
PI PE MANIFOLD FRAME
AND ANCHOR BLOCK SUBMARINE HOSES
MOORINGMOORING LINES
BEACON
NMOORING BUOY CHART DATUM
III III I II
TANKER (LIGHT)
11•••
STEEL CHAIN - HAIN
SINKER
SUBMARINE PIPELINE
1\ ANCHOR
MUD LINE
ANCHOR SINKER
FLOATING HOSES
PLAN
ELEVATION
SCALE IN FEET
0 100 200 300 400 500 iiMi.===11K:=11111111.
Robert R. Nathan Associates, Inc.
FIGURE 2 , MONOBUOY LAYOUT

213.
this type of installation has generally been satisfac-tory. At some locations, however, adverse sea and weather conditions, as well as improper operating prac-tices, have caused considerable downtime, high mainten-ance costs, and occasional spills.
An experienced disadvantage of SBM's is that a tanker has a tendency to creep towards the buoy during periods of calm weather and slack tide. This could lead to damage as the bulbous bow of modern tankers could foul the buoy mooring chains or submarine hoses. Therefore, a launch of sufficient power should remain by the tanker to keep it at a satisfactory distance from the buoy.
Floating hose strings are susceptible to damage by vessels, particularly at night, and to damage by waves in adverse sea conditions when they will cause the hoses to override. Sticking of the turntable and sub-sequent wrapping of the hoses around the buoy can also cause damage. The submarine hoses can be damaged due to shifting of the buoy in adverse sea conditions.
In spite of these difficulties, SBM's find grow-ing application. New developments exist in the con-struction of buoys and the fabrication of marine hoses. In particular, the development of the integral hose is believed to be a substantial improvement. SBM's are particularly suitable for locations where rotary tidal stream patterns exist or where sudden changes in wind direction are characteristic.
In principle, tankers can moor at SBM's without tug assistance. To berth safely at SBM's a 4,000-foot radius is required. However, at various locations where SBM's have been installed, the aid of high-power launches or low-power tugs are operationally necessary or desirable to reduce the berthing and deberthing times of large tankers.
For the maintenance of submarine hoses and anchor chains, a craft equipped with suitable lifting gear and diving equipment will be required. Regular inspection,

214.
maintenance and repairs of buoy, hoses, chains and an-chors is required for a successful operation. The hoses must be replaced regularly. Drydocking of the buoy might be required every 3 to 5 years, depending upon site. Downtime can be at least 1 day per month. Dry-docking of the buoy might take 1 month.
Conventional Buoy Mooring
A conventional buoy mooring (CBM) is a facility at which tankers are moored to a number of buoys, gener-ally in one heading only. Unloading of the tankers takes place through hoses which are connected to the submarine line. These hoses rest on the sea bottom when not in use. Hose marker buoys are attached to the sub-marine hose strings to enable the hoses to be found and lifted from the sea bottom. A CBM installation consists of standard manufactured equipment.
Tidal streams of a rotary nature would create major maneuvering difficulties during berthing and de-berthing operations. Because of the great flexibility of mooring lines and anchor chains, it is doubtful if this type of mooring can successfully be applied when the tanker size is 100,000 d.w.t. and over.
Single Pile Moorings
The principle of single pile moorings is the same as that of a monobuoy. This mooring has the same advan-tages as the monobuoys in that tankers are aligned with the resultant of the forces of currents, waves and wind, and that operations can be effected without the aid of tugs. In addition, single pile moorings endeavor to eliminate the major disadvantages of the monobuoys (i.e., the vulnerability of the hoses and the maintenance of the system) by replacing the flexible elements by solid or truss structures. The buoy and submarine hoses are replaced by a pile or truss-type of tower, firmly fixed to the sea bottom, and the floating hoses are re-placed by a floating boom, hinged where appropriate to reduce the forces due to currents and waves. However, these forces are considerably higher than they are for monobuoys, and hydraulic model tests will be required to determine these forces. The construction and

215.
installation costs of these moorings are 2 to 5 times higher than those of monobuoys. The design and main-tenance of the hinges are the critical elements of this type of mooring.
Single pile moorings do not consist of standard manufactured elements. Several consulting engineering firms have patented designs.
Because of the nature of this study and the char-acteristics of the various types of berths, the follow-ing sections will evaluate only two types of berths: fixed berths or monobuoys for crude oil ports, and fixed berths only for dry bulk ports. Each crude oil alternative will consider one type of berth only.
Storage
In principle, the storage area could be located on shore or off shore. If both cases are equally feas-ible, both options will be developed. However, to limit the number of alternatives, only one case -- storage located either on shore or off shore on an artificial island -- will be evaluated if preliminary investiga-tions indicate that one case might be preferred over the other for technical, economical and/or environmental reasons.
If the berthing facilities would be located at a great distance from the shore, or if onshore storage is not feasible, offshore storage might be considered. The storage can be on an artificial island, in sub-marine tanks or in floating pontoons. An artificial island might be attractive if shallow areas exist near the berthing area and if the soil characteristics are suitable for this type of construction. Submarine stor-age might be considered if there are no shallow areas near the berthing facilities and if the feasibility of floating vessels is doubtful because of extreme weather and sea conditions at the site. Floating storage can be considered only when weather and sea conditions are rather moderate and when sufficient water depth is available for the maneuvering of the tankers. In all three cases it is possible to move the tankers

216.
directly to the storage or to moor them at some distance from the storage to fixed berths, monobuoys, conventional buoy moorings or single pile moorings.
Transshipment
In principle, all crude oil alternatives can be evaluated with pipelines as well as with transshipment barges as the links between deepwater ports and refinery areas. However, for each alternative a choice will be made between the two. Pipelines will be selected where the storage is assumed to be on shore and the refinery areas are relatively near, and barges will be selected where the storage is assumed to be off shore and the refinery areas are relatively distant. For the regional alternatives of the east and gulf coasts, both systems will be evaluated; however, for the regional alternatives of the west coast, pipelines alone will be considered to avoid transshipment by barge in the traffic-congested areas of San Francisco.
All dry bulk alternatives will consider only transshipment by barges, except where direct loading is anticipated.
Summary of Alternatives Selected
The selected alternatives will vary by commodity, site, location of storage (off shore on an artificial island or on shore), vessel size or vessel draft. Where appropriate, existing proposals for deepwater port dev-elopments will be included in the alternatives. For the alternatives dealing with crude oil, the type of berth (fixed or monobuoy) and the type of transshipment (pipeline or barge) will also vary. For some alterna-tives, subalternatives will be established in which the deadweight tonnage for a given draft, or the draft for a given deadweight tonnage, will be varied. Also different throughputs of the deepwater port will be considered in some subalternatives.
Table 1 presents a summary of the crude oil deep-water port alternatives selected for detailed analysis.

217.
A total of 26 alternatives will be evaluated, of which eight are on the north Atlantic coast, nine on the gulf coast, and nine on the Pacific coast. The total number of alternatives and subalternatives is 67, of which 32 are on the north Atlantic coast, 24 on the gulf coast, and 11 on the Pacific coast. Thirteen deepwater port sites will be evaluated, of which two are located in the New York area, two in the Delaware area, one in the Mississippi Delta, two in Texas, one at Los Angeles, three at San Francisco, and one near Ferndale-Belling-ham, Washington. Eleven different storage locations will be considered, of which seven are on shore and four are on an artificial island. Of the 26 alternatives, 21 will consider fixed berths and five will consider monobuoys. Four alternatives will consider transship-ment by barge only, 16 will consider transshipment by pipelines only, and six will consider transshipment partly by pipeline and partly by barge. A total of seven different design vessels will be considered; two will be considered on the north Atlantic coast; four will be considered on the gulf coast, and five will be considered on the Pacific coast.
Table 2 presents a summary of the dry bulk deep-water port alternatives selected for detailed analysis. A total of seven alternatives will be evaluated, of which three are on the north Atlantic coast and four are on the gulf coast. The total number of subalternatives is 17, of which six are,on the north Atlantic coast and 11 are on the gulf coast. Four deepwater port sites will be evaluated, of which one is located in the Lower Delaware Bay, one at Hampton Roads, Virginia, one in the Mississippi Delta, and one at Freeport, Texas. Four different storage locations will be considered, of which two are on shore and two are on an artificial island. One alternative will consider direct loading and all other alternatives will hypothesize transshipment by barge. Four different design coal carriers, two dif-ferent design iron coal carriers, and three different design grain carriers will be considered.
Table 3 presents a summary of deepwater port al-ternatives handling crude oil as well as dry bulk.
The following sections present a detailed des-cription, by coast and commodity, of the various factors

0050.. 0060.. 0070.. 0080..
0090.. 0100 0110.. 0120..
0130.. 0140.. 0150.. 0160..
0170.. 0180.. 0190.. 0200..
0210.. 0220.. 0230.. 0240..
0250.. 0260.. 0270.. 0280..
0290.. 0300.. 0310.. 0320..
0330.. 0340..
0350.. 0360.. 0370.. 0380..
0390.. 0400..
0410.. 0420..
Table 1. Summary of Crude Oil Deepwater Port Alternatives Selected for Detailed Analysis
Code no.-
No.
Alt.
Sub.
Port area
Storage loca-tion
Art. island
Type of berth
Mono-buoy
Type of Water depth= transshipt (ft.)
At M.H.W.
Design vessel
Size (d.w.t.)
Annual throughput (mil. 1. tons/year)
1980
Location or site -
Refinery areas served
On- shore
Fixed Pipe line
Barge At M.L.W.
Tidal rise
Draft (ft.)
2000
0010.. 1-1 A 0020.. 1-1 B 0030.. 1-1 C 0040.. 1-1 D
X X X 70-77 4 74-81 70 300,000 30 35 X X X 70-77 4 74-81 70 300,000 35 70 N.Y., N.Y. Lower N.Y. Bay Arthur Kill X X X 70-77 4 74-81 70 400,000 30 35 X X X 70-77 4 74-81 70 400,000 35 70
1-2 A X X X 70-77 4 74-81 70 300,000 100 150 1-2 B Arthur Kill & X X X 70-77 4 74-81 70 300,000 150 300 N.Y., N.Y. Lower N.Y. Bay 1-2 C Delaware R. X X X 70-77 4 74-81 70 400,000 100 150 1-2 D X X X 70-77 4 74-81 70 400,000 150 300
1-3 A X X X 77 4 81 70 300,000 100 150 1-3 B Arthur Kill & X X X 77 4 81 70 300,000 150 300 N.Y., N.Y. Long Branch 1-3 C Delaware R. X X X 77 4 81 70 400,000 100 150 1-3 D X X X 77 4 81 70 400,000 150 300
2-1 A X X X 73-80 4 77-84 70 300,000 70 115 2-1 B Delaware X X X 73-80 4 77-84 70 300,000 115 230 Big Stone Be. Delaware R. 2-1 C Bay X X X 73-80 4 77-84 70 400,000 70 115 2-1 D X X X 73-80 4 77-84 70 400,000 115 230
2-2 A X X X 73-80 4 77-84 70 300,000 70 115 2-2 B Delaware X X X 73-80 4. 77-84 70 300,000 115 230 Big Stone Be. Delaware R. 2-2 C Bay X X X 73-80 4 77-84 70 400,000 70 115 2-2 D X X X 73-80 4 77-84 70 400,000 115 230
2-3 A X X X 73-80 4 77-84 70 300,000 100 150 2-3 B Delaware Delaware R. & X X X 73-80 4 77-84 70 300,000 150 300 Big Stone Be. 2-3 C Bay Arthur Kill X X X 73-80 4 77-84 70 400,000 100 150 2-3 D X X X 73-80 4 77-84 70 400,000 150 300
2-4 A X X X 73-80 4 77-84 70 300,000 100 150 2-4 B Delaware Delaware R. & X X X 73-80 4 77-84 70 300,000 150 300 Big Stone Be. 2-4 C Bay Arthur Kill X X X 73-80 4 77-84 70 400,000 100 150 2-4 D X X X 73-80 4 77-84 70 400,000 150 300
2-5 A X X X 77-80 4 81-84 70 300,000 100 150 2-5 B Delaware Off Delaware Delware R. & X X X 77-80 4 81-84 70 300,000 150 300 2-5 C Bay Capes Arthur Kill X X X 77-80 4 81-84 70 400,000 100 150 2-5 D X X X 77-80 4 81-84 70 400,000 150 300
4-1 A Miss. R. Garden Is. X X X 63-66 d/ -- 55 200,000 100 450 Gulf Coasts/
4-1 B Delta Bay X X X 63-66 -- -- 55 200,000 150 600
4-2 A X X X 81-84 d/ -- 70 300,000 100 450 4-2 B Miss. R. Garden Is. X X X 81-84 -- -- 70 300,000 150 600 Gulf Coast
s/ 4-2 C Delta Bay X X X 81-84 -- -- 70 400,000 100 450 4-2 D X X X 81-84 -- -- 70 400,000 150 600 4-3 A Miss. R. Garden Is. s/ X X X 109-114 d/ -- 95 500,000 100 450 Gulf Coast- B Delta Bay X X X 109-114 -- -- 95 500,000 150 600 5-1 A X X X X 63 d/ -- 55 200,000 100 450 Texas Freeport Gulf Coast- 5-1 B X X X X 63 -- -- 55 200,000 150 600
continued--

Gulf Coast2/
Gulf Coast2/
Gulf Coast2/
Gulf Coast2/
Gulf Coasts/
Los Angeles-Long Beach
, L.A.-Long f/ Beach, S.F.—
Richmond-Avon
Richmond-Avon
Richmond-Avon
Richmond-Avon
Richmond-Avon
San Francisco-'
San Francisca,f/
L.A.-L. Beach
Richmond-Avon
Richmond
Richmond-Avon
g/ Monterey Bay
Strait of
Los Angeles- San Pedro Long Beach Bay/
Los Angeles- San Pedro Long Beach Bay/
San Fran. Richmond
Texas Freeport
Texas Freeport
Texas
Texas
Texas
Freeport
Freeport
Freeport
a/ Code numbers shown for each alternative are those used in the computer computation of benefits and costs (Annex F). b/ Excluding overdepth. c/ Gulf coast refineries d/ The tidal rise is not e/ For subalternative A, f/ For subalternative A, g/ Moss Landing.
are located at Houston-Baytown, Beaumont-Port Arthur, Lake Charles, Baton Rouge, New Orleans, Corpus Christi and Pascagoula. taken into account; therefore, the water depth at M.L.W. is the governing minimum water depth. Los Angeles Harbor. San Francisco refineries are located in the Richmond-Avon area.
Table 1. Summary of Crude Oil Deepwater Port Alternatives Selected for Detailed Analysis continued--
Alt.
No. Sub.
Storage loca-tion
Art. island
Type of berth
Mono-buoy
Type of transshipt,
Pipe-line
Water depth " (4.)
At M.H.W.
Design vessel
Size (d.w.t.)
Annual thr (mil. 1. t
1980
oughput ons/year)
2000
Code no.—
Port area Location or site
Refinery areas served
On- shore
Fixed At
Barge M.L.W. Tidal rise
Draft (ft.)
0430.. 5-2 A 0440.. 5-2 B 0450.. 5-2 C 0460.. 5-2 D
0470.. 5-3 A 0480.. 5-3 B
0490.. 5-4 A 0500.. 5-4 B
0510.. 5-5 A 0520.. 5-5 B 0530.. 5-5 C 0540.. 5-5 D
0550.. 5-6 A 0560.. 5-6 B
0570.. 6-1 A 0580.. 6-1 B
0590.. 6-2 A 0600.. 6-2 B
0610.. 7-1 -
0620.. 7-2 - San Fran.
0630.. 7-3 - San Fran.
0640.. 7-4 - San Fran.
0650.. 7-5 - San Fran.
0660.. 8-1 - Bellingham- Ferndale Georgia
Bellingham- Strait of Ferndale Georgia
X X 81 d/ -- 70 300,000 100 450 X X 81 -- -- 70 300,000 150 600 X X 81 '-- -- 70 400,000 100 450 X X 81 -- -- 70 400,000 150 600
X X 109 d/ -- 95 500,000 100 450 X X 109 -- -- 95 500,000 150 600
X X 58-66 d/ -- 55 200,000 100 450 X X 58-66 -- -- 55 200,000 150 600
X X 74-84 d/ -- 70 300,000 100 450 X X 74-84 -- -- 70 300,000 150 600 X X 74-84 -- -- 70 400,000 100 450 X X 74-84 -- -- 70 400,000 150 600
X X 100-114 d/ -- 95 500,000 100 450 X X 100-114 -- -- 95 500,000 150 600
X 74-81 d/ -- 70 300,000 28 111 X 74-81 -- -- 70 400,000 28 111
X 74-81 d/ -- 70 300,000 43 171 X 74-81 -- -- 70 400,000 43 171
X 48-53 5 53-58 50 157,000 15 60
X 48-53 5 53-58 50 157,000 15 60
X 57-62 5 62-67 58.5 250,000 15 60
X 57-62 5 62-67 58.5 250,000 15 60
X X 95 d/ -- 83 400,000 15 60
X 91 d/ -- 83 400,000 15 60
X 91 d/ 83 400,000 43 171 0670..1 8-2 -

0680.. 0690.. 0700.. 0710..
0720.. 0730.. 0740.. 0750..
0760.. 0770..
Miss. R. Garden Is. Delta Bay
- Miss. R. Garden Is. - Delta Bay
Miss. R. Garden Is. Delta Bay
- Chesapeake Hampton Rds.
Bay
Texas Freeport
1 2 Delaware 1 Bay 2
1 2 Delaware Big Stone Be. 1 Bay 2
X
X
X
X
100 100 25
Norfolk and Newport News
Miss. River, Texas & La. coast ports
Mobile, Houston, X Baton Rouge X
X
65 58.5 50 65 50
58.5
250,000 250,000 120,000
65 250,000 58.5 250,000
65 58.5 50
250,000 250,000 120,000 250,000 120,000 250,000
65/58.5 250,000 50 120,000
75-78 c/ 67-70 -- 58-60 --
75-78 c/ 67-70 --
75-78 c/ 67-70 -- 58-60 -- 75-78
[
58-60 -- 67-70
75/67 £- 58 --
Coal
1980 12000
32.8 58.9 18.0 23.6 18.0 23.6
7.6 10.4 7.6 10.4
7.6 10.4 32.8 58.9 7.6 10.4 18.0 23.6
18.0 23.6 7.6 10.4
18.0 23.6 7.6 10.4
18.0 23.6 18.0 23.6
250,000 45.4 43.7 250,000 45.4 43.7 250,000 11.5 6.4 250,000 11.5 6.4
250,000 45.4 43.7 12.5 17.1 250,000 45.4 43.7 12.5 17.1 250,000 11.5 6.4 12.5 17.1 250,000 11.5 6.4 12.5 17.1
4 75-82 65 4 75-82 65 4 67-74 58.5 4 67-74 58.5
4 75-82 65 4 75-82 65 4 67-74 58.5 4 67-74 58.5
!GIMP= Table 2. Summary o 1 Deepwater Port Alternatives Selected for Detailed Analysis
Code no.-
0780.. 0790.. 0800..
0810.. 0820..
0830.. 0840.. 0850..
0860..
0870.. 0870..
As- b/ sump.-
Port area Location or
site
Storage
On-shore
Coal
area-
Water depth12/
(ft.)
Commodity and annual throughput (mil. 1 tons/yr.)
Location
Art. Is.
Alt.
No. Sub.
2-6 A 2-6 A 2-6 B 2-6 B
2-7 A 2-7 A 2-7 B 2-7 B
3-1 A 3-1 B
4-4 A 4-4 B 4-4 C
4-5 A 4-5 B
4-6 A 4-6 B 4-6 C
4-6 D
5-7 A 5-7 B
Links to existing ports
Hampton Roads and
Baltimore
Same as alternative 4-4 and 4-5
Texas ports
Design vessel
Di-rect
71-78 71-78 63-70 63-70
71-78 71-78 63-70 63-70
X 55-60 2.5 57.5-62.5 52 128,000 46.1 46.6 X 55-60 2.5 57.5-62.5 52 179,000 46.1 46.6
Hampton Roads, Big Stone Be. Baltimore,
Philadelphia-Trenton
Ld./unld.
Trans-shpt. barge
x
At M.L.W.
Tidal rise
At M.H.W.
Draft (ft.)
Size (d.w.t.)
Iron ore t Grain
198012000 198012000
a/ Code numbers shown for each alternative are those used in the computer computation of benefits and costs. b/ For an explanation of the two assumptions, refere to chapter VI. c/ The tidal rise is not taken into account; therefore, the water depth at M.L.W. is the governing minimum water depth.

Table 3. Summary of Deepwater Port Alternatives Handling Crude Oil As Well As Dry Bulk
Grain
Location or site
Commodities
Iron ore
Combination of alternatives Alternative
number Port area
Crude oil Coal
2-8
2-9
2-10
2-11
2-12
2-13
2-14
2-15
4-7
4-8
4-9
4-10
4-11
4-12
4-13
4-14
4-15
5-8
5-9
5-10
X X 2-1 & 2-6 X X X 2-1 & 2-7 X X 2-2 & 2-6
Delaware Big Stone X X X 2-2 & 2-7 Bay Beach X X 2-3 & 2-6
X X X 2-3 & 2-7 X X 2-4 & 2-6 X X X 2-4 & 2-7
X X 4-1 & 4-4 X X 4-1 & 4-5 X X X 4-1 & 4-6
Mississippi Garden Is- X X 4-2 & 4-4 River Delta land Bay X X 4-2 & 4-5
X X X 4-2 & 4-6 X X 4-3 & 4-4 X X 4-3 & 4-5 X X X 4-3 & 4-6
X X 5-4 & 5-7 Texas Freeport X X 5-5 & 5-7
X X 5-6 & 5-7

226.
evaluated in the selection of the sites, storage loca-tions, vessel sizes or vessel drafts, throughputs, and types of berth and transshipment in the case of crude oil.
Crude Oil
East Coast
The two major oil refinery areas on the east coast are located along the Arthur Kill and Delaware River. Because these two areas are only about 100 miles apart, alternatives will be considered whereby each area is served by an individual deepwater port (local ports) and whereby both areas are served by one port (regional ports).
Sites
Area 1 -- New York. Depending on the water depth considered, various sites for a deepwater port that would be protected against heavy wave attack exist in the New York area. For depths in the 40- to 60- foot range, several potential sites exist in the vic-inity of Staten Island or Sandy Hook. The berths would be located in the Upper New York Bay, the Narrows, or the Anchorage, Ambrose or Sandy Hook Channels. The intermediate storage could be located on Staten Island or at Bayonne near the deepwater area, or could be located nearer the refineries. For depths in excess of 60 feet, the dredging quantities would increase rap-idly for sites near Bayonne or Staten Island. Many potential sites for depths up to 100 feet exist in Long Island Sound. However, tank farm location and pipeline routing would present many environmental and land-use difficulties.
The site on Romer Shoal (alternatives 1-1 and 1-2) was selected for the following reasons:
1. A more seaward location would provide less shelter for vessels entering the turning basin area, and in addition would result in a more expensive island because of greater water depth and more exposure to waves during construction.

227.
2. A more landward location would result in greater dredging volumes and the possibility of more interference with all other traffic.
3. Because preliminary investigations showed that an intermediate tank farm on Staten Island most likely would be environmentally difficult to realize, and because an offshore island would not pose this is-sue, only an offshore island will be considered.
4. The submarine pipeline to the refinery areas could follow an existing pipeline route through Raritan Bay between Morgan, near South Amboy, New Jersey, and Rockaway Point on Long Island, so that no pipeline would cross Staten Island.
The site off Long Branch (alternative 1-3) was selected because an actual proposal deals with this particular location. The 80-foot contour line is lo-cated only 6 miles off shore at this location.
Area 2 -- Delaware Bay. Depending on the water depth considered, various sites for a deepwater port that would be protected against heavy wave attack are available in the Lower Delaware Bay area. However, the characteristics of the sites are more or less similar. The site near Big Stone Beach, Delaware (alternatives 2-1 through 2-4), was selected because it deals with an actual proposal, and because it is located near a nat-urally deep area. For depths in excess of 80 feet, this area is 3.5 miles long and is over 1/2 mile wide for a length of 2 miles. Also, a naturally deep site lo- cated about 10 miles off the Delaware Capes (alternative 2-5) was selected because it would have different envir-onmental characteristics than the site inside the bay. At this particular site, water depths in excess of 100 feet are located close to water depths in the 40-foot range, and this site therefore is attractive for an offshore island.
Location of Storage
For each site, two locations for intermediate storage could be considered: one on shore and one off

228.
shore on an artificial island. Preliminary environmen-tal analyses showed that onshore storage on Staten Island or near the refineries along the Arthur Kill would raise many environmental objections, and it was therefore not considered feasible. Consequently, the alternatives dealing with the site in Lower New York Bay will consider offshore storage only. The site at Long Branch will deal only with onshore storage because the actual proposal deals with onshore storage, and an offshore storage island would be similar to that of alternative 2-5, located off the Delaware Capes. The alternatives dealing with the Lower Delaware Bay will evaluate onshore as well as offshore storage.
Vessel Sizes and Vessel Drafts
To limit the number of subalternatives on the east coast, and to enable proper comparison between al-ternatives, only one vessel draft will be considered for all eight alternatives. To keep the dredging quan-tities below 100 million cubic yards, to have a draft between 40 and 100 feet, and to be in the same range of draft and vessel size as presented in the proposals for deepwater ports at Big Stone Beach and Long Branch, a vessel draft of 70 feet was selected. This is the draft of a tanker in the 300,000 to 400,000 d.w.t. range.
Type of Berths
In principle, fixed berths can be considered only at locations where the forces on the berth structures, and the movements of the tanker with respect to the berth, are limited. Therefore, naturally or artifici-ally protected areas are required for this type of berth if continuous operations are anticipated. However, it is possible to locate this type of berth in unprotected waters and to accept the unavoidable port closures dur-ing inclement weather, if periods of such weather are limited.
Monobuoys, because of their design concept of exposing a tanker to the elements as little as possible, are a logical structural type of berth for use at ex-posed locations. However, since monobuoys operate with-out tugs, sufficient maneuvering area for the tankers is required.

229.
Considering these principles, fixed berths could be considered at the selected sites in the Lower New York Bay and Lower Delaware Bay; and monobuoys, at the selected sites off Long Branch, off the Delaware Capes and in the Lower Delaware Bay. Therefore, for the site in the Lower New York Bay, fixed berths were selected; and for the site off Long Branch, monobuoys are con-sidered. Since an actual proposal considers monobuoys off Long Branch, this is an additional reason to evalu-ate them at this site. For the site off the Delaware Capes, fixed berths without breakwater protection were selected to evaluate the difference with the site off Long Branch. For the site in the Lower Delaware Bay, fixed berths were selected to stay in line with the actual proposal.
Types of Transshipment
Although transshipment by pipeline as well as by barge is feasible in principle for all eight alterna-tives, only one type of transshipment per alternative will be considered. Since locating deepwater port sites close to refinery areas and onshore storage would limit the length of pipelines, pipelines are selected for the two sites in the New York area and for the site near Big Stone Beach. For the deepwater ports off Long Branch and off Big Stone Beach, selection of pipelines is in accordance with the actual proposals at these sites. Because of its offshore location, and also to demon-strate the difference between the barge and pipeline concept, barges were selected for the site off the Delaware Capes (alternative 2-5).
Throughputs
The explanation for the selection of throughputs at deepwater ports appears in Annex F.
Gulf Coast
The two major oil refinery areas on the gulf coast are located in the Houston-Baytown area and the Beaumont-Port Arthur area, with a total 1970 refining capacity of 2,713,000 barrels per day. Five other re-finery areas exist in this area. In sequence of

230.
decreasing capacity, these refineries are located near New Orleans, Baton Rouge, Corpus Christi, Lake Charles, and Pascagoula. Their 1970 refinery capacities range from 540,000 to 270,000 barrels per day; their total 1970 capacity was 1,884,000 barrels per day. These data indicate that about 60 percent of the 1970 refining capacity is located in the first two areas, and about 40 percent is located in the latter five areas.
Since the distance between the center of the Houston-Beaumont area and the center of the New Orleans-Baton Rouge area is about 270 miles, consideration should be given to deepwater ports serving each area individually (local ports) as well as serving both areas (regional ports). However, as will subsequently be explained, it was considered necessary to evaluate ports with different water depths in this region. Therefore, to keep the number of alternatives manageable, local ports will not be evaluated in this region, especially since regional ports deal with the same type of issues as local ports.
Sites
Area 4 -- Mississippi Delta. In this area the deepwater and shallow water contour lines are closest in Garden Island Bay, which is located east of the South Pass of the Mississippi River. The distance between the 35-foot and the 70-foot and 120-foot contour lines is about 1 and 2 miles, respectively. The site selected in this area deals with an actual proposal for construct-ing an artificial island. For further evaluation, it has been assumed that the subsoil conditions and the siltation characteristics are such that island and berth construction are technically feasible.
Area 5 -- Texas. The 60-foot contour line near Freeport, Texas, is located at a distance of about 8 miles from the shoreline. To the northeast, the dis-tance increases rapidly to a maximum of about 40 miles off Port Arthur; to the southwest, the distance remains more or less constant at 8 miles for approximately 80 miles, and then decreases gradually to about 6 miles off Corpus Christi. Because Freeport is located only

231.
about 50 miles south of Houston, it offers the most at-tractive site on the Texas coast for depths of about 60 feet.
The 90-foot contour line near Freeport is located at a distance of about 20 miles from the shore. To the northeast, the distance increases rapidly to a maximum of about 65 miles off Port Arthur; to the southwest, the distance increases to about 23 miles over a length of 30 miles, and thereafter decreases gradually to about 15 miles off Corpus Christi. Therefore, for depths of about 90 feet, a site near Corpus Christi could be somewhat more attractive than a site near Freeport.
The 120-foot contour line near Freeport is lo-cated at a distance of about 40 miles from the shore. To the northeast, the distance increases rapidly to a maximum of about 90 miles off Port Arthur; to the south-west, the distance decreases to about 20 miles off Cor-pus Christi and to about 15 miles off Brownsville. Therefore, a site near Corpus Christi is most favorable for depths of about 120 miles.
It should be noted, however, that in many cases the distances given apply only to individual restricted locations on the respective contour lines. These loca-tions are of interest when dredged channels are being considered. However, they do not necessarily apply to the larger areas that would be required for the instal-lation of a series of monobuoys.
Since the basic characteristics of the coast do not change between Freeport and Corpus Christi, and since this detailed analysis can deal only with a lim-ited number of basic alternatives, it was decided that a site near Freeport would be selected. Freeport was specifically selected because of its closeness to the Houston area for all different water depths to be con-sidered, even though for water depths in the 90- to 120- foot range, a location more to the southwest of Freeport has the advantage of being located closer to these depths.
232.
Location of Storage
Because the actual proposal for a deepwater port in area 4 deals with an offshore island, and because the onshore soil conditions near this site most probably are technically unsuitable for onshore storage, only off-shore storage will be considered. It has been assumed that the soil conditions at or in the vicinity of the selected offshore site would permit the construction of an artificial island. Ample good areas for onshore storage exist at Freeport), and moreover, the distance between shallow and deepwater contour lines is very great. For these reasons, and to consider a different type of storage location in area 4 than in area 5, on-shore storage near Freeport will be considered.
Vessel Sizes and Vessel Drafts
Given the great differences in distance between the shore and the contour lines in the 60- to 120-foot range, it was considered necessary to evaluate three different vessel drafts. Vessel drafts of 55, 70, and 95 feet were selected. The corresponding vessel sizes are 200,000 d.w.t., 300,000 to 400,000 d.w.t., and 500,000 d.w.t., respectively.
Type of Berths
Considering the contour lines near Freeport with respect to configuration and distance to the shore, monobuoys are a feasible solution for an offshore deep-water port, and will therefore be evaluated for area 5. For dredged channels and basins, fixed berths were sel-ected to restrict the required inland maneuvering space.
In area 4, a great number of monobuoys might pre-sent layout problems, whereas fixed berths, due to their confined layout, would result in short pipelines between berths and island. Therefore, fixed berths were selected for area 4. Without further evaluation, it has been assumed for this analysis that no breakwater to provide for calm or calmer water at the berths would be required.

233.
Types of Transshipment
For all nine alternatives, transshipment by pipe-line as well as by barge to each refinery area is feas-ible in principle. However, to limit the number of al-ternatives, only one type of transshipment per refinery area will be considered for each alternative. Because of the desirability of evaluating both types of trans-shipment for each refinery area, it is logical to select pipelines in the case of onshore storage and nearness of major refinery areas (as is the case in area 5), and to select barges in the case of offshore storage and greater distances to the major refinery areas (as is the case in area 4). Since the projected volumes for Pasca-goula and Corpus Christi are small in comparison to those projected for the major areas and, moreover, be-cause in some cases the distances between deep water and refinery are relatively great, barge movements to these two refinery areas will be hypothesized under all alter-natives.
Throughputs
The explanation for the selection of the through-puts at deepwater ports appears in Annex F.
West Coast
The two major refinery areas on the west coast are located in the Los Angeles-Long Beach area and in the San Francisco area. The refineries in Washington and Oregon presently have small refining capacities. The distance between the Los Angeles-Long Beach and the San Francisco refinery areas is about 400 miles, and the distance between the San Francisco and the Ferndale, Washington, refinery areas is about 950 miles. Further deepening of the San Francisco Harbor Channels poses environmental difficulties. Since the dredging amounts in the case of deepening the Los Angeles-Long Beach channels are comparatively small, and since in the case of Ferndale no dredging would be required, regional ports at Los Angeles-Long Beach and at Ferndale will also be evaluated.
234.
Sites
Area 6 -- Los Angeles-Long Beach. Because the channels to the petroleum facilities in the Los Angeles and Long Beach Harbors are separate channels, deepening of both channels should therefore be evaluated. How-ever, because the basic concept of deepening each harbor would be the same, because of the desirability of limit-ing the number of alternatives, and because both ports would be able to handle the projected imports of the area, deepening of only one port will be considered. The major petroleum facilities at Los Angeles are lo-cated closer to deep water than those of Long Beach. However, the present channel of Long Beach is consider-ably deeper than that of Los Angeles. This study will evaluate deepening of the channel to Los Angeles only; this selection is an arbitrary one.
Area 7 -- San Francisco. The existing major crude oil handling facilities in this area are located between Richmond and Avon. Considering the presence of deep water in the San Francisco Bay, a site for a common deepwater port terminal near Richmond's Long Wharf facility was selected and will be evaluated in alternatives 7-1 and 7-3. Also, dredging to all exist-ing major crude oil handling facilities will be con-sidered (alternatives 7-2 and 7-4), which will allow a continuation of present operational practices. Since deep water in Monterey Bay exists close to shore near Moss Landing, and since a deepwater port is or was under consideration at this location, this site will also be evaluated (alternative 7-5).
Area 8 -- Ferndale-Bellingham. Since sufficient deep water exists close to all major existing crude oil handling facilities in Washington, no alternatives will be considered that evaluate imports for local use. For evaluating deepwater ports which would serve San Fran-cisco or the combined San Francisco and Los Angeles-Long Beach area, a site near Ferndale was selected, because a large area near Ferndale is designated for industrial use.

235.
Location of Storage
Since onshore land for crude oil storage would be available at each of the selected sites, only onshore storage will be evaluated in all alternatives.
Vessel Size or Vessel Draft
For each area the maximum vessel size to be con-sidered was arbitrarily set at 400,000 d.w.t. For dredged channels in the Los Angeles area (alternatives 6-1 and 6-2), the draft was limited to 70 feet, and for areas where natural deep water exists (alternatives 7-5, 8-1 and 8-2), the draft was maximized at 83 feet. For dredged channels in the San Francisco area, the channel depth was arbitrarily set at 50 feet (alternatives 7-1 and 7-2) and 60 feet (alternatives 7-3 and 7-4).
Type of Berths
Because of the confining nature of dredged chan-nels, fixed berths will be considered in alternatives 6-1, 6-2, and 7-1 through 7-4. Monobuoys will be con-sidered for alternative 7-5 because of this alternative's exposed site. Although monobuoys might be feasible in the Ferndale area, in certain areas the water depth at buoy and anchors might be in excess of 120 feet; there-fore, fixed berths were selected for alternatives 8-1 and 8-2.
Type of Transshipment
Pipelines as well as barges are feasible types of transshipment. However, because all storage is antici-pated to be located on shore, because the channels of San Francisco are congested, and because visual problems from fog exist in this area, pipelines alone will be con-sidered for detailed evaluation in this study.
Throughput
The explanation for the selection of throughputs at deepwater ports appears in Annex F.

236.
Dry Bulk
As is detailed in Annex F of this report, of all the dry bulk commodities considered in this study, only the export of coal and certain grains to particular over-seas areas and the import of iron ore from particular overseas areas might have potential for economic move-ments in very large carriers. Only a few of these poten-tial developments will be evaluated in detail in the seven selected alternatives.
East Coast
Only certain coal exports from Hampton Roads and Baltimore and certain iron ore imports to Baltimore and the Philadelphia-Trenton area will be considered.
Sites
Area 2 -- Delaware Bay. The two sites considered for crude oil transfer facilities in alternatives 2-1 through 2-5 could also be evaluated for the transfer of coal and iron ore. To limit the number of alternatives, only the more protected site selected for alternatives 2-1 through 2-4 in the Lower Delaware Bay will be con-sidered. Two alternatives will be evaluated: alterna-tive 2-6 will consider an offshore island for the trans-fer of coal, and alternative 2-7 will consider an off-shore island for the transfer of coal and iron ore. To limit the number of alternatives, an island handling only iron ore will not be considered, because it is anticipated that such an island might be economically less favorable than the two selected.
Area 3 -- Hampton Roads. In addition to alterna-tives evaluating transshipment, alternatives should also be considered which deal with deepening of the channels to existing facilities. Only deepening of the channels to Hampton Roads for coal exports (alternative 3-1), will be considered in this Annex. Deepening of the channels to Trenton and to Baltimore for the movement of iron ore alone and other commodities is the subject of recent studies by the Baltimore and Philadelphia offices of the Corps of Engineers.
237.
Location of Storage
For alternatives 2-6 and 2-7, artificial islands will be considered because they could be constructed on a shoal located close to deep water. Since the distance between the coast and the deepwater area is about 6.5 miles, the cost of trestles and conveyor belts would make onshore storage economically unfeasible. However, for coal exports a deepwater port without storage might be worth consideration, in which case the cost of a large island could be offset by the employment of one or two additional transshipment vessels. In that case, close coordination would be required between the load-ing operations of the transshipment vessels at Hampton Roads and the loading operations of the supercarriers at the deepwater port. With proper planning the addi-tional loading time of the supercarriers might be less than half a day. This alternative will not be evaluated further in this analysis.
A shore-connected island located off Hampton Roads on Willoughby Bank has also had preliminary consi-deration. For this alternative, the railroad cars could be unloaded directly after arrival at the shunting yard of the Norfolk and Western Railway. If feasible, this would provide the Norfolk and Western Railway an advan- tage over the Chesapeake and Ohio Railway, which does not own railroad lines in the vicinity of the site. However, connecting the Norfolk and Western Railway's shunting yard with the artificial island would require traversing the residential area located between shunting yard and island, which raises major questions of economic and environmental feasibility. Therefore, this alternative will not be evaluated further in this analysis.
Vessel Size or Vessel Draft
The maximum size of coal and iron ore carriers was arbitrarily set at 250,000 d.w.t. for alternatives 2-6 and 2-7. The corresponding draft would be 65 feet if no depth constraints were presented, or 58.5 feet if depth constraints exist and the wide beam concept is applied in vessel design.

238.
Throughputs
The explanation for the selection of throughputs at deepwater ports appears in Annex F.
Gulf Coast
Only certain grain exports originating from the Mississippi River and the Louisiana and Texas coasts and certain iron ore imports destined for Mobile, Hous-ton, and Baton Rouge, will be considered.
Sites
Area 4 -- Mississippi Delta. The site in Garden Island Bay considered for oil transfer facilities in alternatives 4-1 through 4-3 could also be evaluated for the transfer of grain and iron ore. However, without further evaluation it is anticipated that the iron ore unloading operations would require a breakwater to pro-vide calm water at the berth, and that the grain loading operations would take place without a protecting break-water.
Area 5 -- Texas. The site near Freeport consi-dered for the crude oil transfer facilities in alterna-tives 5- 4 through 5- 6 could also be evaluated for the transfer of grain and iron ore. However, of these two, it is anticipated that grain operations alone might be economically feasible if executed in combination with the oil operations. This possibility will be evaluated in alternative 5-7.
Location of Storage
The same type of storage location will be consi-dered as was considered for the crude oil alternatives; therefore, alternatives 4-4 through 4-6 will consider an artificial island, and alternative 5-7 will consider onshore storage.

239.
Vessel Sizes and Vessel Drafts
Iron ore carriers of 250,000 d.w.t. will be hypo-thesized, drawing 65 or 58.5 feet. For both areas, grain carriers will be assumed to be 250,000 d.w.t., drawing 65 or 58.5 feet, and 120,000 d.w.t., drawing 50 feet.
Throughputs
The explanation for the selection of throughputs at deepwater ports appears in Annex F.

III. DESIGN CRITERIA FOR CRUDE PETROLEUM PORTS
Channels and Maneuvering Areas
The dimensions of channels and maneuvering areas will be evaluated in relation to vessel dimensions and the estimated force of currents and waves to which the vessel will be exposed.
The dimensions of the supertankers selected for the various alternatives are established in Annex E and are reviewed in table 4.
Table 4. Supertanker Dimensions
(In feet)
157 200
Dimen-sions
Sym-bol
Deadweight tons (1,000)
250 300 400 500
Length. Beam ... Draft..
980 1,050 1,095 1,100 1,262 1,160 1,195
164 173 190 192 220 200 208
50 55 58.5 70 70 83 95
Before a tanker can dock at a fixed-berth ter-minal complex, it must proceed normally via ocean chan-nel, inland entrance channel(s) and turning basin to the berthing area. The dimensions of these four naviga-ble areas will be related to the appropriate tanker dimensions, depending on hypothesized general wave and current conditions.

242.
Special detailed studies would be required to determine the need for extra width or depth by location, and to analyze trade-offs between the additional dred-ging cost or additional construction cost in case fac-ilities are constructed in deeper water and the in-creased port closure time. Table 5 presents the estab-lished relations between the dimensions of the vessel and those of channels and maneuvering areas.
Width
In recent hydraulic model studies a safe channel width of three times the beam of the vessel was expe-rienced for one-way traffic channels without crosscur-rents. Crosscurrents and/or beam waves will bring the vessel in an oblique position with respect to its tra-vel direction. The stronger the crosscurrents or beam waves and the lower the travel speed of the vessel, the larger will be the angle between the vessel's axis and its travel direction. For example, a 1,200-foot-long vessel sailing at 6 knots and subject to a 1-knot crosscurrent would require an extra channel width of
1 T x 1,200 = 200 feet,
which approximately equals the beam of the vessel. Therefore, for certain ocean channels an extra width of 1.0B would be required. For inland channels a width of 3.5B will be applied, allowing for differences in water pressures on the sides of the hull.
Depth
The underhull clearance has to allow for trim, squat, pitch, roll, and countercurrents, in addition to allowing a safety margin because of the unevenness of channel bottoms. Ocean channels might require 15 to 20 percent of the draft of the vessel, depending on the state of the sea. A value of 10 percent would be accep-table for inland channels due to reduced wave actions.
For turning basins and berthing areas, where wave actions are negligible and the speed of the vessel is almost zero, 5 percent is considered sufficient.

Description of location Length Width Depth Radius
Channels -
Over 10 miles offshore Less than 10 miles off- shore and less than width between capes inland
Protected, limited wave and current actions
Turning Basins
Unprotected against wave and current actions and over 10 miles offshore: Turning basin between two channels
Turning basin in connec- tion with berthing areas
Protected, very limited wave and current actions: Turning basin between two channels
Turning basin in connec- tion with berthing areas
Berthing Areasy
Unprotected against wave and current actions and over 10 miles offshore
Protected, very limited wave and current actions
Maneuvering Areas '
Unprotected against wave and current actions
5B 1.2D
4B 1.15D --
-- 3.5B 1.1D --
-- 1.2D 2L
a/ 2L 1.2D --
-- 1.1D 1.5L
a/ 1.5L 1.1D
e/ 4000— -- 1.15D
1.5L
1.5L
5B /1.15D
3B9/1.05D
243.
Table 5. Design Dimensions of One-Way Channels and Maneuvering Areas
a/ Depending on the number of berths. b/ At fixed berths. c/ For one berth. For two or more berths, see table 6. d/ At monobuoys. e/ In feet.

244.
Length
The radius of the turning basin was selected at 1.5 to 2.0 times the ship's length, which is a generally applied and accepted value. The radius of the maneu-vering areas of monobuoys was established at 4,000 feet. This dimension depends mainly on the maneuverability of the individual tanker. Maneuverability is determined by speed, length, screw(s), rudder(s) and loading con-dition of the vessel. At berthing areas with parallel island piers the total width required is presented in table 6.
Table 6. Widths of Berthing Areas of Island Piers
(In multiples of beam [B] of vessel)
Number of
berths
Berthing area
Unprotected against wave and current actions and over 10 miles offshore
Protected, very limited wave and current actions
1 2 3 4 5 6 7 8 9 10 11 12 13 14
5B 3B
11B 7B
12B 8B
18B 12B
19B 13B
25B 17B
26B 18B
32B 22B
33B 23B
39B 27B
40B 28B
46B 32B
47B 33B
53B 37B

245.
Supertanker Berths
Introduction
The arrival of ocean-going tankers at terminal facilities cannot be precisely scheduled, for various reasons. First, a vessel may leave the port of lading after its scheduled departure time because inclement weather or the unavailability of a facility necessitated the ship's waiting for a berth, or because the shortage of a stored commodity resulted in loading at a slow rate. Second, the influence of winds, waves and cur-rents may cause vessels to sail faster or slower than their maximum speeds. (Vessels in ballast are influ-enced mainly by winds; laden vessels are influenced mainly by waves and currents.) A variation of 1 or 2 knots in a maximum speed of 14 to 17 knots would result in an acceleration or deceleration of 6 to 14 percent. On a 30-day voyage this variation could result in a ship's arriving about 2 to 4 days off schedule. This would theoretically mean a period of 4 to 8 days in which the vessel might arrive.
However, the average occurrences of winds, waves, and currents on the various portions of a route are known by season and can be included in the calculations of the voyage time. Deviations from the average al-ways occur and, therefore, off-schedule arrival is a normal phenomenon. When taking the arrival of all ves-sels at a terminal facility into account, it is obvious that this phenomenon of early or late arrivals will create a pattern that rather closely fits that of a ran-dom distribution.
Berth Occupancy Factors
The selection of the number of berths required for a particular alternative will be based on Mettam's ship queuing theory. This theory establishes the rela-tion between berth occupancy and the ratio of average queuing time to the average berth service time for var-ious numbers of berths. This relation is graphically shown in figure 3. The broken lines present the case

f in ■
,
:
a :
a
a , ,
i : .
:
, ,,,,
),
■ Meillffi1=Pahl.1111 IA 11111, MIN' IAN CIL't =5, NH Ill .MO111 VAIIVIIIIIIIII
A NB MI 6 1II R al ■ • IPAMMEAV 1 MT
/III= =NM WifilM11 ■MI=P1111 w., Mr/IMOD—I!.
...■orz■ •■•• low IAMBI • 4.+ LAAr 4IIMI de 1 ' 1011%.1.1TA IF.IiIIAZ
, -441-100111111111111111 t._....-....ririre=ii_irii1=
3,0
2.5
2.0
1.5
0.5
1.0 0.9 0.8 0,7 0.6 0.5 0.4
03
3
2. '5
_c
be
_o
ro
po C 47,
130
0
0 ;70
CO
21
1.
10 20 '30 40 50 60 70 80 90 100
Berth occupancy in percent
Source. J.D. Mettam, ForecastingLiebys to Ships in Port, The Dock and Harbour Authority, London, England, April 1967.
FIGURE 3. QUEUING ANALYSIS WAITING TIMES FOR SHIPS IN PORT

247.
of uniform service times, whereas the full lines pre-sent the case of varying service time (the variation is exponential).
The permissible value of the ratio of queuing time to berth service time should be evaluated separ-ately for each case. An increase in the number of berths will reduce the average waiting time of all ves-sels, and the additional investment cost should be weighed against the value of this reduced waiting time. In many studies the permissible value is set at 0.25, which is an arbitrary figure. It should be noted that Mettam's graphs do not include queuing caused by incle-ment weather or an overflow or shortage of storage. It is not possible by means of simple hand calculations to adjust the graphs to reflect these factors. In this study the permissible ratio of waiting time to berth service time will arbitrarily be set at 0.20 for all coastal areas. (The actual value of the ratio of waiting to berth service time will be higher than the permissible value because inclement weather is not taken into consideration in the graph.) The sensitivity of this ratio will be demonstrated in the following para-graphs.
Table 7 presents the permissible berth occupancy factors for a given number of berths when the ratio of average waiting time to average berth service time (tw/tb) equals .20 and .40 for both varying and uniform service times. From this table several conclusions are apparent. First, for a constant value tw/tb , the dif-ference in the permissible berth occupancy factor for uniform or varying service times decreases in absolute value as well as in percentage. For example, if tw/tb = .20 and n (number of berths) = 2, the differ-ence in the permissible berth occupancy factor is .15 or 38 percent, whereas for n=4 the difference is .10 or 16 percent. When tw/tb = 0.40, these figures are .14 (or 29 percent) and .10 (or 15 percent), respec-tively. Second, the difference in permissible berth occupancy factor for a varying number of berths de-creases rapidly when tw/tb = .20 and .40.

tw/tb = 0. 0
Table 7. Permissible Berth Occupancy Factors
Berth occupancy factor
tw/tb = 0.20
Uniform- a/
Number of
berths (n) a Varying / - Unif./var.a/ Varyinga/lUniforma/ Unif./var.
a/
1
2
3
4
5
6
8
10
15
20
.18 .30 1.67 .25 .39 1.56
.40 .55 1.38 .49 .63 1.29
.5312/ b b b/ b/ b/ .65 / - 1.22 / - .60- .72-
.62 .72 1.16 .68 .78 1.15 b/ b/ b/ b/ .8212/ b/
.67- .76- 1.14- .73- 1.13-
.70 .79 1.13 .76 .84 1.11 b/ b/ 1.1112/ b/
.75- .84- .80- .88- 1.10 - b/ .79 .87- 1.10 2/ .83 .91b/ - l.09 21"
.8412/ b/ b/ .8812/ b/ b .91- 1.08- .94- 1.07-"
b/ .88 •93b/ - 1.06b/ - .91 .96b/
a/ Berth service time. b/ Estimated by interpolation or extrapolation.

249.
For n=2 the difference in absolute value is .09 for varying and .08 for uniform service times, or 22 and 15 percent, whereas for n=4 these figures are .06 and .06, or 10 and 8 percent, respectively. The above-mentioned examples demonstrate that for an increasing number of berths the differences between permissible berth occupancy factors diminish in cases of varying and uniform service times as well as for different t w/tb values. Because most of the deepwater port alternatives will require more than four berths, establishing the actual acceptable value of tw/tb for three berths and less is not a critical issue. The relatively low sen-sitivity of this ratio for four or more berths allows us to establish one value of the permissible berth occu-pancy factor for each number of berths. The mean values have been calculated using the formula
b = bu - 0.25(bu-bv )
where
b = berth occupancy factor (b.o.f.), bu = b.o.f. for uniform service times bv = b.o.f. for varying service times
In the above formula, 0.25 is an arbitrary num-ber reflecting the expectation that deviation from the factor for uniform service times will be relatively small. The results of these calculations are given in table 8.
High berth occupancy factors seem very attrac-tive, because they yield high utilization of the berth facilities. However, as the rate of utilization rises, the ability to quickly absorb traffic congestions after spells of port closure lessens. In general, where b= berth occupancy factor and n=days of port closure, an average spell of queuing of b x n days will result from
1 - b a period of port closure. If b = .9 or .75 and n = 4 days, a queuing spell of 36 and 12 days, respectively, will result. In other words, reducing the berth occu-pancy factor from .9 to .75 (or 16.7 percent) will re-duce the queuing spell by 24 days (or 67 percent). For each site the optimum ratio of an additional berth fac-ility to reduced queuing times of all vessels per year should be determined. This optimization process will

250.
Table 8. Theoretically Permissible Mean Berth Occupancy Factors
Number of berths Berth occupancy factor
1 2 3 4 5 6 7 8 9 10 15 20 30
not be undertaken in this study; however, in the follow-ing calculations, an arbitrary maximum berth occupancy factor of .75 will be used. Table 9 presents the es-tablished practicably permissible mean berth occupancy factors.
Table 9. Practicably Permissible Mean Berth Occupancy Factors
.27
.51
.62
.70
.74
.77
.80
.82
.84
.85
.89
.92
.93
Berth occupancy factor
1 2 3 4 5 6 and over
.27
.51
.62
.70
.74
.75
Number of berths
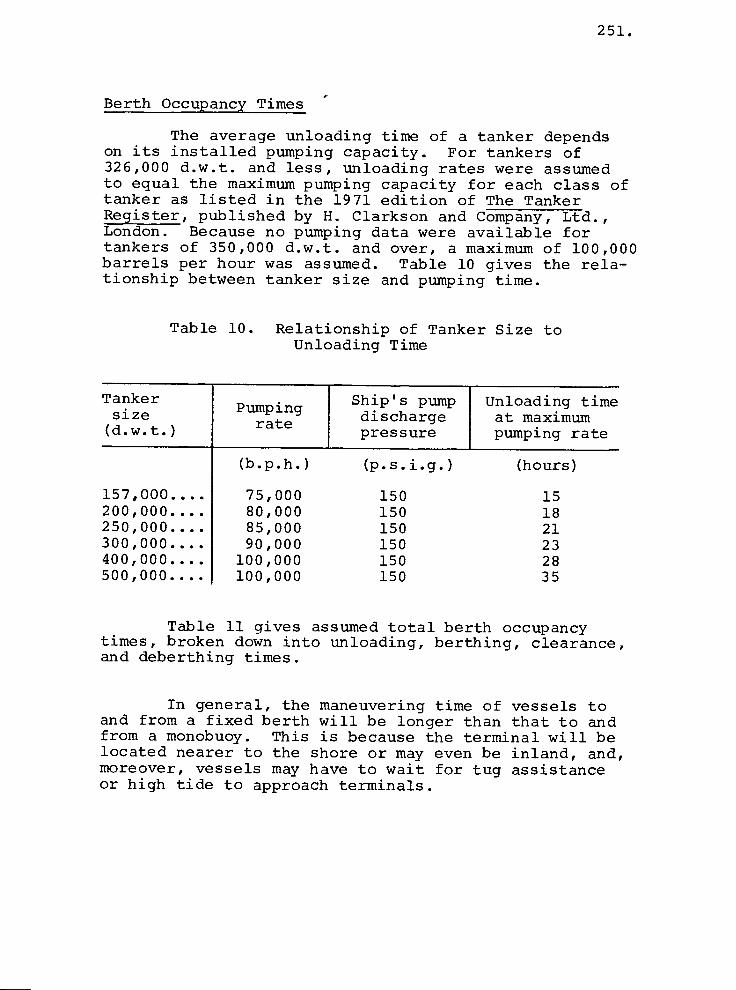
251.
Berth Occupancy Times '
The average unloading time of a tanker depends on its installed pumping capacity. For tankers of 326,000 d.w.t. and less, unloading rates were assumed to equal the maximum pumping capacity for each class of tanker as listed in the 1971 edition of The Tanker Register, published by H. Clarkson and Company, Ltd., London. Because no pumping data were available for tankers of 350,000 d.w.t. and over, a maximum of 100,000 barrels per hour was assumed. Table 10 gives the rela-tionship between tanker size and pumping time.
Table 10. Relationship of Tanker Size to Unloading Time
Tanker size (d.w.t.)
Pumping rate
Ship's pump discharge pressure
Unloading time at maximum pumping rate
157,000.... 200,000.... 250,000.... 300,000.... 400,000.... 500,000....
(b.p.h.)
75,000 80,000 85,000 90,000
100,000 100,000
(p.s.i.g.)
150 150 150 150 150 150
(hours)
15 18 21 23 28 35
Table 11 gives assumed total berth occupancy times, broken down into unloading, berthing, clearance, and deberthing times.
In general, the maneuvering time of vessels to and from a fixed berth will be longer than that to and from a monobuoy. This is because the terminal will be located nearer to the shore or may even be inland, and, moreover, vessels may have to wait for tug assistance or high tide to approach terminals.

252.
Table 11. Berth Occupancy Times/
(In hours)
Fixed structure berth Monobuoy Item
Vessel size (1,000 tons)
2001300
Berthing /. 4 4 4 4 4 4 3 3 3 3
Clearance2l. 2 2 2 2 2 2 2 2 2 2 Unloading1/., 15 18 21 23 28 35 18 23 28 35 Deberthing2X 3 3 3 3 3 3 2 2 2 2
Total 24 27 30 32 37 44 25 30 35 42
a/ Excluding delays for inclement weather, berth occu-pancy and overflow or shortage of storage. b/ Including maneuvering and mooring. c/ Customs and health clearance. a/ Average value. e/ Including maneuvering.
The calculated berth occupancy time of a fixed berth is 2 hours more than that of a monobuoy.
Throughputs
Table 12 gives the number of vessel callings per year and corresponding annual throughput capacities for a berth occupancy factor of 1.0. For these calculations a year is considered to consist of 350 working days, ex-cluding all local and Federal holidays. The mainten-ance of a pier can normally be done during periods of absence of tankers. Because regular maintenance is not time-sensitive and can therefore be executed without interfering with tanker discharge operations, 350 days are theoretically available. Maintenance of a monobuoy normally requires 1 day a month, whereas dry-docking of the buoy, which is required once every 3 years, will take about 1 month.
157 200 250 300 400 500 400 500

Annual throughput (million long tons)
Number of vessel callings per year Vessel size
(1,000 long tons) Pier Monobuoy I Average
157 200 250 300 400 500
n.a. 350
320 315
n.a. 280
267 265
229 228
191 191
350 311 280 262 227 191
55 63 70 80 91 96
253.
Table 12. Vessel Callings and Throughputs per Ves-sel Size at a Berth Occupancy Factor of 1.0
n.a. = not applicable.
Assuming that half of the monthly maintenance of a buoy can be done when no tanker is available for dis-charge, the number of working days per year will be re-duced by 6/1 + 30/3 = 16 days. Thus, the available num-ber of working days is 334. Since at a berth occupancy factor of 1.0 the difference between the number of ves-sel callings per year at a pier or monobuoy is only 3 percent or less, an average number is established for both cases (table 12). The average number of vessels times the vessel sizes results in the annual throughputs when the berth occupancy factor equals 1.0.
Taking into account the practicably permissible mean berth occupancy factors established in table 9 and the number of berths available, the maximum permissible annual throughputs can be determined for different num-bers of berths. Because this deepwater port analysis establishes the maximum annual throughput for 200,000, 300,000, 400,000, and 500,000 d.w.t. tankers at 600 million tons per annum (m.t.a.), only throughputs up to 60Q m.t.a. have been calculated, and the results are g2Ven in table 13. For 157,000 and 250,000 d.w.t. ves-sels the maximum throughput is approximately 60 m.t.a.

254.
Table 13. Annual Throughput Volumes for Varying Vessel Sizes and Numbers of Berths
(In millions of long tons)
Number of berths
Vessel size (1,000 d.w.t.)
400 157 200 250 300 500
1 2 3 4 5 6 7 8 9 10 11 12 13
15 17 19 22 25 26 56 64 71 82 93 98
117 149 169 179
176 224 255 269
233 296 337 355
283 360 409 432
331 420 478 504
378 480 546 576
425 540 614 648
473 600 520 567 614
Pipelines Between Berths and Intermediate Storage
Pipelines
The number and size of the pipelines linking supertanker berths and intermediate storage are deter-mined mainly by the viscosity of the oil, the unloading rate of the tankers, and the length of the pipelines.
Van Houten Associates, Inc.,!" advised selection of the following crude oil characteristics:
Gravity = 32° API (sp. gr . = .8654) Viscosity = 80 SSU at 60° F. Design flowing temperature = 60° F. (average) Pour point: 40° F. or lower
1/ Van Houten Associates Inc., Consulting Engineers, 420 Lexington Avenue, New York, New York.

Barrels
75,000 80,000 85,000 90,000
100,000 100,000
255.
These characteristics are representative of approximately 95 percent of Middle East crudes and do not require heater stations. Problem crudes, such as those found in Lybia or Nigeria, with pour points much higher than 40° F. (and some exceed 100° F.) are not suitable for transportation through cold submarine pipe-lines because the oil will solidify in the pipeline when the flow stops. Although research and development is proceeding on systems to handle these problem crudes, they are excluded from the design of the pipelines.
The unloading rates were assumed to equal the maximum pumping capacities listed for each class of tankers in The Tanker Register. Table 14 presents the selected unloading rates for the various classes of supertankers.
Table 14. Unloading Rates
Unloading rates per hour Tanker size (1,000 d.w.t.a/)
157 200 250 300 400 500
Long tons
10,350 11,000 11,650 12,300 13,700 13,700
a7 In long tons.
Recommended submarine pipeline sizes have been limited to 48 inches. At present this is the largest diameter submarine pipeline capable of being installed by lay-barges.
It must be noted, however, that in cases where terminals are more than 10 miles offshore, the use of 54-inch- or 60-inch-diameter pipelines would greatly reduce pumping horsepower. These sizes may well be

256.
worthy of future consideration as the state of the art improves and lay-barges become available to handle these very large submarine pipelines.
It is assumed that all berths will be served by individual pipelines to segregate the different crudes. However, consideration might be given to common submar-ine pipelines serving multiple berths, especially for facilities of four or more berths. An optimization study should also consider a reduction of unloading rates, comparing the reduction of capital cost of pipe-lines, pumps, and drivers to an increase in port time of unloading tankers. Since the above-mentioned op-tional possibilities have not been evaluated in this study, the selection of pipe sizes and required horse- powers should be regarded as very preliminary and should be considered as only one solution to a many-faceted and complex problem.
Horsepower
The required horsepower of drivers depends on the pressure differential between the ship's manifold and the oil level in the storage tank.
The total differential pressure of the piping system between ship's manifold and storage tanks is com-posed of four main components:
1. pi = pressure loss due to friction in un-loading arms or hoses and meters.
2. p2 = pressure loss due to friction in the pipeline between berth and tank farm.
3. p3 = pressure loss due to friction in mani-folds of tank farm.
4. p4 = pressure loss or gain due to difference in elevation of ship's manifold and oil level in stor-age tanks.
The pressure loss pl can be set at about 15 p.s.i. for fixed terminals utilizing metal unloading arms and at about 70 p.s.i. for single-point moorings utilizing hoses and swivel. Both values are averages of values experienced by Van Houten Associates, Inc.

257.
The pressure loss p2 can be calculated using Darcy's equation, which expresses the pressure drop per mile as
34.87 x f x B 2 x s P - D5
where
p = pressure drop, p.s.i./mile f = friction factor B = barrels/hour s = specific gravity of oil d = internal pipe diameter in inches
The friction factor, f, is a function of the Rey-nolds number, R. The relation is presented in figure 4. The Reynolds number is expressed:
2 ' 214 B R - Dv
where
R = Reynolds number, dimensionless B = barrels/hour D = internal pipe diameter, inches v = kinematic viscosity, centistokes
The following data apply for all cases:
Outside diameter = 48 inches with an assumed av-erage wall thickness of 1.0 inch (conserva-tive)
D = 46 inches v = 14.5 centistokes (corresponds with 80 SSU) s = .8654
The unloading rate varies by vessel size, and may equal 75,000, 80,000, 85,000, 90,000, or 100,000 barrels per hour.
Applying these data to the formulas results in values of differential pressures per mile as presented in table 15.
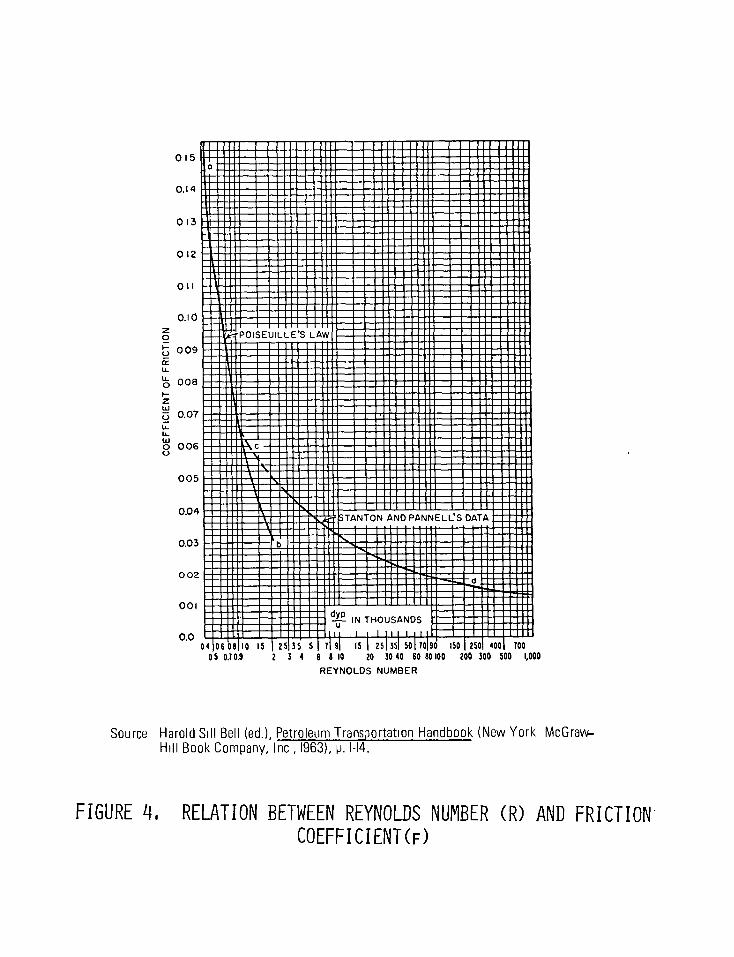
CO
EF
FI C
IEN
T O
F F
RIC
TI O
N
015
0.14
013
012
011
0.10
009
008
0.07
006
005
0.04
0.03
002
001
• 11111M1111•111111M1110111111111111 i•inumm•s summumimmullin101111Inumummi
13•111M•••••••••IMIIIII•••••=m••••••••■•••■••••••nie IIMMIMIN•••1•1•111••••1511••••11MMI••••••1111=•••••••1•Ol•illis
INIMIIIIIIMMININIII•11111MIMINIMMINIMI•111111111111111111•IMMUOMMIM INNIMMIIMMOIMMEINIMINMENIMMUMMUNOWNIlli 11111M111•11111•01.111MMINUMNI=MMIUMIIMMINUNBEMMEga
11•••6111•••••••••••sminummomlium•••••••••■•••im•a• 11111•01111=1M1•1•111•MIIMMIMEM•11•••••••1111=••••••••••••11 111
OMMIIIMEM•••••111.1•1•IMIMIIMMUMIMMUMMOMMIM • 1••••11■1•••••1111•1•MIMI•l•mmo•••••••••••••rnum••••• • 0•11,1••••111•••••••1811111••=1•M•••11•••IIIM•IMMIN•••••• 110 6 • MIIIIIIMI•••••••••11•111111M1•■•1111••••••11=111•1•1••• ■••• 11n ••1•11O1•11••••1•1•0•111••111111•11=1111•111•111111,11111=1111111•1••1•1•• 1111 11 • sussummummmusemsi•I••O•OBINUOIMON•I•I • •IIIIIIMINNIII••••••••WM•••••••■••••o•mmu•n••mso • is•Mi•••■••••••■=•11•1•••••••••••••••■••■•■•••■••Ime • uummiommin•i••=m•losimossw••••••••••11M•••••••••• INIMIIIIMINI•11••••••1•11111MIIMI•••••••1111•1•INI•••••••M•1 MS • lion•1•1••••••■•1•1111111•01■••••••••••••••=mmommees
ilmosmonum•wismill•■•••••■••••mimminimmomm IIIMMI11•11111•••11111111111111•1111111111•111MINIMI•1•11110•1110•11M•11••• ■•••lin 1•101111115••111MIIMMINIMMINIIMMINIIN•••11•••11 11•M••1•1••■•1•11zi
mon twommicum•••••••••■•••••••■•••mummolosses NMI all I•limmill•IN••••••111•11Mme•m•• ■••Nos
POISEUILLE'S LAW relmamillimilosuommismom.".. mina Mi••••••••111••111•1■11M•111•••••••Im
• M•1111•1•••1•11111•110•1•11111MMI••••••••1111•1•011••••■••••• • INN••••••••11•WIIIIIMI•M•••1•••••••NIESIMINM•••1•Wil MUM NO•MIN•11•••••INISMI•Wmil••=1••••111Mm•is•••••ass MOM Olow•••••••=1N11011MimIlm•••••1•••11•Winimm•En MUNI IIMMINMENNIWIMEMINNOOMMISMINEMB1111•01111 mit v••••■■••••=man•Dimummoimmiesmoim•••mmess .••M•1■111•••••••1•11111•IMINIMMII••••11MIMIONII•ME•lin NEM 11••••••••111M•1111111M•1•111WIIIMEIWIMM••1•1•••1••••ss oull••11•11•MM•1••1•11•NIONUM•1•••••••••■••■•••••••••• mnimmisminnimmansumihmmmiumerismmlisasos gliamormommemsmNismommImmomaimismommumui NMENVINNMINIMMIIIIIIMMOUINNIMMOMINIII■MWMINMIMB
• EIMIVVIMIIIMIII•11•111111111MINIM11111111•1111111111MMIUMMIIMIIIIII monassiossinm•losommeromm•mmisonsimmommommasos wommummilminemairnimummiornmegnimmes • OMININUMMOMUMINNIMENOMMOOMIUMMENIMBBI
sommusuommusarnsmoilimommummoolimmummumwomes • anfilal•MMIMm•MBONEMIUMNIONENUMME•lmi•in
• igatimOMminomMINOMINEM•LI•ENSUMEMM•om•insui
mmussmismussina: • TANTON AND PANNELL'S DATA wasion smossimulummos =wows mosommtpiummommimismommummulmmiene • ......umussmemin■bolummu•summo•mu•• INNI•MINIMIII•1•1•••••111••MIMII=WMI•lim•••11 11••■■•••■•••sa 1111,1•11111111U1•10••••••IIIIIIMII•1111:2 1 •1••••••=1•1•1M1111•••1111 N•illINIWIIMINIONIMIIINSMIW•••20 1•11111IMNII•M•••••••11M m•••■••=lusemus••■■m•wm...:_•■■■■••■•••=imme
dyp sinsmismommms8 ••ommom•ismom — IN THOUSANDS IMIN•••••••••S IIMIIIIIIIM11••••111•1••• u •••••••111•••••2611
0.0 1 1 1 1 1 1 04 0606 0 15 25 35 5 71 9 15 25 35 50 70 90 150 250 400 100 1 1 1 1 1 1
05 0709 REYNOLDS NUMBER
Source Harold Sill Bell (ed.) Petroleum Transportation Handbook (New York McGraw—Hill Book Company, Inc ,1963), p. 1-14.
2 3 4 6 6 10 20 30 40 60 80100 200 300 500 1,000
FIGURE 4. RELATION BETWEEN REYNOLDS NUMBER (R) AND FRICTION COEFFICIENT(F)

(1,000)
248 266 280 298 330
259.
Table 15. Differential Pressures per Mile
Unloading rate (barrels/hour)
Reynolds number
(R)
Friction coefficient
(f)
Differential pressure
(P)
(0.01)
1.54 1.52 1.50 1.49 1.47
(p.s.i./mile)
12.7 14.1 15.9 17.4 21.2
75,000 80,000 85,000 90,000 100,000
The pressure loss p3 in the manifolds of the tank farm does not exceed 5 p.s.i. and will therefore be disregarded.
The pressure loss or gain p 4 due to the differ-ence in the elevation of the ship's manifold and the oil level in the storage tank can be expressed by
p4 = (E s - Et) s 2.31
where
p4 = pressure loss (E s < E t ) or gain (E s > Et ) in p.s.i.
Es = average elevation of ship's manifold in feet Et = average elevation of oil level in tank in
feet s = specific gravity of oil
The elevation of the ship's manifold varies with the unloading conditions of the ship and the stage of the tide. The distance between the ship's manifold and water level can be a minimum of 20 feet for a fully loaded vessel and a maximum of 70 feet for an unloaded vessel, depending on ballast conditions and the draft of vessel. An average elevation of +45 feet will be assumed, which does not include an allowance for an av-erage tidal rise of several feet.

260.
The average elevation of the tank farm will be assumed at +30 feet. Assuming a useful tank height of 50 feet, the average elevation of the oil level in the tanks is +55 feet. The total loss of pressure is 10 feet of oil, or less than 4 p.s.i. This value is insig-nificant compared with the total pressure differentials, and therefore will be disregarded. From the foregoing, we have:
1. pl = 15 p.s.i. (fixed berth with metal load-ing arms) or 70 p.s.i. (monobuoy with hoses)
2. P2 = 12.7 p.s.i./mile (75,000 bbl./hr.) 14.1 p.s.i./mile (80,000 bbl./hr.) 15.9 p.s.i./mile (85,000 bbl./hr.) 17.4 p.s.i./mile (90,000 bbl./hr.) 21.2 p.s.i./mile (100,000 bbl./hr.)
3. p 3 = negligible 4. p4 = negligible
The assumed pressure at the ship's manifold is 150 p.s.i.
The horsepower requirements can be expressed by the formula
P B H - 2,450 x E
where
H = brake horsepower P = total differential pressure, p.s.i. B = barrels (42 U.S. gallons) per hour E = pump efficiency, decimal fraction; the sel-
ected value is .78.
For P = 1 p.s.i. the formula will read
h - 2,450 x E
This will produce the following required horse- powers:
1. When B = 75,000 bbl./hr., h = 39 b.hp./p.s.i. 2. When B = 80,000 bbl./hr., h = 42 b.hp./p.s.i.

261.
3. When B = 85,000 bbl./hr., h = 44 b.hp./p.s.i. 4. When B = 90,000 bbl./hr., h = 47 b.hp./p.s.i. 5. When B =100,000 bbl./hr., h = 52 b.hp./p.s.i.
Intermediate Storage
Introduction
The link between intermediate storage and refin-eries will be a pipeline system, transshipment vessels, or both. The capacity of pipelines and transshipment vessels is based on a steady flow of crude oil from the intermediate storage to the refinery tank farms.
The amount of intermediate storage required will depend on the schedule of arrivals and the average car-go load of the ocean-going tankers on the one hand and the ratio between average and maximum capacity of the pipelines or transshipment vessels on the other. In other words, the intermediate storage is the buffer between an irregular inflow and a more steady outflow; its objective is to provide, in general, sufficient storage capacity for unloading vessels so that unloading can take place at the maximum anticipated rate.
The greater the ratio between average and maxi-mum transshipment capacity, the smaller the intermediate storage can be. This might be called the flexibility of the link. The optimal point of trade-off between tank storage capacity and pipeline capacity is found at the point where, taking into account capital recovery and operating costs, the savings in pipelines attribu-table to the last (marginal) unit increase in tank stor-age capacity is equal to the cost of that last (mar-ginal) unit of storage capacity. Since it is outside the scope of this project to deal with optimizations within an alternative, the amount of intermediate stor-age will be calculated on the basis of the rules devel-oped in the subsequent paragraphs.
In principle, the flexibility of a system of pipelines is different from that of transshipment ves-sels. The capacity of pipelines can be increased 50

262.
percent over their capacity at optimum cost with a con-sequent increase in operating cost of approximately 15 percent. An increase in capacity of transshipment ves-sels will normally result in an increase of investment cost of the same ratio as the capacity increase, since the purchase of more vessels will be required.
The operation of pipelines is independent of wea-ther conditions; however, inclement weather influences the operation of transshipment vessels. When transship-ment vessels serve refineries at varying distances from the port, their rate of emptying intermediate storage varies with whether they serve only refineries nearest or further away from the port, if the characteristics of the crude oil and the availability of storage at the receiving refineries permit this. Pipelines do not have this type of flexibility. Because both systems have one advantage and one disadvantage compared with each other, this difference will be considered negligible in the determination of storage requirements.
Derivation of Formula
The amount of intermediate storage will be de-fined as the difference between inflow and outflow dur-ing a certain period. The length of the period will depend on the duration of spells of inclement weather and the effect of the randomness of tanker arrivals. There are few terminals where the storage at or near the terminal is used only as intermediate storage; in most places it is integrated in the long-term refinery storage. However, a pure example of intermediate stor-age is found in Bantry Bay, Ireland. Here the storage capacity is provided by 12 tanks, each having a capa-city of 600,000 barrels. The total capacity is 7.2 million barrels or about 1 million long tons. There is one berth for a very large crude carrier (VLCC) of a maximum size of 326,000 d.w.t. Thus the storage capa- city is equivalent to about three times the vessel size.
The inflow of crude oil during 1 week of full berth occupancy can be expressed by
I§ I lw - - n d

263.
where
I lw = inflow in millions of long tons, during 1 week of full berth occupancy
168 = number of hours per week n = number of berths d = average size tanker in million long tons t = average total berth occupancy time in hours per vessel
The outflow during 1 week of pumping at maximum rate can be expressed by
Olw = 0.02T
where
0lw = maximum 1 week outflow in millions of long tons
0.02 = number weeks/52 weeks T = maximum annual throughput capacity of pipe-line(s) or transshipment vessels in long tons. This maximum is higher than the actual annual throughput in order to get seasonally higher throughputs. An arbitrary factor of 1.2 will be applied, hence T = 1.2A, where A is the annual throughput in million long tons.
The required intermediate storage (Sim) for 1 week of full berth occupancy is Si w = Ilw - Olw .
The amount of storage (S) is proportional to the number of weeks of full berth occupancy. Additional storage will be required since all tanks will generally not be empty at the beginning of the period of full berth occupancy. However, after a long spell of incle-ment weather the amount of oil left in storage will be very small. For this amount an arbitrary figure of 10 percent of total storage capacity is selected. Even more additional storage capacity will be required, since not all tanks will be fully loaded because the oil will be segregated by origin and owner. If only tanks with individual capacities of 600,000 barrels (equivalent to 82,000 long tons.1/ are used, 200,000,
1/ One long ton equals 7.3 barrels.

264.
300,000, 400,000 and 500,000 d.w.t. tankers will re-quire 2.44, 3.66, 4.88, and 6.10 tanks, respectively. This obviously would result in a requirement for three, four, five, and seven tanks, respectively. This means that the storage volume required is 3 4 2.44 = 1.23, 4 4 3.66 = 1.09, 5 4 4.88 = 1.02 and 7 4 6.10 = 1.15 times larger than that theoretically calculated. Be-cause 600,000-barrel tanks are too unfavorable in size if tankers primarily in the 200,000 d.w.t. range are ex-pected to call, a smaller size tank of 500,000 barrels will be assumed. One 500,000-barrel tank is able to contain 68,500 long tons; therefore, one 200,000 d.w.t. tanker will require 2.92 tanks, or three tanks with an average reserve capacity of 3 4 2.92 = 1.03. Given the above ratios of 1.03, 1.09, 1.02, and 1.15, the average ratio of required overcapacity is 1.0725. In addition, since it is assumed that only 10 percent of the tank farm's total capacity of oil will remain in storage after a long period of inclement weather, this factor must be taken into consideration in the calculation of required overcapacity. The average ratio of overcapa-city and the amount of capacity still in use after in-clement weather combines to produce a total required overcapacity of 1.0725 x 1.10 = 1.18, or 1.2.
The total amount of storage required is then:
S = 1.2(168 n d - 0.024A)w,
where
w = number of weeks of full berth occupancy
Table 16 presents the storage volumes required according to the above formula if 1 week of full berth occupancy is experienced. For fixed berths and mono-buoys, an average berth occupancy time of 26, 31, 36, and 43 hours has been applied for 200,000, 300,000, 400,000, and 500,000 d.w.t. vessels, respectively. For 157,000 and 250,000 d.w.t. vessels, the average berth occupancy time is respectively 24 and 30 hours.

265.
Table 16. Storage Volumes for One Week of Full Berth Occupancy
(In millions of long tons)
Vessel size (1,000 d.w.t.)
300 Number of berths
157 1 200 400 I 500 [250
1 2 3 4 5 6 7 8 9 10 11 12 13
0.89 1.06 1.13 1.32 1.53 1.59 1.03 1.25 1.32 1.54 1.80 1.86
1.29 1.56 1.85 1.87
1.13 1.35 1.61 1.62
1.05 1.23 1.49 1.49
1.16 1.34 1.66 1.62
1.32 1.56 1.91 1.90
1.52 1.79 2.19 2.16
1.71 2.01 2.47 2.43
1.89 2.22
2.08 2.45 2.28 2.47
Spells of port closure will vary by site and type of berth facility and might be caused by hurri-canes, swells, or fog. In this study no differentia- tion will be made with respect to site or type of struc-ture. An average major spell of inclement weather of 5 days will be considered applicable for all cases. In case of an average berth occupancy factor b (b 1-b) x 5 days will be required to eliminate the queue initiated by the 5-day port closure. For one, two, three, four, five, and six berths and over, 0.26 0.74, 1.16, 1.66, 2.04, and 2.14 weeks of queue elim-ination will be required if the permissible mean berth occupancy factors of table 9 are applied for b. The amount of storage required will be set at a minimum of 1 week of full berth occupancy for one and two berths, and at 1.16, 1.66, 2.04 and 2.14 weeks of full berth occupancy for three, four, five, and six berths and over. The result is presented in table 17.

266.
Table 17. Crude Oil Storage Capacities
(In millions of long tons)
Vessel size (1,000 d.w.t Number of berths
•)
157 200 250 300 400 500
1 2 3 4 5 6 7 8 9 10 11 12 13
0.89 1.06 1.13 1.32 1.53 1.59 1.03 1.25 1.32 1.54 1.80 1.86
1.50 1.81 2.15 2.17 2.24 2.67 2.69 2.51 3.04 3.04 2.87 3.55 3.47 3.34 4.09 4.07 3.83 4.69 4.62 4.30 5.29 5.20 4.75 5.24
1.88 2.14 2.48 2.82 3.25 3.66 4.04 4.45 4.87 5.29
Bantry Bay presently has 1.0 million tons of storage available. For d = .32, t = 33 (table 11), n = 1, T = 23 (table 13) and S = 1.0, this results in w = .844. It should be noted that in this case the present annual throughput is about 15 million tons, only one shipping route is used, the number of vessels is limited and constant, and the outflow is by trans-shipment vessels only.
Storage Area
One million long tons of crude oil can be stored in approximately twelve 600,000-barrel tanks. Each tank has a diameter of about 260 feet and requires a diked area of about 430 x 430 = 185,000 square feet. Since 1 acre is equivalent to 43,560 square feet, the 12 tanks require an area of about 50 acres.
In addition to crude oil storage, a general ser-vice area is required for the bunker fuel tanks, oil separation tanks and equipment, power generator with

267.
diesel fuel tanks, water tanks, booster station, opera-tion and control center, and personnel and customs quar-ters. This area is estimated at 10 to 30 acres, depen-ding on the number of berths, the number of oil companies involved, and the assumed requirements for bunker fuel and oil separation tanks.
Pipelines Between Intermediate Storage and Refineries
Pipelines
The number and size of the pipelines and the num-ber and horsepower of the booster pumps between inter-mediate storage and the various refinery tank farms is determined mainly by the annual flow, the viscosity of the oil, and the length of the pipelines. The relation between pipe diameter and annual capacity in long tons was determined by using figure 11-a of Michael Hubbard's publication, The Economics of Transporting Oil To and Within Europe (London: MacLaren and Sons, Ltd., 1967). Hubbard assigned a specific gravity of 0.869 and a vis-cosity of 20 centistokes to the crude oil.
Figure 5 is based on Hubbard's figure 11-a, and ranges the pipe sizes from 6 to 56 inches. Extrap-olations for 48- and 56-inch lines and interpolations for 36-inch lines were made using the factors:
(48\2 = 1.3, (56N2 = 1.8 and /36\ 2 = .7 \42/ \42/ k42J
respectively, in relation to the capacity of a 42-inch line. To construct the loops of the three curves that were added to Hubbard's figure (the curves for 36-, 48-, and 56-inch lines), two auxiliary points per curve were determined. For this purpose, throughputs at a 15 percent higher operating cost level were selected. The three added curves were drawn tangential to the exten-sion of the envelop of the other curves, since the en-velop should be a continuous curve. The solid lines in figure 5 represent optimum capacities; the dotted lines, capacities at a 15 percent increase in operating cost.

3
2
1
0.8
0.6
0.4
Cos
t ce
nts
per
mT—
km
02
0.1
0.08
0.0
0.0
0.0
0.0
41-1111111111 r,r- i_ -7...1 1 MENIIIIII 7-̀---- ma ".1:MIN-iim.....111eaS -, ... lika.:13
__, I 1 r =1:1_ 1_ i 4 : I, rtf
ijA, 4 f C •-■ i T , irei
I
-1--r, ' 1 i Electricity at 1.17 cents/kWh I - I Eli I 111-H -r- t-t --t
H l'il-- 1 Capacity charges 10% p.y. iilui 11•11•=1111110112111111011116.1:14=^111111N=1=1=1:1=NIONIIIIIIIIIMMUMMI al --- saaannummuummumuch...a.r. IMMIZZSCI 111111111111111111111111112111111M111 • anommosrasonmstosmssiumnearmanounumnow.usramonssass neemmaa imiggiminommemnifol 'igillivaimsoimmfflimignamg_F4-maggiggrprAllEi simwm E...2.E-3§HEINEINESEMIta..e#444.1.9:41Mrim6-01FieiliE=1 .41:11:111115121111Millil MINIMILIIIIMINEENIO.:;.—.11: .- briA ...INIIMINEMIONNIERNI` OMNI REMENIBM 91 —agrililift2: ''''' PA. di 'FAN
- h..,!= ..5 z... ...= - dal- F-914. ,. • „,,s_._ '"L . at. . ' .... .... =1......E--Er. I& -2g=mak. • = ...=-..... .2.. dr.1 pr
... 2.17:21 THr11111171 UM
. . . r: . = •
MYR ' -N -.my; ..i. a .ierM, --12 1 . e. .4.= -sr- :: ..= • a: :AI •
--. MI. ..... MI • MOM
I I 111I
. =M =now mina ; •-• a. • IMMIMMIll
-FiEnsi.vnups F arum. arm uu ..3 Et ; In im .... n ..... Nil ..1.111* • .4,.. mi.fil lOit ing h. . m III
ills" 1 ! 11,....0 •........: NI 11 111 11 ,11111111 Inn II hIl
I ll • alma • i MI I III.11. .. WEN
I 111111 11 III /11/SH
•Lii
"" "gitrallerViesuMMUANVIMUUMIN" . - sr: .... AWMIliMirrin mu u u
mint_ n lui ilk Mill di winaINIMUMMU 11 1111 RIMINI till Ismierea unit am mamma 1 111111 MIMI] IITIMMIIMIIIM1111 I II II I 111111:11 I 1111 I IHILIS•11 :'lln 1 Illt IIIIMII 1/111pII
Cliregri:=1.11 If RIMS:AIM rILIZEZA•api:: ...... 'I um IszEtindillsi . o. asima: aka. s mum! ..r .. 1.41 IM =22.11111 I II .. m MAW ..... MI 'Ct1231" smmi...... iii7111 3%., .... :: PA; =I. 11- 11%_•111=1.111 iiM81:11; • _
• . ..--:-.--;•• - ---'.1::H::: . - : — - -:.• .--- i
= = . - ... .. =-.=-- •• - , . == .. :I -1.
:::.: 7.: CZ .... "ia..... 4. . .... . 1 . .. .. : .. 2. ..... ..... 1•1 ."
ig--
• :- .. .. = _,.. . . . .... .....
0. il• E = . -tz .. 1. -..... :t. •• • • a ==__ ... I'
. ....; .. = -re ..... =mar
z- ... .. .. .. - !. . ;h.- : .......... . .. ......... ..... ... . ..... ..-......... ... ....... .. -
am" . i-r. -; • ; • 2. . ... • . Br. .1. mii
' .......... . .2: .. ..
II
....... Il ..... . 6 I . ..umw"••• 1" 1111111111 IPII .. ...
mum IIIR • • 111 .1. umul .1. I all 111111 11 11 1111.11.• III 1111110 ...... 11111 I ME•= 1 .... 11 II III 111111 111111 II 1 1111 1 MM. 111111 111111 .... 111 11 11 MIME II Ill I III M•NN . 1111111 11 1111 111111 II I III NE ...... III /I III ..... 1 11 I MIN MUM . U II I II 1111 II I Iii IIIUNNI 1111111 1111 I 111111 II I III NM ...... VII ammonnimanammithunamma unammonnanumummtaa 1 1 Hum; Ii "num iguatanum um; im ; mu 11 ituu 1 ••ausugui _
0! 02 a5 Capacity mil. tans per year
Source. Reproduced, with changes, from Michael Hubbard, The Economics of Transporting Oil To and Within Europe (London. McLaren & Sons Ltd., 1967), p. 55.
FIGURE 5. TOTAL COST OF PIPELINES BY DIAMETER AND CAPACITY

269.
Table 18 presents the annual throughput capaci-ties at the lowest (optimum) and the 15 percent higher cost levels given in figure 5. Although the curves in figure 5 are based on average European cost criteria which do not apply in this study, the table itself is valuable, in that it demonstrates the flexibility in throughput capacity of a pipeline system. It shows clearly that by increasing or decreasing the optimum throughput capacity of a pipeline by about 50 percent, the transportation cost would increase only 15 percent under the assumed European conditions.
Table 18. Annual Throughput Capacity
(In millions of long tons)
Diameter of pipeline
Lower—a/ Higher— a/ (inches) range range
18 5 8 12 24 9 14 21 32 17 29 36 b 21/ — 37 '
42b/ 56—
42 27b/ 50b/ 80b/ 48 10 — 35Ej 65E/ Ob/ 56 50— 90— 140—
a/ Total cost 15 percent higher than in optimum case under the conditions of figure 5. ID/ Derived by extrapolation or interpolation.
It should also be noted that as the pipe size increases, the cost decreases, since the loops in figure 5 representing the larger pipe sizes are at suc- cessively lower levels. This means that scale economies apply. For example, according to this figure, it is less expensive for throughputs in excess of 7 million tons to use a 24-inch rather than an 18-inch line, even when an 18-inch line has its optimum at 8 million tons. However, it should be noted that use of a larger pipe is less expensive only under special circumstances and depends on the pipe sizes that are being compared. For
Annual capacity
Optimum

270.
instance, we have just noted that a 24-inch line is less expensive than an 18-inch line; however, in a com- parison of 18- and 32-inch lines, the 18-inch is cheaper for throughputs less than 11 million tons.
From the curves in figure 5 it is also evident that the optimum of a certain pipe size is not clearly defined, since the curves are rather flat near their horizontal tangents.
Even though the cost scale of figure 5 does not represent the costs applicable to this study, the gen-eral operating cost trend with respect to throughput volumes will still apply. However, under the cost conditions of this study, the various curves might be flatter or steeper, and this graph will therefore be used only for the selection of line sizes.
Horsepower
The horsepower required to boost the oil through the pipelines between the intermediate tank farm and the refinery tank farms can be calculated using the same formulas and basic values established for pipe- lines from supertanker berths to intermediate tank farms.
Transshipment Berths
For those alternatives on the Atlantic and gulf coasts involving transshipment, the size of all trans-shipment barges was established at 40,000 d.w.t. (Annex F).
To obtain a flexible transshipment operation, all berths would require at least 40 feet of water depth. The assumed berth occupancy time of transshipment barges at the deepwater port is presented in table 19.
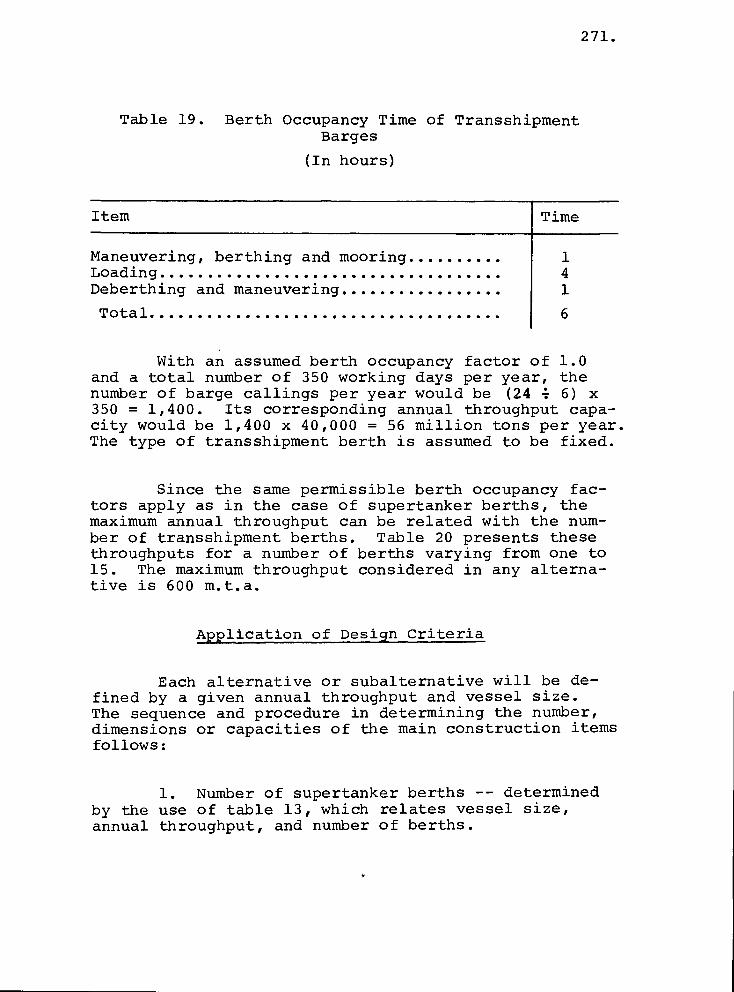
Time
1 4 1
6
271.
Table 19. Berth Occupancy Time of Transshipment Barges
(In hours)
Item
Maneuvering, berthing and mooring Loading Deberthing and maneuvering
Total
With an assumed berth occupancy factor of 1.0 and a total number of 350 working days per year, the number of barge callings per year would be (24 4 6) x 350 = 1,400. Its corresponding annual throughput capa- city would be 1,400 x 40,000 = 56 million tons per year. The type of transshipment berth is assumed to be fixed.
Since the same permissible berth occupancy fac-tors apply as in the case of supertanker berths, the maximum annual throughput can be related with the num-ber of transshipment berths. Table 20 presents these throughputs for a number of berths varying from one to 15. The maximum throughput considered in any alterna-tive is 600 m.t.a.
Application of Design Criteria
Each alternative or subalternative will be de-fined by a given annual throughput and vessel size. The sequence and procedure in determining the number, dimensions or capacities of the main construction items follows:
1. Number of supertanker berths -- determined by the use of table 13, which relates vessel size, annual throughput, and number of berths.

.27
.51
.62
.70
.74
.75
.75
.75
.75
.75
.75
.75
.75
.75
.75
15 56
104 157 207 252 294 336 378 420 462 504 546 588 630
272.
Table 20. Annual Throughput Volumes
(In millions of long tons per year)
Permissible berth occupancy factor Number of berths Throughput
1 2 3 4 5 6 7 8 9 10 11 12 13 14 15
2. Channel and maneuvering area dimensions -- determined by the use of tables 5 and 6, which relate vessel dimensions, number of berths, and channel and maneuvering area dimensions. This will result in the amount to be dredged, or in the site selection of the deepwater port when no dredging is the objective.
3. Pipelines between supertanker berths and in-termediate storage or refineries -- determined by selec-ting 48-inch pipes for all lines, one line per berth, and determining the necessity for and capacity of the booster pumps by calculating the pressure differentials as described in a preceding section. The lengths of the pipelines are determined by the selected locations of the deepwater port, intermediate tank farms and assumed pipeline routes.
4. Crude oil storage capacity of the interme-diate tank farm -- determined by the use of table 17, which relates number of berths, vessel size, and stor-age capacity.
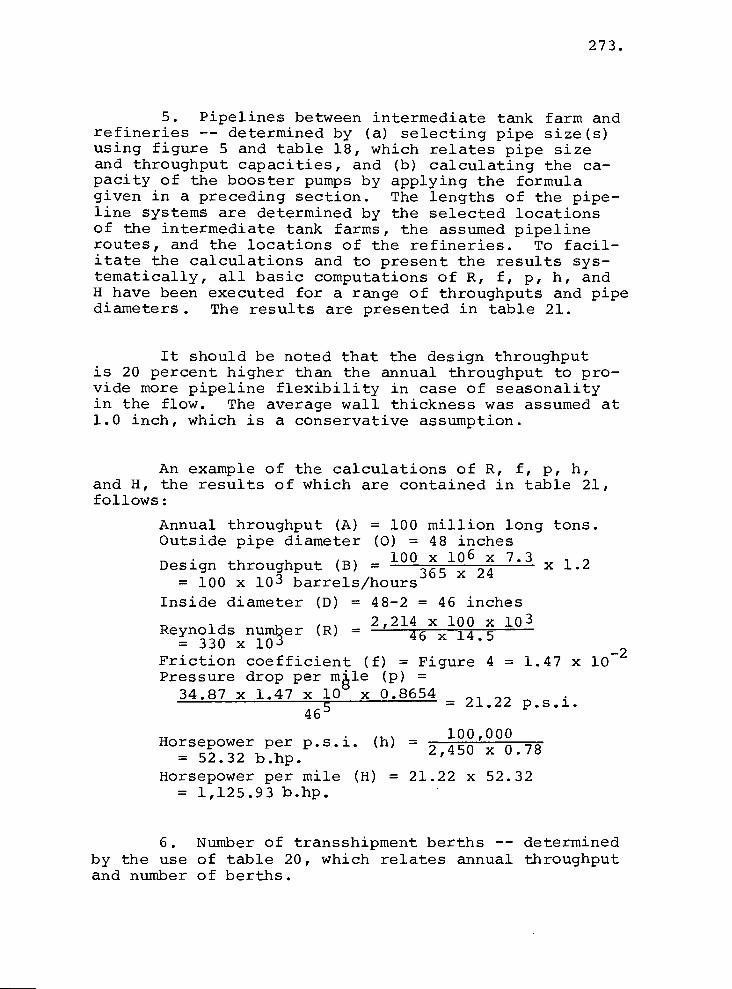
273.
5. Pipelines between intermediate tank farm and refineries -- determined by (a) selecting pipe size(s) using figure 5 and table 18, which relates pipe size and throughput capacities, and (b) calculating the ca-pacity of the booster pumps by applying the formula given in a preceding section. The lengths of the pipe-line systems are determined by the selected locations of the intermediate tank farms, the assumed pipeline routes, and the locations of the refineries. To facil-itate the calculations and to present the results sys-tematically, all basic computations of R, f, p, h, and H have been executed for a range of throughputs and pipe diameters. The results are presented in table 21.
It should be noted that the design throughput is 20 percent higher than the annual throughput to pro-vide more pipeline flexibility in case of seasonality in the flow. The average wall thickness was assumed at 1.0 inch, which is a conservative assumption.
An example of the calculations of R, f, p, h, and H, the results of which are contained in table 21, follows:
Annual throughput (A) = 100 million long tons. Outside pipe diameter (0) = 48 inches
100 x 10 6 x 73 x 1.2 Design throughput (B) =
= 100 x 10 3 barrels/hours365 x 24
Inside diameter (D) = 48-2 = 46 inches
Reynolds number (R) - 2 ' 214 x 100 x 103 46 x 14.5 = 330 x 10 3 Friction coefficient (f) = Figure 4 = 1.47 x 10 -2
Pressure drop per lupe (p) = 34.87 x 1.47 x 10 x 0.8654 - 21.22 p.s.i.
46 100,000 Horsepower per p.s.i. (h) - 2,450 x 0.78 = 52.32 b.hp.
Horsepower per mile (H) = 21.22 x 52.32 = 1,125.93 b.hp.
6. Number of transshipment berths -- determined by the use of table 20, which relates annual throughput and number of berths.

(1,000 bbl./h.) (1 ' 000)
22 10 69 22 15 104
(p.s.i./ mile)
2.00 11.71
1.80 23.71
(inches) (.01) (inches) (mill. tons)
24 10 24 15
61.24 186.12
5.23 7.85
10.47 13.08 15.70
51.72 96.66 161.40
Table 21. Calculations of Basic Characteristics of Horsepower Re- quirements Per Mile
Horse- Annual Design Friction Horse- Horse- Outside Inside Reynolds
loss Pressure Outside through- coeffi- power/ power/ through- diameter diameter number
put put cient p.s.i. mile (0) (A) (D) (B) (R) (f) (p) (h) (H)
32 10 32 20 32 30 32 40 32 45
36 20 36 25 36 30
42 15 42 20 42 25 42 30 42 35 42 40 42 45 42 50
30 10 51 2.11 2.62 5.23 13.70 30 20 102 1.82 9.04 10.47 94.65 30 30 153 1.67 18.66 15.70 292.96 30 40 204 1.59 31.59 20.93 661.18 30 45 230 1.56 39.23 23.55 923.87
34 20 90 1.86 4.94 34 25 112 1.78 7.39 34 30 135 1.72 10.28
40 15 58 2.05 1.36 7.85 10.68 40 20 77 1.95 2.30 10.47 24.08 40 25 96 1.82 3.35 13.08 43.82 40 30 115 1.78 4.72 15.70 74.10 40 35 134 1.72 6.21 18.32 113.77 40 40 153 1.67 7.87 20.93 164.72 40 45 172 1.63 9.72 23.55 228.91 40 50 192 1.60 11.78 26.16 308.16
continued--

(mill. (inches) tons)
42 55 42 42 42
60 65 70
48 48 48 48 48 48 48 48 48 48 48 48 48
20 30 35 40 50 60 65 70 75 80 85 90
100
56 45 56 50
46 46 46 46 46 46 46 46 46 46 46 46 46
54 54
20 30 35 40 50 60 65 70 75 80 85 90
100
45 50
Table 21. Calculations of Basic Characteristics of Horsepower Re-quirements Per Mile continued--
Annual Design Friction Horse- Horse- Outside Inside Reynolds Pressure coeffi- diameter through- diameter through- number loss power/ power/ put put cient p.s.i. mile (0) (A) (D) (B) (R) (f) (p) (h) (H)
(inches) (1 ' 000 (1,000) bbl./h.)
40 55 211 40 60 230 40 65 249 40 70 268
67 100 116 133 165 198 215 232 248 266 280 298 330
127 141
(.01)
1.57 1.56 1.54 1.52
2.01 1.83 1.80 1.72 1.65 1.60 1.57 1.55 1.54 1.52 1.50 1.49 1.47
1.74 1.70
(p.s.i./ mile)
13.99 16.54 19.16 21.95
1.18 2.41 3.23 4.03 6.04 8.44 9.72
11.13 12.68 14.14 15.87 17.39 21.22
2.32 2.79
28.78 31.40 34.01 36.64
10.47 15.70 18.32 20.94 26.16 31.40 34.02 36.64 39.24 41.87 44.47 47.10 52.32
23.55 26.16
b.hp. ----
402.63 519.36 651.63 804.30
12.31 37.84 59.17 84.42
158.00 265.02 330.67 407.80 497.56 597.12 705.77 833.26
1,125.93
54.62 72.99
continued--

62.78 873.27
65.40 980.35 68.02 1,095.12
155 169 183 198 212 226 240 254 268 283 296 310 325 338 353 367
55 60 65 70 75 80 85 90 95
100 105 110 115 120 125 130
54 54 54 54 54 54 54 54 54 54 54 54 54 54 54 54
55 60 65 70 75 80 85 90 95
100 105 110 115 120 125 130
56 56 56 56 56 56 56 56 56 56 56 56 56 56 56 56
95.55 121.10 152.02 188.70 227.56 274.60 327.37 386.14 448.29 515.97 593.35 677.36 768.50
28.78 31.40 34.01 36.64 39.25 41.86 44.48 47.09 49.70 52.33 54.94 57.55 60.18
3.32 3.86 4.47 5.15 5.80 6.56 7.36 8.20 9.02 9.86
10.80 11.77 12.77 13.91 14.99 16.10
1.67 1.63 1.61 1.60 1.57 1.56 1.55 1.54 1.52 1.50 1.49 1.48 1.47 1.47 1.46 1.45
Table 21. Calculations of Basic Characteristics of Horsepower Re-quirements Per Mile continued--
Annual Design Friction Horse- Horse- Outside- through- Inside coeffi- Pressure through- Reynolds power/ power/ diameter diameter number loss
put put cient p.s.i. mile (0) (A) (D) (B) (R) (f) (p) (h) (H)
, _
(.0 1) (mill. (inches) tons) (1,000
(inches) • bbl• /h ) (1,000) (p.s.i./ mile) b.hp.

277.
7. Pipelines from intermediate tank farm to transshipment berths -- determined by selecting 48- inch pipes for all lines, one line per berth, and cal-culating the capacity of the booster pumps using table 21. The loading rate was established at 10,000 long tons, or 73,000 barrels, per hour.
IV. ENGINEERING REQUIREMENTS FOR CRUDE PETROLEUM PORTS
New York Area
Three alternatives, numbered 1-1, 1-2, and 1-3, are considered in the New York area. The locations of the deepwater ports in this area and the pipeline routes to the refineries are shown in figures 6 through 8. Detailed layouts are presented in figures 9 through 11.
Sites
Alternatives 1-1 and 1-2 consider deepwater ports in the Lower New York Bay, whereas alternative 1-3 considers a deepwater port off Long Branch, New Jersey, in the Atlantic Ocean.
Service Areas
Alternative 1-1 serves the refineries along the Arthur Kill; alternatives 1-2 and 1-3 serve the refin-eries along the Arthur Kill, as well as those along the Delaware River. Intermediate tank farms and refinery tank farms are connected by pipelines.
Throughputs
Alternative 1-1 considers two sets of through-puts. The lower throughput is set at 30 million tons per annum (m.t.a.) in 1980 and 35 m.t.a. by 2000. The higher throughput is set at 35 m.t.a. in 1980 and

LEGEND ARTIFICIAL ISLAND
0 REFINERY =en PIPELINE
St it Ilto %lilt • Cm. 20
'ARTHUR KILL REFINERIES'
Lower Bay ROCKAWAY
BEACH
isville
rile
,OtIt
SAN DY
HOOK
4C Highlands ghlands
son Sea Bright rewsbury R Monmouth Beach port Jng Branch
_ng Branch beron
lenhurst /
sbury Park Ocean Grove 0 von by the Sea dmar
C.) . Belmar p6Tnasquan
pring Lake
— a ea Girt 1—••
Pleasant CC Head ,
F- ston
"antoroking
Normandy, Beach
avallettei
Seaside Heights
Seaside
xPark
2
_tr.:44g
Att- tett 1.1CL.-10-Za
Z.'
HI In r:Barrn.7%9
FIGURE 6. LOCATION OF DEEPWATER PORT AND ASSUMED PIPELINE ROUTE OF ALTERNATIVE I-I
Robert R. Nathan Associates, Inc.

Behdder Eit770":747,7,
ARTHUR KILL REFINERIES COMET
Lauer Bay
Ale
em;?'
.Hoortoym ... 1,eRf rT!!-Tlig
ger o
'1•• -
Richlendto4iSttsvIleZ,T11
Quakertown ,
Raven 74 ,
New Ho Sellersvdle
B C K DoylesOrn ‘3. , • • •
! Et mart ' ipirsbdig
.e:Greekville
P4asr ■
• t
". Telford Souderton 0,7,11
irlsvffle.
• , Hatfleld
Lansdale
• scjiryille Amble
ornstow
Jenkm
nghorne
Oakford Flo
Bnsto Cruyclo, ) ridge
C
1111
00IT k Highlands
lighlands
1V." B r t • tusbury R
Monmouth Beach port
ng Branch ng Branch
lberon
Ilenhurst
sbury Park Ocean Grove von by the Sea elmar KrImar
prtng Lake ea Gut
L Pleasant y Head
ston
ntoloking Normandy
Beach
avallette
Seaside Heights
Seasuf e Park
V._ Lc?. Aantsiya Bprbo •Eikest17ro '
POMO will
8 60 ea erns re Jefferson pi
MUSoHiP
Harnson•Glmet A
'tterchnevIlte. Il•WoodatomP,
• Monroev1111 D'e '-nar_et.w•
DELAWARE RIVER REFINERIES
E:ty' .
13 o / If' Barneg
Pen 00C•' Airfare.; %lower Palatal,
01" QuIntoil ,
iHaneOcks Bridge Pe1714 •Harmersvitle
dsfowl:
Bowentown
illvoCh osr!" ,
G
st' BEN DAVIS Pr k
,
Fortesoue
K E N \ Dover
DEFPw• ER ,
EGG !SLAM, PT
WI I I ewe r (iv ••
Vie Halm wEa,
.1.,Port No
r Vineland d '• •
Vineland‘,•: , s•
D Manurniuksgelt
Elizabeth P•to
maws.;
Pet.
,7"r:'77 0-Iv Crass Keys -C1
T •E Br
kfl:;."'"•rta WI ,s •Fries /441s
"MdinvItlett4
^ ■• VS: Victorla•::'
• `, alaga
"d',414
vint , , --Jsr Grove
' MinairawYdn Ce,jar
• *it•rtiqf, •• Cree„kA
' , per, 411Am-brag
41,WOr • .x.„?
:PA"; — Leeds Gir.,,,k& r•-•
;;;73.": 44ii• G;;; tT.
LEGEND ARTIFICIAL ISLAND REFINERY PIPELINE
r Bridgeton
-Cream L
,Fairton
jtog R„ck
aUriCe ,Dorchesf Leesburg
AST PT
Co
POr!Heimbi-rcl"-- .11
Z.Tac , 1
* 11.14 Absecon
Inlet
tlantic wasp argate
City ongport
rear Egg, Inlet
ean City
orson Inlet (..■ Strathrnere 0
View a Isle City
Townsends Inlet
I-- 1- 7630 '
Dela ware cape Dias Cree
_ Green Crilit
FIshIng Creed"' Rio Grand
Errna cold Sur";
W Cape Ma rape May Point
of Gr ee nwich
Bay
valon .C. a C'E
Buktrf tone Harbor .s..
What o `Hereford Inlet WIldwoini
Mwmd Wildwooa Crest
vi,woold.,Spr r .7,01arbo
pe May , 1,3t1
FIGURE 7 LOCATION OF DEEPWATER PORT AND ASSUMED PIPELINE ROUTE OF ALTERNATIVE 1-2
Robert R Nathan Associates, Inc

Et MONOBUOYS 0 INTERMEDIATE TANK FARM
AT NEW SHREWSBURY 0 REFINERY --PIPELINE
, N
1::+reeloh)
Po= „
Fw, GreetvIRe
11/12 .7, :e*d'"j•:e
Hatfield
Lansdale
t" • \
iivinwi *Poll
' Philade
1100K
XIC Highlands
ighlands son
P, b••• • ;pit Sea Bright
„Lttr„, retarbury R oirt I:14P Motnmouth Beach
„ fle • ..k
g Branch . ...21111rikr lberon
r .. l.bi enubrylark Ocean Grove
1te. vobytheSna
anasquan
' • Belmar .pring Lake
•
y Head
ton
ntoloking
Normandy , Beach
valtette/
Seaside Heights
ScanPark
IBM< IRem •ntle■eke ,Palatin ,or . 011ftlt04
•fancidekk fIndg-eo 7P47tit • Harmervapp_ "4,•!:
— V.I. • :-:..ttuti ,Rt5adteforifi
fL
v . Biefie'ntown .4,
k;.111Z UNOAVISP
MAPIT.ENTP in.:ISEit• Hifi"
Forteme
DEEPWATER PT FAST PT
EGGISIAND
De la wa
Bay
FrattAffaai•e"'
---•-••htir''Longtbide ol Greenwich
1-175•80' Cold S
W Cape Cape May Poin
r e CopoM Dias Cree
Poerc Green C
Fishing Cre Roo
ramontcit-1./ 'v.44
.1e4T.-"g ka.r. 'tf-t-t Watt -
tw306: •-•-li"Wrick-ve
_
NI% Raptebrx-,--tei ;„;;MICArt"
- 3 ...atke.y-111 'TUCK.
C
GANTINE
ean City „ ore
_arson Inlet Lt Strathmere
View ea Isle City
Gos Towneeects Wet N mien •C'
C71 tone Harbor
Hereford Inlet ,steVoldwood
MMW Woldwood Crest
old Spring Harbo• Twolcua.14
-ape May
Hite
CeS.■ 1ff., _41M, ACH
'ebsecon Inlet thrItIC
argate City
on gport rear Egg Inlet
LEGEND
••r
FIGURE 8. LOCATION OF DEEPWATER PORT AND ASSUMED PIPELINE ROUTE OF ALTERNATIVE 1-3
Robert R. Nathan Associates, Inc.
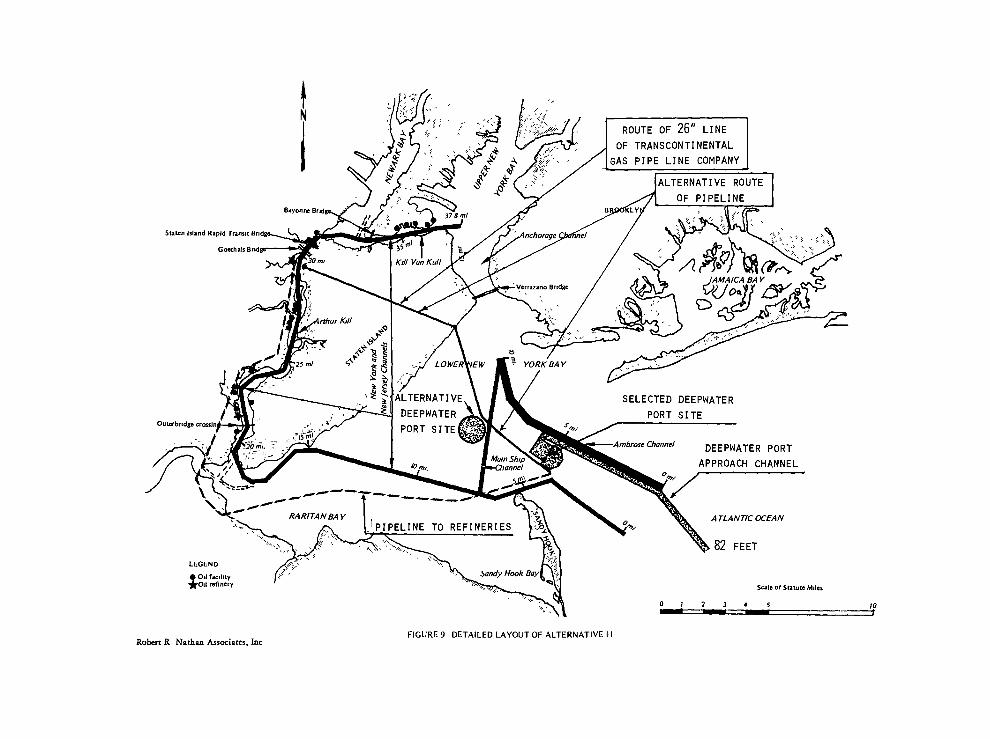
LEGEND
Oil facility *Oil refinery
.Sandy Hook Bay
Scale of Statute Milts
ROUTE OF 26" LINE
OF TRANSCONTINENTAL
s ■/' GAS PIPE LINE COMPANY
ALTERNATIVE ROUTE OF PIPELINE
Bayonne 13nd 378 ml 91X5‘1 .
Staten Island Rapid Transit Bridg
G oath als Bnd
nchorage
rthur Kill
EW ir YORK BAY
SELECTED DEEPWATER PORT SITE
Outerbudge crossIn
Ambrose Channel DEEPWATER PORT APPROACH CHANNEL Main Ship
0-Channel
.... 4
ATLANTIC OCEAN RARITAN BAY
PIPELINE TO REFINERIES
82 FEET
0 7 2 3 4 5 BENENI___I■t--esmoms
FIGURE 9 DETAILED LAYOUT OF ALTERNATIVE I- I Robert R Nathan Associates, Inc

11
10 '41
20
19
15
t - 17
'
7 I 16 13 14 16 13 1
23
25 5 23
39 22
14 13 03 \ _ 13 14 14 14
16
14 16 16 .c .1 "19
/
21
, 1
/ 6
20 4^, 24
2
43
8 h4t 8
1
1 3
0wEsT 13-ACI
I EInt6ser1„1*
Its 15
! ,„. 6•" ----. L.'P ir'19 ' 19
.? 4114N "1
- . 20d' xi
, 20 1 231,>,, A 1 ,f4,$<'•
' 21''-,,22 e".40,4.: 22 / `,24
23 24
23
I i 26
19 23 2,4 l :b0 N23 44/ C"//411
13
20
22 TURNING BASIN
21 BERTHING AREA
Robert R Nathan Associates, Inc
3
19
14 Of/
24 25
re
38\ —zi
\J
- ,
R. Ref'
3 ./7.a41/ 41'10 4 w 33 %
wH/Srlf 1 Fl 4sec i
\ 35 32 k
31 1
%
24\--)32 341
27 1
Ix 28
- 2312,../7\3,211 .
'26 3
23„r , t„ „14ok
15.4” ,,,0 1 , f 1 43cc 5 24 i '21 j35%e%
r9 27: I i
/ 1 , I g ii17....\...r.%?c,3\51
'
\
I 28 i 38%
..k /
Ina' 2
104
J29
rIna' 23
BELL , fIR <hoc
1%33 29 yrri 24 1 104
28 28
41re/6. 21 IR4sec
$32, 26 30
26 25 kV
31
A.26 oicn \era\
23
19 19
27
, 20 23
2.°' 14'
43( 1 ..„) 5,,
13_ 1 _411 17 1 23 27 i
1 1‘3
kb,!:c :‘
13
/ -raiz /
2
233 125 noi 1 25 P
23 1 ,47.7.N. 11 DEPTHS IN FEET
24 28
26
24 26
ta 100• 4 4111111m
\ A1'P' ^ \ '''''• 41110,(■ " '.'"--.. 16
IM.:----.41 11 \\,
21
18 22 .th T
21 is
<P .
hro. ,.
1 ,.. 20
.,. --.22.
\-■ ''' --...., —e -....--..... 18,4. 19 4/03 2, 16 16
41 Ref is 20 19 -... 7 1 /0 „„,,
14 i;\::.. ,
C4 •••4 1 5 16 18
■ ••••••- _ \it"?' 15 r 15 (91 Is .,.. 4,
17 s
-",...--•,22....2-1...,,R... 16 /I 13 17 ( A /7 14
21
Itio
;„'-‘4 11 1 20 2, 2,
23 ' I 10 1 24 /76 1 ' ki 4. ).?
24 sr" 1.4..4. ' 7_ 23 1 a , 23
mi, 1 1 4 PIPELINE(S) TO REFI , g 23
22\
23
24 ARTIFICIAL ISLAND .,.
c• "GENERAL SERVICES AREAii,
23 1 CRUDE OIL TANK FARM -i; 227----4-5-3, 2-/
Ox F7 ./3 , C20\ V2
7 )itir4 ,) It. •2‘0 \ 1
_7A■... X I\ 14 \--) ., 15 18 17_4
--Iv- 19
18 .1 4 •
14 44 /J. 141 -.I A
15 ■11/44 i ,,,„ ■•t7 #4
14 15
13 N.14eY
16
( ■:3t 11
diV 14 13 ‘ 26
20 622 19
i9b,dkl? • 1.1-4S" 25 20_.....*:, •:70*
'...."'...■.-2bc!7 i4 •■;1-44'174„, 14 1:(Vi
14 0 Att Rer
Cl3ly i?04 7.es4,
c Po
1614147t **•••■ k'4
22 19
i5
TO
Scale of Statute Miles Note Ultimate layout for subalternatives B and D of alternative 1-2 0
FIGURE 10 DETAILED LAYOUT OF DEEPWATER PORT OF ALTERNATIVES 1-1 AND 1-2

101
98
10
\', 52 c,
r \ SUBMAR 1 36 r 53 '-'7, ,,83 52 ...5.1. _ _ 6_ 3.) 63
6.5 64 28, , ie, I j / e3'BOOSTER PLATFORM
t 54 ,, 152 58 ,i 6-5 ' 85 ' 71 72
i. ,it 38 \..4.\ 8, 9 .,,, 64 ' , 88 Oder 85 VS •
,, '. 73
151 `,..4. & , . ,- - -5e ; k\ 62 71 •
lc, 1 9 ' • A i ' 50 774,a/ 85 c'''• Mis -
,, ,, 41 i . . slA• -MONOBUOY' AND TANKER ,t ss
,
... , 42 \46
1 4/ r ,tabe r— • - 45-21,45 \ 9i 1 la \
4
43 \ ,N• 04 /e15 C' la\
462 _ • I •, 76 ." '," 64 •• \
, \rr
109 1; ‘,"• 127
4. 32 40 Nit 51 51,/ .."60 58 L 83,2' ,
-
I "46 46 •• ' t \ '11":‘ \ 36 „e 1 ,,,\‘ 41„/ ". \ -
• "
Th \ 0 153
2 ,
•si'\
,53,16
•
\ AT L ANT I C OCEAN 59_ ,
78 E ' aydstr 5 " ‘1
20
30 'P'('7 „ 4w,-* r s 58 r ' cs. 73
1/45 r 64/ ' 0" z TE 83 \ _ 90 - .... ___
88 •
1'0 „ti- 54 A.'"-"/."‘, \76\ 0 _ 109
1 91 114 126 4- 4, #4,„' \w,(,--, ' 442/ 59 ' ',-... " _ -, z-- Ict
,-. , , , 46 ) 53,, se -, -e-S— :- - 77—FOOT CONTOUR
1 .7: , s /,, ...t, 57" ,.." 57
•,,_, _,' A
, i v iNp i 3-' \ -'-- . '' ''' "- IA I c 54,, 38 53 • 56
52 ‘ -58 :''\ . '•a.' 'P9 27 " '03/21 I
34 ' 46 .,•.--- 8/#/7"-•''' -
i'2°, 27 55,•fr4' 01 '' 1.' 75R" 46 4/1 "" ' "
Ft 2,sa • '' - .5i - - ..P;' ,., , ' ",,,I
'51 r - - - 76\„1..• 65
64 C'20 1 \ a N66 4 '6° 21 411, 33 1 37 c 47 ," '
21 17\ 34 14'" 55 53 '-5-8 -,' WS \ es 72 43 , is S 82
' 54 ,_ -
\ '
37 1 S 46 '. - - 64' 4'
\55,5:2." 87 \ ea 73 ) 32
4 \" 54 - •-• • - - 82 , eiS ,-56`,• 42
1 5
....- „
52\N55 ' 61-'0'262\ m \
39 42 L49
46 11;\ „ 56 b'S
57
‘, 58.1
: ' 93 1'4 73
6,3- 72 52 AL
MANEUVERING AREA 71
Oorh- 67
64
(1 67 ''`•
70
71
\\68.,
73
74
89
66
74
• • • ,13/1
,
`R4
/96
,
/721\,. t,f 081
99 j 137
1 1 1 127 ' Iti'V
\;49
1181
/
108
104
112
, 132
/LJ
101
' <
k s 197
'481 112 1
403 (tep destr0"4
141
8 irBA" 441,1)WHIS
181
150
133
:180
.3 : j1 43 / 53,, .. i \ ir , \ 51
39 '''' / .49 / ' 58 \ 2g ' '. h
1 38G, 51 ,/,'\,, 82 47
/ t-
t •, 52 i
47 ;'. • , 46
,...... ._,
5 / • '' - 57 ,DE PTHS IN FEET ' 6
Note: Ultimate layout for subalternatives B and D. * Beacon
„
e5/ - V 63 " 65
`(Ri..‘Dius = 4,000 FT,)" 49 -
-,'70\ ‘, ‘)4\ , - .
''- ''. 86 70 , \
‘4 -; 85 - . .5-1 • - - ' 67 ."-,„„ /59; tfr 63 ,;;AC-'" ,
• -`.„\ \
85
S G 73
se -
74
78
75
62 \
76
0 'Erci
97 0 •
1 83
, 87
ee' N96
,
//
••••
_01 ,
Scale of Statute Miles
)
•
Oimmummi===i
.. 62 48 ,,..:. 63 , , ' 58 ,_ _ „592, C.-.... ,..•i, t, „
62 7 ' . 69. ." - - 6-3, - c.. „52
3,,,, - ' 54 57; 63
FIGURE II DETAILED LAYOUT OF MONOBUOYS AND SUBMARINE LINES OF ALTERNATIVE 1-3
Robert R Nathan Associates, Inc

286.
70 m.t.a. by 2000. Alternatives 1-2 and 1-3 also con-sider two sets of throughputs. The lower throughput is set at 100 m.t.a. in 1980 (30 m.t.a. to the Arthur Kill area and 70 m.t.a. to the Delaware River area) and 150 m.t.a. by 2000 (35 m.t.a. to the Arthur Kill area and 115 m.t.a. to the Delaware River area). The higher throughput is set at 150 m.t.a. in 1980 (35 m.t.a. to Arthur Kill area and 115 m.t.a. to the Delaware River area) and 300 m.t.a. by 2000 (70 m.t.a. to the Arthur Kill area and 230 m.t.a. to the Delaware River area).
Type of Berths
Alternatives 1-1 and 1-2 consider fixed berths, whereas alternative 1-3 considers monobuoys.
Site of Tanks
Alternatives 1-1 and 1-2 consider an offshore tank farm, whereas alternative 1-3 considers an onshore tank farm.
Vessel Sizes
Each alternative considers 300,000 and 400,000 d.w.t. tankers, and it is assumed that all tankers using the deepwater port will be of these maximum sizes. The assumed dimensions of these tankers are given in table 22.
Table 22. Assumed Dimensions of 300,000 and 400,000 Deadweight Ton Tankers
Dimension 300,000 d.w.t. 400,000 d.w.t.
feet
Length Beam Draft
1,100 192 70
1,262 220 70

287.
Dredging
Alternatives 1-1 and 1-2 require dredged channels, turning basins, and berthing areas. The artificial is-land will be constructed of dredged material. Alterna-tive 1-3 does not require dredging. All submarine and onshore pipelines are expected to be buried.
Water Depths
In all alternatives the depths of channels, man-euvering areas, etc., is such that all maximum-size tank-ers will need to wait for high tide to approach the facilities. In other words, in alternatives 1-1 and 1-2, the dredged depths are minimum, and in alternative 1-3 the monobuoys are located as close to shore as pos-sible. Calculations of trade-offs between deeper dredging (alternatives 1-1 and 1-2) or longer submarine lines (alternative 1-3) on the one hand and limited or no waiting time for high water by the supertankers on the other hand are necessary to determine the optimum solution. These calculations have not been made. _
Because mean high water (MHW) at Sandy Hook is 4.6 feet above mean low water (MLW), a value of 4.0 feet for average tidal rise has been selected.
Construction Program
The time phasing of the various construction items for the period prior to 1980 is given in table 23 for alternatives 1-1 and 1-2, and in table 24 for alter-native 1-3. The entire phasing was simplified to fac-ilitate calculations. The total cost of each item will be distributed equally over the pertinent years.
Alternative 1-1
Criteria
1. Site of deepwater port: Lower New York Bay. 2. Service area: Refineries along Arthur Kill. 3. Type of berths: Fixed.
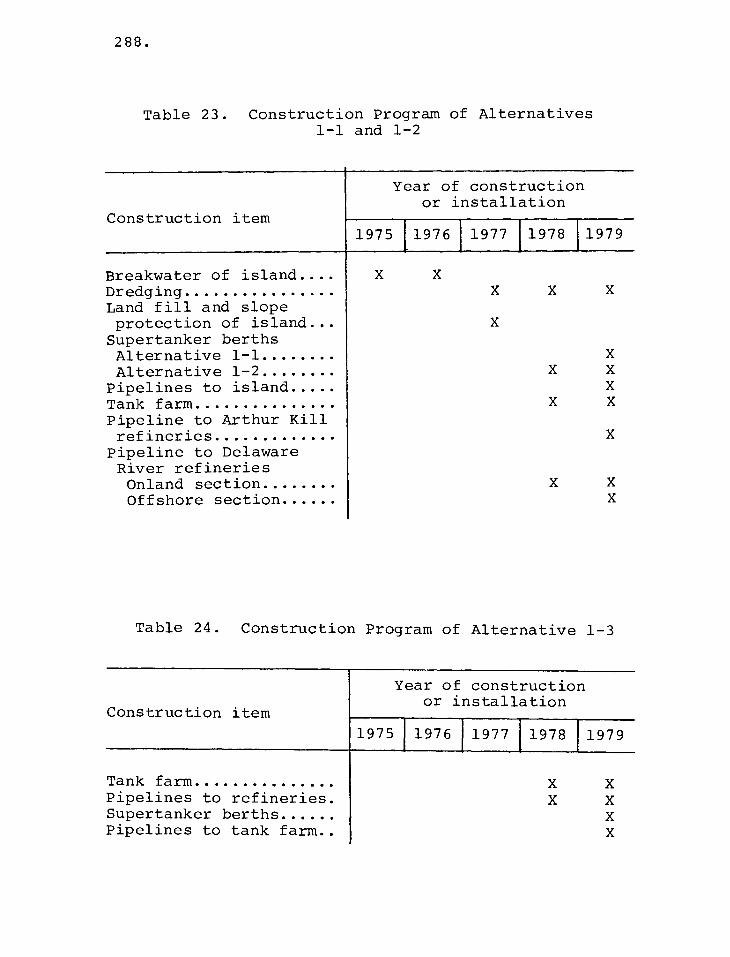
X X X X
X
X
288.
Table 23. Construction Program of Alternatives 1-1 and 1-2
Year of constructio or installation
Construction item 1975 1976 1977 1978 1979
Breakwater of island Dredging Land fill and slope protection of island Supertanker berths Alternative 1-1 Alternative 1-2 Pipelines to island Tank farm Pipeline to Arthur Kill refineries Pipeline to Delaware River refineries Onland section Offshore section
Table 24. Construction Program of Alternative 1-3
Construction item
Year of constructio or installation
1975 1976 1977 1978 1979
Tank farm X X Pipelines to refineries X X Supertanker berths X Pipelines to tank farm X

35 70 35 70
30 35 30 35
289.
4. Site of tanks: Offshore artificial island. 5. Draft of tankers: 70 feet fully loaded. 6. Subalternatives: The throughputs of the var-
ious subalternatives, and the size of the vessels they will serve, are given in table 25.
Table 25. Throughputs and Size of Vessels Served by Subalternatives
Subalternative
Vessel size
(d.w.t.)
Throughput (million tons/year)
1980 2000
A B C D
300,000 300,000 400,000 400,000
7. Type of transshipment: Pipelines only.
Requirements
Supertanker berths. Two berths will be required for all subalternatives by 1980; no additional berths will be required from 1980 to 2000.
Dredging quantities. All quantities will in-clude an overdepth of 4 feet. In determining the chan-nel depth, 4 feet of tide will be taken into account.
1. Ocean Channel, parallel Ambrose Channel a. Length = 9 miles b. Depth = 81 feet-4 feet (tide) + 4 feet
(overdepth) = 81 feet c. Average present bottom depth per mile in
feet:

290.
Mile Side
9 4 3 8 6 2 1 7 5
South... 75 58 52 44 48 20 21 27 29 North... 75 58 52 45 45 45 45 45 45
d. Approximate average depth (1) South side = 41 feet (2) North side = 50 feet
e. Approximate average depth, 45 feet; aver-age dredging depth, 36 feet
f. Width at bottom (1) Subalternatives A and B = 770 feet (2) Subalternatives C and D = 880 feet
g. Quantities to be dredged 9 x 5,280
(1) Subalternatives A and B- 27 x 36 x (770 + 3 x 36) = 55.6 x 10 6 cubic yards
9 x 5,280 (2) Subalternatives C and D- 27
x 36 x (880 + 3 x 36) = 62.6 x 10 6 cubic yards.
2. Turning basin a. Length = 3,000 feet b. Width
(1) Subalternatives A and B = 1,650 feet (2) Subalternatives C and D = 1,900 feet
c. Depth = 77 feet-4 feet + 4 feet = 77 feet d. Average present bottom depth = 15 feet e. Average dredging depth = 62 feet f. Quantities to be dredged
3000 (1) Subalternatives A and B - '27
x 1,650 x 62 = 11.4 x 10 6 cubic yards 3 000
(2) Subalternatives C and D - -.1-27- x 1,900 x 62 = 13.1 x 10 6 cubic yards
3. Berthing area a. Subalternatives A and B
(1) Length = 1,650 feet (2) Width = 7 x 192 = 1,345 feet
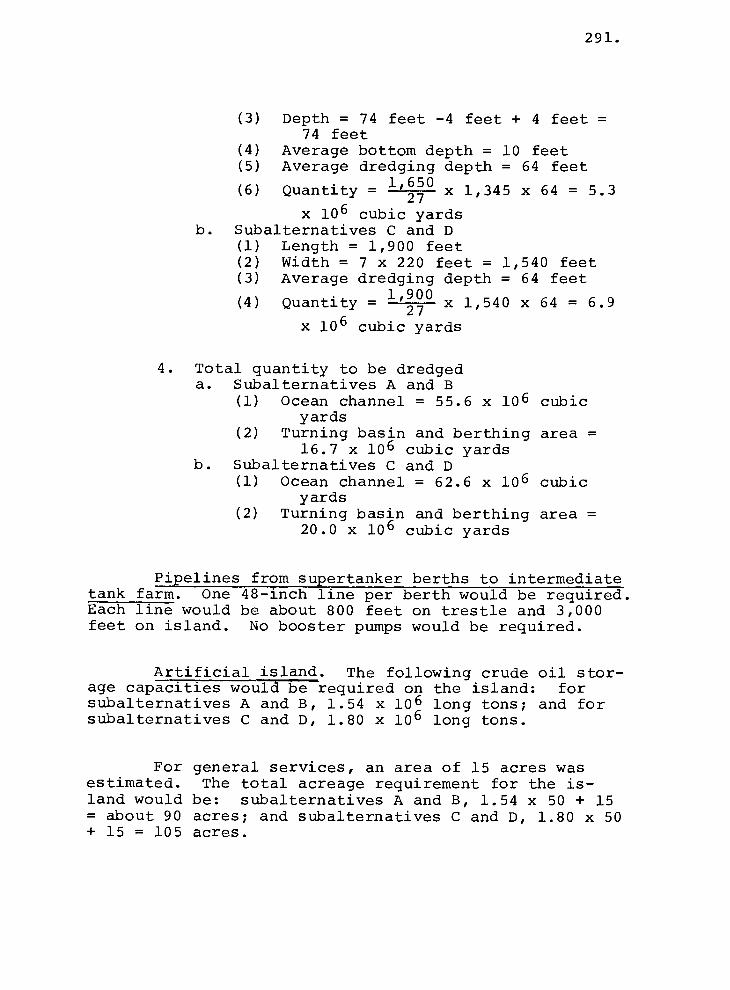
291.
(3) Depth = 74 feet -4 feet + 4 feet = 74 feet
(4) Average bottom depth = 10 feet (5) Average dredging depth = 64 feet
(6) Quantity - x 1,345 x 64 = 5.3
x 10 6 cubic yards b. Subalternatives C and D
(1) Length = 1,900 feet (2) Width = 7 x 220 feet = 1,540 feet (3) Average dredging depth = 64 feet
(4) Quantity - 1,9200 x 1,540 x 64 = 6.9
x 10 6 cubic yards
4. Total quantity to be dredged a. Subalternatives A and B
(1) Ocean channel = 55.6 x 10 6 cubic yards
(2) Turning basin and berthing area = 16.7 x 10 6 cubic yards
b. Subalternatives C and D (1) Ocean channel = 62.6 x 10 6 cubic
yards (2) Turning basin and berthing area =
20.0 x 10 6 cubic yards
Pipelines from supertanker berths to intermediate tank farm. One 48-inch line per berth would be required. Each line would be about 800 feet on trestle and 3,000 feet on island. No booster pumps would be required.
Artificial island. The following crude oil stor-age capacities would be required on the island: for subalternatives A and B, 1.54 x 10 6 long tons; and for subalternatives C and D, 1.80 x 10 6 long tons.
For general services, an area of 15 acres was estimated. The total acreage requirement for the is-land would be: subalternatives A and B, 1.54 x 50 + 15 = about 90 acres; and subalternatives C and D, 1.80 x 50 + 15 = 105 acres.

292.
The assumed average water depth at the island is 15 feet, and the assumed required terrain elevation is + 20 feet. The land fill requirements would be: sub- , alternatives A and B, (90 4. 27) x 43,560 x 35 = 5.1 x 10 °
cubic yards; and subalternatives C and D, (105 27) x 43,560 x 35 = 5.9 x 10 6 cubic yards.
For all subalternatives, the breakwater would be about 1 mile long, and the slope protection at the land side of the island would be about 0.5 mile long.
Pipeline to refineries along Arthur Kill. One 48-inch pipeline would be sufficient during the period from 1980 to 2000. The total length of the pipeline system was estimated at 29 miles, about 15 miles of which would be off shore through the Raritan Bay in or parallel to an existing pipeline area. The inland sec-tion would have two major river crossings, one about 3,000 feet long (Raritan River) and one about 750 feet long (Rahway River). Figures 6, 9, and 10 show the location of the deepwater port and the assumed pipeline route to the major refineries.
Booster pumps with the following approximate horsepowers would be required: subalternatives A and C would require 29 x 37.84 = 1,100 b.hp. by 1980, and 29 x 59.17 = 1,720 b.hp. by 2000. It is assumed that 1,800 b.hp. (35 m.t.a.) would be installed by 1980.
Subalternatives B and D would require 29 x 59.17 = 1,720 b.hp. by 1980, and 29 x 407.80 = 12,000 b.hp. by 2000. The following installations would be made: before 1980, 3,000 b.hp. (42.5 m.t.a.); in 1983, 3,000 b.hp. (54 m.t.a.); and in 1990, 6,000 b.hp. (70 m.t.a).
The maximum throughput in millions of long tons per year of each system is indicated in parentheses.

100 150 100 150
150 300 150 300
293.
Alternative 1-2
Criteria
1. Site of deepwater port: Lower New York Bay 2. Service area: Refineries along Arthur Kill
and Delaware River. 3. Type of berths: Fixed. 4. Site of tanks: Offshore artificial island. 5. Draft of tankers: 70 feet fully loaded. 6. Subalternatives: The throughputs of the
various subalternatives, and the size of the vessels they will serve, are given in table 26. The projected flows are given in table 27.
Table 26. Throughputs and Size of Vessels Served by Subalternatives
Subalternative Vessel size
(d.w.t.)
Throu (million
1980
ghput tons/year)
2000
A 300,000 300,000 400,000 400,000
Table 27. Projected Flow
(In millions of tons/year)
Arthur Kill Delawar e River Subalternative
1980 2000 2000 1980
A and C B and D
30 35 70 115 35 70 115 230
7. Type of transshipment: Pipelines only.

294.
Requirements
Supertanker berths. Subalternatives A and C will require three berths by 1980, and no additional berths during the period from 1980 to 2000. Subalter- native B will require four berths by 1980 and five berths by 1990 (the additional berth will be installed in 1989). Subalternative D would require four berths by 1980 and five berths by 1994 (the additional berth will be installed in 1993).
Dredging quantities. All quantities will in-clude an overdepth of 4 feet. In determining the channel depth 4 feet of tide will be taken into ac-count.
1. Ocean channel. The dimensions will be the same as those required in alternative 1-1. Subalter-natives A and B will require 55.6 x 10 6 cubic yards; subalternatives C and D, 62.6 x 10 6 cubic yards.
2. Turning basin. The following dimensions would be required:
a. Length (1) Subalternatives A and C = 3,600 feet (2) Subalternatives B and D = 4,200 feet
b. Width (1) Subalternatives A and B = 1,650 feet (2) Subalternatives C and D = 1,900 feet
c. Depth = 77 feet-4 feet + 4 feet = 77 feet d. Average present bottom depth = 12 feet e. Average dredging depth = 65 feet f. Quantities to be dredged
(1) Subalternative A - 3,600 x 1,650
x 65 = 14.5 x 10 6 cubic yards. _ (2) Subalternative B x 1,650
x 65 = 16.6 x 10 6 cubic yards. 3
(3) Subalternative C - ,600 x 1,900
x 65 = 16.4 x 10 6 cubic yards. 7
(4) Subalternative D - 4,200 x 1,900 x 65 = 19.1 x 10 6 cubic yards.
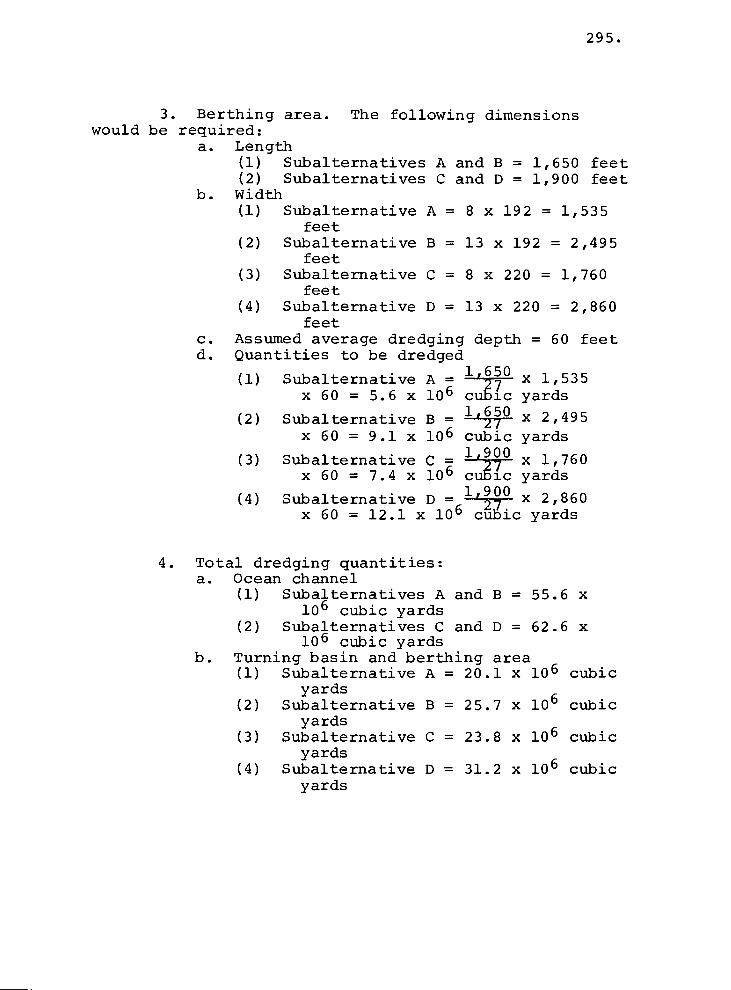
295.
3. Berthing area. The following dimensions would be required:
a. Length (1) Subalternatives A and B = 1,650 feet (2) Subalternatives C and D = 1,900 feet
b. Width (1) Subalternative A = 8 x 192 = 1,535
feet (2) Subalternative B = 13 x 192 = 2,495
feet (3) Subalternative C = 8 x 220 = 1,760
feet (4) Subalternative D = 13 x 220 = 2,860
feet c. Assumed average dredging depth = 60 feet d. Quantities to be dredged
(1) Subalternative A 1 630 x 1,535
x 60 = 5.6 x 10 -6 cubic yards 124(1. (2) Subalternative B - x 2,495
x 60 = 9.1 x 10 6 cubic yards 1 900 (3) Subalternative C 7 x 1,760
x 60 = 7.4 x 10 6 cuBic yards 1,900 (4) Subalternative D - 27 x 2,860
x 60 = 12.1 x 10 6 cubic yards
4. Total dredging quantities: a. Ocean channel
(1) Subalternatives A and B = 55.6 x 10 6 cubic yards
(2) Subalternatives C and D = 62.6 x 10 6 cubic yards
b. Turning basin and berthing area (1) Subalternative A = 20.1 x 10 6 cubic
yards (2) Subalternative B = 25.7 x 10 6 cubic
yards (3) Subalternative C = 23.8 x 10 6 cubic
yards (4) Subalternative D = 31.2 x 10 6 cubic
yards

296.
Pipelines from supertanker berth to intermediate tank farm. One 48-inch line per berth would be required. Each line would be about 800 feet on a trestle and 4,000 feet on the island. No booster pumps would be re-quired.
Artificial island. The following crude oil stor-age capacities would be required: subalternative A, 1.81 x 10 6 long tons in 1980; subalternative B, 2.24 x 10 6 long tons in 1980, and 2.51 x 10 6 long tons in 1990 (additional storage for 0.27 x 10 6 long tons to be in-stalled in 1989); subalternative C, 2.15 x 10 6 long tons in 1980; and subalternative D, 2.67 x 10 6 long tons in 1980, and 3.04 x 10 6 long tons in 1994 (addi-tional storage for 0.37 x 10 6 long tons to be installed in 1993).
For general services an area of 20 acres was es-timated. The total acreage requirement for the island would be: subalternative A, 1.81 x 50 + 20, or approx-imately 110 acres; subalternative B, 2.51 x 50 + 20, or approximately 145 acres; subalternative C, 2.15 x 50 + 20, or approximately 130 acres; and subalternative D, 3.04 x 50 + 20, or approximately 170 acres.
Assuming the elevation of the island is + 20 feet and the present water depth is -15 feet, the land fill volumes required for subalternatives A, B, C, and D would be 6.2, 8.2, 7.3, and 9.6 million cubic yards respectively. The breakwaters for these subalternatives would be about 1.1, 1.3, 1.2, and 1.5 miles long, res-pectively, and the slope protection at the land side of the island would be about 0.8 miles long.
Pipelines from island to refineries. Two sep-arate pipeline systems have been selected, one serving the refineries along the Arthur Kill and one serving the refineries along the Delaware River. Figures 7 and 10 show the location and layout of the deepwater port, and the assumed pipeline routes to the refineries.

297.
1. Pipeline to refineries along Arthur Kill. The requirements for a pipeline would be the same as those of alternative 1-1. The total length of the pipe-line system is estimated at 29 miles, about 15 miles of which would be off shore through the Raritan Bay in or parallel to an existing pipeline area. The inland sec-tion would have two major river crossings, one about 3,000 feet long (Raritan River) and one about 750 feet long (Rahway River).
Booster pumps with the following approximate horsepowers would be required: subalternatives A and C would require 29 x 37.84 = 1,100 b.hp. in 1980, and 29 x 59.17 = 1,720 b.hp.-in 2000. It is assumed that 1,800 b.hp. would be installed before 1980. Subalternatives B and D would require 29 x 59.17 = 1,720 b.hp. in 1980, and 29 x 407.80 = 12,000 b.hp. in 2000. The following installations would be made: 3,000 b.hp. (42.5 m.t.a.) before 1980; 3,000 b.hp. (54 m.t.a.) in 1983; and 6,000 b.hp. (70 m.t.a.) in 1990. The maximum throughput in million long tons per year of each system is indicated in parentheses.
2. Pipelines to refineries along Delaware River. The total pipeline system, including branch lines, would be approximately 140 miles long. About 15 miles would be off shore through the Raritan Bay, in or parallel to an existing pipeline area and to the pipe-line to the Arthur Kill area. The onshore section is assumed to run parallel to the Penn Central Railroad line to Jamesburg, a distance of 12 miles; continuing to Burlington and Camden, a distance of 46 miles; and from there to Delaware City, a distance of 47 miles. The latter section has branch lines to Philadelphia, Paulsboro, and Marcus Hook totaling 13 miles. The main line would cross the Delaware River at Deepwater Point and would also cross 10 smaller rivers or creeks. The Delaware River crossing would be about 5,500 feet long; each of the other 10 crossings would not exceed 500 feet. Two branch lines, one to Philadelphia and one to Marcus Hook, would also cross the Delaware River. Each of these crossings would be about 5,500 feet long.

298.
For subalternatives A and C, one 56-inch line would be required. For the offshore section, two 48- inch lines will be assumed for construction reasons. The horsepower requirement for the two 48-inch lines will be considered the same as for one 56-inch line. The size of the branch lines was set at 48 inches.
The required horsepower in 1980 equals 140 x 188.7, or 26,400 b.hp.; and in 2000, 140 x 768.5, or 108,000 b.hp. The following installations would be made: 54,000 b.hp. (90 m.t.a.) before 1980, and 54,000 b.hp. (115 m.t.a.) in 1988. The maximum throughput of each system in millions of long tons per year is indi-cated in parentheses.
Subalternatives B and D would require two 56- inch lines. For the offshore section, three 48-inch lines will be assumed for construction reasons. The size of the branch lines was set at 48 inches. The horsepower required for three 48-inch lines will be con-sidered the same as for two 56-inch lines. In 2000, the same horsepower capacities per line would be re-quired as in subalternatives A and C. Eventually, the total horsepower installation of subalternatives B and D would be double that of subalternatives A and C. Al-though the second group of pumps could be installed in 1991 or 1992, to keep the installation program identical with that of subalternatives A and C, 1988 will be used.
Alternative 1-3
Criteria
1. Site of deepwater port: In the Atlantic Ocean off Long Branch, New Jersey.
2. Service area: Refineries along Arthur Kill and Delaware River.
3. Type of berth: Monobuoys. 4. Site of tanks: Onshore at New Shrewsbury. 5. Draft of tankers: 70 feet fully loaded. 6. Subalternatives: The throughputs of the
various subalternatives, and the size of the vessels they will serve, are given in table 28. The projected flows are given in table 29.

100 150 100 150
150 300 150 300
35 _30 70 115 35 115 70 230
299.
Table 28. Throughputs and Size of Vessels Served by Subalternatives
Vessel size
(d.w.t.)
Throughput (million tons/year)
1980 Subalternative
2000
A 300,000 300,000 400,000 400,000
Table 29. Projected Flow
(In millions of tons/year)
Arthur Kill Delaware River Subalternative
1980 2000 2000 1980
A and C B and D
7. Type of transshipment: Pipelines only.
Requirements
Supertanker berths. The number of berths would be the same as that required in alternative 1-2: sub-alternatives A and C would require three monobuoys by 1980, with no additional buoys needed in the period from 1980 to 2000. Subalternative B would require four monobuoys by 1980 and five monobuoys by 1990 (the one additional buoy being installed in 1989). Subalterna-tive D would require four monobuoys by 1980 and five monobuoys by 1994 (the one additional buoy being in-stalled in 1993).

300.
Dredging quantities. No dredging is required.
Water depth of maneuvering area. The minimum depth requirement is 81 feet -4 feet = 77 feet.
Pipelines to intermediate tank farm. One 48- inch pipeline per berth would be required. Each line is about 16.5 miles long, of which 7.5 miles would be off shore and 9 miles would be on land. The offshore lines would run from the buoys to a booster pump station, lo-cated at a maximum distance of 2.5 miles from the south-ernmost and northernmost buoys. The available pressure remaining at the booster station would, in subalterna-tives A and B, be 150 -70 -2.5 x 17.4, or 36 p.s.i.; and in subalternatives C and D, 150 -70 -2.5 x 21.2, or 27 p.s.i. The remaining pressure would exceed the minimum of 25 p.s.i.
From the booster station to the tank farm would remain a 14-mile length of pipeline, of which about 5 miles would be offshore and 9 miles would be on land. The power requirement per line would be, for subalter-natives A and B, 14 x 47 x 17.4 = 11,500 b.hp.; and for subalternatives C and D, 14 x 52 x 21.2 = 15,500 b.hp.
Intermediate tank farm at New Shrewsbury. The requirements for crude oil storage would be the same as for alterpative 1-2. Subalternative A would require 1.81 x 10 ° long tgns by 1980. Subalternative B would require 2.24 x 10 ° long tons by 1980 and 2.51 x 10 6
long tons by 1990 (the 0.27 x 10⁶ additional long tons being installed in 1989). Subalternative C would re-quire 2.15 x 10 6 long tons by 1980. Subalternative D would require 2.67 x 10 6 long tons by 1980 and 3.04 x 10 6 long tons by 1994 (the 0.37 x 10b additional long tons being installed in 1993).
Assuming that one bunker line will be used be-tween the tank farm and booster station, and that the number of bunker lines between the booster station and monobuoys will equal the number of monobuoys, the num-ber of bunker fuel tanks can be minimal. Also, it has

301.
been assumed that no oil separation facilities will be installed. Therefore, the general service area has been assumed not to exceed 10 acres.
The required acreage would be: for subalterna-tive A, 1.81 x 50 + 10 = about 100 acres; for subalter-native B, 2.51 x 50 + 10 = about 135 acres; for subal-ternative C, 2.15 x 50 + 10 = about 120 acres; and for subalternative D, 3.04 x 50 + 10 = about 160 acres.
Pipelines to refineries. Two separate pipeline systems will be assumed, one to the refineries along the Arthur Kill and one to the refineries along the Delaware River. Figures 8 and 11 show the location and layout of the deepwater port and the assumed pipeline routes to the refineries.
1. Pipeline to Arthur Kill refineries. The pipeline is assumed to follow a southwesterly route to Farmingdale, and then a northwesterly route to James-burg. After Jamesburg, the pipeline would follow a northwesterly route along the Penn Central Railroad line via South Amboy to the refineries. Alternative routes are possible.
The approximate mileage of the various sections of the pipeline would be as follows: New Shrewsbury tank farm to Jamesburg, 25 miles; Jamesburg to South Amboy, 13 miles; South Amboy to Humble Refinery, Eliz-abeth, 12 miles. The total length of the trunk line would be 50 miles. The length of the branch lines is insignificant.
For subalternatives A and C, one 48-inch line would be required, with about 50 x 37.84 = 1,900 b.hp. in 1980 and 50 x 59.17 = 2,960 b.hp. in 2000. It is assumed that 3,000 b.hp. would be installed before 1980.
For subalternatives B and D, one 48-inch line would be required, with about 50 x 59.17 = 2,960 b.hp.

302.
in 1980 and 50 x 407.80 = 20,400 b.hp. in 2000. It is assumed that 10,200 b.hp. will be installed before 1980 and another 10,200 b.hp. in 1988.
2. Pipeline to the Delaware River refineries. The pipeline is assumed to follow the same route to Jamesburg as the pipeline to the Arthur Kill area. After Jamesburg, the pipeline would follow the same southwesterly route to Delaware City as that of alter- native 1-2. The same river crossings would be required. Various alternative routes are possible for the pipe-line system between the New Shrewsbury tank farm and the Delaware River area.
The approximate mileage of the various sections of the pipeline would be as follows: New Shrewsbury tank farm to Jamesburg, 25 miles; Jamesburg to Glouces-ter City, 50 miles; Gloucester City to Deepwater Point, 28 miles; and Deepwater Point to Delaware City, 15 miles. The total length of the trunk line would equal 118 miles; the branch lines to Philadelphia, Paulsboro, and Marcus Hook would total 13 miles.
For subalternatives A and C, one 56-inch line would be required, with 118 x 188.7 = 22,300 b.hp. in 1980 and 118 x 768.5 = 90,700 b.hp. in 2000. It is assumed that 45,500 b.hp. would be installed before 1980 and another 45,500 b.hp. would be installed in 1988. The branch lines would be 48 inches.
For subalternatives B and D, two 56-inch lines would be required, with 118 x 107.12 = 12,640 b.hp. per line in 1980 and 118 x 768.50 = 90,700 b.hp. per line in 2000. It is assumed that 45,500 b.hp. per line would be installed before 1980 and another 45,500 b.hp. per line would be installed in 1988. The branch lines would be 48 inches.
Delaware Area
Five alternatives, numbered 2-1 through 2-5, are considered in the Delaware area. Alternatives

303.
2-1 through 2-4 are considered in combination with a coal and with a coal and iron ore handling terminal.
The locations of the deepwater ports in this area, the pipeline routes to the refineries, and de-tailed layouts of berths, tank farms, and submarine lines are shown in figures 12 through 22.
Sites
Two sites are considered, one in the Delaware Bay about 10 miles southeast of Big Stone Beach (alter-natives 2-1 through 2-4) and one in the Atlantic Ocean about 10 miles east of the Delaware Capes (alternative 2-5).
Service Areas
Alternatives 2-1 and 2-2 serve the refineries along the Delaware River, whereas alternatives 2-3, 2-4, and 2-5 serve the refineries along the Delaware River and the Arthur Kill, New Jersey. In alternatives 2-1 through 2-4, the connection between the intermediate tank farms and the refinery tank farms is assumed to be by pipelines only. In alternative 2-5, this connec-tion is by transshipment vessels only.
Throughputs
Alternatives 2-1 and 2-2 consider two sets of throughputs. The lower throughput is set at 70 million tons per annum (m.t.a.) in 1980 and 115 m.t.a. by 2000. The higher throughput is set at 115 m.t.a. in 1980 and 230 m.t.a. by 2000.
Alternatives 2-3, 2-4, and 2-5 also consider two sets of throughputs. The lower throughput is set at 100 m.t.a. in 1980 (70 m.t.a. to the Delaware River area and 30 m.t.a. to the Arthur Kill area) and 150 m.t.a. by 2000 (115 m.t.a. to Delaware River Area and 35 m.t.a. to Arthur Kill area). The higher throughput

oWl
NOY
001,
tic Highlands ghlands son
Sea Bright 'Asbury R
Monmouth Beach port
ng Branch ng Branch
lberon Ilenh urst sbury Park
Ocean Grove on by the Sea
Belmar pring Lake
ea Girt anasquan nelle
Pleasant y Head
ston ntoloking ormandy Beach ,
avallette/ Seaside Heights eancle Park
''RicMandto,V,P"lOttviraV,74 1,
„z• 713,441..4- Quaiettown.
Ho" SellersvIlle ••
B U" 'C -e poyleslien
iihkt Barnsti,P[O;
!Jeff.grson
ml -goLni.:11
chnigvIlle;;`
Loo;itawTP: i\ 4~nriItr
rrt _AItorr5y eat*. root" 'iufmm .,00ai1rrie1 L ZiancookkHrRibs g0
•Harmerbvtliec
;II DELAWARE RIVER REFINERIES
' srcrsirja4.„,u , • . „....— i
.1.6s1 ReplArtiadG_reat,k& e se.r - ".• 7,1.1CIIEN
PombrkT %MVO% c../4Llrr/e
'Qice-an9.tyte"- Ifr '
rtlet
_ rt.el
en
Laver Bay Amboy
ic‘:nov;
CONEY
Ora
Delaware
D.;„cerr4 Bay Green CriNgl
I_-1-76-ao Cold S
W Cape Caoe May Point
pe May
Hereford Inlet Mildwood
tldwood WIldwood Crest
old Spring Harbo 0 MILE BEECH
orsort Wet Strathmere
Vmw ea Isle City
Townsends Inlet
valon
ggc.„0-3 tone Harbor vs,
Fs=
NOPAtlantic argate
City fLongport
r,at Et! 101" an City
LEGEND
A DEEPWATER PORT o INTERMEDIATE TANK FARM 0 REFINERY — PIPELINE
Notooe L, 10 15 11
FIGURE 12. LOCATION OF DEEPWATER PORT AND INTERMEDIATE TANK FARM, AND ASSUMED PIPELINE ROUTE OF ALTERNATIVE 2-1
Robert R. Nathan Associates, Inc

15 ,41/1.71,
Storkerto asa,reth,5
DINIty
ife'nbure:2
:41:1-4;e: Faie Bern. *Allowai palatin
Ouintoit
&lancticks 'Bridge ' :-.)eerfat.' *HarmerpIlle
• *.:R6aatown .
r'Bodentown .t; B • . 1,
.r"
Lansdale
' • N Wales H.thom
()4^: 1; ° Willow - r
WI ---140A.:14UnkiVii-17. 4, , Wel. on( hitotOir 4pte1forsb..-47,, 2.- -.. • _
• -= ■ ,_•• •s-...fieerrAo .• ...
' ' '''ght` ' - • 41.dicird4-4.:I • - •moinalla r - . ,.._ ow, , _ _
- - igattie:4. 'Iii1A,714
rirti DELAWARE RIVER REFINERIES offers° a ?. •-•,
'C000 keys -Wail T E irsiadir
.!Prtel,titlIS
qiklinvtakal
v.o. top •,..; VilttrV:
14 -IT -- it
ernen4',.'
obbini
,Pla lranbt14,
•tStabo6v
' 1641;iRtnia"I
egrAte Adelopi Etras , op> N
ne' tti
,•
IF-tokvatir /4- 114' Bdrket
!,1140altayMn. , Ryrm;
,foHytttq ,est Irkettpwn,
OWL "
ANkevilt
Marko
Lower Bay mboy
.enytarbc". ‘‘,
Illag\r:,°D,' HOOK
D .°, SANDY
tic Highlands ighlands
ran Bright retusbury R
Monmouth Beach port
ng Branch ng Brarch
beron lenhurst sbury Park
Ocean Grove von by the Sea
Mal
Belmar pring Lake a Gut
anasquan elle Pleasant
y Head
ston ntoloking
Normandy Beach ,
vaiiette
Seaside Heights
Seastde Park
at Irel larneg !City
CO =gr.
DEN DAVIS Pr
NANTUIENT PT
Fortescue
DEEPWATER PT
EGG ISLAND P
ilaiitMetitoilt VI ' 4, 4V1.4114:ii V2,,ce,c8 - .gngri_Pal
Lewes- fp* - se4a2ainf. brood; -
MItp#154-.; "vvottng.
ding , arnevflefe r,
+fitioDum"d UnWOe
onyrousiOri,,EAttt o
Po tobetehe c
orches aueptg • twice Tuckahoe
Leesburg " Pet bu "•• —n 'rffn
ARTIFICIAL ISLAND REFINERY PIPELINE
,`‘ aa Port RepubbE --, -, Port Repubbc -,-' ,
▪
G re a I "0;4r
Gelman', -*:':FisTia BrtY -:.... TUCKER
zryn.. c tAlTattipokitti.
GAMINE
IfE•GN LEGEND • DEEPWATER PORT Inlet
P' City 0 argate ongport
rear Egg Inlet
••,..ean City =MC ora _N
▪
t 41.
Q./ arson heel C.,
Strathmere 0
View a Isle Cdy
Townsends Inlet '
alon
I--175°30
BIG STONE BEACH
- Cold S W Cape
Cape May goin
.C• IEZcIt'" "••!1 one Harbor
dfo Hereford Inlet
Mlildwood
lidWOOd Wilawood Crest
old Soong Harbo TWO NILE REACH
pe May
FIGURE 13. LOCATION OF DEEPWATER PORT AND INTERMEDIATE TANK FARM, AND ASSUMED PIPELINE ROUTE OF ALTERNATIVE 2-2
Robert R Nathan Associates, Inc.

Arnbi
orristow
JenIrn
ihnti em. 'VI, onY ,Pafattr dr Quinton • .0-tancoUail3riOge Pe:11 141
tteburet, '‘1
rnsville
nghorne
00
Bristo Croydti
wiCk2-t
IL! 01
Lower Bay
ArrIbidy e_",.., at tool
001(
tlt Highlands
iighlands son
Sea Br ghl ezusbury R
onmouth Beach port
ng Branch ng dranch
lberon
Ilenhurst
sbury Park kean GrO,,e
on by the Sea elrnar Belmar
prtng Lake ea Girt anawea. "elle 1Pleasant
y Head
ston
antoloking
Normandy Beach
ayalletle
Seaside Heights
Seaside Park ry,
• at les, larpegai
ren est
•.; 1MA
Allen: town
t
.mdiDELAWARE RIVER REFINERIES] arnslion;
OliVrn G utraLB,1,i4A).....cs7 Cross Keys "tit
iWocelatoty&
*lna rr:nAll "
c. • *ina.:
Idlitearct -45,.!: timer-40'4S
"Wood,
14, 12rIr FaAle
•
*/012
9*,
Pori RePub Gennanra
Pomona
ad% Gs. I, 6,37,n
on,
BEN DAVIS P
NANTU[EPIT PT
Fortescu
DEEPWATER PT
EGGISLAMOPT
Dela ware - c,em Dias Cree
Pierc Bay Green Cr
BIG STONE BEACHqrg
Cold S W Cape
Cape May Porn
BEACH
Inlet
tlantic Pr City A argatk
„ongport rear Egg Inlet
ean City
orson Inlet (,) trathmere 0
View ea Isle City
Townsends Inlet tik,
alon
'Hereford Inlet ssiiidwurA ildwood
Wildw000 Crest old Sprtng Harbo
TWO NILE BEA.
pe May
LEGEND DEEPWATER PORT INTERMEDIATE TANK FARM REFINERY PIPELINE
Pu°r a kirches
Leesburg
Heisierers
AST P
tZ' razcver
one Harbor
FIGURE 14. LOCATION OF DEEPWATER PORT AND INTERMEDIATE TANK FARM, AND ASSUMED PIPELINE ROUTE OF ALTERNATIVE 2-3
em '
Rtegelsvolle: • HellettOwn ." .
'' erenchtow
e).'d
(.; 13. Creels:dile
PerkasI
- Telford • Souderbor■
; Hatfield
Lansdale
ARTHUR KILL REFINERIES
=V'
A
in=
Robert R. Nathan Associates, Inc.

CO
Lower Bay
mboy .1:ortto:,,00r
.00
. • ‘ 1,06' savoy • '''' .\'‘.tI onoI 21100A
. la he Ilighlands ighlands
4 I ST:Br ight
• 4.Milirit..,411$ Monm& 8
outh Beach 114" • •••••, ""Y
•ng Branch ng Branch
lberon Ilenhurst
-C r e rill
0,• sPhi.t.oirn Oft, Lr°
chtoW
- irgo
A i toh,c-kon : Quakertown CI\
1.?..GreekvIlle e,r Raven •RZ,Pr!
New Ho ty4., e Sellersville 1
,..„., B kJ C K. r soo ,,,, Doylelpe d n ga
• '',• ---—.1.5'. Hatfield /
sbury Park Ckean Grose von by the Sea elmar Belmar
prang Lake ea Girt anasquan riche
Pleasant
y Head
ston
rrtoIokirrg
Normandy Beach ,
avallette
Seaside Fietithts
SeDSIOP Park
Jansdale
Philade
LEGEND DEEPWATER PORT ARTIFICIAL ISLAND REFINERY PIPELINE
BEM D•
MANED
DEEPWATER PT
Forte
EGG ISLAND • EAST PT
argate ongport
rent Egg Inlet
ean City „
rson Inlet Strathmere 0
View ea Isle City
oven
'87;":11-1( iTlrui:Kcn
risithiSett.1”;•
GANTIME
CI BEACH
'Absecon Inlet
nantIc 0 City
Goo Townsends Inlet
alon
one Harbor •••.?
Ito Hertford Inlet
tWildwood
ildwood Wildwood Crest
old Sphog Harbo TWO BILE BEACH
Pe May
FIGURE 15 LOCATION OF DEEPWATER PORT AND INTERMEDIATE TANK FARM, AND ASSUMED PIPELINE ROUTE OF ALTERNATIVE 2-4
Dela ware c„ m
Dias Cree Piero Ba y Green Cr.
BIG STONE BEACH oh
1 ■76°80 Cold S
W Cape Cape May Poin
Robert R Nathan Associates, Inc.

Scale of Statute Miles
0 I 2 ■I==1
FIGURE 16. LOCATION AND ORIENTATION OF CHANNEL A OF ALTERNATIVES 2-1 THROUGH 2-5
'Robert R. Nathan Associates, Inc.
Note: Depths are In feet.

22 N, it 4, 13 13
V,90 4.1 44,‘
73 67
5(7) N.
INN 74
42
3k ‘-(27a4;';'<c 49
\ \31 82 ''' ''0
47 37 34\ ‘ 32 , ''''',. 39
28 \
\4
TO DELAWARE RIVER 4
36 50 ' ,...,,<.4 34 44
fr 2pec BELL 3p, , 43 33 48...„...„, R. Ref 39 - "r0.„,„ 49 834 . M
itt -A,4, 6 W " ..14.3-;', R 39 E 52 '',,,,,,.
14'0.. 45 .. 43 al , 45 ,b., , 54
CHANNEL D :::.*...--„
5.3 , 37 ",,, 45 ftLi27 1 ') 34,
4 --,.. 49. 5 48 40 40 , 46 .
‘40
46 47 '45 3
42
41 44 32
40
33
44 42 38
43 39
34
34-
31
31
R 7 26
,---,' 30 8 /17 1 2° . . t" •
, " ,,...,
22 n4.4.19 /2.
30
1
V 21/ 2,/711,214r8, 4
'''''''fa2-414. 4 \ • 35 39
8 4,
( 12 1 19 12 • ,4'.4._N..?,F \ ;rti l'". ti •!7 11 (,/, )9.4,14 .̀ 2i IL,. ‘1
th. 15 ' IJ A 6 44 al I
25 32 4!' 'Iih2!l
4 13'
ioill'
22 /27 29 N'r 1 % 19 ' ' I -4
27
21 27 1
-
:_...‘,GR475,16-ecR33.841,4-38_
t" ".3,3A, •
WS
At!
20
147
42
13
13
11 13
Note Depths are 111 feet Scale of Statute Mtles
0 I 2 iiM=Nr=i
1 17 114\
3 o 8 50
^‘, 126 27
80 18,--`67•145-
23
27 ,,•"
23 20 3°
34 3: 2a
dim 13
10
8 13 1
G 4set \iORN
24 22 13
>:k • 4+; '" /// 1.4'' (9 !...• a3'''' ,...06st =2,
.4%., / 4. it. • ..6' erettlirt 50, , „i 122 N ---;,,,,- 3; 15 15 //:. _, 6;sy44 '' 'Qk Ft 15ft 60-118, '- 4,1c>.\\ 83 03-',,,,N
V. 84 , 120 40 \\,,
- 39
'78.-
F1 li'4‘t,c4018 61,1 - -4 , ; 83, m ,(64 1 12 8 1°,1 _26 ' \
3i
44' \ i 8(' !2 66 X I.).6,/ 78- - ' ,. \
2 8 3 4 5 60 ,;•48r4 80 20f-81 -4;4^..„.41444 1 41 4`,..,
c
,
to 7t.,...J. :
.T. 25
67 \ HARBOI? OA* - 43 's 8i, \\\\ r 21
11
,44.,s . 8\o4.8REFUGE.63/,/ 44 ‘•*.`t. I 66,, '-
2. 6 u 23 34 ' F g‘se"fi2iN ' alrvit, --- -96 1 '80744:4. 1 1
.H Etta:E. :47 7
'0.9 '3 0,,*, rasp./ •4,-- . • ,f ' i : BREAK:%7'ER 2 Id 011. tir A; ■ 11 4/ ' , ; 1 2 HAR F4 BO -'1 :I .4/.. , .. \Eptplir.V,C,111.1'411k41,,B.,_,I,f_y_v: - ,,..40 4 : .16
\___,2 R rd :.:;;;I'll• 4,t r- ---
‘22
MS
23 32'r- '.224.26
2(1
1.6144
Cl
i
7o--,---"1
36 " 3h1 PR 36 35 42 '
40 36 '
1 --,, g- 7
.-
-,....„.. -....---.7 44
CHANNEL B7 —0 R 2l.,' _ - ■ 7 , - - -- '''' '' -.'7 'all Bill .-
',...5
'S■V / ir
,..q.50 \ SG IA' 66 ', 65 1 ATLANTIC OCEAN
/
"l
67 ir,',.. \._ sl '''S4
FIGURE 17 LOCATION AND ORIENTATION OF CHANNEL B, CHANNEL C AND CHANNEL D OF ALTERNATIVES 2-1 THROUGH 2-4
Robert R Nathan Associates, Inc

40 38
36
38
42 39'
38
43 39..0' 34
33
35 \ 38 40\
36 \\
5 33
39. 4 35
37
33 32
hey
32
34
33
45
33
43
35
2 26
2
39
k-l) 1 i fr 2
N, ') e 3 RE$TICTED ACA
204 524 (see nom A) 10
32 15
Are 44
PIPELINES TO REFINERIES 16 m 4
31 e 9 31 22
6 5 35
27 7 33 26 6 23 42
13 rht 14 0
A 19 ft k P 55 28
36 9
GENERAL SERVICES AREA 13 28 .*
35
7 41
22 37 • , 28
10 13 14 15 45 64 x 34
17
4 19 kw 1N-4
26 joG
(19ee__netel
26 17
14 26
—48 22 hed \ 16 23
, 23 19 4
1-1 \ \
,
- . 12 26 34 . 42 16 ...4 ,
CRUDE OIL TANK FARM+ 21 5/ , 6
e
, 42 k ,,,,,8,.c,, 28
13 16 i t. 22 24 31 22 43 I 68 5 49 l;r5,15 ,,,
_
2
i3 BW
9 WC" ,•3
i3 aw 0 .
23
42 29
23 .'• ' , 47 "'"", • 39
66 \ Ly"Et" N'C" ,•9 5
24 .4 i 62 .---- \ \ 54 39
27 26 10 s6 0 99 7
34 . Ir'/-"f4", .2 63 5 42
12 \ 48
9 , \
10 •- 0 n„e 22.-1
10
28 \.5,),2,,, ,,,,-)..irE ARE6\ ---, x 25 la 27 18
0
\s62 "O' \ 51 49 40 . 1-----
2 2,
14 \
18 9 12
17
17 19
26 24 \63 - '‘, 43
24 , • , \ ‘‘‘ , 57
\ 55 38 38 s , 62
\ 55 \ '21 43
(501, ■ ek)
C1.0 35 67 • • 25
• 19 s, ra- 17 16 • 0,, 52
16 6
21 6 34 37 38 \ 4,3
21 36
5 1075
33
38
-
341\ \
\A 3i
\!
Rk
az \ \;'"`c \ ELL 38\ .
39 36 \ \28
22 5\
35 32
5
6
4i 7
5
Note Ultimate layout for subalternatives B and D of alternative 2-3.
Depths are in feet.
39
30 42
‘ 5 21 ze ' s 56
APPROACH LANE
.BOOSTER PLATFORM II 13 26 36 56',
10 6
8 16 8 ''‘4\‘ j"7 .6' li. 6
7 10
4 27 13 DEEPWATER BERTHS
5 .
14 4 ,.,
, 67 , "17 ,5\ -- 2
26 's 41%v ■ ,\6\ Scale of Statute Miles
0 1 2 111MMI1===
., 16 44%,,,„ 2 9,
'i 10 46
....C2.-, 1 5
_
4 e 9 10 19
71464.44%,,29
8 114 8 4
22 1
o 14
i= 2 pe
d- 8 ? 11 25 t 20
7
4 • ' m Bie
FIGURE 18 DETAILED LAYOUT OF DEEPWATER BERTHS, SUBMARINE LINES AND INTERMEDIATE TANK FARM OF ALTERNATIVES 2-1 AND 2-3
Robert R Nathan Associates, Inc

\.- \ C.PC
(1.•
DELAWARE BAY
NORTH
z
BOOSTER PLATFORM
DEEPWATER BERTHS
\A\
MANEUVERING AREA
LAIL 1r +v
0 1
Scale of Statute Miles
\ `v Channel D
Note: Ultimate layout for subalternatives B and D of alternative 2-3
Depths are in feet.
FIGURE 19. DETAILED LAYOUT OF MANEUVERiNG AREA AT THE DEEPWATER BERTHS OF ALTERNATIVES 2-1 AND 2-3
Robert R Nathan Associates, Inc.

4 26 oyoor Groundf4 __ __9 _--
so, 26 17 e. ■ 1 bs A , 23 '
48 34 37 as., , 43
34 \
\ 2\ ...,,, «4 21 40 V\ \ 35 \
nOteL. _ _ _ — --- ■ - 19 23
". ,6 .
T7' - 15 har 14 26 16- -6 36
\ \ \'! (see
• _,, J0 ,_4 -._..— — 32 22 hrd
16 18 ,. 31 8 o
44
22 .6 5
38 41.,:,..srerio3,6„.
40
\ \ „
\ i
4,;,--. \
31 1-% 36 35 32 x Fl 4s +.
27 7.
\ \ Bar 33
21 36
n \ \\29 ea 39
v4 3 36 \ ,
16'7' 22 6 \ \
0
35
35 \
38 ,
4.
5 <6 a ,
, "•,, . o' 28 2 3
' .. \3
34
, \
\
‘, , 33 4 0'
r-138 1
40\
571
38 .. ,42
1 68 1 \
42
1 1 ,
5
66 s
s 4 7641:0_,, ,•:.,.::::67:7 26.923 43 39h,34 t--ir \
• 43:
39 390
3:
33 35 33
36 \,
\
t
..." ‘ , ` - 39 9
37 6
36 s, 6 1." VT ,. 1
i ' \ 54 .. 33 32 ,62 ,..-
4,:fL 63
34 Mr
26 vii5 M.H2RAGt ARI 5013 \
:
24
2,
\ \5 57
\ \51 40
9 13:27
/ 5'1, 34 \562 "0
32
3
\\ N. 62 5 \ 55 39 i 7838 45
C 4
S . 67 \ \
• 19
/5rft rep) 43 .21
33
\ s.. ,- V s 25 43
17 16 '1/2 5 , 11.6.,'!WR, TA" ..
17 19 \ s ',69 '',fr 35Y '‘,52 . 3
14 26 24 \3s /"'' 5 _ ,n 26 22
0, 15 ' ;+•"4" Iltr/ 4se4 ,
62 64 s ,
5 , 43 39
. \ • OA ,
3 cr' 9 . 15 , 4, 14 21 29 s , ' DEE_PWA ER BERTHS
16 ,
' , IO
7 .T.e1 ti 10 4 e 9
tis i
21 29 ' Z APPROACH_ 7 CRUDE OIL TANK FARM , \ /LANE ,
. p 14
' 26ftl0M"1".
; 7 25 „
4 047'7, \ ART I F I CI AL I S LAND-.1 ‘ ' _ 4,9% 'i* ,' - - 326
7 a . _ . . 6 151"., JO '
4 4k 7 GENERAL SERVICES
5
., 55
, . - ' 5
Scale of Statute Miles
0 I 2,
FIGURE 20 DETAILED LAYOUT OF DEEPWATER BERTHS, SUBMARINE LINES AND ARTIFICIAL ISLAND OF ALTERNATIVES 2-2 AND 2-4
Note Ultimate layout for subalternatives B and D of alternative 2-4 Depths are in feet.
Robert R Nathan Associates, Inc

\ e• 4
MANEUVERING AREA
LSUBMAR1 NE LINES TO ISLAND
\Drb-‘ EEPWATER BERTHS
Channel !)
NORTH
DELAWARE BAY
0 1
Scale of Statute Miles
Note. Ultimate layout for subalternatives B and D of alternative 2-4.
Depths are in feet.
FIGURE 21. DETAILED LAYOUT OF MANEUVERING AREA AT THE DEEPWATER BERTHS OF ALTERNATIVES 2-2 AND 2-4
Robert R Nathan Associates, Inc.

51 1
53
Note Ultimate layout for subalternanyes B and D 0 I 2 EMNIIIC=1
46— ... ""bas.f,
(see tioie 37 '471 31 46 43„36 42
41 38:00' 38°50 •o
(Z) r
r '. 37 39 '''N 4T..e 4-) ^,'''38 .. '',. "̀.'5 -X 11'1' - - -47 - '''''0', -- —
—
.37 '5 `....,, 43
— --
11 \ _ 23t4 E48.- ! •;,, .,,,,,,,,,,,.
"Fiai-t9'3'''''4- t3 ..,_ n'Ics,„,, — --41
37-s,„„ 35 44 4' :.• \ Arse 4.
7.
44 .1.: 1544 Art,
."*".. .
35.1Z ' 39 '42
_ ... 7415... —39— .0* _ ,7 ,::._'---N-- -"-- — — $
4 Ft;
?G' .. ' . . : " . ' . • . . • . . 7 ...f ,
' ' 's ' ' . ' . . . . . "--:— — 71— - a '-'-. --,. _ ,... - . 41 39 •t_. ,....
38
,-,-- 40
' 38 40 ,.; At, ''14
,'--. 43 ao -18'....stt:" 1.-"- - 38 Pv - ,
57. - Ireter.lig- -7:.7 /3- 38 -5w. 24) , - '4
39 4, 43
ek : 40
-ss ....54,.._0 1-- --._ TRANSSH1RAERT BERTHS - _ 40
411
',14 ''''. -. . `,.,.,„ 41
-
• CRUDE OIL TANK FARM 40 47 '
, A
64
- , \
r ,„..., AR
:
T I FIC I AL- ISLAND .
- — --
t \ , ‘ , GENERAL- SERVICES AREA `-',1
39
42 30 10
413 ' ,I„ s 1 1 " :5■ 1"6„ /
\ t•.,, 58
73
64 57 77
RECALITIONARY AR_5A
1 1 1465
DELAWetRE
13AT
51%, 144,44t441444 4 4 irst as444.4
48
DEEPW-ATER BEWIRS 50 o'‘`
MANEUVERING AREA 193 'co
49
-19 1 FL el
CAPE 'MAY FL ei i5 we 18 In
(gr. „ 14n) N. /NO' - „.4444+4114r
15 chart I2tkl , , „, 1 'Aro) 23A
- S1 A\ "-,W
DEEPWATER 41- 63P63 444';
PORT SITE"r:'" .1. '' 41ANg ads- a 1.41,1f,„5
\ 1 APO ROY I L 'ANE ' /
, ,
A P11,4 trI 441
3
72 87 90 85 "-
77
62
51
53 \-..
7 80 4-3
56
.48 I
'"*"
56
1.472_,i, 'ts,7
ll DEPTHS IN FATHOMS. 1MP.,
VICINITY _MAP 73 N 66
DEPTHS IN FEET Scale of Statute Miles
FIGURE 22 LOCATION, ORIENTATION AND DETAILED LAYOUT OF BERTHS, PIPELINES AND ARTIFICIAL ISLAND OF ALTERNATIVE 2-5
Robert R. Nathan Associates, Inc

315.
is set at 150 m.t.a. by 1980 (115 m.t.a. to Delaware River area and 35 m.t.a. to Arthur Kill area) and 300 m.t.a. by 2000 (230 m.t.a. to the Delaware River area and 70 m.t.a. to the Arthur Kill area).
Type of Berths
All alternatives consider fixed berths only.
Site of Tanks
Alternatives 2-1 and 2-3 consider an onshore tank farm, whereas alternatives 2-2, 2-4, and 2-5 con-sider offshore tank farms on an artificial island.
Vessel Sizes
Each alternative considers 300,000 and 400,000 d.w.t. tankers, and it is assumed that all tankers using the deepwater port will be of these maximum sizes. The assumed dimensions of these tankers are given in table 30.
Table 30. Assumed Dimensions of 300,000 and 400,000 Deadweight Ton Tankers
Dimension 300,000 d.w.t. 400,000 d.w.t.
feet
Length Beam Draft
1,050 173 70
1,100 192 70
Dredging
Alternatives 2-1 through 2-4 require dredged channels, whereas alternative 2-5 requires only a dred-ged channel and dredged berthing areas. The artificial

316.
islands of alternatives 2-2, 2-4, and 2-5 will be con-structed of dredged material. All submarine and on-shore pipelines will be buried.
Water Depths
In alternatives 2-1 through 2-4, the depths of channels, maneuvering areas, etc., are such that all maximum-size tankers have to wait for high tide to ap-proach the facilities. In other words, in these alter-natives, the dredged depths are minimal.
Since MHW at Cape Henlopen, Delaware, is 4.1 feet above MLW, a value of 4 feet for average tidal rise will be applied.
Because alternative 2-5 requires some dredging of the berthing area only, it has been assumed that in this case fully loaded tankers would be able to berth during all stages of tide.
Construction Program
The time phasing of the various construction items for the period prior to 1980 is given in table 31 for alternatives 2-1 through 2-4, and in table 32 for alternative 2-5. The entire phasing was simplified to facilitate calculations. The total cost of each item is distributed equally over the pertinent years.
Alternative 2-1
Criteria
1. Site of deepwater port: In the Delaware Bay about 10 miles southeast of Big Stone Beach, Delaware.
2. Service area: Refineries along Delaware River.
3. Type of berths: Fixed. 4. Site of tanks: Onshore about 2.5 miles
northwest of Big Stone Beach, Delaware.

X
ion
X
X X
317.
Table 31. Construction Program of Alternatives 2-1 through 2-4
Construction item
Year of construction or installation
1975 1976 1977 1978 1979
Breakwater of island (Alternatives 2-2, 2-4)
Land fill and slope protection of island (Alternatives 2-2, 2-4)
Tank farm Supertanker berths Submarine lines Pipelines to refineries Dredging of channels
Table 32. Construction Program of Alternative 2-5
Construction item
Year of construct or installatio
1975 1976 1977 1978 1979
Breakwater of island I X X X Land fill and slope protection of island
Tank farm Pipelines to and from berths
Dredging
5. Draft of tankers: 70 feet fully loaded. 6. Subalternatives: The throughputs of the
various subalternatives, and the size of the vessels they will serve, are given in table 33.
7. Type of transshipment: Pipelines only.

318.
Table 33. Throughputs and Size of Vessels Served by Subalternatives
Vessel size
(d.w.t.)
Throughput (million tons/year)
1980 2000
Subalternative
A
300,000 70 115
300,000 115 230
400,000 70 115
400,000 115 230
Requirements
Supertanker berths. Subalternative A would re-quire two berths by 1980 and three berths by 1986 (the one additional berth being constructed in 1985). Sub-alternative B would require three berths by 1980 and four berths by 1986 (the one additional berth being con-structed in 1985). Subalternative C would require two berths by 1980 and three berths by 1990 (the one addi-tional berth being constructed in 1989). Subalterna-tive D would require three berths by 1980 and four berths by 1990 (the one additional berth being con-structed in 1989).
Dredging quantities. All quantities will in-clude an overdepth of 5 feet.
1. Ocean channels. Two stretches would require dredging, one (Channel A) located between miles 35.1 and 31.7 and one (Channel B) located between miles 4.2 and 1.5 off the entrance between the Delaware Capes.
Channel A would be oriented nearly east-west and would be located near latitude 38° 30' at an average distance of about 22 miles off the coast. Because of

319.
the orientation and the distances from shore, the re-quired width is set at 1,000 feet and the required depth at 1.2 x 70 = 84 feet. The following dimensions would be required:
a. Length = 35.1 -31.7 = 3.4 miles b. Depth = 84 feet + 4 feet = 88 feet (no tide
will be taken into account because of the distance of the deepwater site from the channel)
c. Average bottom depth per mile = 69, 64, and 80 feet
d. Average present depth = 71 feet e. Average dredging depth = 17 feet f. Width at bottom = 1,000 feet g. Quantities to be dredged for all subalterna-
tives - 3.4 x 5,280 x 17 x (1,000 + 3 x 17) = 11.9 x 10⁶ cubic yards
Channel B would be oriented nearly west-northwest and would be located about 4 miles west of Cape Henlo-pen, Delaware. The following dimensions would be re-quired:
a. Length = 4.2 -1.5 = 2.7 miles b. Depth = 81 feet -4 feet + 4 feet = 81 feet c. Average bottom depth per mile = 69, 40, and
61 feet d. Average present depth = 57 feet e. Average dredging depth = 24 feet f. Width at bottom = 900 feet (because of anti-
cipated unfavorable orientation of channel with respect to currents and waves)
g. Quantities to be dredged for all subalterna
tives - 27
- 2.7 x 53280 x 24 x (900 + 3 x 24)
= 12.3 x 10 6 cubic yards
2. Delaware Bay channels. Two stretches would require dredging, one (Channel C) located between miles 4.0 and 4.4 and one (Channel D) located between miles 5.5 and 8.8 off the entrance between the Delaware Capes.

320.
Channel C would be oriented nearly northwest and would be located about 5 miles north of Cape Henlopen. The following dimensions would be required:
a. Length = 4.4 -4.0 = 0.4 miles b. Required depth = 81 feet (close to entrance)
-4 feet = 77 feet c. Present depth = 76 feet d. Dredging quantity = negligible
Channel D would be oriented nearly north-northwest and would be located 6 miles north-northwest of Cape Henlopen. The following dimensions would be required:
a. Length = 8.8 -5.5 = 3.3 miles b. Required depth = 77 feet -4 feet = 73 feet,
or, including overdepth, 73 feet + 4 feet = 77 feet
c. Present depth per mile = 67, 68, and 69 feet d. Average channel depth = 68 feet e. Average dredging depth = 9 feet f. Width = depends on current conditions; a
conservative width of 900 feet for all sub-alternatives is selected
g. Dredging quantity for all subalternatives = 3.3 x 5,280 x 9 x (900 + 3 x 9) = 5.4 x 10 6 27 cubic yards
3. Turning basin and berthing areas. Because sufficient depth and width is present at the selected site of berths (approximately 10 miles southeast of Big Stone Beach), no dredging would be required for turning basins and berthing areas. An alternative site located 5 miles northwest of the selected site could have been chosen, thus reducing the distance to Big Stone Beach, and consequently the length of the pipe-lines, by approximately 5 miles. However, in this case a substantial amount of dredging would be required since the water depth at the alternative site is be- tween 60 and 65 feet. The alternative site has an addi-tional advantage in that two-sided island berths could be utilized instead of the marginal berths.

321.
The total quantity to be dredged =
11.9 + 12.3 + 0 + 5.4 = 29.6 x 10 6 cubic yards.
Pipelines from berths to intermediate tank farm. One 48-inch crude line would be required per berth. Each line would run underwater to a booster station located about 2,000 feet from the center berth. From the booster station all crude lines to the intermediate tank farm would run parallel for a distance of about 12 miles, of which 9.5 miles would be underwater.
The booster station would be located not more than 1 mile from the northernmost and southernmost berths, so that a pressure in excess of 25 p.s.i. would be available at the booster pumps.
The total pressure requirements per line would be: for subalternatives A and B, 15 (fixed berths) + (12 + 1) x 17.4 -150 = 91.2 p.s.i.; and for subalter-natives C and D, 15 + 13 x 21.2 -150 = 140.6 p.s.i.
The required horsepower per line would be: for subalternatives A and B, 47 x 91.2 = 4,300 b.hp.; and for subalternatives C and D, 52 x 140.6 = 7,300 b.hp.
Intermediate tank farm (onshore). The required crude oil storage capacities would be as follows: Subalternative A would require 1.54 x 10 6 long tons by 1980 and 1.81 x 10 6 long tons by 1986 (the additional 0.27 x 10 6 long tons being installed in 1985). Subal-ternative B would require 1.81 x 10 6 long tons by 1980 and 2.24 x 10 6 long tons by 1986 (the additional 0.43 x 10 6 long tons being installeg in 1985). Subalterna-tive C wopld require 1.80 x 10 long tons by 1980 and 2.15 x 10 ° long tons by 1990 (the additional 0.35 x 10 6
long tons being installed in 1989). Subalternative D would require 2.15 x 10 6 long tons by 1980 and 2.67 x 10 6 long tons by 1990 (the additional 0.52 x 10 6 long tons being installed in 1989).
322.
It is assumed that all bunkering would take place directly through special bunker berths. These could be located parallel to the deepwater berths at a distance of approximately 1/2 mile to the southwest. It is anticipated that oil separation tanks and equip-ment would be present and that an extra berth would be constructed northeast of the tank farm. The general service area has been estimated at 10 acres.
The required acreage would be as follows: for subalternative A, 1.81 x 50 10 = about 100 acres; for subalternative B, 2.24 x 50 + 10 = about 125 acres; for subalternative C, 2.15 x 50 + 10 = about 120 acres, and for subalternative D, 2.67 x 50 + 10 = about 145 acres.
Pipelines from tank farm at Big Stone Beach to refineries along Delaware River. The total pipeline system would be approximately 95 miles long. The dis-tance from the tank farm to the refineries at Delaware City would be about 35 miles. From there the line would follow the same 47-mile route via Deepwater Point to Gloucester City as in alternatives 1-2 and 1-3, with branch lines (13 miles long) to Marcus Hook, Paulsboro, and Philadelphia. The total length of the section 'from Delaware City to Gloucester City, including the branch lines, would be about 60 miles. There would be four major water crossings: one 1,000-foot-long crossing at the Chesapeake and Delaware Canal and three 5,500-foot-long crossings at the Delaware River (at Deepwater Point, New Jersey, and Marcus Hook and Philadelphia, Pennsylvania).
Subalternatives A and C would require one 62- mile-long, 56-inch line for the entire 20-year period from 1980 to 2000. It is assumed that all branch lines and the 20-mile-long trunk line between Swedesboro and Gloucester City would be 48 inches. Subalternatives B and D would require two 62-mile-long, 56-inch lines for the period from 1980 to 2000. The 13-mile-long branch lines and the 20-mile-long trunk line between Swedes-boro and Gloucester City are each assumed to consist of two 48-inch lines.

70 115 70
115
115 230 115 230
323.
Subalternatives A and C would require approxi-mately 95 x 188.7 = about 18,000 b.hp. in 1980 and 95 x 768.5 = about 73,000 b.hp. in 2000. It is assumed that 36,500 b.hp. would be installed in 1980; in 1990 an-other 36,500 b.hp. would be required. Subalternatives B and D would have the same horsepower requirements per line as determined for subalternatives A and C. The total requirement would always be twice that of sub-alternatives A and C.
Figure 12 shows the location of the deepwater port and the intermediate tank farm, and the assumed pipeline route to the refineries. Figures 16 and 17 depict the location and orientation of the channels. A detailed layout of the deepwater port is shown in figures 18 and 19.
Alternative 2-2
Criteria
1. Site of deepwater port: In Delaware Bay about 10 miles southeast of Big Stone Beach.
2. Service area: Refineries along Delaware River.
3. Type of berths: Fixed. 4. Site of tanks: Offshore artificial island. 5. Draft of tankers: 70 feet fully loaded. 6. Subalternatives: The throughputs of the
various subalternatives, and the size of the vessels they will serve, are given in table 34.
Table 34. Throughputs and Size of Vessels Served by Subalternatives
Subalternative Vessel size (d.w.t.)
Throu (million
ghput tons/year)
1980 2000
A 300,000 300,000 400,000 400,000

324.
7. Type of transshipment: Pipelines only.
Requirements
Supertanker berths. The number of berths re-quired would be the same as that for alternative 2-1. Subalternative A would require two berths by 1980 and three berths by 1986 (the one additional berth being constructed in 1985). Subalternative B would require three berths by 1980 and four berths by 1986 (the one additional berth being constructed in 1985). Subalter-native C would require two berths by 1980 and three berths by 1990 (the one additional berth being con-structed in 1989). Subalternative D would require three berths by 1980 and four berths by 1990 (the one additional berth being constructed in 1989).
Dredging quantities. The quantities to be dred-ged would be the same as those for alterative 2-1; the total quantity would equal 29.6 x 10 ° cubic yards.
Pipelines from berth to intermediate tank farm. One 48-inch crude line would be required per berth. Each line would run underwater to an artificial island where the intermediate tank farm for crude oil and the general service area would be located. It is assumed the island would be located on Old Bare Shoal at an average distance of approximately 3 miles to the west of the berths.
No booster stations would be required between berths and island since the pressure loss would not ex-ceed 150 -25 = 125 p.s.i. Assuming a discharge rate of 100,000 barrels per hour, the maximum pressure loss would be approximately 15 + 4 x 21.2 = 100 p.s.i.
Artificial island. The crude oil storage capa-city required would be the same as that of alternative 2-1. Subalternative A would require 1.54 x 10 6 long tons by 1980 and 1.81 x 10 6 long tons by 1986 (the add-itional 0.27 x 10 6 long tons being installed in 1985). Subalternative B would require 1.81 x 10 6 long tons by 1980 and 2.24 x 10 6 long tons by 1986 (the additional

325.
0.43 x 10 6 long tons being instal1e0 in 1985. Subal-ternative C would require 1.80 x 10 ° long tons by 1980 and 2.15 x 10 6 long tons by 1990 (the additional 0.35 x 10 6 long tons being installed in 1989). Subalterna-tive D would require 2.15 x 10 6 long tons by 1980 and 2.67 x 10 6 long tons by 1990 (the additional 0.52 x 10 6
long tons being installed in 1989).
It is anticipated that the general service area would provide for oil separation tanks and equipment, bunker fuel tanks, etc. The required acreage was es-timated at 20 acres. The total required acreage would be: for subalternative A, 1.81 x 50 + 20 = about 110 acres; for subalternative B, 2.24 x 50 + 20 = about 135 acres; for subalternative C, 2.15 x 50 + 20 = about 130 acres; and for subalternative D, 2.67 x 50 + 20 = about 155 acres.
Assuming the elevation of the island at +20 feet and the present water depth at -2 feet, the land fill volumes required would be 3.9, 4.8, 4.6, and 5.5 mil-lion cubic yards for subalternatives A, B, C, and D, respectively. The breakwater would be 1 mile long for all subalternatives; the average length of the slope protection would be about 1.5 miles.
Pipelines from island to refineries along Dela-ware River. The total pipeline system would be about 10 miles longer than that of alternative 2-1. (These 10 miles equal the distance between the tank farm at Big Stone Beach for alternative 2-1 and the tank farm on the artificial island for alternative 2-2.) The total pipeline system would be approximately 105 miles long. The distance to the refineries at Delaware City would be about 45 miles. From there on the line would follow the same 47-mile route via Deepwater Point to Gloucester City as alternative 1-2, 1-3, and 2-1, with branch lines 13 miles long to Marcus Hook, Paulsboro, and Philadelphia. The total length of the section from Delaware City to Gloucester City, including branch lines, would be about 60 miles. There would be four major water crossings: one 1,000-foot-long crossing at the

326.
Chesapeake and Delaware Canal, and three 5,500-foot-long crossings at the Delaware River (at Deepwater Point, New Jersey, and Marcus Hook and Philadelphia, Pennsylvania).
Subalternatives A and C would require one 62- mile-long, 56-inch line for the entire 20-year period from 1980 to 2000. It is assumed that all branch lines and the 20-mile-long trunk line between Swedesboro and Gloucester City would be 48 inches. Because 56-inch lines cannot be installed by laying-barges, it is assumed that the 6-mile-long section between the island and the shore would consist of two 48-inch lines.
Subalternatives B and D would require two 62- mile-long, 56-inch lines for the period from 1980 to 2000. It is assumed that all branch lines and the 20- mile-long trunk line between Swedesboro and Gloucester City would consist of two 48-inch lines. Because 56- inch lines cannot be installed by laying-barges, it is assumed that the 6-mile-long section between the island and the shore would consist of three 48-inch lines.
Subalternatives A and C would require approxi-mately 105 x 188.7 = about 19,800 b.hp. in 1980 and 105 x 768.5 = about 80,700 b.hp. in 2000. It is assumed that 40,000 b.hp. would be installed in 1980; in 1990 another 40,000 b.hp. would be required.
Subalternatives B and D would have the same horse-power requirements per line as those for subalternatives A and C. The total requirement would always be twice that of subalternatives A and C.
Figure 13 presents the location of the deepwater port and the artificial island, and the assumed pipe-line route to the refineries.
Figures 16 and 17 depict the location and orien-tation of the channels. A detailed layout of the deep-water port is presented in figures 20 and 21.
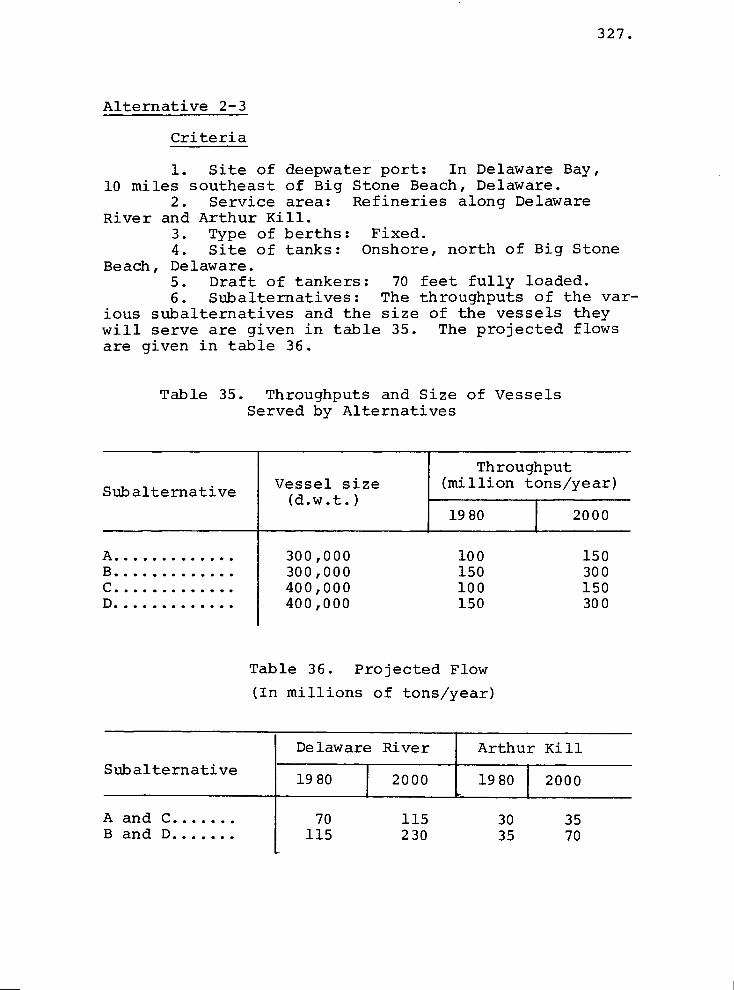
100 150 100 150
150 300 150 300
327.
Alternative 2-3
Criteria
1. Site of deepwater port: In Delaware Bay, 10 miles southeast of Big Stone Beach, Delaware.
2. Service area: Refineries along Delaware River and Arthur Kill.
3. Type of berths: Fixed. 4. Site of tanks: Onshore, north of Big Stone
Beach, Delaware. 5. Draft of tankers: 70 feet fully loaded. 6. Subalternatives: The throughputs of the var-
ious subalternatives and the size of the vessels they will serve are given in table 35. The projected flows are given in table 36.
Table 35. Throughputs and Size of Vessels Served by Alternatives
Subalternative Vessel size (d.w.t.)
Throug (million t
hput ons/year)
19 80 2000
A 300,000 300,000 400,000 400,000
Table 36. Projected Flow
(In millions of tons/year)
Delaware River Arthur Kill
Subalternative 1980 2000 1980 I 2000
A and C B and D
70 115 30 35
115 230 35 70

328.
7. Type of transshipment: Pipeline only.
Requirements
Supertanker berths. The number of berths re-quired would be the same as that for alternatives 1-2 and 1-3. Subalternatives A and C would require three berths by 1980, with no additional berths needed in the period from 1980 to 2000. Subalternative B would re-quire four berths by 1980 and five berths by 1990 (the one additional berth being constructed in 1989). Sub-alternative D would require four berths by 1980 and five berths by 1994 (the one additional berth being constructed in 1993).
Dredging quantity. The quantities to be dredged would be the same as those for alternatives 2-1 and 2-2; the total quantity would equal 29.6 x 10 6 cubic yards.
Pipelines from berths to intermediate tank farm. The routing would be the same as those for alternative 2-1. One 48-inch line per berth would be required. Each line would run underwater to a booster station located about 2,000 feet from the center berth. From the booster station all lines to the intermediate tank farm would run parallel for a distance of about 12 miles, of which 9.5 miles would be underwater.
The booster station required would be the same as that for alternative 2-1. The required horse-powers per line would be: for subalternatives A and B, 4,300 b.hp.; and for subalternatives C and D, 7,300 b.hp.
Intermediate tank farm (onshore). The crude oil storage capacity required would be the same as that for alternatives 1-2 and 1-3. Subalternative A would re-quire 1.81 x 10 6 long tons by 1980. Subalternative B would require 2.24 x 10 6 long tons by 1980 and 2.51 x 10 6 long tons by 1990 (the additional 0.27 x 10 6 long tons being installed in 1989). Subalternative C would require 2.15 x 10 6 long tons by 1980. Subalternative D
329.
would require 2.67 x 10 6 long tons by 1980 and 3.04 x 10 6 long tons by 1994 (the additional 0.37 x 10 6 long tons being installed in 1993).
The general service area required would be the same as that for alternative 2-1 (about 10 acres). The total required acreage would be: for subalternative A, 1.81 x 50 + 10 = about 100 acres; for subalternative B, 2.51 x 50 + 10 = about 135 acres; for subalternative C, 2.15 x 50 + 10 = about 120 acres; and for subalter-native D, 3.04 x 50 + 10 = about 160 acres.
Pipelines from tank farm at Big Stone Beach to refineries along Delaware River and Arthur Kill. The total pipeline system would be approximately 166 miles long. The first section of the route would be the same as that for alternative 2-1. After Gloucester City the system would continue via Jamesburg to the Arthur Kill area. There would be five major water crossings: one 1,000-foot-long crossing at the Chesapeake and Delaware Canal, three 5,500-foot-long crossings at the Delaware River, and one 3,500-foot-long crossing at the Raritan River.
Subalternatives A and C in 1980 would require two 56-inch lines between the Big Stone Beach tank farm and Gloucester City (a total length of 82 miles per line); one 48-inch line between Gloucester City and Woodbridge, New Jersey (a total length of about 59 miles); and one 36-inch line between Woodbridge and Elizabeth, New Jersey (a total length of 12 miles). In addition, one 36-inch line would be required for the branch lines to the refineries along the Delaware River (a total length of about 13 miles).
Subalternatives B and D in 1980 would require two 56-inch lines between the Big Stone Beach tank farm and Gloucester City (a total length of 82 miles per line); one 48-inch line between Gloucester City and Woodbridge, New Jersey (a total length of about 59 miles); and one 36-inch line between Woodbridge and Elizabeth, New Jersey (a total length of 12 miles). In addition, one 36-inch line would be required for the

330.
branch lines to the refineries along the Delaware River (a total length of about 13 miles). In 1989, an addi-tional 82-mile-long, 56-inch line would be required between the Big Stone Beach tank farm and Gloucester City, and additional 36-inch branch lines with a total length of 10 miles would be needed between the trunk line and refineries at Marcus Hook and Philadelphia.
The horsepower requirement for subalternatives A and C in 1980 would be approximately 95 x 72.99 = 7,000 b.hp. per line between the Big Stone Beach tank farm and Gloucester City, and 71 x 37.84 = 2,700 b.hp. between Gloucester City and Elizabeth, New Jersey. In 2000 the horsepower requirement would be approximately 95 x 227.65 = 22,000 b.hp. per line between the tank farm and Gloucester City, and 71 x 59.17 = 4,200 b.hp. between Gloucester City and Elizabeth.
It is assumed that 11,000 b.hp. per 56-inch line would be installed in 1980 on the section between the Big Stone Beach tank farm and Gloucester City, and in 1986 another 11,000 b.hp. per 56-inch line would be in-stalled on the same section. In 1980 4,200 b.hp. would be required for the pipeline from Gloucester City to the Arthur Kill area.
The horsepower requirement for subalternatives B and D in 1980 would be approximately 95 x 277.65 = 22,000 b.hp. per line on the section between Big Stone Beach and Gloucester City and 71 x 59.17 = 4,200 b.hp. on the section between Gloucester City and Elizabeth, New Jersey. In 1990 the horsepower requirement for these two sections would be approximately 95 x 768.50 = 73,000 b.hp. per line and 71 x 175 = 12,400 b.hp., respectively. In 2000 the horsepower requirement for the section between Big Stone Beach and Gloucester City would be 146,000 b.hp. for the first two lines combined and 95 x 188.70 = 18,000 b.hp. for the third line. The requirement between Gloucester City and Elizabeth would be 71 x 407.80 = 29,000 b.hp.
It is assumed that 37,000 b.hp. per 56-inch line would be installed by 1980 for the section between Big Stone Beach and Gloucester City, and that in 1983

331.
another 37,000 b.hp. per 56-inch line would be installed on the same section. In 1988, 18,000 b.hp. would be in-stalled for the third 56-inch line between Big Stone Beach and Gloucester City. On the 48-inch line between Gloucester City and Elizabeth, 14,500 b.hp. would be in-stalled before 1980; an additional 14,500 b.hp. would be required in 1990.
Figure 14 shows the location of the deepwater port and the intermediate tank farm and the assumed pipeline route to the refineries.
Figures 16 and 17 depict the location and orien-tation of the channels. A detailed layout of the deep-water port is presented in figures 18 and 19.
Alternative 2-4
Criteria
1. Site of deepwater Dort: In Delaware Bay 10 miles southeast of Big Stone Beach, Delaware.
2. Service area: Refineries along Delaware River and Arthur Kill.
3. Type of berths: Fixed. 4. Site of tanks: Offshore artificial island. 5. Draft of tankers: 70 feet fully loaded. 6. Subalternatives: The throughputs of the var-
ious subalternatives, and the size of the vessels they will serve, are given in table 37. The projected flows are given in table 38.
7. Type of transshipment: Pipeline only.
Requirements
Supertanker berths. The number of berths re-quired would be the same as that for alternatives 1-2, 1-3, and 2-3. Subalternatives A and C would require three berths by 1980, with no additional berths needed in the period from 1980 to 2000. Subalternative B would require four berths by 1980 and five berths by 1990 (the one additional berth being constructed in 1989). Subalternative D would require four berths by

100 150 100 150
150 300 150 300
332.
Table 37. Throughputs and Size of Vessels Served by Subalternatives
Subalternative Vessel size (d.w.t.)
Throu (million
ghput tons/year)
2000 1980
A 300,000 300,000 400,000 400,000
Table 38. Projected Flow
(In millions of tons/year)
Delaware River Arthur Kill Subalternative
1980 2000 19 80 2000
A and C B and D
70 115 30 35
115 230 35 70
1980 and five berths by 1994 (the one additional berth being constructed in 1993).
Dredging quantities. The quantities to be dredged would be the same as those for alternatives 2-1, 2-2, and 2-3; the total quantity would equal 29.6 x 10 6
cubic yards.
Pipelines from berths to intermediate tank farm. One 48-inch line would be required per berth. Each line would run underwater to an artificial island where the intermediate tank farm for crude oil and the general service area would be located. It is assumed the island would be located on Old Bare Shoal at an av-erage distance of approximately 3 miles to the west of the berths.
333.
No booster stations would be required between berths and island since the pressure loss would not exceed 150 -25 = 125 p.s.i. For a discharge rate of 100,000 barrels per hour, the maximum pressure loss would be approximately 15 + 4 x 21.2 = 100 p.s.i.
Artificial island. The crude oil storage capa-cities required would be the same as those for alterna-tives 1-2, 1-3, and 2-3. Subalternative A would re-quire 1.81 x 10 6 long t9ns by 1980. Subalternative B would require 2.24 x 10 ° long tons by 1980 and 2.51 x 10 6 long tons by 1990 (the additional 0.27 x 10 6 long tons being installed in 1989). Subalternative C would require 2.15 x 10 6 long tons by 1980. Subalternative D would require 2.67 x 10 6 long tons by 1980 and 3.04 x 10⁶ long tons by 1994 (the additional 0.37 x 10 6 long tons being installed in 1993).
It is anticipated that the general service area would provide for oil separation tanks and equipment, bunker fuel tanks, etc. The required acreage was esti-mated at 20 acres. The required total acreage would be: for subalternative A, 1.81 x 50 + 20 = about 110 acres; for subalternative B, 2.51 x 50 + 20 = about 145 acres; for subalternative C, 2.15 x 50 + 20 = about 130 acres; and for subalternative D, 3.04 x 50 + 20 = about 170 acres.
Assuming the elevation of the island at +20 feet and the present water depth at -2 feet, the land fill volumes required would be 3.9, 5.1, 4.6, and 6.0 mil-lion cubic yards for subalternatives A, B, C, and D, respectively. The breakwater would be about 1 mile long for all subalternatives; the slope protection at the land side of the island would have an average length of about 1.5 miles.
Pipelines from tank farm on island to refineries along Delaware River and Arthur Kill. The total pipe-line system would be approximately 176 miles long. The first section of the route would be the same as that for alternative 2-3. After Gloucester City, the system would continue via Jamesburg to the Arthur Kill area. There would be five major water crossings: one 1,000- foot-long crossing at the Chesapeake and Delaware Canal,

334.
three 5,500-foot-long crossings at the Delaware River, and one 3,500-foot-long crossing at the Raritan River.
In 1980 subalternatives A and C would require two 56-inch lines between the tank farm on the island and Gloucester City (a total length 92 miles per line); one 48-inch line between Gloucester City and Woodbridge, New Jersey (a total length of about 59 miles); and one 36-inch line between Woodbridge and Elizabeth, New Jer-sey (a total length of 12 miles). In addition, 13-mile-long, 36-inch branch lines to the refineries along the Delaware River would be required. Because 56-inch lines cannot be installed by laying-barges, it is assumed that the 6-mile long section between the island and the shore would consist of three 48-inch lines.
In 1980 subalternatives B and D would require two 92-mile-long, 56-inch lines between the tank farm on the island and Gloucester City; one 59-mile-long, 48-inch line between Gloucester City and Woodbridge, New Jersey; and one 12-mile-long, 36-inch line between Woodbridge and Elizabeth, New Jersey. In addition, 13-mile-long, 36-inch branch lines to the refineries along the Dela-ware River would be required. In 1989 an additional 92- mile-long, 56-inch line would be required between the island and Gloucester City, and additional 36-inch branch lines with a total length of 10 miles would be needed between the trunk lines and the refineries at Marcus Hook and Philadelphia. Because 56-inch lines can-not be installed by laying-barges, it is assumed that the 6-mile long section between the island and the shore would consist of three 48-inch lines in 1980 and four 48-inch lines by 1989.
In 1980 the total horsepower requirement for sub-alternatives A and C would be approximately 105 x 72.99 = 7,700 b.hp. per 56-inch line on the section between the island and Gloucester City, and 71 x 37.84 = 2,700 b.hp. between Gloucester City and Elizabeth, New Jersey. In 2000 the total horsepower requirement for those two sections would be approximately 105 x 227.65 = 24,000 b.hp. per line and 71 x 59.17 = 4,200 b.hp., respec-tively. It is assumed that 12,000 b.hp. per 56-inch line would be installed in 1980. In 1986 another 12,000 b.hp. per 56-inch line would be required. Before 1980, 4,200 b.hp. would be installed on the line from Glou-cester City to the Arthur Kill area.
335.
In 1980 the horsepower requirement for subalter-natives B and D would be approximately 105 x 227.65 = 24,000 b.hp. per 56-inch line on the section between the island and Gloucester City, and 71 x 59.17 = 4,200 b.hp. on the section between Gloucester City and Elizabeth, New Jersey. In 1990, the horsepower require-ment for those two sections would be approximately 105 x 768.50 = 80,000 b.hp. per line and 71 x 175 = 12,400 b.hp., respectively. In 2000, the horsepower requirement for the section between the island and Glou-cester City would be 160,000 b.hp. for the first two 56- inch lines combined and 105 x 188.70 = 20,000 b.hp. for the third 56-inch line; and for the section between Glou-cester City and Elizabeth, 71 x 407.80 = 29,000 b.hp.
It is assumed that 40,000 b.hp. per 56-inch line would be installed in 1980, and another 40,000 b.hp. per 56-inch line would be installed in 1983. In 1990, 20,000 b.hp. would be required for the third 56-inch line. Before 1980 14,500 b.hp. would be installed on the 48-inch line between Gloucester City and Elizabeth; an additional 14,500 b.hp. would be required by 1990.
Figure 15 shows the location of the deepwater port and the artificial island, and the assumed pipe-line route to the refineries.
Figures 16 and 17 depict the location and orien-tation of the channels. A detailed layout of the deep-water port is shown in figures 20 and 21.
Alternative 2-5
Criteria
1. Site of deepwater port: In the Atlantic Ocean about 10 miles east of Delaware Capes.
2. Service area: Refineries along Delaware River and Arthur Kill.
3. Type of berths: Fixed. 4. Site of tanks: Offshore artificial island. 5. Draft of tankers: 70 feet fully loaded. 6. Subalternatives: The throughputs of the var-
ious subalternatives and the size of the vessels they will serve, are given in table 39. The projected flows are given in table 40.
7. Type of transshipment: Transshipment vessels only.

1980 2000
100 150 100 150
150 300 150 300
336.
Table 39. Throughputs and Size of Vessels Served by Subalternatives
Subalternative Vessel size (d.w.t.)
Throug (million t
hput ons/year)
A 300,000 300,000 400,000 400,000
Table 40. Projected Flow
(In millions of tons/year)
Delaware River
Subalternative 1980 2000
Arthur
19 80
Kill
2000
A and C 70 115 30 35 B and D 115 230 35 70
Reauirements
Supertanker berths. The number of berths re-quired would be the same as that for alternatives 1-2, 1-3, 2-3, and 2-4. Subalternatives A and C would re-quire three berths by 1980, with no additional berths needed in the period from 1980 to 2000. Subalternative B would require four berths by 1980 and five berths by 1990 (the one additional berth being constructed in 1989). Subalternative D would require four berths by 1980 and five berths by 1994 (the one additional berth being constructed in 1993).
Dredging quantities. The dredging that would be required, and the resulting dredging quantities, are as follows:

337.
1. Ocean channel. Dredging of Channel A only would be required; the total quantity would equal 11.9 x 10 6 cubic yards.
2. Turning basins and berthing areas for super-tankers. The siting of the berths was done so that all berth structures would be in 81 feet of water after dredging, and the useful part of the dredged material would have a volume equal to the amount of material re-quired for the construction of the artificial island.
a. Turning basins (1) Required depth = 84 feet (2) Assumed average present depth = 55 feet (3) Average dredging depth = 84 feet + 4
feet -55 feet = 33 feet (4) Approximate area
(a) Subalternatives A and B = 2 x 1,800 x 2,200 = 7.9 x 10 6 square feet (b) Subalternatives C apd D = 2 x 1,800 x 2,500 = 9.0 x 10' square feet
(5) Total dredging amount (a) Subalternatives Nand B = 33 .:- 27 x 7.9 x 10 = 9.7 x 10 cubic yards (b) Subalternatives C and D = 33 4 27 x 9.0 x 10' = 11.0 x 10 6 cubic yards
b. Berthing areas (1) Required depth = 81 feet (2) Assumed average present depth = 55 feet (3) Average dredging depth = 81 feet + 4
feet -55 feet = 30 feet (4) Approximate area
(a) Subalternative A (3 berths) = 1,800 x 1,650 + 600 x 1,650 = 4.0 x 10 6 square feet (b) Subalternative B (4 berths) = 2 x 1,800 x 1,650 = 5.9 x 10 6 square feet (c) Subalternative C (3 berths) = 1,800 x 1,900 + 600 x 1,900 = 4.6 x 10 6
square feet (d) Subalternative D (4 berths) = 2 x 1,800 x 1,900 = 6.8 x 10 6 square feet
c. Total dredging amount (1) Suba1ternativ9 A = 9.7 + 30 4 27 x 4.0
= 14.1 x 10 ° cubic yards.
338.
(2) Subalternative B = 9.7 + 30 4 27 x 5.9 = 16.2 x 10 6 cubic yards
(3) Subalternatin C = 11.0 + 30 4 27 x 4.6 = 16.1 x 10 0 cubic yards
(4) Subalternativp D = 11.0 + 30 4 27 x 6.8 = 18.6 x 10 ° cubic yards
Subalternatives B and D would require the con-struction of a fifth berth in 1989 and 1993, respec-tively. No dredging would be required if this berth is constructed completely separate from the other four berths, as is shown in figure 22.
Pipelines from berths to intermediate tank farm. One 48-inch line would be required per berth. Each line would run underwater to the artificial island where the intermediate tank farm for crude oil and the general service area would be located. It is assumed the island would be located immediately east of a 100- foot-deep natural channel leading to the Delaware Bay entrance near Cape Henlopen, at a distance of approx-imately 10 miles from the shore. No booster stations would be required between the berths and island since the average distance would be about 1 mile.
Artificial island. The crude oil storage capa-cities required would be the same as those for alter-natives 1-2, 1-3, 2-3, 9.nd 2-4. Subalternative A would require 1.81 x 10 ° long tons by 1980. Subalter-native B woulg require 2.24 x 10 6 long tons by 1980 and 2.51 x 10 long tons by 1990 (the additional 0.27 x 10 6 long tons being installed in 1989). Subalternative C would require 2.15 x 10 6 long tons by 1980. Subalter-native D would require 2.67 x 10 6 long tons by 1980 and 3.04 x 10 6 long tons by 1994 (the additional 0.37 x 10 6
long tons being installed in 1993).
It is anticipated that the general service area would provide for oil separation tanks and equipment, bunker fuel tanks, etc. The required acreage was es-timated at 20 acres. The required total acreage would be: for subalternative A, 1.81 x 50 + 20 = about 110 acres; for subalternative B, 2.51 x 50 + 20 = about 145
339.
acres; for subalternative C, 2.15 x 50 + 20 = about 130 acres; and for subalternative D, 3.04 x 50 + 20 = about 170 acres.
Assuming the elevation of the island at +20 feet and the present water depth at -45 feet, the total re-quired height would be 65 feet. The total area require-ment would vary by subalternative; the total land fill requirements (assuming 43,560 square feet = 1 acre) would be: subalternative A, (110 4 27) x 43,560 x 65 = 11.5 x 10 6 cubic yards; r subalternative B, (145 4 27) x 43,560 x 65 = 15.2 x 10 ° cubic yards; subalternative C, (130 4 27) x 43,560 x 65 = 12.3 x 10 6 cubic yards; and subalternative D, (170 4 27) x 43,560 x 65 = 17.8 x 10 6
cubic yards.
The length of the breakwater would be about 1.4, 1.8, 1.5, and 2.0 miles for subalternatives A, B, C, and D, respectively. The length of the slope protec-tion on the land side of the island for each subalter-native would be about 0.7, 0.9, 0.8, and 1.0 mile, respectively.
Transshipment berths. The transshipment barges serving the Arthur Kill and the Delaware River area are assumed to be in the 40,000 d.w.t. range.
According to table 20 this would require, for subalternatives A and C, four berths by 1980, with no additional berths needed in the period from 1980 to 2000; and for subalternatives B and D, five berths by 1980 and one additional berth in each of the years 1985, 1991, and 1997.
Pipelines from tank farm to transshipment berths. One 48-inch line per berth would be required. Each line would be about 3,800 feet long, of which 3,000 feet would be on land and 800 feet on trestle.
The pressure loss per line would be 15 p.s.i. at the berth and 12 p.s.i. per mile of 48-inch line for a

340.
throughput of 10,000 tons (or 73,000 barrels) per hour. The average oil level in the tanks is assumed at 20 + 50 2 = +45 feet, whereas the average elevation of the tanker's manifold would also be at about +45 feet. Assuming a horsepower requirement of 38 b.hp. per p.s.i., then the requirement per line woul.d be (15 + 0.8 x 12) x 38 = 935 b.hp. The total requirements would be: for subalternatives A and C, 4 x 935 = about 4,000 b.hp. in 1980; and for subalternatives B and D, 5 x 935 = about 5,000 b.hp. initially and 8,000 b.hp. ultimately by 2000.
Location, orientation, and detailed layout of berths, pipelines, and artificial island are presented on figure 22.
Location and orientation of Channel A is depicted on figure 16.
Mississippi Delta Area
Three oil alternatives, numbered 4-1, 4-2, and 4-3, are considered in the Mississippi Delta area of the gulf coast. They differ from each other in the water depth at the supertanker berths. The depths are 63, 81 and 109 feet, respectively, for alternatives 4-1, 4-2, and 4-3.
The location, orientation, and layouts of the berths and the artificial island are shown in figures 23, 24, and 25. The presentation of berths and islands is schematic.
Sites
All alternatives are sited in Garden Island Bay, which is located to the east of the South Pass of the Mississippi River.

2
4
wig G41 '? „ , 2 44-41 7 2
, 2 2 184 "Viz GENERAL SERVICES AREA,,, 2
2 2 ARTIFICIAL T4 1 I S LAND " ‘,„„e
BARGE BERTHS V, TRANSgH I PMEI■ ° 9
,,,- 9 // 6-
9 9
1/
/7
se
/ARTIFICIAL I
)ra_L
_---
75
/5
4/
'* 4 6
\
,34 46
op e'
17-N /
5
CRUDE OIL TANK FARM
6 AREA .? A ,
4/
88
89
45 00-
0
29
,
AS”'
t2--
179
89
6 1, 9 8
MANEUVERING 9/
-93 86 ;9
Ey<
,
\-\ DEEPWATER
BERTHS
135
163
126
/52
133,,
/93
MEXICO 24
270 ?3,
rs„
*- 2
(C12 UDE OIL /TANK FARM AREA
2‘- TRESTLE
/5
4/
2
•?5,
BERTH LAYOUT 2 Scale of Statute Miles
0 I 2
ay. le
2.
/40 433',
-- vogn 2 2
5.01
' . 2 .0, ,"•
' 'C'ear_", 2_ 7 2 ? 3
GENERAL SERVICES AREA , - TRANSSHIPMENT s
7 2 ' BARGE BERTH
).„7 A
63
65
06 V
SOUTH PASS ia
_
193
i3o
BERTH LAYOUT 1
West Bay
i-atsanTaOt.W4 11.9
46
s94,,86
27 O PA 29 60 171
s'. DEEPWATER PORT SITE 37 I , 279
7b.0-
' DEPTHS Ims , e/9) 53 DEPTHS I N FATHOMS 1 59 " Fq I • --
VICINITY MAP OF MISSISSIPPI DELTA
r
1.9 "sP 6
108
/GULF OF MEXICO o /23 s
411
199
'*\ 178 _47 DEPTHS I N FEET nv
,^1=0
/0
s
MANEUVERING - DEEPWATER to; AREA2 BERTHS
(r Nr1411,
■ilrodys
s .,‘ 46 \\s,
SOUTH PASS \ 65 2,1"
f' '3 26
„ , . 11
11
•‘114. 717 /Werth Pa'''. 1 • - 26
r R"
i4 4
34
85
o., 6,
077 /99
GULF OF /32 -
8
56
1/2
rss
72o
of (use chart /272 9M
Fl 5sec 16Sk410' 0
— — L— ,g, Fl lOsec 15M I 25 32 !? Bn 320 —+--&-
FIGURE 23 LOCATION, ORIENTATION AND LAYOUTS OF BERTHS AND ARTIFICIAL ISLAND OF ALTERNATIVE 4-I
Robert R Nathan Associates, Inc

7
2 /
18
O 9 /I Z-T-9
s /0
68
9 / 86
97
„•-•
140 \."
:48
/35
99 131 62._) 4Ce
149
126
16
BERTH LAYOUT 2
Scale of Statute Miles
0I 2 ilIMMIM1=3
68` 46
63 6?
• s•N /0
AVIg , 2 z 2
;
2 2 2 -
•
/3 .27'fly'21"to <
12
3 2 '
3 a
6
4 - 4/ .........„.„.
..V.4,
..../... ..„ ,
-
6,-
89 ,
1........, 76 .--
7;
A , B
88
7 , 9,
\I, ...._, t------ ,, 99' 6...- '31
.../6-,..
2 .1.
43
\
Vt?
. • 4, 40, , 11.18e 2
t 4 47 2 2 /
2 / AUT. A
'ueh :1 :16" :;;;.24;41,,,,,,04
4-"st11 ,4? 2 2 2 3 5
4
9
6 ,
a .dt 9
2 9
- 9 IS 1
2. 2
/6
T1. .62'3 ,S-1.: 461115 ,
• 7.6
66 c..
4,,, ..?5 4'4'30/, 56 .,
s
.
88 -- 85
so>4%—is-1 7,5 -F.56
/ 2y • ego--
BERTH LAYOUT 1
63 62
F
5,
4/
68 1:079(1:
23
?.9 89
66
3s7
.95 6\ N Ise
7,,, 1008
/
/9?—°,1•,,,,, 99 ;7"-°----) '''' 1
/
,
/98
,
\
`,. ••,.
04 ■ 0 , /93
CI CO 1 11° ,
<-9 0 /5
2.7
41.2, 34 49 8 .59
i3
DEEPWAtER" _ PORT SITE
.33 \ ,
\ ,.. 17...
/30 ,...cr) 0' 199 477 / PA:ilir..)›..ell IVV:dr )'' 4
By /4
./ Fl 5sec 16M, •• F G 9M
■•• • • BM/ • •
• I
, ._.__
Aband LH) 4/ 0. /274 10 '9? 4f.,
TOWER •
DE.PT ''1,.-: , i4, )1, i / - -.8.... _ 0 R Bn 320 --&—
ie,,, - - C
HS IN FEET 25
,,.. .24 2...,
, R Bn 320 — --&— - 4 .„
▪
.86 ,7 LfrA 29 171
43 37 41,, 126 279 46
72 `. 1.8181 " DEPTHS IN FATHOMS m
VICINITY MAP OF MISSISSIPPI DELTA
Note See figure 23 for designation of facilities
FIGURE 24. LOCATION, ORIENTATION AND LAYOUTS OF BERTHS AND ARTIFICIAL ISLAND OF ALTERNATIVE 4-2
Robert R. Nathan Associatcs, Inc

• - 6, VV. 7.,
4 .(17 2 , 4,
2
1<'Q / 24/ .4 46
/99 .2‘ , frc
BERTH LAYOUT 2
Scale of Statute Miles
0 I 2
,\ , .% 4 /
X' ,■ 48 \I I
2.2 40 /93 A 7 3,3 s, /9,
0C-3
-CO
I 17? N../ DEPTHS IN FEET
BERTH LAYOUT 1
(use chart 1272, / — --;8"--
I it. 15M
25 10sec
--- s Bn 320
,pA —1-4—
27 cD , 60
y A.DEEPWATER PORT SITE 46 279 A ,
[76.0r 72
' e ' 7
' ''"""P) 53 ° DEPTHS IN FATHOMS 69 Al Ag 1
T:tat.nTaTitl; 14, 7,
Boy
G 9M Bn 320 --
48
171
to°
VICINITY MAP OF MISSISSIPPI DELTA
Note. See figure 23 for designation of facilities.
FIGURE 25 LOCATION, ORIENTATION AND LAYOUTS OF BERTHS AND ARTIFICIAL ISLAND OF ALTERNATIVE 4-3
Robert R Nathan Associates, Inc.

1,499 32.6
1,214 303 434 540
3,990 337 270 607
4,597
26.4 6.6 9.5 11.7 86.8 7.3 5.9
13.2 100.0
344.
Service Areas
All alternatives would serve the same refinery areas: Houston and vicinity, Beaumont and vicinity, Lake Charles, Baton Rouge, New Orleans, Corpus Christi, and Pascagoula. All would be served by transshipment vessels.
Throughputs
All alternatives consider two sets of through-puts. The lower throughput is set at 100 m.t.a. in 1980 and 450 m.t.a. by 2000. The higher throughput is set at 150 m.t.a. in 1980 and 600 m.t.a. by 2000. It is assumed that the capacity of all refineries con-cerned would grow approximately in the same proportion.
The 1970 refinery capacities and percentages of the total refining capacity are given in table 41. To facilitate computations, percentages were rounded to 30 percent for Houston and Beaumont; to 10 percent for Lake Charles, Baton Rouge, and New Orleans; and to 5 percent for Corpus Christi and Pascagoula, as shown in table 42.
Table 41. Refining Capacities in 1970
Capacity (1,000 bbl./day)
Percentage of total capacity Refinery area
Houston and vicinity
Beaumont and vicinity Lake Charles Baton Rouge New Orleans
Subtotal Corpus Christi Pascagoula
Subtotal Total

er Hig
345.
Table 42. Projected Flow
(In millions of long tons)
Throughput Percentage of total
throughput
Refinery area Lower
1980 2000 1980 2000
Houston and vicinity 30 30 135 45 180
Beaumont and vicinity 30 30 135 45 180
Lake Charles 10 10 45 15 60 Baton Rouge 10 10 45 15 60 New Orleans 10 10 45 15 60
Subtotal 90 90 405 135 540 Corpus Christi 5 5 22.5 7.5 30 Pascagoula 5 5 22.5 7.5 30
Subtotal 10 10 45 15 60 Total 100 100 450 150 600
Type of Berths
All three alternatives (4-1, 4-2, and 4-3) con-sider fixed berths.
Dredging
Since sufficient water depth is available at the approach area, turning basins and berthing areas, it is possible to locate the berths in such a way that no dredging at the berthing areas would be required. How-ever, if no dredging is not a criterion, berths could be constructed in shallower waters. The necessity of orienting the berths in accordance with dominant cur-rents, waves, or winds will further restrict the flex-ibility of the choice of actual site location.
Two principal layouts will be presented. Layout 1 shows a berth orientation more or less parallel to the depth contour lines, assuming an orientation in
346.
accordance with predominant currents in that direction. Layout 2 shows a berth orientation perpendicular to that of layout 1, assuming an orientation in accordance with predominant waves or winds. It should be noted that layout 2 offers better possibilities than layout 1 for locating the berth structures in the required water depth. These possibilities arise, first, because the total width of layout 2 is less than the total length of layout 1 and layout 2 is therefore less influenced by the curvature of the contour lines. Second, in lay-out 2, it is not necessary to have the dolphins of the various berths in one line, as is required in layout 1. However, in both cases it is possible to have a layout of two separate jetties, the location of each one ad- justed to the contour lines as well as possible. There-fore, it will be assumed that no dredging would be re-quired for any subalternative.
Site of Tanks
All three alternatives consider an offshore tank farm on an artificial island.
Vessel Size
Alternative 4-1 will consider 200,000-d.w.t. tankers; alternative 4-2 will consider 300,000- and 400,000-d.w.t. tankers; and alternative 4-3 will con-sider 500,000-d.w.t. tankers. It is assumed that all tankers using the deepwater port will be of these max-imum sizes for each alternative or subalternative. The assumed supertanker dimensions are given in table 43.
Water Depths
The selected water depth of channels, maneuver-ing areas, etc., is such that all maximum-size tankers would be able to navigate during all stages of the tide.
Pipelines between Supertanker Berths and Artificial Island
These pipes can be laid underwater as well as on a trestle. If a trestle is used, easy access from

347.
Table 43. Vessel Dimensions
(In feet)
Vessel Size (1,000 d.w.t Dimension
200 500 300 400
Length Beam Draft
1,050 1,100 1,262 1,195
173 192 220 208
55 70 70 95
the island to the berth and the reverse can be provided at a given additional cost. Therefore, in this study a trestle has been selected for the connection between su-pertanker berths and island for alternative 4-1.
Construction Program
The time phasing of the various construction items for the period prior to 1980 is given in table 44 for all alternatives. The entire phasing was sim-plified in order to facilitate calculations. The total cost of each item will be equally distributed over the pertinent years.
Alternative 4-1
Criteria
1. Site of deepwater port: In Garden Island Bay, Gulf of Mexico.
2. Service area: Refineries at Houston, Beau-mont, Lake Charles, Baton Rouge, New Orleans, Corpus Christi, and Pascagoula.
3. Type of berths: Fixed berths. 4. Site of tanks: Artificial island. 5. Draft of tankers: 55 feet fully loaded. 6. Subalternatives: The throughputs of the
various subalternatives, and the size of the vessel they will serve, are given in table 45.

X
348.
Table 44. Construction Program of Alternatives 4-1, 4-2, and 4-3
Construction item
Year of constructi or installation
on
1975 1976 1977 1978 1979
Breakwater of island Land fill and slope protection of island
Tank farm Supertanker berths Pipelines to island Transshipment berths Pipelines and boosters to transshipment berths
Table 45. Throughputs and Size of Vessels Served by Subalternatives
Subalternatives
Vessel Size Throu ghput tons/year)
2000 1980
A
200,000 100 450
200,000 150 600
7. Projected flow: Houston and Beaumont, 30 percent each; Lake Charles, Baton Rouge, and New Or-leans, 10 percent each; and Corpus Christi and Pas-cagoula, 5 percent each.
8. Type of transshipment: Transshipment vessel.
Requirements
Supertanker berths. The number of berths re-quired for the subalternatives is as follows:
(d.w.t.)

349.
Subalternative A would require four berths by 1980, five berths by 1984, six berths by 1987, seven berths by 1990, eight berths by 1993, nine berths by 1996, and 10 berths by 1999. Four berths would be constructed before 1980 and two berths would be constructed in each of the years 1983, 1989, and 1995.
Subalternative B would require five berths by 1980, six berths by 1984, seven berths by 1986, eight berths by 1988, nine berths by 1990, 10 berths by 1992, 11 berths by 1994, 12 berths by 1996, and 13 berths by 1999. Six berths would be constructed before 1980 and two berths would be constructed in each of the years 1985, 1989, 1993. The last berth would be constructed in 1998.
Dredging The required water depth at the berths would be 63 feet, and at the turning basins and the approach area, 66 feet. Because sufficient water depth is available at the approach area, turning basins and berthing areas, no dredging would be required.
Pipelines from berths to intermediate tank farm. One 48-inch line per berth would be required. Each line would be about 2 miles long, of which 1.2 miles would be supported by trestle and 0.8 miles would be on the island. No booster pumps would be required.
Artificial island. The crude oil storage capa-cities required would be as follows: subalternative A would require 1.88 x 10 6 long tons by 1980, 2.48 x 10 6
long tons by 1984, 3.25 x 10° long tons by 1990, and 4.04 x 10 6 long tons by 1996. Before 1980, 1.88 mil-lion long tons of storage capacity would be constructed, and additional storage capacities of 0.60, 0.77 and 0.79 million long tons would be constructed in 1983, 1989 and 1995 respectively.
Subalternative B would require 2.48 x 10 6 long tons by 1980, 3.25 x 10 6 long tons by 1986, 4.04 x 10 6
long tons by 1990, 4.87 x 101) long tons by 1994, and 5.29 x 10 6 long tons by 1999. Before 1980, 2.48

350.
million long tons of storage capacity would be con-structed, and 0.77, 0.79, 0.83 and 0.42 million long tons would be constructed in 1985, 1989, 1993 and 1998, respectively.
For the general services an area of 30 acres was estimated. The total acreage requirement would be as follows: for subalternative A, 4.04 x 50 + 30 = approximately 230 acres; and for subalternative B, 5.29 x 50 + 30 = approximately 295 acres.
The assumed average water depth at the island is 35 feet, and the assumed required terrain elevation is +20 feet. The land fill requirements are as follows:
Subalternative A = 43,560x 230 x 55 = 20.4 x 10 6 27 cubic yards
Subalternative B = 43 ' 560 x 295 x 55 = 26.2 x 10 6 27 cubic yards
The main breakwater is about 2.0 miles long; the secondary breakwater, 1.0 mile long.
Transshipment berths. The number of berths re-quired would be as follows: subalternative A would re-quire four berths by 1980, six berths by 1983, eight berths by 1988, and 10 berths by 1993. Four berths would be constructed before 1980 and two berths would be constructed in each of the years 1982, 1987, and 1992.
Subalternative B would require six berths in 1980, eight berths in 1985, 10 berths in 1988, 12 berths in 1992, and 14 berths in 1996. Six berths would be constructed before 1980, and two berths would be constructed in each of the years 1984, 1987, 1991, and 1995.

351.
Pi.elines and booster stations from intermediate storage to transshipment berths. One 48-inch line per berth would be required. The average length of a line would be approximately 1.5 miles, of which 1 mile is on land and 0.5 mile supported by trestle.
The pressure loss per line is 15 + 1.5 x 11.13 = 31.7 p.s.i. The horsepower requirement is 31.7 x 36.64 = about 1,000 b.hp. per line.
The location, orientation, and layouts of berths and artificial island are shown in figure 23. The presentation of berths and island is schematic.
Alternative 4-2
Criteria
1. Site of deepwater port: In Garden Island Bay, Gulf of Mexico.
2. Service area: Refineries at Houston, Beau-mont, Lake Charles, Baton Rouge, New Orleans, Corpus Christi, and Pascagoula.
3. Type of berths: Fixed berths. 4. Site of tanks: Artificial island. 5. Draft of tankers: 70 feet fully loaded. 6. Subalternatives: The throughputs of the
various subalternatives, and the size of the vessels they will serve, are given in table 46.
7. Projected flow: Houston and Beaumont, 30 percent each; Lake Charles, Baton Rouge, and New Or-leans, 10 percent each; and Corpus Christi and Pasca-goula, 5 percent each.
8. Type of transshipment: Transshipment vessels.
Requirements
Supertanker berths. The number of berths re-quired for the subalternatives is as follows: subal-ternative A would require three berths by 1980, four berths by 1983, five berths by 1987, six berths by 1991, seven berths by 1995, and eight berths by 1998. Four

100 150 100 150
450 600 450 600
352.
Table 46. Throughputs and Size of Vessel Served by Subalternatives
Subalternative
hput ons/year)
Vessel size Throug (million t
(d.w.t.) 2000 1980
A 300,000 300,000 400,000 400,000
berths would be constructed before 1980, and one berth would be constructed in each of the years 1986, 1990, 1994, and 1997.
Subalternative B would require four berths by 1980, five berths by 1983, six berths by 1986, seven berths by 1989, eight berths by 1992, nine berths by 1995, and 10 berths by 1997. Four berths would be constructed before 1980, and one berth would be con-structed in each of the years 1982, 1985, 1988, 1991, 1994, and 1996.
Subalternative C would require three berths by 1980, four berths by 1984, five berths by 1989, six berths by 1994, and seven berths by 1998. Four berths would be constructed before 1980, and one berth would be constructed in each of the years 1988, 1993, and 1997.
Subalternative D would require four berths by 1980, five berths by 1985, six berths by 1988, seven berths by 1991, eight berths by 1995, and nine berths by 1998. Four berths would be constructed before 1980, and one berth would be constructed in each of the years 1984, 1987, 1990, 1994, and 1997.

353.
Dredging. The required water depths would be 81 feet at the berths and 84 feet at the approach area and turning basins. Sufficient water depth is available for all areas, and it has been assumed that no dredging would be required for any subalternative. However, as discussed in the introduction, no dredging might result in the locating of some berths in water con-siderably deeper than required.
Pipelines from supertanker berths to inter-mediate tank farm. One 48-inch line per berth would be required. Each line would be about 2.6 miles long, of which 0.8 mile would be supported by trestle, 1 mile would be underwater, and 0.8 mile would be on the island. No booster pumps would be required.
Artificial island. The crude oil storage capa-cities required would be as follows: subalternative A would require 2.24 x 10 6 long tons by 1980, 2.51 x 10 6
long tons by 1987, 2.87 x 10° long tons by 1991, 3.34 x 10 6 long tons by 1995, and 3.83 x 10 6 long tons by 1998. Before 1980, 2.24 million long tons of storage capacity would be constructed; additional storage capa-cities of 0.27, 0.36, 0.47, and 0.49 million long tons would be constructed in 1986, 1990, 1994, and 1997, respectively.
Subalternative B would require 2.24 x 10 6 long tons by 1980, 2.51 x 10 6 long tons by 1983, 2.87 x 10 6
long tons by 1986, 3.34 x 10⁶ long tons by 1989, 3.83 x 10 6 long tons by 1992, 4.30 x 10 6 long tons by 1995, and 4.75 x 10 6 long tons by 1997. Before 1980, 2.24 million long tons of storage capacity would be con-structed; additional storage capacities of 0.27, 0.36, 0.47, 0.49, 0.47, and 0.45 million long tons would be constructed in 1982, 1985, 1988, 1991, 1994, and 1996, respectively.
Subalternative C would require 2.67 x 10 6 long tons by 1980, 3.04 x 10 6 long tops by 1989, 3.55 x 10 6 long tons by 1994, and 4.09 x 10' long tons by 1998.

354.
Before 1980, 2.67 million long tons of storage capacity would be constructed; additional storage capacities of 0.37, 0.51, and 0.54 million long tons would be con-structed in 1988, 1993, and 1997, respectively.
Subalternative D would require 2.67 x 10 6 long tons by 1980, 3.04 x 10 6 long tons by 1985, 3.55 x 10 6
long tons by 1988, 4.09 x 10b long tons by 1991, 4.69 x 10 6 long tons by 1995, and 5.29 x 10 6 long tons by 1998. Before 1980, 2.67 million long tons of storage capacity would be constructed; additional storage capacities of 0.37, 0.51, 0.54, 0.60, and 0.60 million long tons would be constructed in 1984, 1987, 1990, 1994, and 1997.
For general services an area of 30 acres was estimated. The total acreage requirement would be, for subalternative A, 3.83 x 50 + 30 = about 220 acres; for subalternative B, 4.75 x 50 + 30 = about 270 acres; for subalternative C, 4.09 x 50 + 30 = about 235 acres; and for subalternative D, 5.29 x 50 + 30 = about 295 acres.
The assumed average water depth at the island is 35 feet, and the assumed required terrain elevation is +20 feet. The land fill requirements would be as follows:
Subalternative A - 43'560 x 220 x 55 = 19.6 x 10 6 27 cubic yards
Subalternative B = 43 ' 560 x 270 x 55 = 23.9 x 10 6 27 cubic yards
Subalternative C - 43'560 x 235 x 55 = 20.8 x 10 6 27
cubic yards Subalternative D = 43 ' 560 27 x 295 x 55 = 26.2 x 10
6 cubic yards
The main breakwater is about 2.0 miles long; the secondary breakwater, 1 mile long.
Transshipment berths. Subalternatives A and C would require the same number of transshipment berths as subalternative A of alternative 4-1; subalternatives B and D, would require the same number of transshipment berths as subalternative B of alternative 4-1.
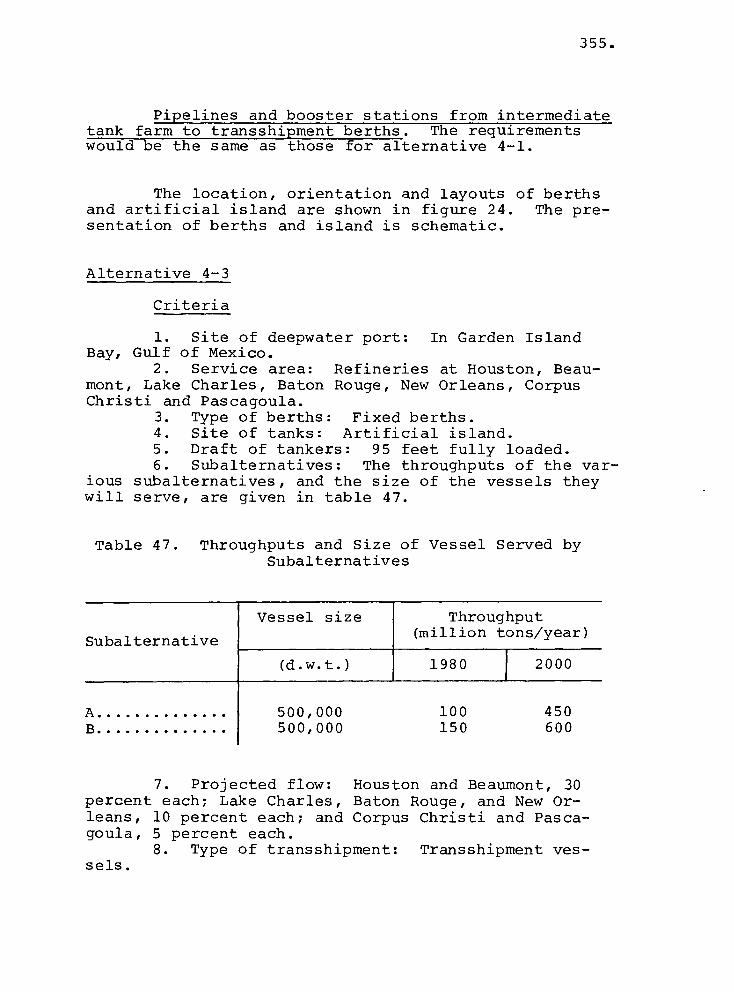
355.
Pipelines and booster stations from intermediate tank farm to transshipment berths. The requirements would be the same as those for alternative 4-1.
The location, orientation and layouts of berths and artificial island are shown in figure 24. The pre-sentation of berths and island is schematic.
Alternative 4-3
Criteria
1. Site of deepwater port: In Garden Island Bay, Gulf of Mexico.
2. Service area: Refineries at Houston, Beau-mont, Lake Charles, Baton Rouge, New Orleans, Corpus Christi and Pascagoula.
3. Type of berths: Fixed berths. 4. Site of tanks: Artificial island. 5. Draft of tankers: 95 feet fully loaded. 6. Subalternatives: The throughputs of the var-
ious subalternatives, and the size of the vessels they will serve, are given in table 47.
Table 47. Throughputs and Size of Vessel Served by Subalternatives
Vessel size
Subalternative
Throug t
put ns/year)
2000 1980
A
500,000 100 450
500,000 150 600
7. Projected flow: Houston and Beaumont, 30 percent each; Lake Charles, Baton Rouge, and New Or-leans, 10 percent each; and Corpus Christi and Pasca-goula, 5 percent each.
8. Type of transshipment: Transshipment ves-sels.
(d.w.t.)

356.
Requirements
Supertanker berths. The number of berths re-quired for the subalternatives is as follows: subal-ternative A would require three berths by 1980, four berths by 1985, five berths by 1990, six berths by 1994, and seven berths by 1999. Three berths would be constructed before 1980; one berth would be constructed in each of the years 1984, 1989, 1993 and 1998.
Subalternative B would require four berths by 1980, five berths by 1985, six berths by 1989, seven berths by 1993, eight berths by 1996, and nine berths by 1999. Four berths would be constructed before 1980; one berth would be constructed in each of the years 1984, 1988, 1992, 1995 and 1998.
Dredging. The required water depths are 109 feet at the berths and 114 feet at the approach area and turning basins. Sufficient water depth is avail-able for all areas, and it is assumed that no dredging would be required for any subalternative. However as discussed in the introduction, no dredging might re-sult in the locating of some berths in water consider-ably deeper than required.
Pipelines from supertanker berths to inter-mediate tank farm. One 48-inch line per berth would be required. Each line would be about 3 miles long, of which 0.4 mile would be supported by trestle, 1.8 miles would be underwater, and 0.8 mile would be on the island. No booster pumps would be required.
Artificial island. The crude oil storage capa-cities required would b9 as follows: subalternative A would require 2.17 x 10' long tons by 1980, 2.69 x 10 6
long tons by 1985, 3.04 x 101° long tons by 1990, 3.47 x 10 6 long tons by 1994, and 4.07 x 10 6 long tons by 1999. Before 1980 2.17 million long tons of storage capacity would be constructed; additional storage capacities of 0.52, 0.35, 0.43 and 0.60 million long tons would be constructed in 1984, 1989, 1993, and 1998, respectively.

357.
Texas Area
Six alternatives, numbered 5-1 through 5-6, are considered in the Texas area of the gulf coast.
The location and layout of the deepwater ports in the area and the pipeline route to the various re-finery areas are shown in figures 26 through 28. De-tailed layouts are shown in figures 29 and 30.
Sites
Alternatives 5-1, 5-2 and 5-3 consider deepwater ports off Freeport in the Gulf of Mexico, whereas alter-natives 5-4, 5-5, and 5-6 consider deepwater ports immediately behind the coastline.
Service Areas
All alternatives would serve the same refinery areas: Houston and vicinity, Beaumont and vicinity, Lake Charles, Baton Rouge and New Orleans, all of which would be served by pipelines; and Corpus Christi and Pascagoula, which would be served by transshipment vessels. It is assumed that the intermediate tank farm would be located on shore at Freeport.
Throughputs
All alternatives consider two sets of through-puts. The lower throughput is set at 100 m.t.a. in 1980 and 450 m.t.a. by 2000. The higher throughput is set at 150 m.t.a. in 1980 and 600 m.t.a. by 2000. It is assumed that the capacity of all refineries con-cerned would grow approximately in the same proportion. As discussed in the preceding section of the Missis-sippi Delta area, the following flows have been pro-jected: to Houston and Beaumont, 30 percent each of the total throughput; to Lake Charles, Baton Rouge, and New Orleans, 10 percent each; and to Corpus Christi and Pascagoula, 5 percent each. Table 48 gives the projected flows to the various refinery areas.
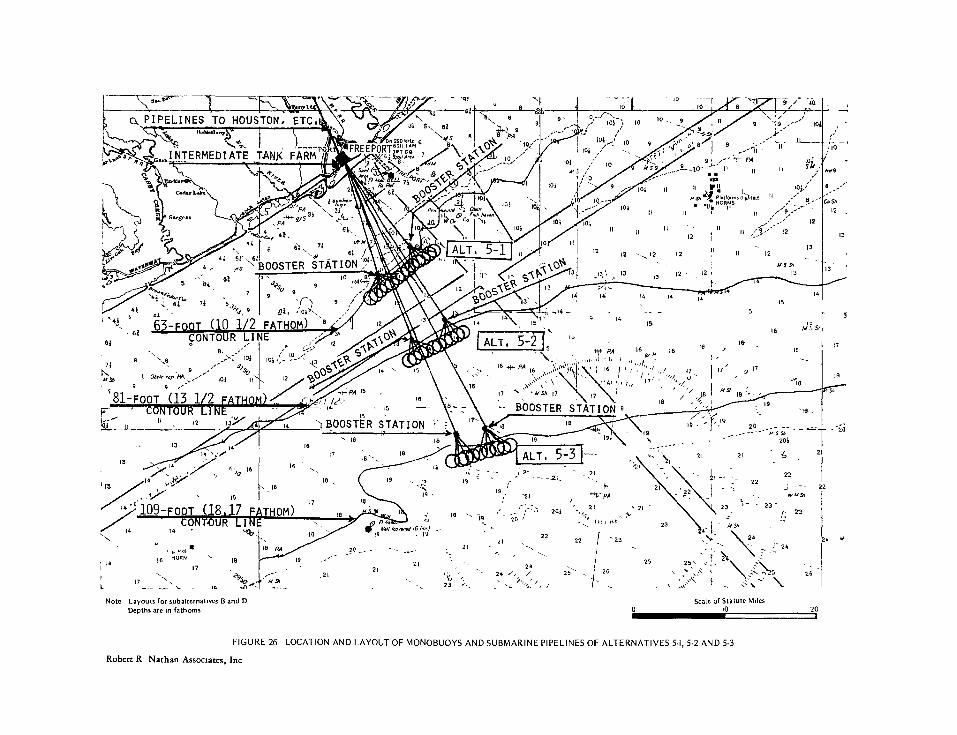
,
10
n91 110124 '-
i 14 17
_ 0
Note Layouts for subalternatives B and D
Depths are m fathoms
18
Scale of Statute Miles 10
16
17
Ia
5 SA 203
tae 54
23 - t-
=1.1 24
20
17
T
4 44
18
S6
21
22
Fl 4fitS■•••. " lconond 16 fins)
21
a, PIPELINES TO HOUSTON, ETC. 'Di 6 a
9 9
• FREEPORT;::r Bn 290 kHz N13.S 8
.0.1/ 10
• . I ,9 • • e4r
-17.1111111k \VP tc "
- 4 2 4
3; 6N 62
7,4 -49
6 101
4,1 2 io; 10
.":1'30/ '1-10- 1-11 9 1 '1
10i II
. 1.-rt3 V`
/ ; ,
-'9 10
8 II
9 PA 11 11 • •
t
10
TO 9
I03
103 44,9
Co 54 12
lOt
12
1 1 11 13
000 41
itc 5
12 12 12 , 12
13
11
2- 121
12
13
14 14 45 .4 63
41
„CONTOUR LIN
10;
- .- 71 9 .„-/
103 11 4/.94 '
81 — FOOT (13 1/2 FATHOM)- CONTOUR LINE
11
2 13.X '01
43
63
14 15
16
- "-/ BOOSTER STATION
17 1, 16 18
16
— 5
1 6 444 PA 16
STATION
1+ PA 36 16
I
A ■
IS
;7
r
9 t
21 13
ALT. 5-3 ; 21 21
14
1O9-FOOT - co
14 14
22
1 9
264 .1 "" 21 21 11'
IS r,
N. 16
15
(18.17 FATHOM) 2
23 TOUR Li 14
22 r - 23 22
21
24 24 /
25 25 , 21 I 26
111 23 ,11
FIGURE 26 LOCATION AND LAYOUT OF MONOBUOYS AND SUBMARINE PIPELINES OF ALTERNATIVES 5-1, 5-2 AND 5-3
Robert R Nathan Associates, Inc

•71 t-e6 rum al
24
24
31/3 4 8121
Scale of Statute Miles
10. 0 20
.16
.
. ,,.., .
'‘. •„.
N 15 , th -.. ••••■ 21--
,
9,
21
'-.. "..., 17
, '-- ---._ — x r -......-. -,20i '''1, 15 ,,,,.<2
15 ".. ‘.
la w c.. ' 8 ',-;,,, 18 ' - - 1'9 ---'----2-0,1 '' - .,6.1'.. of ci-k04'4' 14 `... tie AW:.;;;W4/4,116 4/1 -:- ,---
'15 ..?6,i,„ ,
la ..."-, . 19
.446•41'18' ...„,.., HORN , 18
,
'''.
-''' ...
PA P- - 7., -------- ------- ' - 21
.,
21
::
, , ..7 ''''''
- 24
., 22 1 18 '
25 17
N, 21 ',.., ,1 -.3-... , 24 / , ' /
25' ,,,, , 26
So ,- ■4/ .91 ' 2 .-- ' ' ''' /.. '... , . ., . - /
4
13
4.2
41 '66 N 61
r'S e 6t
7 9 •., 9
di„..1101),
_„ SS
21 ,
PA 36 71 \
PA ' 54
eh/ 71
61
pA
9 f/
16 17
16
1
16
18
.. • - 26 24
/". , 26 / - 26 24'
71
12/ 14
19
6
OUTER TURNING
le= , 19
„ 19 --- --
21 „ 21
14
,
15 ‘‘‘ 16 4.1,.
s.` S` , \
17 \// 54 17
" 10 -
_
71.11-44tor
01'
8 9 s 10
o
PA .2 1_4« 71
61 49,4%.,„ or s
a
71 61 71! 8
9 s
4
a i0
BASIN ° j \
104 ,
) ,,a'fr` to 9 ,1 9 ,..1.i . 101//
.,, A, ,, • 144 ... ...2.....10-4' \ in : 9 I - - -
s0j, i ° ....-- 10 11 it ,,,,, it inlatlor;n11664tse9 ._!!, , a ' a. ., Al ......,, ,01 . ,,,,.. Kap
END OF 0 EAN CHANNEL " 1 It
t _ p II
12 12 12 12
__ _
1 1 11 --
5: 6 7
Si 9i Ss
71
,BERTH I NG AREAS ., P.. s-ss BERTH I NG AREAS
61
9 8 10
8 71
71
2 101 -st 10 1° 9 0 to '°
6 9
9
9
stk
re St
40
10
it)
10
I <". I 9
11
9 9
11
sr sr 9
12
/
/ 8 I°Nu. 9 8
4
419,9941 0,99.<15:21.8 8 31 9
/ ..
fdarogionow0
!'"
-
12
a
13
,110 )10
9
290 90,89,19/2 9
)10
7 9 R.,
13
81 2 2',
14
„„:1 , 37,
" -- 1 .:'4, , ! -.9 Is-
19 /
--- le
!. CD mss
,.....__........... .z_ofv-1 I '/'''e 18 ,,c"
19
:
20-, - ,.s . cn_____--i .&i28 ° 30 :- _ _
5-6 END OF OCEAN CHANN1L 2 ' 21
22 --..
- - S-- 22 .: ,„ r-n6 — 22 1 3320
-
6 23 ---- \,„ 1 --,7 54
24 .:-'-
.., 1 .nn''''' .: , ..., 26
\ \\2P 5-'-. - -'------26"--- ' - "
e2 •A
- i
27 3,
1 '''. u n'• - 2 4
't 0 14
1,1 7:7P3—
5 .••.9 I
16 4)1 Sh - - -
-16 , 6
17 17
18 ' ....... - ' 1 18 '
Char(5 1282 .-.
26 26
4 27
Note. Depths are in fathoms.
FIGURE 27. LOCATION AND LAYOUT OF CHANNELS, BASINS, TANK FARM AND PIPELINES OF ALTERNATIVES 5-4, 5-5, AND 5-6
Robert R ;Nathan Associates, Inc.

Be yvan
Lake Pontchartrain
enne
N
RII:=SIMed •13(1007 ••■ Bearkonoe Ifrz;
Chnstm s , S sc,:/;4
0.T I 'W-ei'e .S711
tr,
Meon wile •
1'4.4 Orem Wen
nose 'Bast( c
k Breaux boson
0- LmvIsbur
h Pool french
I ayne,
Sprin
audAtt
A
• Tote 4'Plac
C 0-e* LS-11111 Peer
doll
I Y-
N 15.6111)itill rou.r ed. Wincent raterway
0;074q-CE
AdrannZ 'GRAI101
The
frhs"sslPrP' South•as Pass n ...o.• i - apt Eat),
"1. North Pass
' -Northrast Pas
"5=Pass Southwest. -.8.'0°04
Poss
Mexico
90, —89g— 91,
Irma
bch Marosorwli arhysWALkt untsvilles
New Weivrt hardt
;WA: r4g4,
Nisr4,0- Co-utsmn. TE011 PT
torn
X A S wimeN.
Gulf
E A
1 SECTION BEAUMONT-
Itacktserry• ;Pear • Ca/sr rAett 0 , ,.. Sob R•4:M
Ii L •
N •••'
.•
.N
'•:*4N f, "" 01000
Ate• #0•;,;" 1`..raansi - ,,,,,,,,:: -.7.,
S'4•wis""C0 be !Udder f„).• T kit _. - ?.....,:t. i
:74 tot . umesto
oldsonfh3 put 414 57 SheP er< nik
ERY
It
•r„ „
4•-• 1 4200,
On
.1.3.11 "MM.. 1..viingeky,
LAKE CHARLESmw***1**
Art or *Pond lake • ••,• 07/77.100
61118
A 14 L L •k Creek*
ir t.„
Lon f Cheat, Ndle ' tton . file.... fest 4.- Oreauche
IE:TION LAKE CHARLES — E BATON ROUGE
1". bran' "1.
rT„ ufl
!Mon .1 T1RSONn'
!DAVIS . A „RoarfOktr
VA ,441;-P;.a:rter
R.Idell E CELINE
Ville P Wdshm
250 wigniers
—upsifaiai
us iii 7%1; >
`,kii. Fd,,..loot, * ' i 1u 4
'?
Ts• or. Mauna T.0, . • ea . oribrrrt . x 7,, ,„0.:00ohld•fm.tteut,..
omp*
9 . , don et 0 0
P . •• • ' wn
Abbey - aunftW' " "'le "' _*.. =1* - 1- , • - -
44•-••—„,,,LE A Ai 187.tvIcrtk.:64,417 A$1,111, SECTION BATON ROUGE
kn; ,..0:240.',,,, — e• EANS 44,4, . ..i.., ,,...,, wev,,,„ ..,
*17• .. ''''''‘ — 4;,", ,„„„ • .. ,...3 01,i3.;,ii,) ,„,toqrt, gorgan UirY
• Feoen isfenti, . 94y Blamehs A # y
. .. '^ , ;;041; 80741LE* ..
'-. ' ' '‘ 14 Cr 0 , V tt.I''' '...'!'''!"6 '' ' 74" *7.
_ CREVACUM
5 00,..‘e-
Statute Mtlea Leg...C42,
--
'‘Efgg,
..f3oosoo L A Ity
PYOtSi Sao
ads
forslepo,
ertInv1110 Coresmitle
Iberia *
thFill tht?' . • i urthwOle ' '"•5'• 14e;s tie ' l'• ,
tolcoorric
gents."
Atchoio; oY-; ' 1 E RD.229,11-5.-6 Lk tp1.-4 "'
/30.11014.1'V 1,4'1..
0 t:tflallt7:: er, .
Boy
._ PI 03 KR __ 47 r!. ..
Merhoat
L.- Torrebonna , -_,
Longitude West of Greenwleh •
i., Che,ovin. • •,,, 1, o 0,1,1r14 040i - - • ...7•,..;.• -
ao
le Wilson
m Park • I ANA
Br ,d•flg
f.3 TIckla• ROOST LIVINGSTONNetal r
BATON .„ c ammo ROUG El" Spagedle • _ .'". "*- Port %anent SPtIngn
' ,P.., • French 4' .setatment
allk 350‘1,ri: ka' 44ps 4 , SION d r N .rreoto A
. afilig oli, - " ,
• • nt . , RN...MT L
'c.f. 8,1 40-0`; . 9,,,linto.vmrdElftlti ill .., ‘2,,, cilm;on7 • G .d • •••••,r
- - CA Ghortns earatarlarpo • n't, f, ".t.:.. . , ' . „ 70 ,„. .., [organ Ctty 1, , 00401;,, . fr So/wader ••••••,„ „.... - , , 0 f '.. 4'; ••• ..". 't o „
nArnelrebt.Elitnclain 4, ‘4.... °ulna L kport •
no 4 "' '1, atherrs 4S Delia Fanner, ... No ***/)*ri- * e Sound
-,,,...,; _ .re C.) -e
' --ar / re, • 6" • , •Pto.4.4a Meth - Akfr 4'4,4, • c Larose •Cut Off 0, cwee,,e4 ,, ,_ ...,
'4" ieetertueVao.gtone 's3 I E fl 0 N N EMontegut% ?... # 9#n -"-• .. ' . !Phu,
0'4,
itanli ' p,..,.......„ g Nt 10,Zisa• $.. -.:re.p, .::-,, -,:, 7:,f 4,:- ..41,894.0?"'e Main Pass
cC
NOrwoori •rehnviII•V &Kent,..dhit.14
'
r
FAST *i S A I PI T '' k WA HINGTON ncht‘ta Greensbu.rg zieng44 ••°4<
,,
1. Kiankt_tnitoun_
ICIANA H E LLNA n ... Holton7 ... —
., .RedeY 'Grangewie 7,-, c.i' 1,.. ..
.;1117eA T h:1: S' "IW-Ge-Ten'tdMe 41,1E1 :tee' 1,1.° L'.17r1 la n; es reZ *Fois oC tl';' ', '''' 1 R sT, Itt4MA T
am-I Idh t, 2
■2.x...„*.id_q___,, vin;ton - 0 Spri mane 05
7077010eade•IIM
Ne
-
nrAmpamomso,
ISLE oERNIERE
- Al fonch'atoula 'Nod,
4 Man
mon HINGTON
Krankttaton e„Bogatusa
-Enon
mut-
Laoon-iNt
19 4
Loh.
NEW ORLEANS
„. __eft NORTH
.*" r ft" skek130624I.
.. , N
BRETON I
ERROL 1
4
8-yton I . 70Il 1i RV!! ,W- e "'
Anahul.;.4
CNAIA,on: VI tslead
iiri_7'.. • ES -fifio„.• Lwow
6a1VM•St011 tfteaLESTON iSiA.NO
SECTION HOUSTON — 1 BEAUMONT
II ECT I ON FREEPORT-
1 1" FREEPORT
„.
- ' A q, Ilat4r,%' , k-r
...,0/. 'Connor
70 7 0 CO 30 .4 06 rIO SO 90 WO
FIGURE 28. ASSUMED PIPELINE ROUTE FROM FREEPORT TO NEW ORLEANS OF AI TERNATIVES 5-1 THROUGH 5-6
Robert R. Nathan Associates, Inc.

18
66
66
67
Al 58
£h
60,' 150
68 67
, 59
60
60
59
59 soi. A I S
56
57
69 69
69 70
72 72
73 72
73
74
78 •*"
/11776
2
75 73
75
57 60 /,' {iv' -,.: --•,), ii - , — 5, 71
--. 70 4,
1 RADIUS 4,000 FEET S 69 -.'. ---- %. - 1,
44 OECI1C-'' ' •:-. 69 MS
12 -. • _ 59 _
_ o
72
t1.,1
72
Note Ultimate layout of subalternative B
Depths are in feet * Beacon
Robert R Nathan Associates, Inc
56
18 feet mc/0,18d 4 .
19
39 A2- IT
Hwlsar Fl 6s.
R. Re/ 46 50
44
3
49
55
Cu
crN
49 52 56\ 58
SUBMARINE LINES- „- 61
52 97 - -\\-- ".. ,
• 56 BOOSTER STATION 6 Rtstfonns (howl , HORN i \ 62
55
58 , 61 , / 63 \ 62
, 59 . 63
42 ; 62
” \ 59 4-7. / 63
63
63
66
67
LP IX%
66
67 1° ,•C•
-. 66 1„ 1,6
0/09 "Ptes.r.i,
0 ; 1/4 67 67
67 \ 67
6 4%
65
52
57 62 61
64 66 66
64 63 64
62 -
0' 59
MONOBUOY
54 3
38 59 t 61 57
40 40 58 60,'
57 69 61
59 6
58 1
BOOSTER STATION.' 60
59
6 62
2
61
61 59 57
57 59
-84
69
68
69
70
69 69
9 69 • 69
68
67
68
68
59
-t
89
56
52
57 53 a 4,, •
54 58
53
30
69' /
/ /,
69 70 -
68 1
70 69
69 Irl 70
70 'C7'
70 72 56
rps, 7"19't
69 LINE -7; 63-FOOT CONTOUR 58
71 70-7 68
4-
1- 71
TX3
72
Scale of Statute Miles
0 1 2 111■111.1===
FIGURE 29 DETAILED LAYOUT OF MONOBUOYS AND SUBMARINE PIPELINES OF ALTERNATIVE 5-I

OUINTANA POINT'
AOINTANA
' RECOMMENDED NEW NORTH JETTY] <01
A/ Vrli JEa_''d
ETTI CHANNEL' BRAZOS HARBOR TURNING BASIN AND CHANNEL
gW1,- SOUTH JETTY
EXIT CHANNEL OF SUPERTANKERS IN BALLAST AND CHANNEL FOR TRANS -SHIPMENT BARGES
LOCATION AND PRINCIPAL LAYOUT OF DEEPWATER PORT
ILOTER BAR HANNEL
NOTE: LAYOUT FOR 10 SUPERTANKER BERTHS
!•$.,
Kct‘'
I PRESENT AND AUTHORIZED CHANNELS AT FREEPORT
kgSE'M es = AUTHORIZED Cli•NNELS IIIA51117
RECOMMENDED CN•101ELS 8 BASINS
nvo,7.2','4V"
‘) c 0 G O
f-P 0
r \V"
PIPELINES TO HOUSTON, ETC.
INTERMEDIATE TANK FARM
OUTER TURNING BASIN
BRAZOSPORT TURNING BASIN
LOWER TURNING BASIN BERTHING AREAS
<<s ro
(‹s
' o
INNER TURNING BASIN S TA GE F ER CHEMICAL
PL ANT ,
S U'R PSI GE
Scale of Statute Miles
0
FIGURE 30 PRESENT AND AUTHORIZED CHANNELS AT FREEPORT, AND LOCATION AND PRINCIPAL LAYOUT OF
DEEPWATER PORT FOR ALTERNATIVES 5-4 1 5-5, AND 5-6
Robert R Nathan Associates, Inc

363.
Subalternative B,would require 2.69 x 10 6 long tons by 1980, 3.04 x 10 ° long tons by 1985, 3.47 x 10 6
long tons by 1989, 4.07 x 10¹⁰ long tons by 1993, 4.62 x 10 6 long tons by 1996, and 5.20 x 10 6 long tons by 1999. Before 1980 2.69 million long tons of storage capacity would be constructed; additional storage capa-cities of 0.35, 0.43, 0.60, 0.55, and 0.58 million long tons would be constructed in 1984, 1988, 1992, 1995, and 1998, respectively.
For general services an area of 30 acres was estimated. The total acreage requirement would be, for subalternative A, 4.07 x 50 + 30 = about 235 acres; and for subalternative B, 5.20 x 50 + 30 = about 290 acres.
The assumed average water depth at the island is 35 feet, and the assumed required terrain elevation is +20 feet. The land fill requirements are as follows:
Subalternative A - 43,560x 235 x 55 = 20.8 x 27 10 6 cubic yards 43,560 Subalternative B - x 290 x 55 = 25.7 x 27 10 6 cubic yards
The main breakwater is about 2.0 miles long; the secondary breakwater, 1 mile long.
Transshipment berths. Subalternative A would require the same number of transshipment berths as subalternative A of alternative 4-1; subalternative B, would require the same number of transshipment berths as subalternative B of alternative 4-1.
Pipelines and booster stations from inter-mediate tank farm to transshipment berths. The require-ments would be the same as those for alternative 4-1.
The location, orientation, and layouts of berths and artificial island are shown in figure 25. The pre-sentation of berths and island is schematic.

her Hig
30 45 180 30 135
364.
Table 48. Projected Flow
(In millions of long tons)
Throughput
Refinery area
Percentage of total throughput
Lower
1980 2000 1980 2000
Houston and vicinity Beaumont and vicinity Lake Charles Baton Rouge New Orleans
Subtotal Corpus Christi Pascagoula
Subtotal Total
30 30 135 45 180
10 10 45 15 60
10 10 45 15 60
10 10 45 15 60
90 90 405 135 540
5 5 22.5 7.5 30
5 5 22.5 7.5 30
10 10 45 15 60
100 100 450 150 600
Type of Berths
Alternatives 5-1, 5-2, and 5-3 consider mono-buoys, whereas alternatives 5-4, 5-5, and 5-6 consider fixed berths.
Site of Tanks
All six alternatives consider an onshore tank farm near Freeport.
Vessel size
Two alternatives (5-1 and 5-4) will consider 200,000-d.w.t. tankers, two alternatives (5-2 and 5-5) will consider 300,000- and 400,000-d.w.t. tankers, and two alternatives (5-3 and 5-6) will consider 500,000- d.w.t. tankers. It is assumed that all tankers using

200 300
365.
the deepwater port will be of these maximum sizes for each alternative or subalternative. The assumed supertanker dimensions are given in table 49.
Table 49. Vessel Dimensions
(In feet)
Vessel Size (1,000 d.w.t Dimension
• )
400 500
Length Beam Draft
1,050 173 55
1,100 192 70
1,262 220 70
1,195 208 95
Dredging
Alternatives 5-1, 5-2, and 5-3 do not require dredging. Alternatives 5-4, 5-5, and 5-6 require dredged channels, turning basins, and berthing areas. All submarine and onshore pipelines are expected to be buried.
Water depths
In all alternatives the depth of channels, maneuvering areas, etc., is such that all maximum-size tankers would be able to navigate during all stages of the tide.
Construction Program
The time phasing of the various construction items for the period prior to 1980, is given in table 50 for alternatives 5-1, 5-2, and 5-3, and in table 51 for alternatives 5-4, 5-5, and 5-6. The entire phas-ing was simplified to facilitate calculations. The total cost of each item will be equally distributed over the pertinent years.

366.
Table 50. Construction Program of Alternatives 5-1, 5-2, and 5-3
Construction item
Year of constructi or installation
on
1975 1976 1977 1978 1979
Tank farm Supertanker berths Pipelines to tank farm Transshipment berths Pipelines to refineries
Table 51. Construction Program of Alternatives 5-4, 5-5, and 5-6
Construction item
Year of construction or installation
1975 1976 1977 1978 1979
Dredging Jetties Tank farm Supertanker berths Pipelines to refineries Transshipment berths
Alternative 5-1
Criteria
1. Site of deepwater port: In the Gulf of Mexico, 13 miles off Freeport.
2. Service area: Refineries at Houston, Beau- mont, Lake Charles, Baton Rouge, and New Orleans by pipeline, and refineries at Corpus Christi and Pasca- goula by transshipment barge.
3. Type of berths: Monobuoys.

367.
4. Site of tanks: Near Freeport. 5. Draft of tankers: 55 feet fully loaded. 6. Subalternatives: The throughputs of the var-
ious subalternatives, and the size of the vessels they will serve, are given in table 52.
Table 52. Throughputs and Size of Vessel Served by Subalternatives
Vessel size
Subalternative
Throug (million t
hput ons/year)
2000 1980
A 200,000 100 450
200,000 150 600
7. Projected flow: Houston and Beaumont, 30 percent each; Lake Charles, Baton Rouge, and New Or-leans, 10 percent each; and Corpus Christi and Pasco-goula, 5 percent each.
Requirements
Supertanker berths. The number of berths re-quired would be the same as that for alternative 4-1. Subalternative A would require four buoys by 1980, five buoys by 1984, six buoys by 1987, seven buoys by 1990, eight buoys by 1993, nine buoys by 1996, and 10 buoys by 1999. Four buoys would be installed before 1980; one buoy would be installed in each of the years 1983, 1986, 1989, 1992, 1995, and 1998.
Subalternative B would require five buoys by 1980, six buoys by 1984, seven buoys by 1986, eight buoys by 1988, nine buoys by 1990, 10 buoys by 1992, 11 buoys by 1994, 12 buoys by 1996, and 13 buoys by
(d.w.t.)

368.
1999. Five buoys would be installed before 1980; two buoys would be installed in each of the years 1983, 1987, 1991, and 1995.
Dredging quanties. No dredging would be re- quired.
Water depth of maneuvering area. The water depth of the maneuvering area would be 63 feet (see table 5).
Pipelines from berths to intermediate tank farm. One 48-inch line per monobuoy would be required. Each line would be about 16 miles long, of which 13 miles would be off shore and 3 miles would be on land.
Each offshore line would run from a buoy to a booster station located at a maximum distance of 3.5 miles from the easternmost and westernmost buoys. The ship has a pressure of 150 p.s.i. at the manifold, 70 p.s.i. of which are lost in the hoses. The available pressure remaining at the booster station is thus 150 -70 -(3.5 x 14.1) = 30.6 p.s.i., which is still greater than the required minimum of 25 p.s.i. In both sub-alternatives, one booster platform would be sufficient for the initial period. Second platforms would be required in 1987 and 1988 for subalternatives A and B, respectively, and would be constructed in 1986 and 1987.
From the booster station(s) to the tank farm the pipeline must run a distance of about 13 miles, of which 10 miles will be off shore and 3 miles on shore. The power requirement per line in both subalternatives would be 13 x 42 x 14.1 = 7,000 b.hp.
Intermediate tank farm. The crude oil storage capacities would be as follows: Subalternative A would require 1.88 x 10 6 long tons by 1980, 2.14 x 10 6
long tons by 1984, 2.48 x 10⁴) long tons by 1987, 2.82 x 10 6 long tons by 1990, 3.25 x 10 6 long tons by 1993,

369.
3.66 x 10 6 long tons by 1996, and 4.04 x 10 6 long tons by 1999. Before 1980, 1.88 million long tons of storage capacity would be constructed; additional storage capa-cities of 0.26, 0.34, 0.34, 0.43, 0.41, and 0.38 mil-lion long tons would be constructed in 1983, 1986, 1989, 1992, 1995 and 1998, respectively.
Subalternative B would require 2.14 x 10 6 long tons by 1980, 2.82 x 10 6 long tons by 1984, 3.66 x 10 6
long tons by 1988, 4.45 x 10' long tons by 1992, and 5.29 x 10 6 long tons by 1996. Before 1980, 2.14 mil-lion long tons of storage capacity would be constructed; additional storage capacities of 0.68, 0.84, 0.79, and 0.84 million long tons would be constructed in 1983, 1987, 1991, and 1995, respectively.
For general services an area of 30 acres was estimated. The total acreage requirement would be, for subalternative A, 4.04 x 50 + 30 = about 230 acres; and for subalternative B, 5.29 x 50 + 30 = about 295 acres.
Pipelines from tank farm to refineries. The throughput volumes of the various sections of the pipe-line system are given in table 53. The size of all branch lines was set at 42 inches. The pipe sizes and horsepowers that follow were selected in relation to the anticipated throughputs.
Table 53. Throughputs per Section
1980
Portion of total
through- put
Subalternativ
A
1980
Section
2000 2000
Freeport-Houston 0.90 90 405 135 540 Houston-Beaumont 0.60 60 270 90 360 Beaumont-Lake Charles 0.30 30 135 45 180 Lake Charles-Baton Rouge 0.20 20 90 30 120 Baton Rouge-New Orleans 0.10 10 45 15 60
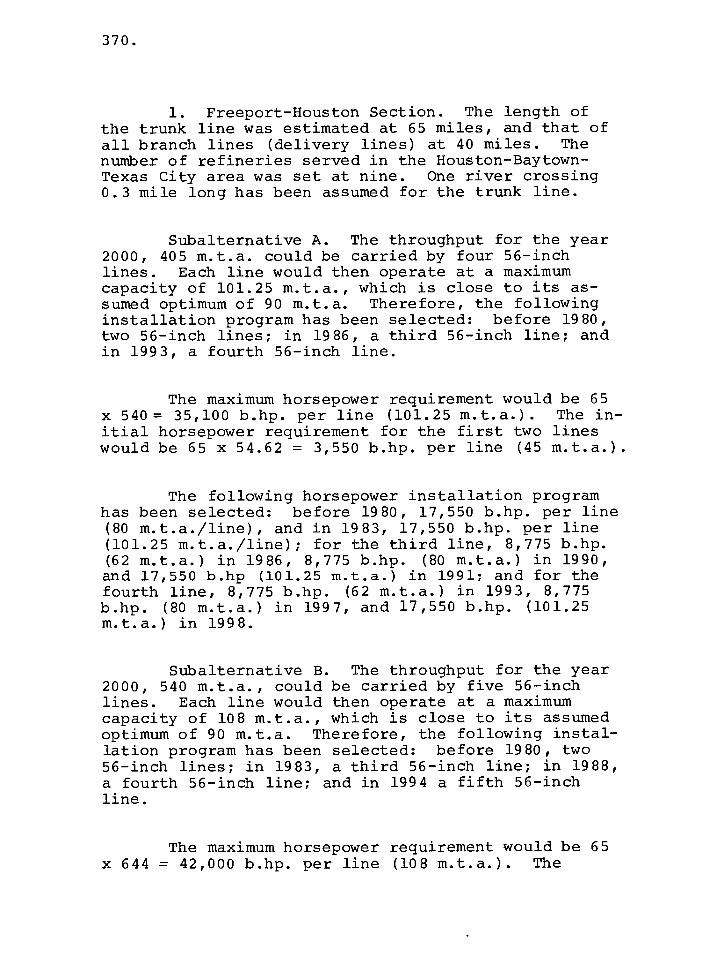
370.
1. Freeport-Houston Section. The length of the trunk line was estimated at 65 miles, and that of all branch lines (delivery lines) at 40 miles. The number of refineries served in the Houston-Baytown-Texas City area was set at nine. One river crossing 0.3 mile long has been assumed for the trunk line.
Subalternative A. The throughput for the year 2000, 405 m.t.a. could be carried by four 56-inch lines. Each line would then operate at a maximum capacity of 101.25 m.t.a., which is close to its as-sumed optimum of 90 m.t.a. Therefore, the following installation program has been selected: before 1980, two 56-inch lines; in 1986, a third 56-inch line; and in 1993, a fourth 56-inch line.
The maximum horsepower requirement would be 65 x 540= 35,100 b.hp. per line (101.25 m.t.a.). The in-itial horsepower requirement for the first two lines would be 65 x 54.62 = 3,550 b.hp. per line (45 m.t.a.).
The following horsepower installation program has been selected: before 1980, 17,550 b.hp. per line (80 m.t.a./line), and in 1983, 17,550 b.hp. per line (101.25 m.t.a./line); for the third line, 8,775 b.hp. (62 m.t.a.) in 1986, 8,775 b.hp. (80 m.t.a.) in 1990, and 17,550 b.hp (101.25 m.t.a.) in 1991; and for the fourth line, 8,775 b.hp. (62 m.t.a.) in 1993, 8,775 b.hp. (80 m.t.a.) in 1997, and 17,550 b.hp. (101.25 m.t.a.) in 1998.
Subalternative B. The throughput for the year 2000, 540 m.t.a., could be carried by five 56-inch lines. Each line would then operate at a maximum capacity of 108 m.t.a., which is close to its assumed optimum of 90 m.t.a. Therefore, the following instal-lation program has been selected: before 1980, two 56-inch lines; in 1983, a third 56-inch line; in 1988, a fourth 56-inch line; and in 1994 a fifth 56-inch line.
The maximum horsepower requirement would be 65 x 644 = 42,000 b.hp. per line (108 m.t.a.). The
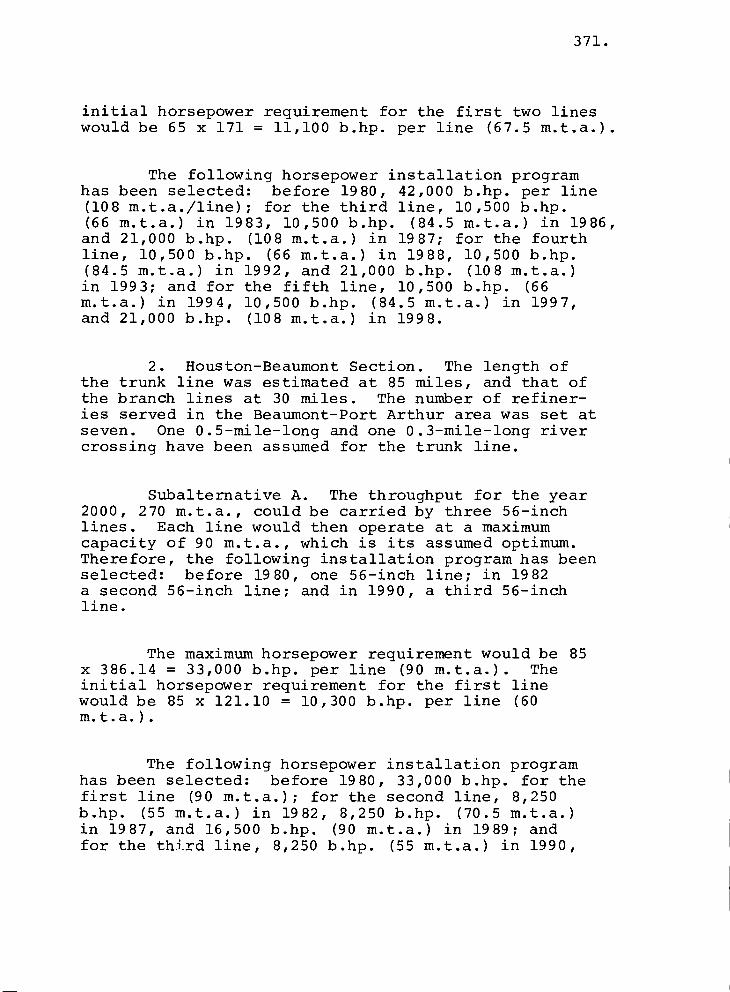
371.
initial horsepower requirement for the first two lines would be 65 x 171 = 11,100 b.hp. per line (67.5 m.t.a.).
The following horsepower installation program has been selected: before 1980, 42,000 b.hp. per line (108 m.t.a./line); for the third line, 10,500 b.hp. (66 m.t.a.) in 1983, 10,500 b.hp. (84.5 m.t.a.) in 1986, and 21,000 b.hp. (108 m.t.a.) in 1987; for the fourth line, 10,500 b.hp. (66 m.t.a.) in 1988, 10,500 b.hp. (84.5 m.t.a.) in 1992, and 21,000 b.hp. (108 m.t.a.) in 1993; and for the fifth line, 10,500 b.hp. (66 m.t.a.) in 1994, 10,500 b.hp. (84.5 m.t.a.) in 1997, and 21,000 b.hp. (108 m.t.a.) in 1998.
2. Houston-Beaumont Section. The length of the trunk line was estimated at 85 miles, and that of the branch lines at 30 miles. The number of refiner-ies served in the Beaumont-Port Arthur area was set at seven. One 0.5-mile-long and one 0.3-mile-long river crossing have been assumed for the trunk line.
Subalternative A. The throughput for the year 2000, 270 m.t.a., could be carried by three 56-inch lines. Each line would then operate at a maximum capacity of 90 m.t.a., which is its assumed optimum. Therefore, the following installation program has been selected: before 1980, one 56-inch line; in 1982 a second 56-inch line; and in 1990, a third 56-inch line.
The maximum horsepower requirement would be 85 x 386.14 = 33,000 b.hp. per line (90 m.t.a.). The initial horsepower requirement for the first line would be 85 x 121.10 = 10,300 b.hp. per line (60 m.t.a.).
The following horsepower installation program has been selected: before 1980, 33,000 b.hp. for the first line (90 m.t.a.); for the second line, 8,250 b.hp. (55 m.t.a.) in 1982, 8,250 b.hp. (70.5 m.t.a.) in 1987, and 16,500 b.hp. (90 m.t.a.) in 1989; and for the third line, 8,250 b.hp. (55 m.t.a.) in 1990,
372.
8,250 b.hp. (70.5 m.t.a.) in 1996, and 16,500 b.hp. (90 m.t.a.) in 1997.
Subalternative B. The throughput for the year 2000, 360 m.t.a., would be carried by four 56-inch lines. Each line would then operate at a maximum capacity of 90 m.t.a., which is its assumed optimum. Therefore, the following installation program has been selected: before 1980, two 56-inch lines; in 1986, a third 56-inch line; and in 1992, a fourth 56-inch line.
The maximum horsepower requirement would be 85 x 386.14 = 33,000 b.hp. per line (90 m.t.a.). The ini-tial horsepower requirement for the first two lines would be 85 x 54.62 = 4,600 b.hp. per line (45 m.t.a.).
The following horsepower installation program has been selected: before 1980, 16,500 b.hp. per line (70.5 m.t.a./line), and in 1983, 16,500 b.hp. per line (90 m.t.a./line); for the third line, 8,250 b.hp. (55 m.t.a.) in 1986, 8,250 b.hp. (70.5 m.t.a.) in 1990, and 16,500 b.hp. (90 m.t.a.) in 1991; and for the fourth line, 8,250 b.hp. (55 m.t.a.) in 1992, 8,250 b.hp. (70.5 m.t.a.) in 1996, and 16,500 b.hp. (90 m.t.a.) in 1998.
3. Beaumont-Lake Charles Section. The length of the trunk line was estimated at 50 miles, and that of all branch lines at 5 miles. The number of re-fineries served in the vicinity of Lake Charles was set at two. One 0.3-mile-long and three 0.2-mile-long river crossings have been assumed for the trunk line.
Subalternative A. The throughput for the year 2000, 135 m.t.a., could be carried by two 48-inch lines. Each line would then operate at a maximum capacity of 67.5 m.t.a., which is close to its assumed optimum of 65 m.t.a. Therefore, the following in-stallation program has been selected: before 1980, one 48-inch line; and in 1986, a second 48-inch line.

373.
The maximum horsepower requirement would be 50 x 370 = 18,500 b.hp. per line (67.5 m.t.a.). The ini- tial horsepower requirement for the first line would be 50 x 37.84 = 1,900 b.hp. (30 m.t.a.).
The following horsepower installation program has been selected: for the first line, 9,250 b.hp. (52.5 m.t.a.) before 1980 and 9,250 b.hp. (67.5 m.t.a.) in 1983; and for the second line, 2,312 b.hp. (32 m.t.a.) in 1986, 2,313 b.hp. (41 m.t.a.) in 1992, 4,625 b.hp. (52.5 m.t.a.) in 1994, and 9,250 b.hp. (67.5 m.t.a.) in 1996.
Subalternative B. The throughput for the year 2000, 180 m.t.a., could be carried by three 48-inch lines or two 56-inch lines. Each line would then operate at a maximum capacity of 60 or 90 m.t.a. res-pectively, which is close to or equal to its assumed optimum of 65 or 90 m.t.a. Because bigger pipelines result in lower transportation costs, the two 56-inch lines are preferred over the three 48-inch lines. Therefore, the following installation program has been selected: before 1980, one 56-inch line; and in 1986, a second 56-inch line.
The maximum horsepower requirement would be 50 x 386.14 = 19,400 b.hp. per line (90 m.t.a.). The in-itial horsepower requirement for the first line would be 50 x 54.62 = 2,730 b.hp. (45 m.t.a.).
The following horsepower installation program has been selected: for the first line, 9,700 b.hp. (70.5 m.t.a.) before 1980, and 9,700 b.hp. (90 m.t.a.) in 1983; and for the second line, 2,425 b.hp (44 m.t.a.) in 1986, 2,425 b.hp. (55 m.t.a.) in 1992, 4,850 b.hp (70.5 m.t.a.) in 1994, and 9,700 b.hp. (90 m.t.a.) in 1996.
4. Lake Charles-Baton Rouge Section. The length of the trunk line was estimated at 130 miles, and that of all branch lines at 5 miles. The number of refineries served in the Baton Rouge region was set

374.
at three. One 0.9-mile-long, one 3-mile-long, and eight 0.2-mile-long river crossings have been assumed for the trunk line.
Subalternative A. The throughput for the year 2000, 90 m.t.a., could be carried by one 48-inch pipe-line as well as by one 56-inch pipeline. The initial throughput would be 20 m.t.a.; the 1990 throughput, 55 m.t.a. Although at the latter throughput both lines would have approximately the same transportation cost, the smaller line is more economical for lower throughputs, and therefore the 48-inch line is a more attractive solution and has thus been selected.
The maximum horsepower requirement would be 130 x 833.26 = 108,000 b.hp. (90 m.t.a.). The initial horsepower requirement would be 130 x 12.31 = 1,600 b.hp. (20 m.t.a.).
The following horsepower installation program has been selected: before 1980, 6,750 b.hp. (33.5 m.t.a.); 6,750 b.hp. (43 m.t.a.) in 1983; 13,500 b.hp. (54.5 m.t.a.) in 1986; 27,000 b.hp. (70.5 m.t.a.) in 1989; and 54,000 b.hp. (90 m.t.a.) in 1993.
Subalternative B. The throughput for the year 2000, 120 m.t.a., could be carried by two 48-inch lines. Each line would then operate at a maximum capacity of 60 m.t.a., which is close to its assumed optimum of 65 m.t.a. Therefore, the following instal-lation program has been selected: before 1980, one 48-inch line; and in 1986, a second 48-inch line.
The maximum horsepower requirement would be 130 x 265.02 = 34,500 b.hp. (60 m.t.a.). The initial horsepower requirement would be 130 x 37.84 = 4,900 b.hp. (30 m.t.a.).
The following horsepower installation program has been selected: for the first line, 17,250 b.hp (46.5 m.t.a.) before 1980, and 17,250 b.hp (60 m.t.a.) in 1983; and for - the second line, 4,312 b.hp. (28

375.
m.t.a.) in 1986, 4,313 b.hp. (36.5 m.t.a.) in 1992, 8,625 b.hp. (46.5 m.t.a.) in 1994, and 17,250 b.hp. (60 m.t.a.) in 1996.
5. Baton Rouge-New Orleans Section. The length of the trunkline was estimated at 80 miles, and that of all branch lines at 10 miles. The number of refineries served in the New Orleans region was set at six. Two 0.2-mile-long river crossings have been assumed for the trunk line.
Subalternative A. The throughput for the year 2000, 45 m.t.a., could be carried by one 32-inch line as well as by one 36- or 42-inch line. Because the 32-inch line is more economical for the first 10 years than are the bigger lines, it is a more attractive solution and has therefore been selected.
The maximum horsepower requirement would be 80 x 923.87 = 74,000 b.hp. (45 m.t.a.). The initial horsepower requirement would be 80 x 13.70 = 1,100 b.hp. (10 m.t.a.).
The following horsepower installation program has been selected: before 1980, 4,625 b.hp. (15.5 m.t.a.); in 1982, 4,625 b.hp. (21 m.t.a.); in 1985, 9,250 b.hp. (27 m.t.a.); in 1989, 18,500 b.hp. (34.5 m.t.a.); and in 1993, 37,000 b.hp. (45 m.t.a.).
Subalternative B. The throughput for the year 2000, 60 m.t.a., could be carried by one 36-inch pipeline as well as by one 42-inch pipeline. The ini-tial throughput would be 15 m.t.a.; the 1990 throughput, 37.5 m.t.a. Since both the 36-inch and the 42-inch lines would have approximately the same transportation cost at a throughput of 29 m.t.a., which would be reached in 1986, the 42-inch line seems to be a more attractive solution for the entire 20-year period. Therefore, one 42-inch line has been selected.

376.
The maximum horsepower requirement would be 80 x 519.36 = 42,000 b.hp. (60 m.t.a.). The initial horsepower requirement would be 80 x 10.68 = 850 b.hp. (15 m.t.a.).
The following horsepower installation program has been selected: before 1980, 2,625 b.hp. (22 m.t.a.); in 1982, 2.625 b.hp (28.5 m.t.a.); in 1985, 5,250 b.hp. (36.5 m.t.a.); in 1989, 10,500 b.hp (47 m.t.a.); and in 1993, 21,000 b.hp. (60 m.t.a.).
Transshipment berths. The annual throughput of transshipment berths is given in table 54.
Table 54. Annual Throughputs by Transshipment Barge
(In millions of tons)
Portion of total
through put
Subalternati
A
198012000
Service area
1980
ve
2000
Corpus Christi and Pascagoula 0.10 10 45 15 60
According to table 20, the number of berths re-quired would be, for subalternatives A and B, two berths by 1980, and none additional from 1980 to 2000.
Pipelines from tank farm to transshipment berths. One 48-inch line would be required. Each line would be 3 miles long and would run on land. Each line would require 1,600 b.hp.
Figures 26 and 29 show the location and layout of the deepwater port. Figure 28 depicts the assumed pipeline route to the various refinery areas.

377.
Alternative 5-2
Criteria
1. Site of deepwater port: In the Gulf of Mex-ico, 22 miles off Freeport.
2. Service area and type of transshipment: Refineries at Houston, Beaumont, Lake Charles, Baton Rouge and New Orleans, by pipeline; and refineries at Corpus Christi and Pascagoula, by transshipment ves-sels.
3. Type of berths: Monobuoys. 4. Site of tanks: Near Freeport. 5. Draft of tankers: 70 feet fully loaded. 6. Subalternatives: The throughputs of the
various subalternatives, and the size of the vessels they will serve, are given in table 55.
Table 55. Throughputs and Size of Vessels Served by Subalternatives
Vessel size (d.w.t.)
Throu (million
hput ons/year) Subalternatives
1980 2000
A 300,000 300,000 400,000 400,000
100 450 150 600 100 450 150 600
7. Projected flow: Houston and Beaumont, 30 percent each; Lake Charles, Baton Rouge, and New Or-leans, 10 percent each; and Corpus Christi and Pasca-goula, 5 percent each.
Requirements
Supertanker berths. The number of berths re-quired would be the same as that for alternative 4-2. Subalternative A would require three buoys by 1980, four buoys by 1983, five buoys by 1987, six buoys by
378.
1991, seven buoys by 1995, and eight buoys by 1998. Three buoys would be installed before 1980; one buoy would be installed in each of the years 1982, 1986, 1990, 1994, and 1997.
Subalternative B would require four buoys by 1980, five buoys by 1983, six buoys by 1986, seven buoys by 1989, eight buoys by 1992, nine buoys by 1995, and 10 buoys by 1997. Four buoys would be installed before 1980; one buoy would be installed in each of the years 1982, 1985, 1988, 1991, 1994, and 1996.
Subalternative C would require three buoys by 1980, four buoys by 1984, five buoys by 1989, six buoys by 1994, and seven buoys by 1998. Three buoys would be installed before 1980; one buoy would be installed in each of the years 1983, 1988, 1993, and 1997.
Subalternative D would require four buoys by 1980, five buoys by 1985, six buoys by 1988, seven buoys by 1991, eight buoys by 1995, and nine buoys by 1998. Four buoys would be installed before 1980; one buoy would be installed in each of the years 1984, 1987, 1990, 1994, and 1997.
Dredging Quantities. No dredging would be required.
Water depth of maneuvering area. The required water depth of the maneuvering area would be 81 feet (see table 5).
Pipelines from berths to intermediate tank farm. One 48-inch line per monobuoy would be required. Each line would be about 25 miles long, of which 22 miles would be off shore and 3 miles on land.
Each offshore line would run from a buoy to a booster station located at a maximum distance of 2.5 miles from the easternmost and westernmost buoys. The Ship has a pressure of 150 p.s.i. at the manifold, 70 p.s.i. of which are lost in the hoses. The available

379.
pressure remaining at the booster station is thus, in subalternatives A and B, 150 -70 -(2.5 x 17.4) = 36 p.s.i., and in subalternatives C and D, 150 -70 -(2.5 x 21.2) = 27 p.s.i., both of which are greater than the required minimum 25 p.s.i. In all subalternatives one booster platform would be sufficient for the initial period. Second platforms would be required in 1987, 1986, 1989 and 1988 for subalternatives A, B, C, and D, respectively, and would be installed 1 year prior to their requirement. The required horsepower per line is 22.5 x 42 x 14.1 = 13,300 b.hp.
Intermediate tank farm. The crude oil storage capacities required would be a§ follows: Subalterna-tive A would require 1.81 x 10 ° long tons by 1980, 2.24 x 10 6 long tons by 1983, 2.51 x 10 6 long tons by 1987, 2.87 x 10 6 long tons by 1991, 3.34 x 10 6 long tons by 1995, and 3.83 x 10 6 long tons by 1998. Before 1980, 1.81 million long tons of storage capacity would be con-structed; additional storage capacities of 0.43, 0.27, 0.36, 0.47, and 0.49 million long tons would be con-structed in 1982, 1986, 1990, 1994, and 1997, respec-tively.
Subalternative B would require 2.24 x 10 6 long tons by 1980, 2.51 x 10 6 long tons by 1983, 2.87 x 10 6
long tons by 1986, 3.34 x 10° long tons by 1989, 3.83 x 10 6 long tons by 1992, 4.30 x 10 6 long tons by 1995, and 4.75 x 10 6 long tons by 1997. Before 1980, 2.24 million long tons of storage capacity would be con-structed; additional storage capacities of 0.27, 0.36, 0.47, 0.49, 0.47, and 0.45 million long tons would be constructed in 1982, 1985, 1988, 1991, 1994, and 1996, respectively.
Subalternative C would require 2.15 x 10 6 long tons by 1980, 2.67 x 10 6 long tons by 1984, 3.04 x 10 °
long tons by 1989, 3.55 x 10° long tons by 1994, and 4.09 x 10 6 long tons by 1998. Before 1980, 2.15 mil-lion long tons of storage capacity would be constructed; additional storage capacities of 0.52, 0.37, 0.51, and 0.54 million long tons would be constructed in 1983, 1988, 1993, and 1997, respectively.

380.
Subalternative D would require 2.67 x 10 6 long tons by 1980, 3.04 x 10 6 long tons by 1985, 3.55 x 10 6
long tons by 1988, 4.09 x 10' long tons by 1991, 4.69 x 10 6 long tons by 1995, and 5.29 x 10 6 long tons by 1998. Before 1980, 2.67 million long tons of storage capacity would be constructed; additional storage capacities of 0.37, 0.51, 0.54, 0.60, and 0.60 mil-lion long tons would be constructed in 1984, 1987, 1990, 1994, and 1997, respectively.
For general services an area of 30 acres was es-timated. The total acreage requirement would be, for subalternative A, 3.83 x 50 + 30 = about 220 acres; for subalternative B, 4.75 x 50 + 30 = about 270 acres; for subalternative C, 4.09 x 50 + 30 = about 235 acres; and for subalternative D, 5.29 x 50 + 30 = about 295 acres.
Pipelines and booster stations from tank farm to refineries. Subalternatives A and C have the same re-quirements as subalternative A of alternative 5-1. Sub-alternatives B and D have the same requirements as sub-alternative B of alternative 5-1.
Transshipment berths. The requirements are the same as those for alternative 5-1.
Pipelines from tank farm to transshipment berths. One 48-inch line would be required. Each line would be 3 miles long, would run on land, and would require 1,600 b.hp.
Figure 26 presents the location and layout of the deepwater port. Figure 25 shows the assumed pipeline route to the various refinery areas.
Alternative 5-3
Criteria
1. Site of deepwater port: In Gulf of Mexico, 34 miles off Freeport.
381.
2. Service area and type of transshipment: Re-fineries at Houston, Beaumont, Lake Charles, Baton Rouge, and New Orleans, by pipeline; and refineries at Corpus Christi and Pascagoula, by transshipment ves-sels.
3. Type of berths: Monobuoys. 4. Site of tanks: Near Freeport. 5. Draft of tankers: 95 feet fully loaded. 6. Subalternatives: The throughputs of the var-
ious subalternatives, and the size of the vessels they will serve, are given in table 56.
Table 56. Throughputs and Size of Vessels Served by Subalternatives
Vessel size (d.w.t.)
Thro (Million
ughput tons/year) Subalternatives
1980 2000
A B
500,000 100 450
500,000 150 600
7. Projected flow: Houston and Beaumont, 30 percent each; Lake Charles, Baton Rouge and New Orleans, 10 percent each; and Corpus Christi and Pascagoula, 5 percent each.
Requirements
Supertanker berths. The number of berths re-quired would be the same as that for alternative 4-3. Subalternative A would require three buoys by 1980, four buoys by 1985, five buoys by 1990, six buoys by 1994, and seven buoys by 1999. Three buoys would be installed before 1980; one buoy would be installed in each of the years 1984, 1989, 1993, and 1998.
Subalternative B would require four buoys by 1980, five buoys by 1985, six buoys by 1989, seven
382.
buoys by 1993, eight buoys by 1996, and nine buoys by 1999. Four buoys would be installed before 1980; one buoy would be installed in each of the years 1984, 1988, 1992, 1995, and 1998.
Dredging quantities. No dredging would be re- quired.
Water depth of maneuvering area. The required water depth of the maneuvering area would be 109 feet (see table 5).
Pipelines from berths to intermediate tank farm. One 48-inch line per monobuoy would be required. Each line would be about 37 miles long, of which 34 miles would be off shore and 3 miles on land.
Each offshore line would run from a buoy to a booster station located at a maximum distance of 2.5 miles from the easternmost and westernmost buoys. The ship has a pressure of 150 p.s.i. at the manifold, 70 p.s.i. of which are lost in the hoses. The available pressure remaining at the booster station would thus be 150 -70 -(2.5 x 21.2) = 27 p.s.i., which is greater than the required minimum of 25 p.s.i. In both subal- ternatives, one booster platform would be sufficient for the initial period. Second platforms would be required in 1990 and 1989 for subalternatives A and B, respec-tively. It is assumed that the contruction of the second platform would take place during the year prior to its requirement. The required horsepower per line would be 34.5 x 42 x 14.1 = 20,500 b.hp.
Intermediate tank farm. The crude oil storage capacities required would be as follows: Subalternative A would require 2.17 x 10 6 long tons by 1980, 2.69 x 10 6 long tons by 1985, 3.04 x 10 6 long tons by 1990, 3.47 x 10 6 long tons by 1994, and 4.07 x 10 6 long tons by 1999. Before 1980, 2.17 million long tons of stor-age capacity would be constructed; additional storage capacities of 0.52, 0.35, 0.43, and 0.60 million long tons would be constructed in 1984, 1989, 1993, and 1998, respectively.

383.
Subalternative B would require 2.69 x 10 6 long tons by 1980, 3.04 x 10 6 long tons by 1985, 3.47 x 10 6
long tons by 1989, 4.07 x 10⁶ long tons by 1993, 4.62 x 10 6 long tons by 1996, and 5.20 x 10 6 long tons by 1999. Before 1980, 2.69 million long tons of storage capacity would be constructed; additional storage capa-cities of 0.35, 0.43, 0.60, 0.55, and 0.58 million long tons would be constructed in 1984, 1988, 1992, 1995, and 1998, respectively.
For general services an area of 30 acres was es-timated. The total acreage requirement would be, for subalternative A, 4.07 x 50 + 30 = about 235 acres; and for subalternative B, 5.20 x 50 + 30 = about 290 acres.
Pipelines and booster stations from tank farm to refineries. Subalternative A would have the same re-quirements as subalternative A of alternative 5-1. Sub-alternative B would have the same requirements as sub-alternative B of alternative 5-1.
Transshipment berths. The requirements would be the same as those of alternative 5-1.
Pipelines from tank farm to transshipment berths. One 48-inch line would be required. Each line would be 3 miles long, would run on land, and would require 1,600 b.hp.
Figure 26 presents the location and layout of the deepwater port. Figure 28 depicts the assumed pipe-line route to the various refinery areas.
Alternative 5-4
Criteria
1. Site of deepwater port: Inland near Free-port.
2. Service area and type of transshipment: Re-fineries at Houston, Beaumont, Lake Charles, Baton Rouge, and New Orleans, by pipeline; and refineries at Corpus Christi and Pascagoula, by transshipment vessels.

384.
3. Type of berths: Fixed. 4. Site of tanks: Near Freeport. 5. Draft of tankers: 55 feet fully loaded. 6. Subalternatives: The throughputs of the var-
ious subalternatives, and the size of the vessels they will serve, are given in table 57.
Table 57. Throughputs and Size of Vessels Served by Subalternatives
Subalternative Vessel size (d.w.t.)
Throu (million
ghput tons/year)
1980 2000
A
200,000 100 450
200,000 150 600
7. Projected flow: Houston and Beaumont, 30 percent each; Lake Charles, Baton Rouge and New Orleans, 10 percent each; and Corpus Christi and Pascagoula, 5 percent each.
Requirements
Supertanker berths. The number of berths re-quired would be the same as that for alternative 4-1. Subalternative A would require four berths by 1980, five berths by 1984, six berths by 1987, seven berths by 1990, eight berths by 1993, nine berths by 1996, and 10 berths by 1999. Four berths would be constructed before 1980; two berths would be constructed in each of the years 1983, 1989, and 1995.
Subalternative B would require five berths by 1980, six berths by 1984, seven berths by 1986, eight berths by 1988, nine berths by 1990, 10 berths by 1992, 11 berths by 1994, 12 berths by 1996, and 13 berths by 1999. Six berths would be constructed before 1980; two berths would be constructed in each of the years 1985, 1989, and 1993. The last berth would be constructed in 1998.

385.
Dredging quantities. The quantities to be dredged would be as follows:
1. Ocean channel. Less than 10 miles off shore the channel width would be 690 feet, and the channel depth, 63 feet. Over 10 miles off shore the width would be 865 feet and the depth, 66 feet.
The total length of channel would be 12 miles; the average depth per mile would be 12, 24, 30, 36, 44, 50, 55, 57, 59, 62, 64, and 65 feet. The total quantity to be dredged per mile, including 3 feet of overdepth dredging would be 9.0, 6.7, 5.6, 4.6, 3.3, 2.3, 1.6, 1.3, 1.0, 04, 0.9, and 0.7 x 10 6 cubic yards, or a total of 37.6 x 10 ° cubic yards.
2. Turning basins and inland channels. The cut through the coastline is the approach channel to the outer turning basin. The dimensions of this canal would be: width, 690 feet; depth, 63 feet; and length, 1,300 feet. Dredging quantity, including 3 feet of overdepth dredging and assuming an average terrain ele-vation of +4 feet, would equal 3.3 x 10 6 cubic yards.
The dimensions of the outer turning basin would be: radius, 1,575 feet; and water depth, 61 feet. Dredging quantity, including 3 feet of overdepth dred-ging and assuming an average terrain elevation at -4 feet, would equal 6.8 x 100 cubic yards.
The dimensions of the channel between outer and inner turning basin would be: water depth 61 feet; length, about 1,700 feet; and width, 605 feet. Dred-ging quantity, including 3 feet of overdepth dredging and assuming an average terrain elevation at -4 feet, would equal 3.0 x 10 6 cubic yards.
The dimensions of the inner turning basin would be: water depth, 61 feet; length, 3,135 feet (serving four berths), 4,000 feet (serving six berths), 4,865 feet (serving eight berths), 5,725 feet (serving 10 berths), or

386.
6,760 feet (serving 13 berths); and width, 1,575 feet. Dredging quantities, including 3 feet of overdepth dredging and assuming an average terrain elevation at -4 feet, would be as follows:
Subalternative A would require dFedging of 11.2 x 10 6 cubic yards before 1980, 3.1 x 10 cubic yaFds by 1982, 3.1 x 10 6 cubic yards by 1988, and 3.1 x 10' cubic yards by 1994.
Subalternative B would require dFedging of 14.3 x 10 6 cubic yards before 1980, 3.1 x 10' cubic yards by 1984, 3.1 x 10 6 cubic yards by 1988, and 3.6 x 10 6
cubic yards by 1992.
The dimensions of the berthing areas would be: water depth, 58 feet; length, 1,575 feet; and width, 2,080 feet (4 berths), 2,940 feet (6 berths), 3,810 feet (8 berths), 4,680 feet (10 berths), or 5,715 feet (13 berths). Dredging quantities, including 3 feet of overdepth dredging and assuming an average terrain elevation of 0 feet, would be as follows:
Subalternative A would require 4 .edging of 7.4 x 10 6 cubic yards before 1980, 3.1 x 10 0 cubic yards by 1982, 3.1 x 10 6 cubic yards by 1988, and 3.1 x 10 6
cubic yards by 1994.
,Subalternative B would require dredging of 10.5 x 10 6 cubic yards before 1980, 3.1 x 10 6 cubic yards by 1984, 3.1 x 10 6 cubic yards by 1988, and 3.6 x 10 6
cubic yards by 1992.
The dimensions of the exit channel would be: water depth, 1.1 x 0.5 x 55 = 30 feet; width, 690 feet (coastal wind is beam on); and length, about 8,000 feet. Dredging quantity, including 2 feet of overdepth dredging and assuming an average terrain elevation of -5 feet, would equal 5.6 x 10 6 cubic yards.
387.
Total dredging quantities for the ocean channel would equal 37.6 x 10 6 cubic yards. For all inland basins and channels these quantities would equal the following:
Subalternative A would require dredging of 37.3 x 10 6 cubic yards before 1980, 6.2 x 10⁶ cubic yards by 1982, 6.2 x 10 6 cubic yards by 1988, and 6.2 x 10 6
cubic yards by 1994.
Subalternative B would require dredging of 43.5 x 10 6 cubic yards before 1980, 6.2 x 10 6 cubic yards, by 1984, 6.2 x 10 6 cubic yards by 1988, and 7.2 x 10 °
cubic yards by 1992.
Pipelines from berths to intermediate tank farm. One 48-inch line per berth would be required. Each line would be supported by a trestle for about 800 feet, and would then continue on land for about 2 miles to the tanks of the tank farm. No booster stations are required.
Intermediate tank farm. The crude oil storage capacities required would be the same as those for al-ternative 4-1. Subalternative A would require 1.88 x 10 6 long tons by 1980, 2.48 x 10 6 long tons by 1984, 3.25 x 10° long tons by 1990, and 4.04 x 10 6 long tons by 1996. Before 1980, 1.88 million long tons of storage capacity would be constructed; additional stor-age capacities of 0.60, 0.77, and 0.79 million long tons would be constructed in 1983, 1989, and 1995, respectively.
Subalternative B would require 2.48 x 10 6 long, tons by 1980, 3.25 x 10 6 long tons by 1986, 4.04 x 10 °
long tons by 1990, 4.87 x 10° long tons by 1994, and 5.29 x 10 6 long tons by 1999. Before 1980, 2.48 mil-lion long tons of storage capacity would be constructed; 0.77, 0.79, 0.83, and 0.42 million long tons would be constructed in 1985, 1989, 1993, and 1998, respectively.

388.
For general services an area of 30 acres was estimated. The total acreage requirement would be, for subalternative A, 4.04 x 50 + 30 = about 230 acres; and for subalternative B, 5.29 x 50 + 30 = about 295 acres.
Pipelines and booster stations from tank farm to refineries. Subalternative A would have the same re-quirements as subalternative A of alternative 5-1. Subalternative B would have the same requirements as subalternative B of alternative 5-1.
Transshipment berths. The requirement would be the same as that for alternative 5-1.
Pipelines from tank farm to transshipment berths. One 48-inch line per berth would be required. Each line would be 3 miles long, would run on land, and would require 1,600 b.hp.
Figures 27 and 30 show the location and layout of the deepwater port. Figure 28 shows the assumed pipeline route to the various refinery areas.
Alternative 5-5
Criteria
1. Site of deepwater port: Inland, near Free-port.
2. Service area and type of transshipment: Refineries at Houston, Beaumont, Lake Charles, Baton Rouge and New Orleans, by pipeline; and refineries at Corpus Christi and Pascagoula, by transshipment ves-sels.
3. Type of berths: Fixed. 4. Site of tanks: Near Freeport. 5. Draft of tankers: 70 feet fully loaded. 6. Subalternatives: The throughputs of the var-
ious subalternatives, and the size of the vessels they will serve, are given in table 58.
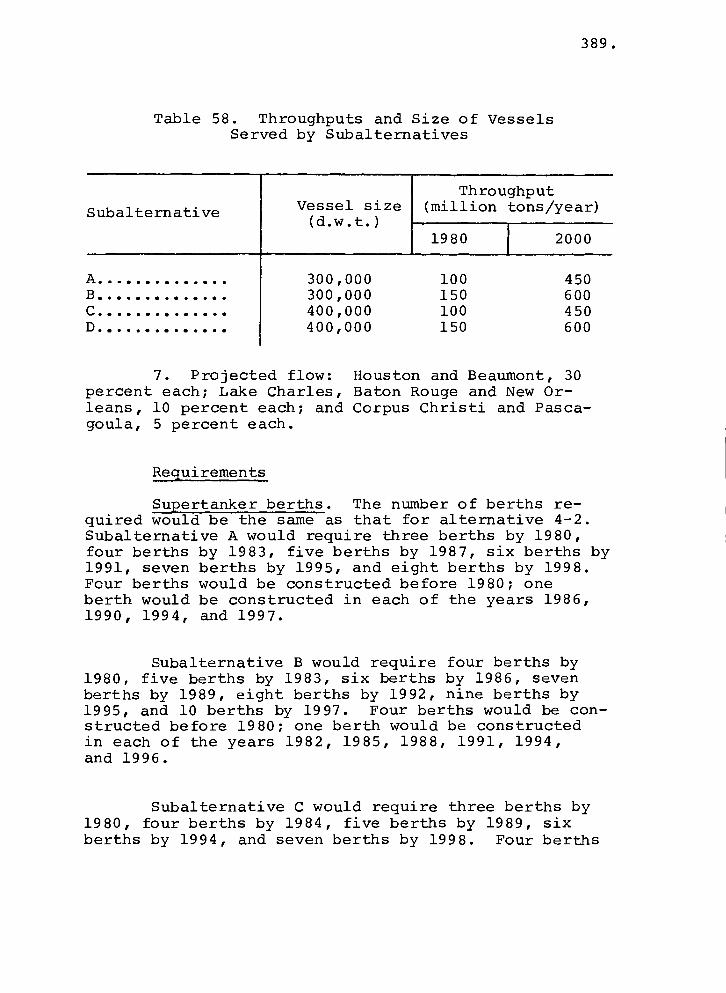
300,000 300,000 400,000 400,000
100 150 100 150
450 600 450 600
389.
Table 58. Throughputs and Size of Vessels Served by Subalternatives
Subalternative Vessel size (d.w.t.)
Throu (million
ghput tons/year)
1980 2000
A
7. Projected flow: Houston and Beaumont, 30 percent each; Lake Charles, Baton Rouge and New Or-leans, 10 percent each; and Corpus Christi and Pasca-goula, 5 percent each.
Requirements
Supertanker berths. The number of berths re-quired would be the same as that for alternative 4-2. Subalternative A would require three berths by 1980, four berths by 1983, five berths by 1987, six berths by 1991, seven berths by 1995, and eight berths by 1998. Four berths would be constructed before 1980; one berth would be constructed in each of the years 1986, 1990, 1994, and 1997.
Subalternative B would require four berths by 1980, five berths by 1983, six berths by 1986, seven berths by 1989, eight berths by 1992, nine berths by 1995, and 10 berths by 1997. Four berths would be con-structed before 1980; one berth would be constructed in each of the years 1982, 1985, 1988, 1991, 1994, and 1996.
Subalternative C would require three berths by 1980, four berths by 1984, five berths by 1989, six berths by 1994, and seven berths by 1998. Four berths

390.
would be constructed before 1980; one berth would be constructed in each of the years 1988, 1993, and 1997.
Subalternative D would require four berths by 1980, five berths by 1985, six berths by 1988, seven berths by 1991, eight berths by 1995, and nine berths by 1998. Four berths would be constructed before 1980; one berth would be constructed in each of the years 1984, 1987, 1990, 1994, and 1997.
Dredging quantities. The quantities to be dred-ged would be as follows:
1. Ocean channel. Less than 10 miles offshore, the channel width would be 770 feet, and the channel depth, 81 feet, for subalternatives A and B; for sub-alternatives C and D these dimensions would be 880 feet and 81 feet, respectively. Over 10 miles offshore, the width would be 960 feet and the depth 84 feet for subalternatives A and B, and 1,100 feet and 84 feet for subalternatives C and D.
The total length of channel would be 24 miles; the average depth per mile would be 12, 24, 30, 36, 44, 50, 55, 57, 59, 62, 64, 65, 66, 66, 66, 66, 66, 67, 68, 69, 73, 77, 79, and 82 feet. The total quantity to be dredged per mile, including 4 feet of overdepth dredging, would be, for subalternatives A and B, 14.1, 11.4, 10.1, 8.8, 7.2; 6.0, 5.0, 4.7, 4.3, 3.7, 4.8, 4.6, 4.4, 4.4, 4.4, 4.4, 4.4, 4.2, 4.0, 3.8, 3.0, 2.2, 1.7, and 1.1 million cubic yards, or a total of 126.7 x 10 6 cubic yards; and for subalternatives C and D, 15.7, 12.7, 11.2, 9.8, 8.0, 6.7, 5.7, 5.3, 4.9, 4.3, 5.5, 5.0, 5.0, 5.0, 5.0, 5.0, 4.8, 4.5, 4.3, 3.4, 2.4, 2.0, and 1.3 million cubic yards, or a total of 142.8 x 10 6 cubic yards.
2. Turning basins and inland channels. The cut through the coastline is the approach channel to the outer turning basin. The dimensions of this canal would be: depth, = 81 feet; width of subalternatives A and B, 770 feet, and of subalternatives C and D,
391.
880 feet; and length, 1,300 feet. Dredging quantities, including 4 feet of overdepth dredging and assuming an average terrain elevation at +4 feet, would equal: for subalternatives A and B, 4.5 x 10⁶ cubic yards; and for subalternatives C and D, 4.9 x 10' cubic yards.
The dimensions of the outer turning basin would be: water depth, 77 feet; and radius of subalternatives A and B, 1,650 feet, and of subalternatives C and D, 1,900 feet. Dredging quantities, including 4 feet of overdepth dredging and assuming an average terrain ele-vation at -4 feet, would equal: for subalternatives A and B, 10.1 x 10 6 pubic yards; and for subalternatives C and D, 12.9 x 10 ° cubic yards.
The dimensions of the channel between outer and inner turning basin would be: depth, 77 feet; length, 1,700 feet; and width of subalternatives A and B, 670 feet, and of subalternatives C and D, 770 feet. Dred-ging quantities, including 4 feet of overdepth dredging and assuming an average terrain elevation at -4 feet, would equal for subalternatives A and B, 4.4 x 10 6
cubic yards, and for subalternatives C and D, 4.8 x 10 6 cubic yards.
The dimensions of the inner turning basin would be: depth, 77 feet; width of subalternatives A and B, 1,650 feet, and of subalternatives C and D, 1,900 feet; and length of subalternatives A and B, 3,380 feet (serving four berths), 4,340 feet (serving six berths), 5,300 feet (serving eight berths), and 6,260 feet (serving 10 berths), and of subalternatives C and D, 3,880 feet (serving four berths), 4,980 feet (serving six berths), 5,200 feet (serving seven berths), and 6,300 feet (serving nine berths). Dredging quantities, including 4 feet of overdepth dredging and assuming an average terrain elevation at -4 feet, would equal the following: for subalternative A, 15.9 x 10 6 cubic yards before 1980, 4.5 x 10 6 cubic yards by 1985, and 4.5 x 10 6 cubic yards by 1993; for subalternative B, 15.9 x 19 6 cubic yards before 1980, 4.5 x 46 by 1981, 4.5 x 10 ° cubic yards by 1987, and 4.5 x 10 cubic yards by 1993; for subalternatiye C, 21.0 x 10 6 cubic yards before 1980, and 7.2 x 10 0 cubic yards by 1987;

392.
and for subalternative D, 21.0 x 10 6 cubic yards efore 1980, 6.0 x 10 6 cubic yards by 1983, and 7.2 x 10' cubic yards by 1989.
The dimensions of the berthing areas would be: depth, 74 feet; length of subalternatives A and B, 1,650 feet, and of subalternatives C and D, 1,900 feet; and width of subalternatives A and B, 2,300 feet (four berths), 3,265 feet (six berths), 4,225 feet (eight berths), and 5,185 feet (10 berths), and of subalter-natives C and D, 2,640 feet (four berths), 3,740 feet six berths), 3,960 feet (seven berths), and 5,060 feet (nine berths). Dredging quantities, including 4 feet of overdepth dredging and assuming an average terrain elevation of 0 feet, would equal the following: for subalternative A, 11.0 x 10 6 cubic yards before 1980, 4.5 x 10 6 cubic yards by 1985, and 4.5 x 10 6 cubic yards by 1993; for subalternative B, 11.0 x 10 6 cubic yards before 1980, 4.5 x 10 6 cubic yards by 1981, 4.5 x 10 6 cubic yards by 1987, and 4.5 x 10 6 cubic yards by 1993; for subalternative C, 14.5 x 10 6 cubic yards before 1980, and 7.2 x 10 6 cubic yards by 1987; and for subalternative D, 14.5 x 10 6 cubic yards before 1980, 6.0 x 10 6 cubic yards by 1983, and 7.2 x 10 6
cubic yards by 1989.
The dimensions of the exit channel would be: depth, 1.1 x 0.5 x 70 = 39 feet; width of subalterna-tives A and B, 770 feet, and of subalternatives C and D, 880 feet; and length, about 8,000 feet. Dredging quantities, including 2 feet of overdepth dredging and assuming an average terrain elevation of -5 feet, would equal: for subalternatives A and B, 9.3 x 10 6 cubic yards; and for subalternatives C and D, 10.6 x 10 6 cubic yards.
Total dredging quantities for the ocean channel would equal: for subalternatives A and B, 126.7 x 10 6 cubic yards; and for subalternatives C and D, 142.8 x 10 6 cubic yards. For all inland basins and channels these quantities would equal the following:

393.
Subalternative A would require dredging of 55.2 x 10 6 cubic yards before 1980, 9.0 x 10 6 cubic yards by 1985, and 9.0 x 10 6 cubic yards by 1993. Subalterna-tive B would require dredging of 55.2 x 10 6 cubic yards before 1980, 9.0 x 10 6 cubic yards by 1981, 9.0 x 10 6
cubic yards by 1987, and 9.0 x 10⁶ cubic yards by 1993. Subalternative C would require dredging of 68.7 x 10 6
cubic yards before 1980, and 14.4 x 10° cubic yards by 1987. Subalternative D would require dredging of 68.7 x 10 6 cubic yards before 1980, 12.0 x 10 ° cubic yards by 1983, and 14.4 x 10 6 cubic yards by 1989.
Pipelines from berths to intermediate tank farm. One 48-inch line per berth would be required. Each line would be supported by a trestle for about 800 feet, and would then continue about 2 miles on land to the tanks of the tank farm. No booster stations are re-quired.
Intermediate tank farm. The crude oil storage capacities required would be the same as those for a4ernative 4-2. Subalternative A would require 2.24 x 10 ° long tons by 1980, 2.51 x 10 6 long tons by 1987, 2.87 x 10 6 long tons by 1991, 3.34 x 10 6 long tons by 1995, and 3.83 x 10° long tons by 1998. Before 1980, 2.24 million tons of storage capacity would be constructed; additional storage capacities of 0.27, 0.36, 0.47, and 0.49 million long tons would be con-structed in 1985, 1990, 1994, and 1997 respectively.
Subalternative B would require 2.24 x 10 6 long tons by 1980, 2.51 x 10 6 long tons by 1983, 2.87 x 10 6
long tons by 1986, 3.34 x 10° long tons by 1989, 3.83 x 10 6 long tons by 1992, 4.30 x 10 6 long tons by 1995, and 4.75 x 10 6 long tons by 1997. Before 1980, 2.24 million long tons of storage capacity would be con-structed; additional storage capacities of 0.27, 0.36, 0.47, 0.49, 0.47, and 0.45 million long tons would be constructed in 1982, 1985, 1988, 1991, 1994, and 1996, respectively.

394.
Subalternative C would require 2.67 x 10 6 long tons by 1980, 3.04 x 10 6 long tons by 1989, 3.55 x 10 6
long tons by 1994, and 4.09 x 10⁶ long tons by 1998. Before 1980, 2.67 million long tons of storage capa-city would be constructed; additional storage capaci-ties of 0.37, 0.51, and 0.54 million long tons would be constructed in 1988, 1993, and 1997 respectively.
Subalternative D would require 2.67 x 10 6 1ong, tons by 1980, 3.04 x 10 6 long tons by 1985, 3.55 x 10 °
long tons by 1988, 4.09 x 10° long tons by 1991, 4.69 x 10 6 long tons by 1995, and 5.29 x 10 6 long tons by 1998. Before 1980, 2.67 million long tons of storage capacity would be constructed; additional storage capacities of 0.37, 0.51, 0.54, 0.60 and 0.60 million long tons would be constructed in 1984, 1987, 1990, 1994, and 1997, respectively.
For general services an area of 30 acres was estimated. The total average requirement would be: for subalternative A, 3.83 x 50 + 30 = about 220 acres; for subalternative B, 4.75 x 50 + 30 = about 270 acres; for subalternative C, 4.09 x 50 + 30 = about 235 acres; and for subalternative D, 5.29 x 50 + 30 = about 295 acres.
Pipelines and booster stations from tank farm to refineries. Subalternatives A and C would have the same requirements as subalternative A of alternative 5-1. Subalternatives B and D would have the same re-quirements as subalternative B of alternative 5-1.
Transshipment berths. The requirements would be the same as those for alternative 5-1.
Pipelines from tank farm to transshipment berths. One 48-inch line per berth would be required. Each line would be 3 miles long, would run on land, and would re-quire 1,600 b.hp.

395.
Figures 27 and 30 show the location and layout of the deepwater port. Figure 28 shows the assumed pipeline route to the various refinery areas.
Alternative 5-6
Criteria
1. Site of deepwater port: Inland, near Free-port.
2. Service area and type of transshipment: Re-fineries at Houston, Beaumont, Lake Charles, Baton Rouge and New Orleans, by pipeline; and refineries at Corpus Christi and Pascagoula, by transshipment vessels.
3. Type of berths: Fixed. 4. Site of tanks: Near Freeport. 5. Draft of tankers: 95 feet fully loaded. 6. Subalternatives: The throughputs of the var-
ious subalternatives, and the size of the vessels they will serve, are given in table 59.
Table 59. Throughputs and Size of Vessels Served by Subalternatives
Subalternative Vessel size (d.w.t.)
Throu (million
ghput tons/year)
2000 1980
A 500,000 500,000
100 450 150 600
7. Projected flow: Houston and Beaumont, 30 percent each; Lake Charles, Baton Rouge, and New Or-leans, 10 percent each; and Corpus Christi and Pasca-goula, 5 percent each.
Requirements
Supertanker berths. The number of berths re-quired would be the same as those for alternative 4-3.

396.
Subalternative A would require three berths by 1980, four berths by 1985, five berths by 1990, six berths by 1994, and seven berths by 1999. Three berths would be constructed before 1980; one berth would be construc-ted in each of the years 1984, 1989, 1993, and 1998.
Subalternative B would require four berths by 1980, five berths by 1985, six berths by 1989, seven berths by 1993, eight berths by 1996, and nine berths by 1999. Four berths would be constructed before 1980; one berth would be constructed in each of the years 1984, 1988, 1992, 1995 and 1998.
Dredging quantities. The quantities to be dredged would be as follows:
1. Ocean channel. Less than 10 miles off shore, the channel width would be 830 feet and the channel depth, 109 feet. Over 10 miles off shore, the width would be 1,040 feet and the depth 114 feet.
The total channel length would be 45 miles; the average depth per mile would be 12,24, 30, 36, 44, 50, 55, 57, 59, 62, 64, 65, 66, 66, 66, 66, 66, 67, 68, 69, 73, 77, 79, 82, 85, 87, 89, 90, 91, 92, 93, 94, 95, 96, 98, 100, 102, 104, 106, 108, 110, 111, 113, 115, and 118 feet. The total quantity to be dredged per mile, including 5 feet of overdepth dredging, would be 22.6, 19.4, 17.8, 16.2, 14.2, 12.8, 11.6, 11.2, 10.7, 10.0, 13.0, 12.7, 12.4, 12.4, 12.4, 12.4, 12.4, 12.1, 11.8, 11.6, 10.6, 9.6, 9.1, 8.3, 7.6, 7.1, 6.6, 6.4, 6.2, 5.9, 5.7, 5.4, 5.2, 5.0, 4.5, 4.0, 3.6, 3.2, 2.7, 2.3, 1.9, 1.7, 1.2 x 0.8, 0.2 million cubic yards, or a total of 394.5 x 10° cubic yards.
2. Turning basins and inland channels. The cut through the coastline is the approach channel to the outer turning basin. The dimensions of this channel would be: width, 830 feet; depth, 109 feet; and length, 1,300 feet. Dredging quantity, including 5 feet of overdepth dredging and assuming an average, terrain elevation at +4 feet, would equal 6.6 x 10' cubic yards.

397.
The dimensions of the outer turning basin would be: radius, 1,800 feet; and water depth, 105 feet. Dredging quantity, including 5 feet of overdepth dred-ging and assuming an average elevation at -4 feet, would equal 17.6 x 10 ° cubic yards.
The dimensions of the channel between outer and inner turning basin would be: width, 725 feet; water depth, 105 feet; and length, 1,700 feet. Dredging quantity, including 5 feet of overdepth dredging and assuming an average terrain elevation at -4 feet, would equal 7.0 x 10 6 cubic yards.
The dimensions of the inner turning basin would be: water depth, 105 feet; width at bottom, 1,800 feet; and length, 3,465 feet (serving three berths), 4,300 feet (serving four berths), 5,335 feet (serving six berths), 5,545 feet (serving seven berths), and 6,585 feet (serving nine berths). Dredging quantities, in-cluding 5 feet of overdepth dredging and assuming an average terrain elevation at -4 feet, would equal the following: for subalternative A, 28.8 x 10 6 cubic yards bepre 1980, 7.3 x 10 6 cubic yards by 1983, and 7.3 x 10 ° clpic yards by 1992; and for subalternative B, 35.7 x 10 cubic yards before 1980, 7.3 x 10 6 cubic yards by 1983, and 8.7 x 10 6 cubic yards by 1991.
The dimensions of the berthing areas would be: water depth, 100 feet; length, 1,800 feet; and width, 1,665 feet (three berths), 2,495 feet (four berths), 3,535 feet (six berths), 3.745 feet (seven berths), and 4,785 feet (nine berths). Dredging quantities, including 5 feet of overdepth dredging and assuming an average terrain elevation of 0 feet, would pqual the following: for subalternative A, 11.7 x 10 ° cubic yard yards before 1980, 7.3 x 10 6 cubic yards by 1983, and 7.3 x 10 6 cubic yards by 1992; and for subalternative B, 17.6 x 10 6 cubic yards before 1980, 7.3 x 10 6 cubic yards by 1983, and 8.7 x 10 6 cubic yards by 1991.
The dimensions of the exit channel would be: water depth, 1.1 x 0.5 x 95 = 52 feet; width at bottom, 830 feet; and length, about 8,000 feet. Dredging

398.
quantity, including 3 feet of overdepth dredging and assuming an average terrain elevation of -5 feet, would equal 14.5 x 10 6 cubic yards.
Total dredging quantities for the ocean channel would equal 394.5 x 10 0 cubic yards. For all inland channels these quantities would equal the following: subalternative A would require dredging of 86.2 x 10 6
cubic yards before 1980, 14.6 x 10⁶ cubic yards by 1983, and 14.6 x 10 6 cubic yards by 1992. Subalternative B would require dredging of 99.0 x 10 6 cubic yards before 1980, 14.6 x 10 6 cubic yards by 1983, and 17.4 x 10 6
cubic yards by 1991.
Pipelines from berths to intermediate tank farm. One 48-inch line per berth would be required. Each line would be supported by a trestle for about 800 feet, and would then continue about 2 miles on land to the tanks of the intermediate tank farm. No booster sta-tion would be required.
Intermediate tank farm. The crude oil storage capacities required would be the same as those for al-ternative 4-3. Subalternative Acwould require 2.17 x 10 6 long tons by 1980, 2.69 x 10 ° long pons by 1985, 3.04 x 10 6 long tons by 1990, 3.47 x 10 ° long tons by 1994, and 4.07 x 10 6 long tons by 1999. Before 1980, 2.17 million long tons of storage capacity would be con-structed; additional storage capacities of 0.52, 0.35, 0.43, and 0.60 million long tons would be constructed in 1984, 1989, 1993 and 1998, respectively.
Subalternative B would require 2.69 x 10 6 long tops by 1980, 3.04 x 10 6 long tons by 1985, 3.47 x 10 ° long tons by 1989, 4.07 x 10 6 long tons by 1993, 4.62 x 10 6 long tons by 1996, and 5.20 x 10 6 long tons by 1999. Before 1980, 2.69 million long tons of stor-age capacity would be constructed; additional storage capacities of 0.35, 0.43, 0.60, 0.55, and 0.58 million long tons would be constructed in 1984, 1988, 1992, 1995, and 1998, respectively.

399.
For general services an area of 30 acres was estimated. The total average requirement would be: for subalternative A, 4.07 x 50 + 30 = about 235 acres; and for subalternative B, 5.20 x 50 + 30 = about 290 acres.
Pipelines and booster stations from tank farm to refineries. Subalternative A would have the same re-quirements as subalternative A of alternative 5-1. Subalternative B would have the same requirements as subalternative B of alternative 5-1.
Transshipment berths. The requirements would be the same as those for alternative 5-1.
pipelines from tank farm to transshipment berths. One 48-inch line per berth would be required. Each line would be 3 miles long, would run on land, and would re-quire 1,600 b.hp.
Figures 27 and 30 show the location and layout of the deepwater port. Figure 28 shows the assumed pipeline route to the various refinery areas.
Los Angeles-Long Beach Area
Two crude oil alternatives, numbered 6-1 and 6-2, are considered in this part of the Pacific coast. These alternatives differ from each other in service area: the deepwater port considered in alternative 6-1 would serve the Los Angeles-Long Beach refinery area, whereas that of alternative 6-2 would serve the Los Angeles-Long Beach as well as the San Francisco refinery area.
The location and layout of the deepwater port at Los Angeles and the assumed pipeline route to San Fran-cisco of alternative 6-2 are shown in figures 31 and 32.

-
Navy Harbor I I I
! I 1 L \
Lj Southeast Basin )
\ •
■ Long Beach Channel
BERTHING AREAS
Los Angeles in Channel
Los Angeles Turning Basin
=ear bpng:th°5111
Nationd San VAL
TB ID 20 JO 40 SO 60 70 SO 10
VICINITY MAP
s. SAN PEDRO BAY
N
Los Angeles Entrance Channel
DEEPWATER CHANNEL
Vincent Thomas Bridg
Los Angeles Harbor Long Beach Harbor
LEGEND
• Oil facility • Grain facility
PACIFIC OCEAN
Scale of Statute Miles
2
FIGURE 31 LOCATION AND LAYOUT OF CHANNEL, TURNING BASIN AND BERTHING AREAS OF DEEPWATER PORT OF ALTERNATIVES 6-1 AND 6-2
Robert R Nathan Associates, Inc

RPM
Sanaa
San Francisco (SAX FRANCISCO CO )
San Bru Red
IsPREAKEIMI
Pa
Pescadero PIGEON en
Davenpori Santa 0,1;
a;d
Castroroll
p.,14%=, Carme
•-r‘
0 m.sua
(-) Bog S Crs
"k6k. ' CILSALISSid
1. 11..1
THIS SECTION FOR i ALTERNATIVE 8-2 ONLY
".rzav
" gn.". "17„1 No
Guadalu
ttstmera Pr SAL
Surf
,ft=nr!!!!
IN THIS AREA BRANCH LINES TO LOCAL REFINERIES IN CASE! 1' OF ALTERNATIVE 8-2
CASE ' "3T ' 0" Los.Ammeg
Long sANWAii ,,, .
AAAAA CAM MIA
• 11.,
DEEPWATER PORT SITE OFt” ALTERNATIVE 6-2
Stow. Miles"' 0 HI 20 30 40 SO 40 70 00 90
TIJ
Ci ..d1 rCoiona del Mar SanJuan Caplan
k San Clemente
Avalon Gulf of •-c
C4 Santa Catalina
Rancho
San Diegn Coro
National CI San Yai
FIGURE 32. PIPELINE ROUTE BETWEEN LOS ANGELES AND SAN FRANCISCO, ALTERNATIVES 6-2 AND 8-2
Robert R. Nathan Associates, Inc.
402.
Sites
Both alternatives consider a deepwater port in the Los Angeles Outer Harbor area, protected by the San Pedro Breakwater.
Transshipment
Both alternatives consider transshipment by pipeline only.
Throughputs
The throughputs of the deepwater ports are set at 28 m.t.a. in 1980 and 111 m.t.a. by 2000 for the Los Angeles-Long Beach area, and 15 m.t.a. in 1980 and 60 m.t.a. by 2000 for the San Francisco area. For both areas combined, the throughputs would be 43 m.t.a. in 1980 and 171 m.t.a. by 2000.
Type of Berths
Both alternatives consider fixed berths.
Site of Intermediate Tank Farm
It is assumed that each of the four major oil companies in the Los Angeles-Long Beach area which would participate in the common facility would have suffi-cient tankage at their refineries. This tankage would be directly connected by pipeline with the new berths. For the pipeline system to the San Francisco area, it is assumed that an intermediate tank farm would be situated at an unspecified location an arbitrary dis-tance of 10 miles from the new deepwater berths.
Vessel Size
Both alternatives will consider 300,000- and 400,000-d.w.t. tankers. It is assumed that all tankers using the deepwater port would be of these maximum sizes for each alternative and subalternative. The assumed tanker dimensions are given in table 60.

Dimension 400 300
Vessel size (1,000 d.w.t.)
Length Beam Draft
1,100 1,262
- 192 220
70 70
x x X X
Table 60. Vessel Dimensions
(In feet)
Dredging
Both alternatives would require a dredged ocean and bay channel, a dredged turning basin, and dredged berthing areas.
Construction Program
The time phasing of the various construction items for the period prior to 1980 are given in table 61 for alternative 6-1, and in table 62 for alternative 6-2. The entire planning was simplified to facilitate calculations. The total cost of each item will be equally distributed over the pertinent years.
Table 61. Construction Program of Alternative 6-1
403.
Construction item
Year of construction or installation
1975 1976 1977 1978 1979
Dredging Supertanker berths Pipelines to refineries

X X
404.
Table 62. Construction Program of Alternative 6-2
Construction item
Year of constructio or installation
1975 1976 1977 1978 1979
Dredging Supertanker berths Pipelines to local refineries
Pipelines to inter-mediate tank farm
Intermediate tank farm Pipeline to San Fran- cisco refineries
Alternative 6-1
Criteria
1. Site of deepwater port: Outer Harbor of Los Angeles, at the inside of the breakwater of San Pedro Bay.
2. Service area: Refineries in the Los Angeles-Long Beach area.
3. Type of transshipment: Pipeline only. 4. Site of intermediate tank farms: At the
existing refinery tank farms of the individual oil companies.
5. Type of berths: Fixed. 6. Throughput: 28 and 111 m.t.a. in 1980 and
2000, respectively. 7. Draft of tankers: 70 feet fully loaded. 8. Subalternatives: Subalternative A would
handle 300,000 d.w.t. tankers; subalternative B, 400,000 d.w.t. tankers.
Requirements
Supertanker berths. Subalternative A would re-quire two berths by 1980 and three berths by 1993 (the one additional berth being constructed in 1992).

405.
Subalternative B would require two berths by 1980 and three berths by 1996 (the one additional berth being constructed in 1995).
Dredging quantities. The mean tidal range is 3.8 feet at the site of the deepwater port. Since this site is located 1.5 miles from the shoreside of the breakwater and 80 feet of water is found at approxi-mately 3 miles from the breakwater, no tidal rise will be taken into account in determining the channel depths.
1. Ocean and bay channel. The ocean and bay channel would have the following dimensions: depth, 81 feet; width at bottom of subalternative A, 770 feet, and of subalternative B, 880 feet; and length, about 4.5 miles. The depth per mile would be about 45, 55, 75, and 80 feet. Total quantity to be dredged, in-cluding 4 feet of overdepth dredging, would equal: for subalternative A, 7.0 + 5.0 + 1.6 + 0.4 million = 14.0 x 10 6 cubic yards; and for subalternative B, 7.8 + 5.7 + 1.8 + 0.5 million = 15.8 x 10 6 cubic yards.
2. Turning basin. The turning basin would have the following dimensions: depth, 77 feet; and radius, of subalternative A, 1,650 feet, and of subalternative B, 1,900 feet. Dredging quantity, including 4 feet of overdepth dredging and assuming an average depth of 40 feet, would equal: for subalternative A, 4.8 x 10 6
cubic yards; and for subalternative B, 6.2 x 10⁶ cubic yards.
3. Berthing area. The berthing area would have the following dimensions: depth, 74 feet; width, of subalternative A, 1,535 feet (three berths), and of subalternative B, 1,760 feet (three berths); length, of subalternative A, 1,650 feet, and of subalternative B, 1,900 feet. Dredging quantity, including 4 feet of overdepth dredging and assuming an average depth of 40 feet, would equal: for subalternative A, 3.8 x 10 6
cubic yards; and for subalternative B, 5.0 x 10⁶ cubic yards.

406.
Total dredging quantities would be as followsi Subalternative A would require dredging of 14.0 x 10' cubic yards for the ocean and bay channel, and of 8.6 x 10 6 cubic yards for the turning basin and berthing aFea. Subalternative B would require dredging of 15.8 x 10 °
cubic yards for the ocean and bay channel, and of 11.2 x 10 6 cubic yards for the turning basin and berthing area.
Pipelines from supertanker berths to refinery tank farms. Four 48-inch lines would be required. The average length of each line would be 10 miles. The pressure loss would be 15 + 10 x 17.4 = 189.0 p.s.i. and 15 + 10 x 21.2 = 227.0 p.s.i. for subalternatives A and B, respectively. A small booster pump would be re-quired; for subalternative A, (189 -125) x 47 = 3,000 b.hp. per line would be required; for subalternative B, (227 -125) x 52 = 5,300 b.hp. per line.
Tankage capacity. The refinery tank farm of each participating oil company should have sufficient stor-age capacity to meet the port requirements.
The location and layout of the deepwater port at Los Angeles is shown in figure 31.
Alternative 6-2
Criteria
1. Site of deepwater port: Outer Harbor of Los Angeles, inside the breakwater of San Pedro Bay. The site is the same as that for alternative 6-1.
2. Service area: Four major refineries in the Los Angeles and Long Beach area, and six major re-fineries in the San Francisco area.
3. Type of transshipment: Separate pipelines to the four major refineries in the Los Angeles-Long Beach area, and one common carrier pipeline to the San Francisco area.
4. Site of intermediate tank farms: For the four pipelines to the major refineries in the Los Angeles-Long Beach area, no intermediate storage will

407.
be considered between supertanker berths and refineries. For the pipeline to San Francisco, an intermediate tank farm will be assumed 10 miles from the berths at an un-specified location.
5. Type of berths: Fixed. 6. Throughput: To the Los Angeles-Long Beach
area, 28 and 111 m.t.a., and to the San Francisco area, 15 and 60 m.t.a. in 1980 and 2000, respectively. For both areas combined the throughputs would be 43 and 171 m.t.a. in 1980 and 2000, respectively.
7. Draft of tankers = 70 feet fully loaded. 8. Subalternatives: Subalternative A would
handle 300,000 d.w.t. tankers; subalternative B, 400,000 d.w.t. tankers.
Requirements
Supertanker berths. Subalternative A would re-quire two berths by 1980, three berths by 1986 (the one additional berth being constructed in 1985), and four berths by 1997 (the one additional berth being constructed in 1996). Subalternative B would require two berths by 1980 and three berths by 1988 (the one additional berth being constructed in 1987).
Dredging quantities. No tidal rise would be taken into consideration (see alternative 6-1).
1. Ocean and bay channel. The dimensions would be the same as for alternative 6-1. Total dredging quantity would be: for subalternative A, 14.0 x 10 6
cubic yards; and for subalternative B, 15.8 x 10⁶ cubic yards.
2. Turning basin. The dimensions would be the same as for alternative 6-1. Total dredging quantity would be: for subalternative A, 4.8 x 10 6 cubic yards; and for subalternative B, 6.2 x 10 6 cubic yards.
3. Berthing areas. By 1980 the requirements would be the same as those of alternative 6-1 (for three berths). Subalternative A would require dredging
408.
of 3.8 x 10 6 cubic yards; and subalternative B, 5.0 x 10 6 cubic yards. Subalternative A would require the dredging in 1995 of about 1.9 x 10 6 cubic yards for the fourth berth. Total dredging quantities would be as follows: Subalternative A would require dredging of 14.0 x 10 6 cubic yards for the ocean and bay channel, and of 10.5 x 10 6 cubic yards for the turning basin and berthing are. Subalternative B would require dredging of 15.8 x 10 ° cubic yards for the ocean and bay channel, and of 11.2 x 10 6 cubic yards for the turning basin and berthing area.
Pipelines from supertanker berths to intermediate tank farm. The requirements for the pipelines to the Los Angeles-Long Beach refinery area would be the same as those for alternative 6-1. For the pipelines to the San Francisco refinery area, two 48-inch lines could take care of the quantity. The distance to the inter-mediate tank farm was arbitrarily set at 10 miles. The pressure losses per line would be the same as those calculated for alternative 6-1. The booster pumps would require a capacity of 3,000 and 5,300 b.hp. per line for subalternatives A and B, respectively.
Intermediate tank farm. For pipelines to the Los Angeles-Long Beach refineries, the assumptions are the same as those discussed in alternative 6-1. For the pipeline to San Francisco area, the assumptions are as follows: In both 1980 and 2000 35 percent of the total deepwater port throughput would be destined to the San Francisco area. Therefore, 35 percent of the total storage requirements, as calculated using the formula on intermediate storage, will be considered to be required for the pipeline to San Francisco.
The total storage reguirement would be: for subalternative A, 1.54 x 10 ° long tons by 1980, 1.81 x 10 6 long tons by 1986, and 2.24 x 10 6 long tons by 1997; and for subalternative B, 1.80 x 10 10 long tons by 1980, and 2.15 x 10 6 long tons by 1988.
Applying the 35 percent division rule results in the following required storage for the line to San

409.
Francisco: for sulpalternative A, 0.55 x 10 6 long tons by 1980, 0.65 x 10° long tons by 1986 (the additional 0.10 x 10 6 long tons of storage being installed in 1985), and 0.80 x 10 6 long tons by 1997 (the additional 0.15 x 10 6 long tons of storage being installed in 1996); and for subalternative B, 0.65 x 10 6 long tons by 1980 and 0.77 x 10 6 long tons by 1988 (the additional 0.12 x 10 6 long tons of storage being installed in 1987).
For the tank farm serving the pipeline system to the San Francisco refineries, an acreage of about 50 x 0.80 + 10 = 50 acres would be required.
Pipeline system to the San Francisco area. One 42-inch line would be sufficient for the entire period from 1980 through 2000. The total length of the line was estimated at 385 miles. The total length of the branch lines to the six refineries was assumed at 20 miles, and the diameter of the branch lines at 24 inches. Three river crossings of the main line, each 0.3 mile long, are anticipated on the entire route.
The following approximate horsepowers would be required: by 1980, 385 x 10.68 = 4,100 b.hp.; and by 2000, 385 x 519.36 = 200,000 b.hp. The following in-stallations would be made: by 1980, 25,000 b.hp. (28.5 m.t.a.); in 1985, 25,000 b.hp. additional (36.5 m.t.a.); in 1989, 50,000 b.hp. additional (47 m.t.a.); and in 1993, 100,000 b.hp. additional (60 m.t.a.).
The location and layout of the deepwater port at Los Angeles and the assumed pipeline route to the San Francisco refineries are shown in figures 31 and 32.
San Francisco Area
Five crude oil alternatives, numbered 7-1 through 7-5, are considered on this part of the Pacific coast.

410.
The location and layout of the deepwater ports, as well as the assumed pipeline routes of alternatives 7-1, 7-3 and 7-5, are shown in figures 33 through 37.
Sites
Two alternatives (7-1 and 7-3) consider a deeper channel to Richmond only, whereas two alterna-tives (7-2 and 7-4) consider a deeper channel to Rich-mond and to the facilities along San Pablo Bay, Car-quinez Strait and Suisun Bay. Alternative 7-5 consid-ers a new deepwater port in Monterey Bay.
Types of Berths
Alternatives 7-1 through 7-4 consider fixed berths. Alternative 7-5 considers monobuoys.
Intermediate Tank Farm
Alternatives 7-1, 7-3 and 7-5 would require an intermediate tank farm.
Transshipment
All alternatives consider either direct unload-ing at the existing berth locations, or unloading at a new location with transshipment by pipeline to the existing refineries.
Refineries
Six refineries are located in the San Francisco area. The capacities of these refineries as of January 1, 1972, are given in table 63.
One refinery, Standard Oil of California, is located at Richmond; its crude oil handling facility is at Richmond Long Wharf. The other refineries and their crude oil handling facilities are located along San Pablo Bay, Carquinez Strait and Suisun Bay; the

AVON nicia-MartInec
ighway Bridge
PACIFIC OCEAN OAKLAND
or CPte
Go Go
SAN FRANCISCO
Scale of Statute Miles
0 1 2 3 4 5
cf-
%./.%
mple Point Highway Bridges
are Island Strait
Southern Pacific Railroad Bridge
30 \ BENICI A \\-\
V 40 mi
HERCULES
PIPELINE TO REFINERIES
Richmond -San Rafael Bridge
West Richmond Channel
Southampton Shoal,Channel Inner Harbor Entrance Channel
_INTERMEDIATE STORAGE
RICHMOND
nner Harbor Channel
Golden Gatepridge Van Francisco-Oakland Bay Bridge
Main Ship Channel
LEGEND
• Oil facility *011 refinery
SAN PABLO BAY
Pmole Shoal Channel 0%
FIGURE 33 IMPROVED CHANNELS AND MANEUVERING AREAS, LOCATION OF COMMON TERMINAL, AND ASSUMED PIPELINE ROUTE OF ALTERNATIVES 74 AND 7-3
Robert R Nathan Associates, Inc

We Richmond Channel .... RICHMOND
inner Harbor Channel
Long Wharf Man. Are
Southampton Shoal Channel Inner Harbor Entrance Channel
Mare Island Strait
SAN PABLO BAY Nc.' '1 \ ,s. Southern Pacific Railroad Bridge
Pinole Shoal Channel 0%
Semple Point Highway Bridges
MARTINEZ
CARQUINEZ STRAIT —SUISUN BAY CHANNEL
11 Richmond -San Rafael Bridge
Fe Channel
30 m; V' I
\)‘- 40 mi
Golden Gate Bridge 1,5an Francisco-Oakland Bay Bridge
PACIFIC OCEAN
Oe Get°
Go kdeP
OAKLAND
SAN FRANCISCO
Main Ship Channel
FIGURE 34 IMPROVED CHANNELS AND MANEUVERING AREAS FOR ALTERNATIVES 7-2 AND 7-4
LEGEND
• Oil facility
--f
Benicia-Martinez 'Highway Bridge
Scale of Statute Miles
0 1 2 3 4 5
Robert R Nathan Associates, Inc

o 42 _
S 45
Gthle Artv 50 4, , q fl 4•
R.1 Ref • ^/ ,9,0 Re Ref
:R044, 40 42 0 S R I std: Lt)„„ AERa _
6,,_ ---y"6"._.• _ 3_4.2_, (F1 R Obstr -Lt) _ - 41(
-
------7----------Zit•-4-7- 'F\ Ck 40
x \,, 39 3
Fl Cctstr O R
38 -...; 7
3
SOCAL TERMINAL BELL \ 4 n ."‘ RA,--H le lYT/L1
'9 Pro, maintd • Dol 8 \
Standard 011 Dock ..„„ 4 A,
\ 8 7 er• 7 )
i \ ( h•*\•A\4 -tURNING BASIN AND 24 \ AI . BERTH I NG AREAS 3 4
\ ..___,/ 24<1...\\ ...■ 20V\ '-',. '°-ep 2 ---------- '`. °;,'N 10- V'',/ — -4- _ f 'CO 1 • G'' TA4.1-5.--N- -) l''
■ ey• ''''.,,4' r,VS -/CS ,...,§ v 4 4 '; 21
23 F7 RP • 20 • - --. -,:`,..c9Y,_,REACH 1-- --, — _12 1.1.,-,."...," „" Ok
26
21
21 ( Ci‘n , \t, Fl 20ft 25
, ‘,. a A4 9
E Int 6sec 3511 5 v 15 \
\ e.
22
\ 1 5 0 \ 21
\ \ 7 C) k'
\ )
1/4 6 ......0 ,o '
4'
3
41
( 35 411PR' 6"
37 4sec R. Ref
31
"4
vt.) r, 9 \2o
001
E W
- 4-
- . COMMON TERMINAL
37
ky 37
41\
51
37
41
r 55 48
37
I 31
7 23 SSh 21 4,133
20 %' 1
23 R 2SS" /79 4sec
114 65, G 4se, 2531"1"
2
SOUTHAMPTON SHOAL CHANNEL' \ 6 330
1%1
\‘‘ A ‘ V II
61
, o = _ \ \
- Pr.,nootri
67 . •61 8 \
23 I "'it C ';
A
/71 100
2 Fl 4sec 2011"5"
107
82 Degauss ," Range
t t 1140 96
77' • 014 , 1.33 92
Clt\ N
101
6
188
Sh 48 , 42
ga.semg APT! 551
- =X / 70
45 ‘fi
44
,
7
4 146 Ousers
3 0 t 84 27
80
i /E'Int6ser 6 ft 13M
\,)1
0011211130 „
52 /-,..ei PF,A-4, \ \
791V0r 14' 1‘. cPi)P"
68
\ 19 \ ,
55 Iii R"2,8 ' 4 N 13
II R 4sec f1069 108 1 1 1 22 -\., 16
A ,.... :9 29.
ec 80ft BELL
39
,6` 46 46
56 R"2".
Fl R 4ses GONG 1 48
47, 72
\ \ 40 ,
97
S A N 80 16
25
3
S 16
34 R
35
38
33
32
Scale of Statute Miles Robert R. Nathat Associates, Inc.
36
6 36
94
FIGURE 35. IMPROVED SOUTHAMPTON SHOAL CHANNEL AND RICHMOND LONG WHARF MANEUVERING AREA OF ALTERNATIVES 7-1 AND 7-3

ED 2
ORAGE - e note A)*
2 Tam
6
2
2
53 45
2 Fl 4sec 201t
107
\207. 6g2
r eta Molete Pt.
73
15_ \ 55 67 E Int R 6sec 301 hrd 50 T4
55 52 Occ R 4sec 32ft
HORN 56 42
3
5
4
16
15
10/ Ad 17
16 (
16
S 45
WEST RICHMOND CHANNEL \
Ar Ruastr Lt)_ AERO_ 4726,-S -ARle"74- (5- -0
- 42 (FI R 06-sir Iti- 4-- c.51.. ob5 0
MI Mr 6.;,..70 )d3PIP, 40 40
009:19 38 ' •
SR •N"8"
38 , Red Rock Re Ret
35
74! 4.2.5 c"2-ER
'FI C•secBELA 48 Re Ref
40
R"2GR"I Fl R 4sec
41\ 43
37 41
37 ,
38
, 35 Priv maintd
36 SIREN
Ciretro
34
N35
36 c26)
/2 /
36
34 1,e \ \34 IV \ N,_",
\ 'I, 24 \ -
24 2
21
23
Fl R 4ssc
40
15
4111151I74sec , 35
13877-03
25 \32\ 11 0
29
24 30 1' ci1
29 7i-„,t 31
21 Itto
7 23 s sh ^-
1- 0‘ 30 20
1 z.1
26 11 ibis 1
Fl G 4sec BELL
39\ 11 % .,0%. 38
42
48 45
25
15 C 39 57 45
G 4sec 2 58
40
46
42
46 40
39 41
Oegaus
3E SG
41
3
2
4
4
5
0 1 1
Scale of Statute Miles
FIGURE 36. WEST RICHMOND CHANNEL OF ALTERNATIVES 7-2 AND 7-4
Robert R. Nathan Associates, Inc.

led S 1.3
a
,1S
IS
13
19
33 21
19 22
14
177
132
113
156
22
101 34
2 25 3 cr$
25 88
67
25
80
15
99 83
r
36
37
34
44
t 00
68
26
Scale of Statute Miles
1
.5
31
19
Lc') 0
ciJ
28
22
26
7
IA
i 0 I
24
25
20/
CI
25 19
36 ° 5 0 ' $
us 49 44
34
25
27 18
35 67 5
92
87 128 91 29
68
81
73 Pt M
64
31
62
86
63
15 $
25 14
14 p,-,KL ILti,ViM '4 gy Mr Re-'
.11 7 *es
41 \71 4/
41
13
121
46 31
St, .11
91
134 1 ea
90 17
7."-fiV98U-1-7,
• hn Z' Invern vit' • •
Al: . - • 11•14 ‘*tf , • 8 ay • • • I** FITT el
Goldex Gal• 116, • • .411 rUPLISGOLOJEwy San Fr
(1 ancisco 8.555 Prane
0.5 85
Duch . c
es
tc)
il.11grn
19-tt
''AON •
0 Santa Cruz 1,4.41
Watsortv e Monttroty.■
VICINITY MAP 4',,„ ' 4°73171
AND PIPELINE -> Mann
ROUTE Pactfir0;1 OP., Cantu!
ASSUMED PIPELINE ROUTE TO REFINER-IES
,sel
45 39 gclii:A 70 A,
59
133 99 140
Mae
23
26
33
MONOBUOY
r
23 5
23 SYS 14
124
64 14 ...."< 7 41
61
4{ 4v S
61
41
33
14
33 MONOBUOY
19'S a
22 1 9 14
19 24 13
15 16 0' 5 13 ) 9
7
7
4i 5
7 a
e 7 mrs 5
51
El
15 33 23
20
28 36 0 45 1 gyS 61,
19 led
50* S 7 Si 4
60 S
Cs1
41
FIGURE 37 LOCATION AND LAYOUT OF MONOBUOYS AND PIPELINES OF ALTERNATIVE 7-5
Robert R Nathan Associates, Inc
1/

416.
Table 63. Refining Capacities of San Francisco Refineries
Refining capacity (bbl./day)
Percentage of total refining capacity
Name Location
Standard Oil Co. of California Gulf Co. Union Oil Co. of California
Humble Oil Co. Shell Oil Co. Phillips Petroleum Co.
Total
Richmond 190,000 Hercules 26,000 4.3
Oleum 95,000 15.6 Benicia 86,000 14.2 Martinez 100,000 16.5
Avon 110,000 18.1
607,000 100.0
31.3
easternmost terminal is the Avon Pier, located at a distance of approximately 39 statute miles from the coast. In alternatives 7-1 and 7-3, the deep-draft channel is anticipated to be dredged to Socal's Long Wharf facility. Northwest of this facility would be located the common unloading facility. In alterna-tives 7-2 and 7-4 the deep-draft channel would be dredged to Socal's Long Wharf facility as well as to the other facilities along San Pablo Bay, Carquinez Strait and Suisun Bay, up to the Avon Pier in Suisun Bay.
Throughputs
The total throughput was set at 15 m.t.a. in 1980 and 60 m.t.a. by 2000.
Projected Flow
To simplify the calculations of the individual terminal requirements, it is assumed that in 1980 the import of crude oil would be distributed among the six

31.3 4.3
15.6 14.2 16.5
18.1
100.0
16.7 4.7
16.6 0.7
16.7 2.3
16.7 2.1
16.6 2.5
16.7 2.7
100.0 15.0
10.0 10.0
10.0 10.0 10.0
10.0
60.0
417.
refineries in proportion to their present refining capacities. However, it is also assumed that in 2000 the import quantities would be equal for all six re-fineries. Table 64 presents the projected flows.
Table 64. Projected Crude Oil Flow
Name
Percentage of total throughput
Annual t (million
roughput ong tons)
1980 2000 2000 1980
Standard Oil Co. of California
Gulf Oil Co. Union Oil Co. of California
Humble Oil Co. Shell Oil Co. Phillips Petro-leum Co.
Total
Vessel Sizes
Due to the hypothesized different water depths, different vessels would be considered in the various deepwater port alternatives. It is assumed that all tankers using the port alternatives would be of the maximum size as established per alternative. Table 65 reviews the established dimensions of the considered vessels.
Dredging
Alternatives 7-1 through 7-4 would require dredged ocean and bay channels, dredged turning basins and dredged berthing areas. Alternative 7-5 would not require any dredging.

418.
Table 65. Vessel Dimensions
(In feet)
Vessel size (1,000 d.w.t.) Dimension
400 250 157
980 164 50
Length Beam Draft
1,095 190
58.5
1,160 200 83
Construction Program
The time phasing of the various construction items used for the period prior to 1980 is given in table 66 for alternatives 7-1 through 7-4, and in table 67 for alternative 7-5. The entire phasing was simpli-fied to facilitate calculations. The total cost of each item will be equally distributed over the pertin-ent years.
Table 66. Construction Program of Alternatives 7-1 Through 7-4
Year of construction or installation Construction item
1977 1978] 1975 1976 1979
Dredging alternatives 7-1, 7-2, and 7-3
alternative 7-4 Supertanker berths Intermediate tank farm alternatives 7-1 and 7-3
Pipeline to Carquinez refineries alternatives 7-1 and 7-3
x x x x x x x x
x
X

419.
Table 67. Constructic:n Program of Alternative 7-5
Year of construction or installation
Construction item
1975 11976 1977 1978 11979
Supertanker berths Pipeline to inter-mediate tank farm Intermediate tank farm
Pipeline to San Fran-cisco refineries
Alternative 7-1
Criteria
1. Site of deepwater port: Richmond's Long Wharf area.
2. Service area: Refineries in the Richmond-Martinez area.
3. Type of transshipment: Pipeline only. 4. Site of intermediate tank farm: At an un-
specified location about 5 miles from the berths. This tank farm would serve the five refineries located out-side the Richmond area.
5. Type of berths: Fixed. 6. Throughput: 15 and 60 m.t.a. in 1980 and
2000, respectively. Of this volume an assumed 10.3 m.t.a. in 1980 and 50 m.t.a. by 2000 would be trans-shipped by pipeline to the refineries outside the Rich- - mond area, and 4.7 m.t.a. in 1980 and 10 m.t.a. by 2000 would go directly to Socal's Richmond refinery.
7. Tanker characteristics: 157,000 d.w.t. with 50-foot draft fully loaded.
Requirements
Supertanker berths. Assuming that all vessels would be of the maximum size, the following number of

420.
berths would be required: Socal would require one berth by 1980, and no additional berths between 1980 and 2000. The common terminal would require one berth by 1980 and two berths by 1983. It is assumed that all three berths would be constructed before 1980.
Dredging quantities. The quantities to be dred-ged would be as follows:
1. Ocean channel. Because the Main Ship Chan-nel is presently being dredged from 50 to 55 feet, it will be assumed that the existing depth of this chan-nel is 55 feet. The channel is located less than 10 miles off shore; therefore, the required dimensions would be: width, 655 feet; and depth, 58 feet. Taking into account 5 feet of tide would result in a required depth of 53 feet, which is less than the "existing" 55 feet. Hence, no additional dredging of the Main Ship Channel would be required.
2. Southampton Shoal Channel. The required di-mensions would be: width, 575 feet; and depth, 55 feet, or taking 5 feet of tide into account, 50 feet. Its length would be approximately 4 miles. The present average depth per mile is: 40, 40, 33 and 37 feet. Total quantity per mile, including 2.5 feet of over-depth dredging, would be: 1.5, 1.5, 2.5 and 1.8 million cubic yards, or a total of 7.3 x 10 6 cubic yards.
3. Turning basin and berthing area. The aver-age dimensions of the combined area would be: length, 3 x 1.5 x 980 = 4,410 feet; width, 1,300 feet; depth, 50 to 48 feet, therefore, 49 feet; and the average pre-sent depth, 41 feet. Dredging quantity would be 2.3 x 10 6 cubic yards, including 2.5 feet of overdepth dredging.
Total dredging quantities would equal, for the ocean channel none; and for the inland basin and chan-nel, 9.6 x 10° cubic yards.

421.
Pipelines. From the common berths to the inter-mediate tank farm, one 48-inch line per berth would be required. The length of each line is set at 5 miles, of which 1 mile would be on trestle and 4 miles on land. No booster pumps would be required. From Socal's berth to their Richmond refinery, it is assumed that there is sufficient piping from the existing berths to the tank farm's manifold.
Intermediate tank farm. The required crude oil storage to serve the common terminal would be 1.03 x 10 6 long tons, to be installed before 1980. Socal would require 0.89 x 10 6 long tons, which is presently available.
For general services an area of 20 acres is as-sumed to be sufficient. Including crude oil storage the total acreage requirement would be 1.03 x 50 + 20 = about 70 acres.
Pipeline from intermediate tank farm to refin-eries. One 32-inch line is considered an attractive solution for a throughput ranging from 10 m.t.a. in 1980 to 45 m.t.a. by 2000. The length of the line was estimated at 25 statute miles. The length of the branch lines is considered negligible.
To calculate the horsepower requirements an aver-age booster length of 20 miles has been assumed. Ini-tially 20 x 13.70 = 274 b.hp. would be required; ulti-mately, 20 x 923.87 = 18,400 b.hp. The following in-stallation program has been selected to meet the re-quirements: 1,150 b.hp. (15.5 m.t.a.), before 1980, 1,150 b.hp. (21 m.t.a.) in 1982, 2,300 b.hp. (27 m.t.a.) in 1985, 4,600 b.hp. (34.5 m.t.a.) in 1990, and 9,200 b.hp. (45 m.t.a.) in 1993.
The location and layout of the deepwater port and the assumed pipeline route to the refineries along the San Pablo Bay, Carquinez Strait and Suisun Bay are shown in figures 33 and 35.

422.
Alternative 7-2
Criteria
1. Site of deepwater port: At the existing waterfront facilities from Richmond to Avon.
2. Service area: Refineries in the Richmond-Martinez area.
3. Type of transshipment: All unloading would take place directly at the individual terminals.
4. Intermediate tank farms: No common-use intermediate tank farm would be required. Each oil company would require sufficient storage for its own operations, as it does now.
5. Type of berths: Fixed. 6. Throughput: 15 and 60 m.t.a. in 1980 and
2000 respectively. In 1980 each of the waterfront fac-ilities of the six refineries would handle between 0.7 and 4.7 m.t.a., which would increase to 10 m.t.a. by 2000.
7. Tanker characteristics: 157,000 d.w.t. with 50-foot draft fully loaded.
Requirements
Supertanker berths. The following number of berths would be required: by 1980, one per oil company, or a total of six; between 1980 and 2000, none addi-tional. It has been assumed that none of the existing waterfront facilities would be able to handle the hy-pothesized bigger tankers, and that six new berths would therefore have to be constructed before 1980.
Dredging quantities. The quantities to be dred-ged would be as follows:
1. Ocean channel. The same dimensions would be required as in alternative 7-1. Hence, no dredging would be required.
2. Southampton Shoal Channel. The same dimen-sions wopld be required as in alternative 7-1. Hence, 7.3 x 10 0 cubic yards of dredging would be required.

423.
3. West Richmond Channel. The approximate di-mensions would be: length, 4 miles; width, 575 feet; depth, 55 -5 = 50 feet. Average present depth per mile would be 48, 38, 38, and 48 feet. Total dredging quan-tity, including 2.5 feet of overdepth dredging, would equal 0.1 + 1.8 + 1.8 + 0.1 million cubic yards, or a total of 3.8 x 10 6 cubic yards.
4. Pinole Shoal Channel. The approximate dimen-sions would be: length, 11 miles; width, 575 feet; depth, 50 feet. Average present depth per mile would be 48, 40, 40, 40, 35, 35, 35, 35, 35, 35, and 48 feet. Total dredging quantity, including 2.5 feet of overdepth dredging, would equal 0.1 + 1.5 + 1.5 + 1.5 + 2.1 + 2.1 + 2.1 + 2.1 + 2.1 + 2.1 + 0.1 million cubic yards, or a total of 17.3 x 10 6 cubic yards.
5. Carquinez Strait-Suisun Bay Channel. The approximate dimensions would be: length, 4 miles; width, 575 feet; and depth, 50 feet. Average present depth per mile would be 40, 40, 35, and 35 feet. Total dredging quantity, including 2.5 feet of overdepth dredging, would equal 1.5 + 2.1 + 2.1 + 1.5 million cubic yards, or a total of 7.2 x 10 6 cubic yards.
6. Six turning basins and berthing areas. The average dimensions of each of the six combined areas would be: length, 1.5 x 980 = 1,470 feet; width, 1.5 x 980 = 1,470 feet; and depth, 50 feet. Average pre-sent depth would be 41 feet. Dredging quantity, in-cluding 2.5 feet of overdepth dredging, would equal 6.0 x 10 6 cubic yards.
Total dredging quantities would equal, for the ocean channel, none; and for inland channels and ba-sins, 41.6 x 10 6 cubic yards.
Pipelines from berths to refineries. It is as-sumed that each terminal would require a 1-mile-long, 48-inch line; five pipelines would be installed on land and one on trestle, connecting each new berth with the existing manifold. No booster pumps would be required.

424.
The locations of the deepwater ports and chan-nels are shown in figures 34 and 36.
Alternative 7-3
Criteria
1. Site of deepwater port: Richmond's Long Wharf area.
2. Service area: Refineries in the Richmond-Martinez area.
3. Type of transshipment: Pipeline only. 4. Site of intermediate tank farm: At an un-
specified location about 5 miles from the berths. This tank farm would serve the five refineries located out-side the Richmond area.
5. Type of berths: Fixed. 6. Throughput: 15 and 60 m.t.a. in 1980 and
2000 respectively. Of this volume an assumed 10.3 m.t.a. in 1980 and 50 m.t.a. by 2000 would be trans-shipped by pipeline to the refineries outside the Rich-mond area; 4.7 m.t.a. in 1980 and 10 m.t.a. by 2000 would go directly to Socal's Richmond refinery.
7. Tanker characteristics: 250,000 d.w.t. with 58.5-foot draft fully loaded.
Requirements
Supertanker berths. The following number of berths would be required: Socal would require one berth in 1980, and no additional berths between 1980 and 2000; Common Terminal would require one berth in 1980 and two berths in 1985. It is assumed that two berths would be installed before 1980, and that the second common terminal berth would be constructed in 1984.
Dredging quantities. The quantities to be dred-ged would be as follows:
1. Ocean channel. The required dimensions of the Main Ship Channel would be: width, 760 feet; and depth, 67 feet. Taking into account 5 feet tide would

425.
result in a required depth of 62 feet. The existing depth would be 55 feet; the length of the channel would be approximately 5 statute miles. Including 3 feet of overdepth dredging, the total dredging quantity would equal approximately 7.7 x 10 6 cubic yards.
2. Southampton Shoal Channel. The required di-mensions would be: width, 665 feet; and depth, 64 feet, or, including 5 feet of tide, 59 feet. The channel length would be approximately 4 miles; average present depth per mile would be 40, 40, 33 and 37 feet. Total dredging quantity per mile, including 3 feet of over-depth dredging, would equal 3.1, 3.1, 4.3 and 3.6 mil-lion cubic yards, or a total of 14.1 x 10 6 cubic yards.
3. Turning basin and berthing area. The aver-age dimensions of the combined area would be approxi-mately: length, 3 x 1.5 x 1,095 = 4,925 feet; width, 1,300 feet; depth, 59 to 57 feet, therefore, 58 feet; and average present depth, 41 feet. Dredging quantity, including 3 feet of overdepth dredging, would equal 4.8 x 10° cubic yards.
Total dredging quantities would equal, for the ocean channel, 7.7 x 10 6 cubic yards; and for the inland basin and channel, 18.9 x 10 6 cubic yards.
Pipelines. From the common berths to the inter-mediate tank farm, one 48-inch line per berth would be required. The length of each line was set at 5 miles, of which 1 mile would be on trestle and 4 miles on land. No booster pumps would be required. From Socal's berth to its Richmond refinery, it is assumed a new 1-mile-long, 48-inch line would be required, to be installed on trestle, connecting the new berth with the existing manifold.
Intermediate tank farm. The required crude oil stgrage to serve the common terminal would be 1.13 x 10 0 long tons, to be installed before 1930. An addi-tional storage of 1.32 -1.13 = 0.19 x 10 6 long tons would be installed during 1984. Socal would require 1.13 x 10 6 long tons. There is presently available a

426.
storage capacity of 17 x 10 6 barrels, which is equiva-lent to approximately 2.3 x 10 6 long tons of crude oil. Thus no additional storage capacity would be required by Socal.
For general services an area of 20 acres is as-sumed to be sufficient. Including crude oil storage the total acreage requirement would be 1.32 x 50 + 20 = approximately 85 acres.
Pipeline from intermediate tank farm to refin-eries. The requirements would be the same as for al-ternative 7-1; thus, one 25-mile-long, 32-inch line would be sufficient until the year 2000.
The same installation program of booster stations selected for alternative 7-1 could be adopted: Before 1980, 1,150 b.hp. (15.5 m.t.a.); in 1982, 1,150 b.hp. additional (21 m.t.a.); in 1985, 2,300 b.hp. additional (27 m.t.a.).; in 1990, 4,600 b.hp. additional (34.5 m.t.a.); and in 1993, 9,200 b.hp. additional (45 m.t.a.).
The location and layout of the deepwater port and the assumed pipeline route to the refineries along San Pablo Bay, Carquinez Strait, and Suisun Bay are shown in figures 33 and 35.
Alternative 7-4
Criteria
1. Site of deepwater port: At the existing waterfront facilities from Richmond to Avon.
2. Service area: Refineries in the Richmond-Martinez area.
3. Type of transshipment: All unloading would take place directly at the individual terminals.
4. Intermediate tank farms: No common-use intermediate tank farm would be required. Each oil company would require sufficient storage for its own operations, as it does now.

427.
5. Type of berths: Fixed. 6. Throughput: 15 and 60 m.t.a. in 1980 and
2000 respectively. In 1980 each of the waterfront facilities of the six refineries would handle between 0..7 and 4.7 m.t.a., which would increase to 10 m.t.a. by 2000.
7. Tanker characteristics: 250,000 d.w.t. and 58.5-foot draft fully loaded.
Requirements
Supertanker berths. The following number of berths would be required: by 1980, one per oil company, or a total of six; between 1980 and 2000, none addi-tional. It is assumed that none of the existing water-front facilities would be able to handle the hypothe-sized bigger tankers, and that six new berths would therefore have to be constructed before 1980.
Dredging quantities. The quantities to be dred-ged would be as follows:
1. Ocean Channel. The same dimensions would be required as in alternative 7-3. Hence, 7.7 x 10 6 cubic yards of dredging would be required.
2. Southampton Shoal Channel. The same dimen-sions woui.d be required as in alternative 7-3. Hence, 14.1 x 10 ° cubic yards of dredging would be required.
3. West Richmond Channel. The approximate di-mensions would be: length, 4 miles; width, 665 feet; and depth, 64 -5 = 59 feet. The average present depth per mile, would be 48, 38, 38, and 48 feet. Total dredging quantity, including 3 feet of overdepth dred-ging, would equal 1.9 + 3.5 + 3.5 + 1.9 million cubic yards, or a total of 10.8 x 10 6 cubic yards.
4. Pinole Shoal Channel. The approximate di-mensions would be: length, 11 miles; width, 665 feet; and depth, 59 feet. Average present depth per mile
428.
would be 48, 40, 40, 40, 35, 35, 35, 35, 35, 35 and 48 feet. Total dredging quantity, including 3 feet of overdepth dredging, would equal 1.9 + 3.1 + 3.1 + 3.1 + 3.9 + 3.9 + 3.9 + 3.9 + 3.9 3.9 + 1.9 million cubic yards, or a total of 36.5 x 10 6 cubic yards.
5. Carquinez Strait-Suisun Bay Channel. The approximate dimensions would be: length, 4 miles; width, 665 feet; and depth, 59 feet. Average present depth per mile would be 40, 40, 35, and 35 feet. Total dredging quantity, including 3 feet of overdepth dred-ging, would equal 3.1 + 3.1 + 3.9 + 3.9 million cubic yards, or a total of 14.0 x 10 6 cubic yards.
6. Six turning basins and berthing areas. The average dimensions of each of the six combined areas would be: length, 1.5 x 1,095 = 1,645 feet; width, 1.5 x 1,095 = 1,645 feet; and depth, 60 feet. Average present depth would be 41 feet. Dredging quantity, in-c1u4ng 3 feet of overdepth dredging, would equal 13.2 x 10 ° cubic yards.
Total dredging quantities would equal, for the ocean channel, 7.7 x 10 6 cubic yard; and for the in-land channels and basins, 88.6 x 10 ° cubic yards.
Pipelines from berths to refineries. It is as-sumed that each terminal would require a 1-mile-long, 48-inch line; five pipelines would be installed on land and one on trestle, connecting each new berth with the existing manifold.
The locations of the deepwater ports and chan-nels are shown in figures 34 and 36.
Alternative 7-5
Criteria
1. Site of deepwater port: Monterey Bay, about 2 miles off Moss Landing.

429.
2. Service area: Refineries in the Richmond-Martinez area.
3. Type of transshipment: Pipeline only. 4. Site of intermediate tank farm: At an un-
specified location about 10 miles from the berths. 5. Type of berths: Monobuoys. 6. Throughput: 15 and 60 million long tons per
year in 1980 and 2000, respectively. 7. Tanker characteristics: 400,000 d.w.t. and
83-foot draft fully loaded.
Requirements
Supertanker berths. The following number of berths would be required: two berths by 1980, and no additional berths between 1980 and 2000.
Dredging quantities. No dredging is required.
Water depth. A depth of 1.15 x 83 = 95 feet would be required.
Pipelines from supertanker berths to inter-mediate tank farm. One 10-mile-long, 48-inch line per berth would be required, of which 2.2 miles would be underwater and 7.8 miles on land. A small booster sta-tion would be required with a capacity of about (10 x 21.2 + 70 -150) x 52 = 7,000 b.hp. per line.
Intermediate tank farm. In 1980 the required crude oil storage would be 1.80 x 10 6 long tons. Al-lowing 15 acres for general services, the total land requirement would be approximately 50 x 1.80 + 15 = 105 acres.
Pipeline systems to the San Francisco area. One 42-inch line would be sufficient for the entire period 1980 through 2000. The total length of the line was estimated at 130 miles. The total length of the branch lines to the refineries was estimated at 10 miles; its size was set at 24 inches. No river

430.
crossings are taken into account, since their number and length is small in relation to the total pipeline length.
The following approximate horsepowers would be required: 130 x 10.68 = 1,400 b.hp. by 1980, and 130 x 519.36 = 68,000 b.hp. by 2000. The following instal-lations would be made: 8,500 b.hp. (28.5 m.t.a.) before 1980, 8,500 b.hp. additional (36.5 m.t.a.) in 1985, 17,000 b.hp. additional (47 m.t.a.) in 1989, and 34,000 b.hp. additional (60 m.t.a.) in 1993. (The max-imum throughput in million long tons per year of each system is indicated in parentheses.)
The location and layout of the deepwater port and the assumed pipeline route to the San Francisco refineries is shown in figure 37.
Bellingham-Ferndale (Washington) Area
Two crude oil alternatives, numbered 8-1 and 8-2, are considered in this part of the Pacific. These al-ternatives differ from each other in service area: the deepwater port considered in alternative 8-1 would serve the six refineries of the San Francisco area, while that of alternative 8-2 would serve the six re-fineries of San Francisco and the four major refineries of Los Angeles and Long Beach.
The location of the deepwater port and inter-mediate tank farm and the assumed pipeline routes are shown in figures 32 and 38.
Sites
Both alternatives consider a deepwater port in the Strait of Georgia, between Point Whitehorn and Sandy Point. This portion of the coast is located about 12 miles northwest of the port of Bellingham. It is about 10 miles long, and the 120-foot contour line parallels the coast at a distance of 900 to 3,000 feet.

FER .N DAL. E • ,,,,k1 :.:1S.::).:;,:,,...;..
oils INTERMEDIATE TANK FARM Ili R PORT SITE' , f 1 :••t,
ISE
L•VA
Laposh
NUN MEAD
G ILIZARITN Taholali
PT GRENVILLE
Mod!, Pa.!. Beach
Copalls Beach
PT 111101.1 Crays
Westpo
Graylan
c SNOSLWATER
OISE! '
OCean Parli
LogMcw
Ilwat G OITAPPOIXT•SGT °.
Fs ApsGA2
H
ictona
-1+G,
(
(
St•Iute
fe'Z' n
110PERA NUR • ' • s."'" Z.• se ' 1
.. r rfl Id .4,4
cs
Inverne \ • WIV211.. PT RITE n "t••4, IraC:, • gig S4I. ,
St•nson Beac STOC
sm.!. • -
San Fran c isc W lei, '7 s' ISAR IRAIISISCOGO °
r. • •• •'‘".icYff• '‘*k
.‘1164'..*%1414.1110.4 $4: THIS SECTION FOR ALTER-4 NATIVE 8-2 ONLY
FIGURE 38 PIPELINE ROUTE BETWEEN FERNDALE, WASHINGTON, AND SAN FRANCISCO, ALTERNATIVES 8-1 AND 8-2
Robert R Nathan Associates, Inc.

432.
Transshipment
Both alternatives consider transshipment by pipe-line only.
Throughputs
The throughputs of the deepwater ports are set at 15 m.t.a. in 1980 and 60 m.t.a. by 2000 for the San Francisco area, and 28 m.t.a. in 1980 and 111 m.t.a. by 2000 for the Los Angeles-Long Beach area. For both areas combined the throughputs would equal 43 m.t.a. in 1980 and 171 m.t.a. by 2000.
Type of Berths
Both alternatives consider fixed berths.
Site of Intermediate Tank Farm
It is assumed that this tank farm would be loca-ted at an unspecified site 5 miles from the berths.
Vessel Size
Both alternatives will consider 400,000-d.w.t. tankers only. It is assumed that all tankers using the deepwater facility will be of the maximum size. The assumed tanker dimensions are presented in table 68.
Table 68. Vessel Dimensions
(In feet)
400,000 d.w.t. Dimension
Length Beam Draft
1,160 200 83

433.
Dredging
Neither alternative would require any dredged channel, turning basin or berthing area, since suffi-cient water depth is available in the Strait of Juan de Fuca, the Rosario Strait and the Strait of Georgia.
Supply of Local Refineries
-It has been assumed that the refineries at Fern-dale, Anacortes and Tacoma will continue to use or will expand their facilities, if necessary, for the import of crude oil, and that they will therefore not parti-cipate in the common waterfront facilities and common pipeline to San Francisco and Los Angeles-Long Beach.
Construction Program
The time phasing of the various construction items used for the period prior to 1980 is given in table 69. The entire planning was simplified to facil-itate calculations. The total cost of each item will be equally distributed over the pertinent years.
Table 69. Construction Program of Alternatives 8-1 and 8-2
Construction item
Year of construction or installation
1975 1976 1977 1978 1979
Tank farm Supertanker berths Pipeline to refineries
Alternative 8-1
Criteria
1. Site of deepwater port: Between Point Whitehorn and Sandy Point in the Strait of Georgia.

434.
2. Service area: Six refineries in the San Francisco area.
3. Type of transshipment: Pipeline only. 4. Site of intermediate tank farm: At an un-
specified location about 5 miles from the berths. 5. Type of berths: Fixed. 6. Throughput: 15 and 60 m.t.a. in 1980 and
2000 respectively. 7. Tanker characteristics: 400,000 d.w.t. and
83-foot draft fully loaded.
Requirements
Supertanker berths. The following number of berths would be required: two berths by 1980, and no additional berths between 1980 and 2000.
Dredging quantities. No dredging is required.
Pipelines from supertanker berths to inter-mediate tank farm. One 5-mile-long, 48-inch line per berth would be required, of which 2000 feet would be on a trestle and the remainder on land. No booster pumps would be required since the pressure at the end of the line would be 150 -15 -5 x 21.2 = 29 p.s.i.
Intermediate tank farm. The crude oil storage required in 1980 would be 1.80 x 10 6 long tons.
Allowing 15 acres for general services, the total land requirement would be approximately 50 x 1.80 + 15 = 105 acres.
Pipeline system to the San Francisco area. One 42-inch line would be sufficient for the entire period 1980 through 2000. The total length of the line was estimated at 950 miles. The total length of the branch lines to the six refineries was estimated at 10 miles. However, these branch lines will not be given further consideration because of their insignificance with respect to the trunk line. Also, river crossings will not be taken into consideration because their total length is insignificant in relation to the total

435.
length of the pipeline system. The assumed route of the pipeline is shown in figure 38.
The following approximate horsepbwers would be required: 950 x 10.68 = 10,100 b.hp. by 1980, and 950 x 519.36 = 494,000 b.hp. by 2000. The following installations would be made: 61,750 b.hp. (28.5 m.t.a.) by 1980, 61,750 b.hp. additional (36.5 m.t.a.) in 1985, 123,500 b.hp. additional (47 m.t.a.) in 1989, and 247,000 b.hp. additional (60 m.t.a.) in 1993. (The maximum throughput in million long tons per year of each system is indicated in parentheses.)
The locations of the deepwater port and the intermediate tank farm, and the assumed pipeline route to the San Francisco refineries, are shown in figure 38.
Alternative 8-2
Criteria
1. Site of deepwater port: Between Point Whitehorn and Sandy Point, in the Strait of Georgia, Washington.
2. Service area: Six refineries in the San Francisco area and four in the Los Angeles-Long Beach area.
3. Type of transshipment: Pipeline only. 4. Site of intermediate tank farm: At an un-
specified location about 5 miles from the berths. 5. Type of berths: Fixed. 6. Throughput: 43 and 171 m.t.a. in 1980 and
2000, respectively. To the San Francisco area would go 15 m.t.a. in 1980 and 60 m.t.a. in 2000; to the Los Angeles-Long Beach area, 28 m.t.a. in 1980 and 111 m.t.a. in 2000.
7. Tanker characteristics: 400,000 d.w.t. and 83-foot draft fully loaded.
Requirements
Supertanker berths. The following number of berths would be required: two berths by 1980, and
436.
three berths by 1988 (the one additional berth being constructed in 1987).
Dredging quantities. No dredging is required.
Pipelines from supertanker berths to intermediate tank farm. One 5-mile-long, 48-inch line per berth would be required, of which 2000 feet would be on a trestle and the remainder on land. No booster pumps would be required since the pressure at the end of the line would be 150 -15 -5 x 21.2 = 29 p.s.i.
Intermediate tank farm. The f2llowing crude oil storage would be r equired: 1.80 x 10 ° long tons in 1980 and 2.15 x 10 long tons in 1988 (the additional 0.35 x 10 6 long tons of storage being constructed in 1987).
Allowing 20 acres for general services, the total land requirement would be approximately 2.67 x 50 + 20 = 155 acres.
Pipeline system to California refineries. The pipeline system to California refineries would have two sections. The first section would run from Ferndale, Washington, to Stockton, California; the second section would run from Stockton to the Los Angeles-Long Beach refinery area. At Stockton, a branch line would con-nect the refineries of the San Francisco area with the trunk line.
1. Ferndale-Stockton section. This section would be about 900 miles long. Its assumed route is shown in figure 38. Since the ultimate throughput capacity would be 171 m.t.a., two 56-inch lines would be required. Each line would transport 85.5 m.t.a., which is close to its assumed optimum capacity of 90 m.t.a. For the first period, however, one 56-inch line would be sufficient, since 43 m.t.a. would be the ini-tial throughput. The second line would be required by 1987, and would be installed in 1985 and 1986.

437.
Designing both lines at a maximum throughput of 85.5 m.t.a., the following horsepowers would be re-quired: the first line would require 900 x 47 = 42,300 b.hp. by 1980, and 900 x 333 = 300,000 b.hp. by 1987. The second line would require 900 x 333 = 300,000 b.hp. by 2000.
The following installations would be required: for the first line, 150,000 b.hp. (67 m.t.a.) before 1980, and 150,000 b.hp. additional (85.5 m.t.a.) in 1983; and for the second line, 37,500 b.hp. (42 m.t.a.) in 1986, 37,500 b.hp. additional (52 m.t.a.) in 1992, 75,000 b.hp. additional (67 m.t.a.) in 1994, and 150,000 b.hp. additional (85.5 m.t.a.) in 1996.
The maximum throughput capacity of each system in millions of long tons per year is indicated in paren-theses. The year the additional booster capacity would be installed is assumed to be the year prior to its re-quirement.
2. Stockton-Los Angeles-Long Beach Section. The length of this section would be 335 miles. Although the initial capacity would be only 28 m.t.a., the ul-timate throughput capacity would be 111 m.t.a. It is assumed that two 42-inch lines would meet the need best. Each line would transport 55.5 m.t.a. by 2000, which is close to its assumed optimum of 50 m.t.a. For the first period, however, one 42-inch line would be sufficient, since 28 m.t.a. would be its initial throughput. The second line would be required by 1987, and would be installed in 1985 and 1986.
Designing both lines at a maximum throughput of 55.5 m.t.a., the following horsepowers would be re-quired: the first line would require 335 x 62 = 20,800 b.hp. by 1980 and 335 x 414 = 140,000 b.hp. by 1987. The second line would require 335 x 414 = 140,000 b.hp. by 2000.
The following installations would be required: for the first line, 70,000 b.hp. (44 m.t.a.) by 1980,

438.
and 70,000 b.hp. additional (55.5 m.t.a.) by 1983; and for the second line, 17,500 b.hp. (26 m.t.a.) in 1986, 17,500 b.hp. additional (34 m.t.a.) in 1992, 35,000 b.hp. additional (44 m.t.a.) in 1994, and 70,000 b.hp. additional (55.5 m.t.a.) in 1996.
The maximum throughput capacity of each system in millions of long tons per year is indicated in paren-theses. The year the additional booster capacity would be installed is assumed to be the year prior to its requirement.
3. Stockton-San Francisco section. This branch line would be about 50 miles long. Since its through-put would be the same as that of the pipeline system for alternative 8-1, one 42-inch line and the same boos-ter pressures per mile would be required. Since the length of this branch line is 50 4 950 = 0.0526 times that of the trunk line of alternative 8-1, all horse-power requirements would be smaller in the same pro-portion. Therefore, the following horsepowers would be required: .0526 x 61,750 = 3,250 b.hp. by 1980, 3,250 b.hp. additional in 1985, 6,500 b.hp. additional in 1989, and 13,000 b.hp. additional in 1993.
It should be noted that all branch lines to the individual refineries are deleted from review due to their insignificance to the total project requirements.
The location of the deepwater port and the inter-mediate tank farm, and the assumed pipeline routes to San Francisco and Los Angeles-Long Beach, are shown in figures 32 and 38.

V. COST ESTIMATES OF CRUDE PETROLEUM PORTS
Unit Costs
First Cost
The main cost components of a deepwater port are the construction and/or installation cost of:
1. Berths
2. Channels and maneuvering areas
3. Pipelines
4. Tank farm
5. Artificial island
6. Land (acquisition cost)
The cost of each component will be evaluated in the following sections; however, all components do not necessarily apply to each type of port construction alternative. The year 1970 was selected as the basis year for the cost evaluation.
Berths
Supertankers. The two principal types of berths selected and applied in this detailed study are fixed berths (islands and marginal piers) and monobuoys. Be-cause no berths that could accommodate tankers in the

440.
100,000 to 500,000-d.w.t. class have yet been constructed in the United States, no factual U.S. construction fig-ures exist. Since a study of this nature cannot eval-uate cost data at a preliminary engineering level, cost estimates presented in recent studies have been used. The costs of the supertanker berths presented herein are based on cost estimates prepared by Divcon in June 1968 in a study entitled, Cost Study and Design of Marine Terminal Facilities Delaware Bay Transportation Company Delaware Bay, U.S.A. Since the 1970 cost of steel con-struction in general was reported to be 16 percent higher than in 1968, all costs estimated by Divcon have been increased in this report by 16 percent. For a 250,000- d.w.t. design vessel and a water depth of 72 feet at fixed berths and of 75 feet at monobuoys, Divcon's 1968 estimates were as follows:
1. For a marginal fixed pier with two berths, the jacket alternate is the cheapest solution. This amounted to $10.25 million, excluding the cost of the pumping platform, or $5.125 million per berth.
2. For an island fixed pier, the jacket alter-nate is again the cheapest solution. This amounted to $7.86 million for two berths, excluding the cost of the pumping platform.
3. For a monobuoy, the cost was estimated at $5.96 million for three buoys, excluding the pumping platform, or about $2 million per buoy.
In 1970 figures, the costs for estimates 1, 2, and 3 would be $5.95, $9.1, and $2.3 million, respec-tively.
To relate these costs to different vessel dead-weight tonnages, water depths, and forces due to cur-rents, waves and wind, multiplication factors will be established. In principle, it is impossible to estab-lish these multipliers properly without hydraulic model test studies, since the forces are of a complex dynamic nature that depends on various spring constants. How-ever, since the applied deadweight tonnage (250,000) and water depth (72 feet) are in the range of our study

441.
parameters, it is felt that the approach which was used is acceptable, considering its purpose and its relative importance in comparing identical cases.
For fixed berths it is assumed that the cost would be proportional with deadweight tonnage and water depth. Hence
= d.w.t. 2 x w.d.2 x C C 2 1 d.w.t. 1 w.d. 1 where
C 1 and C 2
are the costs of berths 1 and 2, respectively; d.w.t.1 and d.w.t. 1 are the deadweight tonnages of the design vessel of Berths 1 and 2, respectively; w.d.1 and w.d.2 are the water depths at berths 1 and 2 during berthing procedures. 1/ The reasoning underlying this formula is that both increased deadweight tonnage and increased water depth would increase the overturning moments of the breasting and mooring dolphin structures and would result in an increase of the structural dimensions and required strength of the dolphins. The increase of the forces on the dolphin structures would normally be less than the proportional increase of the deadweight tonnage. However, the construction and installation difficulties would also be greater for greater depths and heavier construction units. Therefore, it is felt that the linear relation, as established, is a reasonable and acceptable approach.
In addition to the differences in deadweight ton-nage and water depth, the forces on the structures and the difficulties of installation would be much greater at exposed locations than at sheltered locations. There-fore, for each site a theoretical exposure factor will be established which relates the cost of a certain berth
1/ In this and subsequent formulas, subscript 1 indi-cates the design conditions of the base case, and sub-script 2, the conditions of the considered alternative. Thus, in this formula, d.w.t. 1 would be 250,000 d.w.t., and w.d.
1 would be 72 feet.

442.
at the site in the Lower Delaware Bay, selected by the Delaware Bay Transportation Company, with the cost of the same berth at another considered site. In the Lower Delaware Bay, berthing and moored vessels would be af-fected by crosscurrents and low waves. The difficulty of installation would also be affected by the currents and waves. At locations where these effects on the con-struction and installation costs are anticipated to be lower than, equal to, or higher than those at the Dela-ware Bay site, the applied exposure factors are respec-tively smaller than, equal to, or greater than 1.0. The selected exposure factor values are arbitrary and are based solely on judgment.
The forces on monobuoys are mainly determined by the deadweight tonnage of the tanker and the degree of exposure. It is assumed that the effects of variations in the tanker's deadweight tonnage and in water depth at the berth on the construction cost, and of variations in water depth at the berth and in forces due to expo-sure on the installation cost, are significantly smaller than in the case of fixed berths. The water depth at the buoy is of significance with respect to the length and weight of the anchor chains, and therefore to the buoyancy of the buoy; and with respect to the installa-tion difficulties of the hoses between buoy and pipe-line. The influence of these two factors is expressed in the formula
C2 = C x exp2 i d.w.t.1
where
C1 and C 2 are the cost of buoys 1 and 2, respectively; d.w.t.1 and d.w.t. 2
are the deadweight tonnages of tankers to be accommodated by buoys 1 and 2, respectively; and exp2 is the exposure factor at the site of buoy 2.
The use of the square root is arbitrary; its pur-pose is to reduce the effect of variations in size.
The costs of the considered berth structures are presented by alternative and subalternative in tables 70,

250 72 1.00 5.95
443.
71, and 72. The costs of marginal piers and monobuoys are presented by one-berth units; those of island piers, by one- and two-berth units. In the case of island piers, the cost of one berth is set at 65 percent of the cost of two. This is an experienced value based on the fact that both berths would use the same mooring dolphins and sometimes the same unloading platform.
Table 70. Cost of Marginal Berths '
(In millions of dollars)
Alternative Sub - alt.
Vessel size (1,000 d.w.t.)
Water depth (feet)
Exposure factor
Cost of one berth
Base
2-1 through 2-4 A,B 300 74 1.00 7.3
2-1 through 2-4 C,D 400 74 1.00 9.8
6-1, 6-2 A 300 74 0.75 5.5
6-1, 6-2 B 400 74 0.75 7.3
7-1, 7-2 -- 157 53 1.00 2.7
7-3, 7-4 -- 250 62 1.00 5.1
b/
8-1, 8-2 -- 400 96/ 12.7
a/ Including the cost of all mechanical equipment on the berths, such as unloading arms and manifold. b/ 83 feet (draft) + 4 feet (clearance) + 9 feet (tide).

444.
Table 71. Cost of Island Piers '
(In millions of dollars)
Cost Sub - alt.
Vessel size (1,000 d.w.t.)
Water depth (feet)
Exposure factor Alterna-
tive Two berths
One berth
Base 250 72 1.00
1-1, 1-2 A,B 300 74 .75 8.4 5.5
1-1, 1-2 C,D 400 74 .75 11.2 7.3
2-5, 4-2 A,B 300 85 1.3 16.8 10.9
2-5, 4-2 C,D 400 85 1.3 22.4 14.6 b/
4-1 A,B 200 75/ 9.9 6.4
4-3 A,B 500 120-b/ 1.3 28•0E
/ 18.22/
5-4 A,B 200 58 0.6 3.5 2.3
5-5 A,B 300 74 0.6 6.7 4.4
5-5 C,D 400 74 0.6 9.0 5.8
5-6 A,B 500 100 0.6 11.22/ 7.42/
a/ Including the cost of all mechanical equipment on the berths, such as unloading arms and manifold. b/ Because of layout restrictions, the water depths are greater than the minimum required depths. c/ Berthing speed is expected to be lower than in other cases.
9.1

Vessel size (1,000 d.w.t.)
Multi-plier
Cost of one buoy Alternative
Sub - alt.
Exposure factor
Base
1-3, 5-2 1-3, 5-2 5-1 5-3 7-5
1.0 2.3
A,B 300 1.5 1.35 3.1
C,D 400 1.5 1.55 3.6
A,B 200 1.5 1.1 2.6
A,B 500 1.5 1.75 4.1
-- 400 1.5 1.55 3.6
1. 0 250
0.95
1.0 1.0 0.8
445.
Table 72. Cost of Monobuoys 2/
(In millions of dollars)
a/ Including all mechanical equipment.
Transshipment barges. In a recent preliminary engineering study for the New York District of the U.S. Army Corps of Engineers, Van Houten Associates, Inc., of New York estimated a cost of $1.1 million)] for an island pier (including unloading arms) suitable to accom-modate 40,000-d.w.t. tankers. The costs of 40,000-d.w.t. transshipment berths were established in relation to this value and to the rate of exposure, and are given in table 73.
Table 73. Cost of Transshipment Berths
(In million of dollars)
Cost of one island pier (two berths)
Alternative
Base
2-5 4-1,4-2, 4-3 5-1 through 5-6
1/ This cost would be $0.95 million at a 1970 cost level.

446.
Channels and Maneuvering Areas
The dredging cost will be based on experienced or estimated cost, on existing or planned disposal areas or disposal practice by local authorities, and on the soil characteristics, if available. In addition, the use of newly developed dredgers will be assumed where applicable.
New York area, alternatives 1-1 and 1-2. The present dimensions of the Ambrose Channel are: length, 10.2 statute miles; width, 2,000 feet; and depth, 45 feet. Dredging to 60 feet was estimated at $30 million in 1966 (see Annex B-1, appendix table 1). Although no dredging quantities were presented in this table, they would equal approximately
10.2 x 5,280 x (2000 + 3 x 15) x 15 - 60 to 65 x 10 6 cubic yards. 27
This would result in a unit dredging cost of ap-proximately $0.45 per cubic yard at 1966 cost levels. It is assumed that dredged quantities would be disposed of in the Atlantic, because the Corps has used various disposal areas in this ocean for many years. Allowing for a cost increase of 25 percent during the period 1966 to 1970, and for a modest increase of about 10 percent for possible further offshore dumping combined with the use of bigger and modern equipment, the unit cost was established at $0.60 per cubic yard for the Ambrose Chan-ne1.1/ It is not anticipated that the dredged material would be significantly different from the soil encoun-tered thus far.
It is anticipated that the sand fill required for island construction would be dredged from the berth-ing areas and turning basin. This would take place when the breakwater construction was substantially completed. Under these conditions a cutter head dredger equipped with a floating pipeline would be able to exe-cute the work. It is estimated that, including the cost of leveling the island, the work could cost $0.40 per cubic yard. For the remainder of the amount to be dredged for the berthing areas and turning basin, a
1/ Recent information quotes $0.90 per cubic yard.

447.
cost of $0.80 per cubic yard was established since the dredged material will be disposed of in the Atlantic, as was the case for the Ambrose Channe1.1/
Delaware Bay area, alternatives 2-1 through 2-5. No data are available with respect to the soil condi-tions of channels A, B, and D. Therefore, a cost was established in relation with that of the New York area. Taking into account the various distances to deep water, the following costs were established: channel A, $0.40 per cubic yard; channel B, $0.80 per cubic yard; and channel D, $0.90 per cubic yard.2/
It is anticipated that the quantity and quality of sand fill required for the construction of the arti-ficial island would not be found close enough to the site to permit the use of a cutter head dredger. There-fore, the cost was based on the use of a trailing hopper dredger in conjunction with a suction dredger. Includ-ing losses during the construction of the island, the cost was set at $1.00 per cubic yard.
Mississippi Delta area, alternatives 4-1 through 4-3. For the cost of the sand fill of the artificial =and, the same basis was used as for that in the Dela-ware Bay. Therefore, a cost of $1.00 per cubic yard will be applied.
Freeport area, alternatives 5-4 through 5-6. Soil borings up to 90 feet deep are available at the existing ocean channel. They show various clay layers ranging in consistency from soft to hard (the harder clay is called Beaumont clay). It cannot be predicted how far these layers extend into the gulf. Therefore, arbitrary values were selected, which might very well be low. These values are: for the ocean channel, $1.00 per cubic yard; and for the inland basins and channels, $1.30 per cubic yard.
Jetties would be required at both sides of the channel to the deepwater harbor to protect the channel
17 Recent information quotes $0.90 per cubic yard. 2/ Recent information quotes $1.15 per cubic yard on the average.

448.
in the shore area. The presently authorized 45-foot channel to Freeport will require relocation of the pres-ent North Jetty. The cost of constructing a new jetty was estimated at about $5 million by the Galveston Dis-trict of the Corps of Engineers. The offshore section of the jetty would be about 3,300 feet long; its tip would be located in about 17 feet of water. The re-quired depth at the tip of the jetties in alternatives 5-4 through 5-6 is assumed to be about one-third to one-fourth of the hypothesized ocean channel depths. The depths at the tips of the jetties were set at 21, 24, and 27 feet, and these depths occur at distances of 0.7, 1.2 and 2.0 miles off shore, for alternatives 5-4, 5-5, and 5-6, respectively. Each of these respective jetties would require an amount of stone 2.5, 4.0 and 6.5 times greater than the proposed new North Jetty. Therefore, the cost of each jetty was established at: 2.5 x $5 million = $12.5 million for alternative 5-4; 4.0 x $5 million = $20.0 million for alternative 5 5; and 6.5 x $5 million = $32.5 million for alternative 5-6.
Los Angeles Area, Alternatives 6-1 and 6-2. According to the Interim Review Report on Los Angeles-Long Beach Harbors,i/ a volume of 13.8 million cubic yards would be dredged at a cost of $7.6 million. Therefore, a unit cost of $0.55 per cubic yard was applied. The same unit cost will be used in this study.
San Francisco Area, Alternatives 7-1 through 7-4. According to a Corps of Engineers' study, 2 / maintenance dredging of the Oakland area would cost $0.55 per cubic yard if a disposal area in the Pacific were used (a 32- mile round-trip distance). The 1970 cost would be about $0.75 per cubic yard. The round-trip distance for Richmond and Pinole Shoal Channels would be 28 and
1/ Department of the Army, Corps of Engineers, Interim Review Report on Los Angeles-Long Beach Harbors, Los Angeles District, June 1971, p. E-6. 2/ Department of the Army, Corps of Engineers, Commit-tee on Tidal Hydraulics, San Francisco Bay, California; Disposal of Dredge Spoil, Supplement 1 to Appendix V, Sedimentation and Shoaling and Model Tests to Report of Survey on San Francisco Bay and Tributaries, California, Vicksburg, Mississippi, December 1965, p. 23.

449.
56 miles, respectively, according to this study. 1/ Be-cause the unit cost of maintenance dredging should be lower than that of first-cost dredging and because no sufficient soil data are available, the following unit costs were established: for the channel to Richmond, $1.00 per cubic yard; and for Pinole Shoal and Car-quinez Strait-Suisun Bay Channel, $1.50 per cubic yard. It is anticipated that the main portion of the dredged material of the latter ciwinel would be used for land-fill within diked areas./
Pipelines
To determine the various cost components of in-stalled pipelines, a survey on the cost of recently in-stalled lines was undertaken. Detailed cost breakdowns of gasline projects are available through the Inter-state Commerce Commission (ICC). Detailed costs on petroleum product lines are not obtainable because these projects do not require authorization by ICC and because the companies involved are reluctant to release detailed information. The annual tabulation of the total cost and of the four main cost components of transmission lines given in the Oil and Gas Journal could not be used, since analyses showed differences of over 100 percent in costs per mile. For instance, an analysis of six of the thirteen 36-inch onshore trans-mission lines, as published in the August 2, 1971, Oil and Gas Journal (p. 104), showed costs per mile as pre-sented in order of increasing length in table 74.
The two main components of the total cost are those of material and labor. The primary reasons for the variation in material cost are the variation in the wall thickness of the pipe and the included cost of valves, tie-overs, headers, pig traps, etc. The varia-tion in labor cost arises from the presence of river crossings. The reason that the variation in cost is not a function of length in this tabulation is that the
1/ The disposal area would be located west of Seal Rocks, approximately 2 miles off the Golden Gate, within the ocean bar. 2/ It is reported that the dredging cost would run close to $2.00 per cubic yard if dumping were allowed only at the 100-fathom line, which is located 35 miles off the entrance of the Golden Gate.

Table 74. Cost Components of 36-Inch Transmission Lines
(In thousands of dollars per mile)
Length of line (miles)
Right-of- way and damages
Miscella- neous State Material Labor Total
4.13 Kentucky 50.5 136.7 154.0 16.3 357.5
9.80 Oklahoma 1.4 119.5 46.2 15.2 182.3
36.04 Louisiana 19.5 168.0 100.9 23.9 312.3
51.12 Kentucky 6.5 105.0 67.6 7.2 186.3
153.1 New Mexico- Illinois 5.4 94.0 55.3 8.0 162.7
202.2 Kentucky- Louisiana 8.1 129.4 92.9 16.2 246.6

451.
mileage shown is a total of sections of various lengths installed along a pipeline length often 5 to 20 times longer than the shown mileage.
Seven specific 1969 projects have been analyzed to determine the four cost components of 36- and 42- inch onshore lines, of 36-inch river crossings, and of 36-inch offshore lines. The ICC docket numbers of these projects are CP 69-115, CP 69-139 and CP 69-184 for the onshore lines; CP 69-346 for the river cross-ings; and CP 69-326, CP 69-327 and CP 69-336 for the offshore lines. All material costs will be trans-formed to an equivalent cost for pipes with a wall thickness of 0.500 inches.
Onshore lines. The following paragraphs will analyze projects CP 69-115, CP 69-139, and CP 69-184, as filed at ICC.
1. Project CP 69-115.
Company: Texas Gas Transmission Corpora- tion.
Route: From Monroe, Louisiana, to Louis-ville, Kentucky, mainly parallel the Mississippi River and Ohio River; total length, about 550 miles.
Total length of new pipelines: 41.74 miles of 36-inch onshore line (seven sections) and 2.4 miles of 42-inch onshore line (one section). Lengths of the seven sections of 36-inch line: 1.95, 3.30, 3.75, 4.16, 8.04, 10.08, and 10.46 miles. The cost was pre-sented in three sections 34.28, 3.30, and 4.16 miles long.
Locations of sections: Monroe, Louisiana; Cleveland, Mississippi; Memphis, Tennessee; and Louis-ville, Kentucky.
Table 75 presents the total cost and a break-down by the four components of the four sections of the line, as filed. Table 76 shows the same cost com-ponents, but per mile, and in addition shows the two main components (materials and installation) separ-ately by pipe and valves, traps, etc.
For the various sections, the unit costs listed in table 77 were applied. It should be noted that in

452.
Table 75. Cost Components of Transmission Lines of Project CP 69-115
(In thousands of dollars)
Land survey
and right
of way
Engi- neering
and super-vision
Section Mate- rials
Instal-lation Total
34.28 miles of 36-inch
3.30 miles of 36-inch
4.16 miles of 36-inch
2.4 miles of 42-inch
494 4,103 3,068 96 7,761
21 541 512 13 1,087
64 682 712 19 1,477
36 768 413 15 1,232
Table 76. Cost Components Per Mile of Transmission Lines of Project CP 69-115
(In thousands of dollars per mile)
Materials Land survey
and right
of way
Pipe and
coating
Valves, traps, etc.
Installation
Valves, traps, etc.
Engi- neering
and super-vision
Pipe Total
14 .4.... 6.4....
15.4.... 15.0....
106.2 13.5 73.9 15.6
128.2 35.7 107.9.4/ 47.3
128.1 35.8 127.4b/ 43.7
195.4 124.6 84.5 87.5
2.8 226.4
3.9 329.4
4.6 355.0
6.3 513.3
a/ Including $18.2 thousand for rock trenching, or $89.7 thousand without rock trenching. 12/ Including $32.5 thousand for rock trenching, or $94.9 thousand without rock trenching.

453.
this table different unit costs of material and instal-lation for the same pipe size were applied depending on location of the particular section. Valves for 36- inch lines were listed at $30,000 to $38,000 material cost each, and $25,000 installation cost each. Pig traps were listed at $20,000 material cost each and $11,000 installation cost each.
Table 77. Unit Costs of Various Pipe Sizes
(In dollars)
Diameter and wall thickness (inches)
Pipe and coating
Mile
Instal
Foot
lation
Mile Foot
36/.360
36/.430
36/.516
42/.602
16.75 19.70 [23.85 23.50 37.00
88,440 14.00 73,920 104,016 14.00 73,920 125,928 14.00 73,920 124,080 17.00 89,760 195,360 16.00 84,480
If the material costs of the five pipes of table 77 are transformed to the costs for pipes with a wall thickness of 0.500 inch, the material cost per mile would be $128,833, $120,949, $122,023, $120,233, and $162,259, respectively. This results in an aver-age material cost of $123,010 per mile for the 36- inch, 0.500-inch wall-thickness line. The average in-stallation cost of the 36-inch line was $77,880, and that of the 42-inch line was $84,480.
The average survey and right-of-way costs per mile of the four sections of table 76 were $14,410, $6,364, $15,385, and $15,000, respectively, and that of engineering and supervision, $2,800, $3,939, $4,567, and $6,250, respectively. The averages of these values would be $12,790 and $4,390.
2. Project CP 69-139.
Company: Texas Gas Transmission Corporation. Route: From Columbia, Louisiana, to Kenton,
Tennessee.
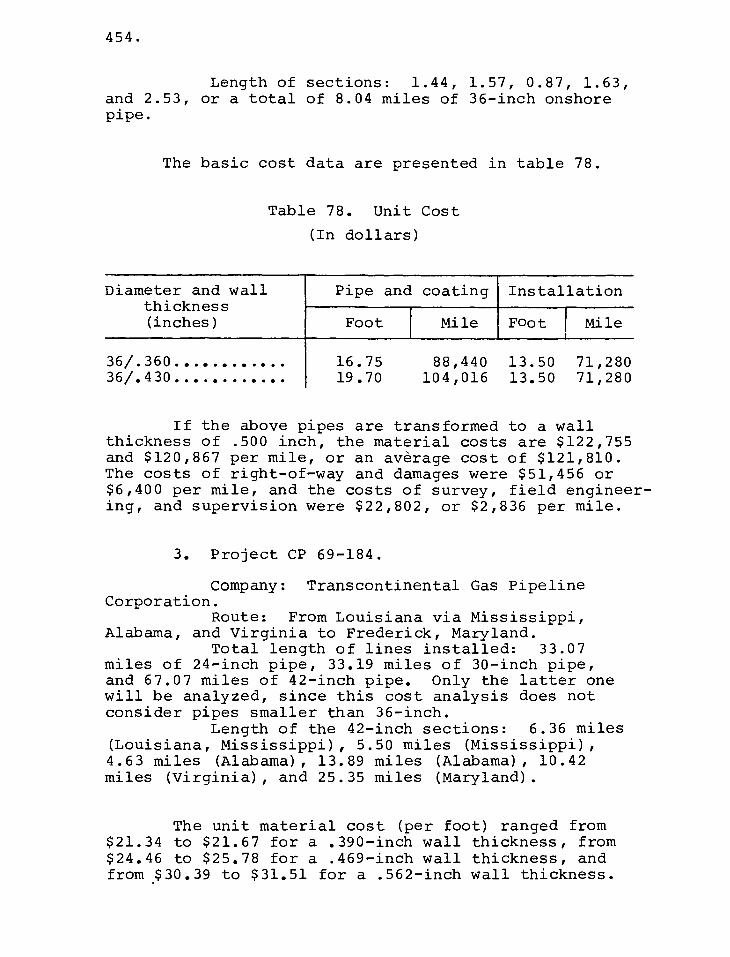
454.
Length of sections: 1.44, 1.57, 0.87, 1.63, and 2.53, or a total of 8.04 miles of 36-inch onshore pipe.
The basic cost data are presented in table 78.
Table 78. Unit Cost
(In dollars)
Diameter and wall thickness (inches)
Pipe and coating
Mile
Instal
Foot
lation
Mile Foot
36/.360
36/.430
16.75 88,440 13.50 71,280
19.70 104,016 13.50 71,280
If the above pipes are transformed to a wall thickness of .500 inch, the material costs are $122,755 and $120,867 per mile, or an average cost of $121,810. The costs of right-of-way and damages were $51,456 or $6,400 per mile, and the costs of survey, field engineer-ing, and supervision were $22,802, or $2,836 per mile.
3. Project CP 69-184.
Company: Transcontinental Gas Pipeline Corporation.
Route: From Louisiana via Mississippi, Alabama, and Virginia to Frederick, Maryland.
Total length of lines installed: 33.07 miles of 24-inch pipe, 33.19 miles of 30-inch pipe, and 67.07 miles of 42-inch pipe. Only the latter one will be analyzed, since this cost analysis does not consider pipes smaller than 36-inch.
Length of the 42-inch sections: 6.36 miles (Louisiana, Mississippi), 5.50 miles (Mississippi), 4.63 miles (Alabama), 13.89 miles (Alabama), 10.42 miles (Virginia), and 25.35 miles (Maryland).
The unit material cost (per foot) ranged from $21.34 to $21.67 for a .390-inch wall thickness, from $24.46 to $25.78 for a .469-inch wall thickness, and from .$30.39 to $31.51 for a .562-inch wall thickness.

455.
For pipes with a wall thickness of .500 inch, these values would be $27.36, $27.78, $26.08, $27.48, $27.04, and $28.03, respectively. The average value would be $27.30.
The unit installation cost (per foot) varied between $11.85 and $16.47; an average value would be $14.16.
The cost components are: right-of-way and damages, $20,486 per mile; material, $144,144 per mile (equivalent 0.500 inch); installation, $74,765 per mile; and survey and engineering, $7,037 per mile.
The results of the analysis of these three proj-ects are presented in table 79.
The total average unit costs are $210,200 per mile for a 36-inch line and $257,300 per mile for a 42-inch line. If the cost of a 36-inch line were trans-formed into that of a 42-inch line using the ratio of the diameters, this would result in 42/36 x $210,200 = $245,200. This proves that the total costs of pipe-lines relate to each other approximately in propor- tion to their diameters.
Transforming the average total unit cost of the 42-inch lines into that of 48-inch lines would result in 48/42 x $257,300 = $294,057. At 1970 cost levels this would be approximately $300,000. Therefore, average total unit costs were established for onshore lines as presented in table 80.
The unit costs of table 80 will be applicable for all alternatives except 1-3, 8-1, and 8-2. For alternative 1-3, it is anticipated that the pipelines would traverse the center of Long Branch, New Jersey. The costs of right-of-way and damages and of installa-tion would be considerably higher than the average unit costs. The total cost of all lines between the shore and the intermediate tank farm will be increased by an arbitrary value of 50 percent. For alternative 8-1 and 8-2, the pipelines to the California refineries would have to traverse mountainous areas of Oregon and north California. Therefore, the total unit cost will be

Table 79. Summary of Unit Costs of ICC Projects
(In thousands of dollars per mile)
Project
Right- of-way and
damages
Material (0.500" wall
thickness)
Diameter (inches)
Installation Miscellaneous Total
4.39
6.30
2.84
7.04
CP 69-115....
CP 69-115....
CP 69-139....
CP 69-184....
36 12.79 123.01 77.88
42 15.00 162.29 84.48
36 6.40 121.81 71.28
42 20.49 144.14 74.77
218.07
268.07
202.33
246.44

457.
Table 80. Average Total Unit Cost of Onshore Lines on 1970 Cost Basis
(In thousands of dollars per mile)
Diameter Cost
24 32 36 42 48 56
150 200 225 263 300 350
increased by an arbitrary value of 30 percent, appli-cable for a 300-mile-long section. This 30 percent corresponds with an installation cost twice as high as that included in the regular total average unit cost (see table 79).
River crossings. The cost of pipelines crossing water bodies, such as rivers and canals, will be based on analysis of Project CP 69-346. The rivers crossed are in the Northwest United States. The main cost components of the various crossings are presented in table 81; the costs presented in the ICC files were transformed to unit costs per mile.
Based on table 81 and judgment, extrapolations were made for the costs of crossings up to 1 mile long. These are presented in table 82.
Offshore submarine lines. The cost of submarine lines will be based on analysis of Projects CP 69-326, CP 69-327, and CP 69-336. The main cost components of these projects, all transformed to a unit cost per mile, are presented in table 83.
Averaging the three major cost components of the 16-inch lines and expressing these averages on a 20- inch line cost basis would result in the following values in thousands of dollars per mile:

Table 81. Unit Cost of River Crossings
(In thousands of dollars per mile)
Project code Length (miles) River
Instal-lation
Diame-ter (inch)
Location of
crossing
Material (.625" wall
thickness)
Contin- gency (percen- tage)
10 CP 69-346.... 36 0.2 Kootenai Bonners Ferry, Idaho
295 1,445
36
36
36
36
CP 69-346....
CP 69-346....
CP 69-346....
CP 69-346....
0.4 Pend Oreille
0.3 Snake
0.2 Umatilla
2.4-V Sprague
Sand Point, Idaho
Starbuck, Washington
Stanfield, Oregon
Klamath Falls, Oregon
231 1,120
---1,843---
---1,325---
275 466
10
11
8
8
a/ Text is not explicit on length of river crossing.
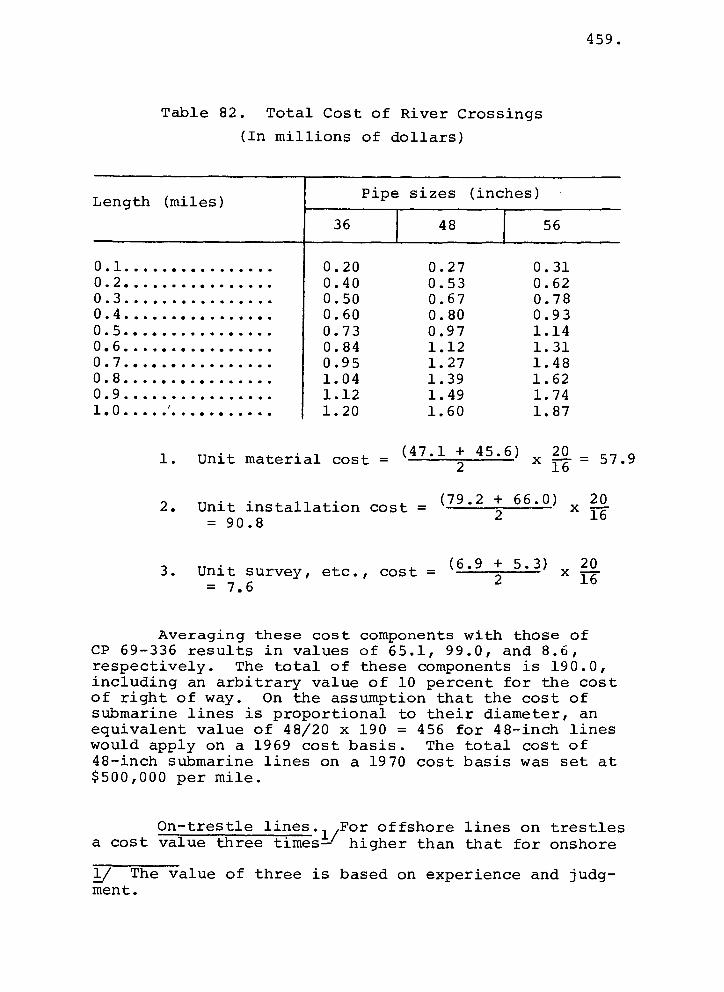
459.
Table 82. Total Cost of River Crossings
(In millions of dollars)
Length (miles) Pipe sizes (inc hes)
36 56 48
0.1
0.2
0.3
0.4
0.5
0.6
0.7
0.8
0.9
1.0
0.20 0.40 0.50 0.60 0.73 0.84 0.95 1.04 1.12 1.20
0.27 0.53 0.67 0.80 0.97 1.12 1.27 1.39 1.49 1.60
0.31 0.62 0.78 0.93 1.14 1.31 1.48 1.62 1.74 1.87
1. Unit material cost - (47.1 + 45.6) 20 2 x . 57.9
16
2. Unit installation cost = (79.2 + 66.0) 20 x 16 =90.8 2
(6.9 + 5.3) 20 3. Unit survey, etc., cost - 2 x 16 = 7.6
Averaging these cost components with those of CP 69-336 results in values of 65.1, 99.0, and 8.6, respectively. The total of these components is 190.0, including an arbitrary value of 10 percent for the cost of right of way. On the assumption that the cost of submarine lines is proportional to their diameter, an equivalent value of 48/20 x 190 = 456 for 48-inch lines would apply on a 1969 cost basis. The total cost of 48-inch submarine lines on a 1970 cost basis was set at $500,000 per mile.
On-trestle lines. For offshore lines on trestles a cost value three times-' higher than that for onshore
1/ The value of three is based on experience and judg-ment.

16 .500 Loui- 5.5 1 siana
47.1 79.2
Table 83. Unit Cost of Submarine Transmission Lines
(In thousands of dollars per mile)
State
Wall thick-ness (inch)
Number of sec- tions
Right of way, damages, landing
fee
Material (.500" wall thick- ness)
Survey, field engi-
neering, and
super-vision
Project code
Diame-ter (inch)
Total length (miles)
Instal-lation
CP 69-326
CP 69-327
CP 69-336
6.9
16 .406 Louisi- 12.2 1 0.0 45.6 66.0 5.3 anaa/
20 1 .5006l.2
Louisi- 28.2 1 0.0 107.2 9.6 .562 ana.a./
76.3
2/ Text is not explicit that line is located in Louisiana.

0.81 1.00 0.80 1.00 1.30
55 66 60 80
100
3 5 7 5 5
461.
lines was selected, which would equal $900,000 per mile for 48-inch lines. This ratio will depend on the water depth, bottom and wave conditions.
Risers. The cost of risers will not be taken into consideration since it is insignificant with re-spect to the total cost of long submarine lines.
Booster platforms. The 1968 costs of booster platforms (pumping platforms) estimated by Divcon were in the range of $0.70 million or, at a 1970 cost level, $0.81 million. The cost depends on the size of the structure and of the boosters, the water depth, and the rate of exposure.
Costs of booster platforms were established based on Divcon's estimate and on judgment regarding the influence of water depth, size, and rate of ex-posure on the cost, and are given in table 84.
Table 84. Cost of Booster Platforms
(In millions of dollars)
Water depth (feet)
Number of booster pumps
Cost of one platform
Alternative
Base 1-3, 2-1, 2-3 5-1 5-2 5-3
Booster pumps. A figure of $150 per b.hp. was established.
Meters and valves. The cost of meters and valves combined was established at $1 million per berth and per refinery.

462.
Tank Farm
In their study of the cost of a deepwater port off Big Stone Beach, the Delaware Bay Transportation Company projected a storage capacity of 17 million barrels, equivalent to approximately 2.35 million long tons of crude oil. Their 1970 estimated cost was approx-imately $60 million, including all tank farm piping. This figure would result in a unit cost of $25.5 per long ton. In their recent study for the New York Dis-trict of the U.S. Army Corps of Engineers, Van Houten Associates, Inc., gave a cost of $4.00 per barrel of storage, including all tank-farm piping. This figure is equivalent to $29.2 per long ton of storage, or $25.2 per long ton at a 1970 cost level.
Based on the above figures, a value of $26 per ton of storage was selected. The cost of all tank-farm piping is included in this figure.
Artificial Island
The cost of an artificial island is determined by the cost of the breakwater(s) and of the sand fill. Since the cost of the sand fill is given in the section entitled "Channels and Maneuvering Areas," this section will deal only with that of the breakwater.
The cost of a breakwater is determined mainly by the water depth, design wave characteristics, anticipa-ted conditions of the sea during the construction period, the type of structure and construction selected, and the cost of labor and material. Because no data on de-sign or construction cost of breakwaters at the selected sites are available, very rough estimates of cost will be used in this report.
In a current study for a breakwater in about 20 feet of water at City Island in the westernmost area of Long Island Sound, a preliminary cost estimate arrived at $4,000 per foot of breakwater length, or about $20 million per statute mile.
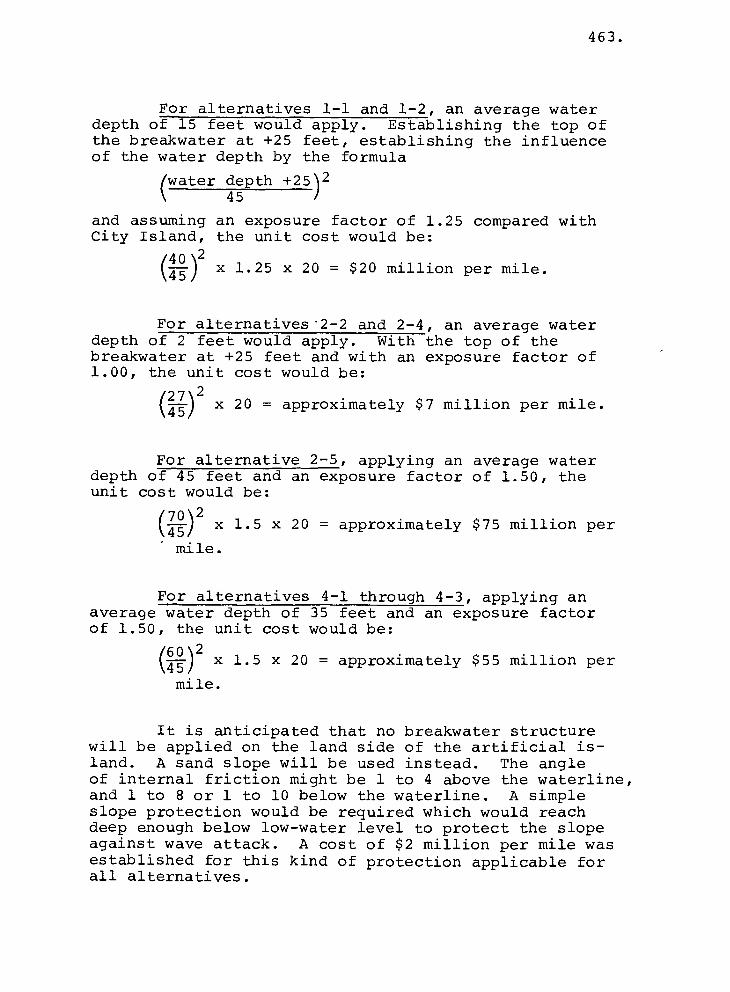
463.
For alternatives 1-1 and 1-2, an average water depth of 15 feet would apply. Establishing the top of the breakwater at +25 feet, establishing the influence of the water depth by the formula
(water depth +25) 2 45
and assuming an exposure factor of 1.25 compared with City Island, the unit cost would be:
(40)2 x 1.25 x 20 = $20 million per mile. k45
For alternatives 2-2 and 2-4, an average water depth of 2 feet would apply. With the top of the breakwater at +25 feet and with an exposure factor of 1.00, the unit cost would be:
()
2x 20 = approximately $7 million per mile. 45
For alternative 2-5, applying an average water depth of 45 feet and an exposure factor of 1.50, the unit cost would be:
(
22) 2 x 1.5 x 20 = approximately $75 million per 45 . . mile.
For alternatives 4-1 through 4-3, applying an average water depth of 35 feet and an exposure factor of 1.50, the unit cost would be:
(60) 2 x 1.5 x 20 = approximately $55 million per k45 mile.
It is anticipated that no breakwater structure will be applied on the land side of the artificial is-land. A sand slope will be used instead. The angle of internal friction might be 1 to 4 above the waterline, and 1 to 8 or 1 to 10 below the waterline. A simple slope protection would be required which would reach deep enough below low-water level to protect the slope against wave attack. A cost of $2 million per mile was established for this kind of protection applicable for all alternatives.

464.
Land
The costs per acre that were established for the various hypothesized onshore sites are as follows:
1. New Shrewsbury, New Jersey: $10,000 (alter-native 1-3)
2. Big Stone Beach, Delaware: $5,000 (alterna-tives 2-1, 2-3)
3. Freeport, Texas: $2,000 (alternatives 5-1 through 5-6)
4. Los Angeles, California: $20,000 (alterna-tive 6-2)
5. Richmond, California: $20,000 (alternatives 7-1, 7-3)
6. Moss Landing, California: $10,000 (alterna-tive 7-5)
7. Ferndale, Washington: $5,000 (alternatives 8-1, 8-2).
The cost of the construction of artificial is-lands is covered in the cost of breakwaters and sand fill.
Operating Cost
The operation of a deepwater port is divided into the following components:
1. Marine operations 2. Unloading and loading operations at the
berths 3. Tank farm operations 4. Pipeline operations 5. Personnel transport.
The costs given for these components will provide only for the cost of personnel and equipment directly related to the operations. It is anticipated that all facilities would operate on a 7-day-a-week program and that four 8-hour shifts would therefore be required. The average annual labor cost of a person is set at $15,000.

Marine Operations
The minimum amount of personnel required for marine operations is given in table 85.
Table 85. Personnel Requirements by Number of Berths
465.
Personnel
Number of supertanker berths
Fixed
Numb transs
be
er of hipment rths Buoy
1-8 9-16 1-8 9-16 1-8 9-16
Dock master Assistant dock master Foremen Oarsmen
Total
1 1 1 1
4 4 4 4 -- --
4 8 4 8 4 8
24 48 12 24 16 32
33 61 21 37 20 40
In the case of fixed berths, tugs would be re-quired to assist tankers during their maneuvering in the channels and at the berths. The number of tugs used during these operations would vary from two to six, de-pending on the horsepower capacity of the tugs, the deadweight tonnage and loading condition of the tanker, and the conditions of currents, waves and wind. Be-cause of the amount of labor involved in tug operations, the present trend in the United States as well as abroad is toward the use of a small number of very powerful tugs.
For this study, the requirement for fixed berths will be set at three 4,000 shaft-horsepower (s.hp.) tugs for supertanker operations and one 4,000 s.hp. tug for transshipment barge operations. It is anticipated that this number would provide safe and smooth operations.

466.
Launches are required to transport oarsmen to the hooks on the mooring dolphins and to assist in transporting the ropes and wires from tankers to dolphins.
In the case of monobuoys, no tugs, but two powerful launches, are required. The launches are re-quired to transport the floating hoses to and from the tanker. The annual cost of a 4,000 s.hp. tug was es-timated at $660,000, that of a powerful launch at $175,000, and that of a small launch at $65,000. Accor-ding to table 11 of chapter III, the berth occupancy time at a fixed berth varies from 27 to 44 hours. It has been anticipated that each tanker would require an average tug assistance time of 10 tug-hours for maneu-vering, berthing and deberthing. Since the average berth occupancy time of a supertanker would be 1.5 days, each berth would require 10/1.5 = 7 tug-hours per day. Three tugs operating 75 percent of the time would have 3 x 24 x .75 = 54 tug-hours available. This means that they could serve 54/7 = 8 berths. For nine or more berths, more tugs would be required. This num-ber is set at two. It is anticipated that a team of oarsmen would spend 3.5 hours in berthing and deberthing a supertanker. Since the average berth occupancy time of such a tanker would be 1.5 days, each berth would re-quire 3.5/1.5 = 2.3 team-hours per day. One team oper-ating 75 percent of the time would have 24 x .75 = 18 hours available. This means that they could serve 18/ 2.3 = 8 berths. For nine berths and over, four addi-tional shifts of oarsmen would be required. For mono-buoys the requirement of launches and oarsmen will also double for nine or more berths.
For transshipment berths, it is anticipated that one extra tug would be required to assist a tug-barge combination during berthing and deberthing operations, and that this extra tug would spend about 1 hour per barge. Since the average berth occupancy time of a transshipment barge would be 6 hours, or 0.25 days, each berth would require 1/0.25 = 4 tug-hours per day. One tug operating 75 percent of the time would have 24 x .75 = 18 hours available. This means that one tug would serve 18/4 = 4.5 berths, or that two tugs could serve nine berths. To keep the computations comparable with those for supertanker berths, it is assumed that

er of shipment erths
Numb trans
467.
these two tugs would be required for eight berths and less, and that two more tugs would be required for nine or more berths. The annual operating cost of two tugs, each with a capacity in the range of 1,000 s.hp., is set at $635,000.
Table 86 presents the annual operating cost of the various berths concepts.
Table 86. Annual Operating Cost by Number of Berths
(In millions of dollars)
Number of supertanker berths
Fixed Item Buoy
9-16 1-8 1-8 1-8 9-16 9-16
Personnel 0.495 0.915 0.315 0.555 0.300 0.600 Launches 0.065 0.130 0.350 0.700 0.065 0.130 Tugs 2.000 4.000 -- 0.635 1.270
Total 2.560 5.045 0.665 1.255 1.000 2.000
In the foregoing it has been assumed that the tugs and oarsmen required at the deepwater port would be used exclusively at the deepwater port. However, if a deepwater port were to be located near other port facilities, the same tugs and oarsmen could be used by all facilities. This would considerably reduce the operating cost of the deepwater port, especially for three berths and less. How great a reduction this would be would depend on the distances between the deepwater port and the other facilities and on the necessity for tug assistance at the other facilities in comparison with the deepwater port. Assuming that other facilities in the vicinity would share the use of tugs and oarsmen, an arbitrary reduction factor of 50

468.
percent will be taken into account in the case of alter-native 1-1, subalternatives A and C of alternative 1-2, and alternatives 6-1, 6-2, 7-1, 7-3, 8-1, and 8-2.
Unloading and Loading Operations at the Berths
During the entire period of unloading a super-tanker or loading a transshipment barge, one operator would be present at the berth. Therefore, four opera-tors would be required for each berth per week. The annual labor cost would amount to $60,000 per berth
Tank Farm Operations
The number and kind of personnel required on the tank farm depend on the metering system of the tanks and the possibility of operating the valves from a cen-tral control room (remote control system). In this study, five persons per shift will be assumed a suf-ficient number; thus, 20 persons would be required, at an annual cost of $300,000. The cost of personnel handling the bunkering facilities will not be included in the cost of the tank farm operations, since they provide a service whose cost is separate from that of crude oil handling. The cost of personnel handling the oil separation and cleaning system and the floating oil spill abatement equipment, if present, will also be excluded. These costs are excluded because these per-sonnel would provide a service only in an emergency, and because most probably all these costs would be com-pensated by the payments of fines, etc., by the company responsible for the spill. The cost of the pumphouse personnel is included in the operating cost of booster stations and pipelines. In case of alternative 6-1, no intermediate tank farm would be required. However, management of the terminal facilities would be required, and the annual cost of labor and expenses of this man-agement was set at $300,000.
Pipeline Operations
Since one person at a time would be present at a booster station, four persons per week would be required.
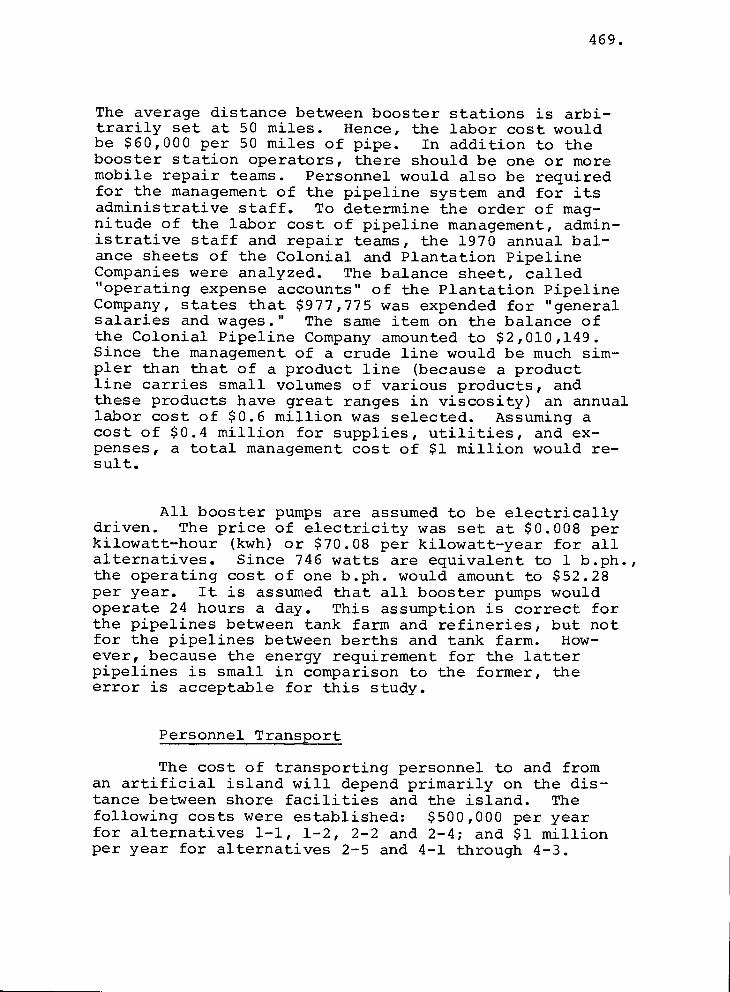
469.
The average distance between booster stations is arbi-trarily set at 50 miles. Hence, the labor cost would be $60,000 per 50 miles of pipe. In addition to the booster station operators, there should be one or more mobile repair teams. Personnel would also be required for the management of the pipeline system and for its administrative staff. To determine the order of mag-nitude of the labor cost of pipeline management, admin-istrative staff and repair teams, the 1970 annual bal-ance sheets of the Colonial and Plantation Pipeline Companies were analyzed. The balance sheet, called "operating expense accounts" of the Plantation Pipeline Company, states that $977,775 was expended for "general salaries and wages." The same item on the balance of the Colonial Pipeline Company amounted to $2,010,149. Since the management of a crude line would be much sim-pler than that of a product line (because a product line carries small volumes of various products, and these products have great ranges in viscosity) an annual labor cost of $0.6 million was selected. Assuming a cost of $0.4 million for supplies, utilities, and ex-penses, a total management cost of $1 million would re-sult.
All booster pumps are assumed to be electrically driven. The price of electricity was set at $0.008 per kilowatt-hour (kwh) or $70.08 per kilowatt-year for all alternatives. Since 746 watts are equivalent to 1 b.ph., the operating cost of one b.ph. would amount to $52.28 per year. It is assumed that all booster pumps would operate 24 hours a day. This assumption is correct for the pipelines between tank farm and refineries, but not for the pipelines between berths and tank farm. How-ever, because the energy requirement for the latter pipelines is small in comparison to the former, the error is acceptable for this study.
Personnel Transport
The cost of transporting personnel to and from an artificial island will depend primarily on the dis-tance between shore facilities and the island. The following costs were established: $500,000 per year for alternatives 1-1, 1-2, 2-2 and 2-4; and $1 million per year for alternatives 2-5 and 4-1 through 4-3.
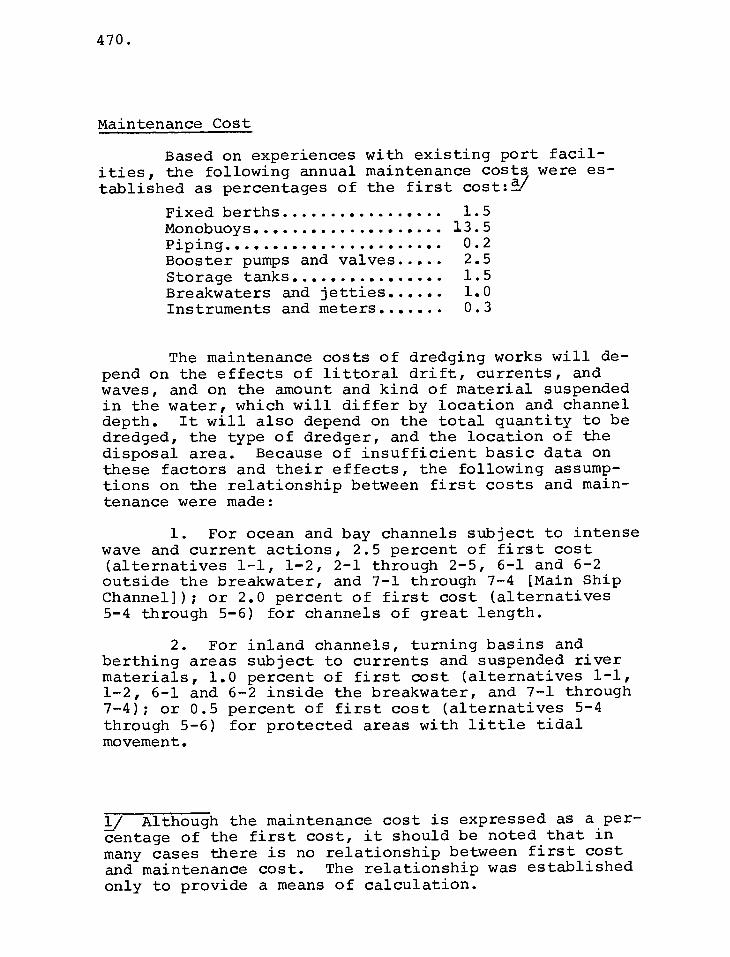
470.
Maintenance Cost
Based on experiences with existing port facil-ities, the following annual maintenance costs were es-tablished as percentages of the first cost:/
Fixed berths 1.5 Monobuoys 13.5 Piping 0.2 Booster pumps and valves 2.5 Storage tanks 1.5 Breakwaters and jetties 1.0 Instruments and meters 0.3
The maintenance costs of dredging works will de-pend on the effects of littoral drift, currents, and waves, and on the amount and kind of material suspended in the water, which will differ by location and channel depth. It will also depend on the total quantity to be dredged, the type of dredger, and the location of the disposal area. Because of insufficient basic data on these factors and their effects, the following assump-tions on the relationship between first costs and main-tenance were made:
1. For ocean and bay channels subject to intense wave and current actions, 2.5 percent of first cost (alternatives 1-1, 1-2, 2-1 through 2-5, 6-1 and 6-2 outside the breakwater, and 7-1 through 7-4 [Main Ship Channel]); or 2.0 percent of first cost (alternatives 5-4 through 5-6) for channels of great length.
2. For inland channels, turning basins and berthing areas subject to currents and suspended river materials, 1.0 percent of first cost (alternatives 1-1, 1-2, 6-1 and 6-2 inside the breakwater, and 7-1 through 7-4); or 0.5 percent of first cost (alternatives 5-4 through 5-6) for protected areas with little tidal movement.
1/ Although the maintenance cost is expressed as a per-centage of the first cost, it should be noted that in many cases there is no relationship between first cost and maintenance cost. The relationship was established only to provide a means of calculation.
471.
Total Costs
Applying the unit costs derived in the preceding sections to the engineering requirements of the selected alternatives and subalternatives results in total first costs, total annual operating and maintenance costs. These are given in table 87. A breakdown of the first costs into five components is given in table 88.

0130 0140
Table 87. First, Operating and Maintenance Costs of Crude Petroleum Alternatives
(In millions of dollars)
Cost
2000 Code M Alter- native
1980 volume (m.t.a.) Oper-
ating
1980
Main- tenance
2000 volume (m.t.a.)
1980- 2000 first Oper-
ating Main-
tenance
1975-79 first
Cost
New York Area
b/ 3.3 0010 1-1-A 30 132.7 1.9 35 0 3.3 1.9 0020 1-1-B 35 132.9
s/
C-/ 3.4 1.9 70 1.4 3.7 2.0 0030 1-1-C 30 148.9F/
3.4 3.3 2.2 35 0 3.3 2.2
149.1 0040 1-1-D 35 230.7-6-
/ 5.7
/ 9.3
2.2 70 1.4 3.7 2.2 3/ 0050 1-2-A 100 2.5 150 8.1 7.8 2.7
317'31- 0060 1-2-B 150
3.1 300 31.4 13.9 3.7 0070 1-2-C 100 252.9 -/ 5.7 2.9 150 8.1 7.8 3.1 0080 1-2-D 150 345.82' 9.3 3.5 300 35.8 13.9 4.2 0090 1-3-A 100 175.5 6.1 2.5 150 6.8 7.9 2.7 0100 1-3-B 150 254.1 8.4 3.4 300 34.5 13.3 4.4 0110 1-3-C 100 188.0 6.7 2.9 150 6.8 8.6 3.1 0120 1-3-D 150 269.9 9.1 3.9 300 38.2 14.7 5.0
Delaware Bay Area
h/ 2-1-A 70 139.1 5.7 1.5 115 27.1 7.3 1.7 h 2-1-B '115 204.1-
/ 7.8 2.1 230 36.9 11.0 2.7
Continued. . . .

Cost Co st
Code2A Alter- native
1980 volume (m.t.a.)
1980 1975-79 first Oper- Main-
ating tenance
2000 volume (m.t.a.)
1980- 2000 first
20
Oper- ating
0
Main- tenance
Table 87. First, Operating and Maintenance Costs of Crude Petroleum Alternatives (continued)
(In millions of dollars)
Delaware Bay Area
h/ 0150 2-1-C 70 151.9N/ 5.7 1.8 115 32.3 7.3 2.2
221.3E/ 7 ' 8 0160 2-1-D 115 2.6 230 42.2 11.0 3.2 0170 2-2-A 70 150.1F(, 6.2 1.7 115 22.8 7.8 2.0
214. 0180 2-2-B 115 1h/
1N/ 7.9 2.1 230 33.0 11.1 2.7 0190 2-2-C 70 162.4N/ 6.2 1.8 115 27.4 7.8 2.3 0200 2-2-D 115 231.2E/ 7.9 2.4 230 37.8 11.1 3.0 0210 2-3-A 100 216.8N/ 6.4 2.0 150 3.3 7.1 2.1 0220 2-3-B 150 250.5s/ 8.9 2.5 300 72.8 13.1 3.2 0230 2-3-C 100 234.7N/ 6. 8 2.2 150 3.3 7.6 2.3 0240 2-3-D 150 274.7H/ 9.5 2.9 300 78.4 13.9 3.7 0250 2-4-A 100 225.9N/ 6.1 2.0 150 3.6 7.0 2.1 0260 2-4-B 150 257.8H/ 8.8 2.5 300 72.8 13.0 3.2 0270 2-4-C 100 242.8E/ 6.1 2.2 150 3.6 7.0 2.3 0280 2-4-D 150 280.037/ 8.8 2.8 300 77.9 13.0 3.6 0290 2-5-A 100 209.837/ 5.6 2.5 150 0 5.6 2.5 0300 2-5-B 150 264.51/ 5.7 3.1 300 25.4 6.1 3.4 0310 2-5-C 100 236.51/ 5.6 2.8 150 0 5.6 2.8 0320 2-5-D 150 289.5- 5.7 3.6 300 31.7 6.1 4.0
Continued

Table 87. First, Operating and Maintenance Costs of Crude Petroleum Alternatives (continued)
(In millions of dollars)
Cost
1980 1975-79 first Oper- Main-
ating tenance
1980- 2000 first
Cost
20
Oper-ating
0 0
Main- tenance
Code-'au Alter- native
1980 volume (m.t.a.)
2000 volume (m.t.a.)
Mississippi Delta Area
0330 4-1-A 100 220.0 5.6 2.2 450 114.3 10.1 3.6 0340 4-1-B 150 260.8 6.0 2.7 600 144.7 10.7 4.5 0350 4-2-A 100 243.0 5.6 2.6 450 98.9 7.5 3.8 0360 4-2-B 150 252.1 5.8 2.6 600 149.2 10.5 4.5 0370 4-2-C 100 266.6 5.6 2.9 450 95.5 7.5 4.1 0380 4-2-D 150 276.8 5.8 2.9 600 158.7 10.5 5.0 0390 4-3-A 100 252.6 5.6 3.0 450 129.8 7.5 4.7 0400 4-3-B 150 288.2 5.8 3.1 600 171.2 10.4 5.4
Freeport, Texas Area
0410 5-1-A 100 0420 5-1-B 150 0430 5-2-A 100 0440 5-2-B 150 0450 5-2-C 100 0460 5-2-D 150
324.5 8.7
393.0 11.3
328.2 9.2
406.9 12.0
338.7 9.2
420.2 12.0
3.1 450 312.1 30.2 8.0
3.9 600 429.2 34.9 10.1
3.1 450 325.4 30.9 7.9
4.0 600 423.6 36.5 9.6
3.4 450 307.3 30.2 8.0
4.4 600 411.0 35.7 10.0
Continued

. Table 87. First, Operating and Maintenance Costs of Crude Petroleum Alternatives (continued)
(In millions of dollars)
Cos t Cos t
2000 Code ' Alter- native
1980 volume (m.t.a.) Oper-
ating
1980
Main- tenance
2000 volume (m.t.a.)
1980- 2000 first Oper-
ating Main- tenance
1975-79 first
Freeport, Texas Area
0470 5-3-A 100 362.2 10.3 3.7 450 337.0 32.9 8.8 0480 5-3-B 150 451.4 13.6 4.9 600 446.5 39.2 10.8 0490 5-4-A 100 399.9 9.0 2.9 450 283.3 29.6 5.7 0500 5-4-B 150 480.2 11.1 3.5 600 373.0 33.2 6.7 0510 5-5-A 100 543.1 9.0 5.2 450 266.8 27.1 7.8 0520 5-5-B 150 592.7 11.0 5.5 600 380.0 33.0 8.7 0530 5-5-C 100 593.0 9.0 5.9 450 257.4 27.0 8.4 0540 5-5-D 150 642.6 11.0 6.1 600 384.1 32.9 9.4 0550 5-6-A 100 877.9 8.9 11.1 450 300.6 27.0 14.0 0560 I 5-6-B 150 963.1 11.0 11.7 600 394.6 32.9 15.0
Los Angeles Area
0570 6-1-A 28 43.4 2.4 0.5 111 6.5 2.4 0.5 0580 6-1-B 28 50.6 2.9 0.6 111 8.3 2.9 0.7 0590 6-2-A 43 178.2 4.9 1.0 171 46.8 12.1 2.0 0600 6-2-B 43 188.7 5.6 1.2 171 37.7 12.7 2.0
Continued

0660 0670 570.4 11.7 2.9 43 8-2
Table 87. First, Operating and Maintenance Costs of Crude Petroleum Alternatives (continued)
(In millions of dollars)
Cost
Code/1 Alter- native
1980 volume (m.t.a.)
1980 1975-79 first Oper- Main-
ating tenance
2000 volume (m.t.a.)
1980 2000 first
20
Oper- ating
00
Main- tenance
Cost
San Francisco Area
0610 7-1 15 63 80.8'1
// 2.9
3 '1/ 2 9 0.7 60 2.6 3.5 0.7 k
0620 7-2 15 0.8 60 0 2.9 0.8 0630 7-3 15 85.8-i, 2.8 1.1 60 15.7 3.5 1.3
167. 0640 7-4 15 m/ 3- 2.9 1.9 60 0 2.9 1.9
0650 7-5 15 108.6 2.5 1.9 60 9.0 4.9 2.1
Ferndale, Washington Area
8-1 15 367.3 5.7 1.9 60 64.9 23.1 3.5 171 562.4 46.9 6.6
a/ Code numbers shown for each alternative are those used in the computer computation of benefits and costs (Annex F). b/ To be increased by $17.8 million or 13 percent for revised dredging cost.
Continued

477.
Table 87. First, Operating and Maintenance Costs of Crude Petroleum Alternatives (continued)
67- To be increased by $20.2 million or 14 percent for revised dredging cost. d/ To be increased by $18.1 million or 8 percent for revised dredging cost. e/ To be increased by $18.4 million or 6 percent for revised dredging cost. f/ To be increased by $20.4 million or 8 percent for revised dredging cost. g/ To be increased by $20.9 million or 6 percent for revised dredging cost. h/ To be increased by $14.6 million or 5 to 11 percent for revised dredging cost. i/ To be increased by $9.0 million or 3 to 4 percent or revised dredging cost.
1/ To be increased by $9.6 million or 15 percent for revised dredging cost. k/ To be increased by $26.4 million or 33 percent for revised dredging cost. 1/ To be increased by $23.9 million or 28 percent for revised dredging cost. m/ To be increased by $64.3 million or 38 percent for revised dredging cost.

Table 88. First Cost Components of Crude Oil Alternatives
(In millions of dollars)
1975-79 1980-2000
Tank farm
Total Tank farm
Alter- native
Berths and
pipe-lines to tank farm
Arti-ficial island or on-shore land
Pipe-line to
refin-eries
Berths and
pipe-lines to
tank farm
Arti-ficial island or on-shore land
Pipe-line to
refin-eries
Dredg- ing
Dredg- ing
Total
1-1-A 1-1-8 1-1-C 1-1-D 1-2-A 1-2-B 1-2-C 1-2-D 1-3-A 1-3-B 1-3-C 1-3-D 2-1-A 2-1-8 2-1-C 2-1-D
a
42.5;../
/ 9.0 40.0 23.0 18.2 132.7
a/ 0 0 0 0
42.5E:/
9.0 40.0 23.0 18.4 132.9a/
0 0 0 0
48.7E1/
11.8 46.8 23.4 18.2 148.912/
0 0 0 0
48.7-C/ 11
•
.8 46.8 23.4 18.4 149.112/
0 0 0 0
44.5a/ 15.1 47.0 26.1 98.0 230.72/
0 0 0 0
47.3-e-/
18.2 58.2 30.9 162.7 317.3cl/
0 5.8 7.0 0
50.77/
19
•
.7 56.0 28.5 98.0 252.92/
0 0 0 0
54.7-- 23.8 69.2 35.4 162.7 345.8f/
0 7.6 9.6 0 O 38.9 47.0 1.0 88.6 175.5 0 0 0 0 O 51.5 58.2 1.4 143.0 254.1 0 11.3 7.0 0 O 42.2 56.0 1.2 88.6 188.0 0 0 0 0 O i 55.9 69.4 1.6 143.0 269.9 / 0 12.4 9.6 0
19.421/ 28.4 40.0 0.5 50.8 139.12C 0 13.6 7.0 0
19.42C 43.5 47.0 0.6 93.6 204.11" 13.7 11.2 0
19.42C 34.3 46.8 0.6 50.8 151.9 2C 0 16.7 9.1 0
19.42/ 51.6 56.0 0.7 93.6 221.32/ 0 16.7 13.5 0
0
1.4 1.4 0
1.4 1.4
8.1 8.1
18.6 31.4
8.1 8.1
18.6 35.8
6.8 6.8
16.2 34.5
6.8 6.8
16.2 38.2
6.5 27.1
12.0 36.9
6.5 32.3
12.0 42.2
Continued

Table 88. First Cost Components of Crude Oil Alternatives (continued)
(In millions of dollars)
1975-79 1980-2000
Tank farm
Total Tank farm
Alter- native
Berths and
pipe-lines to
tank farm
Arti-ficial island or on-shore land
Pipe-line to
refin-eries
Berths and
pipe-lines to tank farm
Arti-ficial island or on-shore land
Pipe-line to
refin-eries
Dredg- ing
Dredg- ing
Total
2-2-A 2-2-B 2-2-C 2-2-D 2-3-A 2-3-B 2-3-C 2-3-D 2-4-A 2-4-B 2-4-C 2-4-D 2-5-A 2-5-B 2-5-C 2-5-D
19.42/, 17.6 40.0 14.0 59.1 150.12// 0 8.8 7.0 0 7.0 22.8
19.42C 26.5 47.0 14.8 106.4 214.12C 0 8.8 11.2 0 13.0 33.0
19.42C 22.6 46.8 14.5 59.1 162.42C 0 11.3 9.1 0 7.0 27.4
19.421 33.9 56.0 15.5 106.4 231.22C 0 11.3 13.5 0 13.0 37.8
19.42C 42.1 47.0 0.5 107.8 2l6.8 ' 0 0 0 3.3 3.3
19.42C 55.6 58.2 0.7 116.6 250.52C 0 13.7 7.0 0 52.1 72.8
19.42C 50.9 56.0 0.6 107.8 234.721 0 0 0 0 3.3 3.3
19.42C 67.4 69.4 0.8 117.7 274.7 ' 16.7 9.6 0 52.1 78.4
19.42C 26.5 47.0 14.0 119.0 225.92C 0 0 0 0 3.6 3.6
19.4 2C 35.2 58.2 15.0 130.0 257.8' 0 8.8 7.0 0 57.0 72.8
19.42, 33.9 56.0 14.5 119.0 242.8' 0 0 0 0 3.6 3.6 19.42/
45.2 69.4 16.0 130.0 280.0 1' 0 11.3 9.6 0 57. 77.9 h/ i/ ' h/
0i/
4.8- 31.3 47.0 117.9 8.8- 209.8- 0 0 0 0 0- 0 h/ i/ h/ i/
4.8- 38.2 58.2 152.0 11.3 264.5- 0 12.9 7.0 0 5.5- 25.4 h/ 1/ h/ i/ '
4.8- 40.5 56.0 126.4 8.8-7 236.5- 0 0 0 0 0- 0 h/ 1/ h/ i/
4.8- 49.4 69.4 154.6 11.3- 289.5 " 16.6 9.6 0 5.5- 31.7
Continued

56.1 73.0 41.3 65.2 36.9 68.1 49.4 65.3 56.2 81.8 52.5 65.2 50.4 68.1 49.4 65.3
37.8 45.5 39.2 58.8 41.2 66.4 62.0 81.7 68.0 90.0 86.0
103.0 71.0 88.5
101.7 126.8
O 25.1 O 37.7 O 39.5 O 39.5 O 50.7 O 50.7 O 50.7 O 62.0 O 45.4 O 56.6 O 52.1 O 69.0 O 53.5 O 71.0 O 76.6 O 101.6
48.8 132.5 13.64/ 220.0 64.4 138.3 20.4 -/ 13.4/ 260 .8 58.2 131.7 243.0 58.2 136.0 18.4 i/ 252.1 69 .4 132.9 13.6 i/ 266.6 69.4 138.3 18.4 i
i/ 276.8
56.4 1 32.9 12.6 / 252.6 70.0 137.8 18.4 i/ 288.2 48.9 0.5 229.7 1/ 324.5 55.6 0.6 280'21/ 47.0 0.4 228.71/ 393'0
58.2 0.5 279.21/ 328.2 56.0 0.5 228.71/ 40
6.9
338'7 69.4 0.6 279.21/ 420.2 56.4 0.5 22871/ 70.0 0.6 279.21/ 465 21. 24
20.421-1/ 114.3 26.2 4, 144.7 18.44/ 98.9 25.22:-// 149.2 17.44Y 95.5 24.24/ 158.7 18.41// 129.8
-:
24.2 171.2 3 187.9 / =i 312.1
257.4-4', 429.2 186.941/ 325.4 255.44"/ 423.6 185.941/ 307.3 254.44'i 411.0 185.94'/ 337.0 254.431 446.5
Table 88. First Cost Components of Crude Oil Alternatives (continued)
(In millions of dollars)
1975-79 1980-2000
Tank farm Total
Tank farm
Alter- native
Berths and
pipe-lines to tank farm
Arti-ficial island or on-shore land
Pipe-line to
refin-eries
Berths and
pipe-lines to
tank farm
Arti-ficial island or on-shore land
Pipe-line to
refin-eries
Dredg- ing
Dredg- ing
Total
4-1-A 4-1-B 4-2-A 4-2-B 4-2-C 4-2-D 4-3-A 4-3-B 5-1-A 5-1-B 5-2-A 5-2-B 5-2-C 5-2-D 5-3-A 5-3-B
Continued

Table 88. First Cost Components of Crude Oil Alternatives (continued)
(In millions of dollars)
1975-79 1980-2000
Tank farm Total
Tank farm
Alter- native
Berths and
pipe-lines to
tank farm
Arti-ficial island or on-shore land
Pipe-line to
refin-eries
Berths and
pipe-lines to
tank farm
Arti-ficial island or on-shore land
Pipe-line to
refin-eries
Dredg- ing
Dredg- ing
Total
5-4-A 111.0 9.9 48.8 0.5 229.71/ 399.9 24.3 15.0 56.1 0 187.91/ 283.3 5-4-B 119.0 15.0 64.4 0.6 281.2
i/ 480.2 25.6 18.0 73.0 0 256.44/ 373.0
5-5-A 238.5 16.3 58.2 0.4 229.74/
543.1 23.4 16.2 41.3 0 185.9i/ 266.8 j/ 5-5-B 238.5 16.3 58.2 0.5 279.2i/ 592.7 35.1 24.3 65.2 0 255.471 380.0
5-5-C 272.5 20.9 69.4 0.5 229.73j/
12 / 593.0 18.7 16.9 36.9 0 l84.94"
5-5-D 272.5 20.9 69.4 0.6 279.2- 642.6 34.3 27.3 68.1 0 254.44/7, 384.1 5-6-A 571.5 20.8 56.4 0.5 228.71/ 877.9 38.0 25.2 51.5 0 185.9ill 300.6 5-6-B 588.0 25.3 70.0 0.6 279.2
1/ 963.1 41.6 33.3 65.3 0 254.4 12 394.6
6-1-A 12.6 11.0 0 0 19.8 43.4 0 5.5 0 0 1.0 6.5 6-1-B 14.8 14.6 0 0 21.2 50.6 0 7.3 0 0 1.0 8.3 6-2-A 12.6 17.9 14.4 1.0 132.3 178.2 1.0 11.0 6.5 0 28.3 46.8 6-2-B 14.8 k/ 22.2 17.0 1.0 133.7 188.7 0 7.3 3.1 0 27.3 37.7 7-1 9.67/ 12.3 26.8 1.4 13.2 63.3L/ 0 0 0 0 2.6 2.6 7-2 57.0- 0 0 6.0 80.8-1/ 0 0 0 0 0 0
m .i. 7-3 29.3 -1 13.2 29.4 1.7 12.2 85.8 / - 0 7.2 4.9 0 3.6 15.7 m 7-4 l28.3 ' 0 0 6.0 167.3 E/
0 0 0 0 0 0 H
Continued

Table 88. First Cost Components of Crude Oil Alternatives (continued)
(In Millions of dollars)
1975-79 1980-2000
Tank farm
Total Tank farm
Alter- native
Berths and
pipe-lines to
tank farm
Arti-ficial island or on-shore land
Pipe-line to
refin-eries
Berths and
pipe-lines to
tank farm
Arti-ficial island or on-shore land
Pipe-line to
refin-eries
Dredg- ing
Dredg- ing
Total
O 15.7 46.8 1.1 45.0 108.6 0 0 0 0 9.0 9.0 O 28.8 46.8 0.5 291.2 367.3 0 0 0 0 64.9 64.9 O 28.8 46.8 0.8 494.0 570.4 0 14.4 9.1 0 538.9 562.4
7-5 8-1 8-2
a/ See footnote b, table 87. b/ See footnote c, table 87. Cl See footnote d, table 87. d/ See footnote e, table 87. e/ See footnote f, table 87. f/ See footnote g, table 87. g/ See footnote h, table 87.
h/ See footnote i, table 87. i/ Barge transshipment facilities only. i/ Including barge transshipment facilities. k/ See footnote j, table 87. 1/ See footnote k, table 87. m/ See footnote 1, table 87. n/ See footnote m, table 87.

VI. DESIGN CRITERIA FOR DRY BULK PORTS
Channels and Maneuvering Areas
The dimensions of channels and maneuvering areas relate to vessel dimensions, and to the estimated force of currents and waves to which the vessel would be ex-posed, in the manner that was established in chapter III for the oil alternatives. Therefore, the dimen-sions of ocean channels, entrance channels, turning basins, and berthing areas given in tables 5 and 6 for oil tankers also apply to bulk carriers.
The dimensions of the bulk carriers selected for the various alternatives are established in Annex E. Table 89 reviews these dimensions.
Table 89. Bulk Carrier Dimensions
(In feet)
Vessel Dimensions Symbol
Vessel size (1,000 d.w.
120 128 179 250
t. )
250
Length L 860 875 1,015 1,095 1,050 Beam B 140 137 170 190 180 Draft D 50 52 52 58.5 65

484.
Supercarrier Berths
There is no significant difference between arri-val patterns of bulk carriers and those of tankers. Therefore, the practicably permissible mean berth occu-pancy factors as derived in table 9 for tankers also apply for bulk carriers.
Optimum loading and unloading rates are a func-tion of additional port time costs of all vessels com-pared to the cost of additional handling equipment and/ or berths. Because these optimum rates cannot be deter-mined in this analysis, the following assumptions will be made:
1. Average coal loading rates for 128,000 d.w.t. carriers would equal 10,000 tons per hour; for 179,000 d.w.t. carriers, 11,000 tons per hour; and for 250,000 d.w.t. carriers, 12,000 tons per hour.
2. Average iron ore unloading rates for 250,000 d.w.t. carriers would equal 6,000 tons per hour.
3. Average grain loading rates for 120,000 d.w.t. vessels would equal 6,000 tons per hour; and for 250,000 d.w.t. vessels, 12,000 tons per hour.
Total berth occupancy times were estimated using the above assumptions and allowing the same amount of time for maneuvering and clearance for bulk carriers as was established for oil tankers in the case of fixed berths, and are presented in table 90.
With an assumed berth occupancy of 1.0, the berth occupancy times given in table 90 would result in the number of vessel callings per year and corres- ponding annual throughput capacities given in table 91.

160 40
280 34 280 70
380 335 280
49 60 70
485.
Table 90. Berth Occupancy Times of Bulk Carriers by Commodity and Vessel Size
(In hours)
Iron ore Coal Grain
Item Vessel size (1,000 d.w.t.)
128 1179 1 250 1 250 1 120 1 250
Berthing Clearance Loading/unloading Deberthing
Total
4 4 4 4 4 4
2 2 2 2 2 2
13 16 21 41 21 21
3 3 3 3 3 3
22 25 30 50 30 30
Table 91. Vessel Callings and Annual Throughput at a Berth Occupancy Factor of 1.0
Commodity and vessel size (d.w.t.)
Number of vessel callings/year
Annual throughput (million long tons)
Coal
128,000
179,000
250,000
Iron ore
250,000
Grain
120,000
250,000
Taking into account the practicably permissible mean berth occupancy factors established in table 9 and the number of berths available, the maximum per-missible annual throughputs can be determined for dif- ferent numbers of berths. Table 92 presents this rela-tion.

13 50 16 61 19 73
11 42
9 35
19 73
Coal
128,000
179,000
250,000
Iron ore
250,000
Grain
120,000
250,000
486.
Table 92. Annual Throughput Volumes
(In millions of long tons)
Throughputs by number of berths Commodity and
vessel size (d.w.t.) 1 2
Intermediate Storage
Imports
For iron ore the same formula applies as was derived for oil, since the same relationship exists be-tween inflow and outflow. Thus
S = 1.2 168 n d -0.024 A) w
where
t = berth occupancy time in hours n = number of berths d = d.w.t. of super carrier in 10 6 long tons A = annual throughput in millions of long tons w = number of weeks of inclement weather
If t = 50, n = 1, d = .250, A = 11 and w = 5/7, the storage required would be 0.5 million long tons. If n = 2 and A = 17.1, the storage would be 1.1 million long tons.

487.
Assuming a density of 14 to 19 cubic feet per long ton, or an average density of 16 cubic feet per long ton, 0.5 million long tons would have a volume of 0.5 x 16 = 8 x 10 6 cubic feet. Assuming that the stock-pile were triangular with a hejr ght of 30 feet and a base of 85 feet, a volume of 8 x 10 cubic feet would be approximately 6,300 feet long. The required net area would then amount to 85 x 6,300 = 535,000 square feet. Including an assumed 50 percent for grade segregations and slopes, 30 percent for ownership segregation, and 25 percent for marginal areas, the total surface re-quirement would be 1.50 x 1.30 x 1.25 x 535,000 = 1,300,000 square feet, or 0 acres for 0.5 million long tons. Storage of 1.1 x 10 ° long tons of iron ore would therefore require about 1.1/0.5 x 30 = 65 acres.
Exports •
For grain and coal, the storage formula given for imports cannot be applied because of numerous dif-ferences in specific qualities of the product. In the case of metallurgical coal exports, product variation arises from differences in performance characteristics of coal mined at different sources. Among characteris- tics of particular importance to the market are the pro-duct's coking abilities, its tendency to swell, and its content of sulfur, ash, and volatile matter.
To obtain coal with acceptable technical and quality characteristics for charging into a metallur-gical coke oven, foreign steel companies blend coal from a number of mines in the United States and from other countries. This blending is required because no single mine produces the precise combination of re-quired qualities, because qualities vary among dif-ferent mines, and because one mine is incapable of ex-porting the quantities of coal required by foreign steel companies. To achieve a satisfactory blend therefore requires careful control of the quantities and qualities of coal to be delivered to any one buyer, and, consequently, to be loaded into a vessel for delivery to such buyer.
488.
In the case of grains, there are differences both in the basic cereal (e.g., wheat, corn, sorghum, soy-beans, etc.) as well as within each group. Thus there are different grades of wheat, which are distinguished by the market in purchases and prices. The same phen-omenon applies to the other cereals.
Coal
There is no precedent for ground storage of over-seas export coal at the port of shipment such as would be required at an offshore island loading deep-draft vessels. Export coal is presently shipped to port and stored in cars until it is loaded into vessels. The Norfolk and Western (N&W) Railroad and the Chesapeake and Ohio (C&O) Railroad, which own and operate the coal-dumping facilities at Norfolk and Newport News, serve approximately 375 and 150 individual coal mines, respectively. Each car of coal loaded at the mine is consigned to either a foreign buyer or to a U.S. export firm. Ships are chartered and scheduled by individual buyers, and each ship load is therefore composed of coal that is consigned to a particular buyer and that orig-inated in a number of mines, was delivered to port over a period of time, and was stored in cars until a suffi-cient number was accumulated to make a full cargo.
The dumping of individual coal cars into the vessel and sequence of dumping are directed by either the representative of the foreign buyer or of the U.S. export firm which takes responsibility for delivering a blend of coals meeting contract specifications. Under this system, the average waiting time of coal cars at Norfolk is understood to be from 12 to 14 days, and the capacity at the Norfolk and Western yards is understood to be 14,000 cars. The average car capacity is 78 tons. The total average rate of dumping is 1,500 cars per day (approximately 1,000 by the N&W and 500 by the C&O); with an average waiting time of 12 days, this figure gives a storage equivalent of 18,000 cars, or approx-imately 1.4 million tons.
The feasibility of ground storage either at present ports of export or at an offshore island, as an

489.
alternative to the current practice of car storage, has not been demonstrated, and the storage requirements have not been determined. In this circumstance, storage re-quirements can be calculated only on the basis of broad assumptions, the validity or feasibility of which can-not be demonstrated. For purposes of the present study, the assumptions employed are as follows:
1. Maintenance of present standards of grade and ownership segregation in ground storage would triple the ground storage requirement over what it would be without the necessity for such segregation. The ba-sis for this assumption is that the stockpile would con-sist of a great number of pyramids instead of prisms and, since the volume of a pyramid is one-third that of a prism if the three basic dimensions of pyramid and prism (length, width, and height) are the same, an area three times larger would be required.
2. The possibility of reducing the coal to 10 "standard" grades would reduce the storage area re-quirement by 75 percent.
Assumption 1. Assuming a triangular stockpile with a height of 20 feet, a base of 60 feet, and an average density of 48 cubic feet per long ton, then a storage volume of 1.4 million long tons would be approx-imately 112,000 feet long. The required net area would amount to 60 x 112,000 = 6.7 x 10 6 square feet. If an extra 200 percent for slopes and for grade and ownership segregation, and an extra 25 percent for marginal areas, are included, the total surface requirement would be 3.00 x 1.25 x 6.7 x 10 6 = 25.1 x 10 6 square feet, or 575 acres.
The size of the largest cargoes being loaded at Hampton Roads is presently in the range of 70,000 tons; however, this figure might increase to 90,000 tons when wide-beam vessels are used. If it is assumed that the storage requirements of ports serving larger vessels will increase at least by a factor of d.w.t. of larger carrier/90,000, this factor would be approximately

490.
1.2, 1.4, and 1.7 for 128,000-, 179,000-, and 250,000- d.w.t. carriers, respectively. The required acreage would be approximately 700, 800, and 1,000 acres, res-pectively.
Assumption 2. Reducing the total number of dif-ferent grades by systematic blending of all existing grades to 50, 30, or even 10 "standard" grades would sub-stantially reduce the volume of coal stored at the deep-water port compared with present practice, and would also reduce the required ground area. In this study it is not possible to determine the minimum feasible num-ber of grades. By way of a theoretical exercise, the assumption will be made that a reduction in the number of grades would be considered, and that this would re-duce the storage area by 75 percent. The required acreage would be 175, 200, and 250 acres for 128,000-, 179,000-, and 250,000-d.w.t. carriers, respectively. For one berth, the storage area is assumed to be five-eights of the above acreages.
Grains
Because grain also varies by ownership, kind and quality, it is impossible to determine the amount of storage that grain in general would require. However, considering the possible variations, it seems unlikely that the required storage would be less than five and eight times the average vessel size for one and two berths, respectively. Therefore, a storage capacity of 0.6 and 1.25 million long tons for one berth and 0.96 and 2.0 million long tons for two berths for 120,000-, and 250,000-d.w.t. carriers, respectively, will be con-sidered.
Assuming an average density of grains of 48 cubic feet per long ton, an average effective silo height of 40 feet, and a marginal area of 40 percent, then for 1 million long tons the required acreage would amount to (1.4 x 48 x 10 6 )/(40 x 43,560), or approx-imately 40 acres. The required acreage would be 24, 50, 40, and 80 acres for 0.6, 1.25, 0.96, and 2.0 million long tons, respectively.

1 8 1
10
491.
Transshipment Vessels
The size of the transshipment barges would be in the 40,000 d.w.t. range, as established in Annex E.
The time required for maneuvering, berthing, and deberthing of transshipment vessels for dry bulk is assumed to be the same as that for crude oil trans-shipment movements. The average unloading rates for coal and grain, and the average loading rate for iron ore, were established at 5,000 tons per hour. Self-unloading via conveyor belts for coal and unloading through a fluidizing pressure system for grain have been assumed; for iron ore loading, dumping from con-veyor belts would be adequate to achieve the assumed rate. Table 93 presents the total berth occupancy time of all transshipment vessels.
Table 93. Berth Occupancy Time of Transshipment Barges
(In hours)
Item Time
Maneuvering, berthing, and mooring
Loading or unloading Deberthing and maneuvering
Total
With an assumed berth occupancy factor of 1.0 and a total number of 350 working days per year, the number of barge callings per year would be 24/10 x 350 = 840. The corresponding annual throughput capa- city would be 840 x 40,000 = 34 million tons per year. The type of transshipment berth is assumed to be fixed.

9 35 63
.27
.51
.62
492.
Since the permissible berth occupancy factors are the same as those established for supertanker berths, the maximum annual throughput can be related with the number of transshipment berths. Table 94 gives these throughputs for one to three berths. The maximum throughput of a single commodity considered in any alternative is 45.6 million tons per year.
Table 94. Annual Throughput Volumes
(In millions of long tons per year)
Number of berths
Permissible berth occupancy factor
Throughput
1 2 3
It is assumed that all transshipment berths will be equipped to handle one commodity only. However, in preliminary engineering studies of deepwater ports handling more than one commodity, consideration should also be given to the possibility that a berth would be able to handle more than one commodity.

VII. ENGINEERING REQUIREMENTS FOR DRY BULK PORTS
Coal
Three alternatives, numbered 2-6, 2-7, and 3-1, will be considered. Alternative 2-6 considers only coal, whereas 2-7 considers a deepwater port for coal and iron ore combined.
Sites
Alternatives 2-6 and 2-7 consider deepwater ports in the Lower Delaware Bay, whereas alternative 3-1 con-siders a deepwater port at Hampton Roads.
Links to Existing Ports
The deepwater port of all alternatives would be linked to the N&W facilities at Norfolk and the C&O facilities at Newport News; the deepwater ports of al-ternatives 2-6 and 2-7 might also be linked to Baltimore, depending on the hypothesized vessel size.
Throughputs
Alternatives 2-6 and 2-7 consider two sets of throughputs. The higher throughput is set at 45.4 m.t.a. in 1980 and 43.7 m.t.a. by 2000 if 250,000 d.w.t. carriers drawing 65 feet are utilized. The lower throughput is set at 11.5 m.t.a. in 1980 and 6.4 m.t.a. by 2000 if 250,000 d.w.t. carriers drawing 58.5 feet are utilized. Alternative 3-1 considers a throughput of 46.1 m.t.a. in 1980 and 46.6 m.t.a. by 2000.

494.
Intermediate Storage
Alternative 3-1 considers a continuation of the present system of operations at Hampton Roads, with rail-road cars at the shunting yard awaiting unloading upon request. In this case, the railroad cars provide the necessary storage. In alternatives 2-6 and 2-7, an artificial island would provide storage for the coal. The storage area would be in accordance with the two assumptions made in chapter VI; that is, (1) all present grades would be stored; and (2) only a restricted number of blended grades would be stored.
Vessel Sizes
Alternatives 2-6 and 2-7 will consider 250,000 d.w.t. carriers drawing 65 or 58.5 feet. Alternative 3-1 will consider 128,000 and 179,000 d.w.t. carriers drawing 52 feet. The assumed dimensions of the vessels, in feet, are given in table 95.
Table 95. Assumed Dimensions of 128,000, 179,000, and 250,000
Deadweight Ton Carriers
Vessel size (1,000 d.w.t.)
Dimension 179 250 128
875 137 52
Length Beam Draft
1,015 170 52
1,095 190
58.5
1,050 180 65
Transshipment barges are hypothesized in the 40,000-d.w.t. range, drawing 30 to 36 feet, for alter-natives 2-6 and 2-7. Alternative 3-1 would not employ transshipment barges, since this alternative considers direct loading into the supercarrier.
Dredging
All alternatives would require dredged channels. Alternative 3-1 would also require dredged turning basins and berthing areas.

495.
Water Depths
In all alternatives the depth of channels, etc., is such that all maximum-draft carriers would have to await high tide to approach the facilities. For alter-natives 2-6 and 2-7, a value of 4.0 feet for average tidal rise will be applied; this value is 2.5 feet for alternative 3-1, which is the average tidal range of the Thimble Shoal Channel.
Construction Program
The time phasing of the various construction items for the period prior to 1980 is given in table 96 for alternatives 2-6 and 2-7, and in table 97 for al-ternative 3-1. The entire phasing was simplified to facilitate calculations. The total cost of each item will be distributed equally over the pertinent years.
Table 96. Construction Program of Alternatives 2-6 and 2-7
Construction item
Year of construction or installation
1975 1976 1977 1978 1979
Breakwater of island Sand fill and slope protection
Berths and trestles Mechanical and electri- cal equipment
Dredging Breakwater at iron ore berth (alternative 2-7)
Iron Ore
Three alternatives, numbered 2-7, 4-5, and 4-6, will be considered. Alternative 2-7 considers a

Dredging
496.
Table 97. Construction Program of Alternative 3-1
Year of constructio Construction item
1977j 1978 1975 1976 1979
deepwater port for iron ore and coal combined; alter-native 4-5 considers a deepwater port for iron ore only, and alternative 4-6 considers a deepwater port for iron ore and grain combined.
Sites
Alternative 2-7 considers a deepwater port in the Lower Delaware Bay, whereas alternatives 4-5 and 4-6 consider deepwater ports in Garden Island Bay, in the Mississippi Delta.
Links to Existing Ports
The deepwater port of alternative 2-7 would be linked to the terminal facilities at Sparrows Point, Baltimore, and to those at Philadelphia-Trenton. The deepwater ports of alternatives 4-5 and 4-6 would be linked to the existing ports of Houston, Mobile and Baton Rouge.
Throughputs
Alternative 2-7 considers one set of throughputs: 12.5 m.t.a. in 1980 and 17.1 m.t.a. by 2000. Alterna-tives 4-5 and 4-6 also consider one set of throughputs: 7.6 m.t.a. in 1980 and 10.4 m.t.a. by 2000.
Intermediate Storage
All three alternatives would require intermediate storage on an artificial island.

497.
Vessel Sizes
Each alternative considers 250,000 d.w.t. car-riers drawing 65 or 58.5 feet. The assumed lengths and breadth of these carriers are the same as those given in table 95 for coal carriers. The transshipment barges are hypothesized in the 40,000-d.w.t. range, drawing 30 to 36 feet.
Water Depth
For alternative 2-7, 4 feet of tide will be taken into account for determining the required water depths. For alternatives 4-5 and 4-6, no tidal rise will be taken into account, since the mean tidal range is about 1 foot in the gulf.
Construction Program
The time phasing of the various construction items for the period prior to 1980 is given in table 98 for alternatives 4-5 and 4-6. The construction pro-gram of alternative 2-7 is given in table 96. The en-tire phasing was simplified to facilitate calculations. The total cost of each item will be distributed equally over the pertinent years.
Grains
Three alternatives, numbered 4 - 4, 4 -6, and 5 - 7, will be considered. Alternative 4-4 considers a deep-water port for grain only, whereas alternative 4-6 considers one for grain and iron ore combined, and alternative 5-7 considers one for grain and crude oil combined.
Sites
Alternatives 4-4 and 4-6 consider deepwater ports in Garden Island Bay, Gulf of Mexico; alternative 5-7 considers a deepwater port at Freeport, Texas.

X
X X X
498.
Table 98. Construction Program of Alternatives 4-5 and 4-6
Year of construction or installation
Construction item 1975 1976 1977 1978 1979
Breakwater of island Land fill and slope protection of island
Breakwater at iron ore berth
Mechanical and electri- cal equipment
Grain silos (alter- native 4-6) Dredging for iron ore berth
Berths and trestles
Links to Existing Ports
The deepwater ports of alternatives 4-4 and 4-6 would be linked with the existing ports on the Missis-sippi River and on the Texas and Louisiana coasts. The deepwater port of alternative 5-7 would link the exis-ting ports of Texas.
Throughputs and Vessel Sizes
Alternatives 4-4 and 4-6 consider two sets of throughputs. The higher throughput was set at 32.8 m.t.a. in 1980 and 58.9 m.t.a. by 2000 if 250,000- d.w.t. carriers drawing 65 feet are used. The lower throughput was set at 18.0 m.t.a. in 1980 and 23.6 m.t.a. by 2000 if 250,000-d.w.t. carriers drawing 58.5 feet, or 120,000-d.w.t. carriers drawing 50 feet are utilized. Alternative 5-7 considers the lower through-put alone, in combination with the three vessel sizes mentioned above. The assumed length and breadth of the 250,000-d.w.t. grain carriers are the same as those given in table 95 for coal carriers; for a 120,000- d.w.t. grain carrier drawing 50 feet, the length and breadth are 860 and 140 feet, respectively.

X
X X X
499.
The transshipment barges are hypothesized in the 40,000-d.w.t. range, drawing 30 to 36 feet.
Intermediate Storage
Alternatives 4-4 and 4-6 consider silos on an artificial island, whereas alternative 5-7 considers silos on shore.
Dredging and Water Depths
Alternatives 4-4 and 4-6 would not require dred-ged channels or berthing areas for the grain facilities. Alternative 5-7 would require dredged channels, turning basins, and berthing areas.
Construction Program
The time phasing of the various construction items for the period prior to 1980 is given in table 99 for alternative 4-4 and in table 100 for alternative 5-7. (The construction program of alternative 4-6 is given in table 98.) The entire phasing was simplified to facilitate calculations. The total cost of each item will be distributed equally over the pertinent years.
Table 99. Construction Program of Alternative 4-4
Year of constructio or installation
Construction item 1975 1976 1977 1978 1979
Breakwater of island Land fill and slope protection of island
Mechanical and electri- cal equipment
Silos Berths and trestles

X
500.
Table 100. Construction Program of Grain Facilities of Alternative 5-7
Construction item
Year of constructio or installation
1975 1976 1977 1978 1979
Dredging Mechanical and electri- cal equipment
Silos Berths and trestles
Description
Alternative 2-6
Criteria
1. Commodity: Coal. 2. Site of deepwater port: Delaware Bay, about
10 miles southeast of Big Stone Beach, Delaware. 3. Links to existing ports: Hampton Roads,
Virginia, and Baltimore, Maryland. 4. Site of storage: Artificial island. 5. Size of supercarriers: 250,000 d.w.t. 6. Subalternatives: The throughputs of the
various subalternatives, as well as the draft of the vessels they will serve, are given in table 101.
Table 101. Throughputs and Drafts of Vessels Served by Subalternatives
Vessel draft fully loaded
(feet)
Throughput (million tons/year)
1980 2000
Sub alternative
65 45.4 43.7
58.5 11.5 6.4 A

501.
Requirements
Supercarrier berths. subalternative A would re-quire two berths by 1980, while subalternative B would require one berth by 1980. Neither subalternative would require any additional berths in the period from 1980 to 2000.
Dredging quantities. All quantities will in-clude an overdepth of 3 feet for advanced maintenance dredging. The channels are the same as those for al-ternatives 2-1 through 2-4, except for the water depth, since it is assumed that the supercarriers considered would draw 5 and 12.5 feet less than the supertankers. No dredging would be required for turning basins and berthing areas.
1. Channel A. The required depths would be 1.2 x 65 = 78 feet, and 1.2 x 58.5 = 70 feet, for subal-ternatives A and B, respectively. The following dimen-sions would be required:
a. Length = about 2 miles b. Required depth = 81 and 73 feet, in-
cluding overdepth, for subalternatives A and B, re-spectively
c. Average present bottom depth = 67 feet d. Width at bottom = approximately 1,000
feet e. Quantities to be dredged:
(1) Subalternative A = 5.7 x 10 6 cubic yards
(2) Subalternative B = 2.4 x 10 6 cubic yards
2. Channel B. The required depths would be 1.15 x 65 -4 (tide) + 3 = 74 feet, and 1.15 x 58.5 -4 + 3 = 66 feet, for subalternatives A and B, re-spectively. The following dimensions would be required:
a. Length = 2.5 miles b. Average present bottom depth = 57 feet c. Width at bottom = approximately 900 feet d. Quantities to be dredged:

502.
(1) Subalternative A = 7.9 x 10 6 cubic yards
(2) Subalternative B = 4.1 x 10 6 cubic yards
3. Channel C. No dredging would be required, since the minimum present water depth is 76 feet.
4. Channel D. The required depths would be 1.1 x 65 = 71 feet, and 1.1 x 58.5 = 64 feet, for subal-ternatives A and B, respectively. The average depth is 68 feet. Dredging quantities would be negligible for subalternative A, and zero for subalternative B.
5. Total dredging quantities. The total quan-tity to be dredged would be as follows: for subalter-native A, 5.7 + 7.9 = 13.6 x 10 6 cubic yards; and for subalternative B, 2.4 + 4.1 = 6.5 x 10 6 cubic yards.
Trestle between supercarrier berths and artifi-cial island. If the artificial island is located in 4 to 20 feet of water, a trestle length of approximately 1.5 miles per berth would be required for both sub- alternatives.
Artificial island. The storage requirement for subalternative A would be 1,000 acres under assumption 1 and 250 acres under assumption 2. The storage re-quirement for subalternative B would be 625 acres under assumption 1 and 155 acres under assumption 2.
The breakwaters and corresponding slope protec-tions would be approximately 2.5 and 1.0 miles long for subalternative A, assumptions 1 and 2, respectively; and 1.7 and 0.8 miles long for subalternative B, assump-tions 1 and 2, respectively. The corresponding average water depths were estimated at 15, 8, 12, and 6 feet. The required sand fill would be: for subalternatiye A, assumption 1, (1,000 x 43,560 x 35)/27 = 56.5 x 10 °
cubic yards, and assumption 2, (250 x 43,560 x 28)/27 = 11.3 x 10 6 cubic yards; and for subalternative B,

ore Iron
503.
assumption 1, (625 x 43,560 x 32)/27 = 32.3 x 10 6 cubic yards, and assumption 2, (155 x 43,560 x 26)/27 = 6.5 x 10 6 cubic yards.
Transshipment berths. Subalternative A would require three berths by 1980; for subalternative B, one berth by 1980 would probably be sufficient. Neither subalternative would require any additional berths in the period from 1980 to 2000.
Each berth would have a trestle to the island which would be about 1 mile long.
Alternative 2-7
Criteria
1. Commodity: Coal and iron ore. 2. Site of deepwater port: Delaware Bay, about
10 miles southeast of Big Stone Beach, Delaware. 3. Link to existing ports: Hampton Roads,
Virginia, and Baltimore, Maryland, for coal; and Bal-timore and Philadelphia-Trenton for iron ore.
4. Site of storage: Artificial island. 5. Size of supercarriers: 250,000 d.w.t. 6. Subalternatives: The throughputs of the
various subalternatives, as well as the draft of the vessels they will serve, are given in table 102.
Table 102. Throughputs and Drafts of Vessels Served by Subalternatives
Throughput (million ton s/year)
Sub alter- native
Vessel draft fully loaded
(feet) Coal
2000 1980 1980 2000
65 45.4 43.7 12.5 17.1
58.5 11.5 6.4 12.5 17.1 A..

504.
Requirements
Supercarrier berths. Subalternative A would require two coal and two iron ore berths by 1980; sub-alternative B would require one coal and two iron ore berths by 1980. Neither subalternative would require an additional berth in the period from 1980 to 2000.
Dredging .suantities. In addition to the approx-imate dredging required in alternative 2-6, a dredged berthing area for two iron ore carriers would be re-quired. For both subalternatives A and B, the approx-imate dimensions of this area would be: length, 2 x 1.5 x 1,100 = 3,300 feet; width, 4 x 200 = 800 feet; and depth, betweep 62 and 68 feet. The dredging volume would be 2.7 x 10 ° cubic yards. The total dredging quantities would be: for subalternative A, 13.6 + 2.7 = 16.3 x 10 6 cubic yards; and for subalternative B, 6.5 + 2.7 = 9.2 x 10 6 cubic yards.
Trestle between supercarrier berths and artifi-cial island. If the artificial island is located in 4 to 20 feet of water, a trestle length of approximately 1.5 miles would be required for the coal facilities and for the iron ore facilities. It is anticipated that a breakwater would be required to provide calm water at the iron ore unloading facilities. The breakwater would be about 1/2 mile long and would be located in about 40 feet of water.
Artificial island. The storage requirements for coal would be: for subalternative A, assumption 1, 1,000 acres, and assumption 2, 250 acres; and for subalterna-tive B, assumption 1, 625 acres, and assumption 2, 155 acres.
The storage requirement for iron ore would be 65 acres for both subalternatives. The total require-ment would be: for subalternative A, assumption 1, 1,065 acres, and assumption 2, 315 acres; and for sub-alternative B, assumption 1, 690 acres, and assumption 2, 220 acres.
505.
The breakwaters and slope protection would be approximately 2.6 and 1.1 miles long for subalternative A, assumptions 1 and 2, respectively; and 1.8 and 0.9 miles long for subalternative B, assumptions 1 and 2, respectively. The corresponding average water depths were estimated at 15, 8, 12, and 6 feet. The required sand fill will be: for subalternative A, assumption 1, (1,065 x 43,560 x 35)/27 = 60.1 x 10 6 cubic yards, and assumption 2, (315 x 43,560 x 28)/27 = 14.2 x 10 6 cubic yards; and for subalternative B, assumption 1, (690 x 43,560 x 32)/27 = 35.6 x 10⁶ cubic yards, and assumption 2, (220 x 43,560 x 26)/27 = 9.2 x 10⁶ cubic yards.
Transshipment berths. Subalternative A would require three coal berths and two iron ore berths by 1980; subalternative B would require one coal berth and two iron ore berths by 1980. Neither subalternative would require any additional berths in the period from 1980 to 2000.
The length of each trestle was estimated at 1.0 mile.
Figure 39 presents the location and layout of the deepwater port and the artificial island.
Alternative 3-1
Criteria
1. Commodity: Coal. 2. Site of deepwater port: Present facilities
at Norfolk and Newport News. 3. Site of storage: Railroad cars in shuttling
yard. 4. Subalternatives: The throughput of the
various subalternatives, as well as the size of the vessels they will serve, are given in table 103.
Requirements
Supercarrier berths. Since the anticipated throughput is of the same order of magnitude as the

4 7 e 9
'
3 14 15
4 , 10 19
CRUDE 011. ISLAND ti 25,
7 9
NV" .13 26 11
21
16
7 io•
5 6
10 tZ)
ID crT1
50 i\\
I•u4 , Vs ,
4
a
3
41 7 5 6. .9
8
14
8
10 • ° Pfles 14
4
\ ,
10 t,1•7,.,1 5
8 bi
1. Fl R 4alleZ. 3 .. 7 • „, 4 26ft10M1" 8 t
. 4
7
Robert R Nathan Associates, Inc
39 21 ' 4., v ‘
30 '42 tc, 43 \ \
100 ‘ \ „ 4 • if!
'. 1 4\
.11 ' 46 39 15 ,„ \ \
' % 37\ \i i,58. ,
36 5'"..... 42 \\ 7R3( 4*
'13 x \ 32
37 343 k ,
Illitthi Itliinol I 33 34 COAL BERTHS
..28 32 \43
I \\ \ 3
\ ' \ \
,•'''‘‘"' . ̀ 4V'Io.f 40 „ nt';',W\ N`. IRON ORE BERTHS '4,,, R.. Ref "-
c, - ..,0 ' . 4., .4. 46 40 44 e\
'-'- 45 ',../
R, ,_
BREAtcWATER AT IRON ORE BERTHS 54
s \ \ 63 , , / "/, '..„,y'
, --...",
../,, <,...,99 •:.-.... 53
. -
66' 7, -", 55 ;.' 220—ACRE ISLAND ■ --.. -..,_. ''',,-- _
,„. • ' ' ' lilw64) -- —
65 ' .1--,----------7;-' ` E 65 •,'-'57 ■
-... -
■.:," ....:2.....„;.; z.:-",- ' 67
/ 73 s67 ..;•.:
\ ‚•
A , / '76 1
, \ ' ,,,,,‘ ,, .....„
.„„ \ sz,772
87
2
75
103 7
1-1Z
Scale of Statute Miles
0 I 2 IIMMMI===1
.... -27-
----1, - ...: -...,
4" s ::- - 11 24 24 28 a= -
3 , s,„i
12 15 23 --,— - --
o ,... 29 _ 42
, -_-. —__29---------- , 12_—
4 .'• 5 4 .., , 21 . ----- ef q , , .• 26 --7:-
9 .... ......
22 ,4* ...-", 28-..:., .-,28 5 6
12
3 2
14
5
id 27
14' 26 5
1065—ACRE ISLAND
.-1-:• -- ---" .--„ -,
24
e. •"/„., ' ,/,/,../p 4 ,.
14i'',, ',PI' H§ 1 , ■ 1: ' ha,)
,i„ , , j ,,,,%\ 21 ' %,,, 3 16 , 1 11( ff - 1 I 41',K
15 . 2I : \ 8 08' s , 67 „.•\ 227,,
4 13 ' .'i'7''',/q 30 16 \ ve`e,o
, 10 - ' o yooirol,,„ , 40.tr' ' 11 12
8 , 3 111 till i ,„
8 , 3 8
12 10 1 26
15 16 .
88' N' 26
1 19
5
18
59 2 5 5
hid 9
10 9 14
, 21 101 28 a ' 5'
''
56
rii ' , ,
21 29 ., , 34 42
14 55 ', TRANSSHIPMENT BERTHS
20 \Nak / 121 • s *9
\ . • • 74 74
26
9 2 ,4 8
3 2 5 3 7
62
sir 29
46
19
If 9 11
19 3 24 55.,
17 7 13 24 22 36
r 14
9 11„,„13
r mis,,if9
15 13 •e 50
12 tfl ' ,l iz BP Obf 39 q
1,.. 15 715 0-9 (11_ ,
Q.... ,' 6.4'6)6 21 it 16 14' 15 ..z. .
21 ' ', 4°4,e.c 951
" Ye" ' 13 16 22 - 't. 23\17 45
'
44 COAL BERTHS
44
47 t 57
I
84
Mir
94
FIGURE 39 LOCATION AND LAYOUT OF DEEPWATER BERTHS, TRESTLES, BREAKWATER AND ARTIFICIAL ISLAND OF ALTERNATIVE 2- 7

507.
Table 103. Throughputs and Size of Vessels Served by Subalternatives
Vessel dimensions
Subalternative Size (d.w.t.)
Draft (feet)
Thro t
1980
ghput ons/year)
2000
A.
128,000 52 46.1 46.6
179,000 52 46.1 46.6
present throughput, the number of berths presently available would be sufficient. (Table 92 shows that two berths are sufficient.)
Dredging quantities. All quantities will in-clude an overdepth of 3 feet for advanced maintenance dredging. In determining the channel depth, 2.5 feet of total rise will be taken into account.
1. New ocean channel. A new ocean channel would be located off shore between miles 14.3 and 3.3, and would be 11 miles long. The required water depth would be about 60 feet. The present average water depth per mile is 57, 53, 55, 50, 50, 50, 50, 52, 52, 55, and 55 feet, respectively; the average depth of the channel would be approximately 53 feet. The width of the channel could vary between 5B and 4B (B = beam of vessel); however, due to the channel's orientation with respect to possible crosscurrents, a width of 5B will be applied for its entire length. Consequently, the width would be 685 and 850 feet for subalternatives A and B, respectively. The dredging quantity, including 3 feet of advanced maintenance dredging, would be 15.4 x 10 6
cubic yards for subalternative A and 18.9 x 10⁶ cubic yards for subalternative B.
2. Thimble Shoal Channel. The maximum available depth of the Thimble Shoal Channel over the South Tunnel of the Chesapeake Bay Bridge and Tunnel is 55 feet. The dimensions of the channel would be length, 13.5 miles; width, 550 and 680 feet for subalternative A

508.
and B, respectively; and depth, 58 feet. The total quan-tity to be dredged would be 20.2 x 10 6 and 24.7 x lob cu-bic yards for subalternatives A and B, respectively.
3. Entrance Reach. This channel would be approx-imately 2 miles long; 55 feet deep, excluding overdepth; and 480 and 595 feet wide for subalternatives A and B, respectively. The total quantity to be dredged would be 2.6 x 10 6 and 3.2 x 10 6 cubic yards for subalternatives A and B, respectively.
4. Newport News Channel. This channel would be approximately 4.8 miles long; 55 feet deep, excluding overdepth; and 480 and 595 feet wide for subalternatives A and B, respectively. The total quantity to be dredged would be 6.3 x 10 6 cubic yards and 7.7 x 10 6 cubic yards for subalternatives A and B, respectively.
5. Norfolk Harbor and Craney Island Reaches. This channel would be approximately 6.3 miles long; 55 feet deep, excluding overdepth; and 480 and 595 feet wide for subalternatives A and B, respectively,_ The total quantity to be dredged would be 8.3 x 10' and 10.2 x 10 6 cubic yards for subalternatives A and B, respec-tively.
6. Berthing areas. Three areas, each 52 feet deep, and approximately 1,310 feet long and 410 feet wide for subalternative A, and approximately 1,520 feet long and 510 feet wide for subalternative B, would require 0.2 x 10 6 cubic yards and 0.3 x 10 6 cubic yards each, respectively.
7. Dredging quantities. Total dredging quanti-ties would be: ocean channels, 35.6 x 10 6 and 43.6 x 10 6 cubic yards; and Inland channels, 17.8 x 10 6 and 22.0 x 10 6 cubic yards, for subalternatives A and B, respec-tively. No major additional modifications are assumed to be required.

509.
Alternative 4-4
Criteria
1. Commodity: Grain. 2. Site of deepwater port: Garden Island Bay,
Gulf of Mexico. 3. Links to existing ports: All grain evacuat-
ing ports on the Mississippi River and the Texas and Louisiana coasts.
4. Site of storage: Artificial island. 5. Subalternatives: The throughputs of the var-
ious subalternatives, as well as the dimensions of the vessels they will serve, are given in table 104.
Table 104. Throughputs and Dimensions of Vessels Served by Subalternatives
Vessel dimensions
Subalternative Size (d.w.t.)
Draft (feet)
Thro (million
1980
ughput tons/year)
2000
A B C
250,000 65 32.8 58.9 250,000 58.8 18.0 23.6 120,000 50 18.0 23.6
Requirements
Supercarrier berths. Subalternatives A and C would require two berths by 1980, and no additional berths in the period from 1980 to 2000. Subalternative B would require one berth by 1980, and it is assumed that no additional berths would be required in the per-iod from 1980 to 2000, since this is a loading operation.
Dredging. Subalternatives A, B, and C would re-quire water depths at the berthing area of 75, 67, and 58 feet, respectively; they would require depths at the turning basin and approach area of 78, 70, and 60 feet, respectively. Since sufficient water depth is available at the approach area, turning basin and berthing area, no dredging would be required.

510.
Trestle between supercarrier berth and artificial island. If the artificial island is located in 35 feet of water, a trestle length of approximately 1/2 mile per berth would be required, for all subalternatives.
Artificial island. The required silo storage ca-pacity would be: for subalternative A, 2.0 million long tons; for subalternative B, 1.25 million long tons; and for subalternative C, 0.96 million long tons. The re-quired acreage for the grain storage would be: for sub-alternative A, 80 acres; for subalternative B, 50 acres; and for subalternative C, 40 acres. Including an addi-tional 10 acres for general services, the total acreage for each alternative would be 90, 60, and 50 acres, res-pectively.
With an assumed water depth of 35 feet and an assumed terrain elevation of + 20 feet, the land fill requirement would be: for subalternative A, (90 x 43, 560)/27 x 55 = 8.0 x 10 6 cubic yard; for subalternative B, (60 x 43,560)/27 x 55 = 5.3 x 10 ° cubic yards; and for subalternative C, (50 x 43,560)/27 x 55 = 4.4 x 10 6 cubic yards.
For subalternatives A, B, and C, the length of the breakwater was estimated at 1.2, 0.9, and 0.8 miles, respectively, and the length of the slope protection at 0.8, 0.6, and 0.5 miles, respectively.
Transshipment berths. Subalternative A would re-quire three berths by 1980; subalternatives B and C would require two berths by 1980. No alternatives would require any additional berths in the period from 1980 to 2000.
The length of each trestle was estimated at 0.2 mile.

511.
Alternative 4-5
Criteria
1. Commodity: Iron ore. 2. Site of deepwater ports: Garden Island Bay,
Gulf of Mexico. 3. Links to existing ports: Mobile, Houston and
Baton Rouge. 4. Site of storage: Artificial island. 5. Supercarrier dimensions: 250,000 d.w.t. 6. Subalternatives: The throughputs of the var-
ious subalternatives, as well as the drafts of the ves-sels they will serve, are given in table 105.
Table 105. Throughputs and Drafts of Vessels Served by Subalternatives
Vessel draft fully loaded
(feet)
Thro (million
1980
ughput tons/year)
2000
Subalternative
A
65 7.6 10.4
58.5 7.6 10.4
Requirements
Supercarrier berths. One berth would be suffici-ent for both subalternatives since the maximum through-put is less than 11 m.t.a.
Dredging. For subalternatives A and B, the re-quired water depth at the berth would be 75 and 67 feet, respectively, and at the turning basin and approach area, 78 and 70 feet, respectively. Sufficient water depth is available at the approach area. However, it is anti-cipated that a breakwater would be required to provide calm water at the berth. To restrict the cost of the breakwater, it is assumed that the breakwater would be located in 40 feet of water. The dredging volume of the turning basin would be approximately (2 x 1,100 x 2 x 1,100 x 35)/27 = 6.3 x 10 6 cubic yards; that of the

512.
berthing area would be (1.5 x 1,100 x 3 x 200 x 35)/27 = 1.3 x 10 6 cubic yards, or a total of 7.6 x 10 6 cubic yards. The breakwater would be about 0.3 miles long.
Trestle between supercarrier berth and artificial island. If the artificial island is located in 35 feet of water, a trestle length of approximately 1/2 mile for both subalternatives would be required.
Artificial island. The storage required for one berth would be approximately 0.5 x 10 6 long tons. The acreage required would be approximately 23 acres for iron ore and 10 acres for general services, for a total of approximately 33 acres.
The assumed water depth would be 35 feet, and the assumed terrain elevation, + 20 feet. The land fill requirement would be (43,560/27) x 33 x 55 = 2.9 x 10 6
cubic yards.
The length of the breakwater was estimated at 0.7 miles, and that of the slope protection at 0.25 miles.
Transshipment berths. Because this alternative is a loading operation, it is assumed that one berth with a practical maximum throughput capacity of 9 m.t.a. would be sufficient, even when the maximum projected throughput is 10.4 m.t.a. The trestle would be 0.2 mile long.
Alternative 4-6
This alternative is a combination of alternatives 4-4 and 4-5.
Criteria
1. Commodities: Grain and iron ore. 2. Site of deepwater port: Garden Island Bay,
Gulf of Mexico.

513.
3. Links to existing ports: As defined for al-ternatives 4-4 and 4-5.
4. Site of storage: Artificial island. 5. Subalternatives: The throughputs of the var-
ious subalternatives, as well as the dimensions of the vessels they will serve, are given in table 106.
Requirements
Supercarrier berths. The number of berths re-quired would be the same as that for alternatives 4-4 and 4-5. Subalternatives A, C, and D would require one iron ore and two grain berths by 1980; subalternative B would require one iron ore and one grain berth by 1980. No subalternative would require any additional berths in the period from 1980 to 2000.
Dredging. The only dredging required would be that of the turning basin and berthing area of the iron ore berth; the total dredging quantity would be 7.6 x 10 6 cubic yards. The breakwater would be about 0.3 mile long and would be located in about 40 feet of water.
Trestle between supercarrier berths and artificial island. The length of the trestle would be 1/2 mile for each of the commodities.
Artificial island. The required silo storage capacity would be: for subalternative A, 2.0 million long tons of grain; for subalternative B, 1.25 million long tons of grain; and for subalternatives C and D, 0.96 million long tons of grain.
The combined total acreage would be: for subal-ternative A, 80 + 23 + 10 = 113 acres; for subalterna-tive B, 50 + 23 + 10 = 83 acres; and for subalternatives C and D, 40 + 23 + 10 = 73 acres.
For subalternatives A, B, and C and D, the land fill requirement would be 10.0 x 10 6 , 7.3 x 10 6 , and 6.4 x 10 6 cubic yards, respectively.

Table 106. Throughputs and Dimensions of Vessels Served by Subalternatives
Grain Iron ore
Subalternative Throughput (m.t.a.)
Throu (m. t
ghput .a.) Vessel dimensions Vessel dimensions
Size (d.w.t.)
Draft (feet)
Size (d.w.t.)
Draft (feet) 1980 2000 1980 2000
250,000
250,000
120,000
120,000
A..
B.
C...
D..
65 32.8 58.9 250,000 65 7.6 10.4
58.5 18.0 23.6 250,000 58.5 7.6 10.4
50 18.0 23.6 250,000 65 7.6 10.4
50 18.0 23.6 250,000 58.5 7.6 10.4

515.
The length of breakwater was estimated at 1.4, 1.1 and 1.0 mile, and that of the slope protection at 1.0, 0.8 and 0.7 miles, for subalternatives A, B, and C and D, respectively.
Transshipment berths. The number of transship-ment berths required would be the same as that for alter-natives 4-4 and 4-5. Subalternative A would require one iron ore and three grain berths by 1980; subalternatives B, C and D would require one iron ore and two grain berths by 1980. No subalternative would require any additional berths in the period from 1980 to 2000.
Figure 40 presents the location, orientation and layout of berths, breakwater and artificial island.
Alternative 5-7
Alternative 5-7 does not stand on its own. It is always combined with one of the alternatives numbered 5-4 through 5-6.
Criteria
1. Site of deepwater port: Inland near Freeport, Texas.
2. Link to existing ports: All existing Texas ports.
3. Site of storage: Near Freeport. 4. Subalternatives: The throughputs of the var-
ious subalternatives, as well as the dimensions of the vessels they will serve, are given in table 107.
Requirements
Supercarrier berths. Subalternative A would re-quire one berth by 1980, and it is assumed that no addi-tional berth would be required in the period from 1980 to 2000, since this is a loading operation. Subalterna-tive B would require two berths by 1980, and no addi-tional berths in the period from 1980 to 2000.

- 41 4f.•
G,,q,.: / a INt 1 • ,I l.
2 A' b 4 j 2 2 1
2 2 - S L. A
• 1 - : 2
"Az
°P". 2 0,4 /3„1 t , / ' 2 /
h pes "ass 4._ '1707-6, 3 r a ..,
'' / " - ight, erty t BREAKWATER Al_- Lin' LoftiLigaiiiil sri.„ c,st j 2 2 2 ,
313. ight„ 2 .27,175,4',to>„__
9 IRON OKt btrci n 2
2 2 56
3 ------- 9 11 _ 14 15 4
2i
2 6/ 8 113-ACRE ISLAND __,—___ 2
-,
izies ° s V 0
T4ANSSHI B, E1.__g_LiS
76 v 82 /26
88
311' \134
52 f
w 0 y 1 I N 1 65 y
4.11, /as On
' oore .52.)
s, 48
- ..-2( Nt. -
SOUTH PASS ---:.-->d 76
-.......
(9z____,..,
126
149
2 3 y2 v7
5 i87 v
135 ...9 0
1 n 16
?s7 — —
85 82 _
— 681 8, (QT N BERTHS 8
63 87
y93 86 131
S/P /4
123 /93
220
/30 GULF OF MEXICO
192
/
.v* 1 78 4f,4) G ‘,„
. 220
;11
e-De, 23e / 2.51
0 4
Scale of Statute Miles
Note: Location reference, figures 23-25.
FIGURE 40. LOCATION, ORIENTATION AND LAYOUT OF BERTHS, BREAKWATER AND ARTIFICIAL ISLAND OF ALTERNATIVE 4-6
/9,4
Robert R. Nathan Associates, Inc.

517.
Table 107. Throughputs and Dimensions of Vessels Served by Subalternatives
Subalternative
Vessel dimensions
I
Size Draft (d.w.t.) (feet)
Throughput (million tons/year)
1980 2000
A
250,000 651 and
58.5
120,000 50
18.0 23.6
18.0 23.6
Dredging. Since the grain operations are always in addition to the oil operations, no dredging require-ments apply for all channels, except for the turning basin and berthing area. This additional volume is es-timated at 10.0 x 10 6 cubic yards.
Acreage. Subalternatives A and B would require storage capacityof 1.25 and 0.96 million long tons, and an acreage of 50 and 38 acres would be required for subalternatives A and B, respectively.
Transshipment berths. For both subalternatives, two berths would be required. The length of the con-veyor belts is set at 1 mile for both berths combined.
VIII. COST ESTIMATES OF DRY BULK PORTS
Unit Costs
First Cost
The main cost components of a deepwater port han-dling dry bulk commodities are the construction and/or installation cost of:
1. Berths and breakwater at berths 2. Channels and maneuvering areas 3. Trestles 4. Artificial island 5. Mechanical and electrical equipment 6. Silos, in case of grain.
The cost of each component will be evaluated in the following sections; however, all components do not necessarily apply to each type of port construction al-ternative. The year 1970 was selected as the base year for the cost evaluation.
Berths and Breakwater at Berths
Supercarrier berths. Only fixed berths (islands and marginal piers) are considered for the handling of dry bulk. The cost of the berths will be evaluated using those costs established for the supertankers, ex-cluding the cost of equipment, which will be assumed to be 10 percent of that required for the oil berth. The multiplication factor is 0.9. Furthermore, it will be assumed that the cost of the breasting dolphins would

520.
constitute 40 percent of the total civil cost of the berth. For loading operations (coal and grain), the cost of the breasting dolphins would be about 50 percent of the cost for unloading operations (oil and iron ore) for the same design vessel and exposure factor, because the mass of a berthing ballasted empty vessel would be 50 percent or less of the mass of a berthing laden ves-sel. The multiplication factor would be 0.80.
1. Delaware Bay area, alternatives 2-6 and 2-7. All coal and iron ore berths would be marginal piers. The base case for cost evaluation would be the base case of table 70 (a design vessel of 250,000 d.w.t., and a water depth of 72 feet). The cost, in millions of dol-lars, of one coal berth would be: for a 250,000 d.w.t. vessel with a draft of 65 feet, 0.9 x 0.8 x 68/72 x $5.95 = $4.1; and for a 250,000 d.w.t. vessel with a draft of 58.5 feet, 0.9 x 0.8 x 62/72 x $5.95 = $3.7. The cost, in millions of dollars, of one iron ore berth would be: for a 250,000 d.w.t. vessel with a draft of 65 feet, 0.9 x 68/72 x $5.95 = $5.1; and for a 250,000 d.w.t. vessel with a draft of 58.5 feet, 0.9 x 62/72 x $5.95 = $4.6.
2. Hampton Roads, alternative 3-1. According to information from local authorities, all existing berths could be utilized at no additional expense.
3. Mississippi Delta area, alternatives 4-4 through 4-6. One berth would be constructed as a mar-ginal pier, whereas two berths would be constructed as an island pier. The base case for cost evaluation would be the $9.9 million island pier of alternative 4-1 (a design vessel of 200,000 d.w.t. and a water depth of 75 feet). The cost, in millions of dollars, of two grain berths would be: for a 250,000 d.w.t. vessel with a draft of 65 feet, 0.9 x 0.8 x 71/75 x $9.9 = $6.7; for a 250,000 d.w.t. vessel with a draft of 58.5 feet, 0.9 x 0.8 x 65/75 x $9.9 = $6.2; and for a 120,000 d.w.t. vessel with a draft of 50 feet, 0.9 x 0.8 x 120/250 x 55/75 x $9.9 = $2.5. The cost, in millions of dollars of two iron ore berths would be: for a 250,000 d.w.t. vessel with a draft of 65 feet, 0.9 x 71/75 x $9.9 = $8.4; and for a 250,000 d.w.t. vessel with a draft of

521.
58.5 feet, 0.9 x 65/75 x $9.9 = $7.7. One berth would cost about 35 percent less than a two-berth island.
4. Freeport area, alternative 5-7. One berth would be a marginal pier, whereas two berths would be an island pier. The base case for cost evaluation would be the $3.5 million island pier of alternative 5-4 (a design vessel of 200,000 d.w.t. and a water depth of 58 feet). The cost, in millions of dollars, of two grain berths would be: for a 250,000 d.w.t. vessel with a draft of 65 feet, 0.9 x 0.8 x 250/200 x 68/58 x 3.5 = $3.7; and for a 120,000 d.w.t. vessel with a draft of 50 feet, 0.9 x 0.8 x 120/200 x 53/58 x 3.5 = $1.4.
Transshipment berths. Since the number of trans-shipment berths does not exceed four, and the cost of a two-berth oil island pier was estimated in the range of $0.8 to $1.0 million, these same cost figures will be applied for this study. Therefore, the costs for a two-berth island pier would be: for alternatives 2-6, 2-7 and 5-7, $0.8 million; and for alternatives 4-4 through 4-6, $1.0 million.
Breakwater at berths. The cost of the breakwater protecting the iron ore berths would amount to (65/45) 2
x 20 = 42 million per mile for alternative 2-7, and to (65/45) 2 x 1.5 x 20 = $63 million per mile for alterna-tives 4-5 and 4-6.
Channels and Maneuvering Areas
Delaware Bay area, alternatives 2-6 and 2-7. The cost to be applied will be the same as for oil alterna-tives 2-1 through 2-4.
Channel A = $0.40 per cubic yard, and Channel B = $0.80 per cubic yard. For the berthing area at the iron ore facility of alternative 2-7, the cost of Chan-nel D will be applied, which is $0.90 per cubic yard.

522.
Hampton Roads area, alternative 3-1. Local au-thorities advised the use of the following preliminary cost figures:
Cost/cubic yard ($) Channel
New Ocean Channel Thimble Shoal Channel Entrance Reach Newport News Channel Craney Island Reach
0.40 0.75 0.90 0.90 0.90
Mississippi Delta. For the turning basin and berthing area at the iron ore berth of alternatives 4-5 and 4-6, a cost of $0.50 per cubic yard will be applied.
Freeport, Texas. A cost of $1.30 per cubic yard will be applied for alternative 5-7.
Trestles
Detailed estimates of the cost of trestles are not available. The cost would vary by water depth, load (mechanical equipment), and load condition due to rate of exposure (wind, waves and current). The following figures will be applied: for alternatives 2-6 and 2-7, $3.0 million per mile; and for alternatives 4-4 through 4-6, $5.0 million per mile. Each berth will be assumed to require one trestle.
Artificial Island
The cost of breakwaters and sand fill to be ap-plied will be the same as that derived for the various oil alternatives.
Delaware Bay area, alternatives 2-6 and 2-7. For both alternatives the breakwater would be in an average water depth of about 25 feet; its cost would be (50/45) 2
x 20 = $25 million per mile. The cost of the slope pro-tection would be $2 million per mile; that of the sand fill, $1.00 per cubic yard.

523.
Mississippi Delta, alternatives 4-4 through 4-6. All breakwaters woLild be in an average water depth of 35 feet, and would cost approximately $55 million per mile. The cost of the slope protection would be $2 mil-lion per mile; the cost of the sand fill, $1.00 per cu-bic yard.
Mechanical and Electrical Equipment
It has been estimated that the cost of mechanical and electrical equipment to handle one coal or iron ore supercarrier would be $15 to $20 million, depending on the length of the trestle. Considering the length of the trestles in various alternatives, a cost of $20 million for mechanical and electrical equipment on berths (supercarrier and transshipment), trestles and island will be applied. This cost is for one berth.
For grain a cost of $5 million per mile of tres-tle will be applied.
Grain Silos
The new 4,200,000-bushel grain silos of Seattle's Pier 86 were reported to have been constructed at a cost of about $8.0 million during 1969 and 1970. A 1971 study by the Port of Tacoma considers extending the ex-isting port grain elevator facility by a million-bushel storage elevator at a cost of $2,255,000, including the cost of design, inspection, administration and contin-gencies. since the deepwater ports of the gulf are an-ticipated to export various grains, a weighted average for the relationship between long tons and bushels will be applied. It was found that 1 long ton is equivalent to 39 bushels. Therefore, in this study a figure of $2 million per million bushels, or $78,000,000 per mil-lion long tons, of grain will be applied.
Miscellaneous
For drainage and surfacing of the coal and iron ore islands, a figure of $10,000 per acre will be ap-plied.

524.
Operating Cost
The main cost components of a deepwater port han-dling dry bulk are the cost of:
1. Marine operations 2. Loading and unloading operations at the
berths 3. Island operations 4. Personnel transport.
The costs given for these components will pro-vide only for the cost of personnel and equipment dir-ectly related to the operations. It is anticipated that all facilities would operate on a 7-day-a-week pro-gram and that four 8-hour shifts would therefore be required. The average annual labor cost of a person is set at $15,000.
Marine Operations
The same requirements for personnel, launches, and tugs would apply as for tankers in the case of fixed berths. Since the total number of supercarrier and transshipment berths combined in most of the alterna-tives is less than six, a cost of $2.56 million would be applied for all berths combined. When the total num-ber of berths is in excess of six, it will be assumed that an additional $1 million would be required for the separate operations at the supercarrier and transship-ment berths.
Loading and Unloading Operations at the Berths
During the entire period of loading or unloading a supercarrier or loading or unloading a transshipment barge, one operator would be present at each berth. Therefore, four operators would be required for each berth per week. The annual labor cost would amount to $60,000 per berth.
Island Operations
It will be assumed that for management, supervi-sion, and administration, an annual labor cost of

525.
$1 million per commodity would be required. In addition to this, the annual cost of supplies, utilities, and expenses could be $300,000 per commodity. The energy cost is set at $0.15 per long ton of throughput.
Personnel Transport
The cost of transporting personnel to and from the island would be the same as that for the deepwater ports handling crude oil. For ports in the Lower Dela-ware Bay and those in the Mississippi Delta, the annual cost will be assumed at $500,000 and $1 million, respec-tively.
Maintenance Cost
The following annual maintenance costs were esta-blished as percentages of the first cost:
Berths and trestles 1 5 Breakwater 1 0 Mechanical and electrical equipment:
Coal and iron ore 8 0 Grain 3 0
Grain silos 2 0 Dredging:
Delaware Bay, ocean channels to Hampton Roads and the Mississippi Delta 2 5
Inland channels at Hampton Roads 1 0
Inland basins at Freeport 0 5
Total Costs
Applying the unit costs as derived in the fore-going sections to the engineering requirements of the selected alternatives and subalternatives results in total first costs, total annual operating costs and total annual maintenance costs. These are given in table 108. A breakdown of the first costs into five components is given in table 109.

4.5 4.1 2.3 2.1
4.5 4.1 2.3 2.1
8.1 7.8 6.2 6.0
8.1 7.8 6.2 6.0
0.7 0.9
0.7 0.9
4.3 2.7 2.3
4.3 2.7 2.3
2.4 2.4
2.4 2.4
6.4 6.4 4.9 4.9 4.5 4.5
6.4 6.4 4.9 4.9 4.5 4.5
2.3 1.8
2.3 1.8
11.4 11.4 6.0 6.0
16.0 16.0 9.6 9.6
11.1 8.0 8.0
6.2 6.2
14.7 14.7 10.6 10.6 10.7 10.7
5.4 5.7
11.3 11.3 5.6 5.6
16.2 16.2 9.6 9.6
13.0 8.4 8.4
6.4 6.4
16.9 16.9 11.3 11.3 11.3 11.3
5.8 6.1
3-1 A 3-1 B
4-4 A 4-4 B 4-4 C
4-5 A 4-5 B
4-6 A 4-6 B 4-6 C 4-6 D 4-6 E 4-6 F
5-7 A 5-7 B
Table 108. Summary of Total First Cost and Total Annual Operating and Maintenance Costs of Dry Bulk Alternatives
(In millions of dollars)
Alternative Corn. and throughput (mil. L. tons)
Code no. a/ No. Sub.
As - sump tion 1980
Coal Iron ore
2000 1980 2000 1980
Grain
2000
First cost 1975-79b/
Annual operating cost
2000
Annual ma co
1980
ntenance
2000 1980
0680... 0690.. 0700.. 0710..
0720.. 0730.. 0740.. 0750..
0760.. 0770..
0780.. 0790.. 0800..
0810.. 0820..
0830.. 0840.. 0850.. 0860.. 0870.. 0880..
0890.. 0900..
2-6 A 1 45.6 43.7 -- -- 2-6 A 2 45.6 43.7 -- -- 2-6 B 1 11.5 6.4 -- -- 2-6 B 2 11.5 6.4 -- --
2-7 A 1 45.6 43.7 12.5 17.1 2-7 A 2 45.6 43.7 12.5 17.1 2-7 B 1 11.5 6.4 12.5 17.1 2-7 B 2 11.5 6.4 12.5 17.1
46.1 46.6 46.1 46.6
- -- 32.8 58.9 - -- 18.0 23.6 - -- 18.0 23.6
7.6 10.4 -- --
7.6 10.4 -- --
7.6 10.4 32.8 58.9 7.6 10.4 32.8 58.9 7.6 10.4 18.0 23.6 7.6 10.4 18.0 23.6 7.6 10.4 18.0 23.6 7.6 10.4 18.0 23.6
- -- 18.0 23.6 - -- 18.0 23.6
210.1 116.8 120.2 65.5
306.4 212.6 215.5 160.2
37.2 45.9
256.0 167.8 141.9
99.4 94.0
322.0 321.6 233.8 233.4 207.8 207.4
121.5 97.7
a/ Codenumbers shown for each alternative are those used in the computer computation of benefits and costs TAnnex F). b/ First cost period 1980-2000 is zero for all alternatives.

0760.. 3-1 A 0770.. 3-1 B
0780.. 4-4 A 0790.. 4-4 B 0800.. 4-4 C
8.0 4.6 7.0
37.2 45.9
37.2 45.9
16.4 9.6
10.6
75.6 56.0 49.5
156.0 97.6 74.8
256.0 167.8 141.9
3.8 3.8
3.8 3.8 3.8
a Table 109. Summary of First Cost of Dry Bulk Alternatives / -
(In millions of dollars)
Code no.b/
Dredg- ing Silos
Alternative
As- Sub. sump-
tion
Berths and
trestles
1975-79
Artificial island and
misc.
Machinery and
equipment No. Total
8.6 8.6 4.2 4.2
0680.. 2-6 A 1 0690.. 2-6 A 2 0700... 2-6 B 1 0710.. 2-6 B 2
27.4 27.4 11.6 11.6
134.1 40.8 84.4 29.7
40.0 40.0 20.0 20.0
80.0 80.0 60.0 60.0
210.1 116.8 120.2 65.5
306.4 212.6 215.5 160.2
0720.. 2-7 A 1 11.0 53.4 162.0
0730.. 2-7 A 2 11.0 53.4 68.2
0740.. 2-7 B 1 6.6 36.8 112.1
0750.. 2-7 B 2 6.6 36.8 56.8
0810.. 4-5 A 0820.. 4-5 B
0830.. 4-6 A 0840.. 4-6 B 0850.. 4-6 C
9.6 9.2
25.8 25.4 19.0
61.0 61.0
108.4 108.4 88.8
156.0 156.0 97.6
20.0 20.0
28.0 28.0 24.6
94.4 94.0
322.0 321.6 233.8
continued--

0860..1 4-6 D 0870.. 4-6 E 0880.. 4-6 F
18.6 20.2 19.8
88.8 82.0 82.0
97.6 74.8 74.8
24.6 27.0 27.0
233.4 207.8 207.4
3.8 3.8 3.8
8.3 2.6 2.6 7.3
121.5 97.7
97.6 74.8
0890..1 5-7 A 0900..1 5-7 B
13.0 13.0
Table 109. Summary of First Cost of Dry Bulk Alternatives / continued--
(In millions of dollars)
Alternative 1975-79
Code no./
No. Sub. Dredg- ing Silos
As- sump- tion
Berths and
trestles
Artificial island and
misc.
Machinery and
equipment Total
a/ First cost period 1980-2000 is zero for all alternatives. E/ Code numbers shown for each alternative are those used in the computer computation of benefits and costs (Annex F).

IX. COMBINATION OF CRUDE PETROLEUM AND DRY BULK PORTS
Although table 3 presents 20 alternatives combin-ing crude petroleum and dry bulk ports, it is not in-tended to evaluate these alternatives in the same way as those dealing with crude oil or dry bulk only, as has been done in the preceding chapters. All main components are the same in principle. Therefore, this chapter will illuminate only those issues or components influ-enced by such a combination of ports. An additional reason for not treating the combination alternatives in the same way as the component alternatives is the num-ber of possible subalternatives. Many crude oil alter-natives have four subalternatives; combining these with two to six dry bulk subalternatives would result in eight to 24 subalternatives.
, Issues of importance for a combination port are the safety of the maneuvering and unloading tankers and the safety of the oil storage, and the influence on the berth layout. In principle, the first cost and the an-nual operating and maintenance cost of the combination alternatives would be the sum of the costs of the indi-vidual alternatives. In other words, the first cost of alternative 2-8 would be the sum of the first costs of alternatives 2-1 and 2-6. In various alternatives, how-ever, some cost items would be duplicated; in these cases, the total costs would be less than the sum of the two components. Cost items which should be considered for reduction in case of combination ports are those of dredged channels, artificial islands, marine operations and personnel transport. Each item will be discussed separately by port area in the following sections.

530.
Delaware Bay Area
Safety
All fully loaded supertankers and supercarriers have to follow the same route between the deepwater lines of Channel A (figure 16) and the natural deepwater area at the berths (figures 19 and 21). This route is about 45 miles long and consists of four channel sec-tions having a total length of approximately 10 miles. Therefore, fully loaded incoming supertankers and iron ore carriers and fully loaded outgoing coal supercar-riers have ample opportunity to pass each other at three sections having a total length of approximately 35 miles. At these sections, sufficient water depth and width exist for safe passage.
The deepwater area at the berths is wide enough for safe maneuvering and for safe waiting if all berths are occupied and therefore can handle combined traffic. The safety of unloading the supertankers will not be in-fluenced by the unloading and loading operations of the coal and iron ore supercarriers and transshipment barges because of the distance between the locations of these operations. If crude oil and dry bulk are stored on one artificial island (which an optimum layout of the deepwater ports for the various commodities makes un-likely in the Lower Delaware Bay), then a minimum dis-tance between the storages would be required.
Berth Layout
The natural deepwater body at the deepwater berths is about 18,000 feet long. The length of one berth varies with the length of the vessel, and in the pertinent alternatives ranges from 1.5 x 1,262 feet to 1.5 x 1,050 feet. This means that approximately ten 1,800-foot-long marginal berths could be installed, if necessary. The maximum total number of berths would be five crude oil, two coal, and one iron ore berths. The orientation of the latter is perpendicular to the orien-tation of the others. Therefore, it may be concluded that there is sufficient space to accommodate all berths.

531.
Dredged Channels
Since the fully loaded supertankers and super-carriers would follow the same route from the Atlantic Ocean to berths and vice versa, all fully loaded ves-sels would use the same channels. The dimensions of the channels would be determined by the dimensions of the vessels with the largest drafts and beams, which in the pertinent alternatives (2-8 through 2-15) are super-tankers. Therefore, in these alternatives the first cost of channel dredging, as calculated for dry bulk alternatives 2-6 and 2-7, do not apply. This cost was estimated at $8.6 and $4.2 million in subalternative 2-6 for 250,000-d.w.t. carriers drawing 65 and 58.5 feet, respectively. It should be noted that the first cost of dredging in the case of alternative 2-7 is $2.4 million higher, which reflects the dredging cost of the berthing area of the iron ore berth. This cost is still applicable where iron ore operations are considered. Therefore, it may be concluded that in all eight combina-tion alternatives the total first cost of dredging is the sum of the first costs of dredging as calculated for the crude petroleum and dry bulk ports, minus $8.6 or $4.2 million, depending on the draft of the dry bulk carrier considered.
Artificial Islands
This paragraph does not apply to alternatives 2-8, 2-9, 2-12, and 2-13, because these alternatives include alternatives 2-1 or 2-3, which consider onshore storage. For the remaining four alternatives, a combination of the two separate islands would theoretically be possible. However, it is very unlikely that this would be proposed, given the characteristics of the requirements for the crude petroleum and dry bulk ports. The crude petroleum berths would be located at the northernmost portion of the natural deepwater body to keep the submarine pipe-lines to the coast at Big Stone Beach as short as pos-sible. A naturally shallow area is found close to this routing. Disregarding conditions of environment, soil, and hydraulics, this area would be suitable for the construction of an artificial island.
The dry bulk port would be located in the southern-most portion of the natural deepwater body to keep the

532.
trestles between berths and artificial island as short as possible. A naturally shallow area, located approxi-mately 3 miles southeast of the first shallow area, would accommodate the dry bulk island. As figure 39 shows, these two islands would not require the same lo-cation and do not interfere physically with each other. Therefore, it may be concluded that combinations of the two islands are not likely to be necessary or required for the combination alternatives that are considered, because this would result in either longer pipelines or longer trestles.
Marine Operations
For the crude oil alternatives, the annual cost of the marine operations; that is, the cost of tug as-sistance and the employment of oarsmen, would be $2.56 million. For the dry bulk alternatives, this cost is $2.56 million for six berths and less, and $3.56 mil-lion for seven or more berths. If, in the case of com-bined activities, the total number of berths is eight or less, then $2.56 million may be deducted from the total operating cost (for instance, alternatives 2-1 and 2-2, subalternatives A and C, in combination with alternative 2-6). If the number of berths is nine or more, then the deduction would be less.
Because of the different criteria for crude oil and dry bulk ports, it is not possible in general to present a figure which might be deducted from the total operating cost. However, this figure will be in the order of magnitude of $1 to $2 million. The number of crude berths varies from a minimum of two by 1980 to a maximum of five by 2000. The number of coal berths varies from two to five, whereas the total number of iron ore berths is four. Therefore, it may be con-cluded that in most of the cases $1 to $2 million, and in some cases, $2.56 million, could be deducted from the total operating costs.
Personnel Transport
The personnel shuttle service between shore and deepwater ports could easily be combined. Therefore,

533.
$0.5 million could be deducted from the total operating costs.
Maintenance Cost
Only the maintenance cost of the dry bulk chan-nels could be deducted from the total sum. The annual maintenance cost of these channels would be 2.5 percent of the first cost. This would result in $0.21 million and $0.11 million, for a first cost of $8.6 and $4.2 million, respectively. This reduction is a very insig-nificant amount of the total maintenance cost.
Conclusion
Taking the above deductions into account, it can be concluded that the total sum of first cost could be reduced by about 1 to 3 percent; of annual operating cost, by 5 to 10 percent; and of maintenance costs, by 1 to 3 percent, depending on the alternative and sub-alternative considered.
Mississippi Delta Area
Safety
Because no dredged channels are required, all vessels would follow different approach lanes to and from the berths. Vessels move in a water body restricted in width only when maneuvering to and from the berths located at the land side of the trestle in the case of crude oil berths oriented as depicted in Layout 1.
Berth Layout and Artificial Island
If two separate islands are built, the layout of the various berths could be independent of each other. However, combining the two islands would result in a reduction of the length of the breakwater. This reduc-tion would be in the order of 0.2 to 0.4 miles, and would reduce the total cost of the breakwater by $11 to
534.
$22 million. Because the area of the combined island would be the same or somewhat greater than the sum of the two individual islands, and because the average water depth would be approximately the same, no reduc-tion of sand fill cost would result from combining the two islands into one.
Marine Operations
For the crude oil alternatives the annual cost of the marine operations (i.e., the cost of tug assis-tance and the employment of oarsmen) would be $3.56 million by 1980 and $7 million by 2000. For the dry bulk alternatives, this cost would be $2.56 or $3.56 million, depending on alternative and subalternative. In the case of combination alternatives, a somewhat bet-ter utilization of tugs and oarsmen could be made, as in case of dry bulk operations alone. However, it is unlikely that this could reduce the marine operating cost by more than $1.0 million at the average.
Personnel Transport
The personnel shuttle service between shore and deepwater ports could easily be combined. Therefore, $1.0 million could be deducted from the total operating cost.
Maintenance Cost
Only the maintenance cost of the breakwater could be reduced, since the first cost of the breakwater would be less. The annual maintenance cost was set at 1.0 percent of the first cost. This would result in a reduc-tion of $0.11 to $0.22 million, depending on the reduc-tion of the first cost.
Conclusion
Taking the above deductions into account, it can be concluded that the total sum of first cost could be reduced by 3 to 4 percent; of annual operating cost, by 10 to 15 percent; and of annual maintenance costs, by 2 to 3 percent, depending on alternative and subalterna-

535.
Freeport, Texas Area
The cost calculations of alternative 5-7 have al-ready taken into account the combination with the crude petroleum operations. Only the safety aspects of maneu-vering in the ocean channel, and this channel's require-ments for local widening to allow passage of fully laden incoming supertankers and outgoing grain carriers, remain to be discussed.
The incoming fully loaded supertankers and the outgoing fully loaded grain supercarriers would use the same deepwater channel. Because the channel width is based on one-way traffic, allowance should be made so that vessels could pass each other safely. The draft of the grain supercarriers was established at 50, 58.5, and 65 feet; and of the supertankers, at 55, 70, and 95 feet. The depth of the ocean channel section lo-cated over 10 miles off shore would be 60, 70, or 78 feet when based on the drafts of the various grain car-riers. These depths exist 10, 21, and 25 statute miles offshore, respectively.
Assuming that one section of the 21- or 25-mile-long ocean channel would be dredged at a width allowing two-way traffic, this section would be located about 11 statute miles off shore. The existing depth at these locations would be about 60 feet. Assuming that this section would be approximately 2 miles long and that the additional width would be equal to 4 times the beam of the grain supercarrier, the additional dredging, in-cluding 3.5 feet of overdepth, would amount to approxi-mately 4 and 8 million cubic yards for the 21- and 25- mile-long channel, respectively. Assuming a unit dredg-ing cost of $0.75 per cubic yard, the additional dredging cost would amount to approximately $3 and $6 million, respectively. This amount would increase the total first cost of the combination alternatives by less than 1 percent. Consequently, the assumed annual maintenance cost would increase by approximately $0.06 million or $0.12 million, or by less than 1 percent.

X. TEXAS-EAST COAST PETROLEUM PRODUCTS PIPELINE
Introduction
The road distance between Houston, Texas, and New York, New York, is 1,636 miles. Assuming that the center of the refinery area would be between Houston and Beaumont-Port Arthur and that the center of the delivery area would be between Philadelphia and New York, the total length of the pipeline system would be approximately 1,550 miles.
The present flow of products through the Colonial pipeline is about 65 percent gasoline, 10 percent kero-sine, and 25 percent distillates. It will be assumed that the same group of products would be transported by the Texas-East Coast Products Pipeline. The assumed principal physical characteristics of these products are given in table 110.
Table 110. Physical Characteristics of Products
Product Specific gravity
Viscosity at 60°F. (cS)
Barrels/ long ton
0.7
2.5
6.0
Gasoline
Kerosine
Distillate
0.73
0.81
0.87
8.65
7.90
7.37

538.
Anticipating that, for a given pipeline and in-stalled horsepower, the throughputs of the three prod-ucts would be different, calculations will be made to determine the difference in required horsepower for a constant annual throughput of each product.
Throughputs and Selected Line Sizes
The projected total volumes of this pipeline sys-tem are 50 million long tons in 1980 and 150 million long tons in 2000. Since the optimum capacity of a 56- inch pipeline is between 70 and 85 m.t.a., it will be assumed that by 1980 the pipeline system would consist of one 56-inch line, and that by 2000 two 56-inch pipe-lines would be utilized.
Horsepower Calculations
Considering the above data, the comparative horsepower calculations will be made for a 56-inch line and an annual throughput of 80 million long tons.
Calculation Example for Gasoline
Annual throughput (A) = 80 million long tons Outside pipe diameter (0) = 56 inches Design throughput (B) = 80 x 10 6 x 8 65
365 x 24 x 1.2 = 95 x 103 barrels/hour
Inside diameter (D) = 56-2 = 54 inches Reynolds number (R) = 2,214 x 95 x 10 3 - 5,500 x 10 3
54 x 0.7 Friction coefficient (f) = 0.0108 Pressure drop per mile (p), --- 34.87 x 0.0108 x 95 2 x 10 ° x 0.73 - 5.4 p.s.i.
54 •
Horsepower (h) = 95,000 = 49.7 b.hp./p.s.i. 2,450 x .78 Required horsepower (H) = 5.4 x 49.7 = 268 b.hp./mile

539.
Calculation Example for Kerosine
A = 80 million long tons 0 = 56 inches
80 x 106 x 7 ' 9 B = 365 x 24 x 1.2 = 86 x 10
3 barrels/hour
D = 54 inches 2,214 x 86 x 10 3
R - = 1,450 x 10 3 54 x 2.5
f = 0.012 34.87 x 0.012 x 86 2 x 10 6 x 0.81
P - 5.5 p.s.i/ 54 5 mile
86,000 h - - 45.0 b.hp./p.s.i. 2,450 x .78 H = 5.5 x 45.0 = 247 b.hp./mile
Calculation Example for Distillate
A = 80 million long tons 0 = 56 inches
80 x 10 6 x 7.37 B - 365- x 24 ' x 1.2 = 80 x 10 3 barrels/hour
D = 54 inches 2,214 x 80 x 10 3
R - ' - 546 x 10 3 5T x 6.0
f = 0.014 34.87 x 0.014 x 80 2 x 10 6 x 0.87
P 54 5 - 5.9 p.s.i./
mile 80,000 h - - 41.8 b.hp./p.s.i. 2,450 x .78
H = 5.9 x 41.8 = 247 b.hp./mile
Since the difference in required horsepower be-tween gasoline on the one hand, and kerosine and distil-late on the other hand, is only about 10 percent, no differentiation in throughput will be made by product. The average required horsepower for the product line would be (268 + 247 + 247)/3 = 254 b.hp. per mile. According to table 21, the required horsepower for a 56-inch crude oil line would be 274.6 b.hp. at a throughput of 80 m.t.a., so that the products lines would require a horsepower capacity which is 93.2

540.
percent of that of the previously evaluated crude oil lines. So as not to repeat the same type of calcula-tions, the required horsepower capacities for varying throughputs of products will be taken at 93.2 percent of the horsepower capacity required for a 56-inch crude line as presented in table 21.
Therefore, the required average horsepower per mile of product line would be for a throughput of 50 m.t.a., 0.932 x 72.99 = 68.0 b.hp./mile; for a through-put of 60 m.t.a., 0.932 x 121.10 = 112.9 b.hp./mile; for a throughput of 70 m.t.a., 0.932 x 188.70 = 175.9 b.hp./mile; and for a throughput of 80 m.t.a., 0.932 x 274.60 = 255.9 b.hp./mile.
Installation Program
It should be noted that the installation phasing is given in a very simplified approach to be used for calculation purposes only. It will be assumed that installation of the first 56-inch line will take place during 1977-79. The second line is assumed to start operation when the first line reaches a capacity of 80 m.t.a., which is assumed to be by 1986.
Therefore, the second line is assumed to be in-stalled during 1983-85, and would have an ultimate capacity of 70 m.t.a. by 2000.
The required horsepower would be: for the first 56-inch line, 68.0 b.hp./mile by 1980, and 255.9 b.hp./ mile by 1986; and for the second 56-inch line, 175.9 b.hp./mile by 2000.
The following horsepower installation program will be assumed: for the first line, 128 b.hp./mile during 1979, and 128 b.hp./mile during 1982; and for the second line, 88 b.hp./mile during 1985, and 88 b.hp./ mile during 1995.

541.
Cost
Unit Cost
The following first cost and annual operating and maintenance costs, per mile or per b.hp., will be applied. All unit costs are in accordance with those established in chapter V for crude oil pipelines.
First cost
The first cost of a 56-inch pipeline would equal $350,000 per mile, and that of booster pumps would equal $150 per b.hp.
Annual Operating Cost
Pipeline management costs would equal $1 million per 1,550 miles. Booster station personnel costs would equal $60,000 per 50 miles, or $1,200 per mile. Energy costs would equal $52.28 per b.hp.
Annual Maintenance Cost
The annual maintenance cost of pipelines would equal 0.2 percent of first cost; that of booster pumps would equal 2.5 percent of first cost.
Total Cost
Table 111 presents the total first and annual operating and maintenance cost of the pipeline system.

Cost Cost
Code no.a/
1980 vol.
(m.t.a.) 1977- 79
first
1980
Main.
2000 vol.
(m.t.a.) 19 80- 2000 first
2000
Operd Main. Oper.
50.0 572.2 10.8 1.8 150.0 613.2 36.2 4.7 0900..
542.
Table 111. Total First and Annual Operating and Main- tenance Cost of the Texas-East Coast Products
Pipeline
(In millions of dollars)
a/ Code number is that used in the computer computation of benefits and costs (Annex F).
Security Classification .. DOCUMENT CONTROL DATA - R & D
(Security classification of title, body of abstract and indexing annotation must be entered when the overall report Is classified)
I ORIGINATING ACTIVITY (Corporate author) 2a. REPORT SECURITY CLASSIFICATION
Robert R. Nathan Associates, Inc. Unclassified 1200 Eighteenth St. N. W. 20. GROUP
Washington, D. C. 20036 NA 3 REPORT TITLE
U. S. Deep Water Port Study
4. DESCRIPTIVE NOTES (Type of report and inclusive dates)
Final Report 5 AUTHOR(S) (First norms, middle initial, last name) Ralph L. Trisko, Philip Cheney,Jacobus de Rprei Jeremy C. Ulin,and B. Ahnert,Lee Bertman,James Cavin, Marcella Czarnecki, Edmund Getzin,Dieter Harper,Orest Koropecky,James Leonard,Richard Maurice and Harold Wein
0 REPORT DATE 75. TOTAL NO. OF PAGES Tb. NO. OF REFS
August 1972 ea. CONTRACT OR GRANT NO 9a. ORIGINATOR'S REPORT NUMVERISI
DACW 31-71-C-0045 b. PROJECT NO. TWR Report 72-8 (in 5 volumes) NA
. 9. OTHER REPORT NOM/ (Any other number* that may be assigned this report)
d. None 10 DISTRIBUTION STATEMENT
This document has been approved for public release and sale, its distribution is unlimited.
II. SUPPLEMENTARY NOTES 12. SPONSORING MILITARY ACTIVITY
None U. S. Army Engineer Institute for Water Resources,Alexandria, Virginia 22314
13 ABSTRACT
This report provides an overall appraisal of deep port needs for the United States by means of identification of the factors critical to U. S. deepwater port decision; development of criteria appropriate to the evaluation of engineering, economic and environmental aspects of deep port needs and policies, analysis of the development options available at this time and the critical issues surrounding each and the identifi-cation of critical issues which need further analysis. The study empha- sizes port requirements for bulk commodities.
Volume 1 contains the Summary Report Volume II contains Commodity Studies and Projections Volume III containsPhysical Coast aid Port Characteristics, and
Selected Deepwater Port Alternatives Volume IV contains The Environmental and Ecological Aspects of
Deepwater Ports Volume V contains Transport of Bulk Commodities and Benefit-Cost
Relationships
DD,1",..1473 AAAAA CIES 00 FORM 147$. I JAN 04. WHICH IS O•SOLIETE FOR ARMY MSC
Security—aassification

Security Classification
14 LINK A LINK B LINK C KEY WORDS
ROLE WT ROLE WT ROLE WT
:ommodity Studies, Projections, Deepwater Port Uternatives, Transport Costs, Benefit-Cost knalysis, Secondary Economic Benefits, 3nvironment and Ecology of Deep Ports
.
Security Classification