u.s. department of the interior south florida natural ...2014:1 ecological and design documentation...
TRANSCRIPT

AlligAtor Production SuitAbility
index Model (gAtor-PSiM v. 2.0)
ecological ModelRepoRt
SFNRc technical Series2014:1
ecological and design documentation
National Park ServiceU.S. Department of the Interior
South Florida Natural Resources CenterEverglades National Park

LNWR
WCA-2
WCA-3A
WCA
-3B
Big CypressNationalPreserve
EvergladesNational Park
Gulf of
Mexico
Atlantic Ocean
BiscayneNational
Park
Florida Bay
LakeOkeechobee
EvergladesAgricultural
Area
Tayl
or S
loug
h
Shark
Rive
r Slou
gh
Homestead
Key Largo
Miami
FortLauderdale
West Palm BeachFort Myers
Naples
Key West
Cape Sable
Tamiami TrailTen Tousand Islands
APSI Model Domain

AlligAtor Production SuitAbility index Model (GATOR-PSIM v. 2.0)
Ecological and Design Documentation
ecological Model RepoRtSFNRc technical Series 2014:1
South Florida Natural Resources centereverglades National parkHomestead, Florida
National park ServiceU.S. department of the interior
cover photograph courtesy of Rodney cammauf


iiialligator production Suitability Model
table oF coNteNtS
coNtRibUtiNg aUtHoRS . . . . . . . . . . . . . . . . . . . . . . . . . . . . . . . . . . . . . . . . . . . . . . . . . . . . . . . . . . . . . . . . . . . . . . . . . iv
acKNoWledgeMeNtS . . . . . . . . . . . . . . . . . . . . . . . . . . . . . . . . . . . . . . . . . . . . . . . . . . . . . . . . . . . . . . . . . . . . . . . . . . . iv
FoRWaRd . . . . . . . . . . . . . . . . . . . . . . . . . . . . . . . . . . . . . . . . . . . . . . . . . . . . . . . . . . . . . . . . . . . . . . . . . . . . . . . . . . . . . . . . v
iNtRodUctioN . . . . . . . . . . . . . . . . . . . . . . . . . . . . . . . . . . . . . . . . . . . . . . . . . . . . . . . . . . . . . . . . . . . . . . . . . . . . . . . . . . . 1
purpose and objective . . . . . . . . . . . . . . . . . . . . . . . . . . . . . . . . . . . . . . . . . . . . . . . . . . . . . . . . . . . . . . . . . . . . . . . . . . . . . . 1Model domain . . . . . . . . . . . . . . . . . . . . . . . . . . . . . . . . . . . . . . . . . . . . . . . . . . . . . . . . . . . . . . . . . . . . . . . . . . . . . . . . . . . . 2
MetHodS aNd ecological RatioNale . . . . . . . . . . . . . . . . . . . . . . . . . . . . . . . . . . . . . . . . . . . . . . . . . . . . . . . . . . 2
Habitat index . . . . . . . . . . . . . . . . . . . . . . . . . . . . . . . . . . . . . . . . . . . . . . . . . . . . . . . . . . . . . . . . . . . . . . . . . . . . . . . . . . . . 3breeding potential index . . . . . . . . . . . . . . . . . . . . . . . . . . . . . . . . . . . . . . . . . . . . . . . . . . . . . . . . . . . . . . . . . . . . . . . . . . . . 5courtship and Mating index . . . . . . . . . . . . . . . . . . . . . . . . . . . . . . . . . . . . . . . . . . . . . . . . . . . . . . . . . . . . . . . . . . . . . . . . . 6Nest building index . . . . . . . . . . . . . . . . . . . . . . . . . . . . . . . . . . . . . . . . . . . . . . . . . . . . . . . . . . . . . . . . . . . . . . . . . . . . . . . . 6in Vivo egg development . . . . . . . . . . . . . . . . . . . . . . . . . . . . . . . . . . . . . . . . . . . . . . . . . . . . . . . . . . . . . . . . . . . . . . . . . . . . 9Nest Flooding index . . . . . . . . . . . . . . . . . . . . . . . . . . . . . . . . . . . . . . . . . . . . . . . . . . . . . . . . . . . . . . . . . . . . . . . . . . . . . . . . 9alligator production Suitability index . . . . . . . . . . . . . . . . . . . . . . . . . . . . . . . . . . . . . . . . . . . . . . . . . . . . . . . . . . . . . . . . . . 11
State VaRiableS aNd Model pRoceSS . . . . . . . . . . . . . . . . . . . . . . . . . . . . . . . . . . . . . . . . . . . . . . . . . . . . . . . . . . 11
inputs . . . . . . . . . . . . . . . . . . . . . . . . . . . . . . . . . . . . . . . . . . . . . . . . . . . . . . . . . . . . . . . . . . . . . . . . . . . . . . . . . . . . . . . . . 11outputs . . . . . . . . . . . . . . . . . . . . . . . . . . . . . . . . . . . . . . . . . . . . . . . . . . . . . . . . . . . . . . . . . . . . . . . . . . . . . . . . . . . . . . . 14
FUtURe Model eNHaNceMeNt . . . . . . . . . . . . . . . . . . . . . . . . . . . . . . . . . . . . . . . . . . . . . . . . . . . . . . . . . . . . . . . . . . 14
SUMMaRy aNd coNclUSioNS . . . . . . . . . . . . . . . . . . . . . . . . . . . . . . . . . . . . . . . . . . . . . . . . . . . . . . . . . . . . . . . . . . 16
liteRatURe cited . . . . . . . . . . . . . . . . . . . . . . . . . . . . . . . . . . . . . . . . . . . . . . . . . . . . . . . . . . . . . . . . . . . . . . . . . . . . . . . 16

iv South Florida Natural Resources center technical Series (2014:1)
Please reference this report as follows:
Shinde, D., L. Pearlstine, L.A. Brandt, F.J. Mazzotti, M.W. Parry, B. Jeffery, and A. LoGalbo. 2014. Alligator Production Suitability Index Model (GATOR–PSIM v. 2.0): Ecological and Design Documentation. South Florida Natural Resources Center, Everglades National Park, Homestead, Florida. Ecological Model Report. SFNRC Technical Series 2014:1. 18pp
Reproduced on 30% post-consumer waste paper with vegetable-based inks. Fiber sourced from responsibly managed forests.
Contributing authors
Dilip Shinde1, Leonard Pearlstine 1, Laura A. Brandt2, Frank J. Mazzotti3, Mark W. Parry1, Brian Jeffery3, and Alicia LoGalbo1
1South Florida Natural Resources Center, National Park Service, Everglades National Park, 950 North Krome Avenue, Homestead, FL 33030, USA
2U.S. Fish and Wildlife Service
3Fort Lauderdale Research and Education Center, University of Florida
CoMMEnts anD QuEstions: [email protected]
aCKnoWLEDgEMEnts
We sincerely thank all contributors that supported the development of this model, including those who developed previous alligator habitat suitability models and field researchers for their tireless efforts collecting and analyzing data. We especially thank all reviewers and contributors that provided feedback to the model development including H. Franklin Percival, Kenneth G. Rice, and Janice H. Parsons. Views expressed here do not necessarily represent the views of the U.S. Fish and Wildlife Service or the National Park Service. Use of trade, product, or firm names does not imply endorsement by the U.S. Government. Portions of this work were supported by funding from the U.S. Geological Survey Greater Everglades Priority Ecosystems Science Program. Much of the improved understanding of alligator ecology was made possible by studies funded as part of the Restoration Coordination and Verification (RECOVER) Monitoring and Assessment Plan (MAP).
Report prepared by Science Communications staff of the South Florida Natural Resources Center: Managing Editor, Alice Clarke; Technical Editor, Ellen Hardy; Desktop Publishing, Brandon Gamble.
valligator production Suitability Model
ForWarD
The American alligator (Alligator mississippiensis) is a keystone species within Everglades marsh systems whose activity structures the landscape increasing the diversity of habitat and species. This report describes an Alligator Production Suitability Index (APSI) model designed to evaluate effects of changes in hydrology and land cover on this keystone species. Alligators are dependent on spatial and temporal patterns of water fluctuations that affect courtship and mating, nesting, and habitat use. Alligator abundance, nesting effort, growth, survival, and body condition serve as indicators of the health of the Everglades marsh system. The Modified Water Deliveries Project and the Comprehensive Everglades Restoration Plan are two of the most significant Everglades restoration programs for reversing past environmental degradation and restoring habitat for wildlife such as the alligator. Ecological modeling tools that can simulate the effects of restoration are of keen interest to natural resource managers and restoration and conservation planners. The APSI model incorporates concepts from existing alligator habitat suitability models, the literature, and data that have been collected in the last decade. This model uses new information to estimate an alligator production suitability index that includes components for habitat assessment and quality, breeding, courtship and mating, and nesting success (nest building and nest flooding). The major input requirement for the model includes daily continuous surfaces of water depth over the modeling time period, habitat, locations and height of tree islands, locations of alligator holes, and, optionally, salinity for coastal regions. Users will typically only need to provide water depths and salinity (if used). The other layers are provided with the model, but new layers can be substituted by the user if desired. Examination of individual components of the index during a year provides insight to any limiting hydrologic conditions that contribute to a poor overall index, thus inhibiting successful hatchling production. The APSI model can help in optimizing water management to stabilize and improve alligator populations and has been used to evaluate the effects of alternative Everglades restoration scenarios on habitat suitability for alligator production in the Central Everglades Planning Project (CEPP). Greater Everglades ecological models play an important role in facilitating planning, evaluation, and assessment of alternative approaches. The APSI model is a major contribution to ecological modeling within the South Florida Natural Resources Center and collaboratively across agencies working on Greater Everglades restoration projects under the umbrella of the Joint Ecosystem Modeling ( JEM) effort, which is a south Florida partnership among federal and state agencies, universities, and other organizations. It has been our pleasure to work with our federal, state, and university partners in the development of this model. The National Park Service looks forward to continued cooperation to promote and maintain the Everglades, a natural area of great importance to the region.
Robert Johnson Director South Florida Natural Resources Center Everglades National Park
December 2014

vi South Florida Natural Resources center technical Series (2014:1)

1alligator production Suitability Model
introDuCtion
The American alligator (Alligator mississippiensis) is consid-ered a key component of the Everglades ecosystem and is a keystone species in the Everglades landscape (Mazzotti and Brandt 1994). Alligator abundance, nesting effort, growth, survival, and body condition serve as indicators of the health of the Everglades marsh system (Mazzotti et al. 2003, 2009). As a top predator in the Everglades ecosystem, alligators consume a particularly wide variety of sizes and taxa of prey and may influence their populations (Mazzotti and Brandt 1994). Everglades plant and animal communities are struc-tured by alligator activities. Alligators shape plant commu-nities by excavating ponds and creating trails, resulting in deeper open-water areas, and by constructing nest mounds that provide relatively elevated areas, which may be colonized by plant species not tolerant of seasonal flooding (Craighead 1968, 1971). These changes in landscape features provided by alligators are critical to many wildlife populations dependent on them as nesting, resting, or foraging sites (Craighead 1968, Kushlan 1974, Deitz and Jackson 1979, Kushlan and Kushlan 1980, Hall and Meier 1993).
Alligators were historically most abundant in wetland habitats fringing the deeper slough areas, where the limestone bedrock was near the surface, and in freshwater mangrove areas (Craighead 1968). Alligators now are most abundant in the central sloughs and canals of the current Everglades land-scape (Kushlan 1990, Morea 1999) and are absent or rare in the peripheral wetlands, which have been lost to development or altered hydrologically (Mazzotti and Brandt 1994, Mazzotti et al. 2009). The spatial pattern of habitat use by alligators has changed as a result of land use change and water manage-ment practices in south Florida. Development has resulted in modified and artificial aquatic habitats such as canals, impoundments, and borrow pits, all of which have become occupied by alligators. Canals, however, do not provide suit-able habitat for juvenile alligators and therefore are typically inhabited only by adults. Canals can act as reproductive sinks. In areas adjacent to some canals, nests may experience rapid and extreme changes in water level during incubation, result-ing in reduced nest success and increased hatchling mortal-ity (Chopp 2003). Mazzotti and Brandt (1994) conclude that region-wide, the natural habitats of the Florida Everglades today contain fewer alligators than historically due to loss and alteration of wetland habitats.
In addition, changes in water management have influenced the pattern of water levels in the southern Everglades, causing unnatural flooding of alligator nests (Kushlan and Jacobsen 1990). Hydrologic alterations of the system have reduced prey availability corresponding to reduced growth, survival, and reproduction of alligators (Mazzotti et al. 2007). Increasing drought frequency and depth of drying have reduced suit-ability of Southern Marl Prairie and Rocky Glades habitats and occupancy of alligator holes by alligators (Mazzotti et al. 2009, Fujisaki et al. 2012). Increasing drought frequency and
depth of drying also increase the time required for fish and macroinvertebrate populations to recover to levels consid-ered representative of the historical Everglades (Trexler et al. 2003, Trexler and Goss 2009) and sufficient to sustain large predators such as alligators (Loftus and Eklund 1994, Turner et al. 1999, Trexler et al. 2005). This may be correlated to lower growth and reproductive rates for alligators in the Everglades when compared to other parts of their range (Mazzotti and Brandt 1994). Repeated drying events also may wipe out entire age classes, as alligators are forced to congregate in remaining water bodies where they may suffer predation and cannibalism (Mazzotti et al. 2009, Fujisaki et al. 2011).
To reverse past environmental degradation and restore habitat for wildlife such as the alligator, the largest environ-mental restoration project in the world is being undertaken in the Everglades ecosystem. The Modified Water Deliveries Project (MWD) (USACE 1992) and the Comprehensive Everglades Restoration Plan (CERP) (http://www.ever-gladesplan.org/about/about_cerp_brief.aspx, accessed Oct. 22, 2012) are two of the most significant Everglades restora-tion programs. These programs seek to restore more natural hydrologic patterns to the Everglades ecosystem through a series of projects that include canal removal, hydropattern restoration, and water storage. CERP is being implemented using an applied science strategy framework (Ogden and Davis 1999, Ogden et al. 2003) that links alternative plan eval-uation with ecological models, monitoring, and research as a way to provide more effective scientific support to Everglades restoration. Development of ecological modeling tools that can simulate the effects of restoration on key components of the Everglades ecosystem, including alligators and their habitat, thus is of keen interest to natural resource managers, restoration, and conservation planners.
Purpose and objective
The purpose of this report is to describe an Alligator Produc-tion Suitability Index model that incorporates concepts from existing alligator habitat suitability models (TIEM 2003, Rice et al. 2004), the literature, and data that have been collected in the last decade. This model uses new information to modify, add, and combine components and parameters from existing models to estimate an alligator production suitability index that includes components for habitat assessment and qual-ity, breeding, courtship and mating, and nesting success (nest building and nest flooding). The focus is on factors that can affect how many young alligators hatch each year (produc-tion) with higher index scores reflecting better habitat condi-tions for hatchling production. Examination of individual components of the index during a year would provide insight to any limiting hydrological conditions that contribute to a poor overall index thus inhibiting hatchling production. This analysis can help in optimizing water management to stabilize and improve alligator populations.

2 South Florida Natural Resources center technical Series (2014:1)
This model can be used to evaluate the effects of alterna-tive Everglades restoration scenarios on habitat suitability for alligator production. This document describes the rationale and methodology used to develop the model and is intended to serve as a general reference document for users. Please refer to the User’s Guide (Pearlstine et al. 2012) available at http://www.simglades.org for detailed instructions on how to install and run the model.
Key objectives of this modeling project included the following:
● building off previous work, develop a spatially explicit alligator production suitability index model whose spatial domain includes the marshes within south Florida: the Water Conservation Areas (WCAs), Everglades National Park (ENP), and Big Cypress National Preserve (BCNP);
● develop the model in collaboration with other scien-tists and facilitate code sharing to encourage long-term improvements to, and use of, the model;
● develop a model that can be used to readily evalu-ate Everglades restoration scenarios from hydro-logic input provided by models such as the Regional Simulation Model (RSM) and the South Florida Water Management Model (SFWMM);
● develop a model that provides nesting and produc-tion suitability that can be used as input to the U.S. Geological Survey (USGS) alligator population model (APM)(Slone and Rice 2002); and
● develop a flexible modeling framework so that exist-ing model parameters can be readily modified and new model parameters can be incorporated.
Model Domain
The model domain is described by the domain of the input hydrologic file (see User’s Guide). Typically, the hydrologic inputs are from the SFWMM, RSM, or Everglades Depth Estimation Network (EDEN) and would include Arthur R. Marshall Loxahatchee National Wildlife Refuge (LNWR, which includes WCA 1), WCA 2, WCA 3, ENP, and wetlands of BCNP (Fig. 1).
Figure 1. the typical model domain is shaded and includes LnWr, WCa 2, WCa 3a and 3b, bCnP, and EnP.
MEthoDs anD ECoLogiCaL rationaLE
Existing alligator models (Newsom et al. 1987, TIEM 2003, Rice et al. 2004, Draugelis-Dale 2008) were reviewed to iden-tify which components and parameters were still valid and which could be updated with new knowledge or data layers (either alligator data or spatial land cover). In some cases parameters were included as described in previous docu-ments, in other cases where additional information made it possible, components or parameters were updated. From that review we developed and modified an annual alligator breed-ing cycle (Table 1) that defines the timing for each component index of the overall alligator production suitability index.
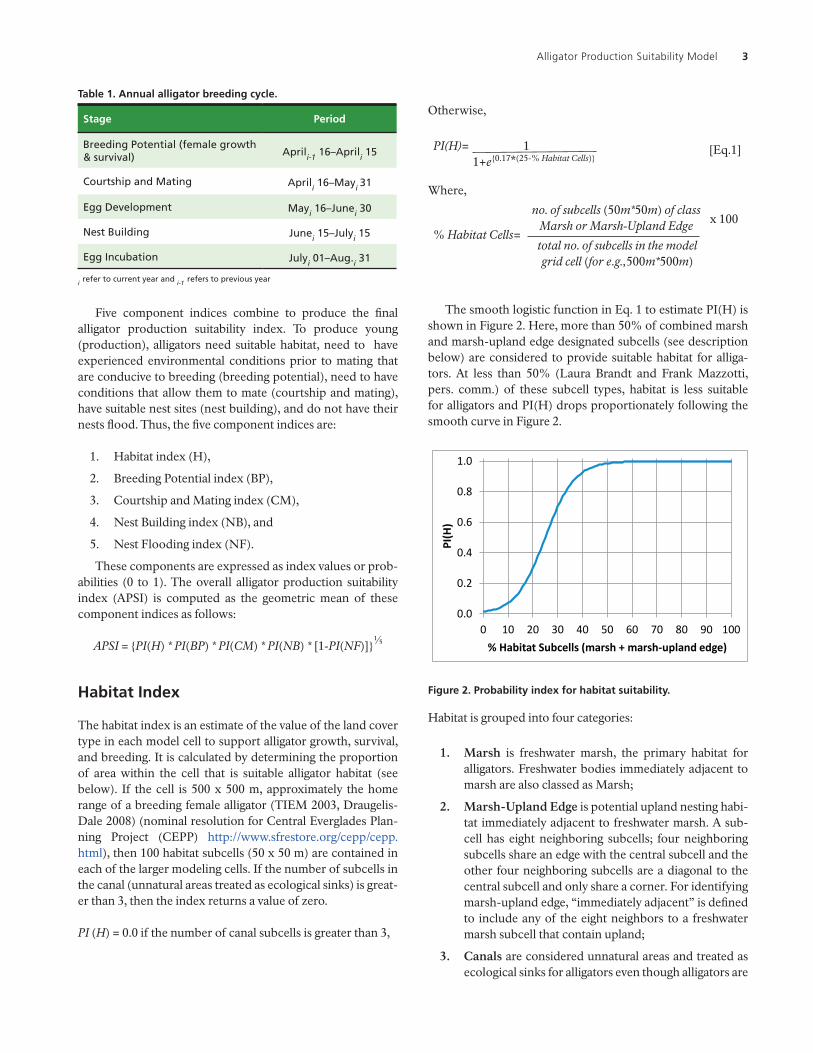
3alligator production Suitability Model
table 1. annual alligator breeding cycle.
stage Period
Breeding Potential (female growth& survival) Aprili-1 16–Aprili 15
Courtship and Mating Aprili 16–Mayi 31
Egg Development Mayi 16–Junei 30
Nest Building Junei 15–Julyi 15
Egg Incubation Julyi 01–Aug.i 31
i refer to current year and i-1 refers to previous year
Five component indices combine to produce the final alligator production suitability index. To produce young (production), alligators need suitable habitat, need to have experienced environmental conditions prior to mating that are conducive to breeding (breeding potential), need to have conditions that allow them to mate (courtship and mating), have suitable nest sites (nest building), and do not have their nests flood. Thus, the five component indices are:
1. Habitat index (H),
2. Breeding Potential index (BP),
3. Courtship and Mating index (CM),
4. Nest Building index (NB), and
5. Nest Flooding index (NF).
These components are expressed as index values or prob-abilities (0 to 1). The overall alligator production suitability index (APSI) is computed as the geometric mean of these component indices as follows:
APSI = {PI(H) * PI(BP) * PI(CM) * PI(NB) * [1-PI(NF)]}�
habitat index
The habitat index is an estimate of the value of the land cover type in each model cell to support alligator growth, survival, and breeding. It is calculated by determining the proportion of area within the cell that is suitable alligator habitat (see below). If the cell is 500 x 500 m, approximately the home range of a breeding female alligator (TIEM 2003, Draugelis-Dale 2008) (nominal resolution for Central Everglades Plan-ning Project (CEPP) http://www.sfrestore.org/cepp/cepp.html), then 100 habitat subcells (50 x 50 m) are contained in each of the larger modeling cells. If the number of subcells in the canal (unnatural areas treated as ecological sinks) is great-er than 3, then the index returns a value of zero.
PI (H) = 0.0 if the number of canal subcells is greater than 3,
Otherwise,
PI(H)= 1 1+e{0.17*(25-% Habitat Cells)}
[Eq.1]
Where,
% Habitat Cells=total no. of subcells in the model grid cell (for e.g.,500m*500m)
no. of subcells (50m*50m) of class Marsh or Marsh-Upland Edge
The smooth logistic function in Eq. 1 to estimate PI(H) is shown in Figure 2. Here, more than 50% of combined marsh and marsh-upland edge designated subcells (see description below) are considered to provide suitable habitat for alliga-tors. At less than 50% (Laura Brandt and Frank Mazzotti, pers. comm.) of these subcell types, habitat is less suitable for alligators and PI(H) drops proportionately following the smooth curve in Figure 2.
0.0
0.2
0.4
0.6
0.8
1.0
0 10 20 30 40 50 60 70 80 90 100
PI(H
)
% Habitat Subcells (marsh + marsh-upland edge)
Figure 2. Probability index for habitat suitability.
Habitat is grouped into four categories:
1. Marsh is freshwater marsh, the primary habitat for alligators. Freshwater bodies immediately adjacent to marsh are also classed as Marsh;
2. Marsh-Upland Edge is potential upland nesting habi-tat immediately adjacent to freshwater marsh. A sub-cell has eight neighboring subcells; four neighboring subcells share an edge with the central subcell and the other four neighboring subcells are a diagonal to the central subcell and only share a corner. For identifying marsh-upland edge, “immediately adjacent” is defined to include any of the eight neighbors to a freshwater marsh subcell that contain upland;
3. Canals are considered unnatural areas and treated as ecological sinks for alligators even though alligators are
x 100

4 South Florida Natural Resources center technical Series (2014:1)
found abundantly in canals adjoining marshes (Chopp 2003); and
4. Excluded are land cover classes that are not marsh, marsh-upland edge, or canal.
A crosswalk to the alligator habitat classes from one clas-sification scheme used in south Florida modeling (Pearlstine et al. 2011) is provided in Table 2. Canals were added to the land cover data layer by overlaying the canal features from the USGS National Hydrography Dataset. The table can be used as a guide for developing crosswalks from other schemes. The resulting habitat input layer is shown in Figure 3.
table 2. the habitat index crosswalk for land cover type of 50 X 50 m cell size (based on a combined rECoVEr–gaP map from ELVes model, Pearlstine et al. 2011). Habitat is classed as Marsh-Upland Edge only if cells are immediately adjacent or diagonal to a Marsh class cell. Otherwise it is classed as excluded.
Value Community habitat
0 Background Excluded
1 Florida Bay Excluded
2 Open Water Marsh unless Lake
3 Tropical Hardwood Hammocks Marsh-Upland Edge
4Temperate Hardwood Hammocks
Marsh-Upland Edge
5 Mixed Mangrove Forest Marsh-Upland Edge
6 Black Mangrove Forest Marsh-Upland Edge
7 Red Mangrove Forest Marsh-Upland Edge
8 Pine Forests Marsh-Upland Edge
9 Swamp Forest Marsh-Upland Edge
10 Cypress Forest Marsh-Upland Edge
11 Buttonwood Woodland Marsh-Upland Edge
12 Bayhead Shrublands Marsh-Upland Edge
13 Willow Shrublands Marsh-Upland Edge
14 Succulent Salt Marsh Excluded
15 Graminoid Freshwater Marsh Marsh
16 Sawgrass Marsh Marsh
17 Spikerush Marsh Marsh
18 Muhly Grass Marsh
19 Cattail Marsh
20 Graminoid Salt Water Marsh Excluded
21 Sand Cordgrass Grassland Excluded
22 Black Needle Rush Marsh Excluded
23Cypress Woodland Open Marsh
Marsh
24Fresh Water Marsh - Open Marsh
Marsh
25Herbaceous Fresh Water Marsh
Marsh
26 Beach Excluded
table 2 continued.
Value Community habitat
27Dry Prairie (Xeric - Mesic) Ecological Complex
Excluded
28 Floating Emergent Marsh Marsh
29 Swamp Scrub Sawgrass Marsh
30 Brazilian Pepper Excluded
31 Melaleuca Excluded
32 Human Impacted Excluded
34 Urban Excluded
35 Agriculture Excluded
36 Quarry Excluded
37 Fish Camp Excluded
39 Canals Canals
40 Spoils Excluded
41Common Reed - Giant Cut-grass
Excluded
42 Australian Pine Excluded
43 Exotics Excluded
44 Pump Station Excluded
45 Lygodium Excluded
46 Levee Excluded
47 Dune Graminoids Excluded
51 Roads – Pavement Excluded
52 Wild Taro Excluded
53 Recreation Area Excluded
60 Clouds Excluded
Estuarine Habitats and Salinity are considered in two indi-ces: the habitat index as shown in the habitat crosswalk (Table 2) and the nest building index, which is discussed below.
Alligators mostly avoid saline areas except during periods of freshwater flows when they can move into estuarine/fresh-water mixing zones for feeding (Craighead 1968). Alligators have a limited ability to tolerate exposure to salt water (Mazzotti and Dunson 1984, 1989) and most sightings of alliga-tors in saline water tend to be of subadult and adult animals in marine areas adjacent to or near freshwater sources (Birkhead and Bennett 1981, Jacobsen 1983, Tamarack 1989). Because reduced freshwater flows into the estuaries have resulted in salinization of the former freshwater mangrove zone, alligator occurrence may be limited to periods of freshwater discharge (Mazzotti 1983). Increasing flows to estuaries is an important objective of Everglades restoration; ultimately, conditions in estuaries should improve for alligators. Conversely, sea level rise may push the estuarine/freshwater mixing zone inland, reducing suitable alligator habitat. Modeling the effects of either of these is incorporated when appropriate salinity inputs are supplied to the model. The model defaults to there

5alligator production Suitability Model
being no influence from salinities when a temporal salinity layer is not provided.
breeding Potential index
The breeding potential index estimates the potential of alliga-tors within each grid cell to breed in the current year based on the hydrologic conditions (water depths) that existed preced-ing breeding (i.e., April 16 [previous year] – April 15 [current year], Table 1). The assumption is that water depths in the preceding year influence adult body condition, which influ-ences successful breeding (better body condition equals more successful breeding). Generally, in marshes, water depths >122 cm (4 ft) reduce food availability and may increase phys-iological stress. Higher water levels above a certain threshold value have been known to decrease body condition of all alli-gator size-classes (Dalrymple 1996a, Dalrymple 1996b, Barr 1997). In addition, water depths <15 cm (0.5 ft) limit the ability of alligators to move easily around the marsh (Frank Mazzotti and Laura Brandt, personal observation), decreasing access to both food and mates (Rice et al. 2004). This index accounts for the ability of alligators to disperse for mating, physiologi-cal stress associated with drought (body condition), and the prolonged follicular development in the adult female (Rice et al. 2004).
During the 12-month period from April 16 of the previ-ous year to April 15 of the current year, the total number of dry days (tdry) when water depth is below 15 cm (0.5 ft) are counted per cell. Similarly, days that are too wet (twet), when the food resources are unavailable to alligators, are counted as the number of days when water depth is above 122 cm (4 ft).
The probability for breeding potential, PI(BP), is comput-ed based on the joint proportion of too dry (<15 cm) and too wet (>122 cm) days (X1) over the period April 16 (previous year) to April 15 (current year) (total days, T = 365 or 366 in a leap year) (Fig. 4).
PI(BP) = 1 at X1 = 0.09 and PI(BP) = 0.0 at X1 = 0.29 corre-sponds to <=36 days and =>105 days (TIEM 2003), respec-tively, cumulating too dry and too wet days (Fig. 4). The range of this decreasing logistic function is based on physiology and breeding cycle using best professional judgment (Frank Mazzotti, personal observation).
For each cell in the study area:
Proportion of dry and wet days (X1) = (tdry + twet)/ T [Eq.2]
The potential for breeding, PI(BP), is approximated as a smooth logistic function, Eq. 3, as shown in Figure 4 between the upper (X1 = 0.09) and lower (X1 = 0.29) limits.
Figure 3. habitat types in the aPsi model. A: map of marsh, edge, and canals for the APSI model domain. B: close-up showing marsh-upland edge details for central section of the domain. The habitat map is at 50 m resolution. A 500 m overlain grid is shown to illustrate the modeling resolution and varying proportions of edge within the larger grid cells.

6 South Florida Natural Resources center technical Series (2014:1)
PI(BP)= 1 1+e{-40*(0.20-X1)}
[Eq.3]
0.0
0.2
0.4
0.6
0.8
1.0
0.10 0.13 0.16 0.19 0.22 0.25 0.28
PI(B
P)
X1, Proportion of wet + dry days
Figure 4. Probability index for breeding potential.
Courtship and Mating index
This component estimates the probability that a cell will support successful courtship and mating (breeding). Alliga-tors breed in relatively deep, open water, and suitability of an area as breeding habitat is influenced by the amount and type of open water. Throughout the alligator’s range, bayous, canals, and deeper water areas of lakes and ponds are the preferred areas for breeding (Newsom et al. 1987). In the Everglades, sloughs, alligator holes, and canals provide these deeper water areas. Deeper water is necessary because during mating, females must be mounted and forcefully submerged before they will engage in copulation (Fleming, 1990). Alli-gators move around to find mates and afterwards, mating females return to nesting areas within the marsh, and males eventually disperse to sites away from females and their young (Fleming 1990).
Rice et al. (2004) reported optimal depth for courtship and mating between 40 cm (1.3 ft) and 49 cm (1.6 ft) based on a regression analysis used to examine the relationship between nest estimates from systematic reconnaissance flights in ENP and water depth in Shark River Slough.
During peak courtship and mating season (April 16 – May 31), average water depth in each cell, X2, is computed. At the optimum depth value, X2 =>40 cm, the courtship and mating index reaches a maximum value of 1.0. At average water depth <15 cm (the water depth necessary for alligators to move easi-ly around in the marsh) (Frank Mazzotti and Laura Brandt, personal observation), the index reaches 0.
The probability index for courtship and mating PI(CM) for a cell, which does not have an alligator hole, is computed as smooth logistic function, Eq. 4, as shown in Figure 5.
PI(CM)= 1 1+e{0.35*(27.5-X2)}
[Eq.4]
Between depths of 15 and 40 cm, the presence of an alli-gator hole modifies this relationship. The presence of one or more alligator holes in a 500 x 500 m cell is considered to positively influence courtship and mating, shown in Eq. 5 and Figure 5, as alligator holes can provide the deep water neces-sary for mating. The amount of influence is unchanged when a cell contains more than one alligator hole because home range for a female alligator can be 50 –150 ha (Morea 1999).
PI(CMwith alligator hole present)= 11+e{0.35*(12.3-X2)}
[Eq.5]
0.0
0.2
0.4
0.6
0.8
1.0
0 10 20 30 40 50 60
PI(C
M)
X2, Average Water Depth, cm
Without alligator holesWith alligator holes
Figure 5. Probability index for courtship and mating with and without the presence of alligator holes.
Location of alligator holes in the model domain is shown in Figure 6. Location data are from Mazzotti et al. (2004) for LNWR, Mazzotti et al. (1999) for WCA 2, Campbell and Mazzotti (2004) for WCA 3, and Rice and Mazzotti (2006, 2007) for ENP. Locations of holes were simulated for BCNP as simple random distributions approximately matching WCA 3 densities above Tamiami Trail and approximately matching ENP densities below Tamiami Trail.
nest building index
In south Florida, alligators generally nest between June 15 and July 15. This is consistent with timing in other areas where it is estimated that 90% of nests are laid prior to the end of the first week of July (Joanen and McNease 1989). Exact timing can

7alligator production Suitability Model
.00
.01
.02
.03
.04
.05
.06
.07
0 5 10 15 20 25 30 35 40 45
Nest
Den
sity
Water Depth, cm
Figure 7. nest probability density in relation to water depth dur-
ing nest building period (June 15 – July 15) in EnP and LnWr.
The nest building probability curve with a μ = 24 cm, σ = 13 cm in Figure 8 was created by incorporating the data in Figure 7 along with expert input (Laura Brandt and Frank Mazzotti, pers. comm.). The PI(NB) estimates the probability of having a nest built in the cell based on water depth at the time of egg laying. During the nest building season (June 15 – July 15), average water depth, X3, in a cell is computed and, assuming the probability of nest building follows a scaled normal distri-bution, Eq. 6, PI(NB) is estimated based on the water depth X3 (Fig. 8).
-(X3-μ)2 ⁄ (2σ2 )
(2πσ2 )
(2πσ2 )*e1
1 *e -0 ⁄ (2σ2 )
PI(NB)= [Eq.6]
Where, μ=24 cm, σ =13 cm.
0.0
0.2
0.4
0.6
0.8
1.0
0 10 20 30 40 50 60
PI(N
B)
X3, Average Water Depth, cm
Figure 8. Probability index for nest building.
be affected by spring air temperature (Joanen and McNease 1989, Kushlan and Jacobsen 1990) but that is not consid-ered here. Here we focus on the effects of hydrology. Flem-ing (1990, 1991) reported that in high rainfall years with high surface water conditions, nest numbers declined rapidly in Shark Slough (ENP) when marsh water depths exceeded 45 cm during the peak nest construction period (mid-June/early July). Most nesting occurred in areas of shallower surface water conditions along the edges of the slough, and on higher elevated nest sites within central slough areas. During most years, the majority of nest locations were within close prox-imity of a pond (alligator hole), and in low rainfall years and low surface water conditions, virtually all nests were located adjacent to such ponds (Fleming 1990). Most alligator nests in ENP are marsh nests located in water less than 25 cm deep (Ogden 1976). In constructing nests, alligators need to locate them so that the eggs will be above the seasonal high water level, while remaining near enough to the water’s edge to prevent desiccation and providing suitable nursery habitat for young (Mazzotti and Brandt 1994).
Nesting pattern in relation to marsh water levels recorded before July 15 (to approximate water depth for nest building period, June 15 – July 15) during the first nest visit was exam-ined for a limited ENP dataset (1986; n=119, 1990; n=23) and LNWR dataset (1999; n=6, 2000; n=1). For this limited datas-et, Figure 7 shows the frequency distribution of nests between 0 and 45 cm of water depths. Most nest building appears to occur between 7.5 and 30 cm of water depths in the marsh.
Figure 6. Location of alligator holes in the model domain.

8 South Florida Natural Resources center technical Series (2014:1)
The presence of at least one alligator hole in a cell enhances the probability of nest building when water depths are below 24 cm. At low water levels, locations near alligator holes serve as suitable sites to build nests. Above 24 cm, nest building is enhanced if marsh-upland edge is present. Presence of marsh-upland edge such as tree islands in the cell provides for higher ground to build a nest in an area not as likely to flood but still close to water. The enhancements are achieved in the model by increasing σ, which has the effect of raising the curve and the resulting PI(NB) at any water depth (Fig. 9).
When alligator holes are present during low water condi-tions (<24 cm), σ in Eq. 6 is raised from 13 to 26 cm. When marsh-upland edge is present during high water conditions (>24 cm), the influence on σ in Eq. 6 depends upon the amount of edge in the modeling cell. Marsh-upland edge is considered to reach a maximum influence on nesting at 20% edge and drops off as the density of edge exceeds 50% (Laura Brandt and Frank Mazzotti, pers. comm.) of the modeling cell (Eq. 7 and Fig. 9).
0.0
0.2
0.4
0.6
0.8
1.0
0 10 20 30 40 50 60 70 80 90 100
PI(N
B)
X3, Average Water Depth, cm
Figure 9. Probability index for nest building showing the influ-ence of alligator holes and marsh-upland edge.
The enhancement factor (Emod), applied to σ in Eq. 6 when marsh-upland edge is present, is estimated in the form of scaled normal distribution as
-(% marsh-upland edge-μ)2 ⁄ (2σ2 )
(2πσ2 )
(2πσ2 )*e1
1 *e -0 ⁄ (2σ2 )
Emod= [Eq.7]
where:
for % marsh-upland edge <20, μ = 20 and σ = 9;
for % marsh-upland edge ≥20 & ≤50, Emod = 1.0;
for % marsh-upland edge >50, μ = 50 and σ = 15.
When marsh upland edge is present in a cell, the σ in Eq. 6 for estimation of PI(NB) is scaled from 13 to 26 cm [σ = 13 + (13 * Emod)] as shown in Figure 10. At the maximum influ-ence of edge (20 – 50% edge), Emod will equal one and σ will reach the maximum value of 26 cm in Eq. 6.
0.0
0.2
0.4
0.6
0.8
1.0
0 10 20 30 40 50 60 70 80 90 100
Emod
Percent Edge
Figure 10. Enhancement factor applied to σ in Eq. 6 for estimat-ing Pi(nb) when marsh-upland edge is present.
PI(NB) is also affected by salinity. Estuarine habitat reduces the nest building effort. Limited alligator nesting occurs where water salinity exceeds 10–12 ppt sea water (McNease and Joanen 1978, Wilkinson 1983). Despite better feeding opportunities that may exist in freshwater and estua-rine mixing zones that may improve alligator body condition and thus breeding potential, higher salinity may prevent nest building efforts in these zones due to reduced quality as nurs-ery habitat.
The influence of salinity (Fig. 11) on PI(NB) is modeled as
PI(NB)= PI(NB)*Smod, where Smod= 11+e{-0.9*(5-Salt)}
[Eq.8]
Salinities are input to this model from the USGS TIME/BISECT hydrologic model for the domain south of Tamiami Trail (USGS 2011). In absence of a salinity value, such as for modeled cells north of Tamiami Trail, Smod defaults to 1.
0.0
0.2
0.4
0.6
0.8
1.0
0 2 4 6 8 10
Smod
Salt (ppt)
Figure 11. salinity influence parameter in Eq.8 as a function of salt concentration.

9alligator production Suitability Model
in Vivo Egg Development
The interval between insemination and egg laying has been reported as three to four weeks (Joanen and McNease 1975, 1979, 1980, Lance et al. 1983), but varies widely among croco-dilian species (Ferguson 1985). The period of May 16 – June 30 (Table 1), has not been defined in other alligator models. It is defined here as “Egg Development” period, but no prob-ability index is assessed during this period.
nest Flooding index
The nest flooding component takes into account the elevation of the clutch above the average water depth during nest building (June 15 – July 15) and the change in water depth over the incubation period (July 1 – August 31). Clutch elevation is known to be influenced by water levels at the time of nest building, with higher water levels resulting in higher clutch elevations. The bottom of a clutch can range from about 15 to 30 cm above the water surface, depending on whether or not the nest is built on an elevated area such as a tree island (unpublished data for WCA 2 and 3 cited in Rice et al. 2004, ENP in Kushlan and Jacobsen 1990, and Brandt and Mazzotti 2000).
For this model, a value of 25 cm was taken to be the mean clutch elevation above the average water surface during peri-od of nest building (June 15 – July 15). Kushlan and Jacobsen (1990) reported that eggs within a clutch form layers that total 16.9 ± 4.9 cm in height (N =181); therefore, we added 17 cm to the mean clutch elevation (25 cm) to estimate the mean clutch top elevation (42 cm)(Fig. 12). A nest was assumed flooded when the water level during incubation period exceeded the top of the clutch (42 cm).
Tree islands provide elevated sites for nest building that have a lower probability of nest flooding. In LNWR, fewer
instances of nest flooding were observed in the interior of the slough where nests were primarily (95%) built on tree islands compared to areas in the southern part of the refuge and adja-cent to canals where nests were not built on tree islands and experienced rapid and extreme changes in water level during incubation period (Brandt 2005, Chopp 2003).
The influence of tree islands in reducing the possibility of nest flooding is included in this model first by determining if there is a “tree island” in the cell by checking for the presence of Marsh-Upland Edge. If present, the average height of tree islands in that region is added to the clutch elevation (Fig. 12) prior to determining if the water level exceeds the flooding threshold (top of the clutch).
Presence of Marsh-Upland Edge was used as an indicator of a tree island in a cell. If at least 1% of the cell was Marsh-Upland Edge and average water depth during the nest build-ing period was less than the average tree island height, then:
mean clutch top elevation (m) = 42 cm + average tree island elevation. [Eq. 9]Otherwise:mean clutch top elevation (m) = 42 cm + nest building period water depth; and [Eq. 10] clutch standard deviation (σx) = nest building period water depth standard deviation [Eq. 11]
Regions have been selected for this model as an aggregate of physiographic regions and compartment boundaries. Each region is assigned a single average tree island height (Fig. 13 and Table 3). LNWR average tree island height above the marsh surface is from Brandt et al. (2006). For WCA 3, aver-age tree island height is derived from maximum height above adjacent sloughs and average tree island profiles reported by Heisler et al. (2002, Table 9-1 and Fig. 9-6). To convert from average height above the ground surface of adjacent sloughs
25 cm42 cm42 cm
25 cm
Max waterlevel duringegg incubation(July 1 – Aug 31)
Grid Cellwith edge
Grid Cellwith no edge
Mean waterlevel duringegg incubation(June 15 – July 15)
Regional meantree islandelevation above marsh surface
Ground level
Figure 12. Depiction of estimation of the clutch-top elevation. Elevation of the top of the clutch is estimated from the average tree island elevation when Marsh-Upland Edge is present or from average water level during the nest building period if Marsh-Upland Edge is not present or if the average water level during nest building is higher than the average tree island elevation.

10 South Florida Natural Resources center technical Series (2014:1)
to average height above adjacent marsh surface, 20 cm was taken to be the average difference between slough and marsh elevation (McVoy et al. 2011, p. 252). WCA 3A (zones 5 and 6) were calculated separately from WCA 3B (zone 7). Average tree island heights in ENP were taken from Ruiz et al. (2011). Because of the lack of published information, WCA 2 and BCNP heights are currently set equal to WCA 3A heights. Average tree island heights are substantially higher in ENP ridge and slough regions (93 cm) than in LNWR (39 cm), WCA 3 (WCA 3A = 48 cm and WCA 3B = 64 cm), or ENP wet prairie (53 cm).
Figure 13. Zones used for providing the aPsi model with average tree island heights.
table 3. Values used for average tree island heights above the marsh surface in each zone (Fig. 13). [Although the tree island zones input layer allows for generalized physiographic zones within each compartment, this iteration of the model gives most zones in a compartment the same value. Zones 11 and 13 have different values than the remainder of ENP because these zones are marl prairie. Zone 7 has a different value than zones 5 and 6 (WCA 3A) because it represents WCA 3B.]
ZonE tree island average height (cm)
LNWR
1 39
2 39
WCA 2
3 48
4 48
WCA 3A
table 3 continued.
ZonE tree island average height (cm)
5 48
6 48
WCA 3B
7 64
BCNP
8 48
9 48
ENP
10 93
11 53
12 93
13 53
14 93
15 93
16 93
17 93
18 93
An approach based on Kushlan and Jacobsen (1990) is adapted here for estimating nest flooding probability, PI(NF). They observed the frequency distribution of standardized nest heights to be normally distributed (Eq. 12) and concluded that the relationship between nest flooding and water depth could be described by a sigmoid curve with asymptotes at high and low nest elevations. The cumulative normal distribu-tion of clutch top elevations provides the sigmoid model (Fig. 14). Nest flooding probability, PI(NF), is estimated (Eq. 13) from the cumulative frequency curve as the area lying left of the highest water level (shaded area as an example in Fig. 14) that is reached during the incubation period (July 1 – August 31).
0.0
0.2
0.4
0.6
0.8
1.0
.00
.01
.02
.03
0 20 40 60 80 100
PI(N
F)
Freq
uenc
y
m, Mean Clutch Height, cm
71.40 %
A
Figure 14. Clutch height distribution and nest flooding prob-ability. The blue line is the normal distribution of clutch top el-evations, the red line is the cumulative frequency curve, and the dashed line A is the maximum water depth during incubation period.

11alligator production Suitability Model
The clutch top elevation for each cell is assumed to follow a normal distribution (represented with mean = m, Eq. 9 and 10, and standard deviation = σx, Eq. 11) that can be described as (Kushlan and Jacobsen 1990):
(2σx2π )
e1f (X) =
(x-m)2
(2σx2 )
-[Eq.12]
The nest flooding probability, PI(NF), is estimated from the cumulative distribution function using the maximum water depth (y, point “A” in Fig. 14) during the incubation period for each cell as (an example in Fig. 14):
PI (NF) = F(y) = ʃ yo f (x).dx [Eq.13]
where, y = maximum water depth during incubation, July 1– Aug. 31.
Subsequently,
The probability of nests not flooding = 1- PI(NF) [Eq.14]
alligator Production suitability index
Habitat suitability indices are often computed by any combi-nation of factors into a single component or index, such as the geometric mean, arithmetic mean, or the minimum of several factors (Draugelis-Dale 2008). The method of choice depends on the desired magnitude of importance for the factor. The minimum function (out of several factors) represents the strongest argument by eliminating influences of all higher-valued factors. This is followed by the geometric mean that combines all factors but can be readily reduced to zero suit-ability for any one nonsuitable factor of zero (“all or none”), and then the arithmetic averaging that balances all factors and maintains a nonzero result if not all zero (Draugelis-Dale 2008).
For the overall APSI, we consider all the component indi-ces of alligator breeding cycle including habitat as critical (“all or none”, if one component is zero, the suitability is zero) and so the APSI is computed as a geometric mean of all the indi-vidual components. Further, all components are considered to have equal weight.
APSI = {PI(H)*PI(BP)*PI(CM)*PI(NB)*[1-PI(NF)]}� [Eq.15]
statE VariabLEs anD MoDEL ProCEss
Input variables are described below. Although water depth and salinity change values temporally, none of the variables change their value as a result of a previous model state.
All the component indices are evaluated for a unit model-ing cell of the spatial grid unless noted otherwise. The size of the modeling cell can vary with the resolution of hydrologic data. For CEPP evaluations, the modeling cell is typically at 500 x 500 m resolution from interpolation of RSM hydro-logic model output. 500 x 500 m resolution modeling cells are also commonly used and are required when the output of the APSI is used as input to the USGS alligator growth and population model (Slone and Rice 2002). EDEN hydrologic products (http://sofia.usgs.gov/eden/index.php) are 400 x 400 m resolution; however, the APSI can use EDEN as input and produce standard 500 m resolution output. The model process steps for each model run are presented in Figure 15.
The output indices vary between 0 and 1. The model output for these indices is shown in Figure 16.
inputs
A number of input files are needed to generate model results. These inputs are listed and generically described in Table 4. More details about the input files are provided in the User’s Guide. The Input column contains the name of the input to be used. The File Type column denotes the format of the input file. For this model, the input file is either CERP-compliant NetCDF or an ASCII text file. The CERP-compliant NetCDF standard is available online at http://www.jem.gov/Standards. The Time Resolution column describes the generalized time resolution of the input; in this case, the input (time step) has values that change along some regular time interval (for example, daily, weekly, monthly, etc.), and static means that the input has a single set value that does not change. The Units column describes the meaning of the values in the input; for example, a water depth value of 500 millimeters (mm) would mean that the water was 500 mm deep in that location.
All inputs must have data whose values are in the units denoted in the Units column for the formulation of the model contained in this document to be directly implementable as it exists. Map coordinates of all the input files must be in the same UTM projection and datum.
Because continuous salinity inputs currently have a small-er spatial and temporal extent than water depth inputs, it is important for the user to understand how the model behaves when the modeled cells are outside of the salinity extent.

12 South Florida Natural Resources center technical Series (2014:1)
Figure 15. Elements of the aPsi modeling process. 26
Process
Model Variables
Legend Read & count: number of alligator holes in each modeled grid cell
Alligator Holes
Read: average tree island ground height & tree island zones. Create
table of heights by zone.
Tree Island Heights Tree Island Zones
Read & count: the number of habitat cells within each larger modeled cell. Evaluate the proportion of habitat area
(Habitat Index) & the percent edge habitat (Edge Index)
Habitat
Perform once; these results are static for all years of the simulation:
Time variant processing. For each year in the simulation and for each grid cell:
Read: daily water depth values. Below ground water depths (depths <0) are set to zero
Daily Water Depths
Read: daily salinity values.
Salinity
During Breeding Potential time period:
Calculate Wet‐Dry Index & Breeding Potential Index
Daily Water Depths
During Nest Flooding time period:
Calculate Maximum Water Depth & Nest Flooding Index
Daily Water Depths, Mean Clutch Height, Standard Deviation of Nest Building Water Depth
During Nest Building time period:
Calculate Mean Water Depth, Mean Clutch Height, Standard Deviation Water Depth, & Nest
Building Index
Daily Water Depths, Salinity Tree Island Table, Edge Index
During Courtship & Mating time period:
Calculate Mean Water Depth, Alligator Holes Index, & Courtship
& Mating Index
Daily Water Depths Number of Alligator Holes
Alligator Production Suitability Index
Habitat Index, Breeding Potential Index, Courtship & Mating Index, Nest Building Index, Nest Flooding Index
Figure 15. Elements of the APSI modeling process.
5
4
32 1
3
21
7
6

13alligator production Suitability Model
Figure 16. Example output of indices from the aPsi model for one year. the color scale ranges from low probabilities in orange to high probabilities in green. This example is from the RSM ECB (existing conditions baseline) alternative for 2003; however, there is substantial variation in the results among years and hydrologic alternatives.
input File typetime
resolutionunits Description
Water Depths NetCDF Daily mmRaster temporal data of daily water depths. Typically at 400 x 400 or 500 x 500 m resolution.
Salinity NetCDF Daily pptRaster temporal data of daily surface water salinities. Typi-cally at 400 x 400 or 500 x 500 m resolution.
Habitat NetCDF Static categoricalRaster static data of habitat and canals. Typically at 50 x 50 m resolution.
Tree Island Zones NetCDF Static categoricalRaster layer of tree islands zones. Typically at 400 x 400 or 500 x 500 m resolution.
Tree Island Heights Text (csv) Static mmTable of mean tree island ground heights above the marsh surface for each zone in the Tree Island Zones raster layer.
Alligator Holes Text (csv) Static naUTM coordinate location of alligator holes within the model’s domain.
Parameters Text (xml) na naContains the path and filenames of input and output files and all the user-modifiable parameters used in the simula-tion.
table 4. inputs needed to generate aPsi model results.
habitat breeding Potential Courtship & Mating
nest building nest Flooding alligator Production
14 South Florida Natural Resources center technical Series (2014:1)
Spatial Salinity Extent
When a grid cell is outside of the spatial extent of the salinity input layer, salinity is set to 0.0. This is realistic for our current modeling because salinity is usually an input from the BISECT model which covers the coastal areas of south Florida. The northern boundary of BISECT is Tamiami Trail. Since none of the current hydrologic models that extend farther north into the Everglades are computationally able to handle a sea level rise of greater than 1.5 feet above exist-ing conditions, salinities will not extend farther north than Tamiami Trail under any model scenarios that include the central and northern Everglades.
Temporal Salinity Extent
When model runs begin before salinity inputs are avail-able, salinities are set to 0.0. When model runs continue in time beyond available salinity inputs, salinities are maintained at the last available values. For most situations, it is preferred that model runs not extend beyond the temporal availabil-ity of salinity inputs if the user is concerned about alligator response in locations that are affected by salinity. The APSI does not prevent model runs from extending beyond the temporal domain of the salinity layer, however, because model runs over the longer period of water depth availability can aid management decisions in the majority of the modeled Everglades area that is not affected by salinities. It is incum-bent on the user to consider this limitation in evaluations and documentation of results.
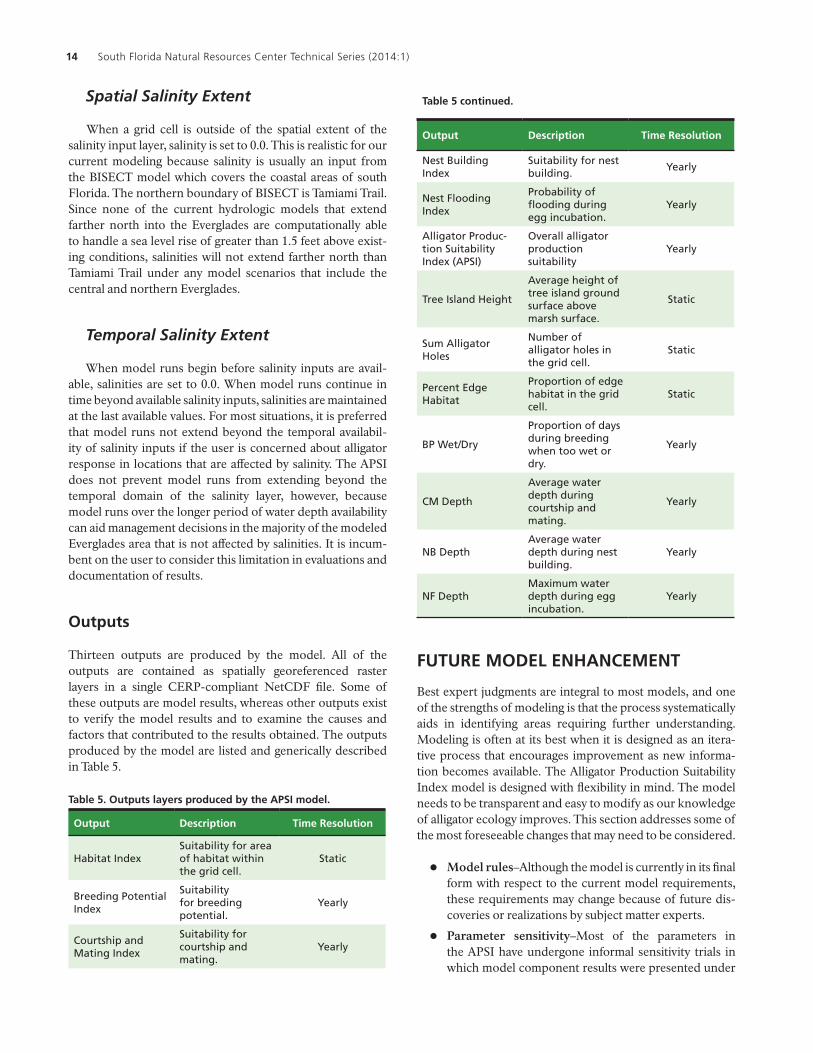
outputs
Thirteen outputs are produced by the model. All of the outputs are contained as spatially georeferenced raster layers in a single CERP-compliant NetCDF file. Some of these outputs are model results, whereas other outputs exist to verify the model results and to examine the causes and factors that contributed to the results obtained. The outputs produced by the model are listed and generically described in Table 5.
table 5. outputs layers produced by the aPsi model.
output Description time resolution
Habitat Index Suitability for area of habitat within the grid cell.
Static
Breeding Potential Index
Suitability for breeding potential.
Yearly
Courtship and Mating Index
Suitability for courtship and mating.
Yearly
table 5 continued.
output Description time resolution
Nest Building Index
Suitability for nest building.
Yearly
Nest Flooding Index
Probability of flooding during egg incubation.
Yearly
Alligator Produc-tion Suitability Index (APSI)
Overall alligator production suitability
Yearly
Tree Island Height
Average height of tree island ground surface above marsh surface.
Static
Sum Alligator Holes
Number of alligator holes in the grid cell.
Static
Percent Edge Habitat
Proportion of edge habitat in the grid cell.
Static
BP Wet/Dry
Proportion of days during breeding when too wet or dry.
Yearly
CM Depth
Average water depth during courtship and mating.
Yearly
NB DepthAverage water depth during nest building.
Yearly
NF DepthMaximum water depth during egg incubation.
Yearly
FuturE MoDEL EnhanCEMEnt
Best expert judgments are integral to most models, and one of the strengths of modeling is that the process systematically aids in identifying areas requiring further understanding. Modeling is often at its best when it is designed as an itera-tive process that encourages improvement as new informa-tion becomes available. The Alligator Production Suitability Index model is designed with flexibility in mind. The model needs to be transparent and easy to modify as our knowledge of alligator ecology improves. This section addresses some of the most foreseeable changes that may need to be considered.
z Model rules–Although the model is currently in its final form with respect to the current model requirements, these requirements may change because of future dis-coveries or realizations by subject matter experts.
z Parameter sensitivity–Most of the parameters in the APSI have undergone informal sensitivity trials in which model component results were presented under

15alligator production Suitability Model
Water Depth (W
D), cm
010
2030
40Suitability Index (SI)
0.20.4
0.60.8
P(W
D, SI)
0.00.20.4
0.6
0.8
1.0
varying parameterization in workshop settings during model development; however, we have not conducted formal analyses of sensitivity and contribution of the parameters to the final scoring.
z Alligator holes–Information on alligator hole depth distribution can be incorporated to provide better esti-mates of Courtship and Mating index when water level goes below ground. The current version only uses pres-ence of holes. Because courtship and mating occurs late in the dry season (April and May), low marsh water lev-els may make water depths within the holes an impor-tant consideration.
A substantial alligator hole mapping effort (Mazzotti et al. 1999, Campbell and Mazzotti 2004, Mazzotti et al. 2004, Rice and Mazzotti 2006, 2007) has concluded that accuracies vary by physiographic habitat type but are often low overall with omission error (alligator holes that were not mapped) generally much higher than commission error (incorrectly mapped alligator holes). ENP had some of the highest recorded omission errors (>70%, Rice and Mazzotti 2006, 2007), and LNWR had commission errors varying from 33 to 49% (Mazzotti et al. 2004). There is a clear need for these efforts to continue examining detection probabilities and work-ing with additional sources of remote sensed imagery for finer resolution and acquisition during the dry season. Sensitivity runs and observations to clarify the incremental benefit of additional holes within a female alligator’s dispersal range would reveal whether relative densities are adequate for the APSI or whether more detailed mapping is necessary. Simulated distributions informed from fine-scale sampling among physiograph-ic regions may be another option.
z Marsh upland edge–Alligator nesting response to di-verse proportions of marsh-upland edge needs further investigation.
z Nest and clutch heights and water depth–Limited data (see section nest building index for details) were used by approximation for the nest building index. Sen-sitivity analyses will reveal whether a more robust index can be estimated as more data are collected in different regions.
z Tree island–Information on tree island mapping and their height distribution in different regions can be bet-ter incorporated to provide improved estimates for Nest Building and Nest Flooding indexes.
z Salinity and the breeding potential index–Proximity to estuarine habitat may improve feeding opportunities and thus have positive influence on the body condition of alligators.
z Temperature–Alligators nest earlier following warm-er springs and delay nesting following colder springs (Joanen and McNease 1989, Kushlan and Jacobsen 1990). Effect of temperature on nesting will be an op-tion to include as more data become available, and this will improve the APSI as a tool for modeling responses to climate change.
z Uncertainty analyses–Bayesian approaches are cur-rently under consideration for a future version of the APSI that will incorporate the reporting of uncertainty and the capacity for learning into the model (Fig. 17).
Figure 17. a: Deterministic response of Courtship and Mating (CM) index to water depth (in the absence of alligator holes). b: an example of a potential distribution of CM index response to water depth.
0.0
0.2
0.4
0.6
0.8
1.0
0 10 20 30 40 50 60
PI(C
M)
Water Depth (cm) a b

16 South Florida Natural Resources center technical Series (2014:1)
suMMary anD ConCLusions
The Alligator Production Suitability Index model allows users to evaluate the potential response of this keystone species to changes in hydrology that are proposed as part of the Great-er Everglades restoration process. The APSI models habitat, breeding potential, courtship and mating potential, nesting potential, and nest flooding potential as discrete compo-nents and aggregates them into an overall production suit-ability score. The individual components and overall score are output as spatially explicit, geo-referenced data layers with an annual time interval. The outputs allow considerable flexibil-ity to the user for evaluations of changes in spatial and tempo-ral distributions as well as post-modeling spatial and temporal aggregations of scores. Because each of the component scores is retained as a discrete output, the user is able to review the overall production suitability score in relation to the individ-ual responses of the components when there are questions about the primary drivers for specific overall scores. APSI’s modular and object-oriented structure was designed from its inception with the intent that the code will be accessible for iterative implementation of improved parameters that will be derived from new knowledge. As a result we believe the APSI is a robust tool from both the resource manager’s and devel-oper’s perspective and we encourage the user to think of APSI as a living model that can be further enhanced over time.
LitEraturE CitED
Barr, B. 1997. Food habits of the American alligator, Alligator missis-
sippiensis, in the southern Everglades. Dissertation. University of Miami, Miami, Florida. 243 pp.
Birkhead, W.S., and C.R. Bennett. 1981. Observations of a small pop-ulation of estuarine inhabiting alligators near Southport, North Carolina. Brimleyana 6:111–117.
Brandt, L.A. 2005. Relative density of alligator nests in the Arthur R. Marshall Loxahatchee National Wildlife Refuge 2000–2004. Unpublished report, September 2005.
Brandt, L.A., G.A. Martin, and F.J. Mazzotti. 2006. Topography of pop-up bayhead tree islands in Arthur R. Marshall Loxahatchee National Wildlife Refuge. Florida Scientist 69(1):19–35.
Brandt, L.A., and F.J. Mazzotti. 2000. Nesting of the American alligator (Alligator mississippiensis) in the Arthur R. Marshall Loxahatchee National Wildlife Refuge. Florida Field Naturalist 28(3):122–126.
Campbell, M.R., and F.J. Mazzotti. 2004. Characterization of natural and artificial alligator holes. Southeastern Naturalist 3(4):583–594.
Chopp, M.D. 2003. Everglades alligator (Alligator mississippiensis) production and natural history in interior and canal habitats at Arthur R. Marshall Loxahatchee National Wildlife Refuge. Thesis. University of Florida, Gainesville, Florida.
Craighead, F.C. 1968. The role of the alligator in shaping plant com-munities and maintaining wildlife in the southern Everglades. Florida Naturalist 41:2–7, 69–74, 94.
Craighead, F.C. 1971. The trees of south Florida. Vol. 1. University of Miami Press, Coral Gables, Florida, 212 pp.
Dalrymple, G.H. 1996a. Growth of American alligators in the Shark Valley region of Everglades National Park. Copeia 1996(1):212–216.
Dalrymple, G.H. 1996b. The effect of prolonged high water levels in 1995 on the American alligator in the Shark Valley area of Everglades National Park. Pages 125–136 in Proceedings of the Conference on Ecological Assessment of the 1994–1995 High Water Conditions in the Southern Everglades. National Park Service, South Florida Natural Research Center, Homestead, Florida.
Deitz, D.C., and D.R. Jackson. 1979. Use of American alligator nests by nesting turtles. Journal of Herpetology 13:510–512.
Draugelis-Dale, R. 2008. Assessment of effectiveness and limita-tions of habitat suitability models for wetland restoration: U.S. Geological Survey Open-File Report 2007–1254, 136 p.
Ferguson, M.W.J. 1985. Reproductive biology and embryology of the crocodilians. Pages 329–491 in Biology of the Reptilia, Vol. 14. C. Gans, F.S. Billet, and P.F.A. Maderson, editors. John Wiley and Sons, New York.
Fleming, D.M. 1990. American alligator distribution and abundance in relation to landscape pattern and temporal characteristics of the Everglades. National Park Service, Everglades National Park, South Florida Research Center Unpublished Report, Homestead, Florida.
Fleming, D.M. 1991. Wildlife ecology studies. An Annual Report. National Park Service, Everglades National Park, South Florida Research Center Unpublished Report, Homestead, Florida.
Fujisaki, I., F.J. Mazzotti, R.M. Dorazio, K.G. Rice, M. Cherkiss, and B. Jeffery. 2011. Estimating trends in alligator populations from nightlight survey data. Wetlands 31:147–155.
Fujisaki, I., F.J. Mazzotti, K.M. Hart, K.G. Rice, D. Ogurcak, M. Rochford, B.M. Jeffery, L.A. Brandt, and M.S. Cherkiss. 2012. Use of alligator hole abundance and occupancy rate as indicators for restoration of a human-altered wetland. Ecological Indicators 23:627–633.
Hall, P.M., and A.J. Meier. 1993. Reproduction and behavior of west-ern mud snakes (Farancia abacura reinwardtii) in American al-ligator nests. Copeia 1993(1):219–222.
Heisler, L., D.T. Towle, L.A. Brandt, and R.T. Pace. 2002. Tree island vegetation and water management in the central Everglades. Pages 283–309 in F.H. Sklar, and A. van der Valk, editors. Tree islands of the Everglades. Kluwer Academic Press, Boston, Massachusetts.
Jacobsen, T. 1983. Crocodilians and islands: Status of the American alligator and the American crocodile in the lower Florida Keys. Florida Field Naturalist 11:1–24.
Joanen, T., and L. McNease. 1975. Notes on the reproductive biology and captive propagation of the American alligator. Proceedings of the Southeastern Association of Game and Fish Commissioners 29:407–415.
Joanen, T., and L. McNease. 1979. Time of egg deposition for the American alligator. Proceedings of the Southeastern Association of Fish and Wildlife Agencies 33:15–19.
Joanen, T., and L. McNease. 1980. Reproductive biology of the American alligator in southwest Louisiana. Society for the Study

17alligator production Suitability Model
of Amphibians and Reptiles, Contributions to Herpetology 1:153–159.
Joanen, T., and L. McNease. 1989. Ecology and physiology of nest-ing and early development of the American alligator. American Zoologist 29(3):987–998.
Kushlan, J.A. 1974. Observations on the role of the American alliga-tor (Alligator mississippiensis) in the southern Florida wetlands. Copeia 1974:993–996.
Kushlan, J.A. 1990. Wetlands and wildlife, the Everglades perspec-tive in freshwater wetlands and wildlife. In R.R. Sharitz and J.W. Gibbons, editors. CONF-8603101, DOE Symposium Series No. 61. U.S. Department of Energy, Office of Scientific and Technical Information, Oak Ridge, Tennessee.
Kushlan, J.A., and T. Jacobsen. 1990. Environmental variability and the reproductive success of Everglades alligators. Journal of Herpetology 24(2):176–184.
Kushlan, J.A., and M.S. Kushlan. 1980. Everglades alligator nests: Nesting sites for marsh reptiles. Copeia 1980:930–932.
Lance, V., T. Joanen, and L. McNease. 1983. Selenium, vitamin E and trace elements in the plasma of wild and farm-reared alligators during the reproductive cycle. Canadian Journal of Zoology, Vol. 61 (8). 1744-1751.
Loftus, W.F., and A.M. Eklund. 1994. Long-term dynamics of an Everglades fish community. Pages 461–483 in S.M. Davis and J.C. Ogden, editors. Everglades: The ecosystem and its restoration. St. Lucie Press, Delray Beach, Florida.
Mazzotti, F.J. 1983. The ecology of Crocodylus acutus in Florida. Dissertation. Pennsylvania State University, University Park Pennsylvania, 161 pp.
Mazzotti, F.J., G.R. Best, L.A. Brandt, M.S. Cherkiss, B.M. Jeffery, and K.G. Rice. 2009. Alligators and crocodiles as indicators for restoration of Everglades ecosystems. Ecological Indicators 9S:S137–S149.
Mazzotti, F.J., and L.A. Brandt. 1994. Ecology of the American alli-gator in a seasonally fluctuating environment. Pages 485–505 in S.M. Davis and J. Ogden, editors. Everglades: The ecosystem and its restoration. St. Lucie Press, Delray Beach, Florida.
Mazzotti, F.J., L.A. Brandt, M.R. Campbell, and M. Palmer. 1999. An ecological characterization of Everglades alligator holes. Final Report. Unpublished report submitted to Everglades Agricultural Area Environmental Protection District and National Fish and Wildlife Foundation.
Mazzotti, F.J., L.A. Brandt, P. Moler, and M.S. Cherkiss. 2007. The American crocodile (Crocodylus acutus) in Florida: Recommendations for endangered species recovery and ecosys-tem restoration. Journal of Herpetology 41(1):122–132.
Mazzotti, F.J., L.A. Brandt, K.G. Rice, R.R. Borkhataria, G. Martin, and K. Minkowski. 2004. Ecological characterization of aquatic refugia in the Arthur R. Marshall Loxahatchee National Wildlife Refuge. Unpublished report submitted to National Park Service, South Florida Natural Resources Center, Critical Ecosystems Studies Initiative, Homestead, Florida.
Mazzotti, F.J., M.S. Cherkiss, and A.M. Weinstein. 2003. Compilation of American alligator data sets in south Florida for restoration needs. Final Report, Volume I. Ft. Lauderdale Research and Education Center, University of Florida. Unpublished report
submitted to U.S. Geological Survey Restoration Ecology Branch, Florida Caribbean Science Center, Fort Lauderdale Field Station, Davie, Florida.
Mazzotti, F.J., and W.A. Dunson. 1984. Adaptations of Crocodylus
acutus and Alligator mississippiensis for life in saline water. Comparative Biochemistry and Physiology 79(4):641–646.
Mazzotti, F.J., and W.A. Dunson. 1989. Osmoregulation in crocodil-ians. American Zoologist 29:903–920.
McNease, L., and T. Joanen. 1978. Distribution and relative abun-dance of the alligator in Louisiana coastal marshes. Proceedings of the Southeastern Association of Fish and Wildlife Agencies 32:182–186.
McVoy, C.W., W.P. Said, J. Obeysekera, J.A. VanArman, and T.W. Deschel. 2011. Landscape and hydrology of the predrainage Everglades. University Press of Florida, Gainesville, Florida. 342 pp.
Morea, C.R. 1999. Home range, movement, and habitat use of the American alligator in the Everglades. Thesis. University of Florida, Gainesville, Florida.
Newsom, J.D., T. Joanen, and R. Howard. 1987. Habitat suitability index models: American alligator. U.S. Fish and Wildlife Service Biological Report 82(10.136). 14 pp.
Ogden, J.C. 1976. Crocodilian ecology in southern Florida. In National Park Service. Research in the Parks: Transactions of the National Park Centennial Symposium, 1971. Symposium Series No. 1. U.S. Department of the Interior, National Park Service, Washington, D.C.
Ogden, J.C., and S.M. Davis. 1999. The use of conceptual ecological landscape models as planning tools for the south Florida ecosys-tems restoration programs. Unpublished report. South Florida Water Management District. West Palm Beach, Florida.
Ogden, J.C., S.M. Davis, and L.A. Brandt. 2003. Science strategy for a regional ecosystem monitoring and assessment program: The Florida Everglades example. Pages 135–163 in: D. Busch and J. Trexler, editors. Monitoring ecosystems: Interdisciplinary ap-proaches for evaluating ecoregional initiatives. Island Press, Washington, D.C..
Pearlstine, L., D. Shinde, L.A. Brandt, F.J. Mazzotti, M. Parry, B. Jeffery, M. Supernaw, and A. LoGalbo. 2012. Alligator Production Suitability Index Model (GATORPI v. 2.1.0). User’s Guide. South Florida Natural Resources Center, Everglades National Park, Homestead, Florida.
Pearlstine, L., S. Friedman, and M. Supernaw. 2011. Everglades Landscape Vegetation Succession Model (ELVeS): Freshwater marsh and prairie component v.1.1, DRAFT. Unpublished eco-logical report. Everglades National Park, South Florida Natural Resources Center, Homestead, Florida.
Rice, K.G., and F.J. Mazzotti. 2006 and 2007. American alligator distribution, size, and hole occupancy and American crocodile juvenile growth and survival. MAP RECOVER Annual Report. Unpublished report submitted to U.S. Army Corps of Engineers, Jacksonville, Florida.
Rice, K.G., F.J. Mazzotti, L.A. Brandt, and K.C. Tarboton. 2004. Alligator habitat suitability index. Pages 93–110 in K.C. Tarboton, M.M. Irizarry-Ortiz, D.P. Loucks, S.M. Davis, and J.T. Obeysekera, editors. Habitat suitability indices for evaluating wa-

18 South Florida Natural Resources center technical Series (2014:1)
ter management alternatives. Unpublished report. South Florida Water Management District, West Palm Beach, Florida.
Ruiz, P.L., J.P. Sah, M.S. Ross, D.L. Rodriguez, and A.M. Lambert. 2011. Monitoring of tree island conditions in the southern Everglades: The effect of hurricanes and hydrology on the status and population dynamics of sixteen tropical hard-wood hammock tree islands. Unpublished report submitted to the U.S. Army Corps of Engineers. Cooperative Agreement W912HZ–09–2–0019, Florida International University, Southeast Environmental Research Center, Miami, Florida.
Slone, D.H., and K.G. Rice. 2002. ATLSS American alligator popula-tion model: A simulation model for Everglades restoration. U.S. Geological Survey software program, Fort Lauderdale, Florida.
Tamarack, J.L. 1989. Georgia’s coastal island alligators: Variations in habitat and prey availability. Pages 105–118 in Proceedings of the 8th Working Meeting of the IUCN Crocodile Specialists Group, Gland, Switzerland.
TIEM (The Institute for Environmental Modeling). 2003. American alligator version 1.1 – CERP target sheet, textual description, flowcharts, and presentation. The Institute for Environmental Modeling, University of Tennessee, Knoxville, Tennessee. Accessed September 26, 2010, at http://atlss.org/cerp_runs/mod_info
Trexler, J.C., and C.W. Goss. 2009. Aquatic fauna as indicators for Everglades restoration: Applying dynamic targets in assessments. Ecological Indicators 9S:S108–S119.
Trexler, J.C., W.F. Loftus, and J.H. Chick. 2003. Setting and monitor-ing restoration goals in the absence of historical data: the case of fishes in the Florida Everglades. Pages 351–376 in D. Busch and J.C. Trexler, editors. Monitoring ecoregional initiatives: Interdisciplinary approaches for determining status and trends of ecosystems. Island Press, Washington, D.C.
Trexler, J.C., W.F. Loftus, and S.A. Perry. 2005. Disturbance frequency and community structure in a twenty-five year intervention study. Oecologia 145:140–152.
Turner, A.M., J.C. Trexler, C.F. Jordan, S.J. Slack, P. Geddes, J.H. Chick, and W.F. Loftus. 1999. Targeting ecosystem features for conser-vation: Standing crops in the Florida Everglades. Conservation Biology 13(4):898–911.
USACE. 1992. Modified Water Deliveries to Everglades National Park, Florida. General design memorandum and Environmental Impact Statement. June 1992. U.S. Army Corps of Engineers, Jacksonville, Florida.
USGS. 2011. Tides and Inflows in the Mangrove Ecotone (TIME) model development. Web page accessed June 1, 2011, at http://sofia.usgs.gov/projects/index.php?project_url=time
Wilkinson, P.M. 1983. Nesting ecology of the American alligator in coastal South Carolina. Study Completion Report: August 1978 – September 1983. South Carolina Wildlife and Marine Research Department, Charleston, South Carolina, 113 pp.


South Florida Natural Resources CenterEverglades National Park
950 N. Krome Ave, 3rd Floor Homestead, FL 33030-4443
www.nps.gov/ever/naturescience/sfnrc.htm