us doe ymsco
TRANSCRIPT
QUARTERLY REPORT
TO
US DOE YMSCO
FROM FTl 2 3 j&)
> c -: ;.< - HEAT TRANSFER LABORATORY MECHANICAL ENGINEERING
DEPARTMENT UNIVERSITY OF NEVADA, LAS VEGAS
"HEAT TRANSFER STUDIES"
R, BOEHM, PI
A, KUMAR SATHAPPAN Y.-T. CHEN, CO-PI
JANUARY 19, 1996 &
DISTRISUTION QF MIS POCUM- 8 UNllMIT€D

Abstract
Drying in subresidually-saturated systems at elevated temperatures has been studied for two different operating conditions. One condition started with flowing nitrogen gas through the test section and simultaneously heating up the porous medium at the same time (denoted in what follows as the "transient heating case"). The other condition started initially with heating up the porous medium with no flow, and then running thehitrogen gas flow through the test section after a steady- state temperature distribution had been reached (denoted in what follows as the "steady heating case"). A 90°C isothermal boundary condition was set on the aluminum wall. An average of 9% discrepancy in the mass balance calculation compared to the digital balance measurement has been found in the transient heating case. An average of 4.3% discrepancy in the mass balance calculation compared to the digital balance measurement has been found after the nitrogen gas flowed through test section for the steady heating case. A large discrepancy has also been found before the nitrogen gas admitted to the test section. This is because some of subresidual water in the test section has been drained out from the bottom due to the gravity effect and the strong convection flow in the porous medium before the nitrogen gas is admitted. This discrepancy may be reduced by closing the end tube at ' bottom before the nitrogen gas is admitted to the test section. The drying characteristics of this system are reported.
A theoretical study has also been initiated in an attempt to supplement the experimental results, and this system is described in the report. A one-dimensional transient system is assumed in which. a two-component (condensable and noncondensable) gas mixture flows through a porous medium with evaporation. The numerical calculation will be performed in the future work to compare to the experimental results.
Table of Contents
Abstract 1 A Study of the Extension of Multi-Phase Models to Sub-Residual Saturation 2
6 13
(I) Re=0.868 with a transient heated isothermal boundary condition (2) Re=0.434 with a steady heated isothermal boundary condition (3) The theoretical study 19
1

A Study of the Extension of Multi-Phase Models to Sub-Residual Saturation In a state of nature, it is known that a varying quantities of water can reside in
underground rocks due to differences in their porous structure. Without a heated condition in the underground, the residual water in the rock can penetrate downward to the water table and can be recharged from episodic water flows from surface. The residual water may stay there for many days, months, or years due to the capillary force equilibrium in the porous medium. As engineers and scientists understand, the capillary force in rock structures can be easily changed under a high thermal environment. When the capillary force decreases at high temperatures in the porous medium, the speed of water flow through the medium can then be accelerated. As mentioned, the high thermal load from buried high-level radioactive spent nuclear fuel can easily heat water in the near-field of the repository above the boiling temperature. It is of interest to investigate the multi- phase flow models as they apply to sub-residual saturation conditions in the porous medium under various thermal boundary conditions. The surface tension of water decreases when the temperature increases. As a consequence, the capillary pressure, which can build up the flow resistance in the porous medium, will be significantly reduced at high temperature conditions compared to what is found at lower temperatures. This will obviously result in higher liquid flows in the porous medium which could cause more moisture to penetrate into the repository. At the high temperature conditions, the water will not be easily confined to the pores due to the increased internal energy. In contrast, water can be easily evaporated, and it can travel in the porous medium and any fractures present due to the strong driving force from the pressure gradients. It is of interest to find out how fast the residual water can be dried out under a gas flow through a heated porous medium initially at residual saturation and to determine the effect of this flow on the relative humidity that exists in adjacent spaces.
To address this issue, our recent studies are focusing on the limitations of applying multi-phase flow models to the hydrothermal processes occurring when the liquid saturation falls below residual levels. A variety of different thermal boundary conditions are being considered in these studies. An experimental program in our laboratory continues to analyze the drying effects of residue water in a porous media with a heated boundary on the test section. A flow of nitrogen gas through a porous medium is used to determine from experimental measurements the physical relationship between the liquid saturation, capillary pressure, and temp era ture.
2

The test section consists of a 16" long aluminum cylinder that has an inside diameter of 1.5" and two windows (0.275" x 5.625"). The reason why aluminum was chosen for this application is because this material is rust resistant and it has a high thermal conductivity. For the current studies, a constant temperature (90OC) boundary condition has been applied on the outside of the aluminum wall. Two different operating conditions have been studied. One condition ("transient heating case") started simultaneously with flowing the nitrogen gas flow through the test section and heating up the porous .medium. The other condition ("steady heating case") started initially with heating up the porous medium until a steady state temperature distribution has been reached and then starting the nitrogen gas flow through the test section.
Quartz beads with an average diameter of 0.037" are used as the fill material in the test section. The glass beads have been cleaned with a 1% hydrochloride solution.
Nitrogen gas is used as the displacing fluid and water is the displaced fluid in the glass beads. Two gas flow rates of 1 and 0.5 SLPM are used in the studies reported here. In this case, the mass flow rates of nitrogen gas yield Re=0.868 and Re=0.434, respectively. These Reynolds numbers assure that the flows are in the Darcy region. A mass flow controller with a servo valve has been used to control the nitrogen gas mass flow rate through the test section. It has * 1% accuracy on the full range of 1 SLPM. Industrial grade nitrogen gas has been used in this study. Distilled water has been used to avoid any interferences such as any chemical bonding strength that might be caused by impurities.
Two relative humidity sensors have been used to measure the inlet and outlet moisture content of the nitrogen on a continuous basis. Prior to performing experiments, calibration of the humidity sensors as a function of water content and temperature has been done following the appropriate ASTM method. During the tests, the output voltages of the humidity sensors are recorded as a function of time.
Other instrumentation used includes a small-range (0.5" water maximum and 5 1% accuracy) differential pressure transmitter for measuring the pressure drop across the porous medium. The output voltages from the transmitter have been recorded. Weight readings of the entire test section with respect to time have also been recorded during the test, and these were accomplished with a digital balance. Comparisons are made between the change of water content in the test section inferred from integration of the mass flow of water out (estimated from the air mass flow and humidity measurements) with readings taken from the digital balance. A
3
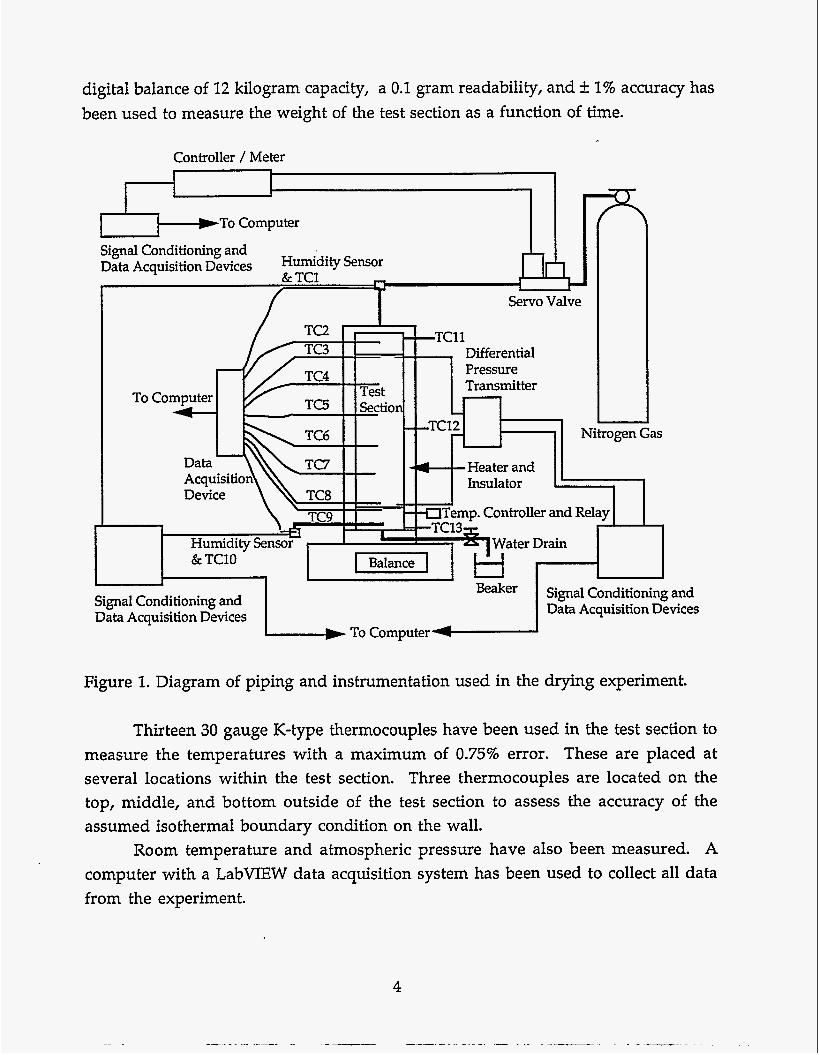
digital balance of 12 kilogram capacity, a 0.1 gram readability, and k 1% accuracy has been used to measure the weight of the test section as a function of time.
Controller / Meter
m m ~ ~ - w T O Computer I I I
Differential Pressure rv 171 NitrogenGas
Heater and
Be*er Signal Conditioning and Data Acquisition Devices
Figure I. Diagram of piping and instrumentation used in the drying experiment.
Thirteen 30 gauge K-type thermocouples have been used in the test section to measure the temperatures with a maximum of 0.75% error. These are placed at several locations within the test section. Three thermocouples are located on the top, middle, and bottom outside of the test section to assess the accuracy of the assumed isothermal boundary condition on the wall.
Room temperature and atmospheric pressure have also been measured. A computer with a LabVIEW data acquisition system has been used to collect all data from the experiment.

T (Not to Scale)
O-ring
\ 7 Metalscreen
WatLr Drain
Figure 2. Schematic diagram of the test section used in the drying experiments. Two windows on one side allow visual observations during the test runs. The test section can be operated with or without heating.
5
A case where a heated wall has been used on the experiment is reported here. An Omega I” x 8’ heating tape (maximum output rating of 8.6 W/in2) has been chosen to accomplish the heating task. An on-off type solid state temperature controller has been used to control the heating temperature.
The experimental setup is shown in Figure 1. The details of test section are shown in Figure 2. II) Re=0,868 with a transient heated boundarv condition
This test began with the system at residual saturation. At the start of the experiment, the nitrogen flow and the wall heater were turned on simultaneously. The nitrogen gas volumetric flow rate on this was 1 SLPM. Data are reported from this starting condition.
The relative humidity at the inlet and outlet vs. time is shown in Figure 3. The outlet relative humidity value maintains a constant value throughout most of the test. At approximately 28 minutes from the completion of the test, the relative humidity started to decrease significantly. The inlet relative humidity is a constant. The outlet relative humidity experiences a 10% range fluctuating between 30 and 33 minutes. This noise may come from the electromagnetic sensitivity of the relative humidity sensor. It may also come from a very small quantity of residual water at the bottom of the porous medium that remains after the initial water is drained. The outlet relative humidity value decreased gradually throughout most of the test (after 33 minutes).
Decrease in mass of the experimental apparatus with time, which is due to drying of the bed, is an important parameter in this study. Measurements from the digital balance are compared to similar results from the integration of the mass lost in the flow. The latter is inferred from the mass flow rate of the gas and the relative humidity measurements. An average of 8.7% discrepancy in the mass balance calculation compared to the digital balance measurement has been found and it is shown in Figure 4.
It is of interest to examine the drying slopes on the curve of reduced weight vs. time (Figure 4). Slope A is denoted between 0 and 400 seconds, slope B is between 400 and 1000 seconds, slope C is between 1000 and 1650 seconds, slope D is between 1650 and 1950 seconds, and slope E is after 1950 seconds. The values of slopes B and D are very similar and the highest drying rates occur during these periods of time. Slope A indicates that the initial drying rate is slow. This is because the residual water and air in the porous medium adjacent to the wall are heated up to induce a large temperature gradient between the center and the wall. A
6

convection cell may exist in this period of time until the temperature gradient becomes very small. It is possible that the direction of gas flow near the wall is upward due to a possible circulation cell in the porous medium. This phenomenon can cause a retardation of water vapor expelling out from the bottom of the test section. Thus, the reduced weight in the test section during this period of time is small. Slope C is smaller than slope B. The reason why the drying rate is moderate in this period of time is possibly because the equilibrium of the capillary force from the subresidual water at the bottom section of the porous medium is becoming established. Therefore, less water vapor exits the test section during this period of time. When the downward driving force is larger than the capillary force, the local equilibrium is then changed. Thus, more water vapor with the nitrogen gas flow will come out from the bottom at that moment. As a result, it has a larger slope D compared to slope C.
The volumetric flow rate of nitrogen gas and pressure drop across the porous medium vs. time are shown in Figure 5. The nitrogen gas flow rate is nearly constant. The pressure drop across the porous medium is not constant during the drying. The pressure drop decreases from 5 to 2.5 inches water during the first 100 seconds. It shows that there is not a large quantity of gas flow through the porous medium due to resistance from a capillary force of residual water. As mentioned, the capillary force decreases when the temperature in the porous medium increases. Thus, the pressure drop increases when the gas flow through the porous medium increases. The pressure drop decreases again when the new equilibrium of capillary force is established at the bottom of porous medium. The pressure drop in the gas flow through the porous medium is 3.18 inches water when the test section becomes completely dry.
The temperature at various locations in the test section is shown in Figures 6- 10. Figure 6 shows the nitrogen inlet and outlet temperatures. The inlet temperature is nearly constant. The outlet temperature increases up from the room temperature at the start to 75°C at 1000 seconds. It then experiences a 22OC drop between 1000 and 1850 seconds. This is may be due to higher evaporation rates in the gas flow at the bottom of the porous medium during this period. As it has been mentioned above, excess residual water might accumulate at the bottom of the test section due to the capillary force equilibrium. The outlet temperature increases again after the porous medium is completely dried.
7

H (in)
( . . . . I . . . .
Theoretical Weight from Calculation - Experimental Weight from Digital Balance -
- - - - -
0 500 1000 1500 2000 2500 3000 Time (sed
Figure 3. Relative humidity variations at the inlet and the outlet of the test section vs. time for the transient heating case with a 90°C wall setpoint (Re=0.868).
0
-2
-4
5 -6
5 -8
3
F4
v
.- z -10
z -12 U
-14
-16
-18
Figure 4. Amount of water transported from the experiment is compared from estimates using humidity measurements and digital balance measurements for the transient heating case with a 90°C wall setpoint (Re=0.868).
8

0.9
0.8
0.7
0.6
0.5
Figure 5. The volumetric flow rate of nitrogen gas and pressure drop across the porous medium vs. time for the transient heating case with a 90°C wall setpoint (Re=0.868).
LO?-* ' ~ > ' ' " ' 3 ' : ' " " ' ' ' ' I " ' .' 5.0
:: 4.5
; : 4.0
: 3.5
: 3.0
1 2.5
2.0
1 t 1 -4
j -!
-I .! ! + :! 7
I
" * " ' * ' " ' ' * ' I " * " * * ' ' " ' * *
70 1 8 0 ~ . 1 I 1 a 5 a 1 * I
Outlet -
- Inlet :
0 500 1000 1500 2000 2500 3000 Time (sed
Figure 6. Nitrogen gas inlet and outlet temperatures vs. time for the transient heating case with a 90°C wall setpoint (Re=0.868).
9

90
80
70
60
50
40
30
20 v2
1000 1500 2000 2500 3000 0 500 Time (sed
Figure 7. Temperatures at thermocouple 2 and 9 (see Figure 2) vs. time for the transient heating case with a 90°C wall setpoint (Re=0.868).
Figure 7 shows the temperatures at thermocouple 2 and 9 where are located above and under the porous medium, respectively. The temperatures in the location of thermocouple 2 and thermocouple 9 where the glass beads are not present shows a quick heating effect due to the convection heat transfer mechanism. Temperature at location of thermocouple 2 indicates an increased trend without any drop. Temperature at thermocouple 9 shows a similar trend as the outlet temp era ture.
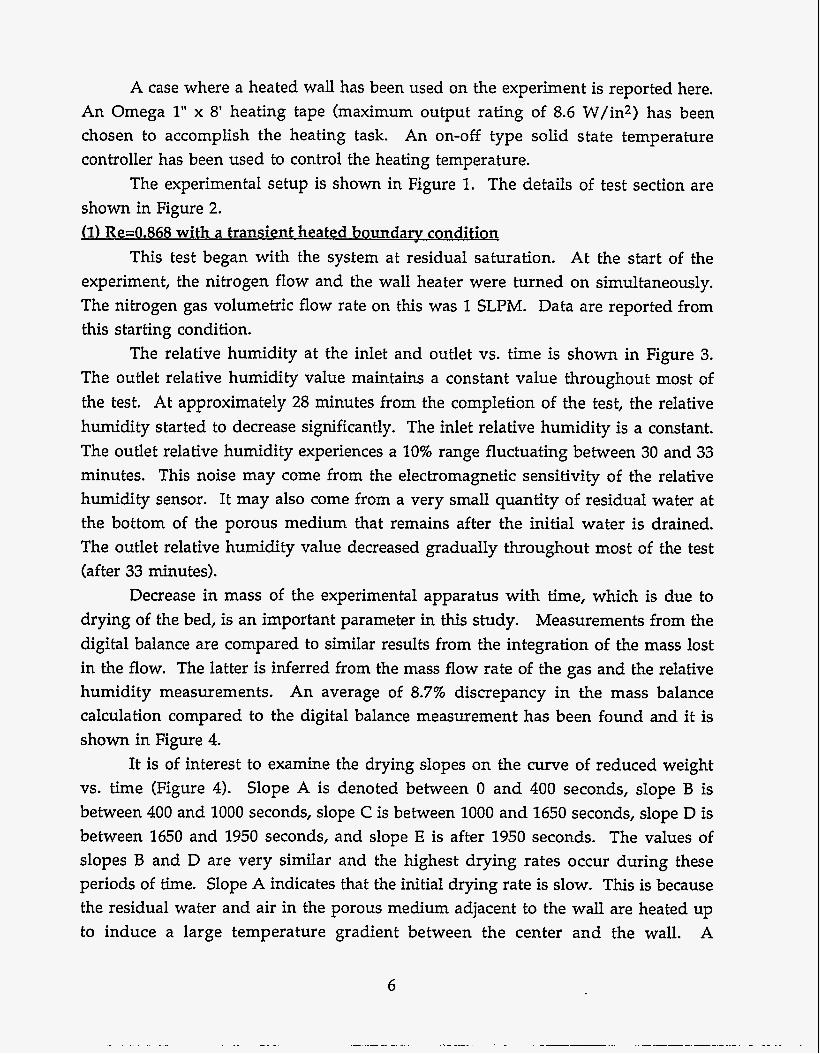
The top, middle, and bottom wall temperatures are shown in Figure 8. The feed back thermocouple connected to the on-off temperature controller is located close to the thermocouple 12. Thus, it almost maintains at a constant temperature. The top wall temperature is less than the middle and bottom wall temperatures before 700 seconds. This is probably due to the fact that the cooling effect is more significantly in this section during this period of time. In a contrast, the temperature at the bottom wall becomes less than the top and middle temperatures when the evaporation move downward.
100
90
n 80 u W 70
60 E $ 50 ' 40
a
30
20
12 :middle wall 13 : bottom wall
-..I..-- -.-.-.-
0 500 1000 1500 2000 2500 3000 Time (sed
Figure 8. Temperatures at top, middle, and bottom wall (see Figure 2) vs. time for the transient heating case with a 90°C wall setpoint (Re=0.868).
a 0 W
2 Y
E a k? F
Figure 9. Temperatures at thermocouple 3,5,7,8, and middle wall (see Figure 2) vs. time for the transient heating case with a 90°C wall setpoint (Re=0.868).
100
90
80
70
60
50
n
0 W W
Y B pc
I-( 40
30
20 1 . . . . 1 . . . . 1 . * . . 1 . . . . 1 . . . . ’
0 500 1000 1500 2000 2500 3000 Time (sed
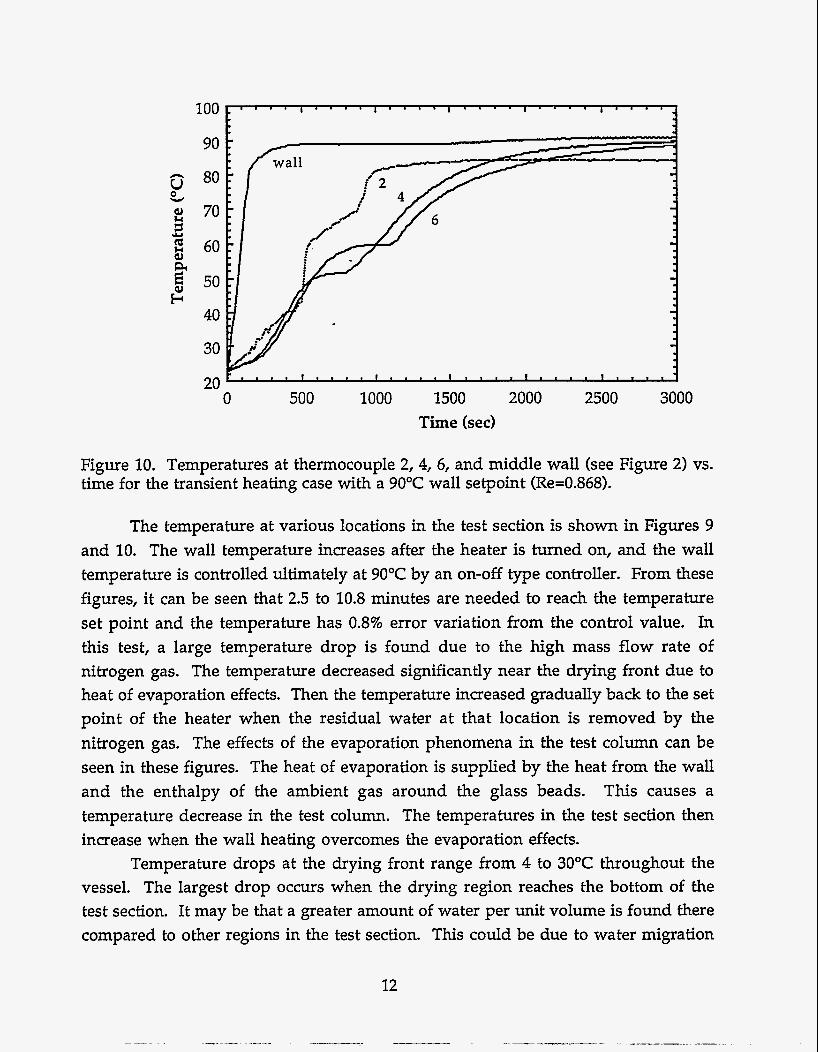
Figure 10. Temperatures at thermocouple 2, 4, 6, and middle wall (see Figure 2) vs. time for the transient heating case with a 90°C wall setpoint (Re=0.868).
The temperature at various locations in the test section is shown in Figures 9 and 10. The wall temperature increases after the heater is turned on, and the wall temperature is controlled ultimately at 90°C by an on-off type controller. From these figures, it can be seen that 2.5 to 10.8 minutes are needed to reach the temperature set point and the temperature has 0.8% error variation from the control value. In this test, a large temperature drop is found due to the high mass flow rate of nitrogen gas. The temperature decreased significantly near the drying front due to heat of evaporation effects. Then the temperature increased gradually back to the set point of the heater when the residual water at that location is removed by the nitrogen gas. The effects of the evaporation phenomena in the test column can be seen in these figures. The heat of evaporation is supplied by the heat from the wall and the enthalpy of the ambient gas around the glass beads. This causes a temperature decrease in the test column. The temperatures in the test section then increase when the wall heating overcomes the evaporation effects.
Temperature drops at the drying front range from 4 to 30°C throughout the vessel. The largest drop occurs when the drying region reaches the bottom of the test section. It may be that a greater amount of water per unit volume is found there compared to other regions in the test section. This could be due to water migration
12

caused by both gravity effects and the nitrogen flow in that direction. If more water evaporates in this region, the temperature change on drying would be larger. The experiment with the same Reynolds number but without heating on the wall has also been reported in the project quarterly reported dated July 20, 1995. Without heating, 390 minutes are needed to dry the test section, but only 50 minutes are needed to complete the drying with heating to 9OOC. The temperatures experience a similar drop in both experiments when evaporation occurs. An average of temperature drops ranges from 6. to 10 "C with a constant room temperature condition, compared to 4 to 30 OC with the heated condition.
(2) Re=0.434 with a stea dv heated isothermal boundam condition This test also began with the system at residual saturation. At the start of the
experiment, the wall heater was turned on to heat up the porous medium. When a steady-state temperature distribution was reached, the nitrogen gas flow then was allowed to run through the test section. The nitrogen gas volumetric flow rate on this was 0.5 SLPM. Data are reported from this starting condition.
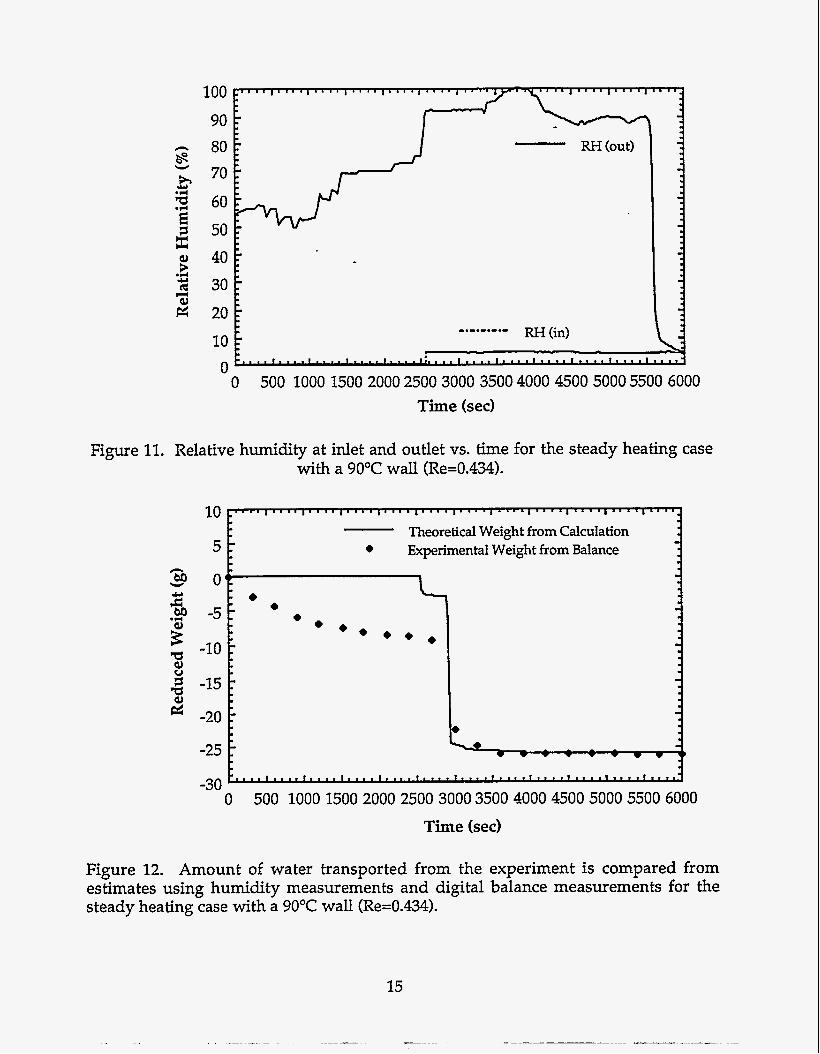
The relative humidity at the inlet and outlet vs. time is shown in Figure 11. The inlet relative humidity shows a constant when the nitrogen gas flow is admitted. The outlet relative humidity value shows a small fluctuation between 50% and 64% during the first 1400 seconds and is nearly constant at 70% between 1400 and 2500 seconds. This humidity increases significantly and reaches the maximum reading at 3800 seconds: then the reading starts to decrease. At approximately 85 minutes from the completion of the test, the relative humidity started to decrease significantly. Reasons why a constant maximum value of the outlet relative humidity is not found after initiating the nitrogen gas flow through the porous medium are not known. It is possible that a great deal of water vapor is buoyantly concentrated in the top of the porous medium after the test section temperature reaches steady state. Another interesting aspect of this is seen by examining Figure 15. This figure shows that thermocouple 2, which is located above the top of the porous medium, has a 43OC temperature drop when the gas flow evaporates the liquid, a large decrease.
Decrease in mass of the experimental apparatus with time, which is due to drying of the bed, is also an important parameter in this study. Measurements from the digital balance are compared to similar results from the integration of the mass lost in the flow. The latter is inferred from the mass flow rate of the gas and the relative humidity measurements. An average of 4.3% discrepancy in the mass
13
balance calculation compared to the digital balance measurement has been found after the nitrogen gas flowed through test section. This is shown in Figure 12. A large discrepancy has also been found before the nitrogen gas is admitted to the test section. This is because some of the subresidual water in the test section drains out the bottom over time. There is also a possibility of strong convection flows in the porous medium before the nitrogen gas is admitted. Actions are being considered to alleviate this discrepancy.
The volumetric flow rate of nitrogen gas and pressure drop across the porous medium vs. time are shown in Figure 13. The nitrogen gas flow rate is nearly constant. It shows a 0.2 liter per minute overshoot when the nitrogen gas flow is admitted. This is because the control valve is completely opened initially to meet the mass flow requirement. A higher flow rate causes a higher pressure drop across the porous medium. The pressure drop decreases from 3.95 to 0.57 inches water after the nitrogen gas flow is admitted. When the test section becomes completely dry, the pressure drop of the gas flow is 0.48 inches water .
The temperature at various locations in the test section is shown in Figures 14-18. The inlet temperature is nearly constant. The outlet temperature increases gradually from the room temperature up to 54°C before the nitrogen gas flow is admitted. The outlet temperature does not increase significantly when the nitrogen gas flow is introduced as it did in the transiently heated case reported above. This may be due to the fact that a smaller gas flow is used here, and this gas flow may be impeded by the buoyancy effects existing in the test section. The outlet temperature increases from 54°C up to 87°C with 3.8 minutes lag due to the fact that the gas flow is slowly moved and heated through the porous medium. The outlet temperature then decreases gradually to 67OC. This is probably because the cooling effect from the evaporation in the gas flow occurs at the bottom of the porous medium. When the porous medium is completely dried, the outlet temperature is 72 "C.
Figure 15 shows the temperatures at thermocouple 2 and 9 which are located above and under the porous medium, respectively. The temperatures in the locations of thermocouple 2 and thermocouple 9 (these are not in the glass beads) show rapid increases. Thermocouple 2 shows a significant drop after the nitrogen gas flow is admitted. Thermocouple 9 decreases gradually after the nitrogen gas flow is admitted. This is because the slow, cool gas flow is heated as it travels through the warm porous medium. Both temperatures increase back to 85.7"C when the porous medium is completely dried.
Figure 14 shows the nitrogen inlet and outlet temperatures.
14
100
90 - 80 * 70 h 3 60 50
Q) 40 3 ;;i 30
W
.y
8
2 20
.d
H
10 0
RH (out) - - - -
€ - - c RH (in) -.-.-.-.-
I . ... 1 * . . * I .. .. I . .. . ) I . . , I I .. I t I . . * 1 1 I . .. I .. * I I . .. . I .... 0 500 1000 1500 2000 2500 3000 3500 4000 4500 5000 5500 6000
Time (sed
Figure 11. Relative humidity at inlet and outlet vs. time for the steady heating case with a 90°C wall (Re=0.434).
Figure 12. Amount of water transported from the experiment is compared from estimates using humidity measurements and digital balance measurements for the steady heating case with a 90°C wall (Re=0.434).
15
I I-.__..__.. .. -

0.7
0.6
0.5
0.4
0.3
0.2
0.1
0.0
- - - - - - L . . . . 1 . . . . I .
0 1000 2000 3000 4000 5000 6000 Time (sed
Figure 13. The volumetric flow rate of nitrogen gas and pressure drop across the porous medium vs. time for the steady heating case with a 90°C wall (Re=0.434).
n
0 W U
Y ii l?
Figure 14. Nitrogen gas inlet and outlet temperatures vs. time for the steady heating case with a 90°C wall (Re=0.434).

n
0 Y U
90
80
70
60
50
40
30
20
- I . l . . l . . . . l ~ l r . l . . . t l . . , . I . , . . I . . . . 1 . . . . 1 . . I r l . r l l l . . . . l . . * .
0 500 1000 1500 2000 2500 3000 3500 4000 4500 5000 5500 6000 Time (sed
Figure 15. Temperatures at thermocouple 2 and 9 (see Figure 2) vs. time for the steady heating case With a 90°C wall (Re=0.434).
100
90 - 80 U
&J 70 s $ 60
0 Y
.c)
PI
40
30
20
12 middle wall 13 :bottom wall
-------. -.-.-.-.-
F.. * * I * 9 * * 1 . " ' 1 ' " ' 1 - - * * I ' * * ' I * " * f * ' * ' 1 * ' . * I * a * * I * * ' * I * * . . I 0 500 100015002000 25003000 35004000450050005500 6000
Time (sed
Figure 16. Temperatures at top, middle, and bottom wall (see Figure 2) vs. time for the steady heating case with a 90°C wall (Re=0.434).
17
100
90
80
70
60
0 8
0 W
I Y
aJ E 50
40 F
30
20 0 500 1000 1500 2000 2500 3000 3500 4000 4500 5000 5500 6000
Time (sed
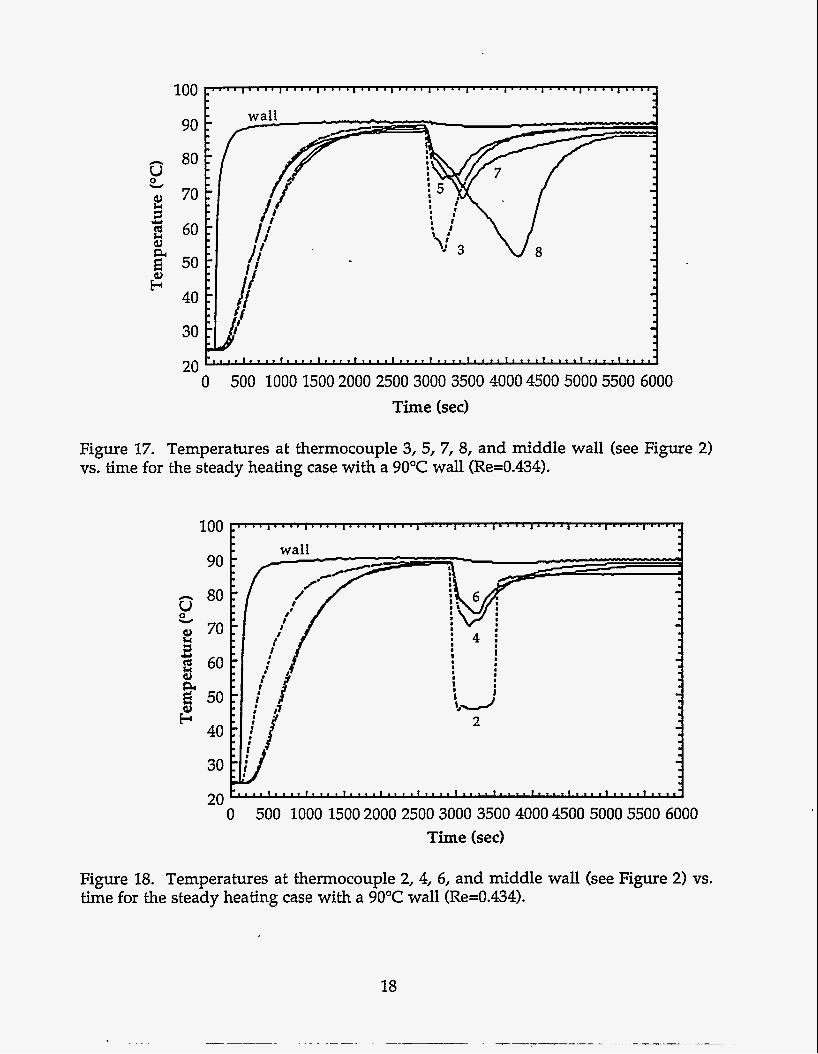
Figure 17. Temperatures at thermocouple 3, 5, 7, 8, and middle wall (see Figure 2) vs. time for the steady heating case with a 90°C wall (Re=0.434).
1
n
0 v U
Figure 18. Temperatures at thermocouple 2,4, 6, and middle wall (see Figure 2) vs. time for the steady heating case with a 90°C wall (Re=0.434).

The top, middle, and bottom wall temperatures are shown in Figure 16. The feedback thermocouple connected to the on-off temperature controller is located close to thermocouple 12. Thus, this temperature is maintained at an almost constant temperature. When the nitrogen gas flow is admitted, the temperature at the bottom wall shows a 5°C drop.
Temperatures at various locations in the test section are shown in Figures 17 and 18. The wall temperature increases after the heater is turned on, and the wall temperature is controlled at 90°C by- the on-off controller. From these figures, it can be seen that 5 to 12.5 minutes are needed to reach the temperature set point and the temperature has 0.8% error variation from the control value. In this test, a significant temperature drop is found when the nitrogen gas begins to flow through the porous medium. The temperature decreased significantly near the drying front due to heat of evaporation effects. Then the temperature increased gradually back to the set point of the heater when the residual water at that location is removed by the nitrogen gas. The effects of the evaporation phenomena in the test column can be seen in these figures. The heat of evaporation is supplied by the heat from the wall and the enthalpy of the ambient gas around the glass beads. This causes a temperature decrease in the test column. The temperatures in the test section increase when the heating process occurs. The movement of the drying front with time can be seen in these figures.
Temperature drops at the drying front range from 14 to 42°C throughout the vessel. The largest drop occurs when the drying region is at the top of the test section.
l- A theoretical study has also been initiated in an attempt to supplement the
insights gained from the experiments. The approach taken is to assume a one- dimensional transient system in which two-component (condensable and noncondensable) gas mixture flows through a porous medium with evaporation. In order to predict properly the various phenomena that affect the drying, it is desirable that restrictive conditions imposed on the formulation be minimized. Three continuity equations (i.e., for nitrogen, water vapor, and condensed liquid) and two energy equations (i.e., for gas mixture, and condensed liquid and porous medium) are basically used. To make these equations manageable, the following assumptions are introduced: (1) The porous medium is homogeneous. (2) Streamwise component of mass diffusion is negligible compared with that of

convective transport. (3) The total pressure in the porous medium is constant. (4) All the thermophysical properties except the nitrogen gas and water vapor densities are taken as constant.
The equations are expressed in dimensionless form. The normalization is made with respect to the reference values, the physical properties of gas, and the total pressure. The mass conservation for nitrogen gas is expressed as:
x- where z is the dimensionless time, as is the volume fraction of gas phase, pN is the dimensionless nitrogen gas density, Z is the dimensionless coordination, and U is the dimensionless gas-phase velocity.
The mass conservation for water vapor is given as:
x- where pwv is the dimensionless water vapor density, SC and Se are introduced for the convenience of description and they are defined as SC = 1 in the condensation region, Sc =O otherwise, and Se =1 in the evaporation region, Se = 0 otherwise. Mc and Me are the dimensionless mass transfer rates of phase change for condensation and evaporation, respectively.
The mass conservation expression for condensed liquid is:
where a1 is the volume fraction of liquid phase, pl* is the dimensionless water density.
The energy conservation expression for the mixture of nitrogen gas and water vapor is as follows.
20

where S is defined as
where 0g is dimensionless temperature of gas-phase, Peo is the Peclect number, Nlo is the Nusselt number, f i is dimensionless heat transfer coefficient, Cpwv* is the dimensionless specific heat of water vapor at constant pressure.
The energy conservation'for liquid and porous medium is listed as follow.
where r0 is a constant and is defined as show below, and Hfg is the dimensionless latent heat of evaporation.
where E is the porosity, p the reference specific heat of porous medium.
is the reference density of porous medium, and C P O PO
is
The volumetric constraint for the homogeneous condition is given as:
a,+a,=&
The equation of state for nitrogen gas is given as:
where PN* is the dimensionless pressure of nitrogen gas, RN* is the dimensionless gas constant of nitrogen gas, and A is a constant.
Water vapor is assumed to have an equation of state as given below:
I p;I, R&,(O, + A ) Pwv =

where PWV* is the dimensionless pressure of water vapor, R W V * is the dimensionless gas constant of water vapor, and A is a constant.
The relations between partial pressure and mole fraction are:
The dimensionless governing equations will be solved numerically using a finite difference scheme.
DISCLAIMER
This report was prepared as an account of work sponsored by an agency of the United Statcs Government. Neither the United States Government nor any agency thereof, nor any of their employees, makes any warranty, express or implied, or assumes any legal liability or responsi- bility for the accuracy, completeness, or usefulness of any information, apparatus, product, or process disclosed, or represents that its use would not infringe privately owned rights. Refer- erne herein to any specific commercial product, process, or service by trade name, trademark, manufacturer, or otherwise does not necessarily constitute or imply its endorsement, recom- mendation, or favoring by the United States Government or any agency thereof. The views and opinions of authors expressed herein do not necessarily state or reflect those of the United States Government or any agency thermf.
22
.