u.s. downstream refinery netback - home - energy …€¦ · · 2017-04-03the widely followed 3...
TRANSCRIPT

April 3, 2017 Volume 2: Issue 14
National Trends and Highlights
Last Week’s Market Drivers
Oil prices were higher across the board last week with RBOB leading the complex higher. The market may have hit a short term turning point as the nearby fundamentals look slightly more positive while talk of extending the OPEC accord have put a more posi-tive outlook on the longer term balances.
The May Brent/WTI spread ended the week lower with Brent still trading at a modest premium to WTI. The May Brent/WTI spread narrowed by $0.60/bbl on the week. Brent is trading at a premium to WTI and is still a wide enough level to open the arb win-dow for select US crudes to work in the export market.
The spot May WTI contract increased on the week and is still trading in the lower technical trading range that has not been in play since November of last year. The May Brent contract also increased but less than the May WTI contract resulting in the May Brent/WTI contract narrowing $0.60/bbl. The May Brent/WTI spread remained in its current technical trading range last week.
Both the HO and RBOB crack spreads were higher versus WTI for the week. The widely followed 3-2-1 crack spread also widened last week driven by the RBOB component.
(Continued on page 3)
Two very powerful factors hit the refinery marketplace this week to create the largest one-week increase in down-stream netbacks we have seen in 2017. National average margins rocketed higher by $5.54 per barrel marking the first visit north of $15 since visiting the territory on the way down in early January. The week-on-week change was a whopping %57.4 increase. The first factor was foretold last week as processed crude prices were set to decline. Paired with this was the second factor of increasing refined product revenues based on a global view of the market that may be changing.
Last week we wrote of this week’s decline in processed crude prices as runs this week are based on purchases that occurred three weeks ago when surveyed prices had dropped to $45.30 per barrel. This is a healthy drop of $3.97 per barrel. We wrote that the market had begun to lose con-fidence not in the fact that OPEC and others were working toward global supply balance, but how long it would take to achieve this balance. Being an impatient lot, market partici-pants began stacking bets that balance was a lot farther down the road than previously expected. This prevailing, although trailing, view of the market will continue to be re-flected in our processed crude prices through mid April. At that time the market will take an abrupt change again that was brought about this week.
After getting pummeled for about a month or so oil pric-es rallied last week to notch the largest weekly gain in about 4 months or so. Part of the gains were simply driven by short covering as the market was in an oversold technical condition coming into last week. In addition, the weekly EIA US oil inventory snapshot
(Continued on page 2)
$0.00
$5.00
$10.00
$15.00
$20.00
$25.00
JUN JUL AUG SEP OCT NOV DEC JAN FEB MAR APR MAY
Pe
r B
arre
l
U.S. Downstream Refinery Netback
Last Year This Year
This week: $15.20
$0.00
$10.00
$20.00
$30.00
$40.00
$50.00
$60.00
JUN JUL AUG SEP OCT NOV DEC JAN FEB MAR APR MAY
Per
Bar
rel
U.S. Processed Crude Cost
Last Year This Year
$45.30This week:
2
was supportive as total combined stocks of crude oil and refined products declined for the second week out of the last three weeks. With the refinery maintenance season about over refiner demand for crude oil is likely to increase in the coming weeks which should result in inventories entering a normal seasonal destocking period.
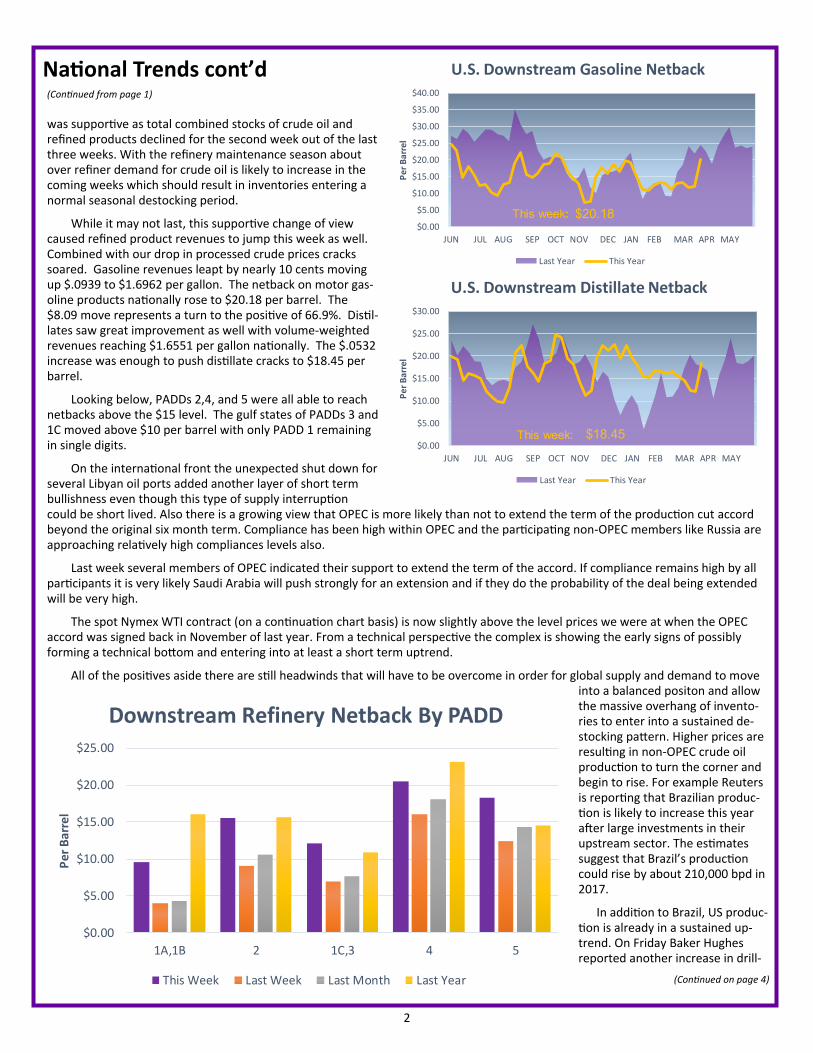
While it may not last, this supportive change of view caused refined product revenues to jump this week as well. Combined with our drop in processed crude prices cracks soared. Gasoline revenues leapt by nearly 10 cents moving up $.0939 to $1.6962 per gallon. The netback on motor gas-oline products nationally rose to $20.18 per barrel. The $8.09 move represents a turn to the positive of 66.9%. Distil-lates saw great improvement as well with volume-weighted revenues reaching $1.6551 per gallon nationally. The $.0532 increase was enough to push distillate cracks to $18.45 per barrel.
Looking below, PADDs 2,4, and 5 were all able to reach netbacks above the $15 level. The gulf states of PADDs 3 and 1C moved above $10 per barrel with only PADD 1 remaining in single digits.
On the international front the unexpected shut down for several Libyan oil ports added another layer of short term bullishness even though this type of supply interruption could be short lived. Also there is a growing view that OPEC is more likely than not to extend the term of the production cut accord beyond the original six month term. Compliance has been high within OPEC and the participating non-OPEC members like Russia are approaching relatively high compliances levels also.
Last week several members of OPEC indicated their support to extend the term of the accord. If compliance remains high by all participants it is very likely Saudi Arabia will push strongly for an extension and if they do the probability of the deal being extended will be very high.
The spot Nymex WTI contract (on a continuation chart basis) is now slightly above the level prices we were at when the OPEC accord was signed back in November of last year. From a technical perspective the complex is showing the early signs of possibly forming a technical bottom and entering into at least a short term uptrend.
All of the positives aside there are still headwinds that will have to be overcome in order for global supply and demand to move into a balanced positon and allow the massive overhang of invento-ries to enter into a sustained de-stocking pattern. Higher prices are resulting in non-OPEC crude oil production to turn the corner and begin to rise. For example Reuters is reporting that Brazilian produc-tion is likely to increase this year after large investments in their upstream sector. The estimates suggest that Brazil’s production could rise by about 210,000 bpd in 2017.
In addition to Brazil, US produc-tion is already in a sustained up-trend. On Friday Baker Hughes reported another increase in drill-
(Continued from page 1)
(Continued on page 4)
National Trends cont’d
$0.00
$5.00
$10.00
$15.00
$20.00
$25.00
$30.00
$35.00
$40.00
JUN JUL AUG SEP OCT NOV DEC JAN FEB MAR APR MAY
Per
Bar
rel
U.S. Downstream Gasoline Netback
Last Year This Year
This week: $20.18
$0.00
$5.00
$10.00
$15.00
$20.00
$25.00
$30.00
JUN JUL AUG SEP OCT NOV DEC JAN FEB MAR APR MAY
Per
Bar
rel
U.S. Downstream Distillate Netback
Last Year This Year
This week: $18.45
$0.00
$5.00
$10.00
$15.00
$20.00
$25.00
1A,1B 2 1C,3 4 5
Per
Bar
rel
Downstream Refinery Netback By PADD
This Week Last Week Last Month Last Year

3
The May WTI contract increased by 5.18 percent or $2.63/bbl last week as total US crude oil stocks increased less than ex-pected. The May Brent contract increased by 4 percent or $2.03/bbl.
On the distillate fuel front the Apr Nymex HO contract increased for the week by 5.07 percent or $0.0760/gal as distillate fuel inventories declined more than the market expectation. Gasoline prices increased after gasoline inventories declined more than expected on the week. The spot Nymex gasoline price increased by 5.94 percent or $0.0953/gal this past week.
Nat Gas prices increased last week and remains in an upward trending channel. The increase in Nat Gas prices was primarily driven by lingering cold weather forecast. The spot May Nymex contract ended the trading week increasing by 1.17 percent or $0.037/mmbtu.
On the financial front equity markets were higher for the week after decreasing during the previous week. The overall EMI Global Equity Index increased by 0.79 percent for the week with the year to date gain widening to 5.8 percent. Nine of the ten bourses in the Index remain in positive territory for 2017. Japan remains in the worst performer spot in the Index with Hong Kong still in the top spot with a 9.6 percent gain for the year. The positive value direction in global equity markets last week was a posi-tive price driver for the oil complex.
On the currency front the US dollar Index traded higher for the week with the Yen/USD and the Euro/USD lower. Overall the currency markets were a negative price driver for the oil complex last week.
(Continued from page 1)
Market Drivers cont’d
PADD Breakdown PADD 1A, 1B: The Mid-Atlantic
and New England failed to break into double digits this week but margin improvement was huge nonetheless. The region added $5.65 per barrel to come in at an average $9.60. Singularly racks delivered by the Laural pipe did break into double digits at $12.38.
Gasoline pulled into the margin lead at $12.64 per barrel with dis-tillates a close second at $12.10.
PADD 2: The heartland saw overall margins push higher by $6.49 per barrel attaining a region-al average of $15.52. With many players and a diverse span of eco-nomics, the players all drew within $2.87 of each other. On top were eastbound products moving on Phillip’s line. Marathon barrels out of Chicago struggled the most at $13.77 but were still hughly profit-able compared to last week. Min-neapolis/St. Paul barrels jumped back into the lead among origina-tion points at $16.04 per barrel. Group III originations from Tulsa came in second at $15.73. Material moving from the Chicago complex earned an average $15.44.
(Continued on page 4)
$9.10
$8.93
$12.33
$8.05
$0.00 $2.00 $4.00 $6.00 $8.00 $10.00 $12.00 $14.00
New York - Barge Racks
New York - Buckeye
New York - Laurel
New York - Sunoco
PADD 1A-1B Market Netbacks Per Barrel
$16.27
$15.41
$13.77
$15.87
$16.36
$14.94
$16.04
$14.01
$15.24
$15.05
$16.36
$16.88
$16.82
$0.00 $4.00 $8.00 $12.00 $16.00 $20.00
Chicago - Buckeye
Chicago - Magellan
Chicago - Marathon
Chicago - Sunoco
Chicago - West Shore
Chicago - Wolverine
Minn/StPaul - Magellan
Group III - Explorer
Group III - Magellan N. of Des Moines
Group III - Magellan S. of Des Moines
Group III - NuStar
Group III - Phillips East
Group III - Phillips West
PADD 2 Market Netbacks Per Barrel

4
$11.50
$10.02
$12.76
$11.15
$10.28
$10.29
$13.62
$12.16
$10.96
$15.07
$12.24
$10.87
$0.00 $2.00 $4.00 $6.00 $8.00$10.00$12.00$14.00$16.00
Gulf Coast - Plantation
Gulf Coast - Atlanta
Gulf Coast - Barge Racks
Gulf Coast - Colonial N of Greensboro
Gulf Coast - Colonial to Greensboro
Gulf Coast - Enterprise
Gulf Coast - Explorer
Gulf Coast - Exxon
Gulf Coast - Florida Barge
Gulf Coast - Magellan
Gulf Coast - NuStar
Gulf Coast - Sunoco
PADD 1C,3 Market Netbacks Per Barrel
$22.46
$0.00
$19.76
$19.13
$0.00 $5.00 $10.00 $15.00 $20.00 $25.00
Billings - Yellowstone
Casper/Sinclair - Magellan
Casper/Sinclair - Phillips 66
Salt Lake City - Tesoro
PADD 4 Market Netbacks Per Barrel
$15.70
$18.33
$18.65
$20.93
$17.82
$0.00 $5.00 $10.00 $15.00 $20.00 $25.00
Los Angeles - CalNev
Los Angeles - SFPP
Pacific NW - Olympic/Barge
Pacific NW - SFPP
San Francisco - SFPP
PADD 5 Market Netbacks Per Barrel
ing rigs deployed to the US oil sector. Rigs increased by 10 new rigs or a 1.5 percent increase for the week. Total rigs deployed to the oil sector have now increased by 300 or 82.9 percent year over year.
As shown in the chart to the right both oil rigs and US crude oil production bottomed about the middle of last year. Both have been in a sustained uptrend with total US crude oil production now higher by almost 700,000 bpd since the middle of October of 2016. All signs continue to suggest that US drill-ing and subsequently crude oil production will increase going forward. Non-OPEC crude oil production gains are going to continue to pressure OPEC to continue with a high compliance level as well as extend the term of the accord if they expect prices to move to higher levels.
(Continued from page 2)
Gasoline gained favor here as well earning $19.83 per barrel ahead of distillates at $18.73
PADD 1C, 3: Gulf states were able to earn refiners $12.13 per barrel last week. This was a sizable improvement of $5.24. The Magel-lan line delivered the best results in the region averaging $15.07. All pipes and barge routes earned re-finers at least $10 with Atlanta squeaking by at $10.02. Top to bottom there was a significant $5.00 spread among potential routes.
Gasoline continued on top at $17.34 per barrel while distillates could be expected at $16.02..
PADD 4: The rocky mountain region pushed back above the $20 mark by 45 cents collectively. Lead-ing the pack was material shipped on the Yellowstone line out of Billings where barrels returned $22.46. Diesel continued on top with margins of $26.07 while gaso-line saw returns of $23.22 per bar-rel.
PADD 5: The west coast saw margins move up nearly 50% to reach $18.28 on average. A big turnabout was seen in the Pacific Northwest where barrels took the top spot at $20.93 in income if shipped on Kinder Morgan’s SFPP line. CalNev barrels struggled the most but still topped $15.
Gasoline income shot to $27.85 with diesel rising nicely as well to $19.31 per barrel.
(Continued from page 3)

5
$0.50
$0.70
$0.90
$1.10
$1.30
$1.50
$1.70
$1.90
$2.10
$2.30
JUN JUL AUG SEP OCT NOV DEC JAN FEB MAR APR MAY
Per
Gal
lon
U.S. Ex-Freight Distillate Revenue(Volume-Weighted Rack less Pipe/Barge)
Last Year This Year
This week: $1.6551
$0.50
$0.70
$0.90
$1.10
$1.30
$1.50
$1.70
$1.90
$2.10
$2.30
JUN JUL AUG SEP OCT NOV DEC JAN FEB MAR APR MAY
Pe
r G
allo
nU.S. Ex-Freight Gasoline Revenue
(Volume-Weighted Rack less Pipe/Barge)
Last Year This Year
$1.6962This week:
April 3, 2017 Semi-Variable Refining Cost Avg. Avg.
Avg. API Processed Gasoline Diesel Gasoline Diesel Downstream Netback
Netback Market Refining District Gravity Crude Price Crack/bbl Crack/bbl Yield Yield Per Barrel Per Gallon
New York - Barge Racks East Coast 34.00 $51.03 $11.28 $12.60 47.78% 29.43% $9.10 $0.2166
New York - Buckeye East Coast 34.00 $51.03 $10.88 $12.67 47.78% 29.43% $8.93 $0.2126
New York - Laurel East Coast 34.00 $51.03 $18.68 $11.56 47.78% 29.43% $12.33 $0.2936
New York - Sunoco East Coast 34.00 $51.03 $9.72 $11.58 47.78% 29.43% $8.05 $0.1917
PADD I: 34.00 $51.03 $12.64 $12.10 47.78% 29.43% $9.60 $0.2286
Chicago - Buckeye IN-IL-KY 31.38 $41.44 $22.89 $18.69 52.32% 22.99% $16.27 $0.3875
Chicago - Magellan IN-IL-KY 31.38 $41.44 $20.41 $20.57 52.32% 22.99% $15.41 $0.3669
Chicago - Marathon IN-IL-KY 31.38 $41.44 $18.53 $17.73 52.32% 22.99% $13.77 $0.3279
Chicago - Sunoco IN-IL-KY 31.38 $41.44 $20.98 $21.28 52.32% 22.99% $15.87 $0.3778
Chicago - West Shore IN-IL-KY 31.38 $41.44 $23.02 $18.77 52.32% 22.99% $16.36 $0.3895
Chicago - Wolverine IN-IL-KY 31.38 $41.44 $20.34 $18.72 52.32% 22.99% $14.94 $0.3558
IN-IL-KY AVG: 31.38 $41.44 $21.03 $19.29 52.32% 22.99% $15.44 $0.3676
Minn/StPaul - Magellan MN-WI-ND-SD AVG: 30.76 $41.47 $20.62 $20.78 51.82% 25.76% $16.04 $0.3819
Group III - Explorer OK-KS-MO 37.08 $42.98 $16.98 $15.24 50.09% 36.14% $14.01 $0.3336
Group III - Magellan N. of Des Moines OK-KS-MO 37.08 $42.98 $17.71 $17.62 50.09% 36.14% $15.24 $0.3628
Group III - Magellan S. of Des Moines OK-KS-MO 37.08 $42.98 $17.27 $17.70 50.09% 36.14% $15.05 $0.3583
Group III - NuStar OK-KS-MO 37.08 $42.98 $19.08 $18.82 50.09% 36.14% $16.36 $0.3895
Group III - Phillips East OK-KS-MO 37.08 $42.98 $20.12 $18.83 50.09% 36.14% $16.88 $0.4020
OK-KS-MO AVG: 37.08 $42.98 $18.23 $17.64 50.09% 36.14% $15.51 $0.3692
PADD II: 33.70 $42.09 $19.83 $18.73 51.35% 28.70% $15.52 $0.3694
Group III - Phillips West Texas Inland AVG: 40.23 $43.57 $20.15 $21.78 52.52% 28.64% $16.82 $0.4005
Gulf Coast - Plantation LA Gulf Coast AVG: 29.81 $44.61 $17.39 $13.98 40.78% 31.54% $11.50 $0.2738
Gulf Coast - Atlanta TX Gulf Coast 31.09 $45.57 $14.01 $14.18 42.96% 28.23% $10.02 $0.2387
Gulf Coast - Barge Racks TX Gulf Coast 31.09 $45.57 $21.10 $13.07 42.96% 28.23% $12.76 $0.3037
Gulf Coast - Colonial N of Greensboro TX Gulf Coast 31.09 $45.57 $16.82 $13.89 42.96% 28.23% $11.15 $0.2654
Gulf Coast - Colonial to Greensboro TX Gulf Coast 31.09 $45.57 $14.70 $14.02 42.96% 28.23% $10.28 $0.2447
Gulf Coast - Enterprise TX Gulf Coast 31.09 $45.57 $14.74 $14.04 42.96% 28.23% $10.29 $0.2451
Gulf Coast - Explorer TX Gulf Coast 31.09 $45.57 $19.74 $18.22 42.96% 28.23% $13.62 $0.3244
Gulf Coast - Exxon TX Gulf Coast 31.09 $45.57 $17.84 $15.93 42.96% 28.23% $12.16 $0.2896
Gulf Coast - Florida Barge TX Gulf Coast 31.09 $45.57 $15.68 $14.96 42.96% 28.23% $10.96 $0.2610
Gulf Coast - Magellan TX Gulf Coast 31.09 $45.57 $20.18 $22.66 42.96% 28.23% $15.07 $0.3588
Gulf Coast - NuStar TX Gulf Coast 31.09 $45.57 $18.04 $15.89 42.96% 28.23% $12.24 $0.2914
Gulf Coast - Sunoco TX Gulf Coast 31.09 $45.57 $15.00 $15.67 42.96% 28.23% $10.87 $0.2588
TX Gulf Coast AVG: 31.09 $45.57 $17.08 $15.68 42.96% 28.23% $11.77 $0.2801
PADD III: 31.69 $45.34 $17.34 $16.02 43.53% 28.52% $12.13 $0.2889
Billings - Yellowstone Rocky Mountain 33.48 $41.60 $25.71 $27.72 50.14% 34.52% $22.46 $0.5347
Casper/Sinclair - Magellan Rocky Mountain 33.48 $41.60 $24.38 50.14% 34.52%
Casper/Sinclair - Phillips 66 Rocky Mountain 33.48 $41.60 $20.67 $27.21 50.14% 34.52% $19.76 $0.4704
Salt Lake City - Tesoro Rocky Mountain 33.48 $41.60 $22.12 $23.29 50.14% 34.52% $19.13 $0.4554
PADD IV: 33.48 $41.60 $23.22 $26.07 50.14% 34.52% $20.45 $0.4869
Los Angeles - CalNev West Coast 27.45 $46.42 $22.81 $19.31 51.39% 20.57% $15.70 $0.3737
Los Angeles - SFPP West Coast 27.45 $46.42 $26.62 $22.60 51.39% 20.57% $18.33 $0.4363
Pacific NW - Olympic/Barge West Coast 27.45 $46.42 $29.87 $16.03 51.39% 20.57% $18.65 $0.4440
Pacific NW - SFPP West Coast 27.45 $46.42 $33.56 $17.94 51.39% 20.57% $20.93 $0.4984
San Francisco - SFPP West Coast 27.45 $46.42 $26.40 $20.67 51.39% 20.57% $17.82 $0.4243
PADD V: 27.45 $46.42 $27.85 $19.31 51.39% 20.57% $18.28 $0.4353
Total 32.07 $45.30 $20.18 $18.45 48.84% 28.35% $15.20 $0.3618

6
API Gravity: EMI surveys crude density data from refiner, government, and other sources then models a current monthly estimate by region. Light crudes generally exceed 38 degrees API; heavy crudes are typically 22 degrees or below; intermediate crudes fall between the 22 to 38 degree API gravity range.
Processed Crude: EMI surveys private and international crude producer (IOC) price bulletins from U.S. and Canadian companies. In addition, national oil com-pany (NOC) prices are surveyed from OPEC and non-OPEC countries. Prices are then averaged by region of origin and applicable pipeline or waterborne trans-portation costs are added to formulate a cost of crude delivered to specific refining districts expressed in US dollars per barrel. The Processed Crude price shown in each report is not the current price of crude and has been lagged approximately 22 days from the publication date. This is done to simulate the elapsed average transit, blending, and processing time between when a crude is purchased and ultimately refined.
OpEx + D&A: EMI surveys SEC and self-reported financial documents to determine variable refinery operating expenses (OpEx) and depreciation and amorti-zation (D&A) charges. These costs are grouped together by refinery complexity category, averaged across regions, and expressed in US dollars per barrel.
Total Cost: Processed crude costs are added to variable refinery operating expenses and depreciation and amortization charges (OpEx + D&A) to arrive at a total cost of refining a barrel of crude.
Gasoline Yield: EMI surveys the average percent of finished motor gasoline (all octanes) produced from refinery inputs as reported by refiner, government, and other sources. These values are modeled forward to create a current monthly estimate by region.
Gasoline Revenue: EMI surveys and publishes wholesale/rack price assessments at hundreds of individual markets each day. This data can be purchased separately and is described in more detail here: https://emi.org/publication/wholesale-fuel-price-assessments/. Additionally, EMI surveys and publishes pipeline and barge transportation rate assessments on a monthly basis. This data can be purchased separately and is described in more detail here: https://emi.org/publication/emi-pipeline-barge-rate-assessments-annual-subscription/. The transportation cost of moving product from the refinery to the wholesale market is subtracted from the wholesale price to arrive at a net gasoline price. Lastly, EMI surveys and publishes weekly wholesale fuel volume assessments which can be purchased separately and is described in more detail here: https://emi.org/publication/gasoline-diesel-fuel-volume-assessments/. EMI multiples the net gasoline price by the fuel volume assessment to arrive at volume-weighted gasoline revenues within specific regions. Prices are expressed in US dol-lars per gallon.
Gasoline Crack/gal: Calculated by subtracting Total Cost from Gasoline Revenue expressed in US dollars per US gallon. This calculation is a 1-1 crack and assumes a theoretical 100% gasoline yield.
Gasoline Crack/bbl: Calculated by subtracting Total Cost from Gasoline Revenue expressed in US dollars per 42-gallon barrel. This calculation is a 1-1 crack and assumes a theoretical 100% gasoline yield.
Diesel Yield: EMI surveys the average percent of distillate fuel oil (on- and off-highway No. 1, No. 2, and No. 4 grade diesel) produced from refinery inputs as reported by refiner, government, and other sources. These values are modeled forward to create a current monthly estimate by region.
Diesel Revenue: EMI surveys and publishes wholesale/rack price assessments at hundreds of individual markets each day. This data can be purchased sepa-rately and is described in more detail here: https://emi.org/publication/wholesale-fuel-price-assessments/. Additionally, EMI surveys and publishes pipeline and barge transportation rate assessments on a monthly basis. This data can be purchased separately and is described in more detail here: https://emi.org/publication/emi-pipeline-barge-rate-assessments-annual-subscription/. The transportation cost of moving product from the refinery to the wholesale market is subtracted from the wholesale price to arrive at a net diesel price. Lastly, EMI surveys and publishes weekly wholesale fuel volume assessments which can be purchased separately and is described in more detail here: https://emi.org/publication/gasoline-diesel-fuel-volume-assessments/. EMI multiples the net diesel price by the fuel volume assessment to arrive at volume-weighted diesel revenues within specific regions. Prices are expressed in US dollars per gallon.
Diesel Crack/gal: Calculated by subtracting Total Cost from Diesel Revenue expressed in US dollars per US gallon. This calculation is a 1-1 crack and assumes a theoretical 100% diesel yield.
Diesel Crack/bbl: Calculated by subtracting Total Cost from Diesel Revenue expressed in US dollars per 42-gallon barrel. This calculation is a 1-1 crack and assumes a theoretical 100% diesel yield.
Downstream Netback Per Gallon: Gasoline Yield in each region is multiplied by Gasoline Revenue. The result is added to the Diesel Yield in each region multi-plied by Diesel Revenue. Total Cost is subtracted from the resulting sum of the yield-weighted refined product revenues and expressed in US dollars per US gallon.
Downstream Netback Per Barrel: Gasoline Yield in each region is multiplied by Gasoline Revenue. The result is added to the Diesel Yield in each region multi-plied by Diesel Revenue. Total Cost is subtracted from the resulting sum of the yield-weighted refined product revenues and expressed in US dollars per 42-gallon barrel.
NOTES, DATA COLLECTION, AND ANALYSIS METHODOLOGY
Downstream Refinery Netbacks is published each week by the Energy Management Institute (EMI), 1324 Lexington Avenue, #322, New York, NY 10128. Copyright 2017. Reproduction without permission is strictly prohibited. Subscriptions: $1,195 per month. Editor in Chief: J. Scott Susich; Publisher: Stephen Gloyd; Contributing Editor: Dominick Chirichella. Information and opinions ex-pressed in this publication are intended to provide general market awareness. All information is gathered from sources deemed reliable but accuracy is not guaranteed. EMI is not responsible for business actions, market transactions, or decisions made by its readers based on information published in this report. Readers of Downstream Refinery Netbacks use this information at their own risk. To participate as a source for any data in this report please contact EMI at 888 871-1207 or [email protected].