u.s. environmental protection agency … · 10th conference of air quality models 03/13/2012...
TRANSCRIPT

U.S. ENVIRONMENTAL PROTECTION AGENCY
10TH CONFERENCE OF AIR QUALITY MODELS
DAY ONE
U.S. EPA
109 T.W. ALEXANDER DRIVE
RESEARCH TRIANGLE PARK, NC
MARCH 13, 2012
8:30 A.M.

10TH CONFERENCE OF AIR QUALITY MODELS 03/13/2012 CCR#16766-1 2
1 GUEST SPEAKERS:
2
3 BRET ANDERSON, US FOREST SERVICE
4 GEORGE BRIDGERS, US EPA - OAQPS
5 ROGER BRODE, US EPA - OAQPS
6 CHAT COWHERD, MIDWEST RESEARCH INSTITUTE
7 CHRIS DRESSER, US EPA - OTAQ
8 TYLER FOX, US EPA - OAQPS
9 GALE HOFFNAGLE, TRC ENVIRONMENTAL CORP.
10 ROBERT PAINE, AECOM
11 MEG PATULSKI, US EPA - OTAQ
12 RON PETERSEN, CPP, INC.
13 RANDY ROBINSON, US EPA - REGION 5
14 JAMES THURMAN, US EPA - OAQPS
15 RICHARD (CHET) WAYLAND, US EPA - OAQPS
16
17
18
19
20
21
22
23
24
25

10TH CONFERENCE OF AIR QUALITY MODELS 03/13/2012 CCR#16766-1 3
1 U.S. ENVIRONMENTAL PROTECTION AGENCY
2 10TH CONFERENCE OF AIR QUALITY MODELS
3 MARCH 13, 2012
4 MR. BRIDGERS: Good morning everyone and
5 welcome to North Carolina. Welcome to the EPA RTP
6 facility. As we kick off the 10th Conference on Air
7 Quality Modeling, I am glad that we have got a pretty
8 full house today. Hopefully, everybody made it through
9 security, and visitor parking and all of that without a
10 whole lot of hassle. I imagine the next couple of days
11 it will get a little more fluid after this morning.
12 Before we start the conference in earnest, I wanted to
13 go through just a few logistics about the meeting room
14 and about some things with respect to the conference.
15 I wanted to point out up front for everybody -- this is
16 like you are on the telephone call where it says, "this
17 call may be recorded for various uses." This meeting
18 is a Public Hearing and off to my right is a
19 transcriptionist. And so everything that is presented
20 or is said in the conference is going to be recorded.
21 So, don't say anything that you don't want said back to
22 you later. But, to that end, it is also very important
23 that when we engage in our dialogue during the Question
24 and Answer sessions, and then those that are
25 presenting, that everybody identify themselves so that
10TH CONFERENCE OF AIR QUALITY MODELS 03/13/2012 CCR#16766-1 4
1 that can go on the transcription.
2 So, I will do that now. My name is
3 George Bridgers. I am with the Office of Air Quality
4 Planning and Standards here at EPA, and I will have
5 more about myself later. We have an extremely full
6 schedule, and that is why at 8:30 I wanted to go ahead
7 and "crack the whip" and let us get started. I would
8 not trust the clocks in the room. Some have been set
9 for Daylight saving time and some have not. So, trust
10 the watch that is on your arm or just follow everybody.
11 And the other thing is that we are going to ask that
12 all of the speakers -- I know that some of these
13 presentations are ten minutes, some of these
14 presentations are fifteen minutes, and it is a very
15 tight schedule. So, we are going to go ahead and thank
16 everybody up front for being conscientious of the time
17 and being respectful for the other speakers that are on
18 the agenda.
19 Also, I want to make sure that everybody
20 is aware of the security protocols . I know that there
21 was some confusion coming through the metal detector
22 this morning. Some people got through the metal
23 detectors, some got to bypass the metal detector -- the
24 rule of thumb is if the guard with the gun says "go
25 through the metal detector," go through the metal

10TH CONFERENCE OF AIR QUALITY MODELS 03/13/2012 CCR#16766-1 5
1 detector. I will try to get some clarity over the next
2 day whether we can bypass that or not, but typically,
3 everybody has to go through that level of screening.
4 The other thing is this is a secure campus. And so,
5 outside of the common areas of this foyer, the
6 bathrooms, and the Lakeside Cafe, you need an escort.
7 So, if you want to go visit some friends in other parts
8 of the "C" building or any other part of the campus,
9 you will need somebody to escort you, and thank you for
10 understanding that.
11 Since we have such a large crowd, I also
12 want to just do a real quick briefing on emergencies.
13 The exits are all around, but primarily, the exits to
14 your right will take you out of the building either to
15 the lake or up the steps back out to which you came in
16 this morning. If there is a campus emergency, or if
17 you have an emergency, "911" on the campus is "1-2900"
18 on any telephone that you find. Most of them actually
19 have on the handset have "1-2900." And that will get
20 the guard desk and then they can further call "911"or
21 what not, but normally, the EPA folks will handle that.
22 If an evacuation order is given, it is probably not
23 going to happen -- but if it is, the small visitor
24 parking lot where we all -- where you came in up at the
25 top of the stairs, that is our evacuation point. So,

10TH CONFERENCE OF AIR QUALITY MODELS 03/13/2012 CCR#16766-1 6
1 thank you for listening to that.
2 We are going to try to have a break
3 every hour and a half to two hours, but you are more
4 than welcome to get up if you need to, to have a bio
5 break. For those that don't -- haven't found it yet,
6 the bathrooms -- if you go out in the foyer, go across
7 the foyer, not into the Lakeside Cafe -- the bathrooms
8 are just before the elevators. And for lunch -- if you
9 would like to leave the campus, you are more than
10 welcome to. You are not going to make it back in an
11 hour -- I can guarantee you that. So, we do have a
12 Cafe that -- and I am not trying to promote the Cafe,
13 it is there. You can also bring your lunch. Oh, it is
14 kind of late for those that are here now -- to bring
15 your lunch. But for tomorrow, if you wanted to bring
16 something, you can eat in the cafeteria without having
17 to pay for it. And, they have breakfast and coffee in
18 the morning, and then after we get through the lunch
19 time span, I think the cafeteria stays open in some
20 capacity through the afternoon if you need a granola
21 bar or something of the like.
22 So, without further ado, I want to turn
23 the mike over to our Key Note this morning, to Mr. Chet
24 Wayland.
25 MR. WAYLAND: Thanks, George, and good

10TH CONFERENCE OF AIR QUALITY MODELS 03/13/2012 CCR#16766-1 7
1 morning to everyone and welcome to North Carolina for
2 those of you coming from out of town and the 10th
3 Conference on Air Quality Models. I am Chet Wayland,
4 and I am the Director of the Air Quality Assessment
5 Division here at OAQPS, and I am really pleased to
6 welcome all of you here today to the conference. While
7 we are required to hold this conference by the "Clean
8 Air Act," it is something that the Act says we have to
9 do every three years, it has historically become a
10 great venue for us to share technical information and
11 to gather with peers and others across the country to
12 talk about Air Quality Modeling. And I think this
13 year's conference will be, you know, no exception to
14 what we have seen in the past.
15 Dispersion Modeling is a key component
16 of EPA's regulatory program, and it has been used
17 successfully for many years in the PSD program, as well
18 as in the NAAQS SIP world. With recent changes to the
19 NAAQS for NO2 and SO2, the tools we have used
20 historically are becoming even more critical to the Air
21 Quality Management program. I think this conference
22 comes at an ideal time, and I think you all agree for
23 EPA, states, locals, and tribes and industry to come
24 together and talk about the uses and benefits of these
25 models.
10TH CONFERENCE OF AIR QUALITY MODELS 03/13/2012 CCR#16766-1 8
1 Science doesn't stand still. Science
2 moves forward and as sciences move forward, the models
3 we have today are much more sophisticated and can
4 simulate the real atmosphere in a better fashion than
5 many of the more simplistic models we had years ago.
6 With that sophistication also comes a challenge. It
7 has become more and more important for those using
8 these models to fully understand and appreciate the
9 sophistication of these tools and fully understand the
10 implications of the inputs to these models, their
11 formulation and parameterization and the best way to
12 apply these models. Improved knowledge over the years
13 along with better technology has yielded better models
14 for today. That does not mean that we still do not
15 face challenges, because we do. Just as with modeling
16 science, our understanding of the impacts of the air
17 quality on human health also moves forward, leading to
18 review of our air quality standards. Clean Air Act says
19 we should look at these standards every five years.
20 Historically, we have not always done that for many of
21 these, but through legal challenges, we have been
22 required to do that now, and I think the saying goes
23 right now -- it is all NAAQS all the time around EPA
24 because we really are looking at six and seven
25 standards all at the same time right now. But as these

10TH CONFERENCE OF AIR QUALITY MODELS 03/13/2012 CCR#16766-1 9
1 air quality standards change, we must continue to make
2 sure our models support implementation of those
3 standards. As we better understand the health impacts
4 from air pollution, we must also better understand how
5 models simulate air pollution and the range that these
6 health effects are witnessed. That is how we will
7 continue to move forward and protecting public health,
8 and that is really the great benefit of this conference
9 -- is looking at the tools that we have, how they are
10 used to actually protect public health that comes from
11 the setting of the NAAQS.
12 This conference provides the modeling
13 community at large an opportunity to come together on a
14 regular basis and share information that will continue
15 to lead to improve models and improve guidance on how
16 these models can be used in the regulatory and non-
17 regulatory arena. Now, obviously, it takes a lot of
18 work to put together a conference like this, and so at
19 this time I would like to acknowledge the EPA Modelers
20 from OAQPS, whose hard work and new guidance and model
21 updates will be discussed at length during this
22 conference. Roger Brode -- if you could wave your hand
23 there -- James Thurman, you've already met George
24 Bridgers. George just joined us a year ago as our
25 Model Clearinghouse Director, and we also have a new

10TH CONFERENCE OF AIR QUALITY MODELS 03/13/2012 CCR#16766-1 10
1 employee, Chris Owen, who just joined us yesterday.
2 So, what a great way to introduce him to the Modeling
3 community. So, I really appreciate all of the efforts
4 that they have done to plan for this conference. We
5 have got a record turnout, and I think that the prep
6 that they have done to get the presentations together
7 and get the agenda put together has just been
8 fantastic. So, I really appreciate their efforts, and
9 Chris welcome aboard -- I'm really glad to have you
10 here as well.
11 But, we have also benefitted greatly
12 from our EPA Regional Modelers and if there are any of
13 the EPA Regional Modelers, if they could please stand
14 just to -- so they could be recognized that are here
15 today. Great, thank you guys -- it has been a nice
16 team effort across the EPA from within Headquarters and
17 the Regions working on many of these things to get
18 ready for this conference. But, lastly, we have also
19 greatly benefitted by working with our state, local and
20 tribal agency modelers, so, those of you that are
21 representing state, local or tribal agencies, if you
22 could please stand as well -- don't be shy. Great,
23 thank you guys very much for all of your efforts as
24 well. I think the community owes a great deal to these
25 folks, as they have worked hard -- especially over the

10TH CONFERENCE OF AIR QUALITY MODELS 03/13/2012 CCR#16766-1 11
1 past few years, and we know that our future success
2 will depend upon our continued close communication,
3 coordination, and collaboration across Federal, State,
4 Local and tribal agencies.
5 However, it doesn't stop there. We have
6 also taken steps to work closer with other stakeholders
7 and, in particular, established a technical work group
8 to assist the EPA in the development of the conference
9 agenda and identify speakers and panelists. We look
10 forward to continue to use this work group as an
11 important avenue for communication, coordination of our
12 activities, and follow up to the conference, and
13 collaborations where appropriate and mutually
14 beneficial. We obviously can't do it all ourselves, so
15 we greatly value the time and contributions of these
16 work group members and look forward to continued
17 interactions moving beyond this conference. It is
18 wonderful to have over 250 people registered for this
19 conference and here today. It truly shows the level of
20 interest in this topic. I hope the next three days
21 will be enlightening for all of you, as I am sure it
22 will be for me. The talent of the participants ensures
23 that there will be many strong opinions and lively
24 debate. I hope everyone will be respectful of each
25 other's opinions and will look at this conference as an
10TH CONFERENCE OF AIR QUALITY MODELS 03/13/2012 CCR#16766-1 12
1 opportunity for the Regulatory Modeling Community to
2 work together to help address what are challenging
3 issues. This has always held true in the past
4 conferences, and I am confident that it will hold true
5 again this year.
6 Thank you all for being here. I look
7 forward to the many presentations to come and for the
8 positive dialogue that will follow. And remember, by
9 being here, you do make a difference -- because if you
10 are not here, your opinions would not be heard, and we
11 greatly appreciate you being here. Gathering
12 information and learning from that information is how
13 we will all move forward and face these challenges.
14 Let's move forward together during this conference, and
15 with a commitment to continue the interactions and
16 dialogue afterwards -- to then realize the necessary
17 improvements in our models and guidance. And I just
18 want to add one thing at the end, this has been an
19 incredibly challenging time period for all of us in the
20 modeling community. We have been faced with new
21 challenges of tighter standards, using models sometimes
22 in ways that, you know, they have not been used in the
23 past, more sophistication than we have had in the past
24 -- I have been really impressed with the cooperation
25 across all sectors of people here today. We have had

10TH CONFERENCE OF AIR QUALITY MODELS 03/13/2012 CCR#16766-1 13
1 state, local, tribal agencies working with the EPA. We
2 have had many of our industry partners to come in here
3 on separate occasions and work with us on specific
4 issues. We have tried to address as many of those
5 issues as we can. We have put out guidance where we
6 could to try to alleviate some of the challenges that
7 have, you know, come to us -- however, we know there is
8 still a lot of other things to do -- a lot more
9 challenges out there. I am really personally looking
10 forward to this. I am glad you all are here. I think
11 it is a great opportunity for us at EPA to hear what
12 some of the concerns are that you have, for you to hear
13 some of the things that we have to share, and know
14 about where we are today, and where we need to go in
15 the future.
16 So, I hope this will be a very open
17 dialogue and a very positive dialogue with everyone
18 here. You know, if you want to grab people in the
19 hallways at breaks and at lunch, please do so. We are
20 here to listen as well as to present. So, I am really,
21 really thrilled to have this many people here and this
22 opportunity.
23 Janet McCabe, our Assistant Deputy
24 Administrative for Air will be here on Wednesday, not
25 for the conference, but for some other things. I am

10TH CONFERENCE OF AIR QUALITY MODELS 03/13/2012 CCR#16766-1 14
1 hopeful maybe she can slide in and hear a little bit of
2 the presentations on Wednesday if her schedule allows.
3 She has got a full schedule down here for other
4 meetings, but I am really hopeful and she is
5 interested, if possible, to slide in and listen to some
6 of this as well. From her standpoint and from Gina
7 McCarthy's standpoint, I wanted to relay that they are
8 aware of the many challenges that folks are facing with
9 the new standards and some of the modeling issues that
10 you guys have been talking about for the last several
11 months and, trust me, they are with us as we try to
12 work through these together. So, thank you very much
13 for being here. I look forward to a very positive and
14 enjoyable conference. And if there is anything I can
15 do for any of you during the next three days, please
16 don't hesitate to let me know. Thank you very much.
17 MR. FOX: Well, I would like to add my
18 welcome to all of you. Thanks for traveling here to
19 North Carolina to join us for this 10th Modeling
20 Conference. Our group has become one of the most
21 popular groups here at EPA, and this is evidenced by
22 all of you attending here, and all of the visits that
23 we get by various folks since we have been facing a
24 number of challenges with new NAAQS and new models and
25 the like -- so, what I would like to do is start off in

10TH CONFERENCE OF AIR QUALITY MODELS 03/13/2012 CCR#16766-1 15
1 terms of an update and status of Appendix W by going
2 back to my first modeling conference, which was the 8th
3 Modeling conference back in 2005.
4 At the time, we were awaiting the
5 promulgation of AERMOD. I think at the time I said
6 "let's pretend as if it is already promulgated." Some
7 of you were a little suspicious of that but, within a
8 month later, we actually did promulgate AERMOD and get
9 it out there, and it became full use for permit
10 modeling and the like. We were only two years removed
11 from the promulgation of CALPUFF in 2003. So, what we
12 needed to do was within the group, come up with a
13 vision that would move us forward in terms of
14 addressing the challenges that we faced -- at least at
15 that time, and to provide four essential elements
16 related to achieving that vision. And so, I would like
17 to go back to that vision and those elements here this
18 morning to see how far we have come since 2005 but,
19 more importantly, highlight that we still have a lot of
20 work to do and as Chet said, this conference is where
21 we will begin that work in terms of engaging with you
22 all and defining that path to updating Appendix W for
23 the first time since we gathered back in 2005.
24 So, our vision was a simple one -- to
25 lead and promote collaborative efforts on near-field

10TH CONFERENCE OF AIR QUALITY MODELS 03/13/2012 CCR#16766-1 16
1 air quality modeling and to improve source culpability
2 assessments. At the time, we were introducing two next
3 generation models as I mentioned both AERMOD and
4 CALPUFF, and we were just beginning to learn about the
5 challenges in implementing those models in the permit
6 process as well as SIP provisions and the light. And
7 also at the time, we had absolutely no idea of what the
8 changes were in store for us in the coming years in
9 terms of NAAQS revisions -- both the 1-hour NO2 and SO2
10 NAAQS or related policy changes in terms of moving away
11 from the PM10 surrogacy policy and needing to
12 explicitly address PM2.5 and permitting.
13 So, our first essential element was to
14 foster a collaborative environment aimed at
15 strengthening our technical expertise and working
16 relationships across the EPA, other Federal agencies,
17 and the scientific community to regain our leadership
18 role and promote the use of best science and evaluation
19 methods. In doing that, we have strengthened the Model
20 Clearinghouse, which at the time had really got to a
21 point of not being supported as it should. ISC and
22 other questions related to our legacy models had
23 largely been addressed, but we realized that with the
24 new models we needed to have a strong presence in
25 engaging with the regions, the state and local

10TH CONFERENCE OF AIR QUALITY MODELS 03/13/2012 CCR#16766-1 17
1 agencies, and we now have George Bridgers, who joined
2 us last year, to man that Clearinghouse and to
3 effectively work with the states and local agencies as
4 well as the regions on a case-by-case basis. He also
5 promotes more regular interaction, to get heads up on
6 issues, sooner rather than later, which is always
7 beneficial -- and, hopefully, then to avoid situations
8 at the eleventh hour that we have to deal with on a
9 permitting situation.
10 We also established and effectively
11 utilized the AERMOD implementation work group. First,
12 with Al Cimorelli leading us, then with Randy Robinson,
13 and now under the leadership of James Thurman and Erik
14 Snyder, who you will hear later tomorrow, about the
15 efforts to gather the regional offices, state and local
16 modelers and evaluate the current guidance and maybe
17 potential changes in that guidance under the new 1-hour
18 standards. We also collaborated with the Office of
19 Transportation Air Quality on their hot spot PM2.5
20 modeling guidance for conformity and Meg Patulski will
21 be joining us in talking about that later today. We
22 also continued our collaborations and strong
23 relationships with the Federal Land Managers, including
24 our joint work on evaluating long-range transport
25 models, chemistry models, and last year signing a

10TH CONFERENCE OF AIR QUALITY MODELS 03/13/2012 CCR#16766-1 18
1 Memorandum of Understanding between EPA, Department of
2 Interior, and the U.S. Department of Agriculture on
3 NEPA analyses.
4 We have continued to try and engage with
5 the scientific community. The past two years we have
6 been active participants in the Harmonization
7 Conference in Europe, to engage with modelers there,
8 and to compare notes -- if you will, in terms of their
9 experiences and ours. And, we continue to attend
10 specialty conference sponsored by AWMA and others to
11 try and engage directly and in more depth on these
12 issues. And then finally, at last year's Regional
13 State Local Modeler's Workshop for the first time in 30
14 years, we extended that workshop to an additional day
15 and had private sector participation, and thought that
16 was a very useful and valuable exercise -- both for us
17 to communicate where we were going and what we were
18 seeing, and to receive information from the community
19 at large. And I hope that we can continue that into
20 the future.
21 The second element was to promote and
22 facilitate the use of gridded meteorological data,
23 including state of the practice National Weather
24 Service Meteorological Analyses, to improve modeling
25 science and performance for near-field modeling
10TH CONFERENCE OF AIR QUALITY MODELS 03/13/2012 CCR#16766-1 19
1 applications for permits, toxics and direct PM. So
2 after years of development and testing with the Federal
3 Land managers, we released a beta version of the
4 mesoscale model interface program, MMIF, just prior to
5 this conference -- and, in fact, got a number of
6 comments within the first couple of days in terms of
7 bug fixes and the like, and we greatly appreciate that,
8 and expected that that would happen. And that tool
9 specifically allows for the direct feeding of MM5 or
10 WRF meteorological data into CALPUFF, AERMOD, and
11 SCICHEM. Therefore, helping us move forward in our
12 evaluation of those models and for potential use in the
13 future in terms of permitting, and that would need to
14 be associated -- come with some guidance and the like.
15 So, we look forward to comments and input on that.
16 As part of that release, we also
17 provided the MMIFSTAT program to facilitate evaluation
18 of those meteorological data prior to feeding the Air
19 Quality model, which we feel is a critical aspect of
20 what we do and what we need to do as a community. And
21 we have also developed and improved the AERSURFACE and
22 AERMINUTE modules to facilitate use of representative
23 met data in the AERMOD modeling system.
24 The third essential element was to
25 promote continual development of appropriate model
10TH CONFERENCE OF AIR QUALITY MODELS 03/13/2012 CCR#16766-1 20
1 evaluation methods to evaluate areas of improvement in
2 our modeling system including emissions and met inputs,
3 as well as the science in terms of the formulation of
4 the model, to prioritize the research agenda across the
5 modeling community and, ultimately, to improve the
6 model performance and critical policy in science areas.
7 Obviously, with the new challenges of 1- hour NO2 and
8 SO2, this is very relevant and important, as well as
9 for PM2.5. And we have made a number of attempts to
10 align our model evaluation methods with the use of
11 those models in the regulatory and even non-regulatory
12 aspects following a "fit for purpose" paradigm, if you
13 will. That is expected to improve the performance
14 evaluations that we rely upon, and give people more
15 confidence in terms of the use of those models in the
16 various applications that we have, and to base those
17 methods on proven techniques and approaches that are
18 out there in the community -- those that have been used
19 in the SIP modeling community with photochemical
20 regional models, as well as peer reviewed literature
21 and the like. And you will see a number of discussions
22 about that throughout this conference.
23 The fourth essential element was to
24 promote a community approach to model development and
25 acceptance. The champions that use the best science

10TH CONFERENCE OF AIR QUALITY MODELS 03/13/2012 CCR#16766-1 21
1 supports continual improvement in the modeling science
2 and data, and timely model acceptance for use in the
3 regulatory arena. We have made a number of attempts to
4 improve upon this. We have developed tools to
5 streamline the approach to updating the models to
6 address bug fixes and the like -- that is evidenced by
7 the CALPUFF update tool. We have also continued to
8 provide evaluations support for updates to AERMOD --
9 most recently, when we issued clarification memos under
10 the 1-hour NO2 and SO2 NAAQS. We revisited the
11 evaluations and reported those evaluations for the 1-
12 hour time step in terms of AERMOD to hopefully support
13 and justify the continued use in that context. But we
14 recognize that we need to continue to improve those
15 methods as we get more challenges in terms of the NAAQS
16 and the situations that you all deal with on a day-to-
17 day basis that challenge our models. We also look
18 forward to working with the model developers and
19 addressing these issues to give greater confidence in
20 these models, and to extend their use to the needs that
21 we have. And we will talk about those needs, and we
22 will talk about the emerging models and techniques
23 tomorrow. And a number of those techniques are already
24 in practice, and we need to better understand those and
25 learn from those applications. And some of those

10TH CONFERENCE OF AIR QUALITY MODELS 03/13/2012 CCR#16766-1 22
1 models are in need of improvement, and we need to work
2 with the science community and the research community
3 to give us those important and critical inputs.
4 We also have been striving to provide
5 these in a timely manner and in a fully transparent
6 manner for review. We do ask that there be respect to
7 the process that we have to go through in conducting
8 those assessments and putting those out there, but we
9 have worked very hard to put those out in terms of
10 conferences, the workshops and conferences that we
11 host, the specialty conferences or other types of
12 conferences that we attend and the like. And then,
13 ultimately, providing EPA reports and peer reviewed
14 articles as necessary.
15 So, change is afoot, and we -- we
16 basically formally begin that with this conference.
17 There is a lot of work that we have done leading up to
18 this conference that you will see in the presentations
19 today and tomorrow. We look forward to the input from
20 the community. On Thursday, we have expanded that to be
21 a full day in anticipation of increased attendance and
22 interest in what we are doing but, suffice it to say,
23 we will be focusing on the current status and updates
24 to our current suite of regulatory models and evaluate
25 the needs there that can be done both in the near term

10TH CONFERENCE OF AIR QUALITY MODELS 03/13/2012 CCR#16766-1 23
1 through guidance or the longer term in terms of
2 updating Appendix W more formally. The permit modeling
3 of PM2.5, now that we are in a post-PM10 surrogacy
4 policy era, and the issues that we need to address
5 there. The challenges, as Chet mentioned, we all know
6 very well of modeling and demonstrating compliance of
7 the new 1-hour NO2 and SO2 NAAQS, and the emerging
8 models and techniques to account for chemistry for both
9 long-range transport as well as ozone and PM2.5 impacts
10 as we have made a commitment formally through Gina
11 McCarthy, to move forward on that approach in granting
12 the Sierra Club petition, and we will be going into
13 that in more detail tomorrow as well.
14 So, with that, I will turn the mike over
15 to, I believe, George for the Clearinghouse update and
16 again, appreciate all of the active participation that
17 we will be getting in the coming days and as Chet
18 said,.we are very excited to have all of you here, and
19 don't hesitate to pull us aside to ask any questions
20 throughout the conference. Thank you.
21 MR. BRIDGERS: Thanks, Tyler. Once
22 again, since this is being recorded, I am George
23 Bridgers. Tyler actually hit on several of the points
24 that I was going to make, so I can probably just yield
25 my time to Roger. Roger has got a presentation with

10TH CONFERENCE OF AIR QUALITY MODELS 03/13/2012 CCR#16766-1 24
1 what, 180 slides or whatever it is coming up -- so you
2 all didn't really come to hear me talk, but real quick.
3 Tyler hit on the point that over the
4 past -- this actually goes back to the 9th Modeling
5 Conference -- maybe slightly before. The OAQPS, there
6 is throughout the Agency, there has been a realization
7 that the Model Clearinghouse needed to be revitalized.
8 Tyler hit on a point that there is a flurry through the
9 years of activity in the Clearinghouse with ISC and
10 then we get, you know, to a steady state to where
11 things are running along pretty well. The importance
12 of the Clearinghouse is somewhat diminished and when
13 the light is not focused, you know, the resources get
14 shifted around. Then we had the promulgation of
15 CALPUFF and AERMOD, and all of a sudden we have got a
16 whole new suite of issues and, more recently, we have
17 had the revision of the 1-hour NO2 NAAQS, and that has
18 further put a stress or put a point of emphasis on the
19 need for coordination -- and detailed coordination
20 between the regional offices and the program office
21 here. So, I am not going to read all of the things in
22 the slides. It will be part of the record, I kind of
23 hit the high points.
24 Just a little bit about me -- My
25 pedigree, I spent 12 years with the State of North
10TH CONFERENCE OF AIR QUALITY MODELS 03/13/2012 CCR#16766-1 25
1 Carolina -- a little over 12 years sort of was a "Jack
2 of all trades." I started in the Ambient Monitoring
3 Program putting out PM2.5 monitors in 1998, back when
4 we were starting that whole program. I have spent a
5 great deal of my time on the SIP and photochemical
6 modeling side of the regulatory house. So, the
7 dispersion aspect of my job -- I left to some other
8 friends that are actually in the room, in Jim Roller's
9 group with the State but, nonetheless, I was very
10 connected with what was going on there. I did quite a
11 bit of public speaking through the public hearings and
12 what not, and fortunately, had the opportunity to play
13 with a bunch of toys like SYSADMIN from our LINUX
14 class. Last year we have got some radar profilers that
15 I was operating, so that was the fun part of the job.
16 And then I landed at the Clearinghouse and so where it
17 says, "effective January 3rd," that was my start date.
18 It took a little bit to -- just to kind of get into the
19 groove, and there was an e-mail or a memo that went out
20 to all of the regional offices in April -- but I had
21 already then been quite a bit in coordination and
22 context with the regional offices at that point leading
23 up to our regional, state and local modeler's workshop
24 last year.
25 So really quickly, what is the Model

10TH CONFERENCE OF AIR QUALITY MODELS 03/13/2012 CCR#16766-1 26
1 Clearinghouse? It could be interpreted in a bunch of
2 different ways, but it's a process as much as it is a
3 person, as it is an activity within the Agency to which
4 we honestly are looking for national consistency on a
5 variety of issues. An issue pops up in a region with a
6 particular application and we have a process that is
7 now -- that has been in place for years and years and
8 years, and we are refocusing on to try to resolve some
9 of these issues in a way that is consistent across the
10 country. There is statutory authority. It is written
11 in the Appendix W and this is closely associated with
12 the consultation process that is in Appendix W. Like I
13 said, really the stride that I have is to promote this
14 national consistency. And I am not trying to use words
15 that are oxymoronic, like urban planning and no offense
16 to people that are in that realm, but just as a funny -
17 - timely, okay -- and again, I said I wasn't going to
18 joke -- but timely interpretation of guidance, I know
19 that there are issues that some have had in the past
20 with the word "timely" but there again, I will talk
21 about the process in a minute. When the process is
22 honored, then the timely factor actually can come into
23 play. It minimizes bad press to be right honest with
24 you. It helps us not have mud in our eye, where we
25 have got something going on in one part of the country

10TH CONFERENCE OF AIR QUALITY MODELS 03/13/2012 CCR#16766-1 27
1 that is uniquely different than something that is going
2 on in the other part of the country, and they are the
3 same issue. And so that is really what my goal is --
4 is to get everybody talking, and get everybody
5 coordinating internally. The Clearinghouse to me is
6 not just this act of the region, requesting something
7 of the program office and giving a response. It is
8 making sure that on a day-to-day, a week-to-week, a
9 month-to-month process that we are talking -- and that
10 we are getting together not so much at this particular
11 meeting, but at other meetings and other contexts to
12 make sure that we are all on the same page. And,
13 obviously, this is -- my wife loved this statement,
14 "the Clarification Memorandum and Guidance Development
15 through consensus building." So we're, you know, the
16 team effort.
17 So far as you know, when we we look at
18 internally, as things come to the Clearinghouse, if
19 they are technical issues, I will work with the
20 internal staff of the Air Quality Modeling Group. If
21 there are particular issues that come to us that look
22 like -- and this is actually often is the case --
23 things that come to us that have the appearance they
24 are a technical issue, but it is a policy call, it has
25 something to do with ambient air, for example, then I

10TH CONFERENCE OF AIR QUALITY MODELS 03/13/2012 CCR#16766-1 28
1 will work very closely with the New Source Review Group
2 and other people within the Policy Division -- so just
3 that we can try to get resolution with the regional
4 office and then back to the applicant, and there may be
5 other things that we need to elevate and have OGC, the
6 Office of General Counsel, look at -- basically, the
7 lawyers to approve.
8 But, let's talk about the process
9 because this so often in the past has gotten
10 circumvented -- where there is this thought that
11 people come straight in contact with the program office
12 and that -- because they have an issue. And I can
13 speak from being with the state of North Carolina,
14 OAQPS was just across, you know, town -- it was just
15 out here, it was easy to pick up the phone and talk to
16 people in the Agency, and Region IV, at least in my
17 case, often got circumvented. So this is where the
18 state really needs to be talking with the region. If
19 that communication isn't there, there is a problem.
20 So, the state is in coordination with the regional
21 office on particular permit applications, the applicant
22 is not directly talking with the regional office
23 without the state or local agency involved.
24 In the case of the Clearinghouse, the
25 regional office actually should go ahead and make some

10TH CONFERENCE OF AIR QUALITY MODELS 03/13/2012 CCR#16766-1 29
1 type of a determination -- that would be done in
2 coordination with us, but they are going to send us a
3 very formal memo that has the statement of the issue,
4 they are going to have the desired approach that this
5 is -- you know, from the regional office's perspective
6 and the justification for it. And then we are going to
7 take and evaluate that, and then like I said earlier,
8 if we need to talk with the policy group, or OGC, or
9 what not, that we will work on that and then we will
10 summarize in a response back to the region and then,
11 ultimately, to the applicant.
12 There is a couple of points down here
13 that we are trying to do, and I'll have a slide on it
14 in a few minutes about MCHISRS to make the decisions
15 that are made with them, and the recommendations that
16 are sent to the Clearinghouse, and the decisions that
17 are made back to the regions. Such that they are
18 available to everybody and that is through this MCHISRS
19 database. We also do report outs at the regional, state
20 and local modeler's workshop and as Tyler had mentioned
21 a few minutes ago, last year was the first year that we
22 actually had a public session invited for the people
23 from the industry, the trade groups and what not -- to
24 come in, and we hope to do that again in the future,
25 although, the conference that we have got coming up

10TH CONFERENCE OF AIR QUALITY MODELS 03/13/2012 CCR#16766-1 30
1 this year is a week-long one -- the workshop in
2 Chicago. So, not this year, but we will look to do it
3 again next year. And, sometime, I will write an annual
4 report, and that is overdue -- And like I said
5 before, that if we need to go to through the policy
6 group to develop additional memorandas or
7 clarifications, we will do so, or ourselves -- we may
8 issue clarification guidance that Roger will talk a lot
9 about that in a minute.
10 I think Tyler already hit the points on
11 this slide that again, that the importance of the
12 Clearinghouse has been raised again with the
13 promulgation of these new two models -- or now, not so
14 new models. But, I wanted to point out on this slide
15 at the bottom on the protocol and this comes back to
16 the consultation -- there needs to be good
17 consultation between the applicant, state and local
18 agency and the regional office because that gives the
19 regional office the opportunity to review the modeling
20 protocol and to foresee issues ahead of schedule. This
21 is that "getting out ahead of time" and I know that
22 there is some angst out there between the state and
23 locals and regions, and that is something that we as
24 the community definitely have to work on. But when
25 protocols are submitted to the regional office and when
10TH CONFERENCE OF AIR QUALITY MODELS 03/13/2012 CCR#16766-1 31
1 the regional office reviews them, these issues should
2 come to light and, with my coordination with them, then
3 that should come back to this timely aspect of it.
4 And, this was just some points again about the
5 respecting the roles -- I won't read down those. They
6 are in for the record.
7 That is -- in the interest of time, I
8 just want to jump right ahead. These are the
9 Clearinghouse Actions, the formal actions that have
10 occurred since the 9th Modeling Conference, and there's
11 five of them. Three of them are somewhat related --
12 the AERMOD ones, a CALPUFF and one is otherwise. The
13 first -- this was right out of the bat, this was 2009,
14 this was in Region 8. We had a request that came in
15 about certain aspects of a BART analysis, and I won't
16 read through all of the specifics, you have got it
17 there in front of you, but in general, we concurred
18 with the regional office here about an issue with the
19 use of one kilometer grid resolution -- it not being
20 adequately justified in what had been submitted.
21 We also concurred here that the blending
22 of the National Weather Service observations with
23 prognostic model data is the most technically sound
24 approach for developing met fields for the application
25 within CALPUFF. There was another issue there that we
10TH CONFERENCE OF AIR QUALITY MODELS 03/13/2012 CCR#16766-1 32
1 deferred back to the regional office and to the Federal
2 Land Managers with respect to post-processing. It was
3 from this Region 8 CALPUFF, with respect to BART
4 response, that we actually went further. I think Bret
5 Anderson is in the room, there is a few others that
6 were involved in this -- that there was some
7 recommendations that were then made in response to the
8 IWAQM Phase 2 recommendations, and there was another
9 document -- there was a reassessment document that is
10 posted on SCRAM that was written very shortly after
11 that action.
12 I didn't see Stan this morning, Stan
13 Krivo, but if he is in the room, he gets the honor of
14 having the actual first official Model Clearinghouse
15 activity with respect to AERMOD. And this one actually
16 had to do with one of the pre-processors to AERMOD that
17 had to with some issues with surface roughness. The
18 regional office actually was seeking a review of a
19 situation in concurrence on their determination of use
20 of a non-default radius for surface reference
21 determination. We responded with a disagreement at
22 least on their determination of this technical
23 justification for something other than one kilometer.
24 And it was through this and I defer to Roger Brode to
25 talk in great length about the issues with AERSURFACE

10TH CONFERENCE OF AIR QUALITY MODELS 03/13/2012 CCR#16766-1 33
1 and the surface roughness estimates and then at this
2 time was introduced this gust factor method, that was
3 introduced as a way of helping collaborate the surface
4 roughness in this case. And I think that is all I have
5 got to say on that.
6 Region 6, followed up -- this was in
7 2010, this was an issue with respect to PM2.5
8 compliance that we will talk about later in the
9 conference. Here the issue was with an application,
10 modeling demonstration down in Louisiana. The regional
11 office in this case had actually already seen the
12 protocol. There's some issues on timing here but,
13 nonetheless, when we saw the Clearinghouse request,
14 with respect to a couple of different issues, we
15 concurred on one and we had to disagree on another.
16 The concurrence was with respect to the monitoring site
17 that was determined for the background concentrations
18 and then the disagreement -- and this actually became
19 an issue that was further explained in the Page
20 memorandum -- the March 23, 2010 Page memorandum that
21 is the standing PM2.5 Modeling Guidance, is that the
22 use of the 8th highest modeled 24-hour, is not
23 appropriate. We were recommending -- at that time we
24 recommended and continue to recommend that you should
25 average the highest model concentrations across the

10TH CONFERENCE OF AIR QUALITY MODELS 03/13/2012 CCR#16766-1 34
1 five years. At least -- for your cumulative impact
2 assessment -- and that is what this slide actually goes
3 into much greater detail. And there is a caveat at the
4 bottom, and I won't read it. It has to do with the
5 aspects of -- just because we are talking about five
6 years of modeling data, does not to be confused with
7 the three-year averaging period for the design value.
8 More recently, and this comes up under
9 my peer view, this was after I had come in as the Model
10 Clearinghouse Director, we had two different issues.
11 This one was earlier in the year, this had to do with
12 Offshore Continental Shelf drilling in the Region 10
13 region, and -- kudos to Region 10 for sending us a very
14 well prepared package with respect to the COARE
15 algorithm being added in to AERMOD as an alternative
16 model. It made my first Clearinghouse action -- I
17 won't say easy, but it made it at least the steps of it
18 a lot less complicated than it had to be. But,
19 nonetheless, you've got this coupled ocean atmospheric
20 response experiment or the core flux algorithm. The
21 response here, though, was to very specific application
22 in the Beaufort and Chukchi Seas of the Arctic Ocean,
23 but it wasn't -- as we issued this clarification back
24 to the regional office, it wasn't to be that this can
25 only be applied in these seas, but it was that if you
10TH CONFERENCE OF AIR QUALITY MODELS 03/13/2012 CCR#16766-1 35
1 had a similar application in a different part of the
2 world -- or the domestic United States, that you could
3 use this algorithm, but you needed to engage with the
4 regional office early such that they could have in
5 coordination with us a decision.
6 So, that was more recent, and the most
7 recent -- and this is the one that -- and Roger, you
8 are going to -- we are going to have more discussion on
9 this as we go along, but this is the one that probably
10 has the most implications to this room right now, and
11 this had to do with an Alcoa facility in Iowa, and in
12 this case there was an issue with the fluid modeling or
13 the wind tunnel derived equivalent building dimensions
14 that were to be used in BPIPPRM . In this case, there
15 was a variety of issues that were elevated to us from
16 the regional office, and this is one that there had
17 been -- there is a long history. It predates me --
18 that is fine, I am now part of the Agency, so it dates
19 me here. But, nonetheless, there was a lot of
20 consultation back and forth to the regional office. We
21 had a lot of discussions with them, with the contractor
22 and with the facility. In the end, we agreed with the
23 assessment of the regional office that there had been
24 an insufficient technical justification for the use of
25 these particular EBDs. In particular, there were some
10TH CONFERENCE OF AIR QUALITY MODELS 03/13/2012 CCR#16766-1 36
1 flaws as we saw it in the particular design of the wind
2 tunnel. Specifically, there was an addition of some
3 additional surface roughness elements to simulate the
4 actual facility in the EBD test. When the actual EBD
5 structure was put in, these additional surface
6 roughness elements were actually larger than the EBD
7 itself and that created quite a bit of a problem.
8 Also, there is an aspect, and this is
9 probably the most important aspect of this
10 Clearinghouse Action, is that we agreed with the
11 regional office that there is a host of technical
12 challenges that are right now have been introduced with
13 the promulgation of AERMOD. All of the previous
14 guidance, with regards to equivalent building
15 dimensions, had been done under a previous model such
16 as ISC. Through this action, we suspended, and this is
17 until further notice, all past, previous -- however you
18 want to say it, EPA guidance relating to the
19 determination of EBDs. Now I say that, there is a
20 caveat at the bottom -- this does not mean that it is
21 forbidden forever. It doesn't mean that someone can't
22 start a project right now with a wind tunnel to
23 determine EBDs for an application. But what it does
24 mean, back on this consultation side, is there needs to
25 be early engagement with model protocol, with the
10TH CONFERENCE OF AIR QUALITY MODELS 03/13/2012 CCR#16766-1 37
1 regional office, and then the regional office needs to
2 be in close coordination with us because we, as a
3 community, need to move forward on redeveloping the
4 guidance and making sure that these determinations for
5 EBDs are appropriate with the new internal structure of
6 AERMOD. Did I say that right, Roger? That is fine.
7 Real quick and then I will yield a bunch
8 of my time, not that I have a whole lot of time left,
9 to Roger and his 80 slides is MCHISRS, and this is not
10 a four-letter word for those in the room that have
11 tried to use it. It is actually -- we are trying to
12 improve MCHISRS. Through the years it was an internal
13 database that we -- a number of years ago made
14 available to the public. There is a variety of things
15 in MCHISRS. There's phone memos and there is a bunch
16 of informal information in there from years past
17 because it was an internal database tracking system.
18 What we are trying to do is clean it up, we are trying
19 to make sure that all of the records that are formal --
20 the ones that would have signatures on them, are
21 available in their PDF forum so you can actually see
22 the signature, and we are going to go back and make
23 sure with time, that all of the records that are there
24 are text searchable -- such that if you need to copy
25 and paste, it is not just an image file. So, we are

10TH CONFERENCE OF AIR QUALITY MODELS 03/13/2012 CCR#16766-1 38
1 working on that. Of the over 1,400 records that are in
2 MCHISRS, about 250 to 260 are formal ones where the
3 regional office had requested of us and we responded
4 back. And of those -- and this is very fluid, these
5 numbers, because we have been engaging with the
6 regional offices on these updates, we are now at about
7 somewhere between a half to two-thirds complete on
8 making sure that we've got the original -- not just a
9 text file, but the original signed copies. And for
10 those in the room, and it is not a misspelling at the
11 bottom, I was trying to be cute with the word
12 "sensitive", the search database now is case sensitive,
13 so you can type things upper case, lower case or
14 however you want to, and it should report back from the
15 record.
16 So, there is the link to the
17 Clearinghouse, my contact information, and the two
18 minutes that I have left, I am going to yield to Roger.
19 AUDIENCE MEMBER: Shouldn't it be case
20 insensitive?
21 GEORGE BRIDGERS: Yes, it is case
22 insensitive. Yes, sorry.
23 AUDIENCE MEMBER: We weren't trying to
24 make it more difficult for you --
25 GEORGE BRIDGERS: We were trying to make

10TH CONFERENCE OF AIR QUALITY MODELS 03/13/2012 CCR#16766-1 39
1 it more difficult, I can add that in right now.
2 ROGER BRODE: Good morning. I already am
3 going to yield some of my time in the next presentation
4 to this one, so I didn't really need that. But, yes,
5 as far as Stan bringing the first official Model
6 Clearinghouse action to AERMOD, I thought that was a
7 milestone and thought it might be appropriate to give
8 him some type of reward to acknowledge him for that,
9 but given the fact that we had to disagree with him, I
10 think that disqualified him for that particular
11 recognition.
12 So, clarification memo is going to --
13 some of this is a rehash that was already presented at
14 the last modeling conference, but it is good to remind
15 ourselves -- talk about the role of clarification
16 memoranda in general -- what process we go through here
17 when we feel the need to issue such memos, review some
18 of the Appendix W references to clarification and
19 consistency which sort of underpin the need for these
20 types of actions, and sort of briefly mentions the
21 clarification memos that have been issued since the
22 last modeling conference as well as discuss some
23 pending memos.
24 Once again, these memos address issues
25 that may arise from broad applications or broad
10TH CONFERENCE OF AIR QUALITY MODELS 03/13/2012 CCR#16766-1 40
1 implications. They don't come in the context of a
2 specific application. The formal Model Clearinghouse
3 process is what is set up to handle that and George
4 just summarized some of the recent cases that fit into
5 that mode, but this is more general -- may be in the
6 interactions with the regional offices or wherever --
7 we might get a sense that there is some issues in terms
8 of how guidance is being interpreted that need to be
9 clarified. And these service reminders and, again,
10 consistency is another important part of that -- to
11 foster national consistency in how Appendix W
12 recommendations are applied.
13 Once again, it might rise through the
14 normal process of interacting with the regional offices
15 or other assessments going on and also, more recently,
16 a couple of examples are in response to new or revised
17 NAAQS where -- from the standard change, some issues
18 come up in relation to that that need to be clarified,
19 and these memos go through a pretty good detail or
20 thorough internal review here through the Air Quality
21 Assessment Division, with Chet as Director. Sometimes
22 they may come from Chet as the Division Director. We
23 often coordinate with the Air Quality Policy Division
24 because there is certainly a lot of overlap in some of
25 the issues that we deal with on the technical side.

10TH CONFERENCE OF AIR QUALITY MODELS 03/13/2012 CCR#16766-1 41
1 You know, sometimes hard to distinguish between
2 technical versus policy -- that line is a little bit
3 blurry. And also, the Office of General Counsel, the
4 lawyers try to keep us out of trouble, though sometimes
5 we need to actually go as high as them to make sure we
6 are keeping them out of trouble -- or I don't know
7 which is it.
8 Anyway, we also give the EPA Regional
9 Office Modeling Contacts an opportunity to review the
10 memos before they are issued, so we are all on the same
11 page within that particular family. And they're issued
12 to EPA Regional Offices either through the modeling
13 contacts or the Air Division Directors, sort of
14 depending on the level of importance, or controversial
15 nature of it. Perhaps, it depends upon the scope of the
16 memo. So, these memos once they are finalized are
17 distributed to the committee -- a broader committee
18 through the SCRAM website. They will be identified
19 under the "recent additions" portion of that, but they
20 are also archived on a separate SCRAM webpage with the
21 link from the Permit Modeling Guidelines page. And
22 right now, we are taking action in addition to what
23 George mentioned about the formal Clearinghouse actions
24 that are documented in MCHISRS. We also are working to
25 try to incorporate these clarification memos in there

10TH CONFERENCE OF AIR QUALITY MODELS 03/13/2012 CCR#16766-1 42
1 to further facilitate public access.
2 So, this is one of the SCRAM webpages
3 down at the bottom under Appendix W guidance is a link
4 -- if you can see it, for clarification memos. This
5 lists the clarification memos that are posted there.
6 There have been quite a few since the last Modeling
7 Conference. But again, through a review of Appendix W
8 mentions several places about the importance of
9 consistency, the industry and control agencies both
10 agree on the need for consistency in application of
11 models for regulatory purposes. So, one of the reasons
12 we have the modeling conference is to facilitate that.
13 So, these opportunities for applications sometimes
14 result in revisions to the guidelines. So, to a
15 certain extent, the clarification memo may be
16 considered sort of a small step towards something that
17 might, ultimately, have to be formalized through rule
18 making in revision to Appendix W. At least it gives us
19 an opportunity to sort of clarify where we are now,
20 meet the current needs because rule making can be a
21 very lengthy process.
22 But, again, Appendix W makes -- several
23 points mention the role of the Model Clearinghouse in
24 terms of providing clarification, fostering consistency
25 and so on. So, here is a list of the clarification

10TH CONFERENCE OF AIR QUALITY MODELS 03/13/2012 CCR#16766-1 43
1 memos that have been issued since the 9th Modeling
2 Conference. A couple relate to CALPUFF in terms of the
3 recommended settings for CALMET. But three of them
4 relate to sort of new NAAQS. I mean PM2.5 NAAQS was
5 not new at the time, but I guess from our perspective
6 in terms of PSD permit modeling, it was sort of new
7 because we were still living under the PM10 surrogacy
8 policy until quite recently. So, as George referenced,
9 the page memo in March 2010 sort of laid out some
10 recommendations for how to do permit modeling for PM2.5
11 of direct emissions through AERMOD and how to couple
12 that with monitor background to account for the
13 secondary PM2.5 component and then, more recently, two
14 memos related to the new 1-hour SO2 and NO2 NAAQS. One
15 each, I guess, certainly after they -- those new NAAQS
16 were promulgated, I think the NO2 was a little bit
17 lagged behind the actual promulgation or effective date
18 of the new NO2 memo. SO2 is a little bit more prompt.
19 There are some similarities in these in terms of
20 addressing the form of the standards, what that implied
21 as far as data analysis, how to determine significant
22 impact levels or significant contributions to model
23 violations and so on. NO2 is a little bit more complex
24 because of the role of chemistry involved. Most of the
25 emissions are in the form of NO, but the standard is in
10TH CONFERENCE OF AIR QUALITY MODELS 03/13/2012 CCR#16766-1 44
1 the form of NO2. So, we clarified the applicability of
2 the tier three, three-tiered approach in Appendix W to
3 address NO2, NO2 NAAQS that was written in the context
4 of the annual standard, but that we feel like guidance
5 is still applicable to the new 1-hour standard. There
6 may be some additional issues or concerns that might be
7 more important in the context of the hourly standard,
8 which we highlighted. But, at least people need to
9 understand, you know, where we are with that.
10 But, more recently, we issued another
11 memo in March of 2011, sort of additional clarification
12 regarding applicability of Appendix W to the 1-hour NO2
13 NAAQS, that sort of went beyond sort of the basic
14 information provided in the earlier one. Went into
15 more detail about the issues involved in determining
16 which background sources need to be included in the
17 cumulative impact assessment, options and issues to
18 consider in terms of how to combine model to
19 concentrations with marked background for cumulative
20 assessments, and so on. And a lot of that general
21 information in that March memo is also applicable to
22 the 1-hour SO2 NAAQS, and we pointed it out in the
23 memo. And, more recently, just clarifying the sort of
24 regulatory status I guess, if you want to call it that,
25 of AERSCREEN as the recommended screening model now.

10TH CONFERENCE OF AIR QUALITY MODELS 03/13/2012 CCR#16766-1 45
1 The promulgation package -- the preamble to
2 promulgation for AERMOD in 2005 actually referenced the
3 existence of AERSCREEN, which was under development at
4 the time, and indicated once that was completed that it
5 would essentially replace SCREEN3 as the recommended
6 screening model. So, I have some slides to sort of
7 summarize some of these memos. I don't want to go into
8 a lot of detail here, probably everybody is very
9 familiar with them, and I hope that my voice holds out.
10 But, again, this PM2.5 memo was issued
11 in response to the expected transition away from the
12 PM10 surrogacy policy where applicants were not
13 required to do dispersing modeling to show compliance
14 of PM2.5 emissions to show compliance with the PM2.5
15 NAAQS. That if you showed compliance with the PM10
16 NAAQS, that was assumed to be an appropriate surrogate.
17 We no longer live in that world, so we are trying --
18 this was sort of the first major step toward addressing
19 these new needs and emphasize use of AERMOD as the
20 preferred model for estimating near-field impacts from
21 primary PM2.5 emissions. AERMOD does not include any
22 chemistry to account for secondary PM2.5 formation.
23 But also, again, addressed some of the methods and
24 metrics for combined modeled and monitored
25 concentrations, given both the nature of ambient PM2.5,

10TH CONFERENCE OF AIR QUALITY MODELS 03/13/2012 CCR#16766-1 46
1 the secondary PM2.5 can play a significant -- it is
2 typically a significant portion of the monitored
3 background and that is not something we account for
4 directly in the AERMOD modeling, but also due to the
5 form of the standard, which is a bit different.
6 So, for the 1-hour NO2 and SO2 NAAQS,
7 again clarifying their use of AERMOD as the preferred
8 model for estimating the impacts under these new
9 standards, and again describing the applicability of
10 the three-tier approach for NO2, to the 1-hour NO2
11 standard. But again, some of the -- we are still
12 working under that -- sort of three-tiered approach for
13 the 1-hour NO2 standard, but some of the issues may be
14 more important with the 1-hour standard than were with
15 the annual standard. In fact -- I mean the biggest
16 change, of course, is the level of the NAAQS prior to
17 the 1-hour NO2 NAAQS. We rarely had to go beyond tier
18 one, at least as far as we knew from OAQPS. Many
19 applicants were able to show compliance with the annual
20 standard by just assuming full conversion of NO to NO2.
21 That is certainly no longer the case in most
22 situations.
23 Part of it was clarifying where PVMRM
24 fit in this as well. Appendix W explicitly includes
25 OLM, the ozone limiting method, as an example of a tier

10TH CONFERENCE OF AIR QUALITY MODELS 03/13/2012 CCR#16766-1 47
1 three more detailed screening approach. PVMRM is sort
2 of in that same category. In fact, they are based on
3 the same chemical mechanism, they are just implemented
4 somewhat differently but in more detail for both of
5 these in terms of the form of the standard based on the
6 annual distribution of daily maximum 1-hour values, and
7 the analysis procedures necessary to first do a design
8 value showing the cumulative impacts, but also what
9 appropriate metric used to compare it to the SIL in
10 terms of determining the significant impact, or the
11 interim SIL, I guess.
12 Also clarified that monitoring guidance,
13 regarding the three-year average used to -- for the
14 model design value doesn't really pre-empt Appendix W
15 requirements for use of five years of airport data or
16 at least one year of site specific data. So, we state
17 that the model design value is based on the average
18 across the number of years model to be consistent with
19 that particular form of the standard.
20 So, we also clarified some of the
21 procedures, as I said in terms of how to determine
22 significant impact analysis whether your project
23 emissions are contributing significantly to model
24 violations of the standard. In this more recent memo,
25 we get into more detail about that. Also recommended a

10TH CONFERENCE OF AIR QUALITY MODELS 03/13/2012 CCR#16766-1 48
1 default tier two ambient ratio of .8 for the 1-hour
2 standard. In the earlier memo, we said that the .75
3 tier three ambient ratio or tier two ambient ratio is
4 actually described as being -- representing sort of
5 annual and sort of equilibrium conditions which would
6 be more appropriate for an annual standard than an
7 hourly standard. So, we didn't -- we cautioned that
8 it may not be as appropriate for the hourly standard,
9 but we haven't gone too far. But based on review of
10 some information, thought it was appropriate to
11 recommend a .8 as a default tier two. So, tier two,
12 basically you run the model with your NAAQS emissions,
13 get the result, and multiply it by that number -- .8,
14 so it's a very simple tier to implement. It may not
15 buy you much, but it might help some.
16 And then the other key issue that we
17 highlighted in the earlier memos was the more increased
18 importance of the in-stack NO2 and Nox ratio as one of
19 the inputs to the AERMOD model when you are operating -
20 - implementing these three -- tier three options -- OLM
21 or PVMRM, and what we had indicated is, prior to the 1-
22 hour standard -- I think .1 or 10 percent in- stack
23 ratio is pretty much assumed to be a default. I think
24 it had been defined as a default for OLM way back when,
25 but PVMRM never actually defined it as a default, at

10TH CONFERENCE OF AIR QUALITY MODELS 03/13/2012 CCR#16766-1 49
1 least when it was an AERMOD. But we sort of said that
2 there really isn't a default in-stack ratio that we
3 felt would be appropriate for the 1-hour NO2 standard
4 due the nat -- you know, it's a short-term standard.
5 It is -- it certainly may be more appropriate for the
6 annual standard, but -- so, we looked at the available
7 data, there is an effort to try to compile information
8 on what in-stack ratios would be appropriate for
9 different source categories and, hopefully, we'll get
10 to the point where it will have more information
11 available for people to reference or draw upon. But we
12 decided that it was appropriate to -- in this latest
13 memo, indicate -- recommend .5 as an appropriate
14 default in-stack ratio, but I want to emphasize the
15 underlying part in the absence of more appropriate
16 information. We are not saying that this is the ratio
17 that you have to use. We are just saying "if you don't
18 have any other information, we are okay if you use .5."
19 If you have information then that is more appropriate
20 to that source, then please use it. If it's over .5,
21 just don't tell us about it!
22 But another very big issue that emerged in terms of the
23 1-hour NO2 standard, in particular, was the importance
24 of intermittent emission sources. Emergency
25 generators, for example, often are large emitters of

10TH CONFERENCE OF AIR QUALITY MODELS 03/13/2012 CCR#16766-1 50
1 NOx concentrations. They are intermittent, they are
2 not operating all the time. They weren't really an
3 issue under the annual standard. Not sure exactly how
4 they were handled under the annual standard in terms of
5 modeling but certainly wasn't that much of an issue,
6 with the hourly standard that is suddenly a much bigger
7 issue. So, we looked at the available guidance -- what
8 we have in Appendix W, tried to understand whether it
9 is appropriate or not, and we made some suggestions
10 that we thought would be appropriate that -- if you
11 have an intermittent source that doesn't contribute
12 significantly to the annual distribution of daily
13 maximum 1-hour values, then it may not -- .may be
14 appropriate to exclude that source from the modeling.
15 Exactly what that means and how to interpret it in a
16 given context is, you know, more complicated than that.
17 But we did provide a few examples. For example, if
18 it's -- if you have an emergency generator that is
19 permitted to operate 500 -- up to 500 hours a year,
20 that is a pretty typical permit condition that we have
21 seen for emergency generators. But records show that
22 you rarely operate it more than 30 hours a year, and
23 you never know when you are going to, and it is
24 sporadic. It might be 30 hours in a row or something.
25 That is something that probably won't contribute

10TH CONFERENCE OF AIR QUALITY MODELS 03/13/2012 CCR#16766-1 51
1 significantly to the annual distribution of daily
2 maximum 1-hour values. And you don't want that -- the
3 assumption of that operating all of the time should not
4 be the basis for your compliance demonstration. On
5 the other hand, if you have sort of a peaking unit that
6 starts up, shuts down pretty frequently depending, you
7 know, maybe every afternoon or whatever, such that you
8 -- it might emit or operate for an hour, or two, or
9 three every day possibly, then even though the number
10 of hours may not be that much more than the other case,
11 in terms of the permit condition, given the form of the
12 standard, it could contribute significantly to the
13 annual distribution of daily maximum 1-hour values.
14 So, it would be less appropriate to exclude that.
15 So, that's -- again, the details and how
16 to apply or interpret that in a given case, you know,
17 can be difficult and we haven't got a lot of feedback,
18 so I'm not sure exactly how that is being implemented
19 in real cases but, hopefully, it's been a useful
20 clarification. But the other concern we have had, and
21 we kind of expressed it up front, is sort of a
22 longstanding practice, I guess you would call it, of
23 using the 1990 -- is it -- NSR Workshop Manual, the
24 Puzzle Book, which was never been other than draft and
25 it is out of date, but it lays out very detailed
10TH CONFERENCE OF AIR QUALITY MODELS 03/13/2012 CCR#16766-1 52
1 descriptive procedures that you could go through if you
2 want to do a modeling analysis to show compliance with
3 a standard under PSD regulations. It is very detailed,
4 it goes into a lot of detail, you run the model, you
5 see how far out the model impacts are above the SIL,
6 that is your significant impactor, then you go 50
7 kilometers beyond that, you look at all of the sources
8 in that domain and whatever. So, I mean it is a very
9 detailed step-by-step procedure and that is what a lot
10 of people would like to have -- a detailed step-by-step
11 procedure because I know what to do. I don't have to
12 necessarily think about it that much or justify it that
13 much -- just do it, done, get an answer, I am okay.
14 And that -- there is nothing necessarily wrong with
15 doing that. That may be a sufficient method for doing
16 a demonstration, but it may not always be necessary.
17 So, that's what we are trying to make a distinction
18 there, and we have a concern that parts of that -- the
19 recommendations are -- I guess I don't want to put
20 recommendations -- some of the suggestions documented
21 in that draft workshop manual don't necessarily conform
22 completely with Appendix W guidance in terms of nearby
23 sources. So, we're sort of getting people to try to
24 rethink that process. Try to look at the application,
25 understand the nature of the nearby sources, where they
10TH CONFERENCE OF AIR QUALITY MODELS 03/13/2012 CCR#16766-1 53
1 are distributed, how they operate, what kind of ambient
2 background concentrations are available, and how all of
3 the different pieces can fit together in a whole that
4 actually makes sense for that application and for that
5 standard, and try not to overdo it -- try to do enough,
6 but try not to overdo it. So, we discussed the
7 criteria in Appendix W regarding -- now, what nearby
8 sources should be included and what Appendix W says is
9 -- those sources which cause a significant
10 concentration gradient in the vicinity of your source.
11 So, that is the criteria in Appendix W. That doesn't
12 necessarily say draw a circle at your maximum
13 significant impact level, add 50 kilometers to that,
14 and then take all of those sources and dump them into
15 the model. Again, if you want to do that, we are
16 probably going to be okay with it, but if you do that
17 and you come up with a result that is way over the
18 standard, then maybe you need to rethink how you did
19 it, so -- I don't want to overly belabor that point,
20 but -- it is an issue that we are concerned about and,
21 you know, we have tried to clarify well -- why does
22 Appendix W -- Appendix W doesn't say any more than that
23 -- significant concentration gradient, but what does
24 that mean? You know, how can I understand that and try
25 to apply it in my case? So, we have tried to provide

10TH CONFERENCE OF AIR QUALITY MODELS 03/13/2012 CCR#16766-1 54
1 some discussion that we hope is helpful. In time, we
2 might be able to go further and go into more detail,
3 provide more examples, and so on.
4 So, I'll pause now since the next phase
5 is the important stuff. I wasn't going to spend that
6 much time on that, but since I have already yielded
7 myself time. How much time do I have? Ten minutes
8 plus thirty? Okay. So, I guess the more important
9 part maybe is the pending clarification memos, or maybe
10 I should have said "still pending clarification memos,"
11 since we have identified both of these as pending memos
12 at the 9th Modeling Conference. I guess clarification
13 memos grow better with time, so there have been some
14 new developments related to both of these issues that
15 we will describe now. So, I am going to go into some
16 detail about both of these -- the first one relates to
17 the use of ASOS, airport data, automated surface
18 observing system, which began being deployed in 1992 to
19 replace the standard observer based approach at
20 airports for reporting surface weather observations.
21 And then the treatment of missing airport data in
22 AERMOD, so there is some -- a lot of details there.
23 And then the other major one is how the EPA formula
24 height has been implemented in the model in terms of a
25 criterion for whether downwash should apply or not and

10TH CONFERENCE OF AIR QUALITY MODELS 03/13/2012 CCR#16766-1 55
1 with the promulgation of AERMOD, which includes the
2 PRIME downwash algorithms, some significant issues have
3 come up related to that. I do want to exert a caveat
4 or clarify that these pending clarification memos I
5 have are not final, they are still under development in
6 internal reviews but, hopefully, this will give you an
7 idea of where we are and where we are going with this.
8 So, first point, realized when AERMOD was promulgated,
9 there were issues that came up. We became aware that
10 people were sort of applying the same approach they
11 used for ISC3 with AERMOD. So, the ISC3 model under
12 the regulatory default mode required a 100 percent data
13 completeness. If you had missing data, there was a
14 missing data processing option that treated missing
15 data like calm -- even though calm were treated like
16 missing, I guess you couldn't treat missing as missing,
17 but -- anyway, that was part of the regulatory default
18 option under ISC. So, if you had missing data, you
19 either had to fill it in every hour or use a non-
20 default -- turn off the default option. So I want to
21 re-clarify that AERMOD did not have that requirement.
22 It wasn't an oversight that was intentional. It might
23 be nice to have all of the data, but it was not a
24 requirement under the regulatory default option. So, I
25 wanted to clarify that and try to make sure people

10TH CONFERENCE OF AIR QUALITY MODELS 03/13/2012 CCR#16766-1 56
1 aren't just carrying forward that process
2 unnecessarily.
3 But, I guess, one of the bigger
4 motivators was that -- again with the advent of ASOS,
5 there is a lot more missing data. I mean one of the
6 initial concerns about ASOS was that with the cloud
7 cover -- this goes way back -- Tom Pierce actually
8 helped write a report on that with Bruce Turner back in
9 the '80's trying to influence the weather service and
10 FAA or whoever -- if you are going to do this, here's
11 some of our concerns, our needs of this data, please
12 consider this when you go forward. And I guess they
13 didn't either hear you, or they just ignored you, so I
14 mean FAA, airports, pilots -- they don't really care
15 about light wind conditions, so who cares if less than
16 three knots is a calm? So there are some issues there,
17 but one of the initial concerns was that the ceilometer
18 that they were going to use had a vertical limit of
19 12,000 feet. So, clear below 12,000 feet from ASOS
20 might actually mean overcast at 16,000 feet. Well
21 again, that might not be important to a pilot or the
22 terminal at the airport, but for dispersion modeling
23 actually that could make a big difference. It could be
24 a difference between stability class A or D with ISC.
25 So, what are we going to do about that? Well, we have

10TH CONFERENCE OF AIR QUALITY MODELS 03/13/2012 CCR#16766-1 57
1 found later -- we redid a ASOS sensitivity study that
2 was done for ISC using AERMOD and actually showed much
3 less sensitivity to those issues than ISC, which is
4 good. But, the big issue is that there is a lot more
5 missing data now. Prior to ASOS, you would rarely see
6 missing airport data -- an hour here or there maybe
7 unless a hurricane went through maybe and knocked the
8 tower out, but with ASOS there is a lot more missing
9 data -- both due to calms -- increased frequency of
10 calms. We have documented about a factor of two
11 increase in the number of calm hours before -- after
12 versus before ASOS. And then the adoption of the METAR
13 standard in July '96, which introduced the variable
14 wind code. So you could have winds -- valid wind
15 speeds up to six knot, but the wind direction is
16 variable -- which means for us missing. So that is
17 another hour that is tossed out.
18 This is just one slide from the ASOS
19 sensitivity study showing AERMOD's on the left -- this
20 is a 55 meter stack with downwash. Comparing results
21 with model results using ASOS clouds versus airport --
22 you know, in observer based clouds. And I don't know
23 if you can see that, but -- so AERMOD is showing very,
24 very little sensitivity to the cloud cover issue, which
25 was the main issue in the beginning with ASOS. ISC

10TH CONFERENCE OF AIR QUALITY MODELS 03/13/2012 CCR#16766-1 58
1 showed quite a bit of sensitivity for this source, but
2 it is almost always biased higher with ASOS than not.
3 And again, this is a case for a tall stack, you might
4 have 1-hour again where it is clear below 12,000 feet
5 with ASOS means Astability, but maybe it really was
6 overcast at 16,000 feet, which meant D-stability if it
7 was an observer. Well, for a tall stack, A- to D-
8 stability is a pretty big difference and you can have -
9 - but the tend is going to have much higher
10 concentrations with the ASOS data. And that was one
11 reason why we said -- didn't say -- well, don't use
12 ASOS data because if there was a bias, it tended to be
13 in the direction that was -- that we were more
14 comfortable with. But, at least the good news, AERMOD,
15 it just threw away because 1-hour of clear versus
16 overcast doesn't really affect the results as much
17 because the convective boundary layer evolves over time
18 in AERMOD and so on, so it's -- that sensitivity is
19 much reduced. And this is a plot showing the frequency
20 of calms before ASOS versus after ASOS -- almost every
21 dot there is above the one to one line -- meaning more
22 calms with ASOS. And on average, we have seen about a
23 factor of two increase.
24 So, the other issue is that these data
25 gaps -- calm winds and variable winds are both biased
10TH CONFERENCE OF AIR QUALITY MODELS 03/13/2012 CCR#16766-1 59
1 towards low wind speeds which increase the concern
2 about the representativeness of the ASOS data for some
3 applications. And I don't want to pick on Birmingham,
4 Alabama but it's a case where we actually had a need to
5 look at Birmingham a while back, and it is a good
6 poster child for some of the ASOS issues. So, an
7 example, for 2010, just the standard ASOS data from the
8 ISHD file, quoted at 32 percent calm hours and 4
9 percent variable. That is a lot, but the reason for
10 the clarification memo, or one of the needs, is that
11 Appendix W doesn't explicitly address data completeness
12 requirements for NWS or other airport data. I mean we
13 say "NWS," we also mean FAA, airport -- so just it is a
14 terminology, but -- but again, prior to ASOS, missing
15 airport data was very rare.
16 So, Appendix W does provide some
17 recommendations or references the met monitoring guides
18 for regulatory applications in terms of data
19 completeness requirements for site specific data, and
20 that is where it recommends at least 90 percent
21 completeness before substitution, and that should be
22 reached variable separately as well as the joint
23 variable. So, you need to have all of the data
24 available to run the hour 90 percent of the time to
25 meet the requirement, but has to be done on a quarterly
10TH CONFERENCE OF AIR QUALITY MODELS 03/13/2012 CCR#16766-1 60
1 basis.
2 Appendix W also recommends in the
3 Section on Site Specific Data that after validated
4 retrieval requirements have been met, hours in the
5 record having missing data should be treated according
6 to an established data substitution protocol provided
7 that data from an adequately representative alternative
8 site are available. So, to add some emphasis there and
9 I will repeat it again -- so that I think is a very
10 important phrase which fits right into -- well, what
11 are we going to do about missing ASOS data? So, most
12 of the data that is missing is due to missing winds
13 either due to calm winds or variable winds, so wind
14 data is probably the worse thing. So we just kind of
15 stumbled on this one-minute ASOS data archive that NCDC
16 had been archiving for a while -- so, they have
17 archived its two-minute average wind speed direction
18 reported every minute for beginning in 2000 this one-
19 minute AR -- this one-minute ASOS wind data was
20 available for all of the major NWS sites all of the way
21 up to the present. The secondary stations data became
22 available in, I think, March 2005, but we now have five
23 years of data for that as well. So, it fits very
24 neatly into Section 3, 3, 2, (C), since it comes from
25 the same site and instrument. So, it has definitely
10TH CONFERENCE OF AIR QUALITY MODELS 03/13/2012 CCR#16766-1 61
1 got to be a representative alternative site. It is the
2 same site.
3 So, we think that one-minute ASOS wind
4 data clearly as representative as a standard data, but
5 the standard data is based on a single two-minute value
6 reported sometime before the hour and also reported to
7 the nearest knot, but also truncated to the whole knot
8 as we found later. And the wind directions are
9 reported to the nearest ten degrees. Whereas, the
10 hourly average winds based on one-minute data generated
11 by AERMINUTE actually more appropriate inputs to
12 AERMOD, we think. AERMOD uses a 1-hour time step, so
13 you actually have hourly average and wind speed
14 direction, and eliminates the need to randomize the
15 wind directions.
16 So, we haven't stated this on paper yet.
17 We have certainly discussed it with the regional
18 offices and so on, but we recommend that AERMINUTE
19 should routinely be used to supplement the standard
20 airport data with hourly average winds based on the
21 one-minute ASOS data when it is available. Again, now
22 it should be available for just about any station. So,
23 when this is applied for the Birmingham, Alabama 2010
24 example, it reduces the number of calms from 32 percent
25 to 1.2 percent, and the number of variables from 4

10TH CONFERENCE OF AIR QUALITY MODELS 03/13/2012 CCR#16766-1 62
1 percent to 1 percent. That is a pretty significant
2 change. So, again, Appendix W doesn't establish a
3 minimum requirement for daily completeness for NWS
4 data, but we think the 90 percent joint capture by
5 quarter is certainly a useful benchmark, so we would
6 suggest if the NWS data completeness is less than 90
7 percent by quarter with the use of AERMINUTE, then the
8 representativeness of that data may be suspect and
9 alternative sources maybe should be considered for, you
10 know, if you can substitute from representative data
11 this -- then that is appropriate as well, but you are
12 not required to achieve a 100 percent data completeness
13 as you had to with ISC.
14 So, I am going to show some examples for
15 Birmingham. This is a plot of wind speed versus wind
16 direction for 2010 using the one-minute winds, and sort
17 of see quite a bull's-eye down there -- pretty low wind
18 speeds, half meter to a meter per second. It is sort
19 of a lull, you know, stable light wind drainage flow
20 that occurs near the airport, which we saw in an
21 earlier study. This is what you would get without
22 AERMINUTE. So, you have discrete speeds because the
23 winds are reported in whole knots. Since any wind
24 below three knots is considered a calm under METAR and
25 the fact that the winds are actually truncated to three

10TH CONFERENCE OF AIR QUALITY MODELS 03/13/2012 CCR#16766-1 63
1 to whole knots, the minimum speed that you would get
2 without one-minute data would be about 1.8 meters per
3 second. But it does kind of pick up a similar pattern
4 overall, but a lot less detail. But actually, you
5 know, the actual raw data has wind directions to the
6 nearest ten degrees, so that's what the raw data looks
7 like without AERMINUTE.
8 And once again, it is sort of similar,
9 but not quite the same. So that is frequency of calms
10 by hour of day -- so, it shows that even though 32
11 percent is a lot, for the nighttime hours, it is
12 actually more like -- well, here is the percentage --
13 it is more like 50 percent during the night, so if you
14 had a source that only operated between noon and five
15 p.m., actually the data might be pretty representative.
16 But if it is operating all of the time, then there is
17 some serious concerns.
18 So, we know that there are some concerns
19 and issues about use of low wind speeds near
20 (Inaudible) for 1-minute data, and we will talk about
21 those in other presentations, but we also note Appendix
22 W does state that measured site specific data less than
23 a meter per second, but higher than this threshold of
24 the instrument, should be set to one meter per second
25 for steady state improved models, but the same section

10TH CONFERENCE OF AIR QUALITY MODELS 03/13/2012 CCR#16766-1 64
1 goes on to say "but not for AERMOD" because that point
2 has been raised.
3 I have 10:15, right -- total. But, I'll
4 talk faster -- Okay, so we are just time managing here,
5 which would be difficult with me, but anyway -- so --
6 but since the alternative to the use of airport data
7 under Appendix W is to collect site specific data, and
8 since the guidance regarding site specific data does
9 not require wind speed thresholds from less than half a
10 meter per second, we believe that it is reasonable and
11 appropriate to allow users to apply a threshold of half
12 meter per second to hourly average winds to arrive for
13 one-minute data. It might not make everybody happy,
14 but we think that that is a reasonable and appropriate
15 thing to allow, and we have a pending update to AERMET,
16 which is almost done -- hoped it would be released, but
17 hopefully very soon, that includes an option to specify
18 a wind speed threshold for a one-minute ASOS wind data
19 in Stage 3. In such that hours -- any hour where the
20 average wind speed from AERMINUTE was less than the
21 threshold, after being adjusted for the truncation,
22 would be considered a calm. And so this is what it
23 would look like with that threshold. So, it just kind
24 of skims stuff off at the bottom, but still captures a
25 lot of the information that was added with the use of

10TH CONFERENCE OF AIR QUALITY MODELS 03/13/2012 CCR#16766-1 65
1 the one-minute data. So, that is with and without the
2 threshold. So, that's one of the pending clarification
3 memos, the other one -- It has to do with how the EPA
4 formula height has been implemented in the model as the
5 criterion for whether downwash effects should be
6 applied. It is something that AERMOD inherited from
7 ISC -- all previous models, but prior to Version 11059,
8 the AERMOD model ignored building downwash if the stack
9 height was greater than or equal to the EPA formula
10 height, which was again consistent with all previous
11 versions of AERMOD before PRIME was incorporated in
12 previous versions of ISC and ISC-PRIME, but significant
13 discontinuities and concentrations had been reported
14 for stack heights that straddled that EPA formula
15 height -- even by, you know, .1 meters. In fact, there
16 is one case that was eight orders of magnitude
17 difference for with maybe a .1 meter per second change
18 in stack height.
19 So, those significant discontinuities
20 didn't occur before PRIME or if they were -- they were
21 less significant. This issue actually came up when
22 ISC-PRIME was originally proposed by EPA to replace
23 their ISC for applications where downwash was
24 important. At the 7th Modeling Conference in 2000, the
25 AB-3 Committee actually recommended that EPA modify

10TH CONFERENCE OF AIR QUALITY MODELS 03/13/2012 CCR#16766-1 66
1 ISC-PRIME to do exactly what we did, AERMOD, to
2 eliminate those discontinuities. EPA's response at the
3 time was that current implementation was requirement
4 under GEP's stack height regs promulgated under Section
5 123 of the Clean Air Act. And that was sort of -- sort
6 of the -- I don't want to say "knee- jerk response,"
7 but certainly the widely held belief. But the
8 magnitude of these discontinuities kind of finally
9 prompted reassessment of that decision, and that
10 reassessment has concluded that AERMOD should be
11 modified to remove this criterion for ignoring downwash
12 influences. And that change was finally implemented
13 with Version 11059.
14 So GEP stack height regs define GEP
15 height as the greater of 65 meters, the de minimus
16 height or the EPA formula height, that one or the older
17 one, the grandfathered, or a height determined by fluid
18 modeling or field stay demonstration. So, first, the
19 formula height doesn't even apply for stacks below 65
20 meters based on the definition. But the criterion for
21 determining GP height through fluid modeling or field
22 study is a height needed to avoid excessive
23 concentrations, which are defined as "where downwash
24 influences or an increased concentration is at least 40
25 percent compared to no downwash." So if you go through

10TH CONFERENCE OF AIR QUALITY MODELS 03/13/2012 CCR#16766-1 67
1 and determine GEP height for your source, you have
2 already shown that that is the height you need to avoid
3 excessive concentrations, but excessive concentrations
4 are at least 40 percent. So, I am not aware of
5 anywhere else in the Clean Air Act where we are willing
6 to discount your results by 40 percent. I mean a lot
7 of people might like to be able to do that, but to
8 ignore downwash for stacks that are at or above the EPA
9 formula height for GEP or GEP height itself, is
10 ignoring at least 40 percent increase in concentration.
11 So, we think that is inappropriate and
12 it is certainly not supported by the regulations, so --
13 and the regulations, as I said, provide no basis or
14 justification for ignoring at least a 40 percent
15 increase in concentration due to downwash -- which is
16 the criterion. So, before PRIME, the vertical extent
17 of the wake was actually formulated pretty much
18 consistent with the formula heights so there was
19 little, if any, discontinuity for stacks straddling the
20 height. But, with PRIME, the vertical extent of wake
21 influences is significantly higher than the formula
22 height in some cases and there is plenty of data to
23 support the fact that downwash influences can be
24 significant for stacks above the EPA formula height --
25 this cites one in 1993 by Roger Thompson that the EPA

10TH CONFERENCE OF AIR QUALITY MODELS 03/13/2012 CCR#16766-1 68
1 fluid modeling facility -- and he actually makes that
2 point that the formula is not adequate to define that
3 height. But, even going back further, the technical
4 support document for the GEP stack height regs has a
5 figure that shows wake heights, so that is the formula
6 height line right there. But, most of the data points
7 are actually higher than that. So the wake height is
8 mostly higher than that and, in fact, the notice of
9 proposed rule making for the 1985 GEP stack height regs
10 actually states that "EPA has found that the formula
11 represents not an average, but a lower limit of the
12 height needed to avoid a 40 percent increase in
13 pollutant concentrations." So, rather than being
14 distributed uniformly, the height needed to limit
15 impact of downwash to 40 percent increase tends to be
16 skewed towards greater than formula height. So, the
17 formula height itself is actually a conservative
18 estimate of the height needed to avoid excessive
19 concentrations -- i.e., at least 40 percent. So that
20 means that the EPA formula height impacts are usually
21 greater than the 40 percent increase. Yet, from the
22 GEP stack height perspective, the purpose of the GEP
23 stack height regs is to limit the credit you can take
24 due to downwash and setting your emission limit -- or
25 the credit you can take for raising your stack and
10TH CONFERENCE OF AIR QUALITY MODELS 03/13/2012 CCR#16766-1 69
1 setting your emission limit. So, ignoring downwash
2 effects for a stack of EPA formula height would
3 essentially allow a source to take a higher limit,
4 emission limit, than they would otherwise be able to
5 take if downwash influences were included. And that is
6 completely at cross purposes to the GEP stack height
7 regs. So, we believe that the technical evidence is
8 very clear and non- controversial. The downwash
9 effects can significantly increase concentrations above
10 formula height -- that ignoring downwash effect
11 influences would actually go counter to the purpose of
12 the GEP stack height regs and although we haven't
13 issued the memo yet, we have consulted with Office of
14 General Counsel and they have fully concurred with this
15 assessment regarding EPA formula height.
16 But, again, this issue matured with time
17 and, more recently, come to the realization that the --
18 that we have reassessed the appropriateness of the 5L
19 limit -- the distance limit on the structure influence
20 zone for buildings incorporated in BPIPPRM. Again,
21 this goes back to GEP stack height regs, define which
22 building or structures you can account for in setting
23 your GEP -- your credible GEP height -- and there you
24 can include nearby structures and "nearby" is defined
25 as "those structures that are less than five times the

10TH CONFERENCE OF AIR QUALITY MODELS 03/13/2012 CCR#16766-1 70
1 lesser of the height or width," so within 5L as the
2 distance limits, so in GEP stack height regs, if you
3 have a building that is 6L from your stack, you can't
4 account for that building in justifying a higher stack
5 height to avoid downwash influences. It doesn't mean
6 that this 6L building is not going to cause downwash
7 influences. But again, the data are very clear --
8 buildings can influence concentrations significantly
9 beyond a distance of 5L. But that is incorporated in
10 BPIPPRM as a hard line, any building beyond that is
11 ignored, and we don't think that's appropriate either,
12 so that will be documented more fully in this memo.
13 So, again, it is similar to the formula
14 height issue only in the lateral instead of the
15 vertical direction. So, there is a summary of the key
16 points, but the disclaimer -- the GEP stack height regs
17 are very complex and this presentation is not intended
18 to fully address the issues that may arise in applying
19 these regulations to specific cases, but -- this is our
20 assessment of that important issue, and -- how much
21 time do I have -- and that is where?
22 Okay, this will be an air modeling
23 update and a very fast one -- so, AERMOD, we had a few
24 major updates since the last modeling conference -- 9,
25 09, 292 -- a lot of them have dealt with sort of --

10TH CONFERENCE OF AIR QUALITY MODELS 03/13/2012 CCR#16766-1 71
1 clean up the model, fixing it, but a lot of them have
2 been motivated by the new hourly NO2 and SO2 NAAQS
3 including option to more fully support those standards.
4 That has been a big focus -- certainly, the tier three
5 options that are in there, there have been some bugs
6 there that needed to be fixed. There was what we call
7 a "formulation bug fix," I guess, an issue that AERMIC
8 was aware of before it was promulgated, that the urban
9 option AERMOD enhances turbulence during nighttime
10 stable hours to account for the urban heat island
11 effect. But, as soon as it turns convective in the
12 morning, all of that enhanced turbulence goes away --
13 at least based on what the model had thought. So, it is
14 an issue that actually came up in applying the model
15 for the NO2 risk and exposure assessment in Atlanta and
16 where the MOBILE source were calling fairly high
17 concentrations for the first convective hour, and so we
18 have fixed that in the model, we have shown -- prior to
19 evaluation results -- so, this is Indianapolis tall
20 stack elevated source -- so this is the observed -- no,
21 this is the observed is the green -- this is what the
22 model produces with the fix -- this is a particular day
23 -- distance concentration by distance for the first
24 convective hour, and the original previous version
25 predicted that because it ignored, you know, or

10TH CONFERENCE OF AIR QUALITY MODELS 03/13/2012 CCR#16766-1 72
1 enhanced turbulence for the urban need island
2 disappeared. So, there is another example that shows
3 much better agreement.
4 This is for the Atlanta Risk and
5 Exposure Assessment, these were low level sources, it
6 kind of goes the other way -- here is an example of a
7 peak value -- hourly value that was influenced by this
8 issue and after the fix, you are down here, and so it
9 significantly reduced those outliers that overestimated
10 impacts due to this concern. There's minor updates
11 come along and buck fixes to the max D contribution
12 option. AERMOD, again same thing -- a lot of
13 infrastructure, trying to clean it up -- make the air
14 reporting better, but also allow for support of the
15 one-minute ASOS data. Let's see -- you know, the
16 operatives, some changes were made there to give more
17 flexibility that may have implications outside the U.S.
18 more so, but let's see -- AERMAP, really there weren't
19 a lot of big changes other than, you know, supporting
20 newer data formats, the net data in addition to DEM
21 data, and so on. For the future plan priorities, we
22 would like to get a point line source option in AERMOD.
23 This has come up as an issue a number of times where a
24 source maybe has a blunt line as part of it, but that
25 is not all they have, so what do they want to do -- you
10TH CONFERENCE OF AIR QUALITY MODELS 03/13/2012 CCR#16766-1 73
1 know, do you run BPIP and AERMOD and combine the
2 results where you are using different meteorologies.
3 So, we would like to try to address that eventually and
4 possibly appoint areas for its option -- we are looking
5 at the NOx -- you know two options, especially PVMRM,
6 we will be talking about that more based on some work
7 that API has been doing on that. What I would like to
8 do is develop a MAXDCONT event processing option, so
9 you didn't have to do it as part of an internal post
10 process thing, that would give a little bit more
11 flexibility. And AERMET, we've got a pending release
12 that has a couple bug fixes -- more the HUSWO wind
13 probably not that important because it may only happen
14 if the day has been reformatted to HUSWO, the cloud
15 cover -- ASOS's cloud covers are being misinterpreted.
16 Currently, a bigger issue is issue with the convected
17 mixing height calculation that has been kind of out
18 there for a while, we finally worked through and
19 resolved that -- and there will be some changes to the
20 convective mixing heights. We have redone some of the
21 field study evaluations, not all of them, but overall,
22 it doesn't seem to have that much impact on model
23 performance, but we are going to pursue and document
24 that more fully. And then, as I mentioned earlier, we
25 are adding an Option Stage 3 to for the users specified

10TH CONFERENCE OF AIR QUALITY MODELS 03/13/2012 CCR#16766-1 74
1 by a threshold for the one-minute ASOS wind data. And,
2 we would like to continue to try to pursue the use of
3 met inputs derived from prognostic models with
4 development of the MMIFTOOL. I think maybe we will --
5 and some new staff, maybe we will be able to make some
6 further progress there, and we also need to update and
7 finalize the APTI Air Pollution Training Institute,
8 advanced course in modeling to reflect AERMOD. So,
9 almost --
10 MR. THURMAN: Okay, we will briefly go
11 over AERSCREN, the status and update. It has been
12 released since the 9th Modeling Conference. I just
13 want to acknowledge Jim Haywood from Michigan DEQ for
14 doing a lot of work on AERSCREEN before I arrived at
15 EPA, and then I inherited it. Just a brief release
16 history. A Beta version was released in August of 2010
17 when we allowed the public to comment -- there was a
18 30-day comment period to report bugs. Comments and
19 suggested changes -- March 11th of 2011, we released
20 the -- what we called a "final version" that
21 incorporated bug fixes and suggestions from the
22 modeling community. And then a week later, found a bug
23 that didn't pick up on before related to complex
24 terrain processing, and then a couple of months later,
25 we had to modify our screen to read "output from error

10TH CONFERENCE OF AIR QUALITY MODELS 03/13/2012 CCR#16766-1 75
1 map" for source elevations that had the 12 character
2 source ID that was done for AERMAP and AERMOD, and also
3 corrected a minor bug in a subroutine that reads the
4 input file.
5 Roger touched on AERSCREEN's status as
6 the EPA recommended screening model. We did release the
7 clarification memo in April of 2011 -- that should be
8 2011 -- recommending AERSCREEN model and, as you
9 know, SCREEN3 has been the recommended model. Like
10 Roger said, the Preamble mentions AERSCREEN, it was
11 supposed to have been out in Fall 2005, we only missed
12 it by about a few months. So, the Preamble states
13 "AERSCREEN would be the recommended model" -- like --
14 and also since AERSCREEN is based on AERMOD, the EPA
15 preferred near-field dispersion model, we feel it is
16 appropriate to use AERSCREEN, whereas SCREEN3 is based
17 on ISC and subject to the same limitations as ISC.
18 Just some changes since the beta
19 release, this is Version 11126, the latest version that
20 is out there. There is more QA of the inputs. You can
21 see the model change bulletin number 1 on the screen
22 for that. Make sure you don't put letters in where you
23 should have numbers, you know -- AERSCREEN won't crash,
24 it won't just abort, it will stop and tell you there is
25 something wrong. The probe distance is now entered in

10TH CONFERENCE OF AIR QUALITY MODELS 03/13/2012 CCR#16766-1 76
1 meters instead of kilometers. When the beta version
2 went out, people were putting in 50,000 meters for 50
3 kilometers and AERSCREEN thought it was 50,000
4 kilometers. So, you were going up to the moon or
5 something.
6 We also changed the receptor spacing
7 methodology. We used -- now you can use the domain, XY
8 keyword added to the AERMAP processing part, that is so
9 you don't have to use the whole NED file or DEM file,
10 or whatever elevation file you are using -- it will
11 speed up the processing. Basically, that is 1.1 times
12 the probe distance. You can also specify the ten
13 discrete distances for receptors in addition to the
14 regulator space receptors -- this would be if you had -
15 - you were running AERSCREEN location, you may want to
16 have a distance from a source to a school or, you know,
17 a subdivision, or something, you could add the
18 distances in. Right now, that is not direction
19 depended, it would put those distances in for all
20 directions. And one thing we were actually thinking
21 about was adding that, maybe a direction dependent to
22 that.
23 Also, corrected a bug related to
24 receptor placement for area sources, and that did
25 impact the maximum concentration estimates from

10TH CONFERENCE OF AIR QUALITY MODELS 03/13/2012 CCR#16766-1 77
1 AERSCREEN, so we corrected that.
2 Per suggestions from the user community,
3 you can specify an output file name other than the
4 default AERSCREEN.OUT. If you are doing sensitivity
5 test on a source, you know, checking meteorology or no
6 downwash versus downwash, or controls, no controls --
7 AERSCREEN will use that -- uses the file prefix for the
8 maximum concentration file, that's the file that has
9 maximum concentration by distance. And it will also
10 rename your new AERSCREEN input file using that naming
11 convention in the AERSCREEN log file. So, you will
12 have this whole set of files specific to that
13 particular AERSCREEN run.
14 Also, we added the capability for
15 AERSCREEN and model NOx to enter to a conversion using
16 PVMRM or OLM. The user would specify the in-stack
17 ratio and a representative ozone concentration with the
18 units of PPB, PPM or micrograms per meter cubed. It
19 uses the fall equilibrium ratio of .9, so you don't
20 enter that. If the necessary executable, such as
21 AERMOD, MAKEMET, AERMAP and BPIPPRM are not in the
22 current working directory, or wherever you're running
23 AERSCREEN, before AERSCREEN would just stop and tell
24 you they couldn't find the executables, now AERSCREEN
25 will ask you where those are and copy them over. And

10TH CONFERENCE OF AIR QUALITY MODELS 03/13/2012 CCR#16766-1 78
1 also AERSCREEN checks that the BPIP input file has the
2 correct process flag, the PRIME flag, and only one
3 stack. This is if you are using an existing BPIP input
4 file for, you know, complicated building geometry. So,
5 a lot of the changes made were just to do a lot more QA
6 so AERSCREEN doesn't just crash and you lose all of
7 your inputs.
8 Just a quick word on AERSCREEN and the
9 new 1-hour NAAQS, you could use it to screen sources to
10 determine inclusion or exclusion in refined modeling.
11 It is conservative. It outputs the max 1-hour
12 concentration, but not the design value. So, if the
13 source exceeds the NAAQS level with AERSCREEN, that
14 doesn't necessarily mean it is going to violate the
15 NAAQS when a design value -- you should probably just
16 consider including the refined modeling, and you may
17 also want to use it to compare results using surface
18 characteristics from your met station that you will use
19 for refined modeling and the surface characteristics
20 from the source.
21 Just some brief word on future
22 modifications, we have talked about maybe allowing a
23 user to input their own receptor network -- maybe an
24 existing AERMAP output file so you don't have to run
25 AERMAP. We are going to look into that, so what does

10TH CONFERENCE OF AIR QUALITY MODELS 03/13/2012 CCR#16766-1 79
1 that mean to run AERSCREEN for a grid versus, you know,
2 a straight line distance? Also, I have been toying
3 with the idea of modifying the input file to make it
4 easier to add variables. Right here is the current
5 file structure -- you know, each line represents a --
6 you know, a different pathway and if you want to add
7 variables, it gets a little difficult to keep adding
8 line -- adding data to the end of the line, the line
9 gets longer and longer. So, I thought about maybe
10 changing the file structure to like a keyword that's
11 like in AERMOD now. This is just an example, you know
12 each line will be a different keyword and variables and
13 that way in the future, as we modify your screen, it
14 will be easier to update. If we were to go this route,
15 AERSCREEN would be able to read the old file structure
16 and this new file structure, so you wouldn't have to
17 necessarily change your files. So, that is where
18 AERSCREEN is and we have questions later, and I think
19 we are back on track with the schedule.
20 Oh, and I also want to acknowledge Tom
21 Baker in our group, he did a lot of work for the SO2
22 NAAQS and with AERSCREEN. We did some screen of
23 sources to determine if, you know, what kind of
24 emission thresholds would give us problems. So, he has
25 done a lot of work with that with me and he actually

10TH CONFERENCE OF AIR QUALITY MODELS 03/13/2012 CCR#16766-1 80
1 found one of the bugs related to terrain processing.
2 MR. BRIDGERS: Well, somehow we ended up
3 five minutes early. So Roger, did you want to come
4 back and say anything about any of the clarifications?
5 So, let's go ahead and take our break and I just
6 conferred with Tyler, I say -- let's go ahead and take
7 it until 10:30, that will give us some time for some
8 cross talk, and then we will start right back up at
9 10:30. Thank you, guys.
10 (WHEREUPON, a break was held from 10:10 a.m. to 10:32
11 a.m.)
12 MR. BRIDGERS: Okay, as everyone takes
13 their seats, I am going to go ahead and introduce James
14 Thurman, and he is going to give an update on
15 AERMINUTE.
16 MR. THURMAN: Okay, I am going to go
17 ahead and get started. I am talking about AERMINUTE.
18 This presentation will just go over how AERMINUTE
19 works. It won't get into low wind speed issues or
20 anything. First thing I want to do is acknowledge the
21 AERMOD Implementation Work Group, especially the
22 meteorology subgroup chaired by Alan Dresser of New
23 Jersey and Joe Simms formerly of Alabama, who is now
24 enjoying retirement. They were a big part of the
25 development of this program, so I just want to thank
10TH CONFERENCE OF AIR QUALITY MODELS 03/13/2012 CCR#16766-1 81
1 them for that. Alan wrote out the first methodology
2 for the program, and we started off from that.
3 So, basically, what is the purpose of
4 AERMINUTE? Is to calculate hourly average winds from
5 the two minute ASOS winds. These are the rolling two
6 minute averages reported every minute, and those are
7 from the...what they called the 6405 format files. In
8 AERMET, you would replace the standard hourly
9 observation with an AERMINUTE hourly average wind
10 unless the AERMINUTE output is calm or missing so there
11 is no substitution. If you have on-site data, that
12 still takes precedence. The purpose of the program is
13 to reduce the number of calms in variable winds output
14 from AERMET due to the METAR coating and the
15 introduction of the ASOS observation system that Roger
16 talked about. Basically, the program is to reclaim
17 data that was lost due to those...the METAR code, and
18 that would make the station more representative of an
19 area. The purpose of the AERMINUTE is not to introduce
20 conservatism in a model, but like I said, reclaim lost
21 data. Just in a METAR code, how it calms and variable
22 winds reported...calm is a wind speed less than three
23 knots. Variable wind, the wind speed is up to six
24 knots, and the wind direction varies by more than 60
25 degrees in a two minute average. So, the wind speed
10TH CONFERENCE OF AIR QUALITY MODELS 03/13/2012 CCR#16766-1 82
1 would be there, but the wind direction is reported as
2 missing in the AERMET output, and obviously, AERMOD
3 cannot calculate hourly concentrations for hours with
4 calm or variable winds. Either you don't have a wind
5 speed or you don't have a wind direction, and usually
6 those light wind conditions are going to be those of
7 most concern for the new, one-hour NAAQS.
8 Just a release history, the initial
9 version was released in February 2011, 11059, that was
10 released at the same time as those versions of AERMOD
11 and AERMET. We released a new version in December to
12 modify the QA routines to account for newly discovered
13 file formatting issues. And, speaking of issues, those
14 are the data file formats. On the NCDC website for the
15 6405 files, there is a description of the file
16 format...they describe a format, but obviously, they
17 didn't follow it. They do not fit that regular format,
18 and it varies from station to station and year to year,
19 and from within the files themselves.
20 Another issue is that winds were
21 reported in whole knots, so they rounded...you know if
22 they are truncated or rounded to whole knots...so that
23 is an issue as well. Here is an example of a file,
24 this is for RDU, back in 2003...the string of
25 characters that starts with RDU, that is the date and

10TH CONFERENCE OF AIR QUALITY MODELS 03/13/2012 CCR#16766-1 83
1 time...it gives the time in local time, as well as
2 Greenwich Mean Time...the program doesn't use the
3 Greenwich Mean Time, it uses the local time. And then,
4 a string of columns, these are extinction co-
5 efficients, then the wind direction, wind speed for the
6 two minutes, and then the 30 and the 5 will be the gust
7 wind direction and speed. So, if you look, that is the
8 wind direction, that is the wind speed in knots, but
9 then you see these in the red rectangles, the file does
10 not fit the regular format. If you didn't try to do
11 any kind of QA on the file, you would see a wind...you
12 would think that this two would be a wind direction,
13 and you would have a wind speed at 648 knots, which I
14 guess if you are on Jupiter, that is true. But,
15 actually, what that is, it looks like they have tried
16 to jam another observation in to the file, so I don't
17 know how they do that...what program, but. Then, you
18 look at these other ones...this one is kind of offset,
19 it is not in the right columns, so the date has been
20 shifted over, and then this last one is kind of similar
21 to this one up here with the two. It looks like they
22 have tried to jam in a record. So, that was a lot of
23 the problem with writing the program was actually just
24 trying to read these files, and get the formats, and
25 try to get something useful out of them when they are

10TH CONFERENCE OF AIR QUALITY MODELS 03/13/2012 CCR#16766-1 84
1 not in a clean format. So, the program does a very...I
2 think it is ten steps of QA on the files.
3 These are the inputs that go into the
4 AERMET input file, when you execute AERMINUTE, it asks
5 you for the name of the input file that controls the
6 processing. This is that file. The start end key word,
7 that is just the start month and start year and end
8 month and end year. The next one is the IFW Group,
9 this is the station part of ice free winds group, and I
10 will get into that. For this example, we are saying,
11 "yes," so you put a "Y." Then you put in the start
12 month, day, and then year of when it would become part
13 of the ice free winds group. And I will get into that
14 in a minute. The data files starting key word, "data
15 key word," and "data file finish," let AERMINUTE know
16 these are the two-minute winds files to read, and these
17 are in a 6405 format file. You can have files outside
18 of the data period you are processing, they will just,
19 you know, ignore them. And also, they don't have to be
20 in order. You could December 2005 first followed by
21 2000...March of 2005. The program doesn't have to have
22 them in order.
23 The next is the surf data. This is the
24 optional list of the ISHD files to use for data
25 comparisons. It doesn't effect the hourly averaging in

10TH CONFERENCE OF AIR QUALITY MODELS 03/13/2012 CCR#16766-1 85
1 AERMINUTE, it is just the compare the minutes in the
2 6405 files to the standard observations that are in the
3 ISHD file, and right now it only reads ISHD data, not
4 like HUSWO or SAMSON data.
5 And, finally, the hour files, the hour
6 file is the file used by AERMET and the outputs in
7 local standard time. The SUM file is a summary file
8 that lists for each hour of the data period how many
9 minutes were read in, how many are calm, how many even
10 minutes were used, how many odd minutes were used, MIN,
11 MAX and average wind speed and wind direction. Then,
12 the COMP file if you are going to compare it to the
13 standard ISHD file, it would list that output of
14 comparison of minute by minute output. There is also
15 three other files of output called "Good Records.DAT
16 and Check Records.DAT, those are just repeats of the
17 data that is in the data files. The good records are
18 the ones that are used in the hourly averages. Check
19 records are those files...those records that they look
20 like they could be valid, but they are suspicious.
21 They don't quite fit the format...but they are not
22 used, and then the bad record files are just, you know,
23 the bad records, and you can usually tell they are
24 really bad. So, actually, you could rerun the program
25 with the good records file after renaming it, and you

10TH CONFERENCE OF AIR QUALITY MODELS 03/13/2012 CCR#16766-1 86
1 will get the same output. And the check records file,
2 if you look at that data and you think it is okay, but
3 it just needs to be shifted over like a column or two,
4 you can do that...rename it, and rerun it with the good
5 records file, and you know, get more output.
6 Now, the ice free winds group key word,
7 beginning in I think around 2003, the weather service
8 began replacing cup and vain anemometers with the sonic
9 anemometers at the NWS and FAA sites. Basically, no
10 moving parts, they say "ice free," but I have heard
11 that birds like to use them to make nests...it makes a
12 good nest. The commission date of the sonic anemometer
13 at a stations input for AERMINUTE, it determines how
14 AERMINUTE is going to treat winds less than two knots.
15 So, when you are running AERMINUTE, if the station has
16 become part of the ice free winds group before or
17 during the data period you are processing, you would
18 put a "OY," and then the commission date on that
19 line...same line. If it is not part of the group
20 during the data period being processed, you can enter
21 an "N" for no, and you don't have to put a date.
22 However, if the commission date is after the data
23 period, and the user enters a "Y" and the date,
24 AERMINUTE will say, "okay, it is after this data
25 period, I am going to change it to "NO." So, you could

10TH CONFERENCE OF AIR QUALITY MODELS 03/13/2012 CCR#16766-1 87
1 still put it in AERMINUTE and it would interpret it
2 correctly, not worry about it.
3 So, how does AERMINUTE treat winds less
4 than two knots? So, for observations before stations
5 ice free wind commission date, or a station that is not
6 part of the ice free winds group, as of October 2009, I
7 don't think all of the stations had been converted over
8 yet. That is the latest update I have seen. So, for
9 those observations, their winds of zero or one knot,
10 because it is whole knots, are reset to one knot. The
11 wind speed will be used in the hourly average wind
12 speed, but we won't use the wind direction in the
13 hourly wind direction. And that observation is just
14 flagged as a calm for bookkeeping purposes. Now, if
15 for observations after a station's ice free wind
16 commission date, all wind speeds are considered valid.
17 There are not resetting of winds below two knots. So,
18 zero and one are treated as zero and one, because
19 AERMET will take care of that truncation issue that we
20 have talked about. After a station's ice free wind
21 commission date, you should see no calm hours in the
22 AERMINUTE output.
23 Continuing with the treatment of winds,
24 hourly winds are calculated from valid, calm, even
25 minutes first, and then any non-overlapping odd

10TH CONFERENCE OF AIR QUALITY MODELS 03/13/2012 CCR#16766-1 88
1 minutes. And for a given hour, say one o'clock, it is
2 going to use winds such as 12:02, 12:04, 12:06, et
3 cetera...just the hour before. So, what it does, it
4 gets all of the even minutes, and then it checks for
5 any non-overlapping odd minutes that it could use. An
6 hour is considered valid if it has at least two non-
7 calm observations in the first half of the hour, or at
8 least one non-calm observation in the last half of the
9 hour. Now, you are using one observation now to
10 represent an hour in standard days, so at least one in
11 the last half an hour, still okay. Also, if the hour
12 has more than 50 percent non-calm observations for the
13 whole hour, an hourly wind will be calculated.
14 Otherwise, the hour is going to be flagged as calm, and
15 AERMINUTE output will have a zero wind speed and zero
16 direction. And AERMET won't substitute that wind speed
17 and direction for a standard observation.
18 If the hour does not meet those
19 requirements of the...of these two requirements here,
20 it is considered invalid, and no hourly winds are
21 calculated. So, they will be set to missing in the
22 AERMINUTE output. And here is just an example for
23 Springfield, Vermont in 2006 to 2010, the pie chart on
24 the left is if you don't have AERMINUTE data in
25 the...and the right is with use AERMINUTE. So, you can

10TH CONFERENCE OF AIR QUALITY MODELS 03/13/2012 CCR#16766-1 89
1 see without AERMINUTE data, you have 51 percent calms
2 and 10 percent missing wind data, and after
3 incorporating AERMINUTE data, it goes down to three
4 percent calm and four percent missing. So, we are
5 reclaiming data, and this could help make this station
6 be used, you know, considered representative. And,
7 also the ice free winds commission date was November 7,
8 2005.
9 These are the wind class
10 frequencies...blue, is without AERMINUTE and red is
11 with AERMINUTE. As you can see, the calms go from over
12 50 percent down to less than ten. And the .5 to 2.1
13 with AERMINUTE almost corresponds to the same number.
14 I don't know if this is the exact same hours or not, I
15 would have to go back and check. And then as you see,
16 as you increase wind speed, you know, they become more
17 alike, and actually you get fewer higher wind speeds
18 with AERMINUTE. And these are just NO2 design valued
19 concentration ratios unpaired in space for this station
20 for example...for a CO EGU, a pulp and paper facility,
21 and a fuel oil turbine, these are from our AIWG work,
22 and we will talk about AIWG tomorrow. But, these are
23 just the ratios, design values with AERMINUTE divided
24 by without AERMINUTE and green are rural, yellow would
25 be urban...so, as you can see, we get quite a spread of

10TH CONFERENCE OF AIR QUALITY MODELS 03/13/2012 CCR#16766-1 90
1 ratios for NO2. And, we also...I think I used OLM with
2 a constant background...ozone concentration for fuels
3 from on the rural ratio are lower than urban, so you
4 get more of a difference with urban in some cases. And
5 then for SO2, the rural, or the ratios are pretty tight
6 distribution...the tails are the men in MACHs, the box
7 represents the 25th and 75th percentiles, the
8 horizontal line through the box is the median, and then
9 the red dot is like the average ratio. So, you get
10 more of a spread with the urban option than you do with
11 the rural, just for this station in particular. So,
12 this is just an example of sensitivity for this
13 particular station. You may not see this every single
14 time, it depends on how much data was filled in. So,
15 just some links of interest...the executable can be
16 found on SCRAM, along with Source code in the User's
17 Guide. The link to the monthly files are listed at
18 NCDC FTP site. Their files are arranged by year, and
19 they are named by the station call sign, and so it is
20 monthly files, and important...most importantly, they
21 are free. Then, also, there is a link to a PDF file
22 that lists the ice free wind commission dates. That is
23 as of October 2009, and I don't...haven't seen an
24 update since then. And like I said, I think there are
25 still a few stations that aren't listed in that list.

10TH CONFERENCE OF AIR QUALITY MODELS 03/13/2012 CCR#16766-1 91
1 So, and I think that is it for AERMINUTE.
2 MR. BRODE: Okay, I think there is going
3 to be somewhat of a common theme between James'
4 presentation and the AERSURFACE update in terms of...I
5 think of the issues we have been dealing with is sort
6 of finding and being able to utilize new data
7 resources, like the one- minute data, but at the same
8 time dealing with problems and issues with those data.
9 Like, the weird formats and things like that. In fact,
10 the winds are truncated instead of rounded to whole
11 knots, which apparently, they are in the process of
12 maybe trying to sometime fix...so, we have heard, but
13 we don't know how we are going to find out if they have
14 fixed it for a given station. But apparently, the
15 new...the latest update to the ASOS software is the
16 last item on the list to fix it...was to correct that,
17 so we are going to try to find out any way we can get
18 information on that, but George made a point, and I saw
19 it in the slides that actually with...with the
20 AERMINUTE data, some of the peak winds actually
21 disappear because the non ASOS one-minute data is a
22 single two-minute average wind speed, and you will get
23 some outliers on the high side that show up for
24 particular two minute average, but of the hourly
25 average quite often that is lower. So, this is the

10TH CONFERENCE OF AIR QUALITY MODELS 03/13/2012 CCR#16766-1 92
1 AERSURFACE update...oh, is there something else we were
2 going to say...so, this is a long presentation, but we
3 will plow through it.
4 Just review the current air surface
5 tool, and discuss some implementation issues with air
6 surface, and there is quite a few of them. Talk about
7 some efforts we have undertaken to try to validate air
8 surface in terms of the surface roughness...estimates
9 in particular and plans for enhancing it. Just to kind
10 of review, AERMOD met data needs, AERMOD was designed
11 explicitly to accept the same basic met inputs in terms
12 of ISC in terms of National Weather Service and Upper
13 Air data, and it was also designed to accept much more
14 real but site-specific data, if available, including
15 multiple levels of wind, and temperature, and
16 turbulence. But, the more advanced boundary layer
17 algorithms in AERMOD require user specified service
18 characteristics...the albedo, sort of measure of
19 reflectiveness of the surface. Bowen ratio, could have
20 an indication of moisture, and surface
21 roughness...those are the three inputs, and requirement
22 for these inputs in the sensitivity of the model to
23 service characteristics has been one of the main
24 implementation issues with AERMOD that we have been
25 working with.

10TH CONFERENCE OF AIR QUALITY MODELS 03/13/2012 CCR#16766-1 93
1 So, AERSURFACE was developed as a tool
2 to assist with determining service characteristics for
3 input to AERMET as well as AERSCREEN, and the initial
4 version, which is still the current version of
5 AERSURFACE was released in January 2008. And the
6 AERMOD implementation guide, which we haven't updated
7 in a while, but it explicitly describes the methodology
8 included in AERSURFACE for estimating surface roughness
9 and so on. But, at this point, AERSURFACE is not
10 considered part of the regulatory modeling system for
11 AERMOD, unlike AERMET and AERMAP, so basically, you
12 don't have to use AERSURFACE, it is a tool that we
13 think is useful, and but it has some issues, but it is
14 not a requirement. And part of that is due to the
15 issues...limitations with the data that we have, and
16 other issues and complexities that we...determining
17 effective surface roughness is a technically
18 challenging topic.
19 So, as I mentioned, the AERMOD
20 implementation guide actually documents recommended
21 method for estimating surface roughness in Section 3.1,
22 and that method is what is implemented in AERSURFACE.
23 I would point out this method is quite different from
24 the method that was included in the AERMET users guide
25 prior to the release of AERSURFACE, especially in terms

10TH CONFERENCE OF AIR QUALITY MODELS 03/13/2012 CCR#16766-1 94
1 of surface roughness. So, the AERMET user's guide
2 actually suggested using a simple area weighted average
3 of surface roughness within three kilometers of the
4 measurement site. One ratio albedo, I think we are
5 also three kilometers. So, it was a pretty big change
6 when we released AERSURFACE to use something different.
7 And what we have changed to was an inverse distance
8 weighted geometric mean of the roughness values within
9 a default radius of one kilometer of the measurement
10 site, and that is another part is AERSURFACE...I mean,
11 our recommendation is, that the surface roughness
12 should be representative of the measurement site where
13 the winds are collected, because the wind data and the
14 surface roughness go into AERMET to determine the
15 turbulence properties of the atmosphere. Bowen ratio
16 and albedo are a little bit different. The calculation
17 method is different. It is for a bowen ratio it is the
18 gridded geometric mean of the gridden bowen ratio
19 values across the ten by ten kilometer domain without
20 any sector or distance dependent. Typically, that may
21 be centered on the same location for surface roughness,
22 the met tower, but the AERMOD implementation guide
23 indicates that if the majority of sources are elevated
24 releases, where those parameters may be more important,
25 then it may be appropriate to determine bowen ratio and

10TH CONFERENCE OF AIR QUALITY MODELS 03/13/2012 CCR#16766-1 95
1 albedo for your application site. So, basically,
2 surface roughness influences all types of sources, but
3 it certainly is dominant for low level releases, peak
4 concentrations for low level releases typically occur
5 during stable conditions. Bowen ratio and albedo only
6 influence the convective hours. So, they are not even
7 going to come into play at all for those. So, for
8 elevated releases, peak concentrations, typically occur
9 during the day time due to convective conditions that
10 bring the plume down, and so bowen ratio albedo play a
11 more important role in those cases, and that is one of
12 the reasons for that, you know, making that
13 distinction. Right now, you would have to run
14 AERSURFACE twice if you wanted to do that.
15 Current version supports the 1992 land
16 cover data in LCD...land cover data has 21 land cover
17 categories at a 30 meter horizontal resolution. There
18 is a number of options. User can define the number of
19 sectors and the widths within certain limits. Ask
20 whether you want monthly, seasonal, or annual
21 resolution of the surface characteristics. You know,
22 if the moisture conditions for use with the bone ratio
23 and so forth. One of the key things is the AERSURFACE
24 ask at might an airport or not an airport, and there is
25 a reason for that. This is a table of the 1992 land
10TH CONFERENCE OF AIR QUALITY MODELS 03/13/2012 CCR#16766-1 96
1 cover categories, and one of the categories we are
2 going to talk about is, you know, for the developed you
3 have low intensity, high intensity residential, and
4 then commercial, industrial transportation is one
5 category there. This is the look-up table that is
6 incorporated in AERSURFACE for surface characteristics
7 for roughness in particular, so for each of those
8 categories, we have a representative surface roughness
9 value based on five seasons. Everybody thinks there is
10 four, but mid-summer with vegetation, autumn
11 unharvested crop land, late autumn after harvest, and
12 then winter with or without snow, and then winter with
13 snow, and then spring. So, there is basically
14 distinguished as being between autumn with and
15 without...before and after harvest, but any way. This
16 is an example of '92 data for North Carolina. Zoom in
17 a little bit closer that Durham area, you can pick up
18 the footprint o f the RDU Airport pretty clear. The
19 orange is that...one of the categories is the urban
20 recreational grass. The red category, that is the
21 runways and so on. So, one of the issues is, we have
22 uncertainties about the ASOS METAR location, that is a
23 key input. You tell AERSURFACE where my METAR is, and
24 then it has a one kil...it looks at a one kilometer
25 radius around that to determine the surface roughness.

10TH CONFERENCE OF AIR QUALITY MODELS 03/13/2012 CCR#16766-1 97
1 National Climatic Data Center has an Excel spreadsheet
2 on their website with ASOS station locations, which is
3 really nice, except for the fact that it is completely
4 unreliable as far as the location. But, how we found
5 out about that was there was a cyclone wind study that
6 was done where...I don't know, grad students or
7 somebody went to about 200 ASOS sites, took pictures of
8 the met tower, estimated roughness of the around the
9 met tower, and then reported some coordinates, which
10 happened to be different than the others filed. Maybe
11 quite different, in fact, the median difference between
12 the NCDC's list and that list was about 500 meters.
13 And where folks saying, that is not good. And at RDU,
14 which I have actually been to, difference was about
15 over two kilometers. So, we are looking at one
16 kilometer radius by the met tower and the met tower
17 location is off by two kilometers. That is not a good
18 situation.
19 So, these are the stations in the ASOS
20 wind study. There is the comparison, there is the
21 difference there, and let's see...Orange Municipal
22 Airport 1.3 kilometers, JFK 3.6 kilometers, 300
23 kilometers...there are a few that stick out like that,
24 and that is where they were...you know, they had an
25 error, it was actually three degrees off longitude or
10TH CONFERENCE OF AIR QUALITY MODELS 03/13/2012 CCR#16766-1 98
1 latitude. But any way, here are some ideas...we
2 highlight this in the AERSURFACE Users Guide that that
3 information may be unreliable. You should try to
4 verify the tower location if you can. There is a
5 number of different things you can do. NCDC does have
6 station history for all of the ASOS sites...it includes
7 aerial photos if you know how many times to click and
8 where to click. It is called the "Multi-Network Meta
9 Data System," but that is not always reliable...but, it
10 might be, and actually shows the history. But, you can
11 actually zoom in, and on Google Earth aerial photos,
12 you might actually be able to identify the tower
13 location if it is a high resolution thing, but there
14 might be some other installations at the airport that
15 look like a met tower, so you have to be careful about
16 that. I am hoping over time, maybe state agencies will
17 have compiled what they think are reliable information
18 on this and share them, but on the ISHD data format,
19 the you know, sort of standard data format we are
20 working with actually has a station location in their
21 coordinates, but that may not be reliable. In fact, it
22 may vary depending on the type of observation. And we
23 found for Reagan National Airport, on certain types of
24 observation, it had the right coordinates, on others it
25 didn't, so. So, these are the fun issues we have to
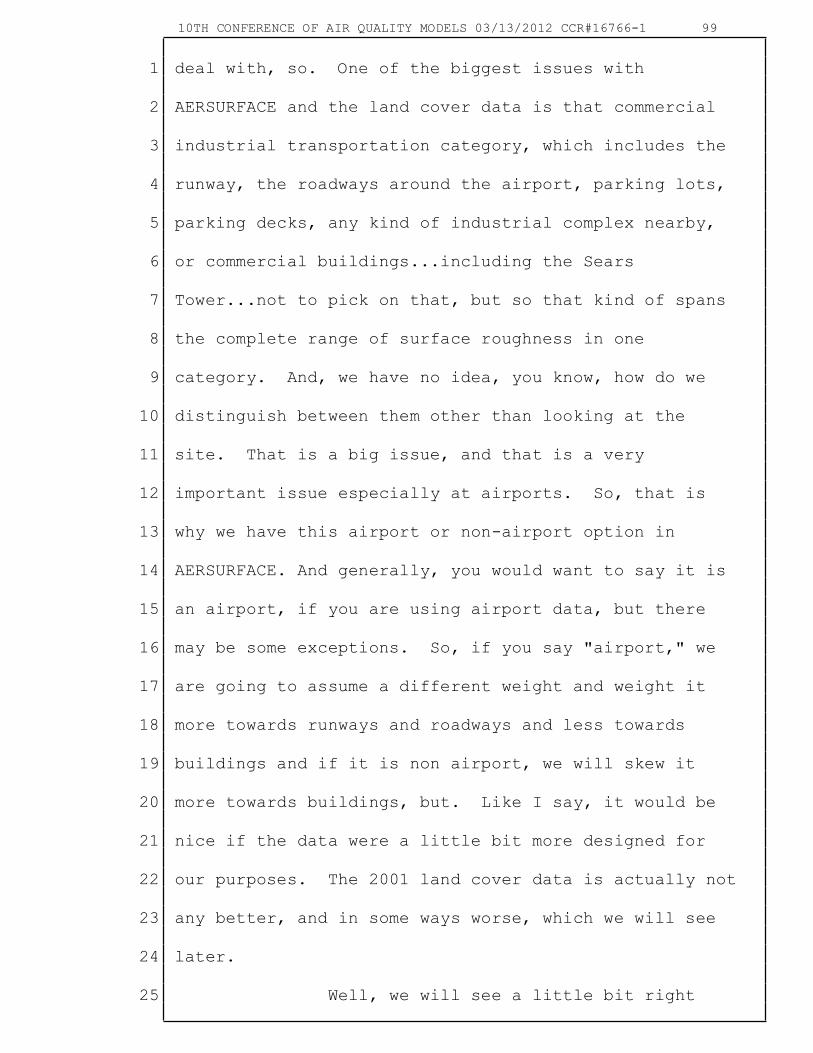
10TH CONFERENCE OF AIR QUALITY MODELS 03/13/2012 CCR#16766-1 99
1 deal with, so. One of the biggest issues with
2 AERSURFACE and the land cover data is that commercial
3 industrial transportation category, which includes the
4 runway, the roadways around the airport, parking lots,
5 parking decks, any kind of industrial complex nearby,
6 or commercial buildings...including the Sears
7 Tower...not to pick on that, but so that kind of spans
8 the complete range of surface roughness in one
9 category. And, we have no idea, you know, how do we
10 distinguish between them other than looking at the
11 site. That is a big issue, and that is a very
12 important issue especially at airports. So, that is
13 why we have this airport or non-airport option in
14 AERSURFACE. And generally, you would want to say it is
15 an airport, if you are using airport data, but there
16 may be some exceptions. So, if you say "airport," we
17 are going to assume a different weight and weight it
18 more towards runways and roadways and less towards
19 buildings and if it is non airport, we will skew it
20 more towards buildings, but. Like I say, it would be
21 nice if the data were a little bit more designed for
22 our purposes. The 2001 land cover data is actually not
23 any better, and in some ways worse, which we will see
24 later.
25 Well, we will see a little bit right

10TH CONFERENCE OF AIR QUALITY MODELS 03/13/2012 CCR#16766-1 100
1 here, so...and I was going to add another box there,
2 so...the categories are different, that is one thing
3 quite different. There is no urban recreational grass
4 category, that sort of orange area around the runways
5 at RDU that you saw...that is a nice category to have
6 because we know it is low roughness, but it is not in
7 there, so that area would show up as developed open
8 space in 2001. So a little bit less vague, and so
9 there is four developed categories. The only
10 distinction is the percent impervious land cover. Open
11 space less than 20 percent, low intensity 20 to 50,
12 medium 50 to 80. High is over 80. So, we also don't
13 have low intensity residential or high intensity
14 residential. So, low intensity residential, we kind of
15 assume it is buildings, and some trees, and maybe some
16 grass. So, we don't know where, that is probably maybe
17 in here, but it is just hard to tell. So, even at a
18 runway from the grassy area next to the runway open
19 space to partly on the runway. It is low intensity and
20 if it is a wide enough runway, we will actually have
21 some high intensity developed category, and then go
22 back to low. So, just going back to the grass, across
23 the runway to the grass, we could span all four
24 categories. So, it is unfortunate, but we are doing
25 the best we can to deal with it. So, that is one of
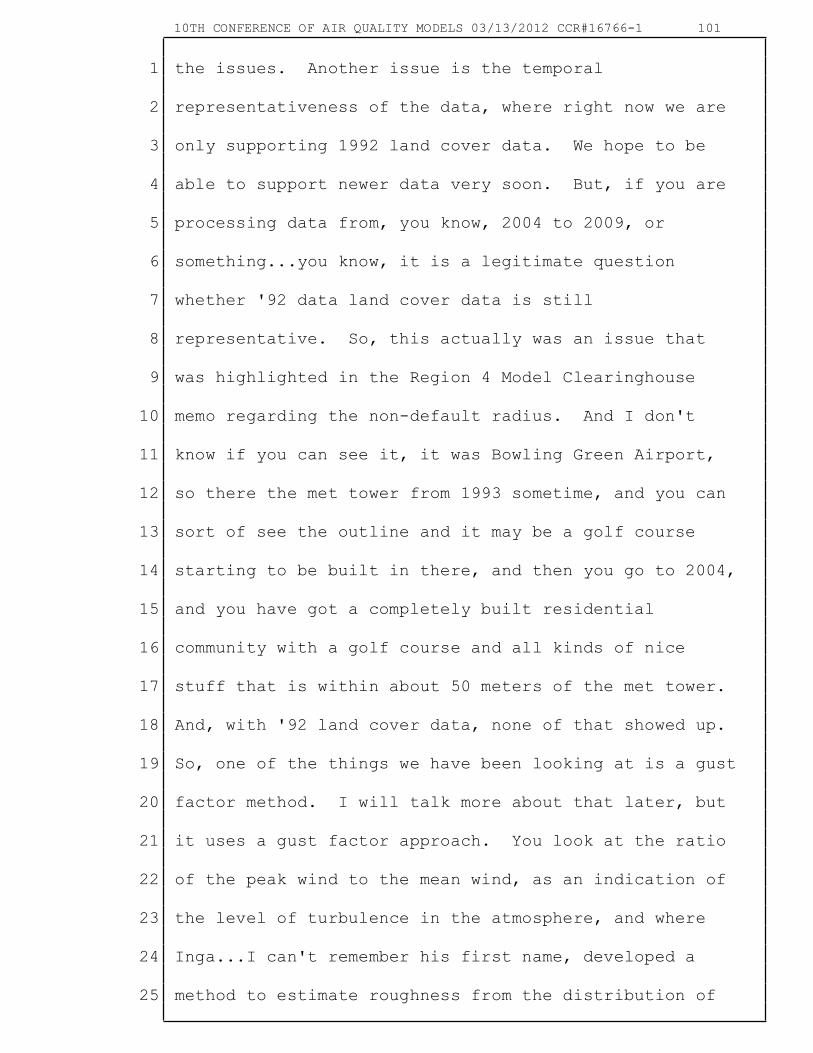
10TH CONFERENCE OF AIR QUALITY MODELS 03/13/2012 CCR#16766-1 101
1 the issues. Another issue is the temporal
2 representativeness of the data, where right now we are
3 only supporting 1992 land cover data. We hope to be
4 able to support newer data very soon. But, if you are
5 processing data from, you know, 2004 to 2009, or
6 something...you know, it is a legitimate question
7 whether '92 data land cover data is still
8 representative. So, this actually was an issue that
9 was highlighted in the Region 4 Model Clearinghouse
10 memo regarding the non-default radius. And I don't
11 know if you can see it, it was Bowling Green Airport,
12 so there the met tower from 1993 sometime, and you can
13 sort of see the outline and it may be a golf course
14 starting to be built in there, and then you go to 2004,
15 and you have got a completely built residential
16 community with a golf course and all kinds of nice
17 stuff that is within about 50 meters of the met tower.
18 And, with '92 land cover data, none of that showed up.
19 So, one of the things we have been looking at is a gust
20 factor method. I will talk more about that later, but
21 it uses a gust factor approach. You look at the ratio
22 of the peak wind to the mean wind, as an indication of
23 the level of turbulence in the atmosphere, and where
24 Inga...I can't remember his first name, developed a
25 method to estimate roughness from the distribution of

10TH CONFERENCE OF AIR QUALITY MODELS 03/13/2012 CCR#16766-1 102
1 those gust factors. So, again we had the one-minute
2 data resource, so we are using it to supplement the
3 very calm and variable winds, but we are also using it
4 to estimate roughness because the one-minute data has
5 two minute average wind speeds, and then the peak wind
6 for two minutes. So, it has got two columns...the
7 average speed and the peak. So, we actually can get
8 that from the data, which has turned out to be pretty
9 useful. So, this shows the results from AERSURFACE,
10 which shows pretty low roughness towards the north, and
11 if you look at...you know, if there is nothing there,
12 that is actually the most open sector around the met
13 tower, at least in '92, with the gust factor, it shows
14 that is the highest roughness. So, it
15 reflects...clearly reflects the influence of those land
16 cover changes in the data.
17 Another issue that has shown up is
18 sometimes the land cover categories are mis-classified
19 in the data for a particular site, so users should
20 really try to have a look at that and compare the land
21 cover data, learn the categories, and then compare it
22 to other information...aerial photos, or whatever to
23 assess the representativeness of the land cover data.
24 And Google Earth, again, may be an option because you
25 can actually look at aerial photos for different times

10TH CONFERENCE OF AIR QUALITY MODELS 03/13/2012 CCR#16766-1 103
1 depending on what is available for that site. And here
2 is an example for Albany, where much of the area around
3 the airport was actually classified as low-intensity
4 residential rather than what might be more appropriate
5 the urban recreational grass. So, that is the aerial
6 photo. Here is the met tower, one kilometer radius, so
7 yes, that area kind of typical...you have the runway,
8 and then you have this very open area, which looks like
9 a nice grassy area. Here is th eland cover data, picks
10 up a little of the oranges, the urban recreational
11 grass, but that light pink, which kind of dominates
12 that area, that is low intensity residential. So, that
13 one theory at the time was that there must have been
14 Lilliputians living at the airport in '92, they didn't
15 show up on the Google Earth. So, if you ran with the
16 '92 land cover data, you would get roughnesses up here
17 about .2 to .25 meters for roughness. The gust factor
18 actually...this thing is kind of losing its
19 duct...shows that it significantly overestimates
20 roughness for that site.
21 Let's see, Implementation Number 3, what
22 are we on...one of the users had commented that some of
23 the categories under the land cover we used an
24 arithmetic mean average across different categories.
25 Like, for example, low intensity residential has

10TH CONFERENCE OF AIR QUALITY MODELS 03/13/2012 CCR#16766-1 104
1 probably got some houses, which is buildings, maybe
2 some trees, and then maybe some lawn, so some mix of
3 those categories. And we have categories for trees and
4 buildings and houses, so...but we use an arithmetic
5 mean average, which they said is not consistent with
6 what you do inside air surface, which is using a
7 geometric mean...weighted geometric mean. And that was
8 a legitimate comment. So, we revisited those, and we
9 have actually made some adjustments to those tables,
10 look-up tables for four categories...low intensity
11 residential, the commercial industrial transportation
12 and so on, and the new values tend to be slightly lower
13 than the originals, but not a lot. But, we also
14 adjusted the weighting that we used. So they were
15 weighted, area weighted. But in doing that, I think
16 the weights that we developed for the geometric mean
17 values are actually more appropriate given the
18 definition of the categories. So, these are the
19 categories...the low intensity residential went from
20 about .5 to .4 or so. Again, generally, slightly lower,
21 and that's...those changes aren't in the version that
22 is on the screen now, but they will be in a very soon
23 to be released update.
24 So, another implementation issue as I
25 mentioned, we went from what the AERMET User's Guide

10TH CONFERENCE OF AIR QUALITY MODELS 03/13/2012 CCR#16766-1 105
1 recommended, three kilometer area weighted averages,
2 especially for roughness to the one kilometer distance.
3 Some concerns have been expressed about making that
4 revision, and the justification for the default one
5 kilometer radius had been sort of questioned. And
6 certainly, it was the...this issue was the issue that
7 prompted the first model Clearinghouse action for
8 AERMOD. So, this issue sort of highlights the need to
9 kind of see what we do to validate AERSURFACE. How do
10 we know if one kilometer radius is right or not. So,
11 that is where the gust factor comes in, and that is
12 what we have been doing some work on. Warringah
13 published a paper, and BAMS, Bulletin of the American
14 Meteorological Society in 1980 that...for estimating
15 effective roughness based on gust factors. And what we
16 have seen so far is that the gust factor results appear
17 to be very reasonable based on what the site actually
18 shows. You saw for the Bowling Green example, it very
19 clearly picked up the influence of those land cover
20 changes to the north, and they generally compare pretty
21 well to AERSURFACE estimates when the land cover data
22 going into AERSURFACE is, you know, pretty well
23 defined. That there aren't issues there. You know,
24 can't highlight the significant impact of temporal
25 changes, may also highlight some issues with land cover
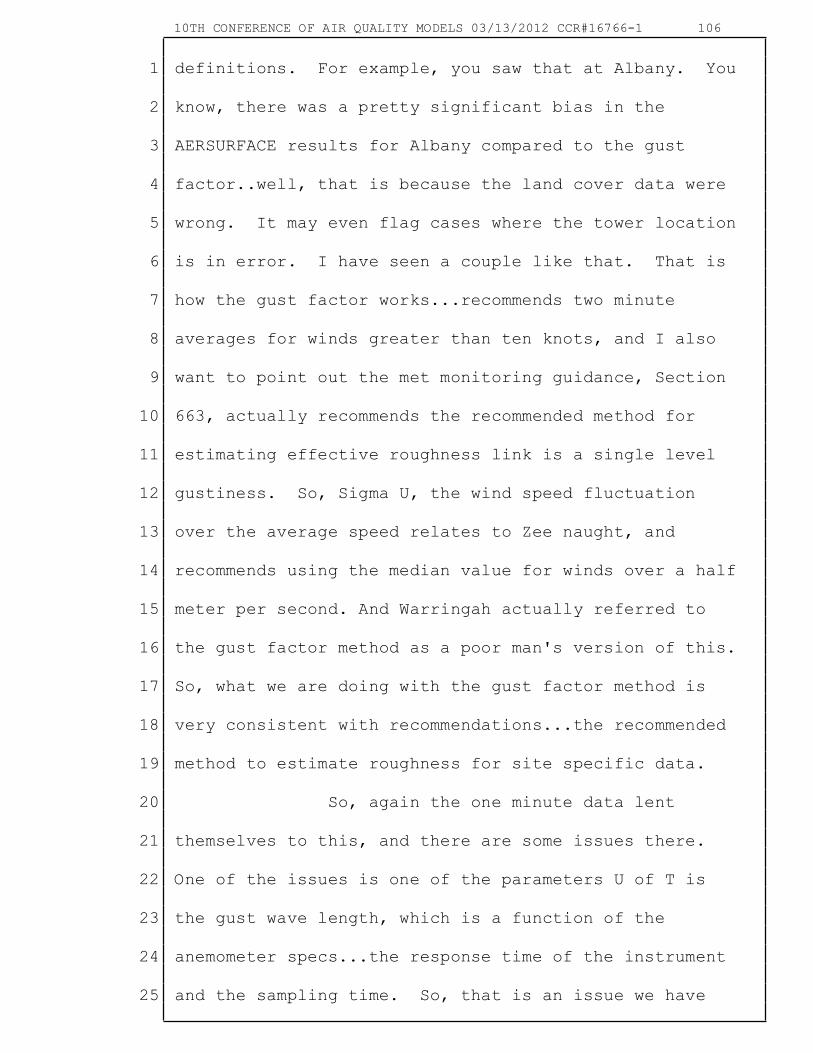
10TH CONFERENCE OF AIR QUALITY MODELS 03/13/2012 CCR#16766-1 106
1 definitions. For example, you saw that at Albany. You
2 know, there was a pretty significant bias in the
3 AERSURFACE results for Albany compared to the gust
4 factor..well, that is because the land cover data were
5 wrong. It may even flag cases where the tower location
6 is in error. I have seen a couple like that. That is
7 how the gust factor works...recommends two minute
8 averages for winds greater than ten knots, and I also
9 want to point out the met monitoring guidance, Section
10 663, actually recommends the recommended method for
11 estimating effective roughness link is a single level
12 gustiness. So, Sigma U, the wind speed fluctuation
13 over the average speed relates to Zee naught, and
14 recommends using the median value for winds over a half
15 meter per second. And Warringah actually referred to
16 the gust factor method as a poor man's version of this.
17 So, what we are doing with the gust factor method is
18 very consistent with recommendations...the recommended
19 method to estimate roughness for site specific data.
20 So, again the one minute data lent
21 themselves to this, and there are some issues there.
22 One of the issues is one of the parameters U of T is
23 the gust wave length, which is a function of the
24 anemometer specs...the response time of the instrument
25 and the sampling time. So, that is an issue we have

10TH CONFERENCE OF AIR QUALITY MODELS 03/13/2012 CCR#16766-1 107
1 been kind of working with is, you know, the response
2 time of sonic is different than a non-sonic in an
3 airport. So, that is going to affect it. But, the
4 other change is before...for the non- sonic sites, the
5 peak winds is a five second average...block five second
6 average. The two minute averages are based out of
7 those five second values. If it is sonic, then it uses
8 a rolling three second average for the peak wind. So,
9 it is a shorter averaging period, but it also is a
10 rolling average, so it could...for a given two minute
11 average wind speed, you could actually...the peak wind
12 for that could actually reflect samples from outside
13 that two minute period. So, that may tend to bias
14 things a little bit higher for sonic, but RDU, as it
15 turns out, is one of the better sites to sort of
16 understand what is going on. You have got met tower
17 there, you have got...you know, typical area of runway
18 and grass, and then you have a very clear discontinuity
19 with trees to the northwest. And then, there is even an
20 issue with land cover change. This is I-540, which did
21 not exist in '92, but does exist now, and shows up in
22 the 2001 land cover. Again, that is the urban
23 recreational grass category. That reddish is that, you
24 know, commercial industrial transportation. So, it
25 covers a lot of different things. This is the 2001

10TH CONFERENCE OF AIR QUALITY MODELS 03/13/2012 CCR#16766-1 108
1 data for the same site, and you can see 540 showing up
2 there as developed. But, you can see the developed
3 open space...orange is developed open space, but then
4 you just...hard to distinguish between grass and runway
5 and building. There is some of the photos. I
6 mentioned cyclone wind study...RDU was one of them.
7 That's...if you are using any of those stations kind of
8 on the east coast to south coast, then that is a very
9 useful resource. It might help determine where the
10 tower actually is based on that. Here are some of
11 their preliminary results. A lot of lines there, but
12 looking at the gust factor for each year from 2001 to
13 2008 compared to AERSURFACE estimates for '92 and 2001
14 data, that is a beta version. Overall, they kind of
15 follow a pretty good trend. 2001 tends to
16 underestimate a little bit for the peak winds, but the
17 peak roughness is in the direction you would expect
18 based on that tree line. But you notice that there is
19 trees about just at one kilometer and beyond to the
20 southeast, but you really don't see much showing up
21 there in the gust factor data. So, it kind of confirms
22 that one kilometer radius may not be that bad. This
23 just shows the average gust factor...again, it matches
24 '92 better. So, this is what we would get for RDU,
25 that top line using the original method...which

10TH CONFERENCE OF AIR QUALITY MODELS 03/13/2012 CCR#16766-1 109
1 produced very high roughnesses over one meter for many
2 sectors. And that was actually...the first version of
3 AERSURFACE that we had developed internally actually
4 included that method, and that is what we saw, and that
5 is when I started to realize...gee, that doesn't make
6 sense, you know, what is going on there? So, whereas,
7 we are down at the gust factor data is...way down here.
8 So, you would have to really assume a tremendous amount
9 of bias in the gust factor estimates to believe that
10 that is more appropriate. There is the three kilometer
11 radius which brings in a lot more high roughness. How
12 much time have I got? Two minutes, and then I have got
13 AERMET after that. No problem.
14 Another interesting site is Atlanta.
15 This is around 2000, showing the runways, there is the
16 met tower, and then some trees and residential area
17 pretty close by. That is the '92 land cover, so that
18 is the urban recreational grass, and then the
19 develop...you know, the transportation thing, and then
20 there is light...low intentional residential, high
21 intentional residential plus some trees. There is the
22 2001 land cover data, which you could sort of pick up
23 the runways there, but the grass area is just the low
24 intensity...developed open space. But, not sure what
25 is going on there, so you can actually see the trees to
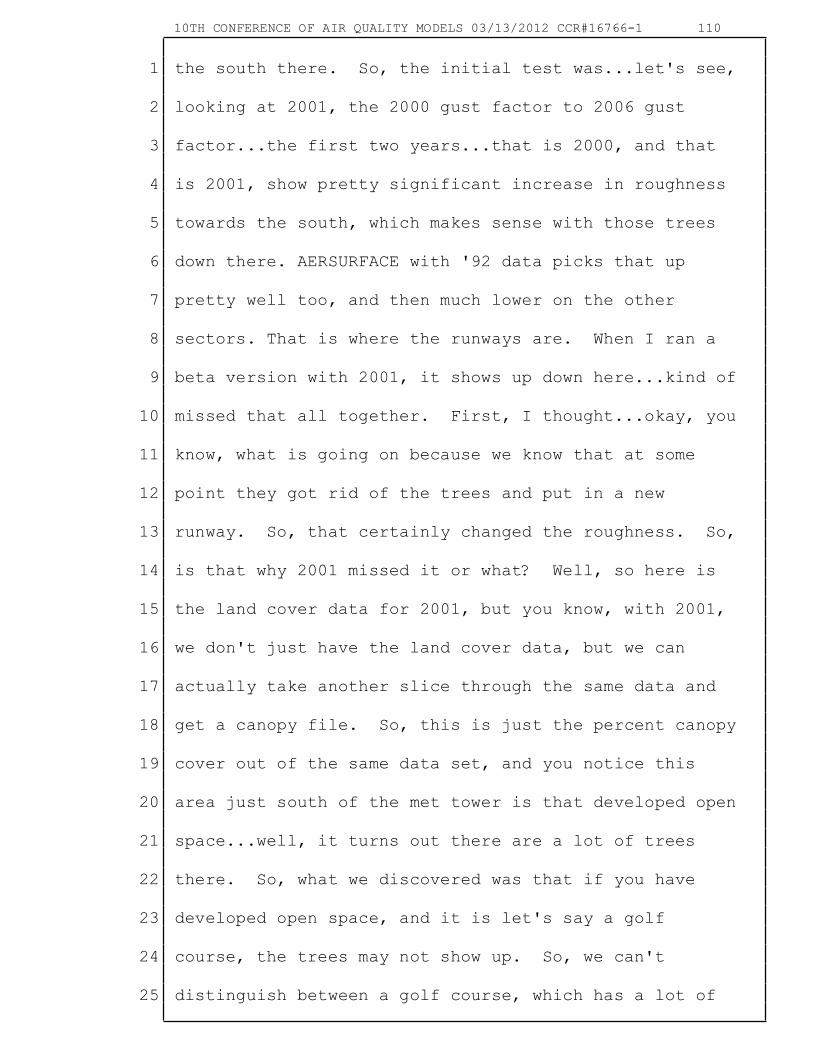
10TH CONFERENCE OF AIR QUALITY MODELS 03/13/2012 CCR#16766-1 110
1 the south there. So, the initial test was...let's see,
2 looking at 2001, the 2000 gust factor to 2006 gust
3 factor...the first two years...that is 2000, and that
4 is 2001, show pretty significant increase in roughness
5 towards the south, which makes sense with those trees
6 down there. AERSURFACE with '92 data picks that up
7 pretty well too, and then much lower on the other
8 sectors. That is where the runways are. When I ran a
9 beta version with 2001, it shows up down here...kind of
10 missed that all together. First, I thought...okay, you
11 know, what is going on because we know that at some
12 point they got rid of the trees and put in a new
13 runway. So, that certainly changed the roughness. So,
14 is that why 2001 missed it or what? Well, so here is
15 the land cover data for 2001, but you know, with 2001,
16 we don't just have the land cover data, but we can
17 actually take another slice through the same data and
18 get a canopy file. So, this is just the percent canopy
19 cover out of the same data set, and you notice this
20 area just south of the met tower is that developed open
21 space...well, it turns out there are a lot of trees
22 there. So, what we discovered was that if you have
23 developed open space, and it is let's say a golf
24 course, the trees may not show up. So, we can't
25 distinguish between a golf course, which has a lot of
10TH CONFERENCE OF AIR QUALITY MODELS 03/13/2012 CCR#16766-1 111
1 trees, and the grassy area next to the runway. That is
2 why I say 2001 is not really any better and in some
3 ways worse, but at least we have that...that may help.
4 But, you know, there is certainly that temporal
5 change...removing the trees, put in a runway, and this
6 shows up in the average speeds by direction by year.
7 So, yes, the lowest speeds for winds from the south
8 which would kind of make sense because of all of that
9 roughness. But you see a pretty clear trend for the
10 wind and average wind speed to increase after that to
11 about a meter per second difference, which is quite a
12 bit when you are down in two to three meters a
13 second...that is a pretty significant change wind
14 speed, and that kind of highlights the point that if
15 you...If you have the trees there, and you don't
16 account for that...the fact, I mean the trees are
17 there, means the wind speeds are lower. You get rid of
18 the trees, the wind speed goes higher. So, there is
19 this interaction between the roughness elements and the
20 wind speed. If you run a high wind speed with a high
21 roughness that is not representative, you are going to
22 get maybe not appropriate results, or vice versa. So,
23 it just kind of highlights that point.
24 So, what we want to do is try to
25 evaluate AERSURFACE more thoroughly. Kind of mentioned

10TH CONFERENCE OF AIR QUALITY MODELS 03/13/2012 CCR#16766-1 112
1 the gust factor method, now this is the new
2 effected...so, this is an issue that AERMIC talked
3 about, so I can skip part of my next presentation.
4 And, you know, given the issues of the data, but you
5 know, how do we know one kilometer is the right radius?
6 I mean it is a very complex process. They are probably
7 site dependencies. There could be met dependencies,
8 and so on. But, AERMIC, actually in response developed
9 an alternative approach based on an internal boundary
10 layer approach to...which we are calling the effective
11 roughness method. And, it is based on what distance do
12 you need to build the boundary layer up to the
13 appropriate height at the measurement site to determine
14 the effective roughness? And so it is
15 related...instead of putting a radius into AERSURFACE,
16 you would put in a measurement height. And it
17 determines the boundary layer height based on that is
18 the multiplier. And what we found is that the
19 multiplier of six seems to be pretty reasonable, but it
20 is pretty consistent with Warringah, another paper he
21 wrote on this. He referred...suggested 60 meters as a
22 roughness blending height. So, that seemed to be
23 pretty good. So, here is the effective roughness
24 method, I am not going to go into detail. But, it
25 basically accounts for the influence of changes in land

10TH CONFERENCE OF AIR QUALITY MODELS 03/13/2012 CCR#16766-1 113
1 cover, changes in the boundary layer...an internal
2 boundary layer development due to changes in land
3 cover. And, so we want to take into account what the
4 characteristics actually are at the site, and that sort
5 of illustrates boundary layers.
6 So, what we do is we start at the met
7 tower with this method, and we calculate the boundary
8 layer...internal boundary layer growth out to the point
9 where it reaches that reference height, which right now
10 is six times the anemometer height. Well, we want to
11 know what the roughness is for winds coming towards the
12 tower, but...so, this is going to tend to weight land
13 cover close to the tower more, because the boundary
14 layer is still kind of low at that point. So, what we
15 do is we would go to that point, and then we would turn
16 around and go back the other way, and build the
17 boundary layer towards the tower, which will tend to
18 weight land cover further from the tower more, which is
19 not necessarily ideal either. But we iterate that
20 until we sort of get the outward radius/inward radius
21 in about the same, and then what we do is we take the
22 effective roughness each way and take the geometric
23 mean, which seems to work pretty well. So, that is the
24 current method that we have been working it with.
25 Again, one of the issues in the gust factor is the wave

10TH CONFERENCE OF AIR QUALITY MODELS 03/13/2012 CCR#16766-1 114
1 length, and I sort of had an idea what the range might
2 be depending on what type of instrument...But, you know
3 documentation for the specs for ASOS instruments isn't
4 all that clear, but you know, there is this difference
5 between pre and post sonic, and how do we treat that?
6 So, recently, thanks to Region 5, looked at Peoria
7 Airport, which is the metric...what am I looking
8 for...it was the key I was looking to sort of try to
9 pin down U of T, because Peoria has some pretty clearly
10 defined sector influences with the trees there. Peoria
11 hasn't changed much over the last ten or so years.
12 And, we also went to commission sonic in September
13 2006, we actually have at least five years of pre-sonic
14 and five years of post-sonic data at a site that hasn't
15 really changed much, that has some pretty clear
16 roughness signals. So, based on those comparisons, I
17 have sort of come to the point where our current
18 recommendation would be 60 for a pre-sonic and 10 for
19 post-sonic data. And this kind of shows that, so there
20 is the pre-sonic data plotted year by year, compared to
21 the pre-sonic average and post-sonic average. So there
22 is pretty good consistency there. Then, you go the
23 other way, and there is pretty good consistency there.
24 So, I feel pretty good about that. Comparing it to the
25 effective roughness methods, it is not too bad, but if

10TH CONFERENCE OF AIR QUALITY MODELS 03/13/2012 CCR#16766-1 115
1 you go back to RDU, so there is the gust factor range
2 for RDU...again, it picks up the signal, but there is a
3 little more noise. And then there is pre and post-
4 sonic. There is not that much post-sonic...or, that is
5 the post-sonic, so there is only a couple of years
6 there, but there is some consistency, so this is the
7 key point I am getting to. So, this compares the
8 roughness estimates for RDU with the effective
9 roughness method we just talked about...compared to the
10 gust factor estimates, and it shows both 1992 land
11 cover data plus the 2001 land cover data...hopefully,
12 you can see those. And that actually shows pretty
13 good. I mean, the north sector is a little bit
14 complicated there...one thing is a lot fewer winds that
15 come from the north at the airport, so the gust factor
16 results are a little bit more scattered. But overall,
17 that is pretty good agreement. 2001 and '92 land cover
18 estimates matched up pretty well with each other and
19 the gust factor . If we go back to the old method, with
20 those slight adjustments, '92 still looks pretty good,
21 but 2001, actually underestimates for that northwest
22 sector. So, if we go back here, you can see the '92
23 data doesn't have the I-40/I-540 corridor...2001 does.
24 The met tower is up around here somewhere. So, that
25 little area is within one kilometer of the met tower.

10TH CONFERENCE OF AIR QUALITY MODELS 03/13/2012 CCR#16766-1 116
1 So, what happened is, with 2001, going out to one
2 kilometer, it picks up that area there, which if it is
3 an airport site, it is going to assume it is low
4 roughness. So, that introduces a biased underestimate
5 the roughness for 2001 with the old way. But, with the
6 effective roughness method, it actually doesn't go out
7 that far...the effective roughness is just short of
8 that, an so it actually matches up pretty well. So,
9 that is very encouraging that this effective roughness
10 method, you know, picks up some signals like that and
11 seems to overall compare better to gust factor
12 methods...or gust factor results.
13 So, let's see how much more
14 time...Atlanta, is kind of an interesting one...so,
15 there is the gust factor at different values of U of T.
16 The blue one is kind of what we are targeting, and
17 2001, with the impervious and the canopy picks up part
18 of it, but not this part. If you just run 2001, the
19 ERM3.5 is sort of what we are on now. So, if we had
20 used 2001 land cover data with the effective roughness
21 method, but without the canopy file, it just misses the
22 trees all together. So, bringing in the canopy layer
23 sort of addresses that problem, but we have got this
24 issue out here to the southeast, where there is
25 actually some new buildings fairly nearby, and play a

10TH CONFERENCE OF AIR QUALITY MODELS 03/13/2012 CCR#16766-1 117
1 more important role there than the trees, and so there
2 is the buildings. And if we go in and use the non-
3 airport option for that...to skew things more toward
4 the building, it actually brings it into much better
5 agreement. So, this is encouraging. So, the plans are
6 to first, get an update to the current version that has
7 those Zee naught adjustments I talked about, also
8 addresses some bugs in terms of the GeoTIFF file
9 structure, better air handling there, and also
10 addresses what has shown up in some cases...sensitivity
11 to the distance of the tower location from the center
12 of the pixel. So, that is sort of the near term
13 release...hopefully, very, very soon. But we would
14 like to plan to release a beta version of this
15 effective roughness method, not necessarily to replace
16 the other one, but as another option to get some more
17 testing. There are still some issues that
18 remained...what do I do if I have site specific data
19 and my measurement height is 50 meters? Do I still go
20 up six times that? There are some issues that we are
21 looking in there...but, we also plan to release the
22 gust factor tool as well once we clean it up a little
23 bit, and make it a little bit more user friendly, and
24 develop guidance on how to use it. It may not be a
25 replacement for AERSURFACE, but it certainly could be
10TH CONFERENCE OF AIR QUALITY MODELS 03/13/2012 CCR#16766-1 118
1 from what we have seen...a useful supplement to
2 AERSURFACE could identify issues with the land cover
3 data, or as we have shown here, and it may actually be
4 appropriate if...I mean one of the issues with using it
5 in place of AERSURFACE is...I have yet to be able to
6 see it pick up a seasonal signal, so if you have a site
7 where there isn't much seasonal variation, then it
8 actually may be appropriate to just use a gust factor
9 if you have the one minute data as your basis.
10 There is other future plans which we
11 have talked about for AERSURFACE that have been kind of
12 on hold for a while being with all of these other
13 issues, but we, you know, have discovered that the NED
14 and SRTM that shuttle research or mission or whatever,
15 that SRTM data reflects the top of the reflecting
16 surface. So, it actually...if you have buildings, it
17 shows the elevation of the top of the building. NED is
18 supposed to reflect ground elevations. If you take the
19 difference of elevation between the two, it actually
20 can give you some idea of whether there is an obstacle
21 there and what its height might be. So, it might allow
22 us to distinguish between highly developed grid cells
23 that are runways or buildings, but there are some
24 difficulties and complexities...they no longer provide
25 the SRTM data in the seamless server, where you get the

10TH CONFERENCE OF AIR QUALITY MODELS 03/13/2012 CCR#16766-1 119
1 NED data. They moved it somewhere, I am not sure
2 where. But, just a real quick example...for the
3 airport, that is the NED data, you can sort of see the
4 footprint of the airport there pretty clearly. The
5 SRTM is a little fuzzier. If you run AERMAP on both of
6 it, take the difference in elevation, you get...you
7 know, a pattern there of some higher differences...not
8 much difference here. You overlay that with the land
9 cover, and it actually picks up the elevations, the
10 trees that are there a little bit. It picks up the
11 signal of the terminal buildings, which aren't that
12 large. Another quick one is D.C..., you know it
13 doesn't...not a lot of obvious differences between NED
14 and SRTM here, but there is the land cover for DAC,
15 that is the Washington Monument right there, and if you
16 take the difference, it actually...you know, picks up
17 the Washington Monument by doing that. So, that is a
18 resource we still haven't been able to tap into due to
19 other things, but we still hope to, and it may address
20 some of the issues. So, there is the summary. How much
21 time do we have?
22 I don't know whether anybody has any
23 questions before we move to the next one. Oh, that is
24 right...oh, I can use up that time, too...no, okay. I
25 thought I would try...So, this is the AERMIC update.

10TH CONFERENCE OF AIR QUALITY MODELS 03/13/2012 CCR#16766-1 120
1 It got a lot bigger than I thought it was going to be,
2 but I will try to get to the highlights as quickly as
3 possible. So, to get a little bit of history of
4 AERMIC, and so on. So, basically AERMIC was developed
5 as CMAS Regulatory Model Improvement Committee that was
6 formed in 1991 to develop a replacement for ISCST, and
7 AERMOD was the result of that. It only took 15 years,
8 but once it was promulgated or close to promulgation,
9 AERMIC kind of wasn't sure what its status was, but you
10 know, in December 2006, we reconstituted it, indicating
11 that we didn't see AERMOD's promulgation as the end of
12 the line for AERMOD, that we want to continue to do
13 what we can to improve it, and address needs, so a new
14 committee was formed. Most of the previous members
15 were included. I served as co-chair with Jeff Weil at
16 NCAR and Vlad Isakov from ORD was not around at that
17 time, so he was added. And we had a bunch of meetings,
18 initially AERMIC was focused on urban formulations
19 concerns about you know, you have to specify a
20 population that is say, how bad the urban issue is.
21 There is just some implementation issues that felt
22 could be improved, but also recognized that there is a
23 lot of overlap among issues in terms of the urban and
24 the surface characteristics and met data, you know, and
25 so on. If you have met data that represents the urban

10TH CONFERENCE OF AIR QUALITY MODELS 03/13/2012 CCR#16766-1 121
1 influences, how do you deal with that? But, we also
2 started to recognize opportunities to address some of
3 these by utilizing newly available data...like, the
4 land cover data, the SRTM and NED differences, and so
5 on.
6 So, in addition to...so, basically
7 AERMIC sort of laid out some broader plans to try to
8 move the modeling system forward. But there are some
9 specific issues that came up, and you know, we have
10 talked about low end conditions. We have gotten sort
11 of thus far, but haven't been able to move it that much
12 further...but that is an issue that we have looked at.
13 It is an important issue that we want to, you know,
14 refocus on. Line sources were some concerns there,
15 spent some time on that. Again, AERMET got involved in
16 developing the effective roughness method that I showed
17 you, and we also talked about some of the issues
18 related to building downwash, and some concerns about
19 the building parameters coming out of the
20 prime...coming out of BPIP to go under PRIME,
21 especially for the elongated building at an angle to
22 the wind...that is something that we had identified at
23 the 9th modeling conference as a concern. And AERMIC
24 also was involved in terms of the change we made to
25 AERMOD to address the urban morning transition
10TH CONFERENCE OF AIR QUALITY MODELS 03/13/2012 CCR#16766-1 122
1 formulation bug fix. So, they provided some feedback
2 on that. I'm not going to go through this in detail,
3 but again, it is something that fits into broader
4 longer term plans maybe that AERMIC had started to
5 develop for AERMOD. But, since I showed you the
6 airport, I am going to show you downtown Durham. So,
7 there is the ballpark on the left NED data, there is
8 the aerial photo, and there is the differences. So, it
9 actually picks up some of the buildings downtown
10 reasonably well. The ballpark shows up...it is a
11 little roughness, but there has been a lot of changes
12 down there now. So, again, we are going to try to do
13 something with that. And, so AERMIC had talked about
14 building on some of these things, and actually be able
15 to use some of that information to make adjustments to
16 the meteorology to the measurement site to the
17 application site. So, we have some pretty ambitious
18 plans. I wish we had made more progress on those since
19 we last met, but they are still there. But, if we can
20 do there...address a number of implementation issues,
21 so...but like I say, down in the balance side, it is
22 probably not going to make AERMOD any faster.
23 But, we...as far as downwash, that is
24 more of an immediate concern right now, and talked
25 about incorporating the building processing into the

10TH CONFERENCE OF AIR QUALITY MODELS 03/13/2012 CCR#16766-1 123
1 model, which would give some more options, and there is
2 a number of issues with BPIP that we will talk about,
3 and AERMIC talked about...developed some alternative
4 approaches maybe to define them. And, talked about
5 mobile sources...I am not going to spend too much time
6 on that right now, and try to come up with a...one of
7 the issues with AERMOD, though is that the horizontal
8 meander algorithm within AERMOD is not applied to area
9 sources. Although, it does for volume and point
10 sources. So, we would like to sort of eliminate that
11 inconsistency if we can. AERMIC is...has done some
12 work toward that end. We are not quite there yet, but
13 we hope to be...fix that at some point. So, building
14 downwash, there are a number of issues that have
15 come...were expressed at the last conference, more have
16 come to light. But, the original criterion in the BPIP
17 program before PRIME was to just pick the tier that
18 influenced the stack, that had the highest GEP height,
19 and that is still the main criterion in PRIME. And,
20 but due to the fact that PRIME actually takes into
21 account the location of the stack in relation to the
22 building, while the degree of the building influence
23 will depend on that. And the old model didn't know the
24 difference. It assumed they were co-located. So, it
25 was less of an issue there, but now, if you have a

10TH CONFERENCE OF AIR QUALITY MODELS 03/13/2012 CCR#16766-1 124
1 slightly smaller building but closer to the stack, that
2 in most cases, could have more downwash influence, but
3 right now BPIP PRIME is not going to pick that up. So,
4 that is one of the biggest issues. There is also
5 the...a number of issues here...how much time do we
6 have? Yes...so, we sort of this split building
7 phenomena...where we discovered if you split a long
8 building in two, and put it in it's two halves, you
9 could get lower concentrations because...first, it
10 picks the tier with the highest GEP height...well, if I
11 have two tiers with the same GEP height, it picks the
12 one with the smaller width. Well, the split...the
13 halves are going to be smaller within the fold, so it
14 is going to pick one or the other, but since they are
15 the same width, I think it picks the first one. So,
16 that is an issue that we need to resolve...that still
17 hasn't been resolved. And, if anything, with the way
18 PRIME is formulated, it would probably be more
19 important to...you should use the one with the larger
20 width, but we haven't made that change yet, because
21 there...it is a more complex issue than that, but the
22 other problem is, if you actually...so, long narrow
23 buildings, the projected building length could be much
24 longer than the long wind fetch for some wind angles,
25 and that has implications. The whole geometry of the
10TH CONFERENCE OF AIR QUALITY MODELS 03/13/2012 CCR#16766-1 125
1 cavity region and the wake are in relation to the
2 projected buildings, so the cavity will be displaced
3 further down wind than it really should be...could
4 actually extend beyond the fence line when maybe it
5 really shouldn't. So, there is just quite a few issues
6 there. And, we also at the last modeling conference
7 identified some concerns about the EBD approach to
8 estimated building dimensions based on guidance, it was
9 developed before AERMOD when PRIME came along that may
10 not take into account these kinds of concerns. So,
11 that was a subject we talked about earlier. Another
12 issue is horizontal meander, which is part of AERMOD
13 that is not actually incorporated within the PRIME.
14 PRIME and AERMOD were kind of stitched together after
15 they were proposed separately, and now...there is a
16 long story there. So there is that something that has
17 not been resolved yet. And PRIME does account for
18 partial entrayment of the plume into the cavity, but
19 not into the wake itself. That is still an all or
20 nothing switch, and maybe...especially, if you have
21 defective conditions with a lot of updraft and
22 downdraft...maybe sort of a partial plume entrainment
23 into the wake is something worth looking at. So, there
24 is another couple of things, so AERMIC actually looked
25 at this and is focusing on the elongated building

10TH CONFERENCE OF AIR QUALITY MODELS 03/13/2012 CCR#16766-1 126
1 issue, suggests it use...keeping the projected building
2 width, because that is still what it is, but redefine
3 an effective building length based on the footprint of
4 the area of the building divided by the width. So,
5 basically, it conserves the footprint or volume of the
6 building. That was the recommendation that was made
7 way back then. And then, even for a building on that
8 idea, if you had a building that had maybe a tier or
9 two rather than treat each tier separately, so that is
10 another situation where you are using the highest EPA
11 formula height as the criteria, you might have a
12 Penthouse on a building that gets picked as the
13 controlling structure, and it is going to ignore the
14 rest of the building if that is the case. And the rest
15 of the building may have far more influence, but it may
16 be the Penthouse could be added in to develop and
17 effect the building height. So, these are some ideas
18 that AERMIC had developed. We have the issue that we
19 talked about earlier about the 5L distance, and there
20 are some other issues that have come up besides that,
21 as far as structures should be combined in BPIP,
22 one...a distance to a gap of less than L is defined as
23 whether two structures should be combined. It looks
24 like BPIP is actually used in the sort of minimum
25 distance between actual distance between the two

10TH CONFERENCE OF AIR QUALITY MODELS 03/13/2012 CCR#16766-1 127
1 structures or tiers rather than the projected gap, and
2 I think based on the GEP regs, that regs should be the
3 projected gap. So, in going back to the split building
4 rather than saying...well, use the building
5 with...because with the split building it still
6 combined the two, because there was no gap between
7 them, so it looked at the combined building as a
8 structure, but again, it was a larger width, so it
9 wasn't picked. But if you step back and think about
10 it, if I actually had two tiers that were like, really
11 close but not the same building, if they are close
12 enough to be combined, well, why would you want
13 to...why would you care about, you know, one half
14 versus the other half? I mean, if BPIP thinks they
15 should be combined, that their influence is a combined
16 phenomena, then you should only look at them as a
17 combined structure. At least that is one opinion. So,
18 that is something that we are considering. So, there
19 is a lot of issues there, and given the range of
20 issues, it is going to take some time to address them
21 all. But, right now, we intend to focus on some of the
22 simpler issues that maybe have easier fixes such
23 as...you know, correct BPIP PRIME, to use a rejected
24 gap between nearby structures to determine whether they
25 could be combined or not. You know, modify it to

10TH CONFERENCE OF AIR QUALITY MODELS 03/13/2012 CCR#16766-1 128
1 ignore individual tiers when those individual tiers are
2 deemed to be combined. Then, maybe incorporate some
3 internal checks to flag if I have two tiers that are
4 really close to each other, and they are almost the
5 same height but not quite, well...maybe they should be
6 treated as the same to avoid the issue where it picks
7 the one with the higher height, and maybe develop some
8 guidance on what kind of information to input to BPIP
9 in those situations.
10 So, the structure influence zone is
11 going to have to be revisited based on that
12 reassessment of the 5L. That is going to take some
13 time to sort that all out. And, we would like to
14 evaluate these options to...especially effect the
15 parameters, so we have some very preliminary
16 results...the effective length...try to skim those as
17 fast as I could. So, not a lot of data, but we used
18 some data from a wind tunnel study that Alan Huber
19 did...published in 1989, where he looked at elongated
20 buildings at an angle to the wind, and we focused on a
21 couple of examples, so...we looked at two where a stack
22 is located at the downwind corner of the building that
23 is twice as wide as is high, and so in the same
24 building, but stacked at the center of the
25 downwind...downwind center of the building. And, I'm

10TH CONFERENCE OF AIR QUALITY MODELS 03/13/2012 CCR#16766-1 129
1 going to compare some of these results. These are very
2 preliminary at this point, but...and they have all been
3 normalized to match at zero orientation where the
4 effective length and projected length would be equal.
5 So, the effective length takes into account the actual
6 fetch along the building to some extent. So, that is
7 the downwind corner of the building, and it ranged from
8 rotated from -30 degrees to 60 degrees...so, for
9 minus...the negative angles, there actually was a fetch
10 cross ability in that the other angles were...it was on
11 the corner. And then at the downwind center, same
12 building, same stack, just moved to the center. So, at
13 least that should be pretty symmetrical there. So,
14 these results for the corner of the building, so, the
15 blue line is extracted from the Huber paper, showing
16 the concentration as a function of distance. Ground
17 level concentrations at three building heights
18 downwind. The red line is what AERMOD would predict
19 with BPIP PRIME inputs. So, it certainly picks up that
20 it is higher over here, but it is...that is kind of
21 what we are looking at, is trying to eliminate that
22 overestimation. With the effective lengths, it
23 actually picks up that pattern and surprisingly well.
24 So, that is encouraging.
25 This is the same situation, these are

10TH CONFERENCE OF AIR QUALITY MODELS 03/13/2012 CCR#16766-1 130
1 the elevated receptors, and you know, it is...there is
2 a lot of...kind of...interpretates of noise in here,
3 but overall, it looks pretty reasonable. It does pick
4 up this peak on this side better than BPIP PRIME does,
5 but it also acknowledges that it is lower there. This
6 is for the stack at the center of the building...again,
7 you have got some symmetry there, and there is not as
8 much, but with the BPIP...current BPIP inputs, you
9 still do see some overestimation for that kind of
10 elongated building at a larger angle. So, the
11 effective length seems to mitigate that pretty well.
12 So, also looked at Bowline, which one of the field
13 studies we had, there is Bowline Power Plant, two
14 stacks...and only two monitors, but it actually turned
15 out to be a more appropriate example than I thought,
16 because you have those two tall buildings, they kind of
17 control things, and for most of the wind come along
18 there, you know, they do get combined. That is where I
19 realized that it wasn't combining them necessarily when
20 it should, but that it is kind of an elongated building
21 and angle to the wind. So, it was a better fit than I
22 thought at first. So, these are some QQ plots, that's
23 overall one hour QQ plot, all conditions both
24 monitored, not too different, but a little bit lower
25 with the effective roughness or effective length, a

10TH CONFERENCE OF AIR QUALITY MODELS 03/13/2012 CCR#16766-1 131
1 little bit better. That is a 24-hour average is again
2 slightly better, lower...less lower prediction. If the
3 Bowline point, the further monitor, again, matches up
4 pretty well through the top part, but you start to see
5 a little bit more difference at the closer end monitor,
6 where they are pretty similar there, but you reduce
7 some of the overestimation further down the
8 distribution. But if you go by wind speed category at
9 the closer monitor, you start to see more differences
10 where the effective length does much better than the
11 BPIP. Same thing here for high wind...low
12 wind...no...yes, high wind unstable, and high wind
13 stable. So, that is where the differences really show
14 up, and using both the Cox-Tikvart protocol for
15 evaluating the model, even though the differences
16 overall aren't that difference in the rural highest
17 concentration, for example...if you apply the method,
18 it will still get a statistically significant
19 difference, or statistically significant improvement in
20 model performance, because the improvements are sort of
21 very set clear and systematic. They are not kind of a
22 random, and even using the BOOT program, there are
23 statistics there, there is the confidence intervals on
24 the BOOT statistics for the effective lengths, so
25 better is appeared zero for actual bias there, so that

10TH CONFERENCE OF AIR QUALITY MODELS 03/13/2012 CCR#16766-1 132
1 is better. So, the fact that they don't overlap even
2 with the BOOT program recognizes a statistically
3 significant improvement in performance with the
4 effective lengths. So, that is encouraging that some
5 fairly simple changes to the building inputs could
6 actually improve the modeling and reduce some of the
7 overestimate that we are concerned about. So, there
8 is...that is about it.
9 So, in the meantime we might...if you
10 have just an elongated building by itself, maybe just
11 develop a separate tool that could be used once we kind
12 of finalize this to say...here is your alternative, and
13 I guess the one point I want to make is...probably is
14 good...is that Clearinghouse, in the past, has
15 indicated that building parameterizations are source
16 characterizations not alternative models, so that is a
17 basis for using EBDs. So, it is a little bit different
18 path, a little bit lower hurdles to use alternative
19 building parameters to input to the model, than if you
20 just change the model all together. So, I am hoping to
21 try to make as many improvements as we can through
22 modifying BPIP to address some of the concerns. Thank
23 you.
24 MR. BRIDGERS: And, what we are going to
25 do is for the question and answer session, everybody

10TH CONFERENCE OF AIR QUALITY MODELS 03/13/2012 CCR#16766-1 133
1 that spoke in the first session, we are going to sit up
2 here at the table, and what I ask is, for those that do
3 have questions, please come up and use one of the stand
4 mikes...and again, identify yourself before you ask
5 your question. And, Roger, can save his breath for a
6 moment. Not all at once.
7 AUDIENCE MEMBER: Bob Paine at AECOM. I
8 had a couple of comments. There is a lot of new
9 material presented here, Roger, and hopefully you will
10 have detailed documentation in addition to your
11 presentation material.
12 MR. BRODE: Yes.
13 AUDIENCE MEMBER: Some of these building
14 issues I would think are more than just a "bug fix,"
15 and I think they ought to be subject to public comment.
16 And, would they change...for example, the creditable
17 stack height that came out of the 1985 stack height
18 rule? I am not sure, but maybe they would, but...and,
19 what happens with stacks build...already built with the
20 existing models? So, those are questions that come up.
21 MR. BRODE: Those are questions that come
22 up, and we do intend to address...grand fathering in a
23 general way in the clarification memo, I think...it
24 should be for the standard grand fathering, is you
25 really don't need to remodel unless you have to for
10TH CONFERENCE OF AIR QUALITY MODELS 03/13/2012 CCR#16766-1 134
1 some other reason. But, from my perspective, we are
2 not changing anything in the GEP stack height regs as
3 far as how you would determine the credible stack
4 height and so on. We are just trying to improve the
5 models ability to account for downwash influences
6 appropriately.
7 AUDIENCE MEMBER: Just as a follow up, so
8 you...if a stack is higher than the formula height, it
9 seemed like you were inclined that you would have to
10 model the downwash from the stack higher than the
11 formula height?
12 MR. BRODE: Well, that is the whole point
13 of the pending clarification memo is that our
14 reassessment that it is inappropriate for the model to
15 ignore downwash effects automatically for stacks that
16 equal or exceed the formula height. There is no
17 technical or policy basis for making that the first and
18 only criterion. Now, just because it is higher than
19 the formula height, it doesn't mean that there will or
20 won't be downwash. Then, it would depend on what
21 the...based on the input provided, there is a criterion
22 within the PRIME algorithm that determines whether a
23 particular plume for a particular source an hour will
24 be influenced by downwash.
25 AUDIENCE MEMBER: Tony Sadar, Allegheny

10TH CONFERENCE OF AIR QUALITY MODELS 03/13/2012 CCR#16766-1 135
1 County Health Department. Roger, on the gust factor
2 method, can you comment on whether aircraft take-offs
3 and landings effect, you know, the gust versus the
4 average...especially with a metar two minute
5 observations?
6 MR. BRODE: It is possible, but you know,
7 it...I don't know that we could pick up a signal for
8 that since...I mean they go by pretty fast...you know,
9 rolling three second for the sonic gust or peak wind,
10 but it is the median of the distribution of gust
11 ratios, so yes, I mean I don't know that that would
12 really influence the representativeness of the gust
13 factor information that much...unless, it hit the
14 tower, I guess...but...
15 AUDIENCE MEMBER: Larry Simmons of Energy
16 & Environmental Management. It was nice to see that
17 buoyant BLP may find its way into AERMOD, I think we
18 talked about that pretty seriously back in 2000 at one
19 of these meetings, and it is nice to see that is at the
20 top of the list now for AERMOD. And I would...in that
21 same vane of taking time to get things in the system, I
22 was wondering...we had talked a while about Sigma
23 Thetas coming out of AERMINUTE, and I was wondering if
24 anybody has continued to think about that...of trying
25 to squeeze that information out of the two minute wind

10TH CONFERENCE OF AIR QUALITY MODELS 03/13/2012 CCR#16766-1 136
1 direction data.
2 MR. BRODE: We have thought about that,
3 and AERMIC even talked about that, and they didn't
4 really present much. I had a case study recently that
5 was very interesting, but it is a case study for a data
6 set that I can't really talk about yet. But, that is
7 something that we looked at, and I was a little
8 encouraged by the results. I don't think it would be
9 appropriate for pre-SONIC ASOS data most likely, but we
10 also have talked about, and I looked at, you know, some
11 sort of sub- hourly...if we have the full record of
12 winds for the hour, maybe doing six ten-minute
13 averages, for example, and in this particular case, it
14 was very...produced a very interesting result, because
15 the outliers in...I won't say too much...but the
16 outliers...two outliers, in the mile to mile
17 comparisons were cases where half of the hour it was
18 blowing at the downwind monitor, the other half of the
19 hour it was blowing at the upwind monitor. And, the
20 model validation was based on the downwind modeled
21 concentration versus the difference between the
22 downwind monitor and upwind monitor. So, basically,
23 they you know, when we...when I did...six, ten-minute
24 averages, it actually reduced the bias to about a
25 factor of five or six down to maybe twenty percent.

10TH CONFERENCE OF AIR QUALITY MODELS 03/13/2012 CCR#16766-1 137
1 So, I mean there is a lot of issues, and questions, and
2 complications there, but I think it is something that
3 we are interested and looking at and seeing if it is
4 something that makes sense. Now, I would point out
5 that in that particular case with that particular field
6 study to compare a model result at a particular
7 monitor, you know, that was extremely important. Now,
8 whether that phenomena is that important from a
9 permitting context, maybe is less...I am sure it is
10 less important, but it is it important enough to be
11 critical is a little bit less clear.
12 MR. BRIDGERS: Any other questions?
13 AUDIENCE MEMBER: Steve Sherman, Indiana
14 DEM. Theoretically, what if...I don't know of any
15 particular example of this that I can imagine it
16 happening, what if a source for say, one hour SO2
17 modeled above the standard, that is above GEP, with
18 buildings in...but if with buildings off, it was below
19 this one hour standard?
20 MR. BRODE: Then, I would say that
21 downwash influences were contributing to the results.
22 AUDIENCE MEMBER: Okay.
23 MR. BRODE: I mean it is going to be a
24 complex issue to work through...I mean one question
25 that has come up is well...could we use the modeled

10TH CONFERENCE OF AIR QUALITY MODELS 03/13/2012 CCR#16766-1 138
1 concentrations to demonstrate what height we need to
2 build the stack to avoid excessive concentrations.
3 With...before the PRIME downwash algorithm mode I would
4 say, clearly, no, absolutely not. I mean, the
5 limitations of the old algorithms were at...just assume
6 the stack was collocated with the building no matter
7 what. I mean there were just a number of issues there.
8 I think we are much closer to that being maybe a viable
9 possibility, but it is...again, it is a
10 complex...anything that touches on GEP stack height
11 regulations, you know, has a lot of complexity
12 associated with it. So, I don't know where that path
13 will go forward, but I would mention that the stack
14 height regs, if you want to demonstrate a credible GEP
15 height that is different than the formula height, you
16 do that through a fluid modeling or a field study
17 demonstration that, that is the height you need to go
18 to avoid excessive concentrations, which again is
19 defined as 40 percent higher with the building than
20 without. While I can understand the fluid modeling
21 demonstration, but it is not clear to me how you would
22 actually do a field study to demonstrate that where you
23 can remove the building and see what you get, and then
24 put it back in. I don't know, but...I mean, one idea
25 may be we need to talk about is, well, what if I

10TH CONFERENCE OF AIR QUALITY MODELS 03/13/2012 CCR#16766-1 139
1 actually do a valid field study at my source that shows
2 how good the downwash algorithms are for that source,
3 could that kind of field study be used to justify the
4 credible height based on the modeling? I mean you
5 still include the downwash in the model when you get
6 there, I mean because I mean GEP doesn't mean no
7 downwash. It is very clear in the definition. So, I
8 mean, again, if we could just slice 40 percent off all
9 of the NAAQS, I am sure a lot of people in the room
10 would be very happy, but...I don't think we can do
11 that, so. So, it is something that we have talked
12 about. I don't know where that path is going to lead
13 yet, but it is certainly worth looking at.
14 AUDIENCE MEMBER: Mike Henderson with
15 TRC. I have listened to the comments on the GEP
16 formula height, and certainly, the one hour SO2
17 standard is going to raise some circumstances under
18 which existing sources are going to be modeled and run
19 into that conundrum that was just discussed. There is
20 another aspect...my particular interest is, I
21 appreciate the details of the AERSURFACE and Sigma Z
22 and so forth, but or Zee, but the things that concern
23 me greatly are those that involve discontinuities or
24 previous points of predictions where certain
25 assumptions were made that the GEP stack height being

10TH CONFERENCE OF AIR QUALITY MODELS 03/13/2012 CCR#16766-1 140
1 one of them, and the second being the minimum wind
2 speed that is in the...in the dispersion calculation of
3 concentration. And now that half a meter wind speeds
4 are being used, one would think that the predictions
5 are going to be larger for those cases, and I am
6 specifically saying how much evaluation of the actual
7 code in the model has been done in terms of how well it
8 predicts for those low wind speeds, and I realize this
9 may not be a short answer question, but that is a topic
10 of concern to me.
11 MR. BRODE: Well, it is a topic of
12 concern for me too, and I...there has been some work
13 done, and I think we are going to hear about some of
14 that later today. I mean, I would point out that low
15 winds, stable conditions is probably the least ideal
16 situation in which to conduct the field study. I mean
17 usually you kind of look for cases where you know the
18 wind is going, and it is going to hit the monitor or
19 not. So, and given that you have very narrow plumes
20 under those conditions, you know, a slight error in the
21 wind direction that you input to the model, could
22 completely miss the monitor when it actually hit it or
23 vice versa. So I think that there is...it is something
24 to keep in mind that I think there is some additional
25 level of uncertainty in how you interpret the model to

10TH CONFERENCE OF AIR QUALITY MODELS 03/13/2012 CCR#16766-1 141
1 monitor comparisons, and that kind of an illogical
2 condition. And, not to say that, you know, ignore all
3 of it, but it is just something that needs to be kept
4 in mind, so. I mean, there are some, you know, plans
5 that we have looked at, and hope to pursue, I guess in
6 terms of managing the evolution of the AERMOD model.
7 It is now the promulgated model, so you know, we are
8 going to have to walk very carefully as far as you
9 know, changing the model formulation in a way that
10 would require rule making. So, that is something that
11 we have to be mindful of, and you know, we are being
12 mindful of that. I didn't say, you don't go there,
13 just the path forward in some of those issues is a
14 little bit different than other issues that we are
15 trying to address also.
16 MR. FOX: Well, and in that context,
17 there is both the near term solutions through guidance
18 and the like that can alleviate or remedy those
19 situations, but then as we talked about here at this
20 conference, getting information and doing the things
21 necessary to inform any update to Appendix W would be
22 something that we would need to do, and if when we plan
23 to do that, then those would need to be done, you know,
24 in the next three years or so to inform that...so that
25 is one of the issues or items to think about in terms

10TH CONFERENCE OF AIR QUALITY MODELS 03/13/2012 CCR#16766-1 142
1 of the prioritization of those aspects of the
2 formulation that would need to be revised or reviewed
3 such that we could make those types of rule making
4 changes.
5 AUDIENCE MEMBER: This is Qiguo Jing,
6 from Breeze Trinity Consultants, I have two questions.
7 First one is air model can be used up to 50 meters and
8 how do you justify to the use the one dominion of
9 AERMET over the two dominion of AERMOD especially over
10 the unihomogenous service. The other question is, we
11 are developing the parallel for your air model to speed
12 up, however, some common agency prevented the use of,
13 you know, the parallel modeling, my question is, is EPA
14 in the future to disown, you know, kind of speed up
15 thing to speed it up? Yes, you especially do the
16 sensitivity study if you have a lot of sources and
17 receptors.
18 MR. BRODE: Okay, I am not sure I
19 understood your first question. As far as speeding it
20 up, we would certainly like to speed it up. Right now
21 I don't think it is our highest priority within our
22 group given other issues that we are dealing with. I
23 mean, I would also point out that there are less and
24 more efficient ways to apply a model in terms of how
25 dense the receptor grid you are using, and how many
10TH CONFERENCE OF AIR QUALITY MODELS 03/13/2012 CCR#16766-1 143
1 sources you have included, and things like that. But,
2 and there are other third party, you know, parallel
3 versions of AERMOD, and we have addressed the status of
4 these proprietary versions of AERMOD in a clarification
5 memo back in I forget when, but a few year's ago...so I
6 mean, Appendix W does address the status of a model.
7 If it is a preferred model that has been changed
8 somehow, what its status is and we laid out what those
9 requirements are, so I am hoping that is an issue that
10 can be worked out between the applicant and the
11 reviewing authority whether an adequate demonstration
12 of equivalency has been provided, basically. But it is
13 not something that we really want to have to get in the
14 middle of.
15 AUDIENCE MEMBER: Kendall Necker from
16 McVehil-Monnett and Associates. Is there any idea that
17 we can use low wind speeds that you will not get in
18 that hour and an receptor that is, that has the
19 concentration will not be addressed, because in that
20 hour it will not get there past, like three kilometers?
21 MR. BRODE: I guess the decision on which
22 sources to include in a cumulative impact assessment is
23 pretty complicated. It depends on, you know, the size
24 of the source, characteristics of it...I mean, but I
25 don't...you know, as far as saying that if the plume is
10TH CONFERENCE OF AIR QUALITY MODELS 03/13/2012 CCR#16766-1 144
1 not going to get to that receptor in an hour, then we
2 should ignore it. I don't know that that is really a
3 valid reason for ignoring it. We realize it is a
4 steady state plume model. It has certain limitations,
5 but the plume itself is not going to stop after an
6 hour, it is going to keep going. Impacts need to be
7 accounted for in some way, so...but, we certainly do
8 understand and acknowledge that there are limitations
9 of a steady state plume model, but we think it is still
10 a very viable option for a wide range of applications.
11 MR. BRIDGERS: Tyler, I was going to make
12 mention to the audience, I know that Roger had a lot of
13 words on a lot of slides, and it was harder to see some
14 of that at the back of the room, but all of the
15 presentations from today will be posted this afternoon
16 on the web, on the SCRAM website. So, you should be
17 able to download it in your hotel room, or back
18 wherever you are staying.
19 AUDIENCE MEMBER: George Schewe, with
20 Trinity. What is the status of AERLINE?
21 MR. BRODE: Are you talking about United
22 Airline or?
23 MR. FOX: That is a question for the
24 Office of Research and Development, so they are still
25 working on that. We have yet to see the most recent

10TH CONFERENCE OF AIR QUALITY MODELS 03/13/2012 CCR#16766-1 145
1 round of development and results from that, and so when
2 they get to a point of testing and evaluating that, I
3 am sure we will engage with them, and then consider
4 that from a standpoint of how it can be brought into
5 the AERMOD modeling system.
6 MR. BRIDGERS: I think we should break
7 for lunch now. Real quick, if you think of questions
8 during the lunch hour or what not, we also have another
9 question and answer session coming up specific to the
10 applications of AERMOD. Try to be back by 1:00, and if
11 you are eating in the cafeteria, please note that we do
12 recycle and compost, so pay attention when you are
13 bringing your tray to the end.
14 (WHEREUPON, a lunch break was taken.)
15 MR. BRIDGERS: Thanks to everybody for
16 making your way back in after lunch. We'll get started
17 here in, like, a minute or two.
18 Well, such that we won't get too far off
19 schedule, it looks like we've got critical mass. The
20 others can filter in.
21 Hopefully, everybody was able to make it
22 through the lunch line. It looked like it was pretty
23 lengthy, but I've heard from a few that said things
24 moved pretty quickly once you got into the cafeteria.
25 This afternoon, the first session deals
10TH CONFERENCE OF AIR QUALITY MODELS 03/13/2012 CCR#16766-1 146
1 with applications of AERMOD. You've heard a lot of EPA
2 folks talk over the morning, but now we have some
3 invited presentations. First up, we have Ron Petersen
4 and Ron, I'll just let you go ahead and grab your
5 title.
6 MR. PETERSEN: Thank you, George.
7 I'm going to speak about the use of
8 equivalent building dimensions in AERMOD and first, let
9 me say that I'm presenting this on behalf of the Air
10 and Waste Management Association AB3 Committee, who
11 will also be presenting some more on Wednesday.
12 A kind of a brief outline, just give you
13 a brief background on EBD, current status, kind of my
14 take on it. Cases where the BPIP inputs clearly will
15 not work and a review of the EPA evaluation of the past
16 EBD study and then kind of what I see as a suggested
17 path forward.
18 Basically, equivalent building
19 dimensions, for those who aren't familiar with them,
20 are the height, width, length, and position that are
21 input into AERMOD in place of the BPIP dimensions when
22 you need more accurate estimates for situations where
23 BPIP clearly is not appropriate or will not work.
24 The guidance for doing these studies was
25 originally developed when ISC was the preferred model

10TH CONFERENCE OF AIR QUALITY MODELS 03/13/2012 CCR#16766-1 147
1 and kind of the notorious Tikvart 1994 memorandum kind
2 of summarize that, that guidance. And I must say that
3 original guidance was developed in a collaborative
4 fashion. Working with industry and EPA, we put
5 together some guidelines on how to conduct those
6 studies.
7 Several studies were conducted after
8 that time using that original guidance for ISC
9 applications, kind of a list of them there. Most of
10 those studies, the results were approved. The very
11 first study was actually done before the guidance was
12 put out for Amoco and then, I think it was Cape
13 Industries, was the one where the guidance was actually
14 formalized.
15 Since that time, since AERMOD was the
16 preferred model, there's been a couple, a few studies,
17 conducted using the same guidance. Some have been
18 approved. Morant. The recent memorandum talked about
19 the Alcoa study which was not approved.
20 So, that's kind of a little bit of
21 history on the situation.
22 Now, the current status in the EPA
23 memorandum, Roger probably hit on some of this, but it
24 says all past EPA guidance related to determined EBDs
25 through wind tunnel modeling is hereby suspended until

10TH CONFERENCE OF AIR QUALITY MODELS 03/13/2012 CCR#16766-1 148
1 further notice. In other words, the Alcoa study was
2 also disapproved at this point.
3 Many in industry actually have talked to
4 me and interpreted this to mean that EBD studies cannot
5 be used and, furthermore, it sounded like all of the
6 past ones were disapproved.
7 Now, I don't know about the past ones or
8 what's happened there. Maybe that will be a comment
9 for later, but I think many didn't read on in the
10 appendix or the guidance because right after that it
11 said that this should not be taken to imply that all
12 such studies will be rejected. It does say that any
13 studies being considered should be discussed with the
14 appropriate agency and the clearinghouse early in the
15 process.
16 So, in a sense, the main thing that's
17 changed here, really the only thing that's changed is
18 the guidance was disapproved. So, a new method for
19 conducting the studies is needed to be worked out. The
20 use of the studies was not disapproved. It was really
21 the guidance for conducting the studies. That's my
22 take on it.
23 And the original memo acknowledged the
24 evolving nature of the guidance. As a matter of fact,
25 when I worked with Joe Tikvart and John Irwin on this,

10TH CONFERENCE OF AIR QUALITY MODELS 03/13/2012 CCR#16766-1 149
1 John Irwin said we'll probably get about 20 of these
2 studies. We'll file them. Look them over and then
3 revise this sometime in the future. Well, it sounds
4 like that future time is now here.
5 The important thing about it, as Roger
6 mentioned, the studies are still classified as a source
7 characterization study which means it's not a new
8 model. The approval process is much easier to do an
9 EBD study.
10 The major problem areas identified in
11 the clearinghouse memo was the recent study for Alcoa,
12 the high roughness used during EBD testing. And so
13 that's just something that needs to be worked out how
14 to do that. Maybe lower roughness needs to be used.
15 The method needs to be firmed up in that case.
16 The other aspect is a different downwash
17 algorithm is now in PRIME because now, as you can see
18 in this picture here, the old study, the ISC, the
19 building was always positioned directly upwind of the
20 stack and the building was a one to two to one specific
21 shape of building.
22 AERMOD PRIME now, the building can moved
23 upwind, downwind, it can have any number of shapes.
24 So, that's one of the major differences in the two
25 methods.

10TH CONFERENCE OF AIR QUALITY MODELS 03/13/2012 CCR#16766-1 150
1 I must say, on some of the recent AERMOD
2 EBD studies we've done, we have moved the building
3 around. So, that part of it has already been
4 incorporated in some of the new EBD studies.
5 Ultimately, a PRIME needs the building
6 shape and position that places the stack in the air
7 flow region for which the model was defined or
8 developed. Now, these pictures show the wind tunnel
9 database that was used to develop the formulas in the
10 downwash algorithm. And so, ideally, you would like to
11 put in a building that matches the theory. And so,
12 that's really the purpose of the equivalent building
13 dimension is to find a building shape that matches the
14 theory. A simple building, one building that goes in
15 to represent your whole site, basically, or whatever
16 geometry you have.
17 So, here's a few cases where BPIP is
18 clearly going to have some problems.
19 Like an urban area there. What do you,
20 you know, what do you pick for the one building that
21 goes in? It may be, in those cases, the background
22 turbulence is higher than the building wake effect. So
23 really, no building may be appropriate of high
24 roughness.
25 A porous or lattice structure. The
10TH CONFERENCE OF AIR QUALITY MODELS 03/13/2012 CCR#16766-1 151
1 theory just doesn't work for that. Here's a case, some
2 of the slides kind of floated a little bit there, but
3 the first top picture shows what the plume looks like
4 downwind of a lattice structure. Now, the equivalent
5 building would find a plume that looks just like that
6 and we found out from that study the solid building was
7 about half the height of that structure that gave you
8 the same result.
9 The BPIP profile is on the bottom there.
10 So, the solid building of the same height as the
11 lattice structure, you can see the plume is heading
12 down. So, that's going to give you high
13 concentrations.
14 Now the -- another recent example here
15 is a case, if you can see those, there was a lattice
16 structure downwind of the stack, upwind of the stack,
17 and then a solid building of actually a shorter height
18 and you can see the solid building, the plume is sucked
19 upwind. So, clearly an entirely different plume
20 behavior when you have a lattice structure in there
21 when the plume actually goes right through the
22 latticework. There is some downwash effect, but it's
23 much less than if you put in the whole solid building
24 height. So, the equivalent building will find the
25 height to put into the model that will make the model

10TH CONFERENCE OF AIR QUALITY MODELS 03/13/2012 CCR#16766-1 152
1 work for that situation.
2 Some other cases, hyperbolic cooling
3 towers that are streamlined. Again, they're going to
4 be treated as a rectangular block, much more downwash
5 that you'd, you know, you're going to get higher
6 numbers.
7 A short building with a large footprint
8 which was talked about in some air and waste management
9 papers last and last year also in detail and this is
10 actually the Alcoa footprint, actually. And clearly the
11 theory is not going to work there because it's outside
12 the bounds of the original PRIME model. It's much
13 wider, shorter than anything that was ever evaluated.
14 Some other structures that might be
15 interesting, air-cooled condenser units. They have
16 latticework underneath. Solid at the top. Clearly,
17 the wake is going to be much less than a solid
18 building.
19 Multi-tiered sloped and porous
20 structures, again, what do you put in for the height?
21 How do you account for a shroud that's around a stack
22 that is porous? 50 percent porous? You know, that's
23 going to create some downwash, too, but how do you put
24 it in? Do you put it in as a solid object? I mean,
25 those are kind of the challenges that BPIP can't

10TH CONFERENCE OF AIR QUALITY MODELS 03/13/2012 CCR#16766-1 153
1 handle.
2 The second part here, I'll kind of just,
3 a review. There was an attachment to the memo where
4 AERMOD or EPA compared the wind tunnel against AERMOD.
5 There was some comparisons. And the results of that
6 appendix or that attachment were used to provide
7 additional justification regarding the use of that
8 large roughness. So, it was kind of some justification
9 documentation.
10 In looking that over, it appears that
11 some of the inputs that were used were not correct.
12 Basically, it appears that the EPA was using model wind
13 speeds when full scale speeds should have been input.
14 They were assuming stable conditions when the wind
15 tunnel is actually neutrally stratified and there was
16 really, technically, not enough data collected in the
17 wind tunnel to do that comparison because if you're
18 going to do a comparison between the field or between
19 the AERMOD and the wind tunnel, you have to collect
20 more data. Turbulence, profiles, you can input those,
21 the theories in AERMOD so, that's what needs to go in.
22 Turbulence and wind profiles.
23 So, my conclusion there was that the
24 Appendix was flawed and, in this case, I just recommend
25 some collaboration here would have been useful. We

10TH CONFERENCE OF AIR QUALITY MODELS 03/13/2012 CCR#16766-1 154
1 could have, I think, done a good -- a much better model
2 evaluation comparison and maybe the conclusions
3 wouldn't change, but at least we would have had a
4 better result, I think, in that appendix.
5 So, kind of in summary there, this is
6 kind of a summary of the differences that EPA inputs
7 what we estimated, see, and like I said, we didn't have
8 enough data so, we had to estimate the inputs that we
9 thought were appropriate. The first thing you have to
10 do is scale model operating conditions back to full
11 scale which is something only fluid modelers can do
12 accurately. I mean, it's fairly hard to do. And so,
13 we did that and you can see in the table here some of
14 the differences. Exit temperatures were different.
15 Exit velocities. The stable versus unstable. Neutral,
16 actually, so you want to have an infinitely negative
17 Monin Obukhov length. The wind speed at stack top was
18 4.6, but for EPA 10.23. And so on.
19 There were a lot of differences and the
20 way we, the inputs really weren't listed so, we
21 actually, what we did was we took the results. Here's
22 the BPIP results on this line here. And here is the
23 equivalent building results using AERMOD and re-
24 replicated that, tried to reproduce that since we
25 didn't have the inputs and that was the table I just

10TH CONFERENCE OF AIR QUALITY MODELS 03/13/2012 CCR#16766-1 155
1 showed you. That's how we got the good agreement.
2 Now, if we use what we think are the
3 appropriate results, here is, again, the two curves to
4 look at are this curve. These are AERMOD predictions.
5 The middle lines here are the wind tunnel. It's the
6 site structures present and the equivalent building.
7 Well, let's see. The site structures, yes, and the
8 equivalent building that was selected in the wind
9 tunnel.
10 Now, when we use the appropriate inputs,
11 you can see that, actually, the lines change
12 dramatically. You might get different conclusions
13 here, but clearly, you have a different result there
14 when you get the correct inputs there.
15 So, anyhow, what's the recommended path
16 forward here? I mean, that's kind of the issue here.
17 How do we move forward?
18 Option one, I think, would be to create
19 kind of an industry EPA work group to develop a
20 guideline for conducting these studies and then publish
21 the guideline much like we already have an EPA fluid
22 modeling guideline that was authored by Snyder some
23 years back in 1981.
24 Option two would be to wait for the next
25 EBD protocol to be submitted, have that reviewed by the

10TH CONFERENCE OF AIR QUALITY MODELS 03/13/2012 CCR#16766-1 156
1 clearinghouse, EPA and then work in a collaborative
2 fashion to, you know, come to some kind of an agreement
3 that this is the way we're going to do the study. Get
4 final approval on the protocol.
5 Now, one thing I'll mention is that
6 we've had trouble getting approval of the protocols
7 before we do it. So, one thing is good to get approval
8 ahead of time and then, when we're doing the study, I'd
9 recommend conducting the study in a collaborative
10 fashion where there is some real-time feedback, let's
11 say, because if things, maybe something you developed
12 in the protocol looks strange. You're getting some
13 strange results along the way and well, maybe you want
14 to change it on-the-fly and do that before you publish
15 the report and then find out the problem after you've
16 submitted your final report.
17 So, in that case, I'd say, you know,
18 when you've finished the study you know you really have
19 an approved study and before the report is even
20 submitted and then use that protocol as kind of a
21 template. Just say that template you've worked out for
22 future studies.
23 So, that's kind of what my recommended
24 path forward is and kind of a brief summary of the EBD
25 input to AERMOD.

10TH CONFERENCE OF AIR QUALITY MODELS 03/13/2012 CCR#16766-1 157
1 Thanks.
2 MR. BRIDGERS: And much like we did this
3 morning, we'll bring everybody back up for questions at
4 the end of the session.
5 So, up next, somebody that probably does
6 not need introductions, but I will. We have Bob Paine.
7 MR. PAINE: Thank you.
8 I'm going to discuss a low wind speed
9 evaluation study we did after the last conference, but
10 a couple of years ago, I'd like to acknowledge
11 contributions from a couple people here, Jeff Connors
12 and Steve Hanna. The study was funded by API and UARG.
13 Let's see, okay, I wanted to know, of
14 course, why are low wind speeds a concern? That's
15 pretty obvious. I'll mention that a little bit. I'm
16 going to review the current AERMOD formulation, how we
17 approach the evaluation study which was done in two
18 parts. A meteorological evaluation and as well as a
19 Tracer study concentration and evaluation and our
20 findings and recommendations.
21 This is just review of, in the past,
22 there had been discussions of these items being
23 imported. At the last conference this was also
24 mentioned. And also the fact that AERMOD has had
25 limited evaluation for conditions of wind speeds less

10TH CONFERENCE OF AIR QUALITY MODELS 03/13/2012 CCR#16766-1 158
1 than one meter per second, especially for near ground
2 releases. The only experiment among the 17 original
3 ones is a Prairie Grass had only one data point at less
4 than one meter per second. It was .92 meters per
5 second and four out of the 44 were less than two meters
6 per second so, not very good representation.
7 Currently, AERMOD computes the friction
8 velocity, USTAR , which is an important issue for
9 mixing height, sigma Z, and sigma Y at night. And it
10 also involves a combined solution of a coherent plume,
11 which is the traditional Gaussian plume, any random or
12 pancake plume and it does a weighting of these two
13 solutions depending upon, in some sense, the prediction
14 of USTAR.
15 USTAR is a function of not only the wind
16 speed, but also of the roughness length and those
17 parameters have been changing in terms of sonic
18 anemometers giving us lower and lower wind speeds down
19 to zero and air surface which has changed the
20 formulation of the roughness length.
21 So, we initiated a new evaluation study
22 to get at really low wind speeds and try to evaluate
23 AERMOD under these conditions with both research grade
24 meteorological databases, as well as low wind speed
25 Tracer databases. We confined our analysis to the

10TH CONFERENCE OF AIR QUALITY MODELS 03/13/2012 CCR#16766-1 159
1 current, then current AERMET and AERMOD in 2009, as
2 well as modifications of those which I'll discuss.
3 We did collaborate with the U.S. EPA and
4 AERMIC. I don't know if AERMIC has provided much
5 review. I haven't seen it, but I'm encouraging that to
6 happen.
7 The phase one which was requested by
8 EPA, was to look at the prediction of USTAR to get that
9 evaluated first and then do the Tracer evaluation. So,
10 we looked at research grade databases with fast
11 response meteorological data so that we could get the
12 actual correlation of U-PRIME, W-PRIME, and the
13 observed USTAR.
14 We had two databases that were nocturnal
15 low wind speed condition dominated. One was Carrington
16 in the United Kingdom and the other nocturnal one was
17 the FLOSS II fluxes over snow surfaces in Northern
18 Colorado. A mostly convective database was Bull Run,
19 although we had meteorological data daytime and
20 nighttime for that database.
21 We found that the single level, which is
22 the basic AERMET prediction, the single level friction
23 velocity predictions at night were found to be too low
24 and we have an adjustment that we have suggested which
25 have greatly improved the prediction of the observed

10TH CONFERENCE OF AIR QUALITY MODELS 03/13/2012 CCR#16766-1 160
1 USTAR values and we have tested those, that adjusted
2 formulation, on all three meteorological databases.
3 This just shows you that -- let me see
4 if I can get this. I guess I can't. Anyway, you can
5 see that the USTAR on the y-axis and U on the x-axis
6 show the formulation of how AERMET predicts the USTAR
7 from the U and we can see that there is a quadratic
8 equation that ends at a transition point, which is
9 connected to the origin zero zero by a straight line.
10 That area was never really tested in any
11 evaluation so, we decided to test it. The white dots
12 indicated the current AERMET formulation and the blue
13 dots indicate some of the observed values of USTAR.
14 Obviously, we can see that the observed values are
15 higher than the predicted values and so we decided to
16 join the origin to a point higher up on the curve.
17 Some of these curves are for different cloud covers and
18 that ended up having a much better, much better
19 performance for the prediction of USTAR.
20 Actually, an independent evaluation done
21 by Ashok Luhar in Australia, indicated that on the left
22 we see USTAR versus USTAR, predicted versus observed.
23 Under-predicting on the left, the lower level, the
24 lower values of USTAR that were observed were under-
25 predicted by the current formulation, but the improved

10TH CONFERENCE OF AIR QUALITY MODELS 03/13/2012 CCR#16766-1 161
1 formulation had a more unbiased prediction of the low
2 values of USTAR.
3 So, we concluded from the meteorological
4 evaluation that the current AERMET formulation would
5 under-predict USTAR in low wind speed stable
6 conditions. This would be, this would end up resulting
7 in higher predictions because of lower dilution speeds,
8 lower dispersion.
9 We have a suggested fix to this that we
10 believe and was subsequently evaluated to show that the
11 model will perform better in predicting concentrations.
12 So, we carried that into the Tracer
13 evaluation phase of the study. We looked at three
14 Tracer databases; Bull Run, a tall stack buoyant plume
15 database done by EPRI in 1982, Idaho Falls and Oak
16 Ridge are old NOAA databases both involving low level
17 releases in stable conditions.
18 We looked at three candidate models.
19 Basically, the current AERMET, then current AERMET and
20 AERMOD. Then changing AERMET as number two, but not
21 changing AERMOD. Then changing both AERMET and AERMOD.
22 Changing AERMOD with a minimum sigma V doubled from the
23 .2 meter per second to the .4 meter per second which
24 ended up looking like it would perform better.
25 Why did we decide to adjust the minimum
10TH CONFERENCE OF AIR QUALITY MODELS 03/13/2012 CCR#16766-1 162
1 sigma V which is the lateral turbulence? We actually
2 took the debug information and put it into an Excel
3 spreadsheet and looked at it very carefully and found
4 that the sigma V became very important in determining
5 both the lateral dispersion and the fraction of the
6 random plume used to calculate the total concentration.
7 The coherent plume was dominating that weighted average
8 and the coherent plume uses that sigma V and it's a
9 very important component.
10 So, we found that the model is over-
11 predicting significantly for light winds when the
12 lateral dispersion was underestimated and the fraction
13 of the random plume was underestimated. And so, we
14 found that doubling that minimum sigma V would work out
15 better and then we put that into the model and then
16 tested the databases fully with that formulation
17 change.
18 We found that with Bull Run and
19 convective conditions no change was really needed
20 because the predominant corrections were needed for
21 stable conditions.
22 So, I'm going to talk about the two
23 databases with stable conditions, we see that for the
24 first one, Idaho Falls, we have the predicted on the y-
25 axis and the observed on the x-axis. In various
10TH CONFERENCE OF AIR QUALITY MODELS 03/13/2012 CCR#16766-1 163
1 distances, in 100, 200, and 400 kilometer, I mean meter
2 arcs, the 100 meter arcs resulted in the highest
3 observed and certainly predicted concentrations,
4 whereas the base model had an over-prediction by about
5 a factor of six with Idaho Falls with a near surface
6 release, with no sigma theta observations accounted
7 for.
8 When we instituted the changes to
9 AERMET, we improved it by about a factor of two.
10 And then when we instituted the changes
11 to AERMET and AERMOD, we got a further improvement and
12 so, with that database, we found that our suggested
13 improvements would ameliorate some of the over-
14 predictions in stable conditions for low winds.
15 Going to the other database, well, first
16 of all, let me give you the overall results for Idaho
17 Falls. The over-predictions were clearly evident at
18 100 meters with somewhat better model performance
19 further up, but the highest predictions were at 100
20 meters.
21 Used in sigma theta observations tended
22 to reduce the over-predictions, but if we decided that
23 we wanted to withhold the sigma theta data, we found
24 that the better AERMET with a higher USTAR predictions
25 would reduce the concentration over-predictions by

10TH CONFERENCE OF AIR QUALITY MODELS 03/13/2012 CCR#16766-1 164
1 about a factor of two due to the higher dilution of
2 wind speed and the higher turbulence levels.
3 And then when we increased the minimum
4 sigma V, we had additional performance improvements.
5 We found that the bulk Richardson number and the
6 multiple level AERMET worked about as well as a single
7 level AERMET when we instituted these improvements.
8 Now, going to the one other stable low-
9 end and low-level release, we found that with Oak Ridge
10 we had about a factor of 20 over-prediction with the
11 base model at the 100 meter arc and, basically, that
12 slope was pretty much evident at the other distances as
13 well. Instituting the change to AERMET improved
14 things, again, by about a factor of two, but still
15 over-predicting by about a factor of ten. Then,
16 instituting the sigma V minimum upgrade still got me
17 about a factor of two to three over-prediction and
18 that's where we basically stopped because some of the
19 data points, you can see at the further distances, are
20 approaching a factor of between one and two over-
21 predicting.
22 And so, the overall results for Oak
23 Ridge were, again, substantial over-predictions for the
24 base model during stable hours, especially during
25 unstable hours, again, AERMOD did reasonably well. We

10TH CONFERENCE OF AIR QUALITY MODELS 03/13/2012 CCR#16766-1 165
1 decided that we needed to have a larger lateral spread
2 of the plume and a better estimate of USTAR and so we
3 found that the minimum sigma V of .4 meters per second
4 substantially improved the model performance.
5 So, the overall findings and
6 recommendations are that, first of all, it's been two
7 years since API provided all of these results, code,
8 and the modelers archive EPA and we're all anxiously
9 waiting for the EPA to do something about it. We
10 encourage EPA to certainly either accept the changes or
11 provide another alternative formulation along these
12 lines which, I think we have found important
13 mischaracterizations and things that need to be
14 corrected in the current model.
15 Also, the fact that, as we drive USTAR
16 lower and lower, where lower wind speeds and lower
17 mixing height, lower that is, lower surface roughness,
18 as we get lower mechanical mixing heights which have
19 led to other issues, like very low plume spreading for
20 releases above the mixing height.
21 And that concludes that presentation.
22 MR. BRIDGERS: Thanks, Bob.
23 Rolling right along, we have Mr. Randy
24 Robinson from EPA Region 5.
25 MR. ROBINSON: Okay. Thanks, George.
10TH CONFERENCE OF AIR QUALITY MODELS 03/13/2012 CCR#16766-1 166
1 As he mentioned, my name is Randy
2 Robinson. I'm with the EPA Region 5 and I'm going to
3 change gears a little bit here. Pardon the pun. I'm
4 going to talk about Haul Roads and, in particular, the
5 Haul Roads Workgroup and our final report out.
6 I'm going to touch on a little bit of
7 background and talk about the activities that we've
8 done over the last couple of years and then discuss
9 final recommendations.
10 Our workgroup final report was posted up
11 on SCRAM a few weeks ago and just to characterize that,
12 this is, it's posted up there. It's our workgroup
13 final effort. I guess we're looking for comments.
14 We're looking for feedback. We're looking for some
15 additional information, if needed, and it doesn't
16 necessarily represent an EPA position on Haul Roads,
17 but this is the workgroup position and, if needed, a
18 final EPA recommendation will come out.
19 So, and just to clarify the issue that
20 we're talking about. This is not tailpipe emissions.
21 We were looking at how to best characterize the dust
22 that's kicked up from industrial trucks. Sometimes,
23 similar to what you see up there.
24 Our group started back after the
25 regional and state modelers workshop in 2009 which

10TH CONFERENCE OF AIR QUALITY MODELS 03/13/2012 CCR#16766-1 167
1 seems like a long time ago now. And it was made up
2 mostly of state agency representatives, some local
3 agency representatives, and some EPA folks. And it was
4 really put together because there were some concerns
5 with how to model Haul Roads.
6 For one, the model impacts from these
7 kinds of sources can be significant. Sometimes, they
8 can overwhelm an attainment demonstration.
9 These kinds of sources are more
10 difficult to characterize than some of the other
11 sources we're used to dealing with and there was a lack
12 of state-to-state consistency, in general, with how
13 this was being dealt with, including not modeling of
14 them at all.
15 So, the workgroup got together and the
16 first thing we did was to, sort of, identify the issue
17 and scope the problem. This was in no way a research
18 project. We focused on activities that would get at
19 how to best characterize dispersion from these kinds of
20 sources. We also decided that we weren't going to dive
21 into the emission factor issue. We felt that we didn't
22 have the expertise for that and other groups are
23 looking at that as well.
24 But what we did focus on was gathering
25 information from existing state approaches from how

10TH CONFERENCE OF AIR QUALITY MODELS 03/13/2012 CCR#16766-1 168
1 they're modeling Haul Roads to get a sense of what sort
2 of the range of options is out there.
3 We conducted a sensitivity analysis to
4 better understand how important the variables were
5 involved in modeling these kind of sources.
6 And then lastly, to the extent we could,
7 we examined available journal articles and field study
8 data to see what we could gain there.
9 What we found, I'm sure we missed some
10 field study information and journal articles, what we
11 tended to find was that most of the field study work
12 was geared toward getting a better picture of emission
13 factors and was really geared toward emissions and not
14 so much sort of plume characterization.
15 Here's just some samplings of the
16 variety of approaches that we saw out there when we
17 gathered information, mostly from the states. I'd say
18 what we saw was there were typically more volume source
19 kind of examples out there, with volume heights or top
20 of plume heights ranging anywhere from, you know, two
21 times the vehicle height. 1.7 times the vehicle height
22 was a fairly popular option. In some cases, the volume
23 height was as low as one meter which is, I think,
24 people were simulating the tire height in those kind of
25 examples.

10TH CONFERENCE OF AIR QUALITY MODELS 03/13/2012 CCR#16766-1 169
1 The sigma values were typically based on
2 the volume heights. Widths ranged, you know, anywhere
3 from truck widths, truck widths to six meters. Road
4 width times two. Or, in some cases, they would have
5 set widths depending on if it was one lane traffic or
6 two lane traffic.
7 There was also a fair number of areas
8 source examples out there. Release sizes, release
9 heights as low as zero meters surface release. In a
10 lot of other cases it was half, sort of, vertical
11 extent and widths for area sources tended to be kind of
12 the width of the driving lane or the width of the
13 roadway.
14 We did a sensitivity analysis just to
15 get a little bit of an idea of just how AERMOD were to
16 some of these parameters and what we did was we varied,
17 basically varied the top of plume height ranging from a
18 surface release of zero meters up to a ten meter top of
19 plume height.
20 The other figure that we varied was the
21 sigma-y which ranged from a three meter width which we
22 kind of assumed was maybe a typical truck width, to a
23 10 meter width which may be is kind of a typical
24 roadway width, to 16 meters which would be a roadway
25 plus three meters on either side which was a popular

10TH CONFERENCE OF AIR QUALITY MODELS 03/13/2012 CCR#16766-1 170
1 option that we saw out there.
2 So, we did, we set up this sensitivity
3 analysis. What we did is we used AERMOD. We set up
4 intersecting roadways and looked at volume sources,
5 both alternate and adjacent volume sources. We looked
6 at area sources. We used one year of real MET data, a
7 variety of MET data as supplied by the states.
8 What we found was not, wasn't really all
9 that surprising. It did give us some good information.
10 We found typically increasing the release heights led
11 to lower concentrations. Increasing the sigma-y for
12 alternate and adjacent volume sources lowered
13 concentrations as well.
14 For the area sources, when we increased
15 the lateral dimension, that tended to lower the
16 concentrations for the lower release heights. It
17 didn't have much impact on the one and a half and three
18 meter release heights that we looked at. And then for
19 area source, adding a sigma Z lowered the
20 concentrations for the surface release heights, but
21 increased the concentrations for the higher release
22 heights and .5 meter had some mixed results.
23 The adjacent runs gave us typically
24 higher concentrations than the alternate runs.
25 We also looked at a little bit of

10TH CONFERENCE OF AIR QUALITY MODELS 03/13/2012 CCR#16766-1 171
1 simulation using point sources to characterize the Haul
2 Roads. It consisted of putting stacks to represent the
3 wheels of a vehicle and then using the vehicle
4 dimensions to simulate the downwash.
5 We did just a little bit of that and
6 found that, you know, that approach was fairly
7 sensitive to stack height. A little sensitivity to
8 stack diameter. And, as I said, we ran multiple MET
9 data sets here and saw the same trends with the one on-
10 site data set that we had with the National Weather
11 Service. That may be likely due to the lower winds
12 with the on-site MET data.
13 So, we came up with some -- we took the
14 information we had and we came up with some general
15 recommendations and I would say our -- which consists
16 of characterizing these Haul Roads as a volume source
17 and I would say that there wasn't an overwhelming
18 conclusion that they should be volume sources, but we
19 felt that the fact that volume sources did contain the
20 meander algorithm was an important factor. And again,
21 some limited model monitor study data that we had from
22 the Cordero Mine, tended to indicate that meander was
23 an important factor there.
24 So, our recommendation on what would be
25 a reasonable and technically supportable approach would

10TH CONFERENCE OF AIR QUALITY MODELS 03/13/2012 CCR#16766-1 172
1 be volume sources and here's some details on what we
2 felt were reasonable ways to characterize a volume
3 source.
4 Again, top of plume height, we focused
5 in on the 1.7 times the vehicle height based on, that's
6 sort of based on a 2005 atmospheric environment paper.
7 The release height would be half of that top of plume
8 height. Plume width, we used the vehicle width plus
9 six meters, focusing on the vehicle width because
10 that's what generates the emissions and the six meters
11 we pulled from a 1992 CO monitoring guidance document.
12 That talked about a three meter buffer from the
13 roadways, as the distance needed to get out of the
14 turbulence created by the roadway. So, I think that's
15 where the six meter originated from a lot of the state
16 work that was done.
17 So, our plume width recommendation is a
18 reasonable recommendation was vehicle width plus six
19 meter for a single lane. If you've got multiple lanes,
20 considering the road width plus six meters. And then
21 for sigma Z, was simply the top of plume height divided
22 by 2.5. For sigma-y is -- was the width of the plume
23 divided by 6.5 and recommended the use of adjacent
24 volumes.
25 As I said, the volume source wasn't an

10TH CONFERENCE OF AIR QUALITY MODELS 03/13/2012 CCR#16766-1 173
1 overwhelming recommendation, but we did feel like the
2 meander algorithm was important.
3 If there are situations where one of the
4 disbenefits of the volume source is that you can't put
5 receptors. If you need to evaluate a receptor very
6 nearby, you can't place a receptor in a volume source.
7 So, in those cases where you need to look at nearby
8 receptors, we recommend the use of an area source. And
9 again, the length would simply be the length of the
10 roadway. The widths recommended are similar to the
11 volume source of vehicle with plus six meters and the
12 road width plus six meters. Top of plume height again
13 is 1.7 times the vehicle height. Release height is
14 half of the plume height. And sigma Z is calculated
15 the same as the volume.
16 Interestingly enough, you know, when you
17 run an area source this way with a sigma Z, it ends up
18 being fairly comparable, at least in our sensitivity
19 work, to a volume source characterization, although it
20 gave us slightly higher concentrations.
21 So, those are the recommendations that
22 we came out with and, again, we just felt like these
23 were reasonable, technically supportable
24 recommendations and look forward to any comments or
25 additional information that the community might have.

10TH CONFERENCE OF AIR QUALITY MODELS 03/13/2012 CCR#16766-1 174
1 We had some suggestions for future
2 efforts. As I mentioned, the field studies, we had
3 trouble finding field studies that really were geared
4 towards sort of plume dimensions, so we encouraged, to
5 the extent that we can influence that, more field
6 studies looking at that. Also, looking at the impact
7 of vehicle speeds.
8 The point source work we did, we
9 thought, had some potential and one of the real
10 benefits there would be the ability to examine downwash
11 from buildings that are nearby the Haul Roads so, we
12 supported further work along that -- further study of
13 that approach.
14 And then the new line source work that
15 is somewhere in development here, that ultimately may
16 replace the need to model these sources as either
17 fugitives or area sources, so we wanted to make sure we
18 kept that in mind.
19 And lastly, we had a very good workgroup
20 here. Mick Daye, Region 7, was co-chair, but as I
21 said, the workgroup was made up of mostly state agency
22 representatives and local area representatives and they
23 did -- they really did a lot of work, particularly with
24 the sensitivity modeling and assisting with the report,
25 so I'd really like to thank them again.

10TH CONFERENCE OF AIR QUALITY MODELS 03/13/2012 CCR#16766-1 175
1 Thank you.
2 MR. BRIDGERS: And Randy now has us back
3 on time.
4 So, up next, Chat, the podium is yours.
5 MR. COWHERD: Let's do advance down here
6 with that.
7 MR. BRIDGERS: You can and this also
8 works.
9 MR. COWHERD: Good afternoon. I'm glad
10 to have the opportunity to speak with you today and the
11 title of my presentation is Modeling Concerns for
12 Fugitive Sources in the Iron, Steel, and Mining
13 Industries.
14 This problem of trying to characterize
15 fugitive sources is a very thorny one. Everything that
16 we've heard about trying to model dispersion from
17 continuously emitting ducted sources, like stacks and
18 vents, we have to add a whole other level of
19 complication to the fugitive sources because they're
20 also called open sources and those sources are those
21 that emit particularly gaseous air pollutants directly
22 into the atmosphere, but they do not pass through a
23 confined, well-defined flow stream in the process of
24 discharging the pollution into the atmosphere. So, you
25 can't, unlike stack testing where you can put a probe

10TH CONFERENCE OF AIR QUALITY MODELS 03/13/2012 CCR#16766-1 176
1 in the stack and you can scan across the dimensions of
2 the stack and get a good estimate of, you know, true
3 emission rate. It's much more difficult to do that
4 with fugitive sources.
5 These sources also tend to be highly
6 variable in time and space around an industrial
7 facility and they are normally associated with batch
8 operations. The stack emissions tend to be relatively
9 continuous. Not always, but the fugitive emissions
10 tend to be associated with batch operations that are
11 highly variable in time which makes it a lot more
12 difficult to use a steady state plume model to
13 represent dispersion from these sources.
14 So, we have issues such as emission and
15 factor development. It's been brought up briefly. We
16 have particle size data. I'll be talking mostly about
17 fugitive dust today. How do you represent the sources?
18 And what about some new effects on PM-10 and PM-2.5
19 depletion phenomenon?
20 We know that AERMOD is best suited to
21 steady state emissions from unobstructed stack flows.
22 You do have building downwash and other issues to try
23 to account for that effect, but these kinds of sources
24 do not represent many of the types of sources at iron
25 and steel and mining facilities.

10TH CONFERENCE OF AIR QUALITY MODELS 03/13/2012 CCR#16766-1 177
1 Fugitive sources pose increasing
2 challenges for accurate air modeling and the kinds of
3 sources we're talking about, some have already been
4 mentioned, the roadways for example, the Haul Roads.
5 The handling of materials around the sites -- the
6 industrial sites where you have to load and unload
7 materials sometimes form storage piles. You load them
8 back into trucks and take them to another location et
9 cetera. You have building roof vents from which
10 emissions can come. You have slag pits. You could
11 have a water cooled material handling operation and you
12 could have a pit at a mining facility where you're
13 below grade. You're significantly below grade when
14 you're actually loading the trucks to take them to the
15 crusher. What happens to the emissions that do not
16 escape from the pit?
17 So, the characteristics of the fugitive
18 sources I've already mentioned. They're diffuse in
19 nature with spatial and temporal variations and many of
20 them are low level releases. A release from a roadway.
21 A release from a building, perhaps near the ground in
22 an area where storage piles exist and you have strong
23 effects of obstructions to air flow.
24 Now, we have proposed, the American Iron
25 and Steel Institute, kind of a collaborative effort to

10TH CONFERENCE OF AIR QUALITY MODELS 03/13/2012 CCR#16766-1 178
1 try to evaluate all of these factors in more detail and
2 to address these problem sources before requiring
3 modeling for NAAQS compliance. So, we really need to
4 look at these in more detail and see what we can do to
5 address the complications of fugitive sources. And this
6 just shows a building that has roof vents and, you
7 know, possible points of releases. It's a very complex
8 structure. There tends to be small spaces between
9 buildings. You have roads passing between buildings
10 so, it's a very complex type of situation to try to
11 model.
12 Now, the emission factors, and I was
13 involved in a lot of this original work back in the 70s
14 and 80s, and EPA was interested in what are, you know,
15 what is the magnitude of fugitive emissions? Do we
16 really have to worry about fugitive emissions and
17 fugitive dust and such in dealing with cleaning the
18 atmosphere, meeting air quality standards, or do we
19 just worry about stack emissions and stop there. And
20 we had a budget to go out and try to look at industrial
21 sources and non-industrial sources like agriculture,
22 construction, and so forth, and try to come up with
23 test methods.
24 Test methods were not developed prior to
25 this work. Unlike stack testing where collaborative

10TH CONFERENCE OF AIR QUALITY MODELS 03/13/2012 CCR#16766-1 179
1 work has gone on for virtually every stack testing
2 method, you can look at it in the Federal Register.
3 You can get an exact prescription of the procedure you
4 have to follow in order to do the measurement.
5 This is not the case for these kinds of
6 sources.
7 And we also -- the idea, if you're going
8 to go out to an industry for the first time, you'll
9 probably look for the dustiest sources. You want to
10 make sure that you hit the top level because the bottom
11 level is -- maybe is zero, but you want to bracket the
12 top of the emission range and so you want to look for
13 those and if you're on a limited budget, you're just
14 going to pick some dusty sources and work on those and
15 then hopefully you can do adjustments later to give you
16 a better average representation of the operation.
17 Now, we know that in the Title-V era and
18 so forth over the many years since a lot of this work
19 was done, there have been improvements to work
20 practices. And these improvements were made with
21 safety in mind, with equipment maintenance in mind, and
22 other factors, as well as air quality so, there have
23 been improvements in the practices which we feel are
24 reflected in emission factors if you were to go out and
25 redo some of the tests.
10TH CONFERENCE OF AIR QUALITY MODELS 03/13/2012 CCR#16766-1 180
1 I would like to point out that back when
2 we were doing the tests and we worried about total
3 suspended particulate matter, there was no definition
4 of particle size at that point, believe it or not, and
5 so then we said well, down the road there's going to be
6 something about inhalable particulate matter or
7 something that represents a particle size so, we better
8 collect some of that data, but we just kind of did that
9 on the fly so-to-speak.
10 And then the test methods themselves
11 were, as I said, never -- never fully standardized and
12 there was only one collaborative -- EPA collaborative
13 test of the profiling method which my company developed
14 and that was at a steel plant in the Chicago area and
15 the four organizations were out there applying the
16 method side-by-side.
17 So, I'd like to say that we know that
18 the dispersion models are going to have problems with
19 regard to predicting impacts from these non-Gaussian
20 fugitive sources and a lot of these effects appear to
21 be leading to over-prediction of the transportability
22 and the air quality impacts of these sources.
23 There are depletion processes going on.
24 We found that -- and if you go out and do this dust
25 testing, for example, you find that there's large

10TH CONFERENCE OF AIR QUALITY MODELS 03/13/2012 CCR#16766-1 181
1 amount of charge on the particles. You can take a
2 filter back to the lab and if you try to weight it
3 without de-charging it, you can take a forceps and go
4 towards the filter, particles will jump off of the
5 filter. And you actually have to pass a radiation
6 strip over the filter to de-charge the particulate
7 matter before you can weigh it.
8 Well, we found some effects that the
9 electrostatic conglomeration, because depending upon
10 the composition and size of the particles, you can
11 actually have a polarity shift and so you can have
12 particles in the dense plume that are attracted to each
13 other and actually are agglomerate at a much higher
14 rate. And we found these effects in some recent field
15 tests that we did for the Department of Defense.
16 So, these kind of things need to be
17 dealt with in looking at plume losses that occur in
18 reality and they need to be represented in the models
19 for dispersion of these emissions.
20 Now, another issue is source
21 configuration. Haul Road haul trucks, you know, if you
22 go out to one of these mines or steel plants, they come
23 along every few minutes. There's not a continuous
24 stream of haul trucks lined up. So, if you model this
25 as a continuous line source, area source, or volume
10TH CONFERENCE OF AIR QUALITY MODELS 03/13/2012 CCR#16766-1 182
1 source, you're assuming the entire source is emitting
2 constantly and that's not a good representation because
3 you don't allow for any dilution in the direction of
4 the road. The entire road is emitting. So, you remove
5 one dimension for dilution and that leads to
6 overestimation of the impacts.
7 And so, we've talked about pit trapping
8 and I already mentioned that and so, someone else
9 previously addressed the issue of low wind conditions
10 and we know that if you have a dense plume cloud --
11 cloud of dust -- that this electrostatic conglomeration
12 is going to be more prevalent in that kind of a
13 situation and so, that's going to cause a depletion to
14 occur when that is developed.
15 I actually submitted a summary of all
16 this to EPA in August of 2009, but I also want to point
17 out a couple of things before my time is up and that is
18 that in looking at regional models performed by EPA to
19 look at the impacts of dust sources, they found that,
20 on average, CMAQ over-predicted by a factor of four the
21 observed dust impact. So, the way that was done was to
22 actually go out and collect samples off of the filters.
23 Do a chemical analysis of those samples and then do
24 fingerprinting against the dust sources and then
25 associate how much dust is actually -- fugitive dust is

10TH CONFERENCE OF AIR QUALITY MODELS 03/13/2012 CCR#16766-1 183
1 actually on the filters.
2 And so for a while, there was just a
3 factor of four reduction of the transport effect to
4 account for what was actually observed at the modeling
5 sites, or the monitoring sites.
6 And so I developed a table showing a lot
7 of these effects and it's in the report I just
8 mentioned. I'm not going to have time to go through
9 all of this, but these are the kinds of problems you
10 can run into if you represent Haul Roads as
11 continuously emitting area or line sources or volume
12 sources. The factor of four correction which is a
13 cumulative effect of a number of different conditions
14 near source agglomeration enhanced deposition. There's
15 a factor, a large factor of over-prediction if you
16 don't account for that. Exclusion of trapping by
17 vertical obstacles during horizontal transport. These
18 are all developed by different investigators. A lack
19 of treatment of pit trapping and then instant vertical
20 mixing and grid models. There are all of these
21 different effects that you can take a look at.
22 And so, what we recommend is that there
23 be some adjustment for these over-predictions if we're
24 going to be modeling these sources with AERMOD and I
25 will say that after EPA used the factor of four

10TH CONFERENCE OF AIR QUALITY MODELS 03/13/2012 CCR#16766-1 184
1 adjustment, they refined that and they developed a map
2 of the whole U.S. county-by-county and they used
3 transport fractions. In other words, it was based on
4 the ground cover in each county. The prevalent ground
5 cover. So, counties with a lot of trees would have a
6 low transport fraction of dust. Counties that are bare
7 -- bare lands -- would have a higher transport
8 fraction. That was developed.
9 So, you could use an emissions pre-
10 processing step, similar to what was used in CMAQ, to
11 take a better look at how do we adjust the emissions
12 slash transport estimate to correct for what we
13 actually observed in the field.
14 And so, in summary, we feel that the air
15 dispersion models need some further work in order to
16 accurately be used for regulatory compliance analysis,
17 especially the fugitive area, volume, and low stack
18 sources that are present in these industries and that,
19 for example, this could be handled by using an emission
20 deposition pre-processing step as part of the standard
21 modeling protocol. Adjusting the models to address wind
22 speed dependent emissions and avoid positive biases for
23 fugitive and volume slash area sources during low wind
24 speed events and to re-examine the applicability of the
25 AP-42 emission factors and the particle size

10TH CONFERENCE OF AIR QUALITY MODELS 03/13/2012 CCR#16766-1 185
1 distributions and make adjustments as necessary.
2 The number of modeling improvements, as
3 we said before, all of this takes time. This is a big
4 effort. It's not going to be accomplished overnight
5 and so, AISI is offering our services to work with the
6 EPA and try go through this in more detail and see what
7 can actually be done reasonably at this time until a
8 better accommodations can be made within AERMOD and
9 other models that might be used for this purpose.
10 So, I thank you for your attention.
11 MR. BRIDGERS: Hopefully, this
12 afternoon's session feels like it's moving along after
13 we had pretty long presentations this morning.
14 If it will load, up next we have a
15 Federal partner agency, a fellow EPA discussion and
16 this is, sort of, the predecessor of some stuff we'll
17 talk about tomorrow morning with the PM 2.5 modeling
18 guidance, Meg Patulski.
19 MS. PATULSKI: Thanks, George.
20 I guess before I get started in the
21 presentation, by a show of hands, how many people know
22 what transportation conformity is?
23 Well, that's nice. I know we've been
24 covering a lot of other types of sources in this
25 workshop and it makes perfect sense, but now that we're

10TH CONFERENCE OF AIR QUALITY MODELS 03/13/2012 CCR#16766-1 186
1 having more overlap in my world at the Office of
2 Transportation Air Quality with Appendix W, it seemed
3 like a good time to have a presentation on our program
4 in this conference.
5 So, thanks, Tyler and your shop for
6 inviting us and telling you a little bit about
7 transportation conformity.
8 I want to let you know that
9 transportation conformity applies in PM-10 and PM-2.5
10 non-attainment maintenance areas. And what I plan to
11 do today is to give you a sense of the program, a few
12 more details, tell you about the overview of our hot
13 spot guidance, highlight some places where we rely on
14 Appendix W, and then I guess that's all the time I'll
15 have.
16 So, let's go.
17 Transportation conformity has been
18 around since 1977. But in 1993, because of the Clean
19 Air Act, we -- revisions in 1990, we revised the
20 conformity rule and it applies to any new transit or
21 highway project that receives Federal funding or
22 approval by the Federal Highway Administration or the
23 Federal Transit Administration. And conformity at its
24 core is intended to make sure that Federal taxpayer
25 investments in those kinds of projects or in larger

10TH CONFERENCE OF AIR QUALITY MODELS 03/13/2012 CCR#16766-1 187
1 transportation plans and programs should not cause or
2 contribute to new NAAQS violations, worsen existing
3 violations, or delay timely attainment of the NAAQS or
4 interim milestones.
5 It is -- a lot of conformity is done at
6 the regional non-attainment maintenance area level
7 through emissions, budgets, those on road mobile source
8 portions of SIPS sub-attainment demonstrations RFP
9 maintenance plans.
10 But there is also a portion of our
11 conformity rule, where hot spot analyses are done in
12 carbon monoxide, PM-2.5, and PM-10 areas so that those
13 individual projects also do not cause or contribute to
14 new violations, worsen existing violations, and so on.
15 I'll be focusing on the PM today. Since
16 1993, there's been a CO hot spot requirement that's
17 been implemented primarily for intersection projects,
18 but we have, of course, a new focus on PM now.
19 How do you meet conformity? At its
20 core, conformity at the project level is a build, no-
21 build test. In my world, the build is -- are the
22 concentrations from the new project as well as your
23 background, compared to the no-build, what life would
24 have been without the project. And you pass if you're
25 below the NAAQS in your build scenario or if your build

10TH CONFERENCE OF AIR QUALITY MODELS 03/13/2012 CCR#16766-1 188
1 scenario is less than your no-build scenario even
2 though you're above the NAAQS.
3 So, you know, this is something that I'm
4 sure, you know, that folks in this room know what this
5 is. Just to focus the conversation, we have, you know,
6 obviously we have -- well, basically it just shows the
7 background level here, we're looking at the part
8 immediately around the highway transit project. You
9 know, looking at the background plus your local
10 component. The emissions from your highway project or
11 from a transit project which I'll go into. That's
12 where the hot spot analysis is done. You know, 100
13 meters, 500 meters from a road. We don't look out any
14 farther than that because, of course, it goes to
15 background.
16 In December of 2010, we released the PM
17 hot spot guidance and this is written to be a
18 transportation conformity guidance document, but it has
19 technical information as applicable to modeling any
20 type of mobile source like a highway or transit
21 project. Many aspects of it rely on the same things
22 that are relied on for other EPA programs.
23 Right now, qualitative analyses are
24 being done, but quantitative -- because of introduction
25 of the moves emissions model, new quantitative

10TH CONFERENCE OF AIR QUALITY MODELS 03/13/2012 CCR#16766-1 189
1 requirements will go into place in December of this
2 year.
3 The technical guidance includes
4 emissions modeling, air quality modeling, background,
5 design values, calculations, and for the parts of it
6 that are relevant, we rely on Appendix W. That is
7 EPA's guidelines for all programs and we follow those
8 guidelines in implementation of our requirement.
9 This just gives you a sense of various
10 parts of completing a hot spot analysis. We have found
11 in our world most of our users are transportation
12 agencies, state DOTs, some state air agencies are
13 involved, but people who, you know, doing a PM
14 localized air quality analysis, we have found, is
15 really a brand new world for lots of programs, not just
16 ours. And so, we try to organize our document to go to
17 various steps in a user-friendly way and to be clear in
18 every step. And basically, you know, you're looking at
19 once you know you need to do an analysis, and for PM
20 hot spot analysis, we're looking at new highway
21 projects or new transit projects with a significant new
22 amount of diesel traffic. So, this is like five
23 percent of all the projects that are done through
24 Federal approval funding in the country.
25 Large highway expansions, new highway

10TH CONFERENCE OF AIR QUALITY MODELS 03/13/2012 CCR#16766-1 190
1 expansions involving lots of trucks. Lots of volume is
2 125,000 annual average daily traffic or higher. Large
3 new intersection expansions that service primarily by
4 diesel trucks. Say you're adding an off ramp or new
5 freight terminal expansion or a port. Large projects.
6 Lots of diesel trucks. Or large new regional or
7 expanded transit terminals with lots of diesel buses.
8 So, those are the kinds of projects.
9 Step three, you look at your motor vehicle emissions,
10 your other sources, and so on. I'm going to go through
11 some of these, but if you want to know what all the
12 steps are, I just wanted to put this up. Our guidance
13 follows all these and goes over a tremendous amount of
14 detail in every single step.
15 But let's -- this is kind of a nice
16 visualization of the kind of work that we do and the
17 scope of what we do and, in this graph, the yellow
18 dotted line is -- outlines a new highway or expanded
19 highway involving, you know, you have some, you know,
20 say you're adding a couple lanes here, you've got maybe
21 a new interchange right here, some ramps. Let's just
22 assume these are all, you know, there's a large amount
23 of diesel traffic.
24 Emissions modeling would first be done
25 for the local roads which are in green and the new

10TH CONFERENCE OF AIR QUALITY MODELS 03/13/2012 CCR#16766-1 191
1 facility. Get the emissions there. Then, the air
2 quality modeling would be done, of course, from the
3 source. You know, and in this example it goes out to
4 about 500 meters. And the emissions, of course, from
5 this area after the air quality concentrations are
6 predicted would then be confined to your background
7 concentrations and then you'd go through your design
8 value calculations.
9 But I'm just trying to give you a sense
10 of the area that people need to show that there is no
11 new NAAQS problem. The public health is protected in
12 those areas immediately adjacent to these facilities.
13 So, latest emissions models need to be
14 as -- for vehicle, tailpipe, tire wear, and brake wear
15 that's MOVES 2010a, soon MOVES 2010b which will be
16 released very soon. EMFAC is used in California and
17 you've got to use the latest models.
18 For construction dust, I'll go over the
19 MOVES project links in a little bit, but in a visual --
20 I have a couple of pictures there.
21 But, we also look at, especially in PM-
22 10 areas, we look at road dust from paved and unpaved
23 roads and for PM-10 areas, all of them that have these
24 kinds of projects need to include those types of
25 emissions.

10TH CONFERENCE OF AIR QUALITY MODELS 03/13/2012 CCR#16766-1 192
1 For PM-2.5, you only include paved and
2 unpaved road dust. If your air quality monitoring data
3 for your area that using your SIP development and so on
4 shows that road dust is a significant contributor to
5 air quality problems. Because we all know that you're
6 going to get a lot of emissions calculated from those
7 facilities for that road dust, but not all of it in PM-
8 2.5 areas get to the monitor. So, we have that and in
9 some areas they look at construction dust as well, from
10 transportation related construction.
11 So, one of the things I want to mention
12 about MOVES since it does carry over to using AERMOD,
13 is with the MOVES model, we have an added layer of
14 sophistication quantifying the emissions from these --
15 from highways, intersections, and so on, to pick up
16 different levels of activity, volumes, types of fleets
17 on doing the individual parts of facilities.
18 So, let's just look at this. We have an
19 intersection here. We have a highway here. Let's say
20 that this new road here -- that this existing facility
21 is a new road. In MOVES, if you look, there's several
22 speed options which you can characterize emissions
23 rates, but if you looked at the average speed option,
24 you could be trapping this road into various
25 calculating different emissions factors for these, you

10TH CONFERENCE OF AIR QUALITY MODELS 03/13/2012 CCR#16766-1 193
1 know, Q activity here in the red. You've got
2 acceleration links where most of -- you're seeing most
3 of the activity there is accelerating. Green as in
4 crews and so on. And what's nice about this is to
5 realize that this information that you're using to
6 quantify your emissions factors will be carried over
7 when you use the air quality models and you
8 characterize your sources. I just wanted to give you a
9 sense of that, of the level of detail.
10 So, air quality modeling. You know, the
11 same steps that are involved in air quality modeling
12 for stationary sources, point sources, are the same
13 steps we use, just the details are different.
14 First you have to select your air
15 quality model, characterize your emissions sources,
16 obtain your MET data, specify your receptors, and run
17 the model. And I can't emphasize enough that we work
18 with Tyler's shop very closely to make sure that what
19 we do is consistent with other air quality modeling,
20 because Appendix W covers our world as well.
21 Now, for what air quality models are
22 used for analyses? Well, AERMOD, it really depends on
23 the kind of project you have. AERMOD can be used for
24 all of the different kinds of projects that could get
25 Federal funding or approval. That could be highway and

10TH CONFERENCE OF AIR QUALITY MODELS 03/13/2012 CCR#16766-1 194
1 intersections projects that don't involve nearby
2 sources or terminals of any kind. We also rely on the
3 CAL3QHCR model. That's the refined version of the
4 CAL3QHC model. That can be used for those kinds of
5 projects. Transit, freight, and other types of
6 terminals, again, these are ports, expanded rail
7 stations, parking lots, things like that. Of course,
8 you can use AERMOD and any project in the
9 transportation world that involves a mix of those
10 different kinds of sources can also rely on AERMOD.
11 This kind of just lets you emphasize,
12 again, the types of sources that we described in our
13 guidance. We, you know, have line sources which we
14 think AERMOD can simulate and CAL3QHCR can certainly
15 cover. Those are for those highway and intersection
16 only projects.
17 Then you have the bus and garage
18 terminals and all those, as well as, for point sources
19 you might have a stack on a maintenance facility. That
20 you can use AERMOD in.
21 Of course, area and volume source, we
22 don't have a preference in our guidance. We offer that
23 as an option for any of the projects that could have a
24 transportation conformity determination.
25 Okay, now selecting MET data and placing

10TH CONFERENCE OF AIR QUALITY MODELS 03/13/2012 CCR#16766-1 195
1 receptors, again, we follow Appendix W. You need to,
2 when you do your air quality modeling, have at least
3 five years of representative off-site data, which for
4 our users will be the most common case. Nobody in the
5 transportation world usually has a site specific
6 monitoring station. They don't do new -- they don't
7 monitor for these sources.
8 But if you do happen to have site
9 specific data, you need to have, like Roger said, at
10 least one year of site specific data and we follow the
11 AERMOD implementation guide for representativeness and
12 so on.
13 Receptor spacing is the same. The same
14 guidelines. You look for the highest model
15 concentrations. You put receptors where the people are
16 going to be and not in places that people cannot access
17 like right-of-ways, private property, and so on. And
18 we also have additional guidance for the annex.
19 Background concentrations, for these
20 kinds of analyses, you know, people can use a
21 representative air quality monitoring station to -- if
22 you don't have any nearby sources, you can certainly
23 use that to represent your background concentrations,
24 but if you do have a nearby source, you have to follow
25 the various parts of Appendix W that apply and quantify
10TH CONFERENCE OF AIR QUALITY MODELS 03/13/2012 CCR#16766-1 196
1 those emissions and include them in your air quality
2 modeling.
3 I do want to point out that we don't
4 envision stationary sources being modeled in these
5 kinds of analyses. We expect, for the most part, those
6 are not going to be affected by our transportation
7 projects and if you have representative background
8 concentrations from an air quality monitor, that could
9 be included there or relevant. Most of these projects
10 are going to be in urban areas.
11 Design value calculations, we follow
12 very closely what people use for other types of
13 sources. We're consistent. We combine the air quality
14 modeling that's done for five years with the air
15 quality representative background concentrations which,
16 again, is usually typically three years of background
17 data from a monitor. And we have a tremendous amount
18 of detail in our guidance and our training for
19 calculating these values and we also have created a
20 MYSQL tool to calculate the 24 hour PM-2.5 NAAQS
21 because that's a very difficult NAAQS to quantify and
22 we have found that tool has been well-received in our
23 training. So, all of this is on our website.
24 The hot spot training, if you want to
25 know more about the details, you can always check out

10TH CONFERENCE OF AIR QUALITY MODELS 03/13/2012 CCR#16766-1 197
1 our guidance, of course. We have a three day training
2 where we walk through not only the conformity aspects
3 of this document, but also you learn MOVES one day. If
4 you're in California, you'll learn EMFAC. Applying
5 that at the project level for PM-10 and PM-2.5.
6 There's a day on AERMOD and then there's a day on
7 CAL3QHCR and design value calculations and so on.
8 We've had in seven places so far and
9 we're going to be offering three more in the near
10 future in Madison, Wisconsin; Frankfurt, Kentucky; and
11 Denver, Colorado. So, if you're interested in learning
12 more, check those out on our website.
13 And again, we have tools and tips and we
14 also have a mini-exercise, as well as more extensive
15 example analysis that goes over all of these models.
16 And then, I guess, if you want more
17 information, you can talk to me or check out our
18 website.
19 Thanks.
20 MR. BRIDGERS: Thanks, Meg. And to that
21 end, we also crosslink off the SCRAM website to the
22 Transportation Conformity Hot Spot Analysis.
23 Well, we've reached the part of the
24 afternoon where we actually have a little time. We had
25 budgeted a half hour for questions related to the

10TH CONFERENCE OF AIR QUALITY MODELS 03/13/2012 CCR#16766-1 198
1 AERMOD applications. I don't know that they need to
2 absolutely have to be.
3 With respect to the speakers, it might
4 be a good policy to do like we did this morning and
5 just have everybody come up and sit so they're at a
6 mic. Is that kosher? Is that cool?
7 Sorry, Meg. You just sat down.
8 I'll turn the mics on here.
9 MS. PATULSKI: Hi, I just wanted to add
10 one more thing. We work very closely with the
11 Department of Transportation. They, per the Clean Air
12 Act, need to concur on all of our rules and
13 requirements and we're working jointly with them, with
14 the Federal Highway Administration with our training,
15 and I would be remiss to not mention their -- the
16 partnership that we have with them.
17 AUDIENCE MEMBER: I'm not sure this is a
18 question for this panel.
19 I'm Gale Hoffnagle from TRC.
20 I did an AERMOD modeling study last
21 summer and the people at EPA, U.S. EPA, that I'm
22 working with have only criticized the fact that I
23 wasn't using the most current version.
24 Well, now I've had to re-run AERMOD
25 twice, because you've changed the versions twice, since

10TH CONFERENCE OF AIR QUALITY MODELS 03/13/2012 CCR#16766-1 199
1 the original study.
2 What do I do?
3 MR. BRODE: Well, I don't think the
4 solution is for us to just stop updating the model and
5 we certainly regret any inconvenience that that might
6 cause anybody in the community. I would say that you
7 should work it out with the appropriate reviewing
8 authority.
9 If there are changes that have been made
10 to the model that impact your application, then
11 certainly that would be a valid reason to require
12 someone to remodel it.
13 If it's clear that there aren't changes,
14 then maybe that's something that could be worked out,
15 but--
16 AUDIENCE MEMBER: I've asked them to
17 talk to you, but that hasn't happened.
18 MR. BRODE: Okay. And whose call should
19 I look for?
20 MR. BRIDGERS: Thank you, Gale, I'll
21 follow-up--
22 MR. BRODE: Well, there's a new update
23 coming up soon and you're going to have to remodel
24 again. So, just tell them to wait.
25 AUDIENCE MEMBER: Quguo Jing, from

10TH CONFERENCE OF AIR QUALITY MODELS 03/13/2012 CCR#16766-1 200
1 Breeze Trinity Consultants.
2 I have a question for Bob.
3 So, under the low wind conditions, the
4 USTAR is always measured by the AERMET so, the sigma V
5 is also on AERMET so you set some minimum value for
6 sigma V.
7 How about sigma W? Do you have a sigma
8 recommendation or do you have any other concerns?
9 MR. PAINE: Sigma W was not, apparently,
10 not as critical a parameter, especially for low level
11 releases and in flat terrain as sigma V.
12 We noticed that the Tracer observations
13 indicated a wide plume spread and predictions without
14 the increased sigma V indicated too small of a plume
15 footprint.
16 By the way, this study has been
17 published in the 2010 Air Waste Management Association
18 Annual Meeting Proceedings. So, that's one access
19 point for this low wind speed study.
20 AUDIENCE MEMBER: Hi. Mike Lebeis from
21 DTE Energy. I just had a couple of questions actually
22 related to AERMOD.
23 First, the intermittent source
24 clarification. I mean, basically, you have the
25 emergency sources. You have, like, a routine source

10TH CONFERENCE OF AIR QUALITY MODELS 03/13/2012 CCR#16766-1 201
1 that operates, you know, typically a certain hour or
2 two a day. Then your third category are sources like
3 peeking units that, in reality, don't operate very
4 often, but they could under an emergency like the
5 Northeast U.S. when we had a blackout back in 2003.
6 Under those circumstance, they're going to operate unit
7 the grid comes back.
8 The question I have is like for those
9 types of sources, would you have to model them in an
10 impact assessment for a specific plant or could you
11 model at an annual average emission rate if you took
12 like a federally enforceable limit, say 100 hours or
13 500 hours? Would you be able to model them at average
14 annual emission rate instead of the maximum hourly
15 emission rate?
16 MR. BRIDGERS: First, I want to see if
17 Roger has any comments. He's looking at the schedule.
18 MR. BRODE: I just want to say that that
19 question would fit more appropriately at some sessions
20 tomorrow, but -- or I would defer to Tyler.
21 MR. BRIDGERS: Let's go ahead and
22 address it now. We've got plenty of time.
23 MR. BRODE: Well, I don't know that I
24 can say much beyond what's in the March clarification
25 memo. We certainly have to be very careful about
10TH CONFERENCE OF AIR QUALITY MODELS 03/13/2012 CCR#16766-1 202
1 offering responses to comments or questions on specific
2 applications outside of the formal Model Clearinghouse
3 process. So, that's -- I mean, our group within OAQPS
4 gets involved in specific permit application issues.
5 Generally, it should be through that formal Model
6 Clearinghouse process, an issue that needs to be
7 resolved.
8 We do interact with the state regional
9 offices, in particular if there are questions that come
10 up that need clarifications. So, I don't think that
11 this is a proper venue to give you an answer that may
12 not have adequately considered all of the facts.
13 I'm sorry about that. I mean, again, we
14 identified in the memo what was intermittent emissions
15 which are not expected to contribute significantly to
16 the annual distribution of daily -- maximum daily one
17 hour values. You know, that's not necessarily a
18 precise definition, but that's sort of the criterion
19 that you need to look at.
20 And we do mention using the annual
21 average emission as an option to consider, but we have
22 not indicated that as a alternative that can be used
23 routinely in every situations.
24 So, it depends on the circumstances and
25 the detail. The devil is in the details as it is with
10TH CONFERENCE OF AIR QUALITY MODELS 03/13/2012 CCR#16766-1 203
1 many things.
2 MR. BRIDGERS: And Roger, I think it's
3 worth pointing out that the annualized emissions,
4 that's not the only solution. There are other options
5 that are there. That's just one potential way of
6 addressing these intermittent emissions.
7 MR. BRODE: Right. It may depend on how
8 well you can actually character the distribution. It
9 may be a situation where you really don't know, like
10 you said. That makes it harder.
11 If it's something where you actually do
12 have some idea what the annual distribution of
13 potential impacts would be, it would be easier, but
14 again it gets into a lot of details that are very
15 application specific.
16 AUDIENCE MEMBER: I'm Mark Bennett with
17 CH2M Hill and I have a question for Randy Robinson and
18 the Haul Roads Work Group.
19 You've heard a number of other issues
20 that have been brought up that are obviously directly
21 applicable to Haul Roads. Bob Paine's presentation and
22 the whole discussion about ASOS and the increased level
23 of low wind speeds. All of those obviously directly
24 applicable. I don't think those were considered in
25 your report that you just posted.

10TH CONFERENCE OF AIR QUALITY MODELS 03/13/2012 CCR#16766-1 204
1 Is that something that you will be
2 considering in your further work?
3 MR. ROBINSON: That's not something that
4 we envision looking at further necessarily. Our charge
5 and our purpose was examining the best way to sort of
6 characterize the dispersion and the initial set-up of
7 these kinds of sources.
8 I think a lot of the things we've heard
9 today speak to, sort of, get at the emissions and maybe
10 more appropriately an emissions factor applied
11 somewhere in the pre-processing area might be a better
12 way of getting at that, but the light wind speed and
13 that kind of thing isn't something that we envision
14 looking at further.
15 AUDIENCE MEMBER: Okay. Thank you.
16 AUDIENCE MEMBER: Hi. This is Ahammad
17 from RWDI and we -- my company works in Canada mostly
18 and some of our work related to roadway jobs, kind of a
19 highway expansion, that sort of stuff. So, my question
20 goes to Meg.
21 The first question is do you have any
22 guideline for -- about the representative background
23 concentration of the monitoring station? Because
24 sometime those background monitoring stations are
25 biased by, you know, the nearby sources like, say for

10TH CONFERENCE OF AIR QUALITY MODELS 03/13/2012 CCR#16766-1 205
1 example, if that monitoring station is near a highway
2 or any industrial location or something like that. So,
3 do you have any guideline for that or do you have any
4 plan to cover that?
5 MS. PATULSKI: We have section eight of
6 our hot spot guidance covers background concentrations
7 and it does include -- it looks at four different
8 options for characterizing background.
9 Looking at one monitor, interpolating
10 between several monitors, or also looking at possibly
11 chemical transport modeling results in some areas and a
12 third, limited option for PM-10 areas.
13 I would say check that out. There are
14 some factors that you should consider so you find a
15 representative site and you have to consider those
16 kinds of things. Is it upwind from your project area?
17 Is it downwind? Is the development similar?
18 You have to consider all of those kinds
19 of things and find, you know, hopefully you have
20 something nearby the project location that is
21 representative, but there possibly could be other
22 monitors in your non-attainment area that might be more
23 representative. You need to just look at what you have
24 and make the best decision and I cannot emphasize
25 enough talking with your state air quality agencies is

10TH CONFERENCE OF AIR QUALITY MODELS 03/13/2012 CCR#16766-1 206
1 really important for this part of our analysis.
2 So, I would say check out section eight
3 of our document and it has a lot more details on making
4 those decisions.
5 AUDIENCE MEMBER: Okay, my next question
6 is about the new version of MOVES.
7 So, you said that the 2010b is coming
8 pretty soon, so what kind of changes we can expect from
9 that.
10 MS. PATULSKI: Well, none of the changes
11 are going to affect anything related to air quality
12 modeling guidelines. I'd just like to say that first.
13 In general, there are some performance
14 enhancements in MOVES 2010b that will help emissions
15 modelers in some aspects, but the emissions results are
16 not really going to be different from MOVES 2010a, but
17 there are some things that have been added. I guess if
18 we have time, I guess I would like to defer to my
19 colleague, Chris Dresser.
20 Can I have Chris? It looks like we have
21 a little bit of time.
22 MR. BRIDGERS: Absolutely.
23 MS. PATULSKI: Yes, why don't you use
24 the mic there.
25 Chris is the MOVES Team. He can give

10TH CONFERENCE OF AIR QUALITY MODELS 03/13/2012 CCR#16766-1 207
1 you a better answer.
2 MR. DRESSER: This is Chris Dresser and
3 I work with Meg at EPA Office of Transportation and Air
4 Quality and I work on the MOVES model and I guess I can
5 announce that we're planning an update, like Meg said,
6 to the MOVES model. It's called MOVES 2010b. It will
7 likely come out at the end of this month or early next
8 month.
9 All of the changes will be mainly
10 usability and performance. There will be no changes to
11 emission rates at all, so it's not considered a new
12 model.
13 MS. PATULSKI: All right.
14 MR. BRIDGERS: Thanks, Chris.
15 AUDIENCE MEMBER: I'm Ryan Gesser from
16 Georgia Pacific and I'll direct my question to Randy,
17 but invite anyone else to comment up there.
18 With regard to your best practices, it
19 might be premature, but I wondered if you could comment
20 on the level of receptiveness or if any of the methods
21 you described are going to be considered presumptively
22 acceptable among your peers and the state agencies and,
23 depending upon your answer, will that be communicated
24 through a memo or AERMOD implementation guide or a
25 stand-alone report or how do you expect that process to

10TH CONFERENCE OF AIR QUALITY MODELS 03/13/2012 CCR#16766-1 208
1 work?
2 MR. ROBINSON: Well, I can answer the
3 beginning and maybe the end Tyler could speak to.
4 From my perspective, I guess I would say
5 if someone in Region 5 came in and was applying the
6 approach that we recommended, I wouldn't have
7 necessarily any objections to it. I mean, it was what
8 we came up with as a reasonable recommendation that we
9 thought was, sort of, technically supportable and so we
10 have it out there now for comments and, as we gather
11 those, and if we end up making modifications, I guess
12 ultimately that would result in EPA coming out with a
13 memo, sort of a final position on it.
14 Tyler?
15 MR. FOX: Yeah, and we -- the great work
16 that Randy and Meg led with the state and local
17 agencies and other local regional modelers. It has
18 been a long time, hadn't it, Randy? 2009 seems like
19 yesterday.
20 What we expect to do as we put it out
21 for comment as part of this conference is to get
22 comments from you all in the community, submit that to
23 the docket, we would consider those comments and need
24 to determine what the appropriate next steps are.
25 I would agree with Randy that it's out

10TH CONFERENCE OF AIR QUALITY MODELS 03/13/2012 CCR#16766-1 209
1 there now so, if someone were to come to a regional
2 office and propose to address the issue in a particular
3 situation following that guidance, again, it would up
4 to that regional office to approve that and I would
5 imagine that, if appropriate, they would do so.
6 So, the fact that there is not final
7 guidance doesn't preclude people. I think the issue
8 was, as Randy presented, we saw a wide ranging type of
9 assessment or account for these types of sources
10 ranging from not at all, to being the controlling
11 scenario for the permit and I think there was a lot of
12 need to figure out what the there there was and the
13 issues. There are issues that Randy and company didn't
14 address that Chat did in terms of the emissions factors
15 and other factors that go in there.
16 So, from the standpoint of getting to a
17 point of having final EPA guidance, there would have to
18 be quite a bit of work done to address the issue fully
19 and we look, again, for your input as part of the
20 comments on this conference and then, as was suggested
21 in another venue, having some type of maybe
22 collaborative work group to get more information and
23 work towards that final EPA guidance.
24 But this is an important aspect. I
25 congratulate Randy and Meg and company for getting it

10TH CONFERENCE OF AIR QUALITY MODELS 03/13/2012 CCR#16766-1 210
1 done and, you know, making it available to you all to
2 review and comment and we would urge you to do so.
3 AUDIENCE MEMBER: Hi. Pete Manuso from
4 First Energy. Quick question.
5 I think the study that API conducted and
6 found potential work around or fix for the low wind
7 speed issue with AERMOD, along the same line as the
8 last question, how does something like that get
9 adopted? Apparently, it's been sitting on the shelf
10 for about two years. Can you comment on that at all?
11 MR. FOX: Sure. Given the
12 prioritization that I and others in the group have to
13 attend to, we have limited resources to get to those
14 things.
15 I think, as a follow-up to this
16 conference and, again, having it there for others to
17 comment on, that study and the like, would be useful
18 for us in consideration of that and along the lines of
19 the other issues that we'll be discussing and have
20 discussed this afternoon and will tomorrow in terms of
21 the one hour NAAQS, those things will be taken into
22 consideration.
23 That's -- we're dealing the best we can
24 in providing guidance to deal with current permit
25 issues and the like under these one hour standards.

10TH CONFERENCE OF AIR QUALITY MODELS 03/13/2012 CCR#16766-1 211
1 We're trying to put out things that are flexible and
2 valuable to the community and resources are
3 constrained.
4 AUDIENCE MEMBER: It just seems like it
5 doesn't get the attention it deserves, respectfully
6 speaking.
7 MR. FOX: Well, that's why it was
8 presented--
9 AUDIENCE MEMBER: I know resources are
10 minimal, but, you know, we're all under that same
11 issue.
12 MR. FOX: That's why it was part of the
13 invited speaker, for Bob to come here and present it to
14 the community, for us to consider it, and so it's not
15 something we are ignoring or discounting, it's just
16 when, you know, we face the realities of what we have
17 to do, we have to hit the priorities that are dictated
18 to us by case-by-case examples and other situations and
19 we're doing the best we can with that.
20 I think as evidence of having Bob
21 present that here, we're looking for input from the
22 community and we'll take it under advisement in terms
23 of follow-up as part of this conference and into our
24 workshop with regional, state, and local modelers in
25 April and we will continue, hopefully, to work with the

10TH CONFERENCE OF AIR QUALITY MODELS 03/13/2012 CCR#16766-1 212
1 technical work group that's established to keep the
2 lines of communication open and any collaborations that
3 could assist us in addressing any questions we may have
4 once we review that study and then do further work
5 maybe to inform either in interim guidance or changes
6 to the model as far as updates to Appendix W go.
7 AUDIENCE MEMBER: Hi. This is Steve
8 Hanna from Hanna Consultants. I have a question for
9 Ms. Patulski.
10 I've done a little bit of analysis in
11 urban areas of the PM hot spots and I heard you say
12 that there's a 500 meter limit and I've heard that
13 mentioned other places before, but you said once you
14 get 500 meters from the highway, then the concentration
15 of course goes down to background and I wouldn't think
16 that would be such an absolute number that it might be
17 a larger distance if it's a large highway and so on.
18 MS. PATULSKI: Yes, I guess I'll just
19 say that it does depend on every situation. When I
20 said 500 meters, I was just talking about the
21 hypothetical project area that I had just to illustrate
22 the concept that we're not looking kilometers away. In
23 most cases, it's going to be very close and when you
24 have a nearby source or topography or other things, it,
25 you know, could be a lot farther out.

10TH CONFERENCE OF AIR QUALITY MODELS 03/13/2012 CCR#16766-1 213
1 So, yes, it really -- what the
2 conformity rule and the Clean Air Act requires is that
3 you need to demonstrate the NAAQS achieved in the
4 project area that is affected by a given situation.
5 So, throughout that project area, you need to
6 demonstrate that the NAAQS is not harmed by building
7 the project. And if that is farther out than 500
8 meters, then you need to look at that. Sometimes, it's
9 going to be less than that. It's really something the
10 consultation process because, yes, I've seen studies
11 where you see differences up to 1,000 meters.
12 So, you're absolutely right.
13 AUDIENCE MEMBER: Larry Simmons with E
14 squared M.
15 I'm glad to see us looking back at Haul
16 Roads again after all these years. Chat mentioned that
17 Southern Research Institute Study at Gary works, that
18 was 28 years ago, I think, that we did that and I was
19 one of the guys on the team eating dust as those big
20 trucks went by. So, it is good to see that as time
21 moves on, we are looking at Haul Roads again.
22 Hang in there guys.
23 MR. FOX: It'll define your career,
24 Randy.
25 AUDIENCE MEMBER: Actually, I have a

10TH CONFERENCE OF AIR QUALITY MODELS 03/13/2012 CCR#16766-1 214
1 question, if I may. Bob Paine. I have a question of
2 maybe Chat and Randy.
3 If it is determined that an adjustment
4 to the emission rate for Haul Road emissions would be
5 the best way to do it, how does that happen? With AP-
6 42 or whatever? How do we go about improving that
7 characterization because that's an important input to
8 the model. It might be a wind speed dependent input,
9 in fact.
10 MR. COWHERD: Well, it's -- as far as
11 the roadway emission factors, they're the most reliable
12 that we have in AP-42. We don't feel that there -- we
13 feel it's a problem once the emissions are generated
14 and then there's effects occurring in the plume that's
15 formed immediately adjacent to the source and those
16 effects have to be dealt with.
17 So, we feel it's more into the initial
18 dispersion process than it is in the emission factors.
19 However, as, you know, I pointed out, a lot of the
20 emissions data that were developed, you know, decades
21 ago, as much as I hate to say it, and just to revisit
22 all of the data, to look it over, to try to assess it,
23 I mean, we'd be willing to -- obviously, willing an
24 interested to help out with that, but to see if there
25 is something to be done to improve the emission
10TH CONFERENCE OF AIR QUALITY MODELS 03/13/2012 CCR#16766-1 215
1 factors? If you start talking about the way to
2 represent the source as a volume source and what height
3 to use and so forth and use meandering and all of these
4 other effects, then it's sensitive to those decisions
5 that you make. I mean, the impact of those sources is
6 sensitive to those decisions.
7 So, it's a sensitivity analysis. One of
8 the uncertainties in the original emission factors, how
9 the source is represented, and then the dispersion
10 process that occurs immediately adjacent to the source.
11 If there was some way of sort of evaluating and ranking
12 the importance of these different factors to figure out
13 where the work should be done first, I would think the
14 EPA would want to do this as well, considering all of
15 the different issues that have been raised and will be
16 raised at the conference.
17 How do you decide which one to go after
18 first? I mean, is there something about the impact of
19 that particular phenomenon that deserves more attention
20 than something else? I'd be interested in hearing from
21 Tyler or somebody else on that as well.
22 I mean, is it just a matter of what
23 happens to come up at this time and what you have time
24 to consider or is it looking at the big picture and
25 trying to figure out, long term, how can this area be

10TH CONFERENCE OF AIR QUALITY MODELS 03/13/2012 CCR#16766-1 216
1 improved most effectively?
2 MR. FOX: Well on this topic or area is
3 even more problematic, I guess, than one that is self-
4 contained within the modeling community because, you
5 know, you get a lot of this. So, if you talk to some of
6 the emissions people, it's a modeling issue and if you
7 talk to the modelers, it's an emissions issue. And so,
8 it's an emissions issue.
9 You know, we've had some long-standing
10 discussions with the Emissions Factors Group. You
11 know, they have their own sense of priorities. There
12 have been some collaborative things to improve the
13 emissions factors for paved and unpaved roads. I think
14 other factors that relate there are the type of
15 vegetation or other types of things that may be near
16 the roadway that may mitigate some of these effects. I
17 think it's a reality and it's safe to say that I doubt
18 we're going to get to the point where we're modeling,
19 you know, impacts near the tire while of a truck or
20 something. I mean, we've got a number of other issues
21 to deal with and so, what I would imagine would be the
22 most productive way is to have some discussions.
23 Bring, for maybe the umpteenth time, people within the
24 agency together to talk about how we could come up with
25 some adjustment factors along the lines of what Tom

10TH CONFERENCE OF AIR QUALITY MODELS 03/13/2012 CCR#16766-1 217
1 Pace and others did. Have some studies to validate
2 those in a way that we feel comfortable with and
3 address that on a case-by-case basis if there's other
4 nuances in terms of the particulars of a permit action.
5 We've -- the Corn Refiners Association
6 and others have approached the agency and have done
7 some work to try and address some of these issues, you
8 know, but I think if people feel as if it's going to be
9 resolved by the models and the modeling community in
10 terms of those micro scale types of effects, we're
11 fooling ourselves.
12 I think there needs to be some
13 discussion along what type of situations and what types
14 of factors to consider to potentially adjust those
15 emissions as they come in to get a more realistic and
16 appropriate characterization of those contributions.
17 MS. PATULSKI: I work with emissions and
18 air quality modelers and I think there's a lot to go
19 around.
20 And then there are policy people like
21 me, so there you go. I guess I will just say that it's
22 my understanding that the last version of AP-42 that
23 was approved included the information from that, from
24 that ethanol plant study and, I guess, I just wanted to
25 add in for transportation conformity, we have several

10TH CONFERENCE OF AIR QUALITY MODELS 03/13/2012 CCR#16766-1 218
1 areas and states that have approved local specific
2 alternatives to AP-42 to take in account their silt
3 loading and other types of information.
4 I mean, a lot of this is used on a
5 regional level, not a project specific level. I
6 totally agree with that, but there are some states
7 where EPA has approved customized emissions factors for
8 road dust.
9 MR. FOX: That's an excellent point,
10 Meg. What we were hearing is that people had to use
11 the AP-42 factors, but we've said over and over again
12 that a local -- local data or specific data to the area
13 or the sources of concern is always preferred as with
14 defaults that we set in other types of guidance.
15 AUDIENCE MEMBER: I'm Pete Catizone.
16 I'm with TRC and I think if I stand here long enough,
17 all of my questions will get answered.
18 I appreciate the conversation, but a lot
19 of the comments that have been made cover questions
20 that I have, but I think with the fact that we're
21 dealing with a totally different pollutant, PM-2.5 and
22 Chat, I remember the days in the 70s and 80s when we
23 were worried about the dust fall and TSP. A lot of the
24 factors we're using weren't exactly collected -- the
25 data wasn't collected to answer the questions that we

10TH CONFERENCE OF AIR QUALITY MODELS 03/13/2012 CCR#16766-1 219
1 have today.
2 I truly believe that to do justice -- to
3 both be able to meet the new standards, we need to go
4 back in the field and get some new data and the sooner
5 we do that, the better off we'll be because re-
6 massaging the data as we do every decade doesn't make
7 the data any better. It just makes us feel better a
8 little bit, I think.
9 So, as much as I hate to say, there's a
10 lot of work to be done to generate the right data, both
11 from emissions standpoint and also to get the
12 information we need for the modeling to be done
13 properly. We need to get back out in the field.
14 Thank you.
15 MR. FOX: And we would agree with that
16 wholeheartedly.
17 AUDIENCE MEMBER: Good afternoon. Hi,
18 Meg.
19 My name is George Schewe. I'm with
20 Trinity.
21 First of all, I really miss the ISC
22 model. I guess you can't bring it back, huh?
23 Chat and Randy, I wanted to maybe make a
24 comment to you, especially maybe Randy. Maybe Chat
25 knows about it.

10TH CONFERENCE OF AIR QUALITY MODELS 03/13/2012 CCR#16766-1 220
1 There was some obscuration modeling done
2 at Fort Leonard Wood years ago that might help you in
3 some of your Haul Roads dust evaluations and I don't
4 know who did that, Chat, but somebody was doing
5 obscuration on purpose because they were trying to shut
6 down the bad guys radio communications. So, they were
7 out there trying to generate dust with trucks and tanks
8 and so there might be some good data out there that you
9 can take a look at.
10 MR. COWHERD: What was the location?
11 AUDIENCE MEMBER: Fort Leonard Wood, I
12 believe, Missouri? Isn't that right?
13 Maybe you don't about it, Chat.
14 MR. COWHERD: I do know that they had
15 smoke releases when we were down there and they were
16 filling up valleys with smoke and whatever, but I'm not
17 aware of any dust obscuration tests.
18 AUDIENCE MEMBER: A couple guys that I
19 had worked with back in the Pedco days in Cincinnati
20 were actually riding. Bob Zimmer, he's out in Denver,
21 he was actually riding in the tanks so, they had stuff
22 all set up there.
23 I do have a question for you, Meg. I'll
24 get to you in a second.
25 I want to tell Bob and Ron to keep

10TH CONFERENCE OF AIR QUALITY MODELS 03/13/2012 CCR#16766-1 221
1 beating the drum, you guys, thank you.
2 Meg, and maybe this is a question for
3 Tyler or Roger, too. What kind of evaluation studies
4 that AERMOD works with these complex situations where
5 we're going to have all these different roads?
6 I haven't really seen too many
7 evaluation studies of even one road and now you're
8 going to be chunking them in there. I mean, I've run
9 CAL3QHCR with Mr. Claggett and so I was wondering, how
10 confident are you that these are going to work on these
11 kind of conformity analyses for hot spots? AERMOD,
12 that is.
13 Thanks.
14 MS. PATULSKI: Well, I would throw into
15 that CAL3QHCR, MOVES, EMFAC, AP-42, all those models
16 are important.
17 I mean, my job is to mean the Clean Air
18 Act requirements and when I -- so, I guess first let me
19 state what my job is and then I'll answer your
20 question. My job is to look at what's latest available
21 information that's in EPA's requirements and that's how
22 I write my guidance. That's what I'm required to do
23 so, I mean, you can look at section seven of our hot
24 spot guidance. We have a lot of information there that
25 we relied upon for relying on AERMOD and CAL3QHCR which

10TH CONFERENCE OF AIR QUALITY MODELS 03/13/2012 CCR#16766-1 222
1 are in Appendix W for these kind of situations.
2 We didn't think screening tools were
3 sufficient for looking at, you know, daily PM-2.5
4 concentrations or annual PM-2.5 concentrations through
5 the complexity of sources. This isn't a CO world
6 anymore. It's not just mobile sources.
7 So, I feel very confident that AERMOD is
8 the best tool based on the latest science to model
9 these projects.
10 In terms of validation, I mean, we do
11 have a couple of things mentioned in our--
12 AUDIENCE MEMBER: Don't say validation.
13 Say evaluation.
14 MS. PATULSKI: Evaluation. Okay,
15 validation, evaluation -- I know there is another one
16 there that modelers use.
17 Whatever the case, I mean, I would say
18 check out our hot spot rule that we promulgate our
19 requirement. We have over 70 studies there about why
20 hot spots are important.
21 We've mentioned several studies in our -
22 - including one that OTAC did for selecting models --
23 for doing the modeling work itself.
24 And then I would just turn to all of you
25 and say that, as you supply new information, you know,

10TH CONFERENCE OF AIR QUALITY MODELS 03/13/2012 CCR#16766-1 223
1 or other Transportation Research Board or whatever --
2 as new information becomes available and if Appendix W
3 is changed, I mean, we will just follow that. I mean,
4 my job isn't necessarily to do what you asked, but I
5 think it has to be based on the latest information and
6 we believe it is by relying on AERMOD. I'll say that
7 just from a conformance perspective.
8 Roger and Tyler, jump in if you want to
9 say more since we worked with you on that
10 recommendation.
11 MR. FOX: As Randy indicated and as
12 we've experienced and Roger presented at the last
13 modeling conference in the context of the NO2 REA,
14 there devil is in the details in terms of both the
15 inputs to the model as well as how you configure and
16 parameterize that model.
17 I think, as Meg said, this community has
18 a responsibility and obligation to help us all get up
19 that learning curve. Right now, we're using the best
20 science available and, you know, using that science
21 then allows us the opportunity with field study data or
22 other types of information that may become available to
23 improve those and then provide more case specific types
24 of examples to ultimately come up with broader
25 guidance, but we've been working successfully with OTAC

10TH CONFERENCE OF AIR QUALITY MODELS 03/13/2012 CCR#16766-1 224
1 and to the extent that we have a process in place and a
2 consultation process in place to address those issues
3 on a case-by-case basis. We think that's sufficient
4 for now.
5 AUDIENCE MEMBER: Hi. I'm Leslie Fifita
6 from URS.
7 I have kind of a general comment and
8 question.
9 It seems like, over time, we've been
10 going from a very prescriptive modeling process using
11 defaults, using standard procedure to going to a very
12 case-by-case situation. You keep saying the devil is
13 in the details and everything depends on your
14 particular situation which is great that we're looking
15 at it in that level of detail, but it's very hard to
16 plan for.
17 So, if we knew that someone submitted an
18 application that, say, included some kind of source and
19 said that we didn't have to put it in our one hour NO2
20 analysis because it's intermittent and you guys agreed,
21 it would be great for the rest of us to know what kind
22 of source that was and why it was approved.
23 Or, if another kind of source was
24 disapproved, for us to know why that was disapproved
25 and not just in this particular context in one hour
10TH CONFERENCE OF AIR QUALITY MODELS 03/13/2012 CCR#16766-1 225
1 NO2, but any of these variables that very widely, on a
2 case-by-case basis, I'm just wondering if those cases
3 are published anywhere in the clearinghouse or
4 somewhere where we could take a look at it?
5 MR. FOX: Well, we only deal with
6 situations that rise to the level of us having to deal
7 with them, otherwise the states' sources and regional
8 offices are dealing with those. There's not a
9 clearinghouse or inventory of these things. I'm maybe
10 naive in my belief that, as a community, you all are
11 exchanging information and providing information to
12 each other about successes and failures and the like.
13 We will talk about some information
14 tomorrow. We engage with AERMOD Implementation
15 Workgroup to try and deal with, you know, model plans
16 for real situations to try and understand what the
17 nature of the problem was and what critical aspects
18 are.
19 We provide defaults because folks can
20 use those without any further justification, but we do
21 prefer and look to people providing case specific
22 information and that would always be preferred, but you
23 can't just use anything. You have to provide some
24 justification for that information and so, as that
25 information, for example, in stack ratios, you know,
10TH CONFERENCE OF AIR QUALITY MODELS 03/13/2012 CCR#16766-1 226
1 are used either through ongoing efforts that the
2 regions have had or folks in California have had to
3 compile those types of data for particular sources that
4 could be particularly useful and so, that's one thing
5 that we hope to talk about tomorrow.
6 But if there are other types of examples
7 of those situations, then we can have those.
8 I guess from the standpoint of, you
9 know, dealing on a case-by-case basis with the permits,
10 we don't see all of these things. In fact, we only see
11 a very few of the permits that are reviewed. Those
12 things are part of the public record so, protocols and
13 other types of information and results are made
14 available and so, I guess I would look to you and the
15 community to be, you know, looking at those things and
16 evaluating those to provide a template or example for
17 where there's successes or where there's issues.
18 We're dealing with issues at the higher
19 level and dealing with guidance and the like that
20 hopefully helps facilitate more flexibility or maybe
21 breaks a barrier or two in dealing with the state or
22 regional office who may be interpreting it in a
23 particular way and we are providing maybe a broader
24 interpretation or more flexibility in that regard and
25 that's what you saw in the March 1st guidance.

10TH CONFERENCE OF AIR QUALITY MODELS 03/13/2012 CCR#16766-1 227
1 MR. BRIDGERS: I guess I would add that
2 that's a topic that I'll take to heart with respect to
3 the regional, state, and local modelers workshop that's
4 coming up. We've got state and local in addition to
5 regional office presentations so, maybe when we are in
6 that venue that we can discuss other ways that the
7 states and locals and the regional offices and the
8 program office here can better exchange that
9 information.
10 So, that's something I'll table for that
11 workshop.
12 MR. BRODE: Well, I will just comment
13 that I think that the relative stringency of the new
14 standards is really -- creates issues on things that
15 weren't issues before. So, you know, if the default
16 values might have worked before, it may not work now
17 and so forth.
18 MR. FOX: And hopefully tomorrow, you'll
19 hear a number of presentations that address some of
20 those things and kind of inform us both in the near
21 term and maybe long term in terms of updating Appendix
22 W.
23 MR. BRIDGERS: Well, to help keep us on
24 schedule, if everybody would, again, give the speakers
25 a round of applause.

10TH CONFERENCE OF AIR QUALITY MODELS 03/13/2012 CCR#16766-1 228
1 I'm not going to ask you to go to the
2 bathroom in six minutes, but if you could get back in
3 here by 3:05, that would be great, so we're shortening
4 the break by about four or five minutes.
5 MR. BRIDGERS: As everybody is taking
6 their seat, I actually am starting to get announcements
7 now.
8 Here's one announcement. I have a young
9 lady in the audience that is staying at the Fairfield
10 Inn. Again, the Fairfield Inn near the airport. If
11 anybody is staying there, she would love to talk with
12 you. So, Hui Chen, are you in the room? She's waving
13 her hand at the back of the room so, if you're staying
14 at the Fairfield Inn, please see her and see if she can
15 catch a ride back over to the hotel this evening.
16 Thank you.
17 MR FOX: All right. So, we're entering
18 the home stretch of the first day.
19 So, we're going to have several
20 presentations on CALPUFF and end the day with
21 discussions about the new beta release of the Mesoscale
22 Model Interface Program and use of those prognostic
23 data.
24 So, I'm going to begin with the current
25 status of CALPUFF and walk you through some things

10TH CONFERENCE OF AIR QUALITY MODELS 03/13/2012 CCR#16766-1 229
1 since the last modeling conference so we're all working
2 off of the same information.
3 As you all know, the agency last updated
4 the regulatory approved version of CALPUFF back in June
5 of 2007 after going through and extended process
6 facilitated by VISTAS and working with the model
7 developer to both understand the nature of the some of
8 the changes that were made and to get a sense of
9 comfort level with this version.
10 In May of 2009, George indicated this
11 morning that we had a Model Clearinghouse memo to
12 Region 8 in terms of the CALPUFF modeling protocol for
13 BART and that addressed a number of issues and then
14 resulted in a draft reassessment of the WAQM Phase 2
15 recommendations that's on SCRAM.
16 We noticed and acknowledged that the
17 CALPUFF modeling system continued to evolve and so that
18 IWAQM guidance that had been previously been put
19 together to support the promulgation of CALPUFF had
20 been static and really no longer reflected the state of
21 the world.
22 And then in August of 2009, we worked
23 very closely with the federal land managers to issue a
24 clarification memo with recommended settings for CALMET
25 to freeze the model options for most regulatory
10TH CONFERENCE OF AIR QUALITY MODELS 03/13/2012 CCR#16766-1 230
1 applications.
2 Of late, there's been a lot of
3 discussion about the most recent version of CALPUFF,
4 version 6.4. In fact, we were aware of this version in
5 the work by AER as contracted, funded by API. Christian
6 Signiore talked to folks in my group back in a CMAS
7 Conference a number of years back and then at the 9th
8 Modeling Conference, Prakash Karamchandani, I always
9 mess up that name. I'm sorry, Prakash. Presented on
10 that work in 2008.
11 TRC updated the version six of CALPUFF
12 with these API sponsored updates, resulting in that new
13 version of 6.4 and that included a number of
14 corrections to the gas phase chemistry as well as new
15 PM and aqueous phase chemistry modules.
16 And on February 15th of last year, we
17 met, along with the federal land managers, with West
18 Associates and API and the model developer to discuss
19 this version and what had been done.
20 As part of that discussion, it became
21 clear that we needed to clarify the regulatory status
22 and so, in working both internally and with the federal
23 land managers, we wanted to be clear that the April
24 15th, 2003 promulgation of the model for NAAQS and PSD
25 increment under Appendix W, it was there for approve
10TH CONFERENCE OF AIR QUALITY MODELS 03/13/2012 CCR#16766-1 231
1 for distances of 58 to 200 kilometers with a 300
2 kilometer maximum and on a case-by-case basis as
3 approved under as an alternative model in situations
4 with complex winds and the near-field.
5 We wanted to be clear that everybody
6 understood that it was not approved for chemistry.
7 Appendix W does identify a preferred model for use in
8 attainment demonstrations for ozone or PM or the
9 uniform rate of progress assessment for regional haze.
10 Models for these purposes should meet requirements of
11 alternative models as defined in section 3-2 and that's
12 consistent with the statement in our SIP modeling
13 guidance which refers back and Appendix W actually does
14 refer to that guidance in terms of the criteria and it
15 follows that criteria. It may be used for reasonable
16 attribution of visibility impairment RAVI analyses per
17 section 6.2.1(e).
18 And so, there was some, I guess,
19 confusion in terms of the regulatory status as a result
20 to the BART guideline, Appendix Y, which states that
21 you may use CALPUFF or other appropriate model to
22 predict the visibility impacts from a single source in
23 class one areas. However, I just want to be clear that
24 Appendix Y does not confer status to any model as an
25 EPA preferred model and certainly doesn't do so here

10TH CONFERENCE OF AIR QUALITY MODELS 03/13/2012 CCR#16766-1 232
1 for either secondary PM or visibility. That can only
2 be done through Appendix W and notice and comment
3 rulemaking.
4 In terms of air quality related values,
5 it's also important to make sure that we're all
6 understanding the guidance pertaining to application of
7 those models for that purpose is under the
8 justification of the federal land managers and, if
9 fact, Appendix W refers to that. The second bullet
10 explicitly states that the FLM has affirmative
11 responsibility to protect HRVs that may be affected and
12 provide the appropriate procedures and analyses
13 techniques.
14 I don't have the reference to the flag
15 2010 guidance that actually went through OMB review and
16 the like, but that is available and provides those
17 specific procedures and analysis techniques and there's
18 a number of folks from the federal land manager
19 community here that could speak to that, if necessary.
20 So, in terms of the status of this
21 version, both the EPA and the FLMs have outstanding
22 technical concerns about the adequacy of the
23 evaluation. Regardless of that, 6.4 does update
24 chemistry and therefore, does not allow the agency to
25 go through the previous update process that we
10TH CONFERENCE OF AIR QUALITY MODELS 03/13/2012 CCR#16766-1 233
1 instituted for CALPUFF because it's outside the
2 approved regulatory use of the model.
3 And during that discussion in February,
4 we informed API, the West Associates representative and
5 the model developer and pointed to the fact that we
6 would be working with the federal land managers through
7 a phase three of the inter-agency workgroup on air
8 quality models to discuss the need for chemistry and
9 improvement in our long range transport models and the
10 process of in forming the rulemaking.
11 So, as I said, this would necessitate a
12 regulatory change in Appendix W through notice and
13 comment rulemaking that would also include the required
14 public review and comment and recently we worked with -
15 - OAQPS worked with Region 6 to reaffirm this decision
16 regarding 6.4 in response to comments on the New Mexico
17 regional haze fail. Each of those aspects that relate
18 to approving a model as an alternative model, we found
19 there to be a lack of support or deficiency in being
20 able to do that.
21 So, I do want to address or at least
22 introduce the fact that we, as an agency, do need to
23 address chemistry under Appendix W. We're going to get
24 into that more tomorrow with respect to the emerging
25 models and techniques session and go through a number

10TH CONFERENCE OF AIR QUALITY MODELS 03/13/2012 CCR#16766-1 234
1 of evaluations and assessments of existing models in
2 terms of addressing that and starting that process and
3 this being the appropriate venue to engage the
4 community on that.
5 As some of you may know, the Sierra Club
6 filed a lawsuit back in August of 2011. They had
7 actually filed previous petition and notice of intent
8 to sue in 2010 and they alleged that we were
9 unreasonably delayed. Imagine that. Responding to an
10 administrative petition for rulemaking which they have
11 provided, requested that we identify and designate
12 models for ozone and PM-2.5 to use in evaluating PSD
13 under the Clean Air Act and do so by updated Appendix W
14 and taking the action required under the Clean Air Act
15 to designate those models.
16 So, we, after a lot of discussion both
17 internally with our division director, Chet Wayland,
18 the policy division, Anna Wood, and Raj Rao in the New
19 Source Review Group, as well as of our Office of
20 General Counsel and the Department of Justice
21 determined the best way to deal with this was to grant
22 the Sierra Club petition and on January 4th, 2012, not
23 2121. That may be the date on which we deliver the
24 models, but -- a little subliminal messaging there.
25 So, not our grandkids, our grandkids' grandkids, but I

10TH CONFERENCE OF AIR QUALITY MODELS 03/13/2012 CCR#16766-1 235
1 don't know. Maybe Planet of the Apes. Maybe they can
2 make it work.
3 I blame Bret for that.
4 But, we will engage in rulemaking to
5 evaluate the updates of Appendix W, as appropriate, and
6 incorporate new analytical techniques or models for
7 ozone and secondary PM.
8 I think it's important to notice that we
9 did not say thou shalt be a model. We said that we
10 would evaluate updates and, as appropriate, incorporate
11 new techniques or models. And, as we'll discuss
12 tomorrow, we're both looking at the existing models
13 that have capabilities to address these issues and
14 evaluating them and looking for various techniques that
15 may provide a suitable technical basis for providing
16 those inputs recognizing the types of resource
17 constraints that are in existence in terms of working
18 on permits.
19 And we will use the existing process and
20 procedures under section 320 of the Clean Air Act to
21 complete that and when, in fact, we refer to this
22 conference as one of the first stepping stones in terms
23 of introducing the work and thoughts of the agency in
24 this regard to the community, getting input from the
25 community, and then engaging in a process to move

10TH CONFERENCE OF AIR QUALITY MODELS 03/13/2012 CCR#16766-1 236
1 forward.
2 In that grant, I believe it specifically
3 states that we would expect that the next modeling
4 conference, the 11th Modeling Conference in 2014, that
5 we would hopefully either be talking about a proposed
6 rule or an upcoming proposed rule in terms of updating
7 Appendix W.
8 So, I'm giving you little highlights of
9 what we'll talk about tomorrow morning as setting the
10 stage for things that we'll be taking on and
11 considering.
12 Key to that effort is the effort -- the
13 collaborative effort that we have ongoing with the
14 federal land managers. As most of you know, IWAQM was
15 formed in 1991 and led us through the process, through
16 phase one and phase two, ultimately with the
17 promulgation of CALPUFF phase one reviewing guidance
18 and recommending interim modeling approaches that would
19 meet and immediate need and are evaluating current
20 models that have those capabilities similar to, right
21 now, us issuing draft permit guidance for PM-2.5 and
22 then evaluating the existing models as we are doing and
23 then in phase two, coming up with specific
24 recommendations concerning the application of a model
25 or techniques in that context to inform promulgation of

10TH CONFERENCE OF AIR QUALITY MODELS 03/13/2012 CCR#16766-1 237
1 the model. Just as in phase two that was done to
2 support the promulgation of CALPUFF.
3 In phase three in particular, we know
4 that we need to meet the single source needs in
5 characterizing ozone and secondary PM-2.5 and also the
6 AQRVs, both visibility and deposition.
7 And, as I've mentioned, the latest
8 efforts both by the agency and in collaboration with
9 the FLMs will be reported tomorrow and so we look
10 forward to both presenting that information to the
11 community and engaging in conversation, recognizing
12 that that's not necessarily sufficient information or
13 sufficient time to engage in the type of discussion
14 that we're going to truly need. We do have a comment
15 period here. I'm not sure if George announced, but we
16 will be extending that so that people have more time to
17 comment on reports and guidance that still has yet to
18 be put out there and we would look forward to comments
19 in terms of the types of analyses that we've done so
20 far and will be presented tomorrow.
21 Now, the latest information as you all
22 recall in April of 2006 Earth Tech sold the rights to
23 CALPUFF to TRC and we have been working with TRC since
24 that time in terms of regulatory updates to the
25 modeling system. I believe we've gone through two

10TH CONFERENCE OF AIR QUALITY MODELS 03/13/2012 CCR#16766-1 238
1 updates, at least.
2 But then, this past spring, Joe Scire
3 and ASG left TRC for Exponent and we could hear the
4 ripple effects in terms of people calling us and asking
5 us what was going on and, to be clear, and Gale
6 reiterated this both in email and on the phone to me
7 last year that TRC retains the rights of CALPUFF and
8 will continue working with us in order to meet those
9 regulatory needs.
10 And to that end, we do recognize that
11 there is a need to update the current regulatory
12 version of CALPUFF to address known bugs. We haven't
13 updated the model since 2007. Again, from the
14 standpoint of priorities and the like, it's been very
15 difficult to get to that process and the past
16 experience in that process have shown that it is not a
17 very simple one to engage in. But it is clear that we
18 need to do that and to that end, we will be meeting
19 with the federal land managers by the end of the month
20 to take into account all of the known bugs and, in
21 terms of things that have already been addressed in
22 current versions of CALPUFF or other bugs that the FLMs
23 know from their experience and then, based on that, we
24 would make a formal request of TRC to provide an
25 updated version, 5.8 version, of that system with the

10TH CONFERENCE OF AIR QUALITY MODELS 03/13/2012 CCR#16766-1 239
1 bug fixes, provided the results of the update tool and
2 post also the updated CALPOST to address the new,
3 improved equation. We had previously requested that in
4 the fall and looked to Gale to address maybe when we
5 can expect that.
6 So, that's the status of where we are
7 right now and so I will turn this over to Gale and then
8 I think Roger follows with a validation study and we
9 have some open time to discuss.
10 MR. HOFFNAGLE: Okay, as described, he
11 took my whole talk, but that's all right. That's fine.
12 It'll get us back on schedule.
13 The guideline on air quality models is
14 codified and there's a location. It requires a
15 modeling conference every three years. The guideline
16 is intended for PSD permitting and attainment
17 demonstrations for single sources. Single sources in
18 an important concept here.
19 Multiple source, state demonstrations,
20 other guidances used. For class one demonstrations,
21 the federal land managers rely on the air quality
22 related values workgroup guidance flag and additionally
23 is it used for the BART process.
24 So, since adoption of AERMOD to replace
25 ISC, EPA has taken a stronger and stronger position

10TH CONFERENCE OF AIR QUALITY MODELS 03/13/2012 CCR#16766-1 240
1 that AERMOD is preferred within 50 kilometers of the
2 source. We don't happen to agree with that. This EPA
3 position reduces the potential use of CALPUFF in
4 obvious complex wind situations and there are many
5 complex wind situations.
6 We believe that CALPUFF should be used
7 in complex wind situations less than 50 kilometers and
8 argued for those options when they are necessitated by
9 the complex winds.
10 We still disagree with the use of
11 arbitrary use of 50 kilometers. You had a 500 meters
12 issue. Well, we have the 50 kilometers issue. So,
13 CALPUFF is the preferred model for class one area
14 impacts.
15 We need a 3D lagrangian model. Eularian
16 model will not work well for individual sources. We
17 still believe that point and grid and sub-grid scale
18 models in eularian models are too simplistic and are
19 inaccurate. So, if you're evaluating a single source,
20 you still need a CALPUFF type model to handle what
21 happens and how it happens.
22 Better handling of low wind speed cases,
23 stagnation, coastal, complex terrain, and flow
24 reversals we know, for instance, in coastal situations,
25 CALPUFF gives us larger concentrations than AERMOD
10TH CONFERENCE OF AIR QUALITY MODELS 03/13/2012 CCR#16766-1 241
1 will, but that is appropriate because those larger
2 concentrations actually occur.
3 Better handling of deposition than is
4 available in AERMOD and CALPUFF is a model with
5 substantial user community experience and should be
6 implemented.
7 TRC maintains the EPA approved code for
8 free use by the public, version 5.8. TRC answers
9 questions about the code and teaches courses on its
10 use. TRC provides multiple graphic user interfaces for
11 user presentation of the results. TRC will provide
12 CALPUFF's version 6.221 which is what Tyler was talking
13 about, that supports the federal land managers,
14 although I should say that the current version of
15 CALPOST on our website does do the same job if you give
16 it the right switches. So, it's just for the lack of
17 having a CALPOST that has the right number on it which
18 is what I was complaining about about AERMOD before.
19 And so you can get the model from the
20 SCRAM website or directly from our website.
21 EPA has not yet approved the bug fixes
22 for 5.8 which Tyler agreed to and we are willing to sit
23 down with Tyler at any time to get that fixed and
24 resolved and we'd be glad to do it.
25 Model change bulletins E and F, we

10TH CONFERENCE OF AIR QUALITY MODELS 03/13/2012 CCR#16766-1 242
1 believe, meet the requirements that you talked about,
2 but we'll be glad to sit down and meet with you on that
3 issue and move forward.
4 EPA's only work to date on CALPUFF are
5 meant to confine its use and to sponsor one study which
6 uses CALPUFF as a long range transport model which we
7 will be having separate comments on. That study needs
8 to be peer reviewed.
9 I believe that's my presentation so far.
10 CALPUFF -- that's the status so far. CALPUFF 6.4,
11 several studies have demonstrated that 5.8 is
12 significantly over-estimates sulfate and nitrate
13 production and thus visibility impact. 6.4
14 incorporates more sophisticated handling of the
15 atmospheric chemistry as nitrate -- as sulfate and
16 nitrate formation leads to more accurate reproduction
17 of the particulate formation and visibility impact
18 calculations.
19 So, we have the rapid ozone chemical
20 mechanism. Isoporeum. Inorganic gas particle
21 equilibrium. RADM for aqueous phase transformation and
22 secondary organic aerosol formation from CALTECH and
23 those things substantially increase the chemistry for
24 visibility analysis and for BART analysis. TRC urges
25 EPA to consider version 6.4 for application to these

10TH CONFERENCE OF AIR QUALITY MODELS 03/13/2012 CCR#16766-1 243
1 assessments. 6.4 is backward compatible with 5.8, so we
2 don't need to worry about that part of it. 6.4 will
3 provide much more accurate determinations of sulfate
4 and nitrate and repeat the same answer.
5 Thank you.
6 MR. BRIDGERS: Thanks, Gale.
7 So, I want to introduce somebody that we
8 haven't heard form yet today. Mr. Roger Brode.
9 MR. BRODE: Do I have to change my
10 voice?
11 So, I'm going to talk about CALPUFF
12 near-field validation a little bit and first, sort of
13 review the regulatory status of CALPUFF for near-field
14 applications which is defined in Appendix W as
15 nominally within 50 kilometers.
16 Some of these issues were addressed in
17 an August 2008 clarification memo and there was a
18 technical issues memo that came out around that same
19 time.
20 Give a brief history of the CALPUFF
21 near-field validations which -- and then share some
22 results from a CALPUFF validation study that was done
23 more recently by the New Jersey DEP in support of their
24 126 petition against the source in Pennsylvania.
25 So, I'm not going to read all of these

10TH CONFERENCE OF AIR QUALITY MODELS 03/13/2012 CCR#16766-1 244
1 words, but again, we issued a clarification memo back
2 in 2008 to address this point. At that time, we sort
3 of came to the conclusion that some members of the
4 modeling community maybe didn't quite understand what
5 Appendix W said about CALPUFF and the near-field.
6 It mentioned in section -- I mean,
7 basically, EPA is a preferred, the AERMOD is the EPA
8 preferred model for near-field regulatory applications.
9 That's what we promulgated in 2005. CALPUFF is not the
10 preferred model for near-field applications, but may be
11 considered as an alternative model on a case-by-case
12 for near-field applications involving complex winds
13 subject to approval by the reviewing authority.
14 The preamble to the CALPUFF promulgation
15 rule actually talked about this in more detail. It
16 says we will require approval to be obtained prior to
17 accepting CALPUFF for complex wind situations. As this
18 will ensure that a protocol is agreed to between the
19 parties involved and so on.
20 So, that hadn't been happening. People
21 -- some people seemed to have it in their mind that if
22 I say complex winds then I can use CALPUFF because it's
23 got to be better. I kind of wish it was better, but so
24 far, that's the issue. We haven't seen a lot of
25 evidence of that yet, so how you apply the model under

10TH CONFERENCE OF AIR QUALITY MODELS 03/13/2012 CCR#16766-1 245
1 those complex winds situations in accordance with
2 section 7, 2, 8 of Appendix W should be determined
3 through the consultation with the reviewing authority
4 and consistent with limitations of paragraph 3, 2, 2,
5 (e) and, a key point is to paragraph 3, 2, 2, (e) is
6 the reference that basically places CALPUFF in the
7 status of an alternative model for near-field
8 applications subject to certain requirements.
9 So, here are the requirements spelled
10 out as paragraph 3, 2, 2, (e) that would apply to
11 CALPUFF for near-field applications. The model has
12 received a peer review. It can be demonstrated to be
13 applicable to the problem. Databases are necessary to
14 perform the analysis are available. That appropriate
15 performance evaluations of the model have shown that
16 the model is not biased toward under-estimates. And a
17 protocol on methods and procedures to be followed has
18 been established.
19 So, item four is really the key issue
20 that emerged as we looked more closely at this. So, we
21 summarized in the clarification memo what steps to go
22 through. First, you have to make a determination as to
23 whether complex wind is critical to estimating design
24 concentration. I appreciate the comment you made in
25 your presentation and if you look at the types of

10TH CONFERENCE OF AIR QUALITY MODELS 03/13/2012 CCR#16766-1 246
1 complex winds that are talked about there, I think in
2 almost every case the expectation would be that, due to
3 those complex winds, I should get higher impacts than I
4 would with a steady state plume model.
5 And maybe one solution would be, okay,
6 run AERMOD, run CALPUFF take the higher result and
7 we'll be happy to accept that. I don't think that's
8 probably an approach that most people would want to
9 take, but I think that was a valid point that you made
10 and felt we'll go on from here.
11 So, each of those has very case specific
12 issues that need to be addressed. So, this is section
13 2, 2, 8 which describes the types of complex winds
14 that, you know, for which CALPUFF may be considered on
15 a case-by-case basis. There are local wind
16 circulations, stagnation, very light winds, valley --
17 mountain valley winds and so on, but I think the real
18 issue has been, for us, is that the CALPUFF model for
19 near-field app complex wind situations is not that well
20 documented.
21 The IWAQM phase two report which was
22 available before CALPUFF was promulgated includes some
23 CALPUFF evaluation results for Kincaid. A field study
24 that's a flat terrain database. And Lovett which is a
25 power plant near a hill. So, a complex terrain field

10TH CONFERENCE OF AIR QUALITY MODELS 03/13/2012 CCR#16766-1 247
1 study and the results for Lovett actually show pretty
2 good performance. This is from the IWAQM phase two
3 report and so, one to one line is there perfect
4 agreement. The higher line is from CTDM Plus that was
5 the preferred model for complex terrain impacts in
6 near-field before AERMOD was promulgation. It's still
7 in Appendix W, but AERMOD is still so much more in
8 widespread use. And then CALPUFF results are there and
9 is actually pretty good. It is within the two to one
10 sort of benchmark for being unbiased. It performs
11 better than CTDM Plus and that's all well and good.
12 The problem is that that evaluation was based on
13 applying CALPUFF with CTDM Plus MET inputs and
14 bypassing CALMET. So, basically it showed that CALPUFF
15 could emulate CTDM Plus pretty well, even better than
16 CTDM Plus in a way, but that approach to applying the
17 model is not consistent with CALPUFF near-field
18 applications under paragraph 7, 2, 8 which actually
19 states that the purpose is to fully treat the time and
20 space variations of meteorological effects on transport
21 and dispersion. That's why it's called complex winds.
22 So, therefore the evaluation results
23 that were available at the time actually are not
24 relevant to application of the model under section 7,
25 2, 8.

10TH CONFERENCE OF AIR QUALITY MODELS 03/13/2012 CCR#16766-1 248
1 So, more recently, a New Jersey DEP had
2 submitted a CALPUFF near-field validation study using
3 the Martin's Creek field study in support of Clean Air
4 Act section 126 petition against a source across the
5 border in Pennsylvania under the new one hour SO2
6 NAAQS.
7 Section 126 of the Clean Air Act
8 addresses interstate transport that may significantly
9 contribute to non-attainment or interfere with
10 maintenance of a NAAQS in a downwind state and New
11 Jersey claimed that the validation study they provided
12 demonstrates that CALPUFF performed better and produced
13 predictions of greater accuracy than AERMOD and
14 therefore should be acceptable as a basis for the
15 modeling submitted for that petition.
16 Now, Portland, actually the facility
17 that the petition was filed against was actually one of
18 the background sources included in the Martin's Creek
19 field study. It wasn't he main focus of the study, it
20 was, you know, the largest I think of the other
21 background sources.
22 New Jersey also had claimed that CALPUFF
23 was more appropriate than AERMOD due to the influence
24 of complex winds. There's a lot of details there that
25 we're not going to get into. You know, we responded in

10TH CONFERENCE OF AIR QUALITY MODELS 03/13/2012 CCR#16766-1 249
1 a fair amount of detail to some of these issues and the
2 technical support documents that were issued in support
3 of the proposed rule and more recent final rule, but
4 the question of whether the validation study submitted
5 adequately demonstrated CALPUFF performing better than
6 AERMOD was important because CALPUFF model results that
7 were submitted by New Jersey DEP were much higher than
8 the AERMOD results that they submitted. They submitted
9 model results based on both models. CALPUFF results
10 tend to be about two to three times higher than AERMOD
11 results and if we had based our response to the
12 petition on CALPUFF results that would have required a
13 much lower emission threshold to eliminate their
14 significant contribution to non-attainment or
15 interference with maintenance of the one hour NAAQS in
16 New Jersey. So, it was a very important issue.
17 This is the layout of the Martin's Creek
18 field study, I don't know if you can see, but Martin's
19 Creek, the main focus of that study is down here. The
20 monitor -- the ambient monitors of SO2 that were
21 deployed as part of the study were mostly focused on
22 this terrain feature to the southeast of Martin's
23 Creek. These identify the location of a SODAR and ten
24 meter tower there that was a source of MET data and
25 these were the sources of the background data, Portland

10TH CONFERENCE OF AIR QUALITY MODELS 03/13/2012 CCR#16766-1 250
1 being up here. So, it's the furthest, but it's also the
2 largest emitter of these other background sources.
3 There was another ten meters MET station up on higher
4 terrain northwest of Portland -- of Martin's Creek.
5 So, we identified some issues that we
6 had with this evaluation protocol including the fact
7 that they varied the number of values in determining
8 the robust highest concentrations and we had some
9 concerns about how that was done and whether it really
10 improved the validity of the evaluation.
11 Ambient data were also collected from
12 this monitor. There was MET data and SO2 ambient data.
13 And the original field study was done before it was
14 applied to AERMOD as well as in the AERMOD study the
15 MS8 monitor was used only to determine background
16 concentrations in comparing model results over here.
17 It was never intended to be -- validate the model at
18 that receptor.
19 So, there's a lot of issues there we
20 won't go into, but that was one concern that we raised.
21 The residual analyses that were done to
22 compare model bias were based on rank distributions and
23 we expressed some concerns there and, again, these are
24 addressed in detail in the TSDs for the proposed and
25 final rule as well as the final response to comments

10TH CONFERENCE OF AIR QUALITY MODELS 03/13/2012 CCR#16766-1 251
1 document.
2 So, these Q-Q plots that were submitted
3 by New Jersey DEP as part of their CALPUFF validation
4 study. So, a one hour Q-Q plot, three hours, and 24
5 hour and the red curve is CALPUFF. The blue which you
6 can't see as well is AERMOD, but overall they actually
7 look quite similar. They both looking pretty good.
8 Very similar. So, that's one bit of information.
9 These are the results using the boot
10 analysis program on the data and this -- these are
11 results for CALPUFF. These are results for AERMOD.
12 So, these are time series -- one hour time series
13 results and the boot analysis does the boot resampling
14 procedure to assign confidence limits on the model
15 evaluation results and those confidence limits are
16 reflected by the range there. So, zero fractional bias
17 is the ideal result and the CALPUFF model results are
18 actually better than, you know, closer to zero than
19 AERMOD. They overlap zero which is good, but if you
20 look at the range of those two confidence intervals,
21 they overlap which is an indication that the difference
22 in the performance between the two models is not
23 statistically significant at the confidence interval.
24 So, that's a key point and that's
25 addressed in our responses. What is better mean when

10TH CONFERENCE OF AIR QUALITY MODELS 03/13/2012 CCR#16766-1 252
1 in Appendix W, section 3-2 that you show that another
2 model is better -- performs better than the preferred
3 model.
4 Well, we also independently applied the
5 Cox-Tikvart Protocol for determining the best
6 performing model to the -- based on the data that was
7 provided by New Jersey, including the results from the
8 MS8 monitor and, again, one of the issues we raised was
9 that New Jersey varied the value of N, number of top
10 ranked values used to determine the robust highest
11 concentration and the general default recommendation is
12 26, but there's some wording that suggest that, well,
13 maybe it should be different in some circumstances. I
14 won't go into the details there here, but we actually
15 applied it for different values of N and 26 is sort of
16 the standard that's used, especially for a large field
17 study like this. A long term, full year of data.
18 Usually, the question of whether you
19 change it is if your sample size is very small. If you
20 only have 24 samples, the 26 highest values isn't going
21 to be very meaningful. We varied with N equals 26, N
22 equals 15, and N equals eight. These are model
23 comparison measures based on the Cox-Tikvart Protocol
24 so, if the middle of the air bars is at zero, then
25 there's no difference between the models overall. If

10TH CONFERENCE OF AIR QUALITY MODELS 03/13/2012 CCR#16766-1 253
1 there air bars cross zero, then if there is a
2 difference, it's not statistically significant. So,
3 basically, these results are very consistent with what
4 you see in the Q-Q plots, just kind of a visual sense
5 of how the models performed. Applying the Cox-Tikvart
6 Protocol which is mentioned explicitly of section 3-2
7 of Appendix W confirms that.
8 If anything, AERMOD is a little better
9 here. AERMOD would be better if it's on the left.
10 CALPUFF better on the right. CALPUFF does, you know, a
11 little better, but not significantly better for the
12 smaller value for N.
13 So, the initial assessment was that, you
14 know, the performance of CALPUFF and AERMOD for this
15 field study is very similar. I mean, we're not saying
16 CALPUFF did badly. It did pretty good. So did AERMOD.
17 So, where does that leave us? Again,
18 since the confidence intervals overlap zero, the
19 differences aren't statistically significant. So, we
20 felt that based on those results, it didn't support the
21 claim that CALPUFF performs better in the sense of
22 statistically significant and we laid out some of the
23 logic and rationale behind that finding and technical
24 support document, but a further review of the CALPUFF
25 input files indicated something we hadn't noticed
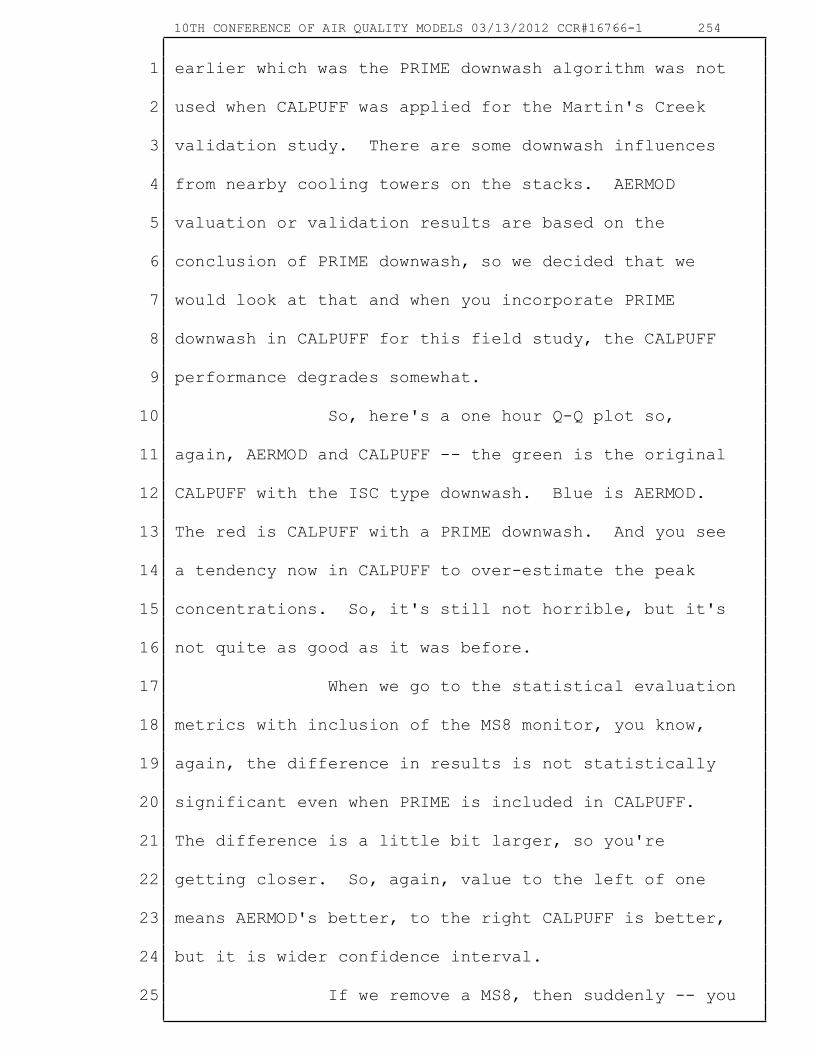
10TH CONFERENCE OF AIR QUALITY MODELS 03/13/2012 CCR#16766-1 254
1 earlier which was the PRIME downwash algorithm was not
2 used when CALPUFF was applied for the Martin's Creek
3 validation study. There are some downwash influences
4 from nearby cooling towers on the stacks. AERMOD
5 valuation or validation results are based on the
6 conclusion of PRIME downwash, so we decided that we
7 would look at that and when you incorporate PRIME
8 downwash in CALPUFF for this field study, the CALPUFF
9 performance degrades somewhat.
10 So, here's a one hour Q-Q plot so,
11 again, AERMOD and CALPUFF -- the green is the original
12 CALPUFF with the ISC type downwash. Blue is AERMOD.
13 The red is CALPUFF with a PRIME downwash. And you see
14 a tendency now in CALPUFF to over-estimate the peak
15 concentrations. So, it's still not horrible, but it's
16 not quite as good as it was before.
17 When we go to the statistical evaluation
18 metrics with inclusion of the MS8 monitor, you know,
19 again, the difference in results is not statistically
20 significant even when PRIME is included in CALPUFF.
21 The difference is a little bit larger, so you're
22 getting closer. So, again, value to the left of one
23 means AERMOD's better, to the right CALPUFF is better,
24 but it is wider confidence interval.
25 If we remove a MS8, then suddenly -- you

10TH CONFERENCE OF AIR QUALITY MODELS 03/13/2012 CCR#16766-1 255
1 go to N equals eight, suddenly you will -- actually,
2 for N equals 15 and N equals eight, that's where AERMOD
3 actually does perform better in a statistically
4 significant sense.
5 So, based on this, we just didn't feel
6 that they had made an adequate demonstration that
7 CALPUFF is better for this application and when our
8 final rule, we based our proposed remedy on the AERMOD
9 modeling results.
10 There were some other issues that we
11 won't get into here, but also, but there's some
12 additional information that may shed some further
13 light. New Jersey had also installed an ambient SO2
14 monitor at Columbia Lake. I think it was two
15 kilometers northeast downwind of the Portland plant
16 back in September 2010 and the monitor shows numerous
17 exceedances at the one hour NAAQS. I think the 99th
18 percentile daily max one hour value for the first year
19 was 136 ppb, so it was about twice the standard. Not
20 quite. So, we're not saying there isn't problems
21 there. Here's where the monitor was located. Here's
22 the Portland plant. So, again, it's about two
23 kilometers and it's kind of a very broad valley, so
24 there's a lot of southwesterly winds. This shows the
25 time series. This wasn't the full year, I just -- Sept

10TH CONFERENCE OF AIR QUALITY MODELS 03/13/2012 CCR#16766-1 256
1 23rd was when it started through February 27th, you can
2 see again a number of exceedances. That's the NAAQS
3 level there. But when it's not spiking up like that,
4 it's pretty much near zero which suggests that there is
5 not a lot of other background sources contributing to
6 impacts at that monitor and we kind of figured that in
7 our action as well.
8 But New Jersey had actually done some
9 monitor to monitor comparisons with the Columbia
10 monitoring data. Comparing the top ten monitored
11 values with the top ten modeled. It wasn't clear if
12 they were the top ten daily max one hour or overall top
13 ten and I made some conclusions there. So, I thought
14 that was a reasonable thing to look at, so we did that
15 ourselves and the next table is going to show observed
16 data, top ten maximum daily or daily maximum one hour
17 values observed and modeled. Observed are from that
18 period, a full year. Now, September 2010 to 2011.
19 AERMOD results are based on the best
20 data we have which is the site specific data collected
21 back in July 93 to June 94. It had 100 meter tower
22 plus a SODAR. With what we think are representative
23 emissions there at maximum load with about 77 percent
24 of allowables based on the fuel contents, we think
25 those emissions are sort of representative of, you

10TH CONFERENCE OF AIR QUALITY MODELS 03/13/2012 CCR#16766-1 257
1 know, the high impact from the plant during this
2 period.
3 CALPUFF was modeled based on the same
4 emissions, but using the three sets of MET data that
5 were included in the 126 petition and, you know,
6 despite the significant difference in the data periods,
7 the periods for CALPUFF varied as well. Overall, the
8 distribution of the maximum one hour daily max one hour
9 values is very similar for AERMOD. Average predicted
10 to observed ration is about 1.14. CALPUFF results show
11 some significant over-predictions with ratios over
12 three. So, here are those results. There's there top
13 ten daily one hour observed values. AERMOD peak one
14 hour is a little bit, you know, about 30, 50 or 60
15 percent higher, but the average of the ratio of modeled
16 to observed across the top ten is, like I said, 1.15
17 for AERMOD and about 3.3 for CALPUFF with 1992-1993
18 data. That was the data period for the Martin's Creek
19 study. The study had some site specific data back then
20 and SODAR as well. And then with 2002 MET it was about
21 3.9 higher.
22 So, those relative comparisons kind of
23 match more closely with the differences in model
24 concentrations submitted with the petition itself, but
25 again, don't really jive with what we just saw as far

10TH CONFERENCE OF AIR QUALITY MODELS 03/13/2012 CCR#16766-1 258
1 as performance at that Martin's Creek study.
2 So, the validation study show generally
3 good performance for CALPUFF, similar to AERMOD, but
4 not clearly superior in our opinion. In fact, when we
5 addresses some of the issues that we raised, it
6 actually started to skew the other way, but at least,
7 you know, it's not bad.
8 More recent model to model comparisons
9 based on the new monitor actually show much better
10 agreement based on AERMOD and CALPUFF and those
11 relative differences, again, I said are similar.
12 So, that's sort of -- we are encouraged
13 to see that kind of study done because that's what we
14 think needs to be done to support the use of CALPUFF in
15 near-field applications under Appendix W. One of the
16 things that we'd maybe like to look at is, you know,
17 what kind of drove CALPUFF performance. I know that
18 there was a SODAR available for the Martin's Creek
19 study. I know that the proffed up tool was used to try
20 to get that SODAR profile information into the modeling
21 system maybe more effectively could be done easily
22 before the proffed up tools, so maybe that's helping.
23 I would be interested to see how much effect that had
24 on its performance, but that's where we are.
25 Any questions?

10TH CONFERENCE OF AIR QUALITY MODELS 03/13/2012 CCR#16766-1 259
1 AUDIENCE MEMBER: Hi. I'm Alan Dresser,
2 New Jersey DEP and one of the infamous authors of the
3 CALPUFF validation study Roger just talked about there.
4 Yeah--
5 MR. BRODE: You should be commended for
6 having conducted such a study.
7 AUDIENCE MEMBER: I'm a little surprised
8 you're talking about it. I didn't know about this, so
9 I feel a little sucker-punched, but Roger and I did
10 have a spirited back and forth on this over a number of
11 months.
12 If you want to read a detailed
13 description of the validation we did, go to the June
14 2011 Air and Waste Management Association Magazine and
15 you'll see our write up of the validation.
16 I'm not going to go into all of the
17 details of some of the things that Roger brought up,
18 but, you know, things like the robust high
19 concentration. We talked to Bill Cox who came up with
20 that concept and how to better develop it and not to
21 use an N of 26 all the time that you can vary that. The
22 AMS8 monitor -- all the monitors were used as
23 background, not just AMS8. So, why eliminate it? It
24 just didn't make sense.
25 And the PRIME downwash, we felt we had

10TH CONFERENCE OF AIR QUALITY MODELS 03/13/2012 CCR#16766-1 260
1 to use a EPA approved version of CALPUFF. The EPA
2 approved version of CALPUFF, you can't run PRIME
3 downwash with more than one source and that's one of
4 the fixes that Mr. Hoffnagle was telling you about that
5 had to get in there.
6 So, we were stuck between a rock and a
7 hard place. We either use the approved version without
8 -- that can't handle PRIME downwash or we used a non-
9 approved version that can handle it. So, that's kind
10 of the problems we were running into.
11 But yeah, please do read the article.
12 MR. BRODE: Thank you for your comments.
13 AUDIENCE MEMBER: Bob Paine, AECOM.
14 I noticed that Gale mentioned that
15 version, CALPUFF version 6.4 can be made backward
16 compatible to version 5.8 with the bug fixes. So, I
17 would strongly recommend that EPA simply replace
18 version 5.8 with version 6.4 and prescribe how it
19 should be used and that would be very -- I think that
20 would help to bring in the advancements in -- that are
21 in the CALPUFF version six series and still make it
22 backward compatible and why not go to a version six
23 rather than a version five?
24 So, that's what I would recommend.
25 MR. FOX: I appreciate that

10TH CONFERENCE OF AIR QUALITY MODELS 03/13/2012 CCR#16766-1 261
1 recommendation based on experience. That's fine.
2 Based on our experience and the review -- this is Tyler
3 Fox OAQPS. Based on our past experience in terms of
4 the update process, it's not as simple or never as
5 simple as that and so we have some concerns in terms of
6 those things that are in the 6.0 series and so we would
7 prefer to stick with the current version that we have
8 an understanding of and have bug fixes, vis-that
9 version.
10 We don't have the time and resources to
11 spend to evaluate it like we did before given all the
12 other issues that we have. So, that's just kind of
13 where we're at.
14 AUDIENCE MEMBER: This is just a follow-
15 up question.
16 If TRC were to provide an equivalency
17 demonstration between the two version, would that help?
18 MR. FOX: That was provided previously
19 and the devil is in the details in terms of those
20 aspects and as we found out, you know again, that there
21 are a lot of issues and those are well documented and
22 we just can't afford or can't use that time to, you
23 know, go down that road again.
24 AUDIENCE MEMBER: But if the model is
25 equivalent to an approved model, it could be proposed

10TH CONFERENCE OF AIR QUALITY MODELS 03/13/2012 CCR#16766-1 262
1 for any given application, correct?
2 MR. FOX: It was said to be equivalent
3 previously and we found some issues in terms. That's
4 what I referred to in terms of federal land managers
5 and EPA, but again, I don't want to belabor or debate
6 the point. I think that we will and acknowledge that
7 we need to address the bug fixes. We're going to
8 engage with FLM to do that and that's the process that
9 we're going to go through.
10 I would urge everybody to pay attention
11 tomorrow to the emerging models and techniques to the
12 extent that version 6.4 is a model that's considered
13 viable in terms of moving forward and addressing the
14 transport needs and the chemistry needs of the agency.
15 Then, it will continue to be evaluated in that context
16 for that suite and it has been and will be in that
17 suite of models that are being evaluated.
18 AUDIENCE MEMBER: Okay. This is Joe
19 Scire.
20 Just a couple of points I wanted to
21 make.
22 One is about the model change bulletins
23 themselves. ENF were changes to CALPUFF that were
24 submitted to EPA back in the year 2007 and that did
25 include the code that went with that and it did include

10TH CONFERENCE OF AIR QUALITY MODELS 03/13/2012 CCR#16766-1 263
1 the entire matrix of applying the EPA model evaluation
2 software. So, you mentioned about receiving those --
3 waiting for those, but those have been delivered oh,
4 maybe five years ago.
5 The other thing that wasn't mentioned
6 was that there was a model change bulletin G and that
7 really needs to be implemented as well. They're
8 important changes to CALMET that was missing from the
9 presentations that has been prepared and provided and
10 that's important to introduce into the model as well.
11 MR. FOX: Well, we appreciate that, Joe,
12 and that was my point in terms again, yes, we have the
13 ENF, but are there other issues and that's why we're
14 meeting with the FLMs to make sure that we have full
15 account of the issues and the bug fixes that need to be
16 part of the update in terms of addressing known bug
17 fixes.
18 AUDIENCE MEMBER: E, F, and G include
19 all of the known bug fixes.
20 MR. FOX: Right. No, I referred to E
21 and F in terms of delivery and I was unaware of the G,
22 so we'll -- that's why we're going to talk to FLM and
23 then engage with TRC to make sure that we have account
24 for everything that we need to.
25 AUDIENCE MEMBER: Okay. The other issue

10TH CONFERENCE OF AIR QUALITY MODELS 03/13/2012 CCR#16766-1 264
1 I want to comment on is related to the equivalence of
2 the different version of CALPUFF.
3 You made reference to problems of last
4 time it was difficult to get equivalents. And that's
5 the case. It was difficult. We had done many tests
6 and found that the version 5.8 and the previous version
7 were equivalent. At that time, we did not have access
8 to the EPA model evaluation software. That's a matrix
9 of about ten different test cases that the model was
10 designed to run with.
11 And so we did tests. In every test, we
12 found the model to be equivalent. Later, EPA ran
13 against this extra set of ten and found some
14 differences that we did not find because we knew the
15 test cases and we did go through and make the models
16 equivalent in those cases where we found that there
17 were differences.
18 So, I mean, it's a process. We do work.
19 We submit it to EPA. We describe what it's finding --
20 what the findings are. The fact that there were other
21 cases that you discovered we then addressed and had to
22 revise the code to make it equivalent doesn't mean that
23 version 6.4 is not equivalent. It would have to be
24 tested and I think that's something that is not outside
25 of the responsibility of EPA to perform in order to do

10TH CONFERENCE OF AIR QUALITY MODELS 03/13/2012 CCR#16766-1 265
1 its evaluation of the model. It's been five years
2 since the last update.
3 MR. FOX: Thank you.
4 AUDIENCE MEMBER: One other comment.
5 This is about Roger's tweaking of CALPUFF and the
6 evaluation statistics. I think that AERMOD is a model
7 that EPA developed. I think people do independent
8 evaluations and then there's the model evaluations that
9 are done by the developers.
10 I think changing the model options to
11 obtain worse performance like the downwash option is
12 questionable in that why would you choose to run the
13 model in the mode that performs less well?
14 The model has both sets of downwash
15 algorithm in there for a reason and what we've found,
16 and we've had discussions with the EPA on individual
17 projects about this, is sometimes the ISC downwash
18 performs better and we recommend its use in those cases
19 and this seems to be a case where things were changed
20 until finally AERMOD performed better and that's when
21 you stopped doing the evaluation tests.
22 So, I don't think that's really
23 appropriate.
24 MR. BRODE: I didn't choose to run
25 CALPUFF with the PRIME downwash option because I

10TH CONFERENCE OF AIR QUALITY MODELS 03/13/2012 CCR#16766-1 266
1 thought it would make the model perform worse. I
2 actually didn't expect that to happen. I just realized
3 that it hadn't used PRIME downwash and, as explained in
4 some of our documentation related to that, you know,
5 the regulatory status of PRIME in CALPUFF may not be
6 that clear, but it's not unreasonable to suggest that
7 if we were to accept the use of the CALPUFF in a near-
8 field situation where downwash was considered to be
9 important, then -- and the PRIME algorithm is
10 incorporated into the model since PRIME is the
11 preferred downwash algorithm at this point in terms of
12 near-field applications it's reasonable to assume that
13 we would expect that PRIME downwash option to be used.
14 The fact that it changed the model results that much
15 was just what happened. It certainly wasn't -- I just
16 thought it would be appropriate to see how that
17 affected the results and I did not expect to see that
18 level of difference.
19 AUDIENCE MEMBER: In the large
20 structures, we tend to find there's a big difference
21 which is why we recommend the ISA downwash for certain
22 kinds of buildings.
23 MR. BRODE: Well, so, I mean, AERMOD was
24 run with both the old downwash and PRIME and that
25 degree of difference didn't occur. I don't know why

10TH CONFERENCE OF AIR QUALITY MODELS 03/13/2012 CCR#16766-1 267
1 one was more sensitive than the other.
2 AUDIENCE MEMBER: Marsha Kinley with
3 Duke Energy.
4 In light of the discussion of
5 performance into the models and the need for field
6 data, I did want to make EPA and the modeling community
7 aware that there is a project that is just getting
8 started between EPRI and RTI here at RTP to take a
9 database that was preliminarily developed for GE during
10 the Fukushima accident. It's called JMARTIS and they
11 are going to get that data qualified as much as
12 possible and they're going to use, first, as a focal
13 point for comparison of models on the nuclear side of
14 the industry. The nuclear utility models, but this
15 data could be used potentially down the road for these
16 type of models and in the near-field that you're
17 talking about around sources.
18 So, we would strongly support that to be
19 looked at in the future.
20 MR. BRODE: Thank you. And we agree
21 that, again, one of the critical aspects of model
22 evaluation is getting the right field study data or
23 getting information.
24 One aspect is do we have access to the
25 available field studies and that's something to pose to
10TH CONFERENCE OF AIR QUALITY MODELS 03/13/2012 CCR#16766-1 268
1 the community. I think we've gone through great
2 lengths to acquire some of this information. It would
3 be great to have that information compiled in a way
4 that would make it more accessible so that we could
5 reduce the barriers to conducting those types of
6 evaluations.
7 Then, to the point of near-field
8 evaluation, identify those areas where we do need those
9 data and then work, either through collaborative or
10 coordination manner to acquire information that is
11 being acquired for other purposes or perhaps focus on
12 field studies.
13 The unfortunate aspect is that given the
14 funding of the agency, I don't envision the agency
15 being able to fully support and fund the types of field
16 studies that we need so, we're going to have to do it
17 in a collaborative way to get where we need to be.
18 AUDIENCE MEMBER: Hi. This is Steve
19 Hanna of Hanna Consultants.
20 As a developer of the BOOT model
21 evaluation software, I was very pleased to see Roger
22 looking at the significance tests and coming to
23 conclusions about whether there was a difference
24 between CALPUFF or AERMOD.
25 However, I think maybe you need to take

10TH CONFERENCE OF AIR QUALITY MODELS 03/13/2012 CCR#16766-1 269
1 it one step further and look at the difference between
2 the performance measures between instead of the
3 performance measures themselves. It appears to me is
4 what you did is you took the, like, fractional bias and
5 then you calculated the uncertainty about that for each
6 model and then you looked at whether those overlapped
7 and then concluded that there wasn't a significant
8 difference because they overlapped.
9 But there is another output of the BOOT
10 software that looks at the significant difference
11 between the two -- the individual fractional bias, say.
12 And then it -- an example of how what you did can
13 arrive at erroneous conclusion is supposing model A is
14 the same as model B, but just the concentration for
15 model A equals twice model B so they're perfectly
16 correlated with a -- you would end up with those two
17 different FBs and distribution and you might conclude
18 that they're not significantly different, but if you go
19 on and use the -- look at the other output which
20 accounts for the correlation between the models and I
21 would assume there is a fairly good correlation between
22 CALPUFF and AERMOD on individual values because it's
23 the same meteorology, then there may be a significant
24 difference in reality that would come out of look at
25 that additional output.

10TH CONFERENCE OF AIR QUALITY MODELS 03/13/2012 CCR#16766-1 270
1 So, the bottom line is there -- you
2 concluded that there was not a significant difference,
3 but in fact there may be a significant difference
4 between the performance of the two models.
5 MR. BRODE: I appreciate those comments.
6 In fact, I think that might have been that I actually
7 had run the BOOT program. That was actually the what -
8 - the way it was used by New Jersey and later I looked
9 at it more closely and realized that, I can't remember,
10 but I think it actually may have been statistically
11 significant at that next level, but I can check that.
12 AUDIENCE MEMBER: Yes, it's kind of
13 confusion and most people don't even use that output.
14 So, I'm pleased to see that.
15 MR. BRODE: I appreciate your pointing
16 that out and I recognize that difference since then and
17 I'll check it.
18 MR. HOFFNAGLE: Maybe the developer can
19 make it less confusing.
20 MR. BRODE: Well, a lot of confusion is
21 on the side of the users, so.
22 MR. BRIDGERS: Do we have other
23 questions?
24 Well, if not, then I guess we can give
25 our speakers another round of applause and we can move

10TH CONFERENCE OF AIR QUALITY MODELS 03/13/2012 CCR#16766-1 271
1 on to the last set of presentations for the day.
2 So, if you look at your schedule, we
3 have 4:15 to 5:15 we've got some talks on MMIF. It says
4 Bret Anderson and Kirk Baker, but all that's been
5 pulled into one presentation if I understand correctly,
6 so I'm going to yield the floor to Bret Anderson for
7 the next hour.
8 MR. ANDERSON: I'm not going to torture
9 anybody with an hour long presentation. Honest.
10 Many of you have seen me in years past,
11 you know, working for EPA Region 7, for the Office of
12 Air Quality Planning and Standards, and now I'm doing
13 my final tour of duty with the Federal Land Management
14 community before I go into imposed retirement -- self-
15 imposed retirement.
16 Anyway, you had seen presentation given
17 by Herman Wong of EPA Region 10 at the 9th Modeling
18 Conference on a project that was then called the, I
19 think he referred to it as the BARF project which was
20 the Bret Anderson Reformatting Tool. For political
21 correctness, we've changed it to the Mesoscale Model
22 Interface Program and you've, you know, you've --
23 there's a beta copy of that up on the website and
24 there's reports, you know, on some of the testing of it
25 and I just wanted to kind of give you an overview of,

10TH CONFERENCE OF AIR QUALITY MODELS 03/13/2012 CCR#16766-1 272
1 you know, what it is and, you know, and some of the
2 ancillary software that, you know, accompanies this.
3 And, so basically, what I wanted to do
4 is I wanted to take a step back and talk about -- to
5 discuss the state of the practice, you know, with
6 respect to the use of old prognostic and diagnostic
7 models as it relates to long range transport modeling
8 and since the publication of the phase two
9 recommendations. This is important because a set of
10 recommendations, as Tyler had mentioned, was a set of
11 recommendations had been laid out in 1998 and Joe, you
12 know, has done a lot to advance the use of prognostic
13 models in long range transport modeling, but the state
14 of the universe has continued to evolve as we've seen,
15 you know, both on the dispersion modeling side and on
16 the SIP modeling side.
17 So, what we wanted to do is we wanted
18 to, you know, in concert with EPAs second essential
19 element which was promoting the use of the prognostic
20 or the grid and meteorological data in a more, you
21 know, in a more complete manner. We looked at the
22 development of this software.
23 And so, basically, what I wanted to do
24 was introduce design feature elements that, you know,
25 make up the MMIF software and to discuss the testing

10TH CONFERENCE OF AIR QUALITY MODELS 03/13/2012 CCR#16766-1 273
1 procedures, introduce the supporting software that goes
2 along with it and then discuss any next steps.
3 So, stepping back to 1998 and the
4 publication of the IWAQM phase two guidance here, we
5 had a new model, you know, called CALPUFF and its
6 diagnostic wind field model called CALMET which, you
7 know, produced three dimensional meteorology which is,
8 you know, for most of the people in this room is, you
9 know, it's a new concept that's been introduced into
10 the dispersion modeling realm. Fully evolved three
11 dimensional meteorology.
12 And so, these are quotes directly from
13 the IWAQM phase two recommendations and it,
14 rightfully, discusses the complexity that's involved
15 with the construction of three dimensional wind fields
16 and, basically, it talks about the, you know, the
17 recommendations as far as the expertise required for
18 the use of CALMET it says that expert understanding of
19 mesoscale and micro scale meteorological effects such
20 as terrain and slope flows on meteorological conditions
21 and the finesse to adjust the available processing
22 controls within CALMET to, you know, induce these
23 desired effects.
24 And then it goes on to say that the
25 IWAQM does not anticipate a lessening in this required

10TH CONFERENCE OF AIR QUALITY MODELS 03/13/2012 CCR#16766-1 274
1 expertise in the future. It says developing three
2 dimensional time varying fields of meteorological
3 conditions is a demanding task which cannot be left to
4 unskilled and inexperienced staff. Written by John
5 Irwin, obviously.
6 It goes on to say that developing CALMET
7 meteorological fields is considered a difficult task
8 just managing the sheer volume of input and output data
9 from CALMET and excellent computer skills are needed to
10 manage the operation of the various processors to
11 CALMET.
12 And it also says that the software was
13 not written, at that time, was not writing to accept a
14 variety of input data formats. The software was
15 developed that the assumption that the user is capable
16 of screening the data for anomalous values. It was
17 also assumed that if the data are not in the required
18 format, that the user has the programming skills to
19 write special programs to translate the data format
20 into the format required.
21 So, taking that into consideration, you
22 know, we've had a number of state of -- advances in the
23 state of practice with respect to the development of
24 three dimensional wind field models and key to this has
25 been the development of graphical user interface.

10TH CONFERENCE OF AIR QUALITY MODELS 03/13/2012 CCR#16766-1 275
1 And as Gale had mentioned in his talk,
2 you know, there have been considerable resources
3 developed by many organizations, in particular we
4 credit Earth Tech and TRC for introducing the original
5 graphical user interface for both the CALMET and
6 CALPUFF system and then you'll see the commercial
7 software that's available from Lake, Trinity, or us and
8 they've made the process of getting data into the
9 CALMET modeling system much less of a burden.
10 And then you couple that with the fact
11 that we now have routinely available MM5 data that was
12 primarily developed by the regional planning
13 organizations for the BART demonstrations across most
14 of the lower 48 United States.
15 These two advances have made the
16 application of CALMET much more user friendly and has
17 expanded the application base of the modeling system
18 tremendously just as Gale had indicated, but there's
19 been a cost associated with this.
20 So, if we roll back to May 2009 and look
21 at what the draft IWAQM revisions talked about in terms
22 of what the state of the practice was at this
23 particular time, it goes on to say as a result of the
24 practice of what we were describing, the end user, that
25 is the dispersion modeler, typically has little

10TH CONFERENCE OF AIR QUALITY MODELS 03/13/2012 CCR#16766-1 276
1 knowledge of the choices made in the numerical weather
2 prediction model physics, options, or the suitability
3 of either the numerical model or the CALMET data sets
4 used in the long range transport model applications.
5 This has also created the unenviable position for
6 reviewing authorities of having to make the judgments
7 on the suitability of those data sets for specific LRT
8 applications with little or no experience in the
9 application of mesoscale meteorological models and an
10 incomplete understanding in the practical limitations
11 of diagnostic meteorological models in relationship to
12 their usage for air dispersion modeling.
13 And so, in the long-winded way of saying
14 it is the state of the practice had deteriorated to a
15 point where the graphical user interfaces had made it
16 so easy to get data into the model and that there was
17 MM5 data that was routinely available, people stopped
18 looking at the meteorology that they were generating
19 and as the IWAQM phase two guidance said, and if you go
20 to any of the TRC or Joe's classes, they will teach you
21 that CALMET requires significant amount of finesse in
22 order to get to induce the correct features. But the
23 state of the practice had degenerated to a point where
24 there was very little evaluation of that going on.
25 You see this in comments that were made

10TH CONFERENCE OF AIR QUALITY MODELS 03/13/2012 CCR#16766-1 277
1 by AB3 -- the AB3 Committee back in 2005 where they
2 talked about inconsistent acceptability, you know, both
3 in terms of both observations and no observations.
4 Which MM5s do I use and which resolutions do I use?
5 So, they recommend that EPA provide
6 oversight for consistency and adequacy and that EPA
7 should collect and distribute at cost.
8 The list of higher priority items that
9 came from AD3 in 2005 was in, you know, highlight and
10 italicized here where mesoscale model data sets and
11 also a methodology to evaluation CALMET wind fields.
12 Rolling forward to 2008 for the 9th
13 Modeling Conference, a presentation was given by Doug
14 Blewitt on behalf of the American Petroleum Institute
15 talks about the widespread use of the meteorological
16 model output and air quality modeling requires the
17 accuracy of MM5 CALMET model output must be tested for
18 each dispersion model application and that EPA needs to
19 coordinate a stakeholder group to develop guidelines to
20 use meteorological models in air quality analyses.
21 Meteorological accuracy is more important than the
22 number of years of model results used in an air quality
23 analysis.
24 So then, roll forward to the IWAQM phase
25 two, we talked about the current state of the practice

10TH CONFERENCE OF AIR QUALITY MODELS 03/13/2012 CCR#16766-1 278
1 here where we said that the ease of use and the date
2 availability can breed complacency in the modeling
3 community. What we found on the Federal Land
4 Management side was the fact that we were seeing no
5 statistical evaluations of either the prognostic or
6 diagnostic meteorological fields as required under the
7 regulations under section 8-three dimensional under
8 Appendix W.
9 And then also a key component of what
10 was recommended in the phase two recommendations was
11 the fact that visualization capabilities became
12 critical because you're relaying upon, you know, as I
13 believe the term is used -- tweaking, I guess, to
14 describe how you go through a process of inducing the
15 correct features into a particular, you know, to induce
16 the correct complex terrain features into a wind fields
17 which is through visualization process.
18 The current regulations are very
19 prohibitive where that's concerned because we have
20 three years where, you know, the regulations require
21 three years' worth of prognostic data be used for long
22 range transport models and for those that are fluent
23 with the modeling system and its utilities for
24 visualization, trying to do three years' worth of print
25 MET and, you know, on individual static fields in

10TH CONFERENCE OF AIR QUALITY MODELS 03/13/2012 CCR#16766-1 279
1 SURFER can be a very painful process.
2 And so that sort of environment has led
3 to where we're at now in terms of the lack of
4 robustness in certain aspects of that and the state of
5 the practice had deteriorated as a result of that.
6 So, the EPA in May of 2009 responds to
7 this by saying the required expertise and collective
8 body of the knowledge in mesoscale meteorological
9 models has never fully emerged from within the
10 dispersion modeling community because, again, it's the
11 dispersion modeling community that is responsible for
12 the review of CALPUFF applications. It is not the SIP
13 modeling community where there meteorological modeling
14 was done. It's the dispersion modelers that are
15 responsible for the CALMET and CALPUFF system and that
16 expertise has never fully emerged from that community.
17 That the lack of a sufficient body of
18 knowledge with respect to the mesoscale meteorological
19 models, model evaluation procedures and related issues
20 has resulted in a process whereby the dispersion
21 modeling community typically obtains the most readily
22 available numerical weather prediction, you know, their
23 NWP or MM5 data set for applications for the CALMET and
24 CALPUFF modeling system, without regard to its
25 suitability, creates a three year CALMET data set and

10TH CONFERENCE OF AIR QUALITY MODELS 03/13/2012 CCR#16766-1 280
1 then performs no additional analysis on the assessment
2 or no additional assessments of the resulting CALMET
3 meteorological fields.
4 And we in the Federal Land Management
5 community are equally guilty of that.
6 And so we get to a state where a lock-
7 down is enforced. Basically, so as EPA continued, it
8 said the situation described above and public comments
9 have compelled the EPA to reassess the existing
10 guidance and standard practices for the application of
11 CALMET. Whereas in the past it was deemed to be both,
12 quote, premature and counter-productive according to
13 the phase two recommendations to recommend specific
14 CALMET model control options, the EPA now believes it's
15 timely and necessary to specify such options to promote
16 scientific integrity and to restore balance to this
17 public decision-making process.
18 Interim recommendations were made in
19 2009 that were intended to configure CALMET in such a
20 way as to preserve as much of the integrity of
21 prognostic data as, you know, of the meteorological
22 fields as they were and we'll get into a little bit of
23 discussion on that a little bit later.
24 And then finally, in August of 2009, EPA
25 issued a clarification memorandum discussing

10TH CONFERENCE OF AIR QUALITY MODELS 03/13/2012 CCR#16766-1 281
1 identifying preferred, what we refer to as preferred
2 model control options. The final control model options
3 are based upon statistical performance evaluations and
4 Ralph Morris will talk more about that tomorrow about
5 some of the data that actually went into formulating
6 those recommendations.
7 And so that kind of gets us to where we
8 are now which is, given that we know what the state of
9 practice was in the modeling community as a whole and
10 recognizing the fact that, you know, the state of the
11 science had evolved to a point where the prognostic --
12 the use of direct prognostic models or, you know, the
13 direct use of prognostic model output became a much
14 more viable concept compared to what it was back in
15 1998 with the phase two publications where we were
16 limited to, you know, to one year or one to two years
17 of 80 kilometers of MM4 data, we now have multiple
18 years of continental 12 kilometers data and in some
19 areas of the United States, one or more years of four
20 kilometers data over multiple states.
21 So, we look at, you know, taking into
22 consideration EPA's second essential element about
23 promoting the use of prognostic meteorological or
24 gridded meteorological data to advance the state of the
25 science, that we look to the possibility of direct

10TH CONFERENCE OF AIR QUALITY MODELS 03/13/2012 CCR#16766-1 282
1 coupling of prognostic meteorological models directly
2 to long range transport models which is a process which
3 is very similar in the emergency response modeling
4 community.
5 It was also in response to comments that
6 were received from AD3 was the attempt to develop
7 methods for evaluating both prognostic and CALMET
8 meteorological fields and then recognizing the
9 practical limitations that, you know, one of the key
10 elements of doing any sort of evaluation is not only a
11 statistical evaluation, but also visual analysis is to
12 enhance the methods for meteorological field
13 visualization.
14 So, this brings us to the first element
15 here which is the mesoscale model interface program
16 and, as I had mentioned before, Herman Wong had already
17 given this presentation back in 2009 and, basically,
18 the MMIF beta program converts either MM5 or WRF
19 meteorological outputs into the appropriate formats for
20 three separate models now; CALPUFF, SCICHEM, and
21 AERMOD.
22 The prototype was developed by U.S. EPA
23 and the continued development is through contract with
24 Environ. MMIF 2.1, the user's guide, is dated January
25 1st, 2012 and this has been released up on the 10th
10TH CONFERENCE OF AIR QUALITY MODELS 03/13/2012 CCR#16766-1 283
1 Conference website.
2 MMIF 2.1 beta features include ability
3 to run on both Linux and Windows environments. The
4 options to re-diagnose are passed through the PBL
5 depths which, you know, which is a -- even with CALMET
6 in a No Obs mode, your convective boundary layers are
7 still being re-diagnosed and so this is one feature of
8 that is, you know, it passes through the prognostic PBL
9 heights.
10 It's designed to work either on the
11 entire MM5 or WRF domain or process a subset of it.
12 There is options in there to perform layer aggregation
13 consistent with the, you know, the IWAQM or the
14 revisions to the phase two recommendations which, you
15 know, basically recommended an 11 model or an 11 layer
16 model or you could specify going, you know, doing one
17 layer matching here.
18 Another key feature here is the fact
19 that it was designed to retain the original MM5 WRF map
20 projection in the horizontal grid resolution and so
21 it's not an interpolator. So, the idea that this is --
22 you'll understand the philosophy behind this in a
23 minute here. That was a key feature that was left out
24 in the design of it and it was done for a reason.
25 And then finally, it, you know, most

10TH CONFERENCE OF AIR QUALITY MODELS 03/13/2012 CCR#16766-1 284
1 applications in the continental United States for
2 prognostic models are in Lambert-conformal, but we've
3 added polar stereographic and Mercator projections
4 based upon work that, you know, EPA Region 10 was
5 having up in the Chukchi Sea and Beaufort area where
6 they were contracting with the University of Alaska
7 Fairbanks in order to produce, you know, three years'
8 worth of WRF high resolution. So, to provide this
9 capability for other areas that require, you know,
10 additional map projections.
11 So, basically, for CALPUFF it has been
12 made forward -- MMIF has been made forward compatible
13 for both 5.8 and 6.4 and basically it was two basic,
14 you know, it has a number of basic features and one of
15 them is that it has two options for defining PG
16 stability class. One is based upon the SRDT method
17 which was in supplement C to the guideline on air
18 quality models in 1995 and the other relies upon the
19 Golder method which is, you know, relates Monin Obukhov
20 length and surface roughness to PG stability class.
21 It will generate a CALMET dot dat file
22 format that can be directly input to CALPUFF and it
23 works with both, and again, it's forward compatible to
24 version 6.4.
25 It's also designed to generate the

10TH CONFERENCE OF AIR QUALITY MODELS 03/13/2012 CCR#16766-1 285
1 auxiliary files that contain the 3D cloud and water
2 mixing ratio for CALPUFF version 6.4, you know, or 6X,
3 the 6-series.
4 It has the option for extracting the MM5
5 and WRF data based upon latitude and longitude window
6 rather than the way it was originally designed which
7 was just to base it on the IJ coordinates of the
8 system.
9 And then it also has the option to pass
10 through the WRF or MM5 leaf area index, Monin Obukhov
11 length and surface roughness values rather than using
12 the look-up table which was in the prototype.
13 And then the final part was, as I had
14 mentioned before, it's designed to retain the
15 projection and the grid resolution of the original
16 prognostic meteorological data in order to preserve the
17 integrity of it as much as possible and you'll
18 understand that that has some pretty severe
19 implications associated with it that I'll get to here
20 at the end of the talk.
21 For AERMOD, there are three options for
22 output of the data that the user can select.
23 They are the -- you can select from a
24 particular grid cell. You can output surface and upper
25 air meteorological data to run through AERMET so it

10TH CONFERENCE OF AIR QUALITY MODELS 03/13/2012 CCR#16766-1 286
1 basically it would be creating pseudo observations that
2 could be used to be reprocessed through AERMET.
3 You can output meteorological data in
4 the AERCOR format to go through, you know, to run
5 through AERCOR consistent with the presentation that
6 was given earlier here in the discussion on the Model
7 Clearinghouse option or memorandum on that.
8 And then also to create AERMET like
9 surface and upper profile data files so that they can
10 be directly input into AERMOD.
11 And for SCICHEM or SCIPUFF it generates
12 the meteorological inputs in the MEDOC format and the
13 MEDOC format can be specified either by ASCII or binary
14 and then MMIF also generates a sample location file
15 with the XYZ and location of all the points that our
16 output in the subdomain that are extracted.
17 And so, you know, MMIF has been, you
18 know, MMIF has been a multi-year effort to do this and
19 so there's been a lot of -- there's been a lot of
20 evaluations that have taken place in terms of -- both
21 in terms of quantitative and qualitative evaluations
22 and these consist of, you know, qualitative diagnostic
23 evaluations of the original prototype and, you know,
24 the MMIF 1.0. Looking at comparing MMIF to CALMET No
25 Obs at the same resolution just to look at -- is there,

10TH CONFERENCE OF AIR QUALITY MODELS 03/13/2012 CCR#16766-1 287
1 just to do a sanity check. Do they look similar to one
2 another?
3 And then, quantitative performance
4 evaluations for both the meteorological and the air
5 quality models and, as I mentioned before, these will
6 be discussed tomorrow in greater length by Ralph Morris
7 in his presentation.
8 And then quantitative and qualitative
9 consequence analyses for use in AQRV assessments and
10 I'll discuss today a little bit about the -- a little
11 bit of the qualitative assessment that the Fish and
12 Wildlife Service did and then the more quantitative
13 assessment that Environ did under contract to EPA.
14 So, for the testing and evaluation, this
15 is just basically -- this is, you know, the qualitative
16 sanity check that we, you know, that I talked about
17 was, basically, a comparison of MMIF and CALMET with
18 the No Obs option for a ten meter winds and so you can
19 see that the two of them look almost identical to one
20 another. It's like in, you know, since both of them
21 are superimposed on one another, you can only see one.
22 The testing and, you know, as far as the
23 temperature, you know, what you see is that the -- what
24 you'll see is that they have very similar patterns
25 although you see more, you know, it appears you see
10TH CONFERENCE OF AIR QUALITY MODELS 03/13/2012 CCR#16766-1 288
1 slightly more definition in the MMIF pattern, but they
2 show a very similar spatial patterns and, you know,
3 magnitude and you would expect to see that given that,
4 you know, CALMET is, you know, if used properly is just
5 using the prognostic temperatures that way anyway. So,
6 the temperature patterns should look very similar to
7 one another.
8 And then this is where the differences
9 start to occur. As I had mentioned before which is
10 because even in the No Obs mode, CALMET re-diagnoses
11 the convective boundary layer. This will generate a
12 pass through or you can, you know, alternatively you
13 can specify the -- you can specify a re-diagnosis of it
14 based upon Bulk Richardson formulation.
15 And so, you can see here this is just
16 two different snapshots between, you know, then. As you
17 can see, there's less agreement between the two models
18 in that construct.
19 So, now we move on to the FLM testing of
20 the MMIF software and this was conducted by the U.S.
21 Fish and Wildlife Service on the MMIF 1.0 and so, as
22 you can see, we're up to 2.1 now. So, the consequence
23 analysis is basically, it's a CALPUFF results examining
24 the differences between deposition fields generated
25 with, you know, meteorology from CALMET versus

10TH CONFERENCE OF AIR QUALITY MODELS 03/13/2012 CCR#16766-1 289
1 meteorology generated from MMIF.
2 The key area of concern was to examine
3 the effect of the prognostic fields on the AQRVs, in
4 particular, you know, what you'll see here is
5 deposition and, in particular, the concern over what
6 impact purely prognostic precip will have on what
7 deposition patterns.
8 And three domains were looked at. They
9 were the Four Corners area and North Dakota and the
10 VISTAS Area Domain 5 and I'm only going to show, you
11 know, just limited results from the two. The North
12 Dakota and the Four Corners Domain. And the analysis,
13 again, was the effect of wet deposition. Turning it
14 on. Dry off. And then dry deposition. So, basically,
15 you know, two hypothetical scenarios were used for
16 this. One was a two stack EGU and the other was a
17 cement plant.
18 And so, this is an example of what the
19 Four Corners MMIF Domain looked like and what the
20 CALMET Domain looked like and, you know, Bob Paine
21 correct me if I'm wrong, I think Tim got those data
22 sets from you, did he not? Yes. So, I think so, you
23 know, so thank you, Bob, for providing those data sets.
24 Well, you know, it did help with the evaluation of this
25 a little bit.

10TH CONFERENCE OF AIR QUALITY MODELS 03/13/2012 CCR#16766-1 290
1 So, and this is the comparison of, you
2 know, the -- which essentially would be the 12
3 kilometers domain that MMIF represents and then the
4 four kilometers -- I believe this is a four kilometers
5 domain nested over the, you know, the Four Corners
6 area.
7 So, and then this is what the -- I think
8 this is probably another Bob Paine one here. This is
9 North Dakota and so, anyway, so again, thank you to Bob
10 for, you know, helping us out with the testing on this.
11 So anyway, this is what the -- this is a
12 purely qualitative analysis here and there's two key
13 elements here.
14 One is, you're looking at two different
15 spatial resolutions here. The one you're looking at a
16 12 kilometers field on the left and you're look at a
17 four kilometers field on the right. So, you know, the
18 spatial pattern, obviously, is going to look different,
19 but, you know, there are some obvious differences that
20 you can see here, you know, and we haven't went back to
21 -- the Fish and Wildlife Service hasn't went back to do
22 a head to head numerical evaluation of just looking at
23 the absolute magnitude. They were just, you know, they
24 were just eyeballing these to see, you know, to look
25 at, you know, what does, you know, what is the impact

10TH CONFERENCE OF AIR QUALITY MODELS 03/13/2012 CCR#16766-1 291
1 in terms of the spatial extent of the change in the
2 deposition fields and such. And as you can, they do,
3 you know, they do have, you know, the CALMET on the
4 right shows a significantly more -- it's less coherent
5 than compared to the, you know, the MMIF, you know, the
6 MMIF one here, but you can see they have -- they show
7 similar flow features, you know, and such, but you'll
8 see that the aerial extent of the deposition, if you
9 take a look at, I believe it's the class one area that
10 you see that extends to the south of this area here.
11 So, if you're looking at this one here as you can see
12 as the marker, you can see that CALMET pushes the
13 precip further to the north so the wet deposition
14 occurs more up in this area here and the prognostic
15 data has it pushed further to the south and so, again,
16 it's just a difference in the spatial pattern.
17 So, that's part of the sanity testing
18 that the EPA -- the FLMs have to go through is that for
19 14 years now, since, you know, 14 or 15 years since
20 CALPUFF has been used and, you know, in a routine sense
21 with the land management community, we're very used to
22 interpolated precipitation values and so, switching
23 over to purely prognostic precip is going to be
24 completely new aspect to the Federal Land Management
25 community.

10TH CONFERENCE OF AIR QUALITY MODELS 03/13/2012 CCR#16766-1 292
1 And so, here you can a, you know, here
2 you can see a similar pattern here in terms of, you
3 know, a larger difference between the deposition fields
4 between MMIF and CALMET. And again, they show a
5 similar transport pattern since, you know, if you look
6 at it, but the precipitation is probably accounting for
7 the spottiness, you know, the prognostic precip is
8 probably accounting for the spottiness in the MMIF
9 whereas you see a more uniform field just like you did
10 in the last one. You see a, you know, you see a more
11 uniform field here with the CALMET one.
12 So, some initial observations from the
13 FLM testing is that there are some significant
14 differences noted in the deposition levels and patterns
15 between MMIF and CALMET results. And these are just
16 common sense, you know, it's like because you're, you
17 know, anything that would be different between a purely
18 prognostic data set versus what would be in CALMET
19 would include; how it calculates stability classes, how
20 it calculates the mixing heights, the convective
21 boundary layers, what the precipitation was, if the
22 prognostic precipitation was correct or not, and then
23 transport directionality.
24 Additional examination of the results is
25 necessary in order to take a more definitive

10TH CONFERENCE OF AIR QUALITY MODELS 03/13/2012 CCR#16766-1 293
1 conclusions or a more quantitative assessment of what
2 the magnitude of the, you know, the extent -- the
3 magnitude and the extent of the differences are.
4 And so it's important to reiterate that
5 this is not a model validation exercise. This is just
6 -- rather these are tests designed to affect the
7 different methods. This is supplying the
8 meteorological data to the dispersion model and the
9 subsequent effects on the air quality related values.
10 So, you know, stepping forward again,
11 some of the additional testing that went on with
12 respect to MMIF includes; comprehensive testing of the
13 MMIF tool done against the Tracer releases that, you
14 know, that Gale had mentioned that they want to provide
15 comment on and this was done with the U.S. EPA's Forest
16 Service and Environ looking at, you know, which is the
17 documentation that you'll see, you know, that Ralph
18 will talk about tomorrow.
19 Basically, what it was was CALPUFF was
20 applied with CALMET and MMIF for various Tracer
21 releases which you've seen many times before and then,
22 basically, the generic conclusion from that is, is that
23 the plume placement is generally comparable or better
24 using MMIF and I think that's, you know, that's
25 probably an overstatement of MMIF's capability there.

10TH CONFERENCE OF AIR QUALITY MODELS 03/13/2012 CCR#16766-1 294
1 On the whole, I think you would see that MMIF, probably
2 for one Tracer experiment it does better. For another
3 one it does worse. And so, you know, the results are
4 somewhat mixed in terms of that.
5 The final report, you know, is up on the
6 EPA website that you see below here regarding that
7 portion of the testing and evaluation phase of MMIF.
8 MMIF testing and evaluation continued. This is work
9 that is being done internal to OAQPS which is where the
10 MMIF tool is being used to prepare meteorological
11 inputs for SCICHEM for the 1999 TBA plume measurement
12 study.
13 Based upon their initial results, they
14 find that the plume placement using MMIF generated
15 meteorology consistent with using SCICHEM with
16 meteorological observations as inputs and the plume
17 placement with MMIF and SCICHEM was also consistent
18 with CMAQ using MSIP and CAMX using WRFed CAMX.
19 So, in terms of MMIF support, the U.S.
20 EPA and Environ have already made several code updates
21 since the MMIF was released in beta form in its
22 original posting on SCRAM in mid-February to address
23 reported bugs and that's kind of the idea is to, you
24 know, getting this out to the community is to, you
25 know, find those things because obviously, when you're

10TH CONFERENCE OF AIR QUALITY MODELS 03/13/2012 CCR#16766-1 295
1 looking at Trace -- whether you're looking at Tracer
2 evaluations or you're looking at, you know, one
3 specific element of it -- if you're looking at, if
4 you're just looking at, you know, with the Tracer
5 evaluations you're only looking at, you know, two to
6 three day up to four day simulations and so, you're not
7 putting it through its full paces of what it would be
8 like under an annual simulation, you know, doing an
9 annual simulation or running it for the other two
10 models, you know, AERMOD or SCICHEM.
11 And, so anyway, so there have already
12 been a flurry of bug activity, bug reports coming in
13 which is, you know, really what this is all about --
14 getting this out to the community and getting feedback
15 from the community on its use and, you know, how it can
16 be improved.
17 And then the updated beta code is
18 already available on SCRAM. I believe the EPA updated
19 the -- right around the 1st of March when the -- with
20 one major bug that was found in the AERMOD component of
21 it and so then an update was released then.
22 And so, there will continue -- the EPA,
23 you know, under, you know, under contract with Environ
24 will continue to compile the bugs and then issue the
25 program with documentation at routine intervals, you
10TH CONFERENCE OF AIR QUALITY MODELS 03/13/2012 CCR#16766-1 296
1 know, much in the same way, you know, you collect it.
2 I hope it's not on that, you know, year 20 thousand
3 whatever schedule, but the next periodic release, you
4 know, unless there's found to be major, major, you
5 know, major flaws with it, there will be periodic
6 releases and the next one is schedule to be for, you
7 know, autumn of 2012.
8 So, now I wanted to get into talking a
9 little bit about the related software. You know,
10 stepping back again to what I had talked about before,
11 the comments that we have received from the, you know,
12 from industry at the 8th and 9th Conference talked
13 about the ability, you know, enhancing the ability to
14 evaluate the, you know, the model. The meteorological
15 data going into the model.
16 And so we looked at it, you know, again
17 going back to the phase two recommendations, the two
18 key components are statistical evaluation and
19 visualization.
20 And so for the first component, the
21 Federal Land Managers and EPA Region 10 sponsored,
22 through Alpine Geophysics, sponsored the development of
23 a program that's called MMIFSTAT. And basically, it's
24 like for those that are familiar with, you know, the
25 running of prognostic models, Environ has developed a

10TH CONFERENCE OF AIR QUALITY MODELS 03/13/2012 CCR#16766-1 297
1 tool that's called METSTAT which is used quite a bit in
2 the SIP modeling community for doing, you know,
3 surface, you know, for doing surface analysis or doing
4 performance evaluation of surface meteorological data
5 against observations.
6 And so it was based off of that, the
7 METSTAT platform, you know, and modified to, you know,
8 to read CALMET data and it was designed to provide
9 statistical evaluation of CALMET or MMIF related
10 fields, MMIF process fields, you know, using, you know,
11 using surface analysis.
12 And we understand that there's going to
13 be issues with this sort of performance evaluation
14 because whenever you're using a diagnostic model, for
15 example, you're evaluating observations against
16 observations. So, you either have to have a data set
17 which is -- you have to have a data set, you know, your
18 evaluation data set which has more observations in it
19 than what was used in the diagnostic model or you have
20 to hold back observations in order to have that, but
21 that's the same issue that you see when you're
22 evaluating prognostic models in the SIP community
23 because when you're doing four dimensions simulation,
24 you're pounding those same observations into the
25 analysis and so, it's not a true one to one comparison.
10TH CONFERENCE OF AIR QUALITY MODELS 03/13/2012 CCR#16766-1 298
1 So, the same issue applies whether you're using a
2 diagnostic model or a prognostic model in this
3 particular case.
4 And then the other one here is, you
5 know, recognizing what we had said before is that, you
6 know, the Earth Tech and TRC have done a lot in order
7 to, you know, promote the visualization tools, but they
8 still have their, you know, they still have the -- they
9 rely upon the functionality of the Golden Software
10 Surfer Platform and that can be very -- that can be
11 very painful and I know that, you know, I know that
12 there's been the animation tool and things like that
13 that have brought that forward and so, you know, it is
14 much better, but we're still limited by -- we're still
15 constrained by that somewhat.
16 So, what we tried to do -- what we tried
17 to, you know, tried to provide a seamless bridge to
18 other visualization platforms. And so what we decided
19 to was to take the CALMET output or the MMIF output and
20 convert it to a Models 3 I/O API format and this was
21 developed -- this approach was developed originally by
22 the U.S. Forest Services Air Fire Team as part of their
23 BlueSky System. And basically what it does is that it
24 reads in the CALMET data and outputs it in a Models 3
25 I/O API format and you can process it -- you can bring
10TH CONFERENCE OF AIR QUALITY MODELS 03/13/2012 CCR#16766-1 299
1 it into PAVE, you can bring it into VERDI and all these
2 other ones.
3 And so what we did is we grabbed that
4 and, you know, basically modified it to work as a
5 stand-alone. So, rather than being part of the BlueSky
6 PERL framework, it's now a stand-alone tool that can be
7 used to convert the data to this separate format, then
8 it can be bridged. Then you can bring it in since it's
9 in essentially NetCDF format, now you can bring it into
10 any myriad of visualization platforms.
11 So, going over what MMIFSTAT is, is
12 again, MIFFSTAT is a statistical performance evaluation
13 package for CALMET format and meteorological files so
14 it will work with either CALMET or MMIF files. And it
15 provides basic statistical measures for winds,
16 temperature, and relative humidity at, you know, mixing
17 ratios at the surface. Again, that's a key component
18 here because it's only a surface evaluation.
19 It's designed after Environ's MEDSTAT
20 program and was designed by Alpine Geophysics under
21 contract to the FLMs and EPA Region 10.
22 So, again, it's basic feature is that it
23 provides basic statistical analysis of primary
24 meteorological variables. It runs on both the Windows
25 and Linux operating systems. That's another key

10TH CONFERENCE OF AIR QUALITY MODELS 03/13/2012 CCR#16766-1 300
1 constraint is taking into consideration that most of
2 these -- well, all of these prognostic models are run
3 on Linux or the Unix environment and most of the
4 dispersion modeling community is a Windows based
5 environment that most of these tools had to be
6 functional on a Windows based system in order to
7 provide, you know, to provide for greater penetration
8 into the user community.
9 Also, it provides an Excel macro. This
10 is another important feature is that it just provides
11 an Excel macro which allows you to visualize either the
12 hourly time series or the daily summaries of the
13 statistics. And so you can see that this is just an
14 example of what it looks like here for, you know, this
15 is just the wind component of the analysis here and it
16 just shows you what the basic measures look like and
17 this is the time series.
18 So, now this is the -- this is getting
19 into the visualization component of it. Because you've
20 -- because you now have it in NetCDF format, you now
21 have access to a wide variety of tools that are used by
22 the prognostic modeling community. And this one here
23 is a particularly powerful tool and this one is called
24 the integrated data viewer. It was developed by
25 Unidata or UCAR out in Boulder, Colorado and it's a

10TH CONFERENCE OF AIR QUALITY MODELS 03/13/2012 CCR#16766-1 301
1 Java based software framework for analyzing and
2 visualizing, you know, geosciences data.
3 So, basically, if you can get it into
4 NetCDF format or grid format, you can get it into this
5 visualization package. And it's all GUI driven and it
6 works on both Linux and Windows and it gives you the
7 ability to, you know, to visualize, you know, in a very
8 powerful way as you can see. These are some, you know,
9 it allows you to look at your meteorological data in
10 any combination of ways.
11 The next one is NCAR Command Language.
12 This is a, developed again by the National Center for
13 Atmospheric Research and I said it is a free
14 interpreted language. In other words it's a scripting
15 language, basically. It's designed by NCAR for
16 scientific visualization and data analysis of
17 atmospheric data sets.
18 It has pretty decent file handling
19 capability if you, like I said, if you can get it in
20 the NetCDF format, you can get it into -- you can get
21 it into NCL. And so, basically, it has file handling
22 capabilities for NetCDF, HDF, GRIB, and ASCII files.
23 So, you can actually, you know, since it's a scripting
24 language, you have the ability to pull in observations
25 and lay them over if you want to. So, you know, you're

10TH CONFERENCE OF AIR QUALITY MODELS 03/13/2012 CCR#16766-1 302
1 basically limited by your own imagination and your own
2 programming skills in terms of being able to do that,
3 but, you know, these are just two basic plots that
4 could be used for, you know, for visualization of the
5 CALMET meteorological data.
6 And again, because of the fact that, you
7 know, we're trying to provide -- we're trying to
8 provide penetration to the community, we're again
9 providing examples of where it could be used for
10 software that is freely available and is available --
11 that is able to run both under the Linux and the
12 Windows operating systems which are key components here
13 of all of this.
14 And then finally, the one that, you
15 know, the CALMET to NetCDF was actually designed for
16 which was for VERDI which is the visualization
17 environment for data rich interpretation and again,
18 it's a Java, you know, it's a Java based program for
19 visualizing and it's what EPA and what UNC
20 Environmental Programs has developed and it's basically
21 designed to, you know, visualize meteorological
22 emissions and air quality data. And it provides
23 extreme flexibility as well in terms of how you look at
24 your data sets.
25 Now, it doesn't provide three

10TH CONFERENCE OF AIR QUALITY MODELS 03/13/2012 CCR#16766-1 303
1 dimensional visualization in the way that you saw IDV,
2 but it allows you to do time series statistics, you
3 know, visualization here like you see at the bottom
4 plot is -- I think that's the time series of
5 temperature here and so you can select any point on the
6 grid that you have and you can generate time series --
7 time series values of it and things like that.
8 So, these are just examples of, you
9 know, by creating and putting in a different format,
10 you now have a whole universe of visualization tools at
11 your disposal whereas before we were limited by, you
12 know, by those physical constraints that we have.
13 So, in summary for the for testing, I
14 said -- we basically said that it's important to note
15 that the testing to date does not, you know, and I need
16 to stress this. It doesn't indicate superior
17 performance advantage for MMIF over CALMET. That's not
18 -- I'm not here to tell you that. MMIF is not a silver
19 bullet. You know, as I had said, you'll find, you
20 know, the statistical performance evaluations show
21 better performance for some Tracer evaluations and
22 worse for others.
23 But it does have certain advantage that
24 the community should take into consideration and those
25 are for regulatory agencies and going back to the state

10TH CONFERENCE OF AIR QUALITY MODELS 03/13/2012 CCR#16766-1 304
1 of practice discussion that I had discussed earlier in
2 terms of the, you know, the regulatory agencies that
3 are charged with the responsibility for reviewing and
4 accepting both prognostic and diagnostic meteorological
5 data sets. This offers a very nice advantage for them
6 because it can provide them the confidence and
7 consistency in the meteorological data sets that are
8 produced because not everybody that applies CALMET
9 knows how to apply it appropriately. It's not a
10 condemnation of CALMET. CALMET is a perfectly good
11 tool, but it requires expertise and sometimes some
12 people that do it don't have that expertise. And so
13 this provides that -- a potential confidence in the
14 data sets that are produced that could be used in LRT
15 modeling assessments.
16 And then for the other parts of the
17 community, it can provide lower costs and reduce
18 project timelines for LRT model assessments. A
19 significant component of the time that goes into doing
20 long range transport modeling assessment is the
21 development of the meteorological inputs. And since
22 you're no longer having to run and -- one interpreting
23 program to put, you know, the prognostic data into an
24 ASCII format and then re-ingest it back into a
25 diagnostic model, you know, it can shave time off your
10TH CONFERENCE OF AIR QUALITY MODELS 03/13/2012 CCR#16766-1 305
1 project timelines that way. And so you know, there is
2 a potential cost savings, you know, and both in terms
3 of time and resources that go along with this.
4 So, where does the community go from
5 here?
6 So, going back to EPA's second essential
7 element here, where we talked about promote and
8 facilitate the use of the gridded meteorological data,
9 including the state of the practice, National Weather
10 Service Meteorological Analyses, to improve modeling
11 science and performance for near-field modeling
12 applications.
13 And going back to what we talked about
14 in the draft phase two recommendations, the released,
15 you know, going back again, you remember those draft
16 recommendations. They were released to support the
17 discussion of the May 2009 EPA Clearinghouse memorandum
18 that George had talked about earlier in response to EPA
19 Region 8, but it had much more in there than just
20 dealing with that. It talked about a vision, you know,
21 of where we could go from here. And unfortunately, it
22 was released prematurely because a lot of these tools,
23 you know, the many elements of these tools were in
24 their infancy at that point. But it talked about what,
25 you know, what a philosophical paradigm might look like

10TH CONFERENCE OF AIR QUALITY MODELS 03/13/2012 CCR#16766-1 306
1 for the use of prognostic data sets.
2 However, revisions reflected the vision
3 that, you know, to address EPA's second element as well
4 as to address many of the longstanding concerns that
5 had been identified by the community here. And so,
6 this is how we were trying to, you know, respond to
7 some of those concerns to provide, you know, to provide
8 analysis tools. To provide, you know, bridges to
9 visualization programs. To allow you to do a better
10 job in the evaluation of those data sets.
11 So, going back to what I had said
12 before, you know, a key design element of MMIF is the
13 fact that there's no horizontal interpolation that
14 occurs. So, basically what this implies is the fact
15 that it's going to -- if you use MMIF, it shifts the
16 burden of the responsibility back to the user. And
17 unfortunately, that's just the way it is. And so what
18 that means is that these recommendations strictly imply
19 that whatever numerical weather model data set you use
20 should be appropriately analyzed to make sure that it
21 appropriately characterizes the features that govern
22 source receptor relations in terms of a specific
23 application.
24 So, In other words, basically what that
25 says is if I've got a 36 kilometers data set and I'm

10TH CONFERENCE OF AIR QUALITY MODELS 03/13/2012 CCR#16766-1 307
1 modeling over a river valley in Colorado, that's not
2 appropriate. And probably even with a 12 kilometers
3 data set. That would be questionable, you know, again
4 it shifts the burden of analysis back to both the
5 applicant and the reviewing authority, in that sense,
6 to bring some sanity back to this process of rather
7 than just grabbing whatever meteorological data set I
8 can find available, to doing this.
9 So, it places a higher emphasis on
10 insuring that the candidate numerical weather model
11 data set is appropriate horizontal grid resolution and
12 that the data set captures the meteorological features
13 that are responsible for either design concentrations
14 or responsible for in the long range transport
15 community that the source receptor relationships to
16 class one areas and things along that line.
17 Therefore, the recommendation, you know,
18 we can't underscore this enough. This, if the
19 community moves forward in this direction, the
20 recommendation for establishing the suitability of
21 these data sets which is required -- I repeat --
22 required under section A3D of the guideline. It's a
23 very critical component for planning of a successful
24 long range transport modeling application.
25 In light of these concerns and the

10TH CONFERENCE OF AIR QUALITY MODELS 03/13/2012 CCR#16766-1 308
1 appropriateness and the adequacy of these grid
2 resolutions that we've talked about before, that all of
3 these features should be adequately justified based
4 upon the specific needs of the particular modeling
5 demonstration that is current here.
6 So, again, I can't stress enough because
7 of the way MMIF was designed, if it is ultimately
8 accepted into the community, it's going to shift the
9 analysis burden back onto the applicants to make sure
10 that the prognostic data sets that are used are
11 appropriate.
12 So, you know, continuing here. In
13 accordance with A3D, you know, EPA must, you know, re-
14 emphasize the fact that, you know, the prognostic data
15 set is, you know, acceptance of a prognostic data set
16 is contingent upon the concurrence from the appropriate
17 reviewing authority. Therefore, at a minimum, any
18 protocol should include an evaluation of the, you know,
19 of the performance of the candidate numerical weather
20 model data set prior to acceptance by the reviewing
21 authority.
22 Again, this is -- we're getting back to
23 the basics here, which is, you know, you heard talking
24 about the need for, you know, in the section 7, 2, 8
25 discussion where we talked about the need for a

10TH CONFERENCE OF AIR QUALITY MODELS 03/13/2012 CCR#16766-1 309
1 modeling protocol, you know, in a complex wind
2 situation, you know. The same thing applies in the
3 long range transport application.
4 We've gotten pretty confident that we're
5 doing the right thing here and so our protocols have
6 become pretty stale in the sense of they've become
7 fairly vanilla and things along that line and as, you
8 know, you don't see the analysis that goes into that,
9 you know, which is required by regulation.
10 So, for next steps. Basically what, you
11 know, as we release it here, we release it as a beta to
12 get feedback from the community based on that. And
13 again, we don't market this as the silver bullet, but
14 it is a viable alternative. And so, you know, we put
15 it out to get feedback and input from the user
16 community on the beta release. And as I had mentioned
17 before, you know, we've already -- the community has
18 already picked it up and started playing with it and
19 we've gotten feedback from them already in terms of
20 some of the features that were wrong with some of the,
21 you know, the newer features in the system.
22 We will begin the process of developing
23 guidance on the use of MMIF as appropriate.
24 We will begin meteorological model
25 evaluation procedures which is the other aspect, you

10TH CONFERENCE OF AIR QUALITY MODELS 03/13/2012 CCR#16766-1 310
1 know, in relationship to the AD3 discussion and I think
2 API discussion in 2008 which is to develop the model
3 evaluation procedures.
4 Unfortunately, even in the prognostic
5 community, the, you know, with METSTAT as an example,
6 the focus is very heavily upon surface analysis and we
7 don't focus enough on look at that whole system which
8 is both looking at upper air and because AQRV analyses
9 in particular are dependent upon precipitation and, you
10 know, for what deposition that's overlooked. And so we
11 will have to develop recommendations and procedures for
12 evaluation both precip and upper air as part of this.
13 Additional updates to MMIFSTAT will have
14 to include, since it was originally designed as a
15 CALMET prototype, was to add features that will allow
16 it to interface with the SCICHEM Medoc format and to
17 also provide which should, you know, be fairly easy.
18 It's just, you know, fairly minor code changes to the
19 header to make it come forward compatible with version
20 6.x of the CALMET system. And then to parallel the
21 development of MIFF to add polar stereographic and
22 Mercator projection.
23 Well, Dennis, it already has polar
24 stereographic, doesn't it?
25 Yes. So, I guess it would just be, I

10TH CONFERENCE OF AIR QUALITY MODELS 03/13/2012 CCR#16766-1 311
1 guess for MMIFSTAT it would just be to add the Mercator
2 to make it, you know, to make it seamless with the MMIF
3 capabilities. So, that's a correction there because
4 it's just -- just to update it for Mercator
5 projections.
6 And then on the Federal Land Management
7 side which is independent from, you know, EPA's use of,
8 you know, of the tool for its purposes is, you know,
9 again, you know, we share this vision that we want to
10 try to provide to the user community consistent, you
11 know, that confidence and consistency in the data sets
12 that you use.
13 And so what we are going to do is we
14 will provide -- we're in the process of developing MMIF
15 coverages for the entire United States based upon WRF,
16 you know, annual WRF simulations and we have a number
17 of those available. EPA has produced a number of 12
18 kilometers CONUS WRF applications for areas of the
19 country, like I'd mentioned before, shifting back to
20 the burden that you have if you're going to use this
21 and you want to use this in a highly complex trained
22 environment. We're not telling you that you should use
23 36 or 12 kilometers data in highly resolved areas. And
24 so, we're saying that if you're going to use this,
25 you're going to have to have the appropriate
10TH CONFERENCE OF AIR QUALITY MODELS 03/13/2012 CCR#16766-1 312
1 meteorological data sets and so going to places like
2 the WRAP West Jumps project which has a very large, you
3 know, four kilometers domain over the western part of
4 the United States as an example of where those data
5 sets could be accessed for that. And to also, you
6 know, if necessary, to develop those four kilometers
7 data sets in the areas where they're necessary.
8 And then as part of this FLM effort, we
9 will also once, you know, once the meteorological
10 evaluation guidance is finalize, we'll provide
11 performance evaluations on each of the domains to
12 provide the data and the performance statistics for
13 those that wish to use these data sets. And then, going
14 back, if you want to use your own prog, you know, we're
15 going to offer you, you know, similar to the was VISTAS
16 has done their work where they have, you know, five or,
17 you know, I think it's five domains to provide, you
18 know, a CALMET data set that is essentially pre-
19 approved by the regulatory agencies for use and so
20 you're not going to get any argument from them about
21 how it was run. That's more or less the intention is
22 to follow the VISTAS model to provide for the FLMs to
23 provide, you know, seamless coverage for those that we
24 would, you know, that we would feel very comfortable
25 with.

10TH CONFERENCE OF AIR QUALITY MODELS 03/13/2012 CCR#16766-1 313
1 And so, if an applicant would like to
2 use their own, independent prognostic data set, then we
3 remind you that, you know, the section, you know, the
4 requirements under section A3D are still in force and
5 that, you know, that will require an independent
6 meteorological performance evaluation in accordance
7 with the final performance guidance.
8 Just acknowledgements and I think, 15
9 minutes ahead of schedule. Well, I guess I'm on
10 schedule, I'm sorry here.
11 But anyway, acknowledgements, you know,
12 I'd like to acknowledge all the people. This has been a
13 pretty torturous process and it's been a long process,
14 too. It's been, you know, and like I said, it's still
15 in its infancy, but there's been a lot of people that
16 have been involved in this and I'd like to, in
17 particular, I'd like to recognize Kirk Baker from EPA
18 OAQPS. He's been the MMIF project work assignment
19 manager and he's had to deal with a lot of whining from
20 FLMs for a couple of years on this thing.
21 And then also, you know, the Environ
22 Development Team. Bart Brashers and Chris Emory, you
23 know, they've done -- they've been very good about, you
24 know, about, you know, cleaning up my coding mistakes
25 and, you know, putting in very good FORTRAN 90 coding

10TH CONFERENCE OF AIR QUALITY MODELS 03/13/2012 CCR#16766-1 314
1 standards and documentation. They've done an excellent
2 job with that.
3 And to recognize Dennis McNally on the
4 MMIFSTAT development.
5 All of the people who have provided
6 testing and funding and then also, you know, from my
7 group back in, you know, back in the Forest Service,
8 you know, the Air Fire Team and Carolina Environmental
9 Programs for their work on, you know, CALMET to NetCDF
10 development.
11 And, I'm done.
12 MR. BRIDGERS: Bret, don't walk away.
13 We have a Q and A session here and since Bret was the
14 only speaker in that session, the chair is yours.
15 AUDIENCE MEMBER: Hi, Bret.
16 MR. ANDERSON: Hey, Patrick.
17 AUDIENCE MEMBER: Patrick McKean with
18 AECOM.
19 I have a general question.
20 The MMIFSTAT program. If you inherit or
21 you generate your own prognostic MET data that's going
22 through a model performance evaluation, it's deemed
23 acceptable, you then have to run through another
24 performance evaluation if you use MMIF just to convert
25 it to CALMET format?

10TH CONFERENCE OF AIR QUALITY MODELS 03/13/2012 CCR#16766-1 315
1 MR. ANDERSON: It would depend.
2 Because again, for example, if you have
3 a continental scale application, you know, you inherit
4 an entire 12 kilometers CONUS application and it was
5 evaluated and, you know, you do a sub-regional
6 evaluation and you find that in certain areas of the
7 country it performs miserably, then answer is probably
8 not. You know, we may have to think twice about that.
9 You know, again, you know, it's not a
10 one size, you know, again, it goes back to it's not a
11 one size fits all approach to that because, you know,
12 when the EPA does its evaluation for its rulemaking, it
13 looks at the macro. And, you know, there may be sub-
14 regions of the country that do better than others and,
15 as a result of that, you know, and since you're, you
16 know, since long range transport applications are
17 typically on order of maybe several hundred to maybe
18 500 to 600 kilometers, you know, on the domain on a
19 site, you know, you're talking about a sub-regional
20 analysis.
21 So, at a minimum, what I would say is,
22 you know, if your -- if the performance evaluation that
23 had been done and has already been documented and if
24 your modeling domain falls within a sub-regional
25 analysis because that's typically what's done is they,

10TH CONFERENCE OF AIR QUALITY MODELS 03/13/2012 CCR#16766-1 316
1 you know, the way that they used to do it for the RPOs
2 was to break the country up into performance zones
3 based upon, you know, the entire RPO or like, you know,
4 in the case of Sunwrap because it went from Canada to
5 Mexico was we had Sunwrap North, Sunwrap South and so,
6 if your modeling domain falls within one of those
7 existing performance zones and you have documented
8 statistics showing that it does okay, then, by all
9 means.
10 But you know, again, the devil is in the
11 detail on those sort of things.
12 AUDIENCE MEMBER: Thanks.
13 MR. ANDERSON: Oh, this is good.
14 AUDIENCE MEMBER: Bob Paine, AECOM.
15 I was wondering what is the limitation
16 to the grid spacing or -- how fine can you go before
17 you cannot trust these numerical weather prediction
18 models and therefore you cannot hope to get the terrain
19 influences?
20 MR. ANDERSON: That's a fair question.
21 I mean, I think, you know, I think, you know, and I'm
22 certainly not an expert on, you know, fine scale
23 applications of numerical weather models, but, you
24 know, you're limited by the resolution of the terrain
25 data sets or, you know, essentially the geophysical

10TH CONFERENCE OF AIR QUALITY MODELS 03/13/2012 CCR#16766-1 317
1 data sets that are going into the model.
2 There have been only a handful of sub-
3 grid scale or sub-kilometer grid scale applications of
4 these models that I've been aware of and so you'll see
5 there was like work that was done by Nelson Seaman and
6 Dave Stalfor up at Penn State University where they
7 were looking at gravity wave formation where they were
8 running W RF at a 440 meters resolution and so, you
9 know, when you get into that environment, you're really
10 talking more about an LES application of it rather than
11 that.
12 You know, I would argue that the, you
13 know, you're going to start running into issues with
14 stability in the model because of the vertical
15 velocity, you know, the vertical velocities that are
16 going to be generated and stuff like that.
17 So, I would think that practically
18 speaking, kilometer would probably be, you know, 1.33
19 kilometers about the farthest that I've seen most
20 people go. You know, that's not a limitation of the
21 model. That's just the limitation of the data set and
22 the time that it takes to run it.
23 AUDIENCE MEMBER: Because one thing that
24 would be for AERMOD applications, we have this problem
25 with the airport or the ASAR station is 50 kilometers

10TH CONFERENCE OF AIR QUALITY MODELS 03/13/2012 CCR#16766-1 318
1 away from the source and therefore you have to figure
2 out, well, could I bypass that limitation by magically
3 taking one of this MMIF profiles? And then I would get
4 away from the fact that I don't have the right surface
5 characteristics at the airport and all that stuff. It
6 would nice, but the limitation is well, if it's in
7 torturous terrain, maybe you cannot trust it.
8 Also, the nice thing about MMIF would be
9 well, I have maybe daily updates to the moisture and
10 other features whereas AERMET only has monthly
11 resolution of those features. So, there's some
12 possible benefits of MMIF if we can trust its, you
13 know, application to AERMOD.
14 MR. ANDERSON: Yeah. And I think that
15 goes back to is the, you know, again, because MMIF
16 really is, you know, just a reformat or whether you
17 call it a BARF program or whatever else. It's, you
18 know, it really is a reformatter of it for whatever
19 modeling system.
20 Obviously, you have to diagnose certain
21 variables, but I think your point is that, you know, it
22 goes back to is the numerical data set sufficient for
23 the application and that, you know, that's really where
24 you get into, you know, you have to do that critical
25 analysis.

10TH CONFERENCE OF AIR QUALITY MODELS 03/13/2012 CCR#16766-1 319
1 I think it's even more important when
2 you're talking about AERMOD because you're talking
3 about, you know, the representative and site specific
4 representativeness in that particular case.
5 AUDIENCE MEMBER: Joe Scire. I have
6 just a couple questions.
7 One is about the statement about not
8 doing horizontal interpolation. I've been reviewing an
9 earlier version of MMIF. Version 1.0. And it seems
10 the way it's construction is that you always do
11 horizontal interpolation of the four MM5 dot points to
12 the crest point.
13 MR. ANDERSON: Correct.
14 AUDIENCE MEMBER: And so, what I'll talk
15 about on Thursday is what the effect is of that
16 interpolation relative to the original MM5 winds.
17 So, it's not exactly a pass through.
18 On the W RF model, the winds are defined
19 the U and V components on opposite sides of the cell,
20 so again, you always have to do some interpolation.
21 So, just to clarify that, it's not
22 really using the exactly the MM5 winds.
23 MR. ANDERSON: I think, and you're
24 absolutely right, Joe, you know, and I think again,
25 it's getting, you know, it's getting from one grid

10TH CONFERENCE OF AIR QUALITY MODELS 03/13/2012 CCR#16766-1 320
1 model, you know, the structure of one grid model
2 whether using Arakawa B or Arakawa C configuration to
3 get it into the appropriate models format.
4 The issue is that the platform was
5 originally designed off of, you know, when I started
6 working on this back in 2007, I started using the MM5
7 CAMX platform and it has the ability to take a 36
8 kilometers data set and output it at a 12 or a four,
9 whatever you specify. That was what I was referring to
10 specifically. Is that design feature has been shut
11 down or shut off in terms of that because, you know,
12 because we just felt that it would be too easy for
13 somebody to try to say hey, I've got a four kilometers
14 data set when I just started with 36 kilometers MM5 so,
15 all I have is a 36 kilometers MM5 interpolated at 4
16 kilometers, which is not appropriate.
17 And so that -- it was a conscious design
18 decision in order to force the discussion onto the
19 suitability of the prognostic data set is basically
20 what it amounted to.
21 AUDIENCE MEMBER: Okay. And I agree
22 about the need for the model evaluation elements of the
23 study. We've been saying that for a long time, many
24 years in fact.
25 But one thing is, on prognostic models,

10TH CONFERENCE OF AIR QUALITY MODELS 03/13/2012 CCR#16766-1 321
1 it's not that MM5 gives you the same mixing height or
2 the same precipitation patterns in each run. It very
3 much depends on the configuration of MM5. And if you
4 think that CALMET has a lot of options, MM5 and WRF
5 have even more options which have an even greater
6 influence on some of those parameters.
7 Every boundary layer scheme in WRF will
8 produce a different boundary layer height -- mixing
9 height.
10 Also, the WRF model, in particular, is
11 very sensitive to the cumulus parameterization scheme.
12 We found, in some cases, WRF over-prediction
13 precipitation by large amounts over the Gulf of Mexico.
14 Four, five, six times the observed.
15 The opposite is true in complex train
16 where the precipitation patterns are often under-
17 predicted. The train enhancement is off and under-
18 predicted by the diagnostic models.
19 So, I think precipitation is a very
20 important parameter to evaluate because even if the
21 winds look okay, when you're looking at air quality
22 related values like sulfur and nitrogen deposition, the
23 precipitation patterns may or may not be adequate.
24 MR. ANDERSON: I don't even have a
25 comment. I would just say that I agree completely with
10TH CONFERENCE OF AIR QUALITY MODELS 03/13/2012 CCR#16766-1 322
1 everything that you've said.
2 You know, those are very good points,
3 you know, it's again, you know, and that underscored
4 the point which is the fact that we need to go back in
5 order for -- this is not ready for PRIME time, yet. We
6 think that it's in a relatively mature stage to get out
7 to the community to start playing with, but I agree
8 completely with you. We need to, you know, if there is
9 a shift, you know, a programmatic shift towards the use
10 of more, you know, more direct use of prognostic data,
11 then we have to be able to evaluate those in a credible
12 manner.
13 So, there are tools out there that, you
14 know, the SIP modeling community use for the evaluation
15 of prognostic, you know, precip and things along that
16 line to compare to the Climate Data Center gridded
17 values and things like that.
18 So, there are those tools out there and
19 we just need to bring those forward into, you know,
20 this suite of packages that could be used, but I
21 completely agree with everything you said, Joe.
22 Oh. We really are done this time.
23 Good.
24 MR. BRIDGERS: I guess that's a good
25 thing and if you want to applause, let's go ahead and

10TH CONFERENCE OF AIR QUALITY MODELS 03/13/2012 CCR#16766-1 323
1 give a round of applause to everybody today. I think
2 that's warranted.
3 Real quick, we're going to start again
4 tomorrow at 8:30. All the people that have the V
5 visitor badges, please remember to return those at the
6 guard station when you leave and I hope everybody has a
7 very nice evening and also, all of the presentations
8 minus two are already available for today on the web.
9 I'll put the other two up here in the next 30 minutes.
10 Thank you.
11 (WHEREUPON, the conference concluded at 5:15 p.m.)
12
13
14
15
16
17
18
19
20
21
22
23
24
25

10TH CONFERENCE OF AIR QUALITY MODELS 03/13/2012 CCR#16766-1 324
1 CAPTION
2
3 The Conference in the matter, on the date, and at the
4 time and place set out on the title page hereof.
5
6 It was requested that the Conference be taken by the
7 reporter and that same be reduced to typewritten form.
8
9
10
11
12
13
14
15
16
17
18
19
20
21
22
23
24
25

10TH CONFERENCE OF AIR QUALITY MODELS 03/13/2012 CCR#16766-1 325
1
2
3
4
5
6
7
8
9
10
11
12
13
14
15
16
17
18
19
20
21
22
23
24
25

10TH CONFERENCE OF AIR QUALITY MODELS 03/13/2012 CCR#16766-1 326
0
09 70:25
1
1 20:7 21:11
48:21 48:22 62:165:15 65:1775:21
1,000 213:11
1,400 38:1
1.0 286:24 288:21
319:9
1.1 76:11
1.14 257:10
1.15 257:16
1.2 61:25
1.3 97:22
1.33 317:18
1.7 168:21
172:5 173:13
1.8 63:2
1:00 145:10
10 34:12 34:13
48:22 89:2114:18 169:23191:22 271:17284:4 296:21299:21
10.23 154:18
10:10 80:10
10:15 64:3
10:30 80:7 80:9
10:32 80:10
100 55:12 62:12
163:1 163:2163:18 163:19164:11 188:12201:12 256:21
10th 3:2 3:6
7:2 14:19 282:25
11 283:15 283:15
11059 65:7
66:13 82:9
11126 75:19
11th 74:19 236:4
12 24:25 25:1
75:1 281:18290:2 290:16307:2 311:17311:23 315:4320:8
12,000 56:19
56:19 58:4
12:02 88:2
12:04 88:2
12:06 88:2
123 66:5
125,000 190:2
126 243:24
248:4 248:7257:5
1-2900 5:17 5:19
13 3:3
136 255:19
14 291:19 291:19
15 120:7 252:22
255:2 291:19313:8
15th 230:16
230:24
16 169:24
16,000 56:20 58:6
17 158:2
180 24:1
1977 186:18
1980 105:14
1981 155:23
1982 161:15
1985 68:9 133:17
1989 128:19
1990 51:23 186:19
1991 120:6 236:15
1992 54:18
95:15 95:25101:3 115:10172:11
1992-1993 257:17
1993 67:25 101:12
186:18 187:16
1994 147:1
1995 284:18
1998 25:3
272:11 273:3281:15
1999 294:11
1-hour 16:9 17:17
21:10 23:7 24:1743:14 44:5 44:1244:22 46:6 46:1046:13 46:1446:17 47:648:1 49:349:23 50:13 51:251:13 58:4 58:1561:12 78:9 78:11
1-minute 63:20
1st 226:25 282:25
295:19
2
2 32:8 60:24
103:17 161:23229:14 245:2245:4 245:4245:5 245:5245:10 245:10246:13 246:13

10TH CONFERENCE OF AIR QUALITY MODELS 03/13/2012 CCR#16766-1 327
247:18 247:25308:24
2.1 89:12
282:24 283:2288:22
2.5 172:22 185:17
192:8
20 100:11
100:11 149:1164:10 296:2
200 97:7 163:1
231:1
2000 60:18
65:24 109:15110:2 110:3135:18
2000...March
84:21
2001 99:22
100:8 107:22107:25 108:12108:13 108:15109:22 110:2110:4 110:9110:14 110:15110:15 111:2115:11 115:17115:21 116:1116:5 116:17116:18 116:20
2002 257:20
2003 15:11 86:7
201:5 230:24
2003...the 82:24
2004 101:5 101:14
2005 15:3 15:18
15:23 45:2 60:2275:11 84:2084:21 89:8 172:6244:9 277:1277:9
2006 88:23
110:2 114:13120:10 237:22
2007 229:5 238:13
262:24 320:6
2008 93:5
108:13 230:10243:17 244:2277:12 310:2
2009 31:13 87:6
90:23 101:5159:1 166:25182:16 208:18229:10 229:22275:20 279:6280:19 280:24282:17 305:17
2010 33:7 33:20
43:9 59:761:23 62:1674:16 88:23188:16 200:17232:15 234:8255:16 256:18
2010a 191:15
206:16
2010b 191:15
206:7 206:14207:6
2011 44:11
74:19 75:775:8 82:9234:6 256:18259:14
2012 3:3 234:22
282:25 296:7
2014 236:4
21 95:16
2121 234:23
23 33:20
23rd 256:1
24 196:20 251:4
252:20
24-hour 33:22
131:1
25 103:17
250 11:18 38:2
25th 90:7
26 252:12
252:15 252:20252:21 259:21
260 38:2
27th 256:1
28 213:18
292 70:25
3
3 60:24 60:24
64:19 73:25103:21 245:4245:5 245:10298:20 298:24
3.1 93:21
3.3 257:17
3.6 97:22
3.9 257:21
3:05 228:3
30 18:13 50:22
50:24 83:6 95:17129:8 257:14323:9
300 97:22 231:1
30-day 74:18
32 59:8 61:24
63:10
3-2 231:11
252:1 253:6
320 235:20
36 306:25

10TH CONFERENCE OF AIR QUALITY MODELS 03/13/2012 CCR#16766-1 328
311:23 320:7320:14 320:15
3D 240:15 285:1
3rd 25:17
4
4 59:8 61:25
101:9 104:20161:23 165:3320:15
4.6 154:18
4:15 271:3
40 66:24 67:4
67:6 67:10 67:1468:12 68:1568:19 68:21138:19 139:8
400 163:1
42 214:6
44 158:5
440 317:8
48 275:14
4th 234:22
5
5 49:13 49:18
49:20 83:6 89:12104:20 114:6165:24 166:2170:22 208:5289:10
5.8 238:25
241:8 241:22242:11 243:1260:16 260:18264:6 284:13
5:15 271:3 323:11
50 52:6 53:13
63:13 76:2 88:1289:12 100:11100:12 101:17
117:19 142:7152:22 240:1240:7 240:11240:12 243:15257:14 317:25
50,000 76:2 76:3
500 50:19 50:19
97:12 188:13191:4 201:13212:12 212:14212:20 213:7240:11 315:18
51 89:1
540 108:1
55 57:20
58 231:1
5L 69:18 70:1
70:9 126:19128:12
6
6 33:6 233:15
6.0 261:6
6.2.1(e 231:17
6.221 241:12
6.4 230:4
230:13 232:23233:16 242:10242:13 242:25243:1 243:2260:15 260:18262:12 264:23284:13 284:24285:2
6.5 172:23
6.x 310:20
60 81:24 112:21
114:18 129:8257:14
600 315:18
6405 81:7 82:15
84:17 85:2
648 83:13
65 66:15 66:19
663 106:10
6L 70:3 70:6
6-series 285:3
6X 285:2
7
7 89:7 174:20
245:2 247:18247:24 271:11308:24
70 222:19
70s 178:13 218:22
75 48:2
75th 90:7
77 256:23
7th 65:24
8
8 31:14 32:3 48:1
48:11 48:13229:12 245:2246:13 247:18247:25 305:19308:24
8:30 4:6 323:4
80 37:9 100:12
100:12 281:17
80s 178:14 218:22
80's 56:9
8th 15:2 33:22
296:12
8-three 278:7
9
9 70:24 77:19
10TH CONFERENCE OF AIR QUALITY MODELS 03/13/2012 CCR#16766-1 329
90 59:20 59:24
62:4 62:6 313:25
911 5:17
911"or 5:20
92 96:16 101:7
101:18 102:13103:14 103:16107:21 108:13108:24 109:17110:6 115:17115:20 115:22158:4
93 256:21
94 256:21
96 57:13
99th 255:17
9th 24:4 31:10
43:1 54:12 74:12121:23 230:7271:17 277:12296:12
A
a...one 123:6
a.m 80:10 80:11
A3D 307:22 308:13
313:4
AB3 146:10
277:1 277:1
AB-3 65:25
ability 129:10
134:5 174:10283:2 296:13296:13 301:7301:24 320:7
able 46:19 54:2
67:7 69:4 74:579:15 91:6 98:12101:4 118:5119:18 121:11122:14 144:17
145:21 201:13219:3 233:20268:15 302:2302:11 322:11
aboard 10:9
abort 75:24
about...
compared 115:9
about...developed
123:3
absence 49:15
absolute 212:16
290:23
absolutely 16:7
138:4 198:2206:22 213:12319:24
accelerating
193:3
acceleration
193:2
accept 92:11
92:13 165:10246:7 266:7274:13
acceptability
277:2
acceptable 207:22
248:14 314:23
acceptance
20:25 21:2308:15 308:20
accepted 308:8
accepting
244:17 304:4
access 42:1
195:16 200:18264:7 267:24300:21
accessed 312:5
accessible 268:4
accident 267:10
accommodations
185:8
accompanies 272:2
accomplished
185:4
accordance
245:1 308:13313:6
according 60:5
280:12
account 23:8
43:12 45:22 46:369:22 70:4 71:1082:12 111:16113:3 123:21125:10 125:17129:5 134:5152:21 176:23183:4 183:16209:9 218:2238:20 263:15263:23
accounted 144:7
163:6
accounting
292:6 292:8
accounts 112:25
269:20
accuracy 248:13
277:17 277:21
accurate 146:22
177:2 242:16243:3
accurately 154:12
184:16
achieve 62:12
achieved 213:3
achieving 15:16

10TH CONFERENCE OF AIR QUALITY MODELS 03/13/2012 CCR#16766-1 330
acknowledge
9:19 39:874:13 79:2080:20 144:8157:10 262:6313:12
acknowledged
148:23 229:16
acknowledgements
313:8 313:11
acknowledges
130:5
acquire 268:2
268:10
acquired 268:11
across 6:6 7:11
10:16 11:3 12:2516:16 20:426:9 28:14 33:2547:18 94:19100:22 103:24176:1 248:4257:16 275:13
act 7:8 7:8
8:18 27:6 66:567:5 186:19198:12 213:2221:18 234:13234:14 235:20248:4 248:7
action 32:11
34:16 36:1036:16 39:6 41:22105:7 217:4234:14 256:7
actions 31:9 31:9
39:20 41:23
active 18:6 23:16
activities
11:12 166:7167:18
activity 24:9
26:3 32:15192:16 193:1193:3 295:12
actual 32:14 36:4
36:4 43:1763:5 126:25129:5 131:25140:6 159:12
actually 5:18
9:10 15:823:23 24:425:8 26:22 27:2228:25 29:22 32:432:15 32:1833:11 33:18 34:236:6 37:11 37:2141:5 45:2 48:448:25 53:456:7 56:20 56:2357:2 59:461:11 61:1362:25 63:4 63:1263:15 65:2165:25 67:17 68:168:7 68:10 68:1769:11 71:1476:20 79:2583:15 83:2385:24 89:1791:19 91:2093:20 94:2 97:1497:25 98:1098:11 98:1298:20 99:22100:20 101:8102:7 102:12102:25 103:3104:9 104:17105:17 106:10106:15 107:12108:10 109:3109:25 110:17112:8 113:4114:13 115:12115:21 116:6
116:8 116:25117:4 118:3118:8 118:19119:9 122:9122:14 123:20125:4 125:13125:24 126:24127:10 129:9129:23 130:14132:6 136:24138:22 139:1140:22 147:11147:13 148:3151:17 151:21152:10 152:10153:15 154:16154:21 155:11160:20 162:1177:14 181:5181:11 181:13182:15 182:22182:25 183:1183:4 184:13185:7 197:24200:21 203:8203:11 213:25220:20 220:21228:6 231:13232:15 234:7241:2 244:15247:1 247:9247:18 247:23248:16 248:17251:6 251:18252:14 255:1255:3 256:8258:6 258:9266:2 270:6270:7 270:10281:5 301:23302:15
actually...if
118:16
actually...so
124:22

10TH CONFERENCE OF AIR QUALITY MODELS 03/13/2012 CCR#16766-1 331
actually...the
107:11 109:2
actually...this
103:18
actually...you
119:16
AD3 277:9 282:6
310:1
add 12:18 14:17
39:1 53:1360:8 76:1779:4 79:6100:1 175:18198:9 217:25227:1 310:15310:21 311:1
added 34:15 64:25
76:8 77:14120:17 126:16192:13 206:17284:3
adding 73:25
76:21 79:779:8 170:19190:4 190:20
addition 36:2
41:22 72:2076:13 121:6133:10 227:4
additional
18:14 30:636:3 36:5 44:644:11 140:24153:7 164:4166:15 173:25195:18 255:12269:25 280:1280:2 284:10292:24 293:11310:13
additionally
239:22
additions 41:19
address 12:2 13:4
16:12 21:623:4 39:2444:3 59:11 70:1873:3 119:19120:13 121:2121:25 127:20132:22 141:15143:6 178:2178:5 184:21201:22 209:2209:14 209:18217:3 217:7224:2 227:19233:21 233:23235:13 238:12239:2 239:4244:2 262:7294:22 306:3306:4
address...grand
133:22
addressed 16:23
45:23 143:3143:19 182:9229:13 238:21243:16 246:12250:24 251:25264:21
addresses
116:23 117:8117:10 248:8258:5
addressing
15:14 21:1943:20 45:18203:6 212:3234:2 262:13263:16
adequacy 232:22
277:6 308:1
adequate 68:2
143:11 255:6
321:23
adequately
31:20 60:7202:12 249:5308:3
adjacent 170:5
170:12 170:23172:23 191:12214:15 215:10
adjust 161:25
184:11 217:14273:21
adjusted 64:21
104:14 160:1
Adjusting 184:21
adjustment 159:24
183:23 184:1214:3 216:25
adjustments 104:9
115:20 117:7122:15 179:15185:1
Administration
186:22 186:23198:14
administrative
13:24 234:10
ado 6:22
adopted 210:9
adoption 57:12
239:24
advance 175:5
272:12 281:24
advanced 74:8
92:16
advancements
260:20
advances 274:22
275:15
advantage

10TH CONFERENCE OF AIR QUALITY MODELS 03/13/2012 CCR#16766-1 332
303:17 303:23304:5
advent 56:4
advisement 211:22
AECOM 133:7
260:13 314:18316:14
AER 230:5
AERCOR 286:4
286:5
aerial 98:7 98:11
102:25 103:5122:8 291:8
AERLINE 144:20
AERMAP 72:18 75:2
76:8 77:21 78:2478:25 93:11119:5
AERMET 64:15
73:11 81:8 81:1482:2 82:1184:4 85:687:19 88:16 93:393:11 93:24 94:194:14 104:25109:13 121:15142:9 159:1159:22 160:6160:12 161:4161:19 161:19161:20 161:21163:9 163:11163:24 164:6164:7 164:13200:4 200:5285:25 286:2286:8 318:10
AERMIC 71:7 112:2
112:8 119:25120:4 120:4120:9 120:18121:7 121:23122:4 122:13
123:3 123:11125:24 126:18136:3 159:4159:4
AERMINUTE 19:22
61:11 61:18 62:762:22 63:7 64:2080:15 80:1780:18 81:481:9 81:10 81:1984:4 84:1585:1 86:13 86:1486:15 86:24 87:187:3 87:22 88:1588:22 88:2488:25 89:189:3 89:10 89:1189:13 89:1889:23 89:24 91:191:20 135:23
AERMOD 15:5
15:8 16:317:11 19:1019:23 21:8 21:1224:15 31:1232:15 32:1634:15 36:13 37:639:6 43:1145:2 45:19 45:2146:4 46:748:19 49:1 54:2255:1 55:855:11 55:21 57:257:23 58:1458:18 61:1261:12 64:165:6 65:865:11 66:1 66:1070:23 71:9 72:1272:22 73:174:8 75:275:14 77:2179:11 80:21 82:282:10 92:1092:10 92:17
92:24 93:6 93:1193:19 94:22105:8 120:7120:12 121:25122:5 122:22123:7 123:8125:9 125:12125:14 129:18135:17 135:20141:6 142:9143:3 143:4145:5 145:10146:1 146:8146:21 147:15149:22 150:1153:4 153:4153:19 153:21154:23 155:4156:25 157:16157:24 158:7158:23 159:1161:20 161:21161:21 161:22163:11 164:25169:15 170:3176:20 183:24185:8 192:12193:22 193:23194:8 194:10194:14 194:20195:11 197:6198:1 198:20198:24 200:22207:24 210:7221:4 221:11221:25 222:7223:6 225:14239:24 240:1240:25 241:4241:18 244:7246:6 247:6247:7 248:13248:23 249:6249:8 249:10250:14 250:14251:6 251:11

10TH CONFERENCE OF AIR QUALITY MODELS 03/13/2012 CCR#16766-1 333
251:19 253:8253:9 253:14253:16 254:4254:11 254:12255:2 255:8256:19 257:9257:13 257:17258:3 258:10265:6 265:20266:23 268:24269:22 282:21285:21 286:10295:10 295:20317:24 318:13319:2
AERMOD's 57:19
120:11 254:23
aerosol 242:22
AERSCREEN 44:25
45:3 74:1475:8 75:10 75:1375:14 75:1675:23 76:3 76:1577:1 77:777:10 77:1177:13 77:1577:23 77:2377:24 78:178:6 78:878:13 79:1 79:1579:18 79:22 93:3
AERSCREEN.OUT
77:4
AERSCREEN's 75:5
AERSCREN 74:11
AERSURFACE
19:21 32:25 91:492:1 93:1 93:593:8 93:993:12 93:2293:25 94:6 95:1495:23 96:6 96:2398:2 99:299:14 102:9
105:9 105:21105:22 106:3108:13 109:3110:6 111:25112:15 117:25118:2 118:5118:11 139:21
AERSURFACE...I
94:10
affect 58:16
107:3 206:11293:6
affected 196:6
213:4 232:11266:17
affirmative
232:10
afford 261:22
afoot 22:15
afternoon 6:20
51:7 144:15145:25 175:9197:24 210:20219:17
afternoon's
185:12
afterwards 12:16
against 153:4
182:24 243:24248:4 248:17264:13 293:13297:5 297:15
agencies 10:21
11:4 13:116:16 17:117:3 42:998:16 189:12189:12 205:25207:22 208:17303:25 304:2312:19
agency 3:1
10:20 24:626:3 28:16 28:2330:18 35:18142:12 148:14167:2 167:3174:21 185:15216:24 217:6229:3 232:24233:22 235:23237:8 262:14268:14 268:14
agenda 4:18
10:7 11:9 20:4
agglomerate
181:13
agglomeration
183:14
aggregation
283:12
ago 8:5 9:24
29:21 37:13157:10 166:11167:1 213:18214:21 220:2263:4
ago...so 143:5
agreed 35:22
36:10 224:20241:22 244:18
agreement 72:3
115:17 117:5155:1 156:2247:4 258:10288:17
agriculture
18:2 178:21
Ahammad 204:16
ahead 4:6 4:15
28:25 30:2030:21 31:880:5 80:680:13 80:17

10TH CONFERENCE OF AIR QUALITY MODELS 03/13/2012 CCR#16766-1 334
146:4 156:8201:21 313:9322:25
aimed 16:14
air 3:2 3:6 4:3
7:3 7:4 7:8 7:127:20 8:16 8:188:18 9:1 9:4 9:513:24 16:1 17:1919:18 27:2027:25 40:2040:23 41:13 66:567:5 70:22 72:1374:7 92:4 92:592:7 92:13 104:6117:9 142:7142:11 146:9150:6 152:8158:19 175:21177:2 177:23178:18 179:22180:22 184:14186:2 186:19189:4 189:12189:14 191:1191:5 192:2192:5 193:7193:10 193:11193:14 193:19193:21 195:2195:21 196:1196:8 196:13196:14 198:11200:17 205:25206:11 207:3213:2 217:18221:17 232:4233:7 234:13234:14 235:20239:13 239:21248:3 248:7252:24 253:1259:14 271:12276:12 277:16277:20 277:22
284:17 285:25287:4 293:9298:22 302:22310:8 310:12314:8 321:21
air-cooled 152:15
aircraft 135:2
Airline 144:22
airport 47:15
54:17 54:2156:22 57:6 57:2159:12 59:1359:15 61:2062:20 64:6 95:2495:24 96:1897:22 98:1498:23 99:4 99:1399:15 99:1599:16 99:19101:11 103:3103:14 107:3114:7 115:15116:3 117:3119:3 119:4122:6 228:10317:25 318:5
airports 54:20
56:14 99:12
AISI 185:5
AIWG 89:21 89:22
Al 17:12
Alabama 59:4
61:23 80:23
Alan 80:22 81:1
128:18 259:1
Alaska 284:6
Albany 103:2
106:1 106:3
albedo 92:18 94:4
94:16 95:195:5 95:10
Alcoa 35:11
147:19 148:1149:11 152:10
algorithm 34:15
34:20 35:3 123:8134:22 138:3149:17 150:10171:20 173:2254:1 265:15266:9 266:11
algorithms 55:2
92:17 138:5139:2
align 20:10
alike 89:17
alleged 234:8
Allegheny 134:25
alleviate 13:6
141:18
allow 64:11 64:15
69:3 72:14118:21 182:3232:24 306:9310:15
allowables 256:24
allowed 74:17
allowing 78:22
allows 14:2
19:9 223:21300:11 301:9303:2
Alpine 296:22
299:20
already 9:23 15:6
21:23 25:2130:10 33:11 39:239:13 54:667:2 150:3155:21 177:3177:18 182:8238:21 282:16

10TH CONFERENCE OF AIR QUALITY MODELS 03/13/2012 CCR#16766-1 335
294:20 295:11295:18 309:17309:18 309:19310:23 315:23323:8
also...I 90:1
alternate 170:5
170:12 170:24
alternative 34:15
60:7 61:1 62:964:6 112:9 123:3132:12 132:16132:18 165:11202:22 231:3231:11 233:18244:11 245:7309:14
alternatively
288:12
alternatives
218:2
am 3:7 4:3 6:12
7:3 7:4 7:511:21 12:413:9 13:10 13:2013:25 14:4 23:2224:21 26:1435:18 38:18 39:252:13 54:1562:14 67:4 80:1380:16 80:1786:25 98:16112:24 114:7115:7 119:1122:6 123:5132:20 133:18137:9 139:9140:5 142:18143:9 145:3228:6
ambient 25:2
27:25 45:25 48:148:3 48:3 53:1249:20 250:11
250:12 255:13
ambitious 122:17
ameliorate 163:13
American 105:13
177:24 277:14
Amoco 147:12
among 120:23
158:2 207:22
amount 109:8
181:1 189:22190:13 190:22196:17 249:1276:21
amounted 320:20
amounts 321:13
AMS8 259:22
259:23
analyses 18:3
18:24 187:11188:23 193:22195:20 196:5221:11 231:16232:12 237:19250:21 277:20287:9 305:10310:8
analysis 31:15
43:21 47:7 47:2252:2 158:25168:3 169:14170:3 182:23184:16 188:12189:10 189:14189:19 189:20197:15 197:22206:1 212:10215:7 224:20232:17 242:24242:24 245:14251:10 251:13277:23 280:1282:11 288:23
289:12 290:12297:3 297:11297:25 299:23300:15 301:16306:8 307:4308:9 309:8310:6 315:20315:25 318:25
analytical 235:6
analyzed 306:20
analyzing 301:1
ancillary 272:2
Anderson 32:5
271:4 271:6271:8 271:20314:16 315:1316:13 316:20318:14 319:13319:23 321:24
anemometer
86:12 106:24113:10
anemometers
86:8 86:9 158:18
angle 121:21
128:20 130:10130:21
angles 124:24
129:9 129:10
angst 30:22
animation 298:12
Anna 234:18
annex 195:18
announce 207:5
announced 237:15
announcement
228:8
announcements
228:6
annual 30:3

10TH CONFERENCE OF AIR QUALITY MODELS 03/13/2012 CCR#16766-1 336
44:4 46:15 46:1947:6 48:5 48:649:6 50:3 50:450:12 51:1 51:1395:20 190:2200:18 201:11201:14 202:16202:20 203:12222:4 295:8295:9 311:16
annualized 203:3
anomalous 274:16
answer 3:24 52:13
132:25 140:9145:9 202:11207:1 207:23208:2 218:25221:19 243:4315:7
answered 218:17
answers 241:8
anticipate 273:25
anticipation
22:21
anxiously 165:8
anybody 119:22
135:24 199:6228:11 271:9
anyhow 155:15
anymore 222:6
anyone 207:17
anything 3:21
14:14 80:4 80:20124:17 134:2152:13 206:11225:23 253:8292:17
anyway 41:8 55:17
64:5 160:4271:16 288:5290:9 290:11
295:11 313:11
anywhere 67:5
168:20 169:2225:3
AP 214:5
AP-42 184:25
214:12 217:22218:2 218:11221:15
Apes 235:1
API 73:7 157:12
165:7 210:5230:5 230:12230:18 233:4298:20 298:25310:2
app 246:19
apparently
91:11 91:14200:9 210:9
appear 105:16
180:20
appearance 27:23
appeared 131:25
appears 153:10
153:12 269:3287:25
appendix 15:1
15:22 23:2 26:1126:12 39:1840:11 42:342:7 42:18 42:2244:2 44:12 46:2447:14 50:8 52:2253:7 53:853:11 53:2253:22 59:1159:16 60:262:2 63:2164:7 141:21143:6 148:10153:6 153:24
154:4 186:2186:14 189:6193:20 195:1195:25 212:6222:1 223:2227:21 230:25231:7 231:13231:20 231:24232:2 232:9233:12 233:23234:13 235:5236:7 243:14244:5 245:2247:7 252:1253:7 258:15278:8
applause 227:25
270:25 322:25323:1
applicability
44:1 44:1246:9 184:24
applicable 44:5
44:21 188:19203:21 203:24245:13
applicant 28:4
28:21 29:1130:17 143:10307:5 313:1
applicants
45:12 46:19308:9
application
26:6 31:2433:9 34:2135:1 36:2340:2 42:10 52:2453:4 95:1 122:17199:10 202:4203:15 224:18232:6 236:24242:25 247:24255:7 262:1

10TH CONFERENCE OF AIR QUALITY MODELS 03/13/2012 CCR#16766-1 337
275:16 275:17276:9 277:18280:10 306:23307:24 309:3315:3 315:4317:10 318:13318:23
applications 19:1
20:16 21:2528:21 39:2542:13 59:3 59:1865:23 144:10145:10 146:1147:9 198:1202:2 230:1243:14 244:8244:10 244:12245:8 245:11247:18 258:15266:12 276:4276:8 279:12279:23 284:1305:12 311:18315:16 316:23317:3 317:24
applied 34:25
40:12 61:23 65:6123:8 204:10250:14 252:4252:15 254:2293:20
applies 186:9
186:20 298:1304:8 309:2
apply 8:12
51:16 53:2554:25 64:1166:19 131:17142:24 195:25244:25 245:10304:9
applying 55:10
70:18 71:14180:15 197:4
208:5 247:13247:16 253:5263:1
appoint 73:4
appreciate 8:8
10:3 10:812:11 19:7 23:16139:21 218:18245:24 260:25263:11 270:5270:15
approach 20:24
21:5 23:1129:4 31:2444:2 46:10 46:1247:1 54:19 55:10101:21 112:9112:10 125:7157:17 171:6171:25 174:13208:6 246:8247:16 298:21315:11
approached 217:6
approaches
20:17 123:4167:25 168:16236:18
approaching
164:20
appropriate 11:13
19:25 33:23 37:539:7 45:1647:9 48:6 48:848:10 49:349:5 49:849:12 49:1349:15 49:19 50:950:10 50:1451:14 61:1162:11 64:1164:14 70:1175:16 94:25103:4 104:17
109:10 111:22112:13 118:4118:8 130:15136:9 146:23148:14 150:23154:9 155:3155:10 199:7208:24 209:5217:16 231:21232:12 234:3235:5 235:10241:1 245:14248:23 265:23266:16 282:19307:2 307:11308:11 308:16309:23 311:25320:3 320:16
appropriately
134:6 201:19204:10 304:9306:20 306:21
appropriateness
69:18 308:1
approval 149:8
156:4 156:6156:7 186:22189:24 193:25244:13 244:16
approve 28:7
209:4 230:25
approved 147:10
147:18 147:19156:19 217:23218:1 218:7224:22 229:4231:3 231:6233:2 241:7241:21 260:1260:2 260:7260:9 261:25312:19
approving 233:18
April 25:20

10TH CONFERENCE OF AIR QUALITY MODELS 03/13/2012 CCR#16766-1 338
75:7 211:25230:23 237:22
APTI 74:7
AQRV 287:9 310:8
AQRVs 237:6 289:3
aqueous 230:15
242:21
AR 60:19
Arakawa 320:2
320:2
arbitrary 240:11
arc 164:11
archive 60:15
165:8
archived 41:20
60:17
archiving 60:16
arcs 163:2 163:2
Arctic 34:22
area 76:24
81:19 94:2 96:17100:4 100:7100:18 103:2103:7 103:8103:9 103:12104:15 105:1107:17 109:16109:23 110:20111:1 115:25116:2 123:8126:4 150:19160:10 169:11170:6 170:14170:19 173:8173:17 174:17174:22 177:22180:14 181:25183:11 184:17184:23 187:6191:5 191:10192:3 194:21
204:11 205:16205:22 212:21213:4 213:5215:25 216:2218:12 240:13284:5 285:10289:2 289:9289:10 290:6291:9 291:10291:14
areas 5:5 20:1
20:6 73:4 149:10169:7 186:10187:12 191:12191:22 191:23192:8 192:9196:10 205:11205:12 212:11218:1 231:23268:8 281:19284:9 307:16311:18 311:23312:7 315:6
arena 9:17 21:3
aren't 56:1 90:25
104:21 105:23119:11 131:16146:19 199:13253:19
argue 317:12
argued 240:8
argument 312:20
arise 39:25 70:18
arithmetic 103:24
104:4
arm 4:10
arranged 90:18
arrive 64:12
269:13
arrived 74:14
article 260:11
articles 22:14
168:7 168:10
as...you 127:23
ASAR 317:25
ASCII 286:13
301:22 304:24
ASG 238:3
Ashok 160:21
aside 23:19
ASOS 54:17 56:4
56:6 56:1957:1 57:5 57:857:12 57:1857:21 57:25 58:258:5 58:10 58:1258:20 58:2058:22 59:259:6 59:759:14 60:1160:15 60:19 61:361:21 64:1872:15 74:181:5 81:15 91:1591:21 96:22 97:297:7 97:1998:6 114:3 136:9203:22
ASOS's 73:15
aspect 19:19 25:7
31:3 36:8 36:9149:16 209:24267:24 268:13291:24 309:25
aspect...my
139:20
aspects 20:12
31:15 34:5 142:1188:21 197:2206:15 225:17233:17 261:20267:21 279:4
assess 102:23

10TH CONFERENCE OF AIR QUALITY MODELS 03/13/2012 CCR#16766-1 339
214:22
assessment 7:4
34:2 35:23 40:2144:17 69:1570:20 71:15 72:5143:22 201:10209:9 231:9253:13 280:1287:11 287:13293:1 304:20
assessments
16:2 22:840:15 44:20234:1 243:1280:2 287:9304:15 304:18
assign 251:14
assignment 313:18
assist 11:8
93:2 212:3
Assistant 13:23
assisting 174:24
associate 182:25
associated
19:14 26:11138:12 176:7176:10 275:19285:19
Associates 143:16
230:18 233:4
Association
146:10 200:17217:5 259:14
assume 99:17
100:15 109:8116:3 138:5190:22 266:12269:21
assumed 45:16
48:23 123:24169:22 274:17
assuming 46:20
153:14 182:1
assumption 51:3
274:15
assumptions
139:25
Astability 58:5
at...just 138:5
at...you 102:11
Atlanta 71:15
72:4 109:14
atmosphere 8:4
94:15 101:23175:22 175:24178:18
atmospheric 34:19
172:6 242:15301:13 301:17
attachment
153:3 153:6
attainment
167:8 187:3231:8 239:16
attempt 282:6
attempts 20:9
21:3
attend 18:9 22:12
210:13
attendance 22:21
attending 14:22
attention
145:12 185:10211:5 215:19262:10
attracted 181:12
attribution
231:16
audience 38:19
38:23 133:7
133:13 134:7134:25 135:15137:13 137:22139:14 142:5143:15 144:12144:19 198:17199:16 199:25200:20 203:16204:15 204:16206:5 207:15210:3 211:4211:9 212:7213:13 213:25218:15 219:17220:11 220:18222:12 224:5228:9 259:1259:7 260:13261:14 261:24262:18 263:18263:25 265:4266:19 267:2268:18 270:12314:15 314:17316:12 316:14317:23 319:5319:14 320:21
August 74:16
182:16 229:22234:6 243:17280:24
Australia 160:21
authored 155:22
authorities 276:6
authority 26:10
143:11 199:8244:13 245:3307:5 308:17308:21
authors 259:2
automated 54:17
automatically
134:15

10TH CONFERENCE OF AIR QUALITY MODELS 03/13/2012 CCR#16766-1 340
autumn 96:10
96:11 96:14296:7
auxiliary 285:1
availability
278:2
available 29:18
37:14 37:21 49:649:11 50:753:2 59:2460:8 60:20 60:2261:21 61:2292:14 103:1121:3 168:7210:1 221:20223:2 223:20223:22 226:14232:16 241:4245:14 246:22247:23 258:18267:25 273:21275:7 275:11276:17 279:22295:18 302:10302:10 307:8311:17 323:8
avenue 11:11
average 33:25
47:13 47:1758:22 60:1761:10 61:1361:20 64:1264:20 68:11 81:481:9 81:25 85:1187:11 90:9 91:2291:24 91:25 94:2102:5 102:7103:24 104:5106:13 107:6107:8 107:10107:11 108:23111:6 111:10114:21 114:21131:1 162:7
179:16 182:20190:2 192:23201:11 201:13202:21 257:9257:15
average...block
107:5
average...
especially 135:4
averages 81:6
85:18 105:1106:8 107:6136:13 136:24
averaging 34:7
84:25 107:9
avoid 17:7
66:22 67:2 68:1268:18 70:5 128:6138:2 138:18184:22
awaiting 15:4
aware 4:20 14:8
55:9 67:4 71:8220:17 230:4267:7 317:4
away 16:10
45:11 58:1571:12 212:22314:12 318:1318:4
AWMA 18:10
axis 162:25
B
background
33:17 43:1244:16 44:19 46:353:2 146:13150:21 166:7187:23 188:7188:9 188:15189:4 191:6
195:19 195:23196:7 196:15196:16 204:22204:24 205:6205:8 212:15248:18 248:21249:25 250:2250:15 256:5259:23
background...
ozone 90:2
backward 243:1
260:15 260:22
bad 26:23 85:22
85:23 85:24108:22 114:25120:20 220:6258:7
badges 323:5
badly 253:16
Baker 79:21 271:4
313:17
balance 122:21
280:16
ballpark 122:7
122:10
BAMS 105:13
bar 6:21
bare 184:6 184:7
BARF 271:19
318:17
barrier 226:21
barriers 268:5
bars 252:24 253:1
Bart 31:15 32:3
229:13 231:20239:23 242:24275:13 313:22
base 20:16
163:4 164:11

10TH CONFERENCE OF AIR QUALITY MODELS 03/13/2012 CCR#16766-1 341
164:24 275:17285:7
based 47:2 47:5
47:17 48:9 54:1957:22 61:5 61:1061:20 66:2071:13 73:6 75:1475:16 96:9105:15 105:17107:6 108:10108:18 112:9112:11 112:17114:16 125:8126:3 127:2128:11 136:20139:4 169:1172:5 172:6184:3 222:8223:5 238:23247:12 249:9249:11 250:22252:6 252:23253:20 254:5255:5 255:8256:19 256:24257:3 258:9258:10 261:1261:2 261:3281:3 284:4284:16 285:5288:14 294:13297:6 300:4300:6 301:1302:18 308:3309:12 311:15316:3
basic 44:13 92:11
159:22 284:13284:14 299:15299:22 299:23300:16 302:3
basically 22:16
28:6 48:12 76:1181:3 81:1686:9 93:11
95:1 96:13112:25 120:4121:6 126:5136:22 143:12146:18 150:15153:12 161:19164:11 164:18169:17 188:6189:18 200:24244:7 245:6247:14 253:3272:3 272:23273:16 280:7282:17 283:15284:11 284:13286:1 287:15287:17 288:23289:14 293:19293:22 296:23298:23 299:4301:3 301:15301:21 302:1302:20 303:14306:14 306:24309:10 320:19
basics 308:23
basis 9:14 17:4
21:17 51:460:1 67:13 118:9132:17 134:17217:3 224:3225:2 226:9231:2 235:15246:15 248:14
bat 31:13
batch 176:7
176:10
bathroom 228:2
bathrooms 5:6 6:6
6:7
be...could 125:3
be...fix 123:13
beating 221:1
Beaufort 34:22
284:5
became 15:9 33:18
55:9 60:21 162:4230:20 278:11281:13
because...first
124:9
become 7:9 8:7
14:20 84:1286:16 89:16223:22 309:6309:6
becomes 223:2
becoming 7:20
before...for
107:4
begin 15:21 22:16
228:24 309:22309:24
beginning 16:4
57:25 60:18 86:7208:3
behalf 146:9
277:14
behavior 151:20
behind 43:17
253:23 283:22
belabor 53:19
262:5
belief 66:7
225:10
believe 23:15
64:10 69:7 109:9161:10 180:4219:2 220:12223:6 236:2237:25 240:6240:17 242:1242:9 278:13290:4 291:9

10TH CONFERENCE OF AIR QUALITY MODELS 03/13/2012 CCR#16766-1 342
295:18
believes 280:14
benchmark 62:5
247:10
beneficial
11:14 17:7
benefit 9:8
benefits 7:24
174:10 318:12
benefitted
10:11 10:19
Bennett 203:16
besides 126:20
best 8:11 16:18
20:25 100:25166:21 167:19176:20 204:5205:24 207:18210:23 211:19214:5 222:8223:19 234:21252:5 256:19
beta 19:3 74:16
75:18 76:1108:14 110:9117:14 228:21271:23 282:18283:2 294:21295:17 309:11309:16
better 8:4 8:13
8:13 9:3 9:421:24 54:13 72:372:14 99:23107:15 108:24111:2 116:11117:4 117:9130:4 130:21131:1 131:2131:10 131:25132:1 154:1154:4 160:18
160:18 161:11161:24 162:15163:18 163:24165:2 168:4168:12 179:16180:7 184:11185:8 204:11207:1 219:5219:7 219:7227:8 240:22241:3 244:23244:23 247:11247:15 248:12249:5 251:18251:25 252:2252:2 253:8253:9 253:10253:11 253:11253:21 254:23254:23 255:3255:7 258:9259:20 265:18265:20 293:23294:2 298:14303:21 306:9315:14
beyond 11:17
44:13 46:17 52:770:9 70:10108:19 125:4201:24
bias 58:12
106:2 107:13109:9 131:25136:24 250:22251:16 269:4269:11
biased 58:2 58:25
116:4 204:25245:16
biases 184:22
bigger 50:6
56:3 73:16 120:1
biggest 46:15
99:1 124:4
Bill 259:19
binary 286:13
bio 6:4
birds 86:11
Birmingham 59:3
59:5 61:23 62:15
bit 14:1 24:24
25:11 25:1825:21 36:741:2 43:16 43:1843:23 46:558:1 73:10 94:1696:17 99:2199:25 100:8107:14 108:16111:12 115:13115:16 117:23117:23 119:10120:3 130:24131:1 131:5132:17 132:18137:11 141:14147:20 151:2157:15 166:3166:6 169:15170:25 171:5186:6 191:19206:21 209:18212:10 219:8243:12 251:8254:21 257:14280:22 280:23287:10 287:11289:25 296:9297:1
blackout 201:5
blame 235:3
blending 31:21
112:22
Blewitt 277:14
block 152:4

10TH CONFERENCE OF AIR QUALITY MODELS 03/13/2012 CCR#16766-1 343
blowing 136:18
136:19
BLP 135:17
blue 116:16
129:15 160:12251:5 254:12
BlueSky 298:23
299:5
blunt 72:24
blurry 41:3
Board 223:1
Bob 133:7 157:6
165:22 200:2203:21 211:13211:20 214:1220:20 220:25260:13 289:20289:23 290:8290:9 316:14
body 279:8 279:17
bone 95:22
Book 51:24
bookkeeping 87:14
boot 131:22
131:24 132:2251:9 251:13251:13 268:20269:9 270:7
border 248:5
bottom 30:15 34:4
36:20 38:11 42:364:24 151:9179:10 270:1303:3
Boulder 300:25
boundary 58:17
92:16 112:9112:12 112:17113:1 113:2113:5 113:7
113:8 113:13113:17 283:6288:11 292:21321:7 321:8
bounds 152:12
bowen 92:19 94:15
94:17 94:1894:25 95:5 95:10
Bowline 130:12
130:13 131:3
Bowling 101:11
105:18
box 90:6 90:8
100:1
BPIP 73:1 78:1
78:3 121:20123:2 123:16124:3 126:21126:24 127:14127:23 128:8129:19 130:4130:8 131:11132:22 146:14146:21 146:23150:17 151:9152:25 154:22
BPIP...current
130:8
BPIPPRM 35:14
69:20 70:1077:21
bracket 179:11
brake 191:14
brand 189:15
Brashers 313:22
break 6:2 6:5
80:5 80:10 145:6145:14 228:4316:2
breakfast 6:17
breaks 13:19
226:21
breath 133:5
breed 278:2
Breeze 142:6
200:1
Bret 32:4 235:3
271:4 271:6271:20 314:12314:13 314:15
bridge 298:17
bridged 299:8
Bridgers 3:4
4:3 9:24 17:123:21 23:2338:21 38:25 80:280:12 132:24137:12 144:11145:6 145:15157:2 165:22175:2 175:7185:11 197:20199:20 201:16201:21 203:2206:22 207:14227:1 227:23228:5 243:6270:22 314:12322:24
bridges 306:8
brief 74:15 78:21
146:12 146:13156:24 243:20
briefing 5:12
briefly 39:20
74:10 176:15
bring 6:13 6:14
6:15 95:10 157:3216:23 219:22260:20 298:25299:1 299:8299:9 307:6322:19

10TH CONFERENCE OF AIR QUALITY MODELS 03/13/2012 CCR#16766-1 344
bringing 39:5
116:22 145:13
brings 109:11
117:4 282:14
broad 39:25 39:25
255:23
broader 41:17
121:7 122:3223:24 226:23
Brode 9:22
32:24 39:291:2 133:12133:21 134:12135:6 136:2137:20 137:23140:11 142:18143:21 144:21199:3 199:18199:22 201:18201:23 203:7227:12 243:8243:9 259:5260:12 265:24266:23 267:20270:5 270:15270:20
brought 145:4
176:15 203:20259:17 298:13
Bruce 56:8
buck 72:11
budget 178:20
179:13
budgeted 197:25
budgets 187:7
buffer 172:12
bug 19:7 21:6
71:7 73:12 74:2174:22 75:3 76:23122:1 133:14239:1 241:21260:16 261:8
262:7 263:15263:16 263:19295:12 295:12295:20
bugs 71:5 74:18
80:1 117:8238:12 238:20238:22 294:23295:24
build 112:12
113:16 138:2187:20 187:21187:21 187:25187:25
build...already
133:19
building 5:8 5:14
27:15 35:1336:14 65:8 69:2270:3 70:4 70:670:10 78:4 108:5117:4 118:17121:18 121:19121:21 122:14122:25 123:13123:22 123:22124:1 124:6124:8 124:23125:8 125:25126:1 126:3126:4 126:6126:7 126:8126:12 126:14126:15 126:17127:3 127:4127:5 127:7127:11 128:22128:24 128:25129:6 129:7129:12 129:14129:17 130:10130:20 132:5132:10 132:15132:19 133:13138:6 138:19
138:23 146:8146:18 149:19149:20 149:21149:22 150:2150:5 150:11150:12 150:13150:14 150:14150:20 150:22150:23 151:5151:6 151:10151:17 151:18151:23 151:24152:7 152:18154:23 155:6155:8 176:22177:9 177:21178:6 213:6
building...
again 130:6
buildings 69:20
70:8 99:19 99:20100:15 104:1104:4 116:25117:2 118:16118:23 119:11122:9 124:23125:2 128:20130:16 137:18137:18 174:11178:9 178:9266:22
buildings...
including 99:6
built 101:14
101:15 133:19
bulk 164:5 288:14
Bull 159:18
161:14 162:18
bullet 232:9
303:19 309:13
bulletin 75:21
105:13 263:6
bulletins

10TH CONFERENCE OF AIR QUALITY MODELS 03/13/2012 CCR#16766-1 345
241:25 262:22
bull's-eye 62:17
bunch 25:13
26:1 37:737:15 120:17
buoyant 135:17
161:14
burden 275:9
306:16 307:4308:9 311:20
bus 194:17
buses 190:7
but...and 129:2
133:18
but...I 138:24
139:10
but...so 113:12
buy 48:15
bypass 4:23 5:2
318:2
bypassing 247:14
C
Cafe 5:6 6:7 6:12
6:12
cafeteria 6:16
6:19 145:11145:24
CAL3QHC 194:4
CAL3QHCR 194:3
194:14 197:7221:9 221:15221:25
calculate 81:4
82:3 113:7 162:6196:20
calculated
87:24 88:1388:21 173:14192:6 269:5
calculates 292:19
292:20
calculating
192:25 196:19
calculation 73:17
94:16 140:2
calculations
189:5 191:8196:11 197:7242:18
California 191:16
197:4 226:2
calm 55:15
55:15 56:1657:11 58:25 59:860:13 62:2464:22 81:10 82:485:9 87:14 87:2187:24 88:7 88:1489:4 102:3
CALMET 43:3
229:24 247:14263:8 273:6273:18 273:22274:6 274:9274:11 275:5275:9 275:16276:3 276:21277:11 277:17279:15 279:23279:25 280:2280:11 280:14280:19 282:7283:5 284:21286:24 287:17288:4 288:10288:25 289:20291:3 291:12292:4 292:11292:15 292:18293:20 297:8297:9 298:19298:24 299:13299:14 302:5
302:15 303:17304:8 304:10304:10 310:15310:20 312:18314:9 314:25321:4
calms 57:9
57:10 58:2058:22 61:24 63:981:13 81:21 89:189:11
CALPOST 239:2
241:15 241:17
CALPUFF 15:11
16:4 19:1021:7 24:15 31:1231:25 32:343:2 228:20228:25 229:4229:12 229:17229:19 230:3230:11 231:21233:1 236:17237:2 237:23238:7 238:12238:22 240:3240:6 240:13240:20 240:25241:4 242:4242:6 242:10242:10 243:11243:13 243:20243:22 244:5244:9 244:14244:17 244:22245:6 245:11246:6 246:14246:18 246:22246:23 247:8247:13 247:14247:17 248:2248:12 248:22249:5 249:6249:9 249:12251:3 251:5

10TH CONFERENCE OF AIR QUALITY MODELS 03/13/2012 CCR#16766-1 346
251:11 251:17253:10 253:10253:14 253:16253:21 253:24254:2 254:8254:8 254:11254:12 254:13254:14 254:20254:23 255:7257:3 257:7257:10 257:17258:3 258:10258:14 258:17259:3 260:1260:2 260:15260:21 262:23264:2 265:5265:25 266:5266:7 268:24269:22 273:5275:6 279:12279:15 279:24282:20 284:11284:22 285:2288:23 291:20293:19
CALPUFF's 241:12
CALTECH 242:22
campus 5:4 5:8
5:16 5:17 6:9
CAMX 294:18
294:18 320:7
Canada 204:17
316:4
candidate
161:18 307:10308:19
canopy 110:18
110:18 116:17116:21 116:22
capabilities
235:13 236:20278:11 301:22
311:3
capability
77:14 284:9293:25 301:19
capable 274:15
capacity 6:20
Cape 147:12
capture 62:4
captures 64:24
307:12
carbon 187:12
care 56:14
87:19 127:13
career 213:23
careful 98:15
201:25
carefully 141:8
162:3
cares 56:15
Carolina 3:5
7:1 14:19 25:128:13 96:16314:8
carried 161:12
193:6
Carrington 159:15
carry 192:12
carrying 56:1
case 27:22
28:17 28:24 33:433:11 35:1235:14 38:1238:13 38:1338:19 38:2146:21 51:1051:16 53:25 58:359:4 65:16126:14 136:4136:5 136:13137:5 149:15
151:1 151:15153:24 156:17179:5 195:4222:17 223:23225:21 246:2246:11 264:5265:19 298:3316:4 319:4
case-by-case 17:4
211:18 217:3224:3 224:12225:2 226:9231:2 244:11246:15
cases 40:4
51:19 67:2270:19 90:4 95:11106:5 124:2136:17 140:5140:17 146:14150:17 150:21152:2 168:22169:4 169:10173:7 212:23225:2 240:22264:9 264:15264:16 264:21265:18 321:12
cases...
sensitivity
117:10
catch 228:15
categories 49:9
95:17 96:196:1 96:896:19 100:2100:9 100:24102:18 102:21103:23 103:24104:3 104:3104:18
categories...
low 104:10

10TH CONFERENCE OF AIR QUALITY MODELS 03/13/2012 CCR#16766-1 347
categories...
the 104:19
category 47:2
96:5 96:2099:3 99:9100:4 100:5100:21 107:23131:8 201:2
Catizone 218:15
cause 53:9 70:6
182:13 187:1187:13 199:6
cautioned 48:7
caveat 34:3 36:20
55:3
cavity 125:1
125:2 125:18
ceilometer 56:17
cell 285:24
319:19
cells 118:22
cement 289:17
center 97:1
117:11 128:24128:25 129:11129:12 130:6301:12 322:16
centered 94:21
certain 31:15
42:15 95:1998:23 139:24144:4 201:1245:8 266:21279:4 303:23315:6 318:20
certainly 40:24
43:15 46:21 49:550:5 61:1762:5 66:767:12 71:495:3 105:6
110:13 111:4117:25 129:19139:13 139:16142:20 144:7163:3 165:10194:14 195:22199:5 199:11201:25 231:25266:15 316:22
cetera 177:9
cetera...just
88:3
CH2M 203:17
chair 314:14
chaired 80:22
challenge 8:6
21:17
challenges 8:15
8:21 12:13 12:2113:6 13:9 14:814:24 15:14 16:520:7 21:1523:5 36:12152:25 177:2
challenging
12:2 12:19 93:18
champions 20:25
change 9:1
22:15 40:1746:16 62:2 65:1766:12 75:2179:17 86:25 94:5107:4 107:20111:13 121:24124:20 132:20154:3 155:11156:14 162:17162:19 164:13166:3 233:12241:25 243:9252:19 262:22263:6 291:1
change...for
133:16
change...removing
111:5
changed 76:6 94:7
110:13 114:11114:15 143:7148:17 148:17158:19 198:25223:3 265:19266:14 271:21
changes 7:18 16:8
16:10 17:1772:16 72:1973:19 74:1975:18 78:5102:16 104:21105:20 105:25112:25 113:1113:2 122:11132:5 142:4163:8 163:10165:10 199:9199:13 206:8206:10 207:9207:10 212:5229:8 262:23263:8 310:18
changing 79:10
134:2 141:9158:17 161:20161:21 161:21161:22 265:10
character 75:1
203:8
characteristics
78:18 78:1992:23 93:2 95:2196:6 113:4120:24 143:24177:17 318:5
characteristics..
.the 92:18

10TH CONFERENCE OF AIR QUALITY MODELS 03/13/2012 CCR#16766-1 348
characterization
149:7 168:14173:19 214:7217:16
characterizations
132:16
characterize
166:11 166:21167:10 167:19171:1 172:2175:14 192:22193:8 193:15204:6
characterizes
306:21
characterizing
171:16 205:8237:5
characters 82:25
charge 181:1
204:4
charged 304:3
chart 88:23
Chat 175:4 209:14
213:16 214:2218:22 219:23219:24 220:4220:13
check 85:16 85:18
86:1 89:15196:25 197:12197:17 205:13206:2 222:18270:11 270:17287:1 287:16
checking 77:5
checks 78:1
88:4 128:3
chemical 47:3
182:23 205:11242:19
chemistry 17:25
23:8 43:24 45:22230:14 230:15231:6 232:24233:8 233:23242:15 242:23262:14
Chen 228:12
Chet 6:23 7:3
15:20 23:5 23:1740:21 40:22234:17
Chicago 30:2
180:14
child 59:6
choices 276:1
choose 265:12
265:24
Chris 10:1 10:9
206:19 206:20206:25 207:2207:14 313:22
Christian 230:5
Chukchi 34:22
284:5
chunking 221:8
Cimorelli 17:12
Cincinnati 220:19
circle 53:12
circulations
246:16
circumstance
201:6
circumstances
139:17 202:24252:13
circumvented
28:10 28:17
cites 67:25
Claggett 221:9
claim 253:21
claimed 248:11
248:22
clarification
21:9 27:1430:8 34:23 39:1239:15 39:1839:21 41:25 42:442:5 42:15 42:2442:25 44:1151:20 54:9 54:1054:12 55:4 59:1065:2 75:7 133:23134:13 143:4200:24 201:24229:24 243:17244:1 245:21280:25
clarifications
30:7 80:4 202:10
clarified 40:9
40:18 44:1 47:1247:20
clarify 42:19
53:21 55:4 55:25166:19 230:21319:21
clarifying
44:23 46:7 46:23
clarity 5:1
class 25:14 56:24
89:9 231:23239:20 240:13284:16 284:20291:9 307:16
classes 276:20
292:19
classified
103:3 149:6
clean 7:7 8:18
37:18 66:5

10TH CONFERENCE OF AIR QUALITY MODELS 03/13/2012 CCR#16766-1 349
67:5 71:172:13 84:1117:22 186:18198:11 213:2221:17 234:13234:14 235:20248:3 248:7
cleaning 178:17
313:24
clear 56:19
58:4 58:1569:8 70:796:18 107:18111:9 114:4114:15 131:21137:11 138:21139:7 189:17199:13 230:21230:23 231:5231:23 238:5238:17 256:11266:6
clearinghouse
9:25 16:2017:2 23:1524:7 24:924:12 25:16 26:127:5 27:18 28:2429:16 30:12 31:932:14 33:1334:10 34:1636:10 38:17 39:640:2 41:23 42:23101:9 105:7132:14 148:14149:11 156:1202:2 202:6225:3 225:9229:11 286:7305:17
clearly 61:4
105:19 114:9119:4 138:4146:14 146:23150:18 151:19
152:10 152:16155:13 163:17258:4
click 98:7 98:8
Climate 322:16
Climatic 97:1
clocks 4:8
close 11:2 37:2
109:17 113:13120:8 127:11127:11 128:4212:23
closely 26:11
28:1 193:18196:12 198:10229:23 245:20257:23 270:9
closer 11:6 96:17
124:1 131:5131:9 138:8251:18 254:22
cloud 56:6
57:24 73:1473:15 160:17182:10 182:11285:1
clouds 57:21
57:22
Club 23:12
234:5 234:22
CMAQ 182:20
184:10 294:18
CMAS 120:5 230:6
co 83:4 89:20
172:11 187:16222:5
COARE 34:14
coast 108:8 108:8
coastal 240:23
240:24
coating 81:14
co-chair 120:15
174:20
code 57:14
81:17 81:2190:16 140:7165:7 241:7241:9 262:25264:22 294:20295:17 310:18
codified 239:14
coding 313:24
313:25
coffee 6:17
coherent 158:10
162:7 162:8291:4
collaborate
33:3 159:3
collaborated
17:18
collaboration
11:3 153:25237:8
collaborations
11:13 17:22212:2
collaborative
15:25 16:14147:3 156:1156:9 177:25178:25 180:12180:12 209:22216:12 236:13268:9 268:17
colleague 206:19
collect 64:7
153:19 180:8182:22 277:7296:1
collected 94:13

10TH CONFERENCE OF AIR QUALITY MODELS 03/13/2012 CCR#16766-1 350
153:16 218:24218:25 250:11256:20
collective 279:7
collocated 138:6
co-located 123:24
Colorado 159:18
197:11 300:25307:1
Columbia 255:14
256:9
column 86:3
columns 83:4
83:19
columns...the
102:6
combination
301:10
combine 44:18
73:1 196:13
combined 45:24
126:21 126:23127:6 127:7127:12 127:15127:15 127:17127:25 128:2130:18 158:10
combining 130:19
come...were
123:15
comes 7:22 8:6
9:10 30:1534:8 60:24105:11 201:7
comfort 229:9
comfortable 58:14
217:2 312:24
coming 4:21 7:2
16:8 23:1724:1 29:25
113:11 121:19135:23 145:9199:23 206:7208:12 227:4236:23 268:22295:12
Command 301:11
commended 259:5
comment 74:17
74:18 104:8133:15 135:2148:8 207:17207:19 208:21210:2 210:10210:17 219:24224:7 227:12232:2 233:13233:14 237:14237:17 245:24264:1 265:4293:15 321:25
commented 103:22
comments 19:6
19:15 74:18133:8 139:15166:13 173:24201:17 202:1208:10 208:22208:23 209:20218:19 233:16237:18 242:7250:25 260:12270:5 276:25280:8 282:5296:11
commercial 96:4
99:2 99:6 104:11107:24 275:6
commission
86:12 86:1886:22 87:5 87:1687:21 89:7 90:22114:12
commitment
12:15 23:10
committee 41:17
41:17 65:25120:5 120:14146:10 277:1
common 5:5 91:3
142:12 195:4292:16
communicate 18:17
communicated
207:23
communication
11:2 11:11 28:19212:2
communications
220:6
community 9:13
10:3 10:2412:1 12:20 16:1718:5 18:18 19:2020:5 20:18 20:1920:24 22:222:2 22:20 30:2437:3 74:2277:2 101:16173:25 199:6208:22 211:2211:14 211:22216:4 217:9223:17 225:10226:15 232:19234:4 235:24235:25 237:11241:5 244:4267:6 268:1271:14 278:3279:10 279:11279:13 279:16279:21 280:5281:9 282:4291:21 291:25294:24 295:14295:15 297:2
10TH CONFERENCE OF AIR QUALITY MODELS 03/13/2012 CCR#16766-1 351
297:22 300:4300:8 300:22302:8 303:24304:17 305:4306:5 307:15307:19 308:8309:12 309:16309:17 310:5311:10 322:7322:14
COMP 85:12
company 180:13
204:17 209:13209:25
comparable 173:18
293:23
compare 18:8 47:9
78:17 85:1 85:12102:20 102:21105:20 116:11129:1 137:6250:22 322:16
compared 66:25
106:3 108:13114:20 153:4187:23 281:14291:5
compares 115:7
comparing 57:20
114:24 250:16256:10 286:24
comparison
85:14 97:20153:17 153:18154:2 252:23267:13 287:17290:1 297:25
comparisons 84:25
114:16 136:17141:1 153:5256:9 257:22258:8
compatible
243:1 260:16260:22 284:12284:23 310:19
compelled 280:9
compile 49:7
226:3 295:24
compiled 98:17
268:3
complacency 278:2
complaining
241:18
complete 38:7
99:8 235:21272:21
completed 45:4
completely
52:22 69:697:3 101:15140:22 291:24321:25 322:8322:21
completeness
55:13 59:1159:19 59:21 62:362:6 62:12
completing 189:10
complex 43:23
70:17 74:23 99:5112:6 124:21137:24 178:7178:10 221:4231:4 240:4240:5 240:7240:9 240:23244:12 244:17244:22 245:1245:23 246:1246:3 246:13246:19 246:25247:5 247:21248:24 278:16309:1 311:21
321:15
complex...
anything 138:10
complexities
93:16
complexities...
they 118:24
complexity 138:11
222:5 273:14
compliance 23:6
33:8 45:13 45:1445:15 46:19 51:452:2 178:3184:16
complicated 34:18
50:16 78:4115:14 143:23
complication
175:19
complications
137:2 178:5
component 7:15
43:13 162:9188:10 278:9295:20 296:20299:17 300:15300:19 304:19307:23
components 296:18
302:12 319:19
composition
181:10
compost 145:12
comprehensive
293:12
computer 274:9
computes 158:7
concentration
53:10 53:2366:24 67:10
10TH CONFERENCE OF AIR QUALITY MODELS 03/13/2012 CCR#16766-1 352
67:15 71:2376:25 77:877:9 77:17 78:1289:19 90:2129:16 131:17136:21 140:3143:19 157:19162:6 163:25204:23 212:14245:24 252:11259:19 269:14
concentrations
33:17 33:2544:19 45:25 50:153:2 58:10 65:1366:23 67:367:3 68:13 68:1969:9 70:871:17 82:395:4 95:8124:9 129:17138:1 138:2138:18 151:13161:11 163:3170:11 170:13170:16 170:20170:21 170:24173:20 187:22191:5 191:7195:15 195:19195:23 196:8196:15 205:6222:4 222:4240:25 241:2250:8 250:16254:15 257:24307:13
concept 212:22
239:18 259:20273:9 281:14
concern 51:20
52:18 59:1 72:1082:7 121:23122:24 139:22140:10 140:12
157:14 218:13250:20 289:2289:5
concerned 53:20
132:7 278:19
concerning 236:24
concerns 13:12
44:6 56:656:11 56:1763:17 63:18105:3 120:19121:14 121:18125:7 125:10132:22 167:4175:11 200:8232:22 250:9250:23 261:5306:4 306:7307:25
concert 272:18
conclude 269:17
concluded 66:10
161:3 269:7270:2 323:11
concludes 165:21
conclusion 153:23
171:18 244:3254:6 269:13293:22
conclusions 154:2
155:12 256:13268:23 293:1
concur 198:12
concurred 31:17
31:21 33:1569:14
concurrence 32:19
33:16 308:16
condemnation
304:10
condenser 152:15
condition 50:20
51:11 141:2159:15
conditions 48:5
56:15 82:695:5 95:995:22 121:10125:21 130:23140:15 140:20153:14 154:10157:25 158:23161:6 161:17162:19 162:21162:23 163:14182:9 183:13200:3 273:20274:3
conduct 140:16
147:5
conducted 147:7
147:17 168:3210:5 259:6288:20
conducting 22:7
148:19 148:21155:20 156:9268:5
confer 231:24
conference 3:2
3:6 3:12 3:143:20 7:3 7:6 7:77:13 7:21 9:89:12 9:18 9:2210:4 10:1811:8 11:12 11:1711:19 11:2512:14 13:2514:14 14:20 15:215:3 15:2018:7 18:1019:5 20:22 22:1622:18 23:20 24:529:25 31:10 33:939:14 39:22 42:7
10TH CONFERENCE OF AIR QUALITY MODELS 03/13/2012 CCR#16766-1 353
42:12 43:2 54:1265:24 70:2474:12 121:23123:15 125:6141:20 157:9157:23 186:4208:21 209:20210:16 211:23215:16 223:13229:1 230:7230:8 235:22236:4 236:4239:15 271:18277:13 283:1296:12 323:11
conferences
12:4 22:10 22:1022:11 22:12
conferred 80:6
confidence
20:15 21:19131:23 251:14251:15 251:20251:23 253:18254:24 304:6304:13 311:11
confident 12:4
221:10 222:7309:4
configuration
181:21 320:2321:3
configure
223:15 280:19
confine 242:5
confined 158:25
175:23 191:6
confirms 108:21
253:7
conform 52:21
conformance 223:7
conformity
17:20 185:22186:7 186:9186:17 186:20186:23 187:5187:11 187:19187:20 188:18194:24 197:2197:22 213:2217:25 221:11
confused 34:6
confusing 270:19
confusion 4:21
231:19 270:13270:20
conglomeration
181:9 182:11
congratulate
209:25
connected 25:10
160:9
Connors 157:11
conscientious
4:16
conscious 320:17
consensus 27:15
consequence 287:9
288:22
conservatism
81:20
conservative
68:17 78:11
conserves 126:5
consider 44:18
56:12 78:16145:3 202:21205:14 205:15205:18 208:23211:14 215:24217:14 242:25
considerable
275:2
consideration
210:18 210:22274:21 281:22300:1 303:24
considered
42:16 62:9 62:2464:22 87:16 88:688:20 89:6 93:10148:13 202:12203:24 207:11207:21 244:11246:14 262:12266:8 274:7
considering
127:18 172:20204:2 215:14236:11
consist 286:22
consisted 171:2
consistency
26:4 26:14 39:1940:10 40:11 42:942:10 42:24114:22 114:23115:6 167:12277:6 304:7311:11
consistent 26:9
47:18 65:1067:18 104:5106:18 112:20193:19 196:13231:12 245:4247:17 253:3283:13 286:5294:15 294:17311:10
consists 171:15
constant 90:2
constantly 182:2
constrained 211:3

10TH CONFERENCE OF AIR QUALITY MODELS 03/13/2012 CCR#16766-1 354
298:15
constraint 300:1
constraints
235:17 303:12
construct 288:18
construction
178:22 191:18192:9 192:10273:15 319:10
Consultants 142:6
200:1 212:8268:19
consultation
26:12 30:1630:17 35:2036:24 213:10224:2 245:3
consulted 69:13
contact 28:11
38:17
contacts 41:9
41:13
contain 171:19
285:1
contained 216:4
contents 256:24
context 21:13
25:22 40:144:3 44:750:16 137:9141:16 223:13224:25 236:25262:15
contexts 27:11
continental 34:12
281:18 284:1315:3
contingent 308:16
continual 19:25
21:1
continue 9:1
9:7 9:14 11:1012:15 18:9 18:1921:14 33:24 74:2120:12 211:25238:8 262:15295:22 295:24
continued 11:2
11:16 17:22 18:421:7 21:13135:24 229:17272:14 280:7282:23 294:8
continuing
87:23 308:12
continuous
176:9 181:23181:25
continuously
175:17 183:11
contract 282:23
287:13 295:23299:21
contracted 230:5
contracting 284:6
contractor 35:21
contribute
50:11 50:2551:12 187:2187:13 202:15248:9
contributing
47:23 137:21256:5
contribution
72:11 249:14
contributions
11:15 43:22157:11 217:16
contributor 192:4
control 42:9
130:17 280:14281:2 281:2
controlling
126:13 209:10
controls 77:6
77:6 84:5 273:22
controversial
41:14 69:8
conundrum 139:19
CONUS 311:18
315:4
convected 73:16
convective
58:17 71:1171:17 71:2473:20 95:695:9 159:18162:19 283:6288:11 292:20
convention 77:11
conversation
188:5 218:18237:11
conversion
46:20 77:15
convert 298:20
299:7 314:24
converted 87:7
converts 282:18
cool 198:6
cooled 177:11
cooling 152:2
254:4
cooperation 12:24
coordinate
40:23 277:19
coordinates
97:9 98:21 98:24285:7

10TH CONFERENCE OF AIR QUALITY MODELS 03/13/2012 CCR#16766-1 355
coordinating 27:5
coordination 11:3
11:11 24:1924:19 25:2128:20 29:231:2 35:5 37:2268:10
copies 38:9
copy 37:24
77:25 271:23
Cordero 171:22
core 34:20 186:24
187:20
Corn 217:5
corner 128:22
129:7 129:11129:14
Corners 289:9
289:12 289:19290:5
correct 78:2
91:16 127:23153:11 155:14184:12 262:1276:22 278:15278:16 289:21292:22 319:13
corrected 75:3
76:23 77:1165:14
correction 183:12
311:3
corrections
162:20 230:14
correctly 87:2
271:5
correctness
271:21
correlated 269:16
correlation
159:12 269:20269:21
corresponds 89:13
corridor...2001
115:23
cost 275:19 277:7
305:2
costs 304:17
could...for
107:10
Counsel 28:6 41:3
69:14 234:20
counter 69:11
counter-
productive
280:12
counties 184:5
184:6
country 7:11
26:10 26:25 27:2189:24 311:19315:7 315:14316:2
county 135:1
184:4
county-by-
county 184:2
couple 3:10
19:6 29:12 33:1440:16 43:2 43:1173:12 74:24106:6 115:5125:24 128:21133:8 147:16157:10 157:11166:8 182:17190:20 191:20200:21 220:18222:11 262:20275:10 313:20319:6
coupled 34:19
coupling 282:1
course 46:16 74:8
101:13 101:16110:24 110:25157:14 187:18188:14 191:2191:4 194:7194:21 197:1212:15
courses 241:9
cover 56:7
57:24 73:1595:16 95:1695:16 96:199:2 99:22100:10 101:3101:7 101:18102:16 102:18102:21 102:23103:9 103:16103:23 105:19105:21 105:25106:4 107:20107:22 109:17109:22 110:15110:16 110:19113:1 113:3113:13 113:18115:11 115:11115:17 116:20118:2 119:9119:14 121:4184:4 184:5194:15 205:4218:19
coverage 312:23
coverages 311:15
covering 185:24
covers 73:15
107:25 160:17193:20 205:6
COWHERD 175:5

10TH CONFERENCE OF AIR QUALITY MODELS 03/13/2012 CCR#16766-1 356
175:9 214:10220:10 220:14
Cox 259:19
Cox-Tikvart
131:14 252:5252:23 253:5
crack 4:7
crash 75:23 78:6
create 152:23
155:18 286:8
created 36:7
172:14 196:19276:5
creates 227:14
279:25
creating 286:1
303:9
credible 69:23
134:3 138:14139:4 322:11
credit 68:23
68:25 275:4
creditable 133:16
Creek 248:3
248:18 249:17249:19 249:23250:4 254:2257:18 258:1258:18
crest 319:12
crews 193:4
criteria 53:7
53:11 126:11231:14 231:15
criterion 54:25
65:5 66:11 66:2067:16 123:16123:19 134:18134:21 202:18
critical 7:20
19:19 20:622:3 137:11145:19 200:10225:17 245:23267:21 278:12307:23 318:24
criticized 198:22
crop 96:11
cross 69:6 80:8
129:10 253:1
crosslink 197:21
crowd 5:11
crusher 177:15
CTDM 247:4 247:11
247:13 247:15247:16
cubed 77:18
culpability 16:1
cumulative 34:1
44:17 44:19 47:8143:22 183:13
cumulus 321:11
cup 86:8
current 17:16
22:23 22:2442:20 66:3 77:2279:4 92:4 93:495:15 113:24114:17 117:6146:13 147:22157:16 159:1159:1 160:12160:25 161:4161:19 161:19165:14 198:23210:24 228:24236:19 238:11238:22 241:14261:7 277:25278:18 308:5
Currently 73:16
158:7
curve 155:4
160:16 223:19251:5
curves 155:3
160:17
customized 218:7
cute 38:11
cyclone 97:5
108:6
D
D.C 119:12
DAC 119:14
daily 47:6
50:12 51:1 51:1362:3 190:2202:16 202:16222:3 255:18256:12 256:16256:16 257:8257:13 300:12318:9
Dakota 289:9
289:12 290:9
dat 284:21
data 18:22
19:10 19:1819:23 21:2 31:2334:6 43:21 47:1547:16 49:7 54:1754:21 55:1255:13 55:1455:15 55:1855:23 56:5 56:1157:5 57:6 57:958:10 58:1258:24 59:259:7 59:11 59:1259:15 59:1859:19 59:23 60:360:5 60:6 60:7

10TH CONFERENCE OF AIR QUALITY MODELS 03/13/2012 CCR#16766-1 357
60:11 60:1260:14 60:1560:19 60:2160:23 61:461:4 61:561:10 61:2061:21 62:462:6 62:862:10 62:12 63:263:5 63:663:15 63:2063:22 64:664:7 64:864:13 64:18 65:167:22 68:670:7 72:15 72:2072:20 72:21 74:179:8 81:11 81:1781:21 82:1484:14 84:1484:15 84:1884:23 84:24 85:385:4 85:885:17 85:17 86:286:17 86:2086:22 86:2488:24 89:189:2 89:3 89:590:14 91:691:7 91:891:20 91:2192:10 92:1392:14 93:1594:13 95:1695:16 96:16 97:198:9 98:18 98:1999:2 99:15 99:2199:22 101:2101:3 101:4101:5 101:7101:7 101:18102:2 102:4102:8 102:16102:19 102:21102:23 103:9103:16 105:21
106:4 106:19106:20 108:1108:14 108:21109:7 109:22110:6 110:15110:16 110:17110:19 112:4114:14 114:19114:20 115:11115:23 116:20117:18 118:3118:9 118:15118:25 119:1119:3 120:24120:25 121:4122:7 128:17128:18 136:1136:5 136:9153:16 153:20154:8 158:3159:11 159:19163:23 164:19168:8 170:6170:7 171:9171:10 171:12171:21 176:16180:8 192:2193:16 194:25195:3 195:9195:10 196:17214:20 214:22218:12 218:12218:25 219:4219:6 219:7219:10 220:8223:21 226:3228:23 249:24249:25 250:11250:12 250:12251:10 252:6252:17 256:10256:16 256:20256:20 257:4257:6 257:18257:18 257:19267:6 267:11
267:15 267:22268:9 272:20274:8 274:14274:16 274:17274:19 275:8275:11 276:3276:7 276:16276:17 277:10278:21 279:23279:25 280:21281:5 281:17281:18 281:20281:24 285:5285:16 285:22285:25 286:3286:9 289:21289:23 291:15292:18 293:8296:15 297:4297:8 297:16297:17 297:18298:24 299:7300:24 301:2301:9 301:16301:17 302:5302:17 302:22302:24 304:5304:7 304:14304:23 305:8306:1 306:10306:19 306:25307:3 307:7307:11 307:12307:21 308:10308:14 308:15308:20 311:11311:23 312:1312:4 312:7312:12 312:13312:18 313:2314:21 316:25317:1 317:21318:22 320:8320:14 320:19322:10 322:16
data...

10TH CONFERENCE OF AIR QUALITY MODELS 03/13/2012 CCR#16766-1 358
hopefully 115:11
data...like 121:3
database 29:19
37:13 37:1738:12 150:9159:18 159:20161:15 163:12163:15 246:24267:9
databases
158:24 158:25159:10 159:14160:2 161:14161:16 162:16162:23 245:13
date 25:17
43:17 51:2582:25 83:1986:12 86:1886:21 86:2286:23 87:5 87:1687:21 89:7234:23 242:4278:1 303:15
dated 282:24
dates 35:18 90:22
Dave 317:6
day 5:2 18:14
21:17 22:21 51:963:10 71:2273:14 84:12 95:9197:1 197:3197:6 197:6201:2 228:18228:20 271:1295:6 295:6
Daye 174:20
Daylight 4:9
days 3:10 11:20
14:15 19:6 23:1788:10 218:22220:19
daytime 159:19
day-to 21:16
day-to-day 27:8
de 66:15
deal 10:24 17:8
21:16 25:5 40:2599:1 100:25121:1 210:24216:21 225:5225:6 225:15234:21 313:19
dealing 91:5 91:8
142:22 167:11178:17 210:23218:21 225:8226:9 226:18226:19 226:21305:20
deals 145:25
dealt 70:25
167:13 181:17214:16
debate 11:24
262:5
debug 162:2
decade 219:6
decades 214:20
December 82:11
84:20 120:10188:16 189:1
decent 301:18
de-charge 181:6
de-charging 181:3
decide 161:25
215:17
decided 49:12
160:11 160:15163:22 165:1167:20 254:6298:18
decision 35:5
66:9 143:21205:24 233:15320:18
decision-making
280:17
decisions 29:14
29:16 206:4215:4 215:6
decks 99:5
deemed 128:2
280:11 314:22
default 48:1
48:11 48:2348:24 48:25 49:249:14 55:1255:17 55:2055:20 55:24 77:494:9 105:4227:15 252:11
defaults 218:14
224:11 225:19
defective 125:21
Defense 181:15
defer 32:24
201:20 206:18
deferred 32:1
deficiency 233:19
define 66:14 68:2
69:21 95:18123:4 213:23
defined 48:24
48:25 66:2369:24 105:23114:10 126:22138:19 150:7231:11 243:14319:18
defining 15:22
284:15
definitely

10TH CONFERENCE OF AIR QUALITY MODELS 03/13/2012 CCR#16766-1 359
30:24 60:25
definition
66:20 104:18139:7 180:3202:18 288:1
definitions 106:1
definitive 292:25
degenerated
276:23
degrades 254:9
degree 123:22
266:25
degrees 61:9 63:6
81:25 97:25129:8
degrees...so
129:8
delay 187:3
delayed 234:9
deliver 234:23
delivered 263:3
delivery 263:21
DEM 72:20 76:9
137:14
demanding 274:3
demonstrate 138:1
138:14 138:22213:3 213:6
demonstrated
242:11 245:12249:5
demonstrates
248:12
demonstrating
23:6
demonstration
33:10 51:4 52:1666:18 138:17138:21 143:11
167:8 255:6261:17 308:5
demonstrations
187:8 231:8239:17 239:19239:20 275:13
Dennis 310:23
314:3
dense 142:25
181:12 182:10
Denver 197:11
220:20
DEP 243:23
248:1 249:7251:3 259:2
Department 18:1
18:2 135:1181:15 198:11234:20
depend 11:2
123:23 134:20203:7 212:19315:1
depended 76:19
dependencies
112:7 112:7
dependent 76:21
94:20 184:22214:8 310:9
depending 41:14
51:6 98:22 103:1114:2 158:13169:5 181:9207:23
depends 41:15
90:14 143:23193:22 202:24224:13 321:3
depletion
176:19 180:23182:13
deployed 54:18
249:21
deposition 183:14
184:20 237:6241:3 288:24289:5 289:7289:13 289:14291:2 291:8291:13 292:3292:14 310:10321:22
depth 18:11
depths 283:5
Deputy 13:23
DEQ 74:13
derived 35:13
74:3
describe 54:15
82:16 264:19278:14
described 48:4
194:12 207:21239:10 280:8
describes 93:7
246:13
describing 46:9
275:24
description 82:15
259:13
descriptive 52:1
deserves 211:5
215:19
design 34:7
36:1 47:747:14 47:1778:12 78:1589:18 89:23189:5 191:7196:11 197:7245:23 272:24283:24 306:12

10TH CONFERENCE OF AIR QUALITY MODELS 03/13/2012 CCR#16766-1 360
307:13 320:10320:17
designate
234:11 234:15
designed 92:10
92:13 99:21264:10 283:10283:19 284:25285:6 285:14293:6 297:8299:19 299:20301:15 302:15302:21 308:7310:14 320:5
desired 29:4
273:23
desk 5:20
despite 257:6
detail 23:13 34:3
40:19 44:15 45:847:4 47:2552:4 54:254:16 63:4112:24 122:2152:9 178:1178:4 185:6190:14 193:9196:18 202:25224:15 244:15249:1 250:24316:11
detailed 24:19
47:1 51:2552:3 52:952:10 133:10259:12
details 51:15
54:22 139:21172:1 186:12193:13 196:25202:25 203:14206:3 223:14224:13 248:24
252:14 259:17261:19
detector 4:21
4:23 4:25 5:1
detectors 4:23
deteriorated
276:14 279:5
determination
29:1 32:19 32:2132:22 36:19194:24 245:22
determinations
37:4 243:3
determine 36:23
43:21 47:21 67:178:10 79:2394:14 94:2596:25 108:9112:13 127:24134:3 208:24250:15 252:10
determined
33:17 66:17147:24 214:3234:21 245:2
determines
86:13 112:17134:22
determining 44:15
47:10 66:21 93:2162:4 250:7252:5
develop 30:6 73:8
117:24 120:6122:5 126:16128:7 132:11150:9 155:19259:20 277:19282:6 310:2310:11 312:6
develop...you
109:19
developed 19:21
21:4 93:1 96:2100:7 100:9100:21 101:24104:16 108:2108:2 108:3109:3 110:20110:23 112:8118:22 120:4125:9 126:18146:25 147:3150:8 156:11178:24 180:13182:14 183:6183:18 184:1184:8 214:20265:7 267:9274:15 275:3275:12 282:22296:25 298:21298:21 300:24301:12 302:20
developer 229:7
230:18 233:5268:20 270:18
developers
21:18 265:9
developing
31:24 121:16142:11 274:1274:6 309:22311:14
development
11:8 19:219:25 20:2427:14 45:355:5 74:480:25 113:2144:24 145:1174:15 176:15192:3 205:17272:22 274:23274:25 282:23296:22 304:21310:21 313:22

10TH CONFERENCE OF AIR QUALITY MODELS 03/13/2012 CCR#16766-1 361
314:4 314:10
developments
54:14
devil 202:25
223:14 224:12261:19 316:10
diagnose 318:20
diagnostic
272:6 273:6276:11 278:6286:22 297:14297:19 298:2304:4 304:25321:18
dialogue 3:23
12:8 12:16 13:1713:17
diameter 171:8
dictated 211:17
did...published
128:19
did...six 136:23
diesel 189:22
190:4 190:6190:7 190:23
difference 12:9
56:23 56:24 58:865:17 90:4 97:1197:14 97:21111:11 114:4118:19 119:6119:8 119:16123:24 131:5131:16 131:19136:21 251:21252:25 253:2254:19 254:21257:6 266:18266:20 266:25268:23 269:1269:8 269:10269:24 270:2
270:3 270:16291:16 292:3
differences
119:13 121:4122:8 131:9131:13 131:15149:24 154:6154:14 154:19213:11 253:19257:23 258:11264:14 264:17288:8 288:24290:19 292:14293:3
differences...not
119:7
different 26:2
27:1 33:14 34:1035:1 46:5 49:953:3 73:2 79:679:12 93:23 94:694:16 94:1797:10 97:11 98:599:17 100:2100:3 102:25103:24 107:2107:25 116:15130:24 132:17138:15 141:14149:16 151:19154:14 155:12155:13 160:17183:13 183:18183:21 192:16192:25 193:13193:24 194:10205:7 206:16215:12 215:15218:21 221:5252:13 252:15264:2 264:9269:17 269:18288:16 290:14290:18 292:17293:7 303:9
321:8
differently 47:4
difficult 38:24
39:1 51:1764:5 79:7 167:10176:3 176:12196:21 238:15264:4 264:5274:7
difficulties
118:24
diffuse 177:18
dilution 161:7
164:1 182:3182:5
dimension
150:13 170:15182:5
dimensional 273:7
273:11 273:15274:2 274:24278:7 303:1
dimensions
35:13 36:15125:8 146:8146:19 146:21171:4 174:4176:1 297:23
diminished 24:12
direct 19:1
19:9 43:11207:16 281:12281:13 281:25322:10
direction 57:15
58:13 60:1761:14 62:1670:15 76:1876:21 81:24 82:182:5 83:5 83:783:8 83:12 85:1187:12 87:13
10TH CONFERENCE OF AIR QUALITY MODELS 03/13/2012 CCR#16766-1 362
88:16 88:17108:17 111:6136:1 140:21182:3 307:19
directionality
292:23
directions 61:8
61:15 63:5 76:20
directly 18:11
28:22 46:4149:19 175:21203:20 203:23241:20 273:12282:1 284:22286:10
director 7:4 9:25
34:10 40:2140:22 234:17
Directors 41:13
directory 77:22
disagree 33:15
39:9 240:10
disagreement
32:21 33:18
disappear 91:21
disappeared 72:2
disapproved 148:2
148:6 148:18148:20 224:24224:24
disbenefits 173:4
discharging
175:24
disclaimer 70:16
discontinuities
65:13 65:19 66:266:8 139:23
discontinuity
67:19 107:18
discount 67:6
discounting
211:15
discovered
82:12 110:22118:13 124:7264:21
discrete 62:22
76:13
discuss 39:22
92:5 157:8 159:2166:8 227:6230:18 233:8235:11 239:9272:5 272:25273:2 287:10
discussed 9:21
53:6 61:17139:19 148:13210:20 287:6304:1
discusses 273:14
discussing 210:19
280:25
discussion 35:8
54:1 185:15203:22 217:13230:3 230:20233:3 234:16237:13 267:4280:23 286:6304:1 305:17308:25 310:1310:2 320:18
discussions 20:21
35:21 157:22216:10 216:22228:21 265:16
disown 142:14
dispersing 45:13
dispersion 7:15
25:7 56:22 75:15140:2 161:8
162:5 162:12167:19 175:16176:13 180:18181:19 184:15204:6 214:18215:9 247:21272:15 273:10275:25 276:12277:18 279:10279:11 279:14279:20 293:8300:4
displaced 125:2
disposal 303:11
disqualified
39:10
distance 69:19
70:2 70:971:23 71:2375:25 76:1276:16 77:979:2 94:794:20 105:2112:11 117:11126:19 126:22126:25 126:25129:16 172:13212:17
distances 76:13
76:18 76:19163:1 164:12164:19 231:1
distinction 52:17
95:13 100:10
distinguish
41:1 99:10 108:4110:25 118:22
distinguished
96:14
distribute 277:7
distributed 41:17
53:1 68:14

10TH CONFERENCE OF AIR QUALITY MODELS 03/13/2012 CCR#16766-1 363
distribution 47:6
50:12 51:1 51:13101:25 131:8135:10 202:16203:8 203:12257:8 269:17
distribution...
the 90:6
distributions
185:1 250:22
dive 167:20
divided 89:23
126:4 172:21172:23
division 7:5 28:2
40:21 40:2240:23 41:13234:17 234:18
docket 208:23
document 32:9
32:9 68:473:23 172:11188:18 189:16197:3 206:3251:1 253:24
documentation
114:3 133:10153:9 266:4293:17 295:25314:1
documented
41:24 52:2057:10 70:12246:20 261:21315:23 316:7
documents 93:20
249:2
doesn't...not
119:13
domain 52:8
76:7 94:19283:11 289:10
289:12 289:19289:20 290:3290:5 312:3315:18 315:24316:6
domains 289:8
312:11 312:17
domestic 35:2
dominant 95:3
dominated 159:15
dominates 103:11
dominating 162:7
dominion 142:8
142:9
done 8:20 10:4
10:6 22:17 22:2529:1 36:15 52:1357:2 59:25 64:1675:2 79:2597:6 123:11140:7 140:13141:23 147:11150:2 154:1157:17 160:20161:15 166:8172:16 179:19182:21 185:7187:5 187:11188:12 188:24189:23 190:24191:2 196:14209:18 210:1212:10 214:25215:13 217:6219:10 219:12220:1 230:19232:2 237:1237:19 243:22250:9 250:13250:21 256:8258:13 258:14258:21 264:5265:9 272:12
279:14 283:24293:13 293:15294:9 298:6312:16 313:23314:1 314:11315:23 315:25317:5 322:22
don't...haven't
90:23
don't...you
143:25
dot 58:21 90:9
284:21 319:11
dots 160:11
160:13 189:12
dotted 190:18
doubled 161:22
doubling 162:14
doubt 216:17
Doug 277:13
downdraft...maybe
125:22
download 144:17
downtown 122:6
122:9
downwash 54:25
55:2 57:2065:5 65:865:23 66:1166:23 66:25 67:867:15 67:2368:15 68:24 69:169:5 69:869:10 70:570:6 77:6 77:6121:18 122:23123:14 124:2134:5 134:10134:15 134:20134:24 137:21138:3 139:2
10TH CONFERENCE OF AIR QUALITY MODELS 03/13/2012 CCR#16766-1 364
139:5 139:7149:16 150:10151:22 152:4152:23 171:4174:10 176:22254:1 254:3254:6 254:8254:12 254:13259:25 260:3260:8 265:11265:14 265:17265:25 266:3266:8 266:11266:13 266:21266:24
downwind 128:22
129:7 129:11129:18 136:18136:20 136:22149:23 151:4151:16 205:17248:10 255:15
downwind...
downwind 128:25
draft 51:24 52:21
229:14 236:21275:21 305:14305:15
drainage 62:19
dramatically
155:12
draw 49:11 53:12
Dresser 80:22
206:19 207:2207:2 259:1
drilling 34:12
drive 165:15
driven 301:5
driving 169:12
drove 258:17
drum 221:1
dry 289:14 289:14
D-stability 58:6
DTE 200:21
duct...shows
103:19
ducted 175:17
due 46:4 49:4
57:9 60:12 60:1367:15 68:2472:10 81:1481:17 93:14 95:9113:2 119:18123:20 164:1171:11 246:2248:23
Duke 267:3
dump 53:14
Durham 96:17
122:6
during 3:23
9:21 12:14 14:1563:13 71:9 86:1786:20 95:595:9 145:8149:12 164:24164:24 183:17184:23 233:3257:1 267:9
dust 166:21
176:17 178:17180:24 182:11182:19 182:21182:24 182:25182:25 184:6191:18 191:22192:2 192:4192:7 192:9213:19 218:8218:23 220:3220:7 220:17
dustiest 179:9
dusty 179:14
duty 271:13
E
earlier 29:7
34:11 44:14 48:248:17 62:2173:24 125:11126:19 254:1286:6 304:1305:18 319:9
early 35:4
36:25 80:3148:14 207:7
earnest 3:12
Earth 98:11
102:24 103:15237:22 275:4298:6
ease 278:1
easier 79:4 79:14
127:22 149:8203:13
easily 258:21
east 108:8
easy 28:15
34:17 276:16310:17 320:12
eat 6:16
eating 145:11
213:19
EBD 36:4 36:4
36:6 125:7146:13 146:16148:4 149:9149:12 150:2150:4 155:25156:24
EBDs 35:25
36:19 36:23 37:5132:17 147:24

10TH CONFERENCE OF AIR QUALITY MODELS 03/13/2012 CCR#16766-1 365
effect 69:10
71:11 84:25126:17 128:14135:3 150:22151:22 176:23183:3 183:13258:23 289:3289:13 319:15
effected...so
112:2
effective 25:17
43:17 93:17105:15 106:11112:10 112:14112:23 113:22114:25 115:8116:6 116:7116:9 116:20117:15 121:16126:3 128:16129:4 129:5129:22 130:11130:25 130:25131:10 131:24132:4
effectively
17:3 17:10 216:1258:21
effects 9:6
65:5 69:2 69:9134:15 176:18177:23 180:20181:8 181:14183:7 183:21214:14 214:16215:4 216:16217:10 238:4247:20 273:19273:23 293:9
efficient 142:24
efficients 83:5
effort 10:16
27:16 49:7166:13 177:25
185:4 236:12236:12 236:13286:18 312:8
efforts 10:3 10:8
10:23 15:2517:15 92:7 174:2226:1 237:8
EGU 89:20 289:16
eight 65:16 205:5
206:2 252:22255:1 255:2
either 5:14 41:12
55:19 56:1360:13 70:11 82:4113:19 165:10169:25 174:16212:5 226:1232:1 236:5260:7 268:9276:3 278:5282:18 283:10286:13 297:16299:14 300:11307:13
eland 103:9
electrostatic
181:9 182:11
element 16:13
18:21 19:2420:23 272:19281:22 282:14295:3 305:7306:3 306:12
elements 15:15
15:17 36:336:6 111:19272:24 282:10290:13 305:23320:22
elevate 28:5
elevated 35:15
71:20 94:23 95:8
130:1
elevation 76:10
118:17 118:19119:6
elevations 75:1
118:18 119:9
elevators 6:8
eleventh 17:8
eliminate 66:2
123:10 129:21249:13 259:23
eliminates 61:14
elongated
121:21 125:25128:19 130:10130:20 132:10
else 67:5 92:1
182:8 207:17215:20 215:21318:17
email 238:6
e-mail 25:19
emerged 49:22
245:20 279:9279:16
emergencies 5:12
emergency 5:16
5:17 49:24 50:1850:21 200:25201:4 282:3
emerging 21:22
23:7 233:24262:11
EMFAC 191:16
197:4 221:15
emission 49:24
68:24 69:169:4 79:24167:21 168:12176:3 176:14

10TH CONFERENCE OF AIR QUALITY MODELS 03/13/2012 CCR#16766-1 366
178:12 179:12179:24 184:19184:25 201:11201:14 201:15202:21 207:11214:4 214:11214:18 214:25215:8 249:13
emissions 20:2
43:11 43:2545:14 45:2147:23 48:12166:20 168:13172:10 176:8176:9 176:21177:10 177:15178:15 178:16178:19 181:19184:9 184:11184:22 187:7188:10 188:25189:4 190:9190:24 191:1191:4 191:13191:25 192:6192:14 192:22192:25 193:6193:15 196:1202:14 203:3203:6 204:9204:10 206:14206:15 209:14214:4 214:13214:20 216:6216:7 216:8216:10 216:13217:15 217:17218:7 219:11256:23 256:25257:4 302:22
emit 51:8 175:21
emitter 250:2
emitters 49:25
emitting 175:17
182:1 182:4183:11
Emory 313:22
emphasis 24:18
60:8 307:9
emphasize 45:19
49:14 193:17194:11 205:24308:14
employee 10:1
emulate 247:15
encourage 165:10
encouraged
136:8 174:4258:12
encouraging 116:9
117:5 129:24132:4 159:5
Energy 135:15
200:21 210:4267:3
ENF 262:23 263:13
enforceable
201:12
enforced 280:7
engage 3:23
18:4 18:718:11 35:3 145:3225:14 234:3235:4 237:13238:17 262:8263:23
engagement 36:25
engaging 15:21
16:25 38:5235:25 237:11
enhance 282:12
enhanced 71:12
72:1 183:14
enhancement
321:17
enhancements
206:14
enhances 71:9
enhancing 92:9
296:13
enjoyable 14:14
enjoying 80:24
enlightening
11:21
ensure 244:18
ensures 11:22
enter 77:15 77:20
86:20
entered 75:25
entering 228:17
enters 86:23
entire 182:1
182:4 263:1283:11 311:15315:4 316:3
entirely 151:19
entrainment
125:22
entrayment 125:18
Environ 282:24
287:13 293:16294:20 295:23296:25 313:21
environment 16:14
172:6 279:2300:3 300:5302:17 311:22317:9
Environmental 3:1
135:16 302:20314:8
environments
283:3

10TH CONFERENCE OF AIR QUALITY MODELS 03/13/2012 CCR#16766-1 367
Environ's 299:19
envision 196:4
204:4 204:13268:14
EPA 3:5 4:4
5:21 7:23 8:239:19 10:12 10:1310:16 11:813:1 13:11 14:2116:16 18:1 22:1336:18 41:8 41:1254:23 65:365:9 65:14 65:2265:25 66:16 67:867:24 67:2568:10 68:20 69:269:15 74:15 75:675:14 126:10142:13 146:1146:15 147:4147:22 147:24153:4 153:12154:6 154:18155:19 155:21156:1 159:3159:8 165:8165:9 165:10165:24 166:2166:16 166:18167:3 178:14180:12 182:16182:18 183:25185:6 185:15188:22 198:21198:21 207:3208:12 209:17209:23 215:14218:7 231:25232:21 239:25240:2 241:7241:21 242:25244:7 244:7260:1 260:1260:17 262:5262:24 263:1
264:8 264:12264:19 264:25265:7 265:16267:6 271:11271:17 277:5277:6 277:18279:6 280:7280:9 280:14280:24 282:22284:4 287:13291:18 294:6294:20 295:18295:22 296:21299:21 302:19305:17 305:18308:13 311:17313:17 315:12
EPAs 272:18
EPA's 7:16 66:2
189:7 221:21242:4 281:22293:15 305:6306:3 311:7
EPRI 161:15 267:8
equal 65:9
129:4 134:16
equally 280:5
equals 252:21
252:22 252:22255:1 255:2255:2 269:15
equation 160:8
239:3
equilibrium
48:5 77:19242:21
equipment 179:21
equivalence 264:1
equivalency
143:12 261:16
equivalent
35:13 36:14
146:8 146:18150:12 151:4151:24 154:23155:6 155:8261:25 262:2264:7 264:12264:16 264:22264:23
equivalents 264:4
era 23:4 179:17
Erik 17:13
ERM3.5 116:19
erroneous 269:13
error 74:25 97:25
106:6 140:20
escape 177:16
escort 5:6 5:9
especially
10:25 73:5 80:2193:25 99:12105:2 121:21142:9 142:15158:1 164:24184:17 191:21200:10 219:24252:16
essential 15:15
16:13 19:2420:23 272:18281:22 305:6
essentially
45:5 69:3290:2 299:9312:18 316:25
establish 62:2
established
11:7 17:1060:6 212:1245:18
establishing
307:20

10TH CONFERENCE OF AIR QUALITY MODELS 03/13/2012 CCR#16766-1 368
estimate 68:18
101:25 102:4106:19 154:8165:2 176:2184:12
estimated 97:8
125:8 154:7
estimates 33:1
76:25 105:21108:13 109:9115:8 115:10115:18 146:22
estimating
45:20 46:893:8 93:21105:14 106:11245:23
et 88:2 177:8
ethanol 217:24
eularian 240:15
240:18
Europe 18:7
evacuation 5:22
5:25
evaluate 17:16
20:1 22:2429:7 111:25128:14 158:22173:5 178:1235:5 235:10261:11 296:14321:20 322:11
evaluated
152:13 159:9161:10 262:15262:17 315:5
evaluating
17:24 131:15145:2 215:11226:16 234:12235:14 236:19236:22 240:19
282:7 297:15297:22
evaluation
16:18 19:1219:17 20:1 20:1071:19 140:6146:15 154:2157:9 157:17157:18 157:19157:25 158:21159:9 160:11160:20 161:4161:13 221:3221:7 222:13222:14 222:15232:23 246:23247:12 247:22250:6 250:10251:15 254:17263:1 264:8265:1 265:6265:21 267:22268:8 268:21276:24 277:11279:19 282:10282:11 287:14289:24 290:22294:7 294:8296:18 297:4297:9 297:13297:18 299:12299:18 306:10308:18 309:25310:3 310:12312:10 313:6314:22 314:24315:6 315:12315:22 320:22322:14
evaluations 20:14
21:8 21:11 21:1173:21 220:3234:1 245:15265:8 265:8268:6 278:5
281:3 286:20286:21 286:23287:4 295:2295:5 303:20303:21 312:11
evening 228:15
323:7
event 73:8
events 184:24
eventually 73:3
everybody 3:8
3:15 3:25 4:104:16 4:19 5:327:4 27:429:18 45:8 64:1396:9 132:25145:15 145:21157:3 198:5227:24 228:5231:5 262:10304:8 323:1323:6
everyone 3:4
7:1 11:2413:17 80:12
everything 3:19
175:15 224:13263:24 322:1322:21
evidence 69:7
211:20 244:25
evidenced 14:21
21:6
evident 163:17
164:12
evolution 141:6
evolve 229:17
272:14
evolved 273:10
281:11
evolves 58:17
10TH CONFERENCE OF AIR QUALITY MODELS 03/13/2012 CCR#16766-1 369
evolving 148:24
exact 89:14 179:3
exactly 50:3
50:15 51:18 66:1218:24 319:17319:22
examination
292:24
examine 174:10
289:2
examined 168:7
examining 204:5
288:23
example 27:25
46:25 49:2550:17 59:7 61:2472:2 72:679:11 82:2384:10 88:2290:12 96:16103:2 103:25105:18 106:1130:15 133:16136:13 137:15151:14 177:4180:25 184:19191:3 197:15205:1 225:25226:16 269:12289:18 297:15300:14 310:5312:4 315:2
example...for
89:20 119:2
example...if
131:17
examples 40:16
50:17 54:3 62:14128:21 168:19168:25 169:8211:18 223:24226:6 302:9
303:8
exceed 134:16
exceedances
255:17 256:2
exceeds 78:13
Excel 97:1
162:2 300:9300:11
excellent 218:9
274:9 314:1
except 97:3
exception 7:13
exceptions 99:16
excessive 66:22
67:3 67:368:18 138:2138:18
exchange 227:8
exchanging 225:11
excited 23:18
exclude 50:14
51:14
exclusion 78:10
183:16
executable
77:20 90:15
executables 77:24
execute 84:4
exercise 18:16
293:5
exert 55:3
exist 107:21
107:21 177:22
existence 45:3
235:17
existing 78:3
78:24 133:20139:18 167:25
187:2 187:14192:20 234:1235:12 235:19236:22 280:9316:7
Exit 154:14
154:15
exits 5:13 5:13
expanded 22:20
190:7 190:18194:6 275:17
expansion 190:5
204:19
expansions 189:25
190:1 190:3
expect 108:17
196:5 206:8207:25 208:20236:3 239:5266:2 266:13266:17 288:3
expectation 246:2
expected 19:8
20:13 45:11202:15
experience 238:16
238:23 241:5261:1 261:2261:3 276:8
experienced
223:12
experiences 18:9
experiment
34:20 158:2294:2
expert 273:18
316:22
expertise 16:15
167:22 273:17274:1 279:7279:16 304:11

10TH CONFERENCE OF AIR QUALITY MODELS 03/13/2012 CCR#16766-1 370
304:12
explained 33:19
266:3
explicitly
16:12 46:2459:11 92:11 93:7232:10 253:6
Exponent 238:3
exposure 71:15
72:5
expressed 51:21
105:3 123:15250:23
extend 21:20
125:4
extended 18:14
229:5
extending 237:16
extends 291:10
extensive 197:14
extent 42:15
67:16 67:20129:6 168:6169:11 174:5224:1 262:12291:1 291:8293:2 293:3
extinction 83:4
extra 264:13
extracted
129:15 286:16
extracting 285:4
extreme 302:23
extremely 4:5
137:7
eye 26:24
eyeballing 290:24
F
FAA 56:10 56:14
59:13 86:9
face 8:15 12:13
211:16
faced 12:20 15:14
facilitate
18:22 19:1719:22 42:1 42:12226:20 305:8
facilitated 229:6
facilities 176:25
191:12 192:7192:17
facility 3:6
35:11 35:22 36:468:1 89:20 176:7177:12 191:1192:20 194:19248:16
facing 14:8 14:23
fact 19:5 39:9
46:15 47:2 62:2565:15 67:23 68:891:9 97:397:11 98:21111:16 123:20132:1 148:24157:24 165:15171:19 198:22209:6 214:9218:20 226:10230:4 232:9233:5 233:22235:21 250:6258:4 264:20266:14 270:3270:6 275:10278:4 278:11281:10 283:18302:6 306:13306:14 308:14318:4 320:24322:4
factor 26:22 33:2
57:10 58:23101:20 101:21102:13 103:17105:11 105:16106:7 106:16106:17 108:12108:21 109:7109:9 110:2112:1 113:25115:1 115:10115:15 115:19116:11 116:12116:15 117:22118:8 135:1135:13 136:25163:5 163:9164:1 164:10164:14 164:15164:17 164:20167:21 171:20171:23 176:15182:20 183:3183:12 183:15183:15 183:25204:10
factor...again
108:23
factor...the
110:3
factor..well
106:4
factors 102:1
105:15 168:13178:1 178:12179:22 179:24184:25 192:25193:6 205:14209:14 209:15214:11 214:18215:1 215:8215:12 216:10216:13 216:14216:25 217:14218:7 218:11

10TH CONFERENCE OF AIR QUALITY MODELS 03/13/2012 CCR#16766-1 371
218:24
facts 202:12
fail 233:17
failures 225:12
fair 169:7
249:1 316:20
Fairbanks 284:7
Fairfield 228:9
228:10 228:14
fairly 71:16
116:25 132:5154:12 168:22171:6 173:18269:21 309:7310:17 310:18
fall 75:11
77:19 218:23239:4
falls 161:15
162:24 163:5163:17 315:24316:6
familiar 45:9
146:19 296:24
family 41:11
fantastic 10:8
far...the 116:7
farther 188:14
212:25 213:7
farthest 317:19
fashion 8:4 147:4
156:2 156:10
fast 70:23 128:17
159:10
fast...you 135:8
faster 64:4
122:22
fathering
133:22 133:24
FBs 269:17
feature 249:22
272:24 283:7283:18 283:23299:22 300:10320:10
features 276:22
278:15 278:16283:2 284:14291:7 306:21307:12 308:3309:20 309:21310:15 318:10318:11
February 82:9
230:16 233:3256:1
federal 11:3
16:16 17:23 19:232:1 179:2185:15 186:21186:22 186:23186:24 189:24193:25 198:14229:23 230:17230:22 232:8232:18 233:6236:14 238:19239:21 241:13262:4 271:13278:3 280:4291:24 296:21311:6
federally 201:12
feedback 51:17
122:1 156:10166:14 295:14309:12 309:15309:19
feeding 19:9
19:18
feel 19:19
39:17 44:4 75:15
114:24 173:1179:23 184:14214:12 214:13214:17 217:2217:8 219:7222:7 255:5259:9 312:24
feels 185:12
feet 56:19
56:19 56:20 58:458:6
fellow 185:15
felt 49:3
120:21 167:21171:19 172:2173:22 246:10253:20 259:25320:12
fence 125:4
fetch 124:24
129:6 129:9
fewer 89:17
115:14
field 66:18 66:21
73:21 130:12137:5 138:16138:22 139:1139:3 140:16153:18 168:7168:10 168:11174:2 174:3174:5 181:14184:13 219:4219:13 223:21246:23 246:25248:3 248:19249:18 250:13252:16 253:15254:8 266:8267:5 267:22267:25 268:12268:15 273:6274:24 282:12

10TH CONFERENCE OF AIR QUALITY MODELS 03/13/2012 CCR#16766-1 372
290:16 290:17292:9 292:11
fields 31:24
273:15 274:2274:7 277:11278:6 278:16278:25 280:3280:22 282:8288:24 289:3291:2 292:3297:10 297:10
Fifita 224:5
fifteen 4:14
figure 68:5
169:20 209:12215:12 215:25318:1
figured 256:6
file 37:25 38:9
59:8 75:4 76:976:9 76:1077:3 77:7 77:877:8 77:10 77:1178:1 78:478:24 79:379:5 79:10 79:1579:16 82:1382:14 82:1582:23 83:9 83:1183:16 84:484:5 84:684:15 84:17 85:385:6 85:6 85:785:7 85:12 85:1385:25 86:186:5 90:21110:18 116:21117:8 149:2284:21 286:14301:18 301:21
filed 97:10 234:6
234:7 248:17
files 77:12 79:17
81:7 82:15 82:1983:24 84:2 84:1484:16 84:1784:24 85:285:5 85:15 85:1785:22 90:1790:18 90:20253:25 285:1286:9 299:13299:14 301:22
files...those
85:19
fill 55:19
filled 90:14
filling 220:16
filter 145:20
181:2 181:4181:5 181:6
filters 182:22
183:1
final 55:5
74:20 156:4156:16 166:5166:9 166:10166:13 166:18208:13 209:6209:17 209:23249:3 250:25250:25 255:8271:13 281:2285:13 294:5313:7
finalize 74:7
132:12 312:10
finalized 41:16
finally 18:12
66:8 66:12 73:1885:5 265:20280:24 283:25302:14
finding 91:6
174:3 253:23
264:19
findings 157:20
165:5 264:20
fine 35:18 37:6
239:11 261:1316:16 316:22
finesse 273:21
276:21
fingerprinting
182:24
finish 84:15
finished 156:18
Fire 298:22 314:8
firmed 149:15
first 15:2
15:23 16:1317:11 18:13 19:629:21 31:1332:14 34:16 39:545:18 47:7 54:1655:8 66:18 71:1771:23 80:20 81:184:20 87:25 88:7101:24 105:7109:2 110:3110:10 117:6124:15 130:22133:1 134:17142:7 142:19145:25 146:3146:8 147:11151:3 154:9159:9 162:24163:15 165:6167:16 179:8190:24 193:14200:23 201:16204:21 206:12210:4 215:13215:18 219:21221:18 228:18235:22 243:12245:22 255:18
10TH CONFERENCE OF AIR QUALITY MODELS 03/13/2012 CCR#16766-1 373
267:12 282:14296:20
Fish 287:11
288:21 290:21
fit 20:12 40:4
46:24 53:3 82:1783:10 85:21130:21 201:19
fits 60:10
60:23 122:3315:11
five 8:19 31:11
34:1 34:547:15 60:2263:14 69:25 80:396:9 107:5 107:5107:7 114:13114:14 136:25189:22 195:3196:14 228:4260:23 263:4265:1 312:16312:17 321:14
fix 71:7 71:22
72:8 91:16 122:1133:14 161:9210:6
fix...so 91:12
fixed 71:6
71:18 91:14241:23
fixes 19:7 21:6
72:11 73:1274:21 127:22239:1 241:21260:4 260:16261:8 262:7263:15 263:17263:19
fixing 71:1
flag 78:2 78:2
106:5 128:3
232:14 239:22
flagged 87:14
88:14
flat 200:11
246:24
flawed 153:24
flaws 36:1 296:5
fleets 192:16
flexibility 72:17
73:11 226:20226:24 302:23
flexible 211:1
FLM 232:10
262:8 263:22288:19 292:13312:8
FLMs 232:21 237:9
238:22 263:14291:18 299:21312:22 313:20
floated 151:2
floor 271:6
FLOSS 159:17
flow 62:19
150:7 175:23177:23 240:23291:7
flows 176:21
273:20
fluctuation
106:12
fluent 278:22
fluid 3:11
35:12 38:4 66:1766:21 68:1138:16 138:20154:11 155:21
flurry 24:8
295:12
flux 34:20
fluxes 159:17
fly 180:9
focal 267:12
focus 71:4 127:21
167:24 187:18188:5 248:19249:19 268:11310:6 310:7
focused 24:13
120:18 128:20167:18 172:4249:21
focusing 22:23
125:25 172:9187:15
fold 124:13
folks 5:21
10:25 14:8 14:2397:13 146:2167:3 188:4225:19 226:2230:6 232:18
follow-up
199:21 210:15211:23
fooling 217:11
footprint 96:18
119:4 126:3126:5 152:7152:10 200:15
for...it 114:8
forbidden 36:21
force 313:4
320:18
forceps 181:3
foresee 30:20
Forest 293:15
298:22 314:7
10TH CONFERENCE OF AIR QUALITY MODELS 03/13/2012 CCR#16766-1 374
forever 36:21
forget 143:5
form 43:20
43:25 44:146:5 47:547:19 51:11177:7 243:8294:21
formal 29:3
31:9 37:1938:2 40:241:23 202:2202:5 238:24
formalized
42:17 147:14
formally 22:16
23:2 23:10
format 81:7 82:16
82:17 83:10 84:184:17 98:1898:19 274:18274:19 274:20284:22 286:4286:12 286:13298:20 298:25299:7 299:9299:13 300:20301:4 301:4301:20 303:9304:24 310:16314:25 320:3
format...but
85:21
format...they
82:16
formation 45:22
242:16 242:17242:22 317:7
formats 72:20
82:14 83:24 91:9274:14 282:19
formatting 82:13
formed 120:6
120:14 214:15236:15
formerly 80:23
forming 233:10
formula 54:23
65:4 65:965:14 66:1666:19 67:9 67:1867:21 67:24 68:268:5 68:10 68:1668:17 68:20 69:269:10 69:1570:13 126:11134:8 134:11134:16 134:19138:15 139:16
formulas 150:9
formulated
67:17 124:18
formulating 281:5
formulation
8:11 20:3 71:7122:1 141:9142:2 157:16158:20 160:2160:6 160:12160:25 161:1161:4 162:16165:11 288:14
formulations
120:18
Fort 220:2 220:11
forth 35:20 95:23
139:22 178:22179:18 215:3227:17 259:10
FORTRAN 313:25
fortunately 25:12
forum 37:21
forward 8:2 8:2
8:17 9:7 11:1011:16 12:7 12:1312:14 13:1014:13 15:1319:11 19:1521:18 22:1923:11 37:356:1 56:12 121:8138:13 141:13146:17 155:16155:17 156:24173:24 236:1237:10 237:18242:3 262:13277:12 277:24284:12 284:12284:23 293:10298:13 307:19310:19 322:19
foster 16:14
40:11
fostering 42:24
four-letter 37:10
fourth 20:23
Fox 14:17
141:16 144:23208:15 210:11211:7 211:12213:23 216:2218:9 219:15223:11 225:5227:18 228:17260:25 261:3261:18 262:2263:11 263:20265:3
foyer 5:5 6:6 6:7
fraction 162:5
162:12 184:6184:8
fractional 251:16
269:4 269:11
fractions 184:3

10TH CONFERENCE OF AIR QUALITY MODELS 03/13/2012 CCR#16766-1 375
framework 299:6
301:1
Frankfurt 197:10
free 84:9 84:13
86:6 86:10 86:1687:5 87:687:15 87:20 89:790:21 90:22241:8 301:13
freely 302:10
freeze 229:25
freight 190:5
194:5
frequencies...
blue 89:10
frequency 57:9
58:19 63:9
frequently 51:6
friction 158:7
159:22
friendly 117:23
275:16
friends 5:7 25:8
front 3:15 4:16
31:17 51:21
FTP 90:18
fuel 89:21 256:24
fuels 90:2
fugitive 175:12
175:15 175:19176:4 176:9176:17 177:1177:17 178:5178:15 178:16178:17 180:20182:25 184:17184:23
fugitives 174:17
Fukushima 267:10
full 3:8 4:5 14:3
15:9 22:21 46:20136:11 153:13154:10 252:17255:25 256:18263:14 295:7
fully 8:8 8:9
22:5 69:14 70:1270:18 71:3 73:24162:16 180:11209:18 247:19268:15 273:10279:9 279:16
fun 25:15 98:25
function 106:23
129:16 158:15
functional 300:6
functionality
298:9
fund 268:15
funded 157:12
230:5
funding 186:21
189:24 193:25268:14 314:6
funny 26:16
further...but
121:12
furthermore 148:5
furthest 250:1
future 11:1 13:15
18:20 19:1329:24 72:2178:21 79:13118:10 142:14149:3 149:4156:22 174:1197:10 267:19274:1
fuzzier 119:5
G
gain 168:8
Gale 198:19
199:20 238:5239:4 239:7243:6 260:14275:1 275:18293:14
gap 126:22
127:1 127:3127:6 127:24
gaps 58:25
garage 194:17
Gary 213:17
gas 230:14 242:20
gaseous 175:21
gather 7:11 17:15
208:10
gathered 15:23
168:17
gathering 12:11
167:24
Gaussian 158:11
GE 267:9
geared 168:12
168:13 174:3
gears 166:3
general 28:6
31:17 39:16 40:541:3 44:20 69:14133:23 167:12171:14 206:13224:7 234:20252:11 314:19
generally 99:14
104:20 105:20202:5 258:2293:23
generate 219:10

10TH CONFERENCE OF AIR QUALITY MODELS 03/13/2012 CCR#16766-1 376
220:7 284:21284:25 288:11303:6 314:21
generated 61:10
214:13 288:24289:1 294:14317:16
generates
172:10 286:11286:14
generating 276:18
generation 16:3
generator 50:18
generators
49:25 50:21
generic 293:22
geometric 94:8
94:18 104:7104:7 104:16113:22
geometry 78:4
124:25 150:16
geophysical
316:25
Geophysics 296:22
299:20
George 4:3 6:25
9:23 9:24 17:123:15 23:2238:21 38:25 40:341:23 43:8 91:18144:19 146:6165:25 185:19219:19 229:10237:15 305:18
Georgia 207:16
geosciences 301:2
GeoTIFF 117:8
GEP 66:14 66:14
67:1 67:9 67:9
68:4 68:968:22 68:22 69:669:12 69:2169:23 69:23 70:270:16 123:18124:10 124:11127:2 134:2137:17 138:10138:14 139:6139:15 139:25
GEP's 66:4
Gesser 207:15
get...you 119:6
gets 32:13 79:7
79:9 88:4 126:12202:4 203:14281:7
getting 23:17
27:10 30:2152:23 115:7141:20 156:6156:12 168:12204:12 209:16209:25 235:24254:22 267:7267:22 267:23275:8 294:24295:14 295:14300:18 308:22319:25 319:25
Gina 14:6 23:10
given 5:22 39:9
45:25 50:1651:11 51:16 88:191:14 104:17107:10 112:4127:19 140:19142:22 210:11213:4 261:11262:1 268:13271:16 277:13281:8 282:17286:6 288:3
gives 30:18 42:18
83:1 189:9240:25 301:6321:1
giving 27:7
158:18 236:8
glad 3:7 10:9
13:10 175:9213:15 241:24242:2
goal 27:3
Golden 298:9
Golder 284:19
golf 101:13
101:16 110:23110:25
gone 48:9 179:1
237:25 268:1
good...is 132:14
Google 98:11
102:24 103:15
got...you 107:17
gotten 28:9
121:10 309:4309:19
govern 306:21
GP 66:21
grab 13:18 146:4
grabbed 299:3
grabbing 307:7
grad 97:6
grade 158:23
159:10 177:13177:13
gradient 53:10
53:23
grand 133:24
grandfathered

10TH CONFERENCE OF AIR QUALITY MODELS 03/13/2012 CCR#16766-1 377
66:17
grandkids
234:25 234:25234:25
granola 6:20
grant 234:21
236:2
granting 23:11
graph 190:17
graphic 241:10
graphical
274:25 275:5276:15
grass 96:20 100:3
100:16 100:22100:23 103:5103:11 107:18107:23 108:4109:18 109:23158:3
grassy 100:18
103:9 111:1
gravity 317:7
great 7:10 9:8
10:2 10:15 10:2210:24 13:11 25:532:25 208:15224:14 224:21228:3 268:1268:3
greater 21:19
34:3 65:966:15 68:1668:21 106:8248:13 287:6300:7 321:5
greatly 10:11
10:19 11:1512:11 19:7139:23 159:25
green 71:21 89:24
101:11 105:18190:25 193:3254:11
Greenwich 83:2
83:3
GRIB 301:22
grid 31:19 79:1
118:22 142:25183:20 201:7240:17 272:20283:20 285:15285:24 301:4303:6 307:11308:1 316:16317:3 317:3319:25 320:1
gridded 18:22
94:18 281:24305:8 322:16
gridden 94:18
groove 25:19
ground 118:18
129:16 158:1177:21 184:4184:4
group 11:7
11:10 11:1614:20 15:1217:11 25:9 27:2028:1 29:8 30:679:21 80:21 84:884:9 84:1386:6 86:16 86:1987:6 142:22155:19 166:24202:3 203:18209:22 210:12212:1 216:10230:6 234:19277:19 314:7
groups 14:21
29:23 167:22
grow 54:13
growth 113:8
guarantee 6:11
guard 4:24 5:20
323:6
guess 43:5
43:15 44:2447:11 51:2252:19 54:8 54:1255:16 56:3 56:1271:7 83:14132:13 141:5143:21 160:4166:13 185:20186:14 197:16206:17 206:18207:4 208:4208:11 212:18216:3 217:21217:24 219:22221:18 226:8226:14 227:1231:18 270:24278:13 310:25311:1 313:9322:24
guess...but
135:14
GUI 301:5
guidance 9:15
9:20 12:1713:5 17:16 17:1717:20 19:14 23:126:18 27:14 30:833:21 36:1436:18 37:440:8 42:3 44:447:12 50:7 52:2264:8 106:9117:24 125:8128:8 141:17146:24 147:2147:3 147:8147:11 147:13

10TH CONFERENCE OF AIR QUALITY MODELS 03/13/2012 CCR#16766-1 378
147:17 147:24148:10 148:18148:21 148:24172:11 185:18186:13 188:17188:18 189:3190:12 194:13194:22 195:18196:18 197:1205:6 209:3209:7 209:17209:23 210:24212:5 218:14221:22 221:24223:25 226:19226:25 229:18231:13 231:14232:6 232:15236:17 236:21237:17 239:22273:4 276:19280:10 309:23312:10 313:7
guidances 239:20
guide 90:17
93:6 93:20 93:2494:1 94:2298:2 104:25195:11 207:24282:24
guideline
155:20 155:21155:22 204:22205:3 231:20239:13 239:15284:17 307:22
guidelines
41:21 42:14147:5 189:7189:8 195:14206:12 277:19
guides 59:17
guilty 280:5
Gulf 321:13
gun 4:24
gust 33:2 83:6
101:19 101:21102:1 102:13103:17 105:11105:15 105:16106:3 106:7106:16 106:17106:23 108:12108:21 108:23109:7 109:9110:2 110:2112:1 113:25115:1 115:10115:15 115:19116:11 116:12116:15 117:22118:8 135:1135:3 135:9135:10 135:12
gustiness 106:12
guys 10:15
10:23 14:10 80:9213:19 213:22220:6 220:18221:1 224:20
H
half 6:3 38:7
62:18 64:9 64:1188:7 88:888:11 106:14127:13 127:14136:17 136:18140:3 151:7169:10 170:17172:7 173:14197:25
hallways 13:19
halves 124:8
124:13
hand 9:22 51:5
228:13
handful 317:2
handle 5:21
40:3 153:1240:20 260:8260:9
handled 50:4
184:19
handling 117:9
177:5 177:11240:22 241:3242:14 301:18301:21
hands 185:21
handset 5:19
Hang 213:22
Hanna 157:12
212:8 212:8268:19 268:19
happen 5:23
19:8 73:13 159:6195:8 214:5240:2 266:2
happened 97:10
116:1 148:8199:17 266:15
happens 133:19
177:15 215:23240:21 240:21
happy 64:13
139:10 246:7
hard 9:20 10:25
22:9 41:170:10 100:17154:12 224:15260:7
harder 144:13
203:10
harmed 213:6
Harmonization

10TH CONFERENCE OF AIR QUALITY MODELS 03/13/2012 CCR#16766-1 379
18:6
harvest 96:11
96:15
hassle 3:10
hate 214:21 219:9
haul 166:4
166:5 166:16167:5 168:1171:1 171:16174:11 177:4181:21 181:21181:24 183:10203:18 203:21213:15 213:21214:4 220:3
haven't 6:5
48:9 51:17 61:1669:12 93:6119:18 121:11124:20 159:5221:6 238:12243:8 244:24290:20
having 6:16 32:14
60:5 160:18186:1 209:17209:21 210:16211:20 225:6241:17 242:7259:6 276:6284:5 304:22
Haywood 74:13
haze 231:9 233:17
HDF 301:22
head 290:22
290:22
header 310:19
heading 151:11
Headquarters
10:16
heads 17:5
health 8:17 9:3
9:6 9:7 9:10135:1 191:11
hear 13:11
13:12 14:1 17:1424:2 56:13140:13 227:19238:3
heard 12:10 86:10
91:12 145:23146:1 175:16203:19 204:8212:11 212:12243:8 308:23
hearing 3:18
215:20 218:10
hearings 25:11
heart 227:2
heat 71:10
heavily 310:6
height 54:24 65:4
65:9 65:10 65:1565:18 66:4 66:1466:15 66:1666:16 66:1766:19 66:2166:22 67:167:2 67:9 67:967:20 67:2267:24 68:368:4 68:6 68:768:9 68:12 68:1468:16 68:1768:18 68:2068:22 68:23 69:269:6 69:10 69:1269:15 69:2169:23 70:170:2 70:570:14 70:1673:17 112:13112:16 112:17112:22 113:9
113:10 117:19118:21 123:18124:11 126:11126:17 128:5128:7 133:17133:17 134:2134:4 134:8134:11 134:16134:19 138:1138:10 138:14138:15 138:15138:17 139:4139:16 139:25146:20 151:7151:10 151:17151:24 151:25152:20 158:9165:17 165:20168:21 168:21168:23 168:24169:17 169:19171:7 172:4172:5 172:7172:8 172:21173:12 173:13173:13 173:14215:2 321:1321:8 321:9
height...well
124:10
heights 65:14
67:18 68:5 73:20129:17 165:18168:19 168:20169:2 169:9170:10 170:16170:18 170:20170:22 283:9292:20
held 12:3 66:7
80:10
help 12:2 48:15
89:5 108:9 111:3206:14 214:24220:2 223:18

10TH CONFERENCE OF AIR QUALITY MODELS 03/13/2012 CCR#16766-1 380
227:23 260:20261:17 289:24
helped 56:8
helpful 54:1
helping 19:11
33:3 258:22290:10
helps 26:24
226:20
Henderson 139:14
here...how 124:5
here...kind 110:9
hereby 147:25
here's 56:10
150:17 151:1154:21 168:15172:1 228:8254:10 255:21255:21
Herman 271:17
282:16
he's 201:17
220:20 313:18313:19
hesitate 14:16
23:19
hey 314:16 320:13
Hi 198:9 200:20
204:16 210:3212:7 219:17224:5 259:1268:18 314:15
high 24:23 41:5
71:16 91:23 96:398:13 100:12100:13 100:21109:1 109:11109:20 111:20111:20 128:23131:11 131:12131:12 149:12
150:23 151:12257:1 259:18284:8
higher 58:2
58:9 63:23 67:2168:7 68:8 69:370:4 89:17107:14 111:18119:7 128:7129:20 134:8134:10 134:18138:19 150:22152:5 160:15160:16 161:7163:24 164:1164:2 170:21170:24 173:20181:13 184:7190:2 226:18246:3 246:6247:4 249:7249:10 250:3257:15 257:21277:8 307:9
highest 33:22
33:25 102:14123:18 124:10126:10 131:16142:21 163:2163:19 195:14250:8 252:10252:20
highlight 15:19
98:2 105:24105:25 186:13277:9
highlighted
44:8 48:17 101:9
highlights
105:8 111:14111:23 120:2236:8
highly 118:22
176:5 176:11
311:21 311:23
highway 186:21
186:22 188:8188:10 188:20189:20 189:25189:25 190:18190:19 192:19193:25 194:15198:14 204:19205:1 212:14212:17
highways 192:15
hill 203:17
246:25
historically
7:9 7:20 8:20
history 35:17
74:16 82:898:6 98:10 120:3147:21 243:20
hit 23:23 24:3
24:8 24:23 30:10135:13 140:18140:22 147:23179:10 211:17
Hoffnagle
198:19 239:10260:4 270:18
hold 7:7 12:4
118:12 297:20
holds 45:9
home 228:18
honest 26:23
271:9
honestly 26:4
honor 32:13
honored 26:22
hope 11:20
11:24 13:1618:19 29:24 45:954:1 101:3

10TH CONFERENCE OF AIR QUALITY MODELS 03/13/2012 CCR#16766-1 381
119:19 123:13141:5 226:5296:2 316:18323:6
hoped 64:16
hopeful 14:1 14:4
hopefully 3:8
17:7 21:1249:9 51:1955:6 64:17 133:9145:21 179:15185:11 205:19211:25 226:20227:18 236:5
hoping 98:16
132:20 143:9
horizontal 90:8
95:17 123:7125:12 183:17283:20 306:13307:11 319:8319:11
horrible 254:15
host 22:11 36:11
hot 17:19
186:12 187:11187:16 188:12188:17 189:10189:20 196:24197:22 205:6212:11 221:11221:23 222:18222:20
hotel 144:17
228:15
hour 6:3 6:11
17:8 20:721:12 48:22 51:855:19 57:6 57:1759:24 61:6 63:1064:19 71:1771:24 85:585:5 85:8 88:1
88:3 88:6 88:788:9 88:10 88:1188:11 88:1388:14 88:18130:23 134:23136:12 136:17136:19 137:16137:19 139:16143:18 143:20144:1 144:6145:8 196:20197:25 201:1202:17 210:21210:25 224:19224:25 248:5249:15 251:4251:5 251:12254:10 255:17255:18 256:12256:16 257:8257:8 257:13257:14 271:7271:9
hourly 44:7
48:7 48:8 50:661:10 61:1361:20 64:12 71:272:7 81:4 81:881:9 82:384:25 85:1887:11 87:1387:24 88:1388:20 91:24201:14 300:12
hourly...if
136:11
hours 6:3 50:19
50:22 50:2451:10 57:11 59:860:4 63:11 64:1971:10 82:3 87:2189:14 95:6164:24 164:25201:12 201:13251:4
house 3:8 25:6
houses 104:1
104:4
HRVs 232:11
Huber 128:18
129:15
huh 219:22
Hui 228:12
human 8:17
humidity 299:16
hundred 315:17
hurdles 132:18
hurricane 57:7
HUSWO 73:12 73:14
85:4
hyperbolic 152:2
hypothetical
212:21 289:15
I
I...there 140:12
i.e 68:19
I/O 298:20 298:25
I-40/I-540 115:23
I-540 107:20
ice 84:9 84:13
86:6 86:10 86:1687:5 87:687:15 87:20 89:790:22
I'd 156:8
156:17 157:10168:17 174:25180:17 206:12215:20 311:19313:12 313:16313:17
ID 75:2

10TH CONFERENCE OF AIR QUALITY MODELS 03/13/2012 CCR#16766-1 382
Idaho 161:15
162:24 163:5163:16
idea 16:7 55:7
79:3 99:9114:1 118:20126:8 138:24143:16 169:15179:7 203:12283:21 294:23
ideal 7:22 113:19
140:15 251:17
ideally 150:10
ideas 126:17
ideas...we 98:1
identical 287:19
identified
41:18 54:11121:22 125:7149:10 202:14250:5 306:5
identify 3:25
11:9 98:12 118:2133:4 167:16231:7 234:11249:23 268:8
identifying 281:1
IDV 303:1
if...I 118:4
137:14
IFW 84:8
ignore 67:8 84:19
126:13 128:1134:15 141:2144:2
ignored 56:13
65:8 70:11 71:25
ignoring 66:11
67:10 67:14 69:169:10 144:3
211:15
II 159:17
IJ 285:7
I'll 29:13 54:4
64:3 146:4 153:2156:5 157:15159:2 176:16186:14 187:15188:11 191:18198:8 199:20207:16 212:18220:23 221:19223:6 227:2227:10 270:17285:19 287:10319:14 323:9
illogical 141:1
illustrate 212:21
illustrates 113:5
I'm 10:9 51:18
122:2 128:25146:7 146:9157:8 157:15159:5 162:22166:2 166:2166:3 166:6168:9 175:9183:8 188:3190:10 191:9198:17 198:19198:21 202:13203:16 207:15213:15 218:15218:16 219:19220:16 221:22224:5 225:2225:9 228:1228:24 230:9236:8 237:15243:11 243:25259:1 259:7259:16 270:14271:6 271:8271:12 289:10
289:21 303:18306:25 313:9313:10 314:11316:21
image 37:25
imagination 302:1
imagine 3:10
137:15 209:5216:21 234:9
immediate
122:24 236:19
immediately 188:8
191:12 214:15215:10
impact 34:1 43:22
44:17 47:1047:22 53:1368:15 73:2276:25 105:24143:22 170:17174:6 182:21199:10 201:10215:5 215:18242:13 242:17257:1 289:6290:25
impactor 52:6
impacts 8:16
9:3 23:9 45:2046:8 47:8 52:568:20 72:10144:6 167:6180:19 180:22182:6 182:19203:13 216:19231:22 240:14246:3 247:5256:6
impairment 231:16
impervious 100:10
116:17
implement 48:14

10TH CONFERENCE OF AIR QUALITY MODELS 03/13/2012 CCR#16766-1 383
implementation
9:2 17:11 66:380:21 92:5 92:2493:6 93:20 94:22103:21 104:24120:21 122:20189:8 195:11207:24 225:14
implemented
47:3 51:18 54:2465:4 66:12 93:22187:17 241:6263:7
implementing 16:5
48:20
implications 8:10
35:10 40:1 72:17124:25 285:19
implied 43:20
implies 306:14
imply 148:11
306:18
importance
24:11 30:1141:14 42:8 48:1849:23 215:12
important 3:22
8:7 11:11 20:822:3 36:940:10 44:7 46:1454:5 54:856:21 60:1065:24 70:2073:13 94:2495:11 99:12117:1 121:13124:19 137:7137:8 137:10137:10 149:5158:8 162:4162:9 165:12168:4 171:20171:23 173:2
206:1 209:24214:7 221:16222:20 232:5235:8 239:18249:6 249:16263:8 263:10266:9 272:9277:21 293:4300:10 303:14319:1 321:20
important...
most 90:20
importantly 15:19
90:20
imported 157:23
imposed 271:14
271:15
impressed 12:24
improve 9:15 9:15
16:1 18:2420:5 20:1321:4 21:14 37:12120:13 132:6134:4 214:25216:12 223:23305:10
improved 8:12
19:21 63:25120:22 159:25160:25 163:9164:13 165:4216:1 239:3250:10 295:16
improvement
20:1 21:1 22:1120:5 131:19132:3 163:11233:9
improvements
12:17 131:20132:21 163:13164:4 164:7179:19 179:20
179:23 185:2
improving 214:6
in...but 137:18
in...I 136:15
inaccurate 240:19
inappropriate
67:11 134:14
Inaudible 63:20
inclined 134:9
include 45:21
69:24 139:5143:22 191:24192:1 196:1205:7 233:13262:25 262:25263:18 283:2292:19 308:18310:14
included 44:16
53:8 69:5 93:893:24 109:4120:15 143:1196:9 217:23224:18 230:13248:18 254:20257:5
includes 46:24
55:1 64:1798:6 99:3189:3 246:22293:12
including 17:23
18:23 20:271:3 78:16 92:14167:13 222:22250:6 252:7305:9
inclusion 78:10
254:18
incomplete 276:10
inconsistency

10TH CONFERENCE OF AIR QUALITY MODELS 03/13/2012 CCR#16766-1 384
123:11
inconsistent
277:2
inconvenience
199:5
incorporate 41:25
128:2 235:6235:10 254:7
incorporated
65:11 69:20 70:974:21 96:6125:13 150:4266:10
incorporates
242:14
incorporating
89:3 122:25
increase 57:11
58:23 59:1 67:1067:15 68:1268:15 68:21 69:989:16 110:4111:10 242:23
increased 22:21
48:17 57:9 66:24164:3 170:14170:21 200:14203:22
increasing 170:10
170:11 177:1
incredibly 12:19
increment 230:25
independent
160:20 265:7311:7 313:2313:5
independently
252:4
index 285:10
Indiana 137:13
Indianapolis
71:19
indicate 49:13
160:13 171:22303:16
indicated 45:4
48:21 132:15160:12 160:21200:13 200:14202:22 223:11229:10 253:25275:18
indicates 94:23
indicating 120:10
indication
92:20 101:22251:21
individual
128:1 128:1187:13 192:17240:16 265:16269:11 269:22278:25
induce 273:22
276:22 278:15
inducing 278:14
industrial 96:4
99:3 99:5 104:11107:24 166:22176:6 177:6178:20 205:2
industries 147:13
175:13 184:18
industry 7:23
13:2 29:2342:9 147:4 148:3155:19 179:8267:14 296:12
inexperienced
274:4
infamous 259:2
infancy 305:24
313:15
infinitely 154:16
influence 56:9
69:19 70:895:6 102:15105:19 112:25123:22 124:2126:15 127:15128:10 135:12174:5 248:23321:6
influenced 72:7
123:18 134:24
influences
66:12 66:2467:21 67:23 69:569:11 70:570:7 95:2 114:10121:1 134:5137:21 254:3316:19
inform 141:21
141:24 212:5227:20 236:25
informal 37:16
information
7:10 9:1412:12 12:1218:18 37:1638:17 44:1444:21 48:10 49:749:10 49:1649:18 49:1964:25 91:18 98:398:17 122:15128:8 135:13135:25 141:20162:2 166:15167:25 168:10168:17 170:9171:14 173:25188:19 193:5197:17 209:22

10TH CONFERENCE OF AIR QUALITY MODELS 03/13/2012 CCR#16766-1 385
217:23 218:3219:12 221:21221:24 222:25223:2 223:5223:22 225:11225:11 225:13225:22 225:24225:25 226:13227:9 229:2237:10 237:12237:21 251:8255:12 258:20267:23 268:2268:3 268:10
information...
aerial 102:22
informed 233:4
infrastructure
72:13
Inga...I 101:24
inhalable 180:6
inherit 314:20
315:3
inherited 65:6
74:15
initial 56:6
56:17 82:893:3 110:1 204:6214:17 253:13292:12 294:13
initially 120:18
initiated 158:21
Inn 228:10 228:10
228:14
Inorganic 242:20
input 19:15 22:19
75:4 77:1078:1 78:378:23 79:384:4 84:586:13 93:3 96:23
128:8 132:19134:21 140:21146:21 153:13153:20 156:25209:19 211:21214:7 214:8235:24 253:25274:8 274:14284:22 286:10309:15
inputs 8:10
20:2 22:348:19 61:11 74:375:20 78:784:3 92:11 92:2192:22 129:19130:8 132:5146:14 153:11154:6 154:8154:20 154:25155:10 155:14223:15 235:16247:13 286:12294:11 294:16304:21
insensitive 38:20
38:22
inside 104:6
in-stack 48:18
49:2 49:849:14 77:16
installations
98:14
installed 255:13
instance 240:24
instant 183:19
instead 70:14
76:1 91:10201:14 269:2
Institute 74:7
177:25 213:17277:14
instituted
163:8 163:10164:7 233:1
instituting
164:13 164:16
instrument
60:25 63:24106:24
instrument...
But 114:2
instruments 114:3
insufficient
35:24
insuring 307:10
integrated 300:24
integrity
280:16 280:20285:17
intend 127:21
133:22
intended 70:17
186:24 239:16250:17 280:19
intensity 96:3
96:3 100:11100:13 100:13100:14 100:19100:21 103:12103:25 104:10104:19
intensity...
developed 109:24
intent 234:7
intention 312:21
intentional 55:22
109:20 109:21
interact 202:8
interacting 40:14
interaction

10TH CONFERENCE OF AIR QUALITY MODELS 03/13/2012 CCR#16766-1 386
17:5 111:19
interactions
11:17 12:15 40:6
inter-agency
233:7
interchange
190:21
interest 11:20
22:22 31:7139:20
interest...the
90:15
interested 14:5
137:3 178:14197:11 214:24215:20 258:23
interesting
109:14 116:14136:5 136:14152:15
Interestingly
173:16
interface 19:4
228:22 271:22274:25 275:5282:15 310:16
interfaces 241:10
276:15
interfere 248:9
interference
249:15
interim 47:11
187:4 212:5236:18 280:18
Interior 18:2
intermittent
49:24 50:1 50:11200:23 202:14203:6 224:20
internal 27:20
37:5 37:12 37:1740:20 55:673:9 112:9 113:1128:3 294:9
internally 27:5
27:18 109:3230:22 234:17
interpolated
291:22 320:15
interpolating
205:9
interpolation
306:13 319:8319:11 319:16319:20
interpolator
283:21
interpret 50:15
51:16 87:1140:25
interpretation
26:18 226:24302:17
interpreted
26:1 40:8148:4 301:14
interpreting
226:22 304:22
intersecting
170:4
intersection
187:17 190:3192:19 194:15
intersections
192:15 194:1
interstate 248:8
interval 251:23
254:24
intervals
131:23 251:20
253:18 295:25
introduce 10:2
80:13 81:19233:22 243:7263:10 272:24273:1
introduced 33:2
33:3 36:12 57:13273:9
introduces 116:4
introducing
16:2 235:23275:4
introduction
81:15 188:24
introductions
157:6
invalid 88:20
inventory 225:9
inverse 94:7
investigators
183:18
investments
186:25
invite 207:17
invited 29:22
146:3 211:13
inviting 186:6
involve 139:23
194:1
involved 28:23
32:6 43:24 44:15121:15 121:24168:5 178:13189:13 193:11202:4 244:19273:14 313:16
involves 158:10
194:9
involving

10TH CONFERENCE OF AIR QUALITY MODELS 03/13/2012 CCR#16766-1 387
161:16 190:1190:19 244:12
Iowa 35:11
iron 175:12
176:24 177:24
Irwin 148:25
149:1 274:5
is...again 138:9
is...has 123:11
is...I 118:5
is...it 140:23
is...probably
132:13
is...that
129:20 132:8
is...there 130:1
is...way 109:7
ISA 266:21
Isakov 120:16
ISC 16:21 24:9
36:16 55:1856:24 57:257:3 57:25 62:1365:7 65:12 65:2375:17 75:1792:12 146:25147:8 149:18219:21 239:25254:12 265:17
ISC3 55:11 55:11
ISC-PRIME 65:12
65:22 66:1
ISCST 120:6
ISHD 59:8 84:24
85:3 85:385:13 98:18
island 71:10 72:1
isn't 28:19
49:2 114:3 118:7
204:13 220:12222:5 223:4252:20 255:20
Isoporeum 242:20
issue 26:5 27:3
27:24 28:12 29:330:8 31:18 31:2533:7 33:933:19 35:1239:17 48:1649:22 50:350:5 50:753:20 57:4 57:2457:25 58:2465:21 69:1670:14 70:20 71:771:14 72:8 72:2373:16 73:1682:20 82:2387:19 99:1199:12 101:1101:8 102:17104:24 105:6105:6 105:8106:25 107:20112:2 116:24120:20 121:12121:13 123:25124:16 124:21125:12 126:1126:18 128:6137:24 143:9155:16 158:8166:19 167:16167:21 181:20182:9 202:6209:2 209:7209:18 210:7211:11 216:6216:7 216:8229:23 240:12240:12 242:3244:24 245:19246:18 249:16263:25 295:24
297:21 298:1320:4
issued 21:9 34:23
39:21 41:1041:11 43:1 44:1045:10 69:13244:1 249:2280:25
issues 12:3
13:4 13:5 14:917:6 18:12 21:1923:4 24:1626:5 26:926:19 27:1927:21 30:20 31:132:17 32:2533:12 33:1434:10 35:1539:24 40:7 40:1740:25 44:6 44:1544:17 46:1354:14 55:255:9 56:1657:3 59:663:19 70:1880:19 82:1382:13 91:591:8 92:592:24 93:1393:16 96:2198:25 99:1 101:1105:23 105:25106:21 106:22112:4 113:25117:17 117:20118:2 118:4118:13 119:20120:21 120:23121:9 121:17122:20 123:2123:7 123:14124:4 124:5125:5 126:20127:19 127:20127:22 133:14

10TH CONFERENCE OF AIR QUALITY MODELS 03/13/2012 CCR#16766-1 388
137:1 138:7141:13 141:14141:25 142:22165:19 176:14176:22 202:4203:19 209:13209:13 210:19210:25 215:15216:20 217:7224:2 226:17226:18 227:14227:15 229:13235:13 243:16243:18 246:12249:1 250:5250:19 252:8255:10 258:5261:12 261:21262:3 263:13263:15 279:19297:13 317:13
issues...
limitations
93:15
issuing 236:21
it...I 135:7
143:24
it...was 91:16
italicized 277:10
item 91:16 245:19
items 141:25
157:22 277:8
iterate 113:19
It'll 213:23
239:12
it's 26:2 48:14
49:4 49:20 50:1851:19 58:18 59:4124:8 149:7151:22 152:11152:12 154:12155:5 162:8
165:6 166:12166:12 176:3176:15 178:7178:10 183:7185:4 185:12199:13 203:2203:11 207:6207:11 208:25210:9 211:14211:15 212:17212:23 213:8213:9 214:10214:13 214:17215:4 215:7216:6 216:7216:8 216:17216:17 217:8217:21 222:6224:15 224:20232:5 233:1235:8 238:14241:16 244:22247:6 247:21250:1 250:1253:2 253:9254:15 254:15255:22 255:23256:3 256:4258:7 261:4264:18 264:19265:1 266:6266:12 267:10269:22 270:12273:9 279:10279:14 280:14283:10 283:21284:23 284:25285:14 287:20288:23 291:4291:9 291:16292:16 293:4296:2 296:23297:25 299:6299:8 299:18299:19 299:22300:25 301:5
301:14 301:15301:23 302:18302:18 302:19302:20 303:14304:9 306:15307:22 308:8310:18 311:4312:17 313:13313:14 313:14314:22 315:9315:10 318:6318:17 319:1319:10 319:17319:21 319:25319:25 321:1322:3 322:6
IV 28:16
I've 145:23
177:18 198:24199:16 212:10212:12 213:10221:8 237:7306:25 317:4317:19 319:8320:13
IWAQM 32:8 229:18
236:14 246:21247:2 273:4273:13 273:25275:21 276:19277:24 283:13
J
Jack 25:1
jam 83:16 83:22
James 9:23
17:13 80:13 91:3
Janet 13:23
January 25:17
93:5 234:22282:24
Java 301:1 302:18
302:18
10TH CONFERENCE OF AIR QUALITY MODELS 03/13/2012 CCR#16766-1 389
Jeff 120:15
157:11
jerk 66:6
Jersey 80:23
243:23 248:1248:11 248:22249:7 249:16251:3 252:7252:9 255:13256:8 259:2270:8
JFK 97:22
Jim 25:8 74:13
Jing 142:5 199:25
jive 257:25
JMARTIS 267:10
job 25:7 25:15
221:17 221:19221:20 223:4241:15 306:10314:2
jobs 204:18
Joe 80:23
148:25 238:2262:18 263:11272:11 319:5319:24 322:21
Joe's 276:20
John 148:25 149:1
274:4
join 14:19 160:16
joined 9:24
10:1 17:1
joining 17:21
joint 17:24 59:22
62:4
jointly 198:13
joke 26:18
journal 168:7
168:10
judgments 276:6
July 57:13 256:21
jump 31:8 181:4
223:8
Jumps 312:2
June 229:4 256:21
259:13
Jupiter 83:14
just...hard 108:4
justice 219:2
234:20
justification
29:6 32:23 35:2467:14 105:4153:7 153:8225:20 225:24232:8
justified 31:20
308:3
justify 21:13
52:12 139:3142:8
justifying 70:4
K
Karamchandani
230:8
Kendall 143:15
Kentucky 197:10
key 6:23 7:15
48:16 70:15 84:684:14 84:15 86:695:23 96:23114:8 115:7236:12 245:5245:19 251:24274:24 278:9282:9 283:18283:23 289:2290:12 296:18
299:17 299:25302:12 306:12
keyword 76:8
79:10 79:12
kick 3:6
kicked 166:22
kil...it 96:24
kilometer 31:19
32:23 94:9 94:1996:24 97:16103:6 105:1105:2 105:5105:10 108:19108:22 109:10112:5 115:25116:2 163:1231:2 317:18
kilometers 52:7
53:13 76:176:3 76:4 94:394:5 97:15 97:1797:22 97:22143:20 212:22231:1 240:1240:7 240:11240:12 243:15255:15 255:23281:17 281:18281:20 290:3290:4 290:4290:16 290:17306:25 307:2311:18 311:23312:3 312:6315:4 315:18317:19 317:25320:8 320:13320:14 320:15320:16
kilometers...
there 97:23
Kincaid 246:23
kinds 101:16

10TH CONFERENCE OF AIR QUALITY MODELS 03/13/2012 CCR#16766-1 390
125:10 167:7167:9 167:19176:23 177:2179:5 183:9186:25 190:8191:24 193:24194:4 194:10195:20 196:5204:7 205:16205:18 266:22
Kingdom 159:16
Kinley 267:2
Kirk 271:4 313:17
knee 66:6
knew 46:18 224:17
264:14
knocked 57:7
knot 57:15 61:7
61:7 87:9 87:10
knots 56:16 62:23
62:24 63:1 81:2381:24 82:21 83:883:13 86:14 87:487:10 87:1791:11 106:8
knots...so 82:22
knowledge 8:12
276:1 279:8279:18
known 238:12
238:20 263:16263:19
kosher 198:6
Krivo 32:13
kudos 34:13
L
lab 181:2
lack 167:11
183:18 233:19241:16 279:3
279:17
lady 228:9
lagged 43:17
lagrangian 240:15
laid 43:9 121:7
143:8 253:22272:11
lake 5:15
255:14 275:7
Lakeside 5:6 6:7
Lambert-conformal
284:2
land 17:23 19:3
32:2 95:15 95:1695:25 96:11 99:299:22 100:10101:3 101:7101:18 102:15102:18 102:20102:23 103:16103:23 105:19105:21 105:25106:4 107:20107:22 109:17109:22 110:15110:16 112:25113:2 113:12113:18 115:10115:11 115:17116:20 118:2119:8 119:14121:4 229:23230:17 230:23232:8 232:18233:6 236:14238:19 239:21241:13 262:4271:13 278:3280:4 291:21291:24 296:21311:6
landed 25:16
landings 135:3
lands 184:7
lane 169:5
169:6 169:12172:19
lanes 172:19
190:20
language 301:11
301:14 301:15301:24
large 5:11 9:13
18:19 49:25119:12 152:7153:8 180:25183:15 189:25190:2 190:5190:6 190:22212:17 252:16266:19 312:2321:13
largely 16:23
larger 36:6
124:19 127:8130:10 140:5165:1 186:25212:17 240:25241:1 254:21292:3
largest 248:20
250:2
Larry 135:15
213:13
last 14:10 17:2
17:25 18:1225:14 25:2429:21 39:1439:22 42:6 70:2483:20 88:8 88:1191:16 114:11122:19 123:15125:6 152:9152:9 157:9

10TH CONFERENCE OF AIR QUALITY MODELS 03/13/2012 CCR#16766-1 391
157:23 166:8198:20 210:8217:22 223:12229:1 229:3230:16 238:7264:3 265:2271:1 292:10
lastly 10:18
168:6 174:19
late 6:14 96:11
230:2
later 3:22 4:5
15:8 17:617:14 17:21 33:857:1 61:874:22 74:2479:18 99:24101:20 140:14148:9 179:15264:12 270:8280:23
lateral 70:14
162:1 162:5162:12 165:1170:15
latest 49:12
75:19 87:8 91:15191:13 191:17221:20 222:8223:5 237:7237:21
latitude 98:1
285:5
lattice 150:25
151:4 151:11151:15 151:20
latticework
151:22 152:16
lawn 104:2
lawsuit 234:6
lawyers 28:7 41:4
lay 301:25
layer 58:17 92:16
112:10 112:12112:17 113:2113:8 113:14113:17 116:22192:13 283:12283:15 283:17288:11 321:7321:8
layer...an 113:1
layer...
internal 113:8
layers 113:5
283:6 292:21
layout 249:17
lays 51:25
LCD...land 95:16
lead 9:15 15:25
139:12
leadership
16:17 17:13
leading 8:17
17:12 22:1725:22 180:21
leads 182:5
242:16
leaf 285:10
learn 16:4
21:25 102:21197:3 197:4
learning 12:12
197:11 223:19
least 15:14 28:16
32:22 34:1 34:1742:18 44:8 46:1847:16 49:1 58:1459:20 66:24 67:467:10 67:1468:19 71:13 88:688:8 88:10102:13 111:3
114:13 127:17129:13 140:15154:3 173:18195:2 195:10233:21 238:1258:6
leave 6:9
253:17 323:6
Lebeis 200:20
led 165:19 170:10
208:16 236:15279:2
legacy 16:22
legal 8:21
legitimate
101:6 104:8
length 9:21 32:25
106:23 114:1124:23 126:3129:4 129:4129:5 130:11130:25 131:10146:20 154:17158:16 158:20173:9 173:9284:20 285:11287:6
length...try
128:16
lengths 129:22
131:24 132:4268:2
lengthy 42:21
145:23
lent 106:20
Leonard 220:2
220:11
LES 317:10
Leslie 224:5
less 34:18
51:14 56:15 57:3

10TH CONFERENCE OF AIR QUALITY MODELS 03/13/2012 CCR#16766-1 392
62:6 63:463:22 64:9 64:2065:21 69:2581:22 86:14 87:389:12 99:18100:8 100:11123:25 126:22137:10 137:11142:23 151:23152:17 157:25158:3 158:5188:1 213:9240:7 265:13270:19 275:9288:17 291:4312:21
less...I 137:9
lessening 273:25
lesser 70:1
lets 194:11
let's 12:14
15:6 28:872:15 72:18 80:580:6 97:21103:21 110:23116:13 155:7156:10 157:13175:5 186:16190:15 190:21192:18 192:19201:21 322:25
letters 75:22
level 5:3 11:19
41:14 46:1653:13 72:5 78:1395:3 95:4 101:23106:11 129:17140:25 159:21159:22 160:23161:16 164:6164:7 175:18177:20 179:10179:11 187:6187:20 188:7
193:9 197:5200:10 203:22207:20 218:5218:5 224:15225:6 226:19229:9 256:3266:18 270:11
levels 43:22
92:15 164:2192:16 292:14
life 187:23
light 16:6
24:13 31:2 56:1562:19 82:6103:11 123:16162:11 204:12246:16 255:13267:4 307:25
light...low
109:20
likely 136:9
171:11 207:7
Lilliputians
103:14
limit 56:18 68:11
68:14 68:2368:24 69:169:3 69:469:19 69:19201:12 212:12
limitation 316:15
317:20 317:21318:2 318:6
limitations 75:17
138:5 144:4144:8 245:4276:10 282:9
limited 157:25
171:21 179:13205:12 210:13281:16 289:11298:14 302:1
303:11 316:24
limiting 46:25
limits 70:2 95:19
251:14 251:15
line 41:2 58:21
68:6 70:10 72:2272:24 79:279:5 79:8 79:879:8 79:12 86:1990:8 108:18108:25 120:12121:14 125:4129:15 129:18145:22 154:22160:9 174:14181:25 183:11190:18 194:13210:7 247:3247:4 270:1307:16 309:7322:16
line...same 86:19
lined 181:24
lines 108:11
155:5 155:11165:12 210:18212:2 216:25
link 38:16
41:21 42:3 90:1790:21 106:11
links 90:15
191:19 193:2
Linux 25:13 283:3
299:25 300:3301:6 302:11
list 42:25
84:24 85:1390:25 91:1697:12 97:12135:20 147:9277:8
listed 90:17

10TH CONFERENCE OF AIR QUALITY MODELS 03/13/2012 CCR#16766-1 393
90:25 154:20
listen 13:20 14:5
listened 139:15
listening 6:1
lists 42:5 85:8
90:22
literature 20:20
little 3:11
14:1 15:724:24 25:1 25:1841:2 43:16 43:1843:23 57:2467:19 73:10 79:794:16 96:1799:21 99:25100:8 103:10107:14 108:16115:3 115:13115:16 115:25117:22 117:23119:5 119:10120:3 122:11130:24 131:1131:5 132:17132:18 136:7137:11 141:14147:20 151:2157:15 166:3166:6 169:15170:25 171:5171:7 186:6191:19 197:24206:21 212:10219:8 234:24236:8 243:12253:8 253:11254:21 257:14259:7 259:9275:25 276:8276:24 280:22280:23 287:10287:10 289:25296:9
live 45:17
lively 11:23
living 43:7
103:14
load 177:6
177:7 185:14256:23
loading 177:14
218:3
local 10:19 10:21
11:4 13:116:25 17:3 17:1518:13 25:2328:23 29:2030:17 83:183:3 85:7167:2 174:22188:9 190:25208:16 208:17211:24 218:1218:12 218:12227:3 227:4246:15
localized 189:14
locals 7:23 30:23
227:7
located 128:22
255:21
location 76:15
94:21 96:22 97:497:17 98:4 98:1398:20 106:5117:11 123:21177:8 205:2205:20 220:10239:14 249:23286:14 286:15
locations 97:2
lock 280:6
log 77:11
logic 253:23
logistics 3:13
long 35:17 92:2
124:7 124:22124:24 125:16167:1 185:13208:18 215:25218:16 227:21233:9 242:6252:17 271:9272:7 272:13276:4 278:21282:2 304:20307:14 307:24309:3 313:13315:16 320:23
longer 23:1 45:17
46:21 79:979:9 118:24122:4 124:24229:20 304:22
longitude 97:25
285:5
long-range
17:24 23:9
longstanding
51:22 306:4
long-standing
216:9
long-winded
276:13
look-up 96:5
104:10 285:12
lose 78:6
losing 103:18
losses 181:17
lost 81:17 81:20
lot 3:10 5:24
9:17 13:8 13:815:19 22:17 30:834:18 35:1935:21 37:8 40:24

10TH CONFERENCE OF AIR QUALITY MODELS 03/13/2012 CCR#16766-1 394
44:20 45:8 51:1752:4 52:954:22 56:557:4 57:8 59:963:4 63:11 64:2567:6 70:2571:1 72:12 72:1974:14 78:578:5 79:21 79:2583:22 104:13107:25 108:11109:11 110:21110:25 115:14119:13 120:1120:23 122:11125:21 127:19128:17 130:2133:8 137:1138:11 139:9142:16 144:12144:13 146:1154:19 169:10172:15 174:23176:11 178:13179:18 180:20183:6 184:5185:24 187:5192:6 203:14204:8 206:3209:11 212:25214:19 216:5217:18 218:4218:18 218:23219:10 221:24230:2 234:16244:24 248:24250:19 255:24256:5 261:21270:20 272:12286:19 286:19298:6 305:22313:15 313:19321:4
lots 99:4
189:15 190:1190:1 190:6
190:7 194:7
Louisiana 33:10
love 228:11
loved 27:13
Lovett 246:24
247:1
low 59:1 62:17
63:19 72:5 80:1995:3 95:4 96:3100:6 100:11100:13 100:14100:19 100:22102:10 103:12103:25 104:19109:23 113:14116:3 121:10140:8 140:14143:17 157:8157:14 158:22158:24 159:15159:23 161:1161:5 161:16163:14 164:8165:19 168:23169:9 177:20182:9 184:6184:17 184:23200:3 200:10200:19 203:23210:6 240:22
lower 38:13 68:11
90:3 91:25104:12 104:20110:7 111:17124:9 130:5130:24 131:2132:18 149:14158:18 158:18160:23 160:24161:7 161:8165:16 165:16165:16 165:16165:17 165:17165:18 170:11
170:15 170:16171:11 249:13275:14 304:17
lower...less
131:2
lowered 170:12
170:19
lowest 111:7
low-intensity
103:3
low-level 164:9
LRT 276:7
304:14 304:18
Luhar 160:21
lull 62:19
lunch 6:8 6:13
6:15 6:1813:19 145:7145:8 145:14145:16 145:22
M
MACHs 90:6
macro 300:9
300:11 315:13
Madison 197:10
Magazine 259:14
magically 318:2
magnitude 65:16
66:8 178:15288:3 290:23293:2 293:3
main 57:25
92:23 123:19148:16 248:19249:19
mainly 207:9
maintains 241:7
maintenance
179:21 186:10

10TH CONFERENCE OF AIR QUALITY MODELS 03/13/2012 CCR#16766-1 395
187:6 187:9194:19 248:10249:15
major 45:18 54:23
60:20 70:24149:10 149:24295:20 296:4296:4 296:5
majority 94:23
MAKEMET 77:21
man 17:2
manage 274:10
management 7:21
135:16 146:10152:8 200:17259:14 271:13278:4 280:4291:21 291:24311:6
manager 232:18
313:19
managers 17:23
19:3 32:2 229:23230:17 230:23232:8 233:6236:14 238:19239:21 241:13262:4 296:21
managing 64:4
141:6 274:8
manner 22:5
22:6 268:10272:21 322:12
man's 106:16
manual 51:23
52:21
Manuso 210:3
map 75:1 184:1
283:19 284:10
March 3:3 33:20
43:9 44:11 44:21
60:22 74:19201:24 226:25295:19
Mark 203:16
marked 44:19
marker 291:12
market 309:13
Marsha 267:2
Martin's 248:3
248:18 249:17249:18 249:22250:4 254:2257:18 258:1258:18
mass 145:19
massaging 219:6
match 129:3
257:23
matched 115:18
matches 108:23
116:8 131:3150:11 150:13
matching 283:17
material 133:9
133:11 177:11
materials 177:5
177:7
matrix 263:1
264:8
matter 138:6
148:24 180:3180:6 181:7215:22
mature 322:6
matured 69:16
max 72:11 78:11
85:11 255:18256:12 257:8
MAXDCONT 73:8
maximum 47:6
50:13 51:2 51:1353:12 76:25 77:877:9 201:14202:16 231:2256:16 256:16256:23 257:8
may 3:17 28:4
30:7 39:2540:5 40:22 42:1544:6 46:1348:8 48:1449:5 50:13 50:1351:10 52:1552:16 62:8 70:1872:17 73:1376:15 78:1690:13 94:2094:24 94:25 98:398:21 98:2299:16 101:13102:24 105:25106:5 107:13108:22 110:24111:3 117:24118:3 118:8119:19 125:9126:15 126:15135:17 138:25140:9 150:21150:23 169:23171:11 174:15202:11 203:7203:9 212:3214:1 216:15216:16 223:22226:22 227:16229:10 231:15231:21 232:11234:5 234:23235:15 244:10246:14 248:8255:12 266:5269:23 270:3270:10 275:20279:6 305:17

10TH CONFERENCE OF AIR QUALITY MODELS 03/13/2012 CCR#16766-1 396
315:8 315:13321:23 321:23
maybe 14:1
17:16 24:551:7 53:1854:9 54:9 57:657:7 58:5 62:965:17 72:24 74:474:5 76:21 78:2278:23 79:9 91:1297:10 98:16100:15 100:16104:1 104:2111:22 122:4123:4 125:4126:8 127:22128:2 128:7132:10 133:18136:12 136:25137:9 138:8148:8 149:14154:2 156:11156:13 169:22179:11 190:20199:14 204:9208:3 209:21212:5 214:2216:23 219:23219:24 219:24220:13 221:2225:9 226:20226:23 227:5227:21 235:1235:1 239:4244:4 246:5252:13 258:16258:21 258:22263:4 268:25270:18 315:17315:17 318:7318:9
maybe...
especially
125:20
McCabe 13:23
McCarthy 23:11
McCarthy's 14:7
MCHISRS 29:14
29:18 37:9 37:1237:15 38:2 41:24
McKean 314:17
McNally 314:3
McVehil-Monnett
143:16
mean 8:14 36:20
36:21 36:24 43:446:15 52:8 53:2456:5 56:14 56:2059:12 59:13 67:670:5 78:1479:1 83:2 83:394:8 94:10 94:18101:22 103:24104:5 104:7104:16 111:16112:6 113:23115:13 118:4127:14 134:19135:8 135:11137:1 137:23137:24 138:4138:7 138:24139:4 139:6139:6 139:6139:8 140:14140:16 141:4142:23 143:6143:24 148:4152:24 154:12155:16 163:1200:24 202:3202:13 208:7214:23 215:5215:18 215:22216:20 218:4221:8 221:17221:17 221:23222:10 222:17223:3 223:3
244:6 251:25253:15 264:18264:22 266:23316:21
mean...weighted
104:7
meander 123:8
125:12 171:20171:22 173:2
meandering 215:3
meaning 58:21
meaningful 252:21
means 50:15 57:16
58:5 68:20111:17 149:7254:23 306:18316:9
meant 58:6 242:5
meantime 132:9
measure 92:18
measured 63:22
200:4
measurement
94:4 94:994:12 112:13112:16 117:19122:16 179:4294:11
measures 252:23
269:2 269:3299:15 300:16
mechanical 165:18
mechanism 47:3
242:20
median 90:8 97:11
106:14 135:10
medium 100:12
Medoc 286:12
286:13 310:16
10TH CONFERENCE OF AIR QUALITY MODELS 03/13/2012 CCR#16766-1 397
MEDSTAT 299:19
meet 42:20
59:25 88:18187:19 219:3231:10 236:19237:4 238:8242:1 242:2
meeting 3:13 3:17
27:11 178:18200:18 238:18263:14
meetings 14:4
27:11 120:17135:19
Meg 17:20
185:18 197:20198:7 204:20207:3 207:5208:16 209:25218:10 219:18220:23 221:2223:17
MEMBER 38:19
38:23 133:7133:13 134:7134:25 135:15137:13 137:22139:14 142:5143:15 144:19198:17 199:16199:25 200:20203:16 204:15204:16 206:5207:15 210:3211:4 211:9212:7 213:13213:25 218:15219:17 220:11220:18 222:12224:5 259:1259:7 260:13261:14 261:24262:18 263:18263:25 265:4
266:19 267:2268:18 270:12314:15 314:17316:12 316:14317:23 319:5319:14 320:21
members 11:16
120:14 244:3
memo 25:19 29:3
39:12 41:1642:15 43:9 43:1844:11 44:2144:23 45:1047:24 48:2 49:1359:10 69:1370:12 75:7101:10 133:23134:13 143:5148:23 149:11153:3 201:25202:14 207:24208:13 229:11229:24 243:17243:18 244:1245:21
memoranda 39:16
memorandas 30:6
memorandum 18:1
27:14 33:2033:20 147:1147:18 147:23280:25 286:7305:17
memos 21:9
37:15 39:1739:21 39:2339:24 40:1941:10 41:1641:25 42:442:5 43:143:14 45:7 48:1754:9 54:10 54:1154:13 55:4 65:3
men 90:6
mention 42:23
138:13 144:12156:5 157:15192:11 198:15202:20
mentioned 16:3
23:5 29:20 41:2373:24 93:19104:25 108:6111:25 149:6157:24 166:1174:2 177:4177:18 182:8183:8 212:13213:16 222:11222:21 237:7244:6 253:6260:14 263:2263:5 272:10275:1 282:16285:14 287:5288:9 293:14309:16 311:19
mentions 39:20
42:8 75:10
Mercator 284:3
310:22 311:1311:4
mesoscale 19:4
228:21 271:21273:19 276:9277:10 279:8279:18 282:15
mess 230:9
messaging 234:24
met 9:23 19:23
20:2 31:24 59:1760:4 74:378:18 92:1092:11 94:22 97:897:9 97:16 97:1698:15 101:12
10TH CONFERENCE OF AIR QUALITY MODELS 03/13/2012 CCR#16766-1 398
101:17 102:12103:6 106:9107:16 109:16110:20 112:7113:6 115:24115:25 120:24120:25 122:19170:6 170:7171:8 171:12193:16 194:25230:17 247:13249:24 250:3250:12 257:4257:20 278:25314:21
Meta 98:8
metal 4:21 4:22
4:23 4:25 4:25
metar 57:12 62:24
81:14 81:1781:21 96:2296:23 135:4
meteorological
18:22 18:2419:10 19:18105:14 157:18158:24 159:11159:19 160:2161:3 247:20272:20 273:19273:20 274:2274:7 276:9276:11 277:15277:20 277:21278:6 279:8279:13 279:18280:3 280:21281:23 281:24282:1 282:8282:12 282:19285:16 285:25286:3 286:12287:4 293:8294:10 294:16296:14 297:4
299:13 299:24301:9 302:5302:21 304:4304:7 304:21305:8 305:10307:7 307:12309:24 312:1312:9 313:6
meteorologies
73:2
meteorology
77:5 80:22122:16 269:23273:7 273:11276:18 288:25289:1 294:15
meter 57:20 62:18
62:18 63:2363:24 64:1064:12 65:1777:18 95:17106:15 109:1111:11 140:3158:1 158:4161:23 161:23163:1 163:2164:11 168:23169:18 169:21169:23 170:18170:22 172:12172:15 172:19212:12 249:24256:21 287:18
meters 63:2 65:15
66:15 66:20 76:176:2 97:12101:17 103:17111:12 112:21117:19 142:7158:4 158:5163:18 163:20165:3 169:3169:9 169:18169:24 169:25172:9 172:10
172:20 173:11173:12 188:13188:13 191:4212:14 212:20213:8 213:11240:11 250:3317:8
method 33:2 46:25
52:15 93:2193:22 93:2393:24 94:17101:20 101:25106:10 106:16106:17 106:19109:4 112:1112:11 112:24113:7 113:24115:9 115:19116:6 116:10116:21 117:15121:16 131:17135:2 148:18149:15 179:2180:13 180:16284:16 284:19
method...which
108:25
methodology
76:7 81:1 93:7277:11
methods 16:19
20:1 20:10 20:1721:15 45:23114:25 149:25178:23 178:24180:10 207:20245:17 282:7282:12 293:7
methods...or
116:12
metric 47:9
metric...what
114:7

10TH CONFERENCE OF AIR QUALITY MODELS 03/13/2012 CCR#16766-1 399
metrics 45:24
254:18
METSTAT 297:1
297:7 310:5
Mexico 233:16
316:5 321:13
mic 198:6 206:24
Michigan 74:13
Mick 174:20
micro 217:10
273:19
micrograms 77:18
mics 198:8
middle 143:14
155:5 252:24
mid-February
294:22
mid-summer 96:10
MIFF 310:21
MIFFSTAT 299:12
might...if 132:9
mike 6:23 23:14
139:14 200:20
mikes...and 133:4
mile 136:16
136:16
milestone 39:7
milestones 187:4
MIN 85:10
mind 140:24 141:4
174:18 179:21179:21 244:21
mindful 141:11
141:12
Mine 171:22
mines 181:22
mini-exercise
197:14
minimal 211:10
minimizes 26:23
minimum 62:3 63:1
126:24 140:1161:22 161:25162:14 164:3164:16 165:3200:5 308:17315:21
minimus 66:15
mining 175:12
176:25 177:12
minor 72:10
75:3 310:18
minus 323:8
minus...the 129:9
minute 26:21 30:9
60:18 60:19 81:581:6 81:681:25 84:1485:14 85:14 91:791:24 102:5106:7 106:20107:6 107:10107:13 118:9135:4 135:25145:17 283:23
minutes 4:13 4:14
29:14 29:2138:18 54:780:3 83:6 85:185:9 85:10 85:1087:25 88:188:4 88:5102:6 109:12181:23 228:2228:4 313:9323:9
mischaracterizati
ons 165:13
mis-classified
102:18
miserably 315:7
misinterpreted
73:15
miss 140:22
219:21
missed 75:11
110:10 110:14168:9
misses 116:21
missing 54:21
55:13 55:1455:14 55:1655:16 55:1655:18 56:557:5 57:6 57:857:16 59:14 60:560:11 60:1260:12 81:10 82:288:21 89:289:4 263:8
mission 118:14
Missouri 220:12
misspelling 38:10
mistakes 313:24
mitigate 130:11
216:16
mix 104:2 194:9
mixed 170:22
294:4
mixing 73:17
73:20 158:9165:17 165:18165:20 183:20285:2 292:20299:16 321:1321:8
MM4 281:17
MM5 19:9 275:11
276:17 277:17

10TH CONFERENCE OF AIR QUALITY MODELS 03/13/2012 CCR#16766-1 400
279:23 282:18283:11 283:19285:4 285:10319:11 319:16319:22 320:6320:14 320:15321:1 321:3321:4
MM5s 277:4
MMIF 19:4 271:3
272:25 282:18282:24 283:2284:12 286:14286:17 286:18286:24 286:24287:17 288:1288:20 288:21289:1 289:19290:3 291:5291:6 292:4292:8 292:15293:12 293:13293:20 293:24294:1 294:7294:8 294:10294:14 294:17294:19 294:21297:9 297:10298:19 299:14303:17 303:18306:12 306:15308:7 309:23311:2 311:14313:18 314:24318:3 318:8318:12 318:15319:9
MMIF's 293:25
MMIFSTAT 19:17
296:23 299:11310:13 311:1314:4 314:20
MMIFTOOL 74:4
mobile 71:16
123:5 187:7188:20 222:6
mode 40:5 55:12
138:3 265:13283:6 288:10
model 9:20 9:25
16:19 19:4 19:1919:25 20:420:6 20:10 20:2421:2 21:1824:7 25:25 31:2332:14 33:25 34:934:16 36:1536:25 39:540:2 42:23 43:2244:18 44:25 45:645:20 46:8 47:1447:17 47:1847:23 48:1248:19 52:452:5 53:15 54:2455:11 57:21 65:465:8 71:171:13 71:1471:18 71:2273:22 75:675:8 75:975:13 75:1575:21 77:1581:20 92:22101:9 105:7120:5 123:1123:23 131:15131:20 132:19132:20 134:10134:14 136:20137:6 139:5140:7 140:21140:25 141:6141:7 141:9142:7 142:11142:24 143:6143:7 144:4144:9 146:25147:16 149:8
150:7 151:25151:25 152:12153:12 154:1154:10 161:11162:10 162:15163:4 163:18164:11 164:24165:4 165:14167:5 167:6171:21 174:16175:16 176:12178:11 181:24188:25 192:13193:15 193:17194:3 194:4195:14 199:4199:10 201:9201:11 201:13202:2 202:5207:4 207:6207:12 212:6214:8 219:22222:8 223:15223:16 225:15228:22 229:6229:11 229:25230:18 230:24231:3 231:7231:21 231:24231:25 233:2233:5 233:18233:18 235:9236:24 237:1238:13 240:13240:15 240:16240:20 241:4241:19 241:25242:6 244:8244:10 244:11244:25 245:7245:11 245:15245:16 246:4246:18 247:5247:17 247:24249:6 249:9250:16 250:17

10TH CONFERENCE OF AIR QUALITY MODELS 03/13/2012 CCR#16766-1 401
250:22 251:14251:17 252:2252:3 252:6252:22 257:23258:8 258:8261:24 261:25262:12 262:22263:1 263:6263:10 264:8264:9 264:12265:1 265:6265:8 265:10265:13 265:14266:1 266:10266:14 267:21268:20 269:6269:13 269:14269:15 269:15271:21 273:5273:6 276:2276:3 276:4276:16 277:10277:16 277:17277:18 277:22279:19 280:14281:2 281:2281:13 282:15283:15 283:16286:6 293:5293:8 296:14296:15 297:14297:19 298:2298:2 304:18304:25 306:19307:10 308:20309:24 310:2312:22 314:22317:1 317:14317:21 319:18320:1 320:1320:22 321:10
modeled 33:22
45:24 136:20137:17 137:25139:18 196:4256:11 256:17
257:3 257:15
modeler 275:25
modelers 10:20
17:16 18:7154:11 165:8166:25 206:15208:17 211:24216:7 217:18222:16 227:3279:14
modeler's 25:23
29:20
Modelers 9:19
10:12 10:13
Modeler's 18:13
modeling 3:7 7:12
7:15 8:15 9:1210:2 12:112:20 14:9 14:1915:2 15:315:10 16:1 17:2018:24 18:2519:23 20:220:5 20:1921:1 23:2 23:624:4 25:627:20 30:1931:10 33:1033:21 34:6 35:1239:14 39:22 41:941:12 41:21 42:642:12 43:143:6 43:10 45:1346:4 50:550:14 52:2 54:1256:22 65:2466:18 66:21 68:170:22 70:24 74:874:12 74:2278:10 78:1678:19 93:10121:8 121:23125:6 132:6138:16 138:20
139:4 142:13145:5 147:25155:22 167:13168:1 168:5174:24 175:11177:2 178:3183:4 183:24184:21 185:2185:17 188:19189:4 189:4190:24 191:2193:10 193:11193:19 195:2196:2 196:14198:20 205:11206:12 216:4216:6 216:18217:9 219:12220:1 222:23223:13 224:10229:1 229:12229:17 230:8231:12 236:3236:4 236:18237:25 239:15244:4 248:15255:9 258:20267:6 271:17272:7 272:13272:15 272:16273:10 275:9275:17 276:12277:13 277:16278:2 278:23279:10 279:11279:13 279:13279:21 279:24281:9 282:3297:2 300:4300:22 304:15304:20 305:10305:11 307:1307:24 308:4309:1 315:24316:6 318:19322:14

10TH CONFERENCE OF AIR QUALITY MODELS 03/13/2012 CCR#16766-1 402
models 3:2 7:3
7:25 8:2 8:5 8:88:10 8:12 8:139:2 9:5 9:159:16 12:17 12:2114:24 16:316:5 16:22 16:2417:25 17:2519:12 20:1120:15 20:20 21:521:17 21:2021:22 22:1 22:2423:8 30:13 30:1442:11 63:25 65:774:3 132:16133:20 134:5161:18 180:18181:18 182:18183:20 184:15184:21 185:9191:13 191:17193:7 193:21197:15 217:9221:15 222:22231:10 231:11232:7 233:8233:9 233:25234:1 234:12234:15 234:24235:6 235:11235:12 236:20236:22 239:13240:18 240:18249:9 251:22252:25 253:5262:11 262:17264:15 267:5267:13 267:14267:16 269:20270:4 272:7272:13 274:24276:9 276:11277:20 278:22279:9 279:19281:12 282:1282:2 282:20
284:2 284:18287:5 288:17295:10 296:25297:22 298:20298:24 300:2316:18 316:23317:4 320:3320:25 321:18
modifications
78:22 159:2208:11
modified 66:11
297:7 299:4
modify 65:25
74:25 79:1382:12 127:25
modifying 79:3
132:22
modules 19:22
230:15
moisture 92:20
95:22 318:9
moment 133:6
Monin 154:17
284:19 285:10
monitor 43:12
131:3 131:5131:9 136:18136:19 136:22136:22 137:7140:18 140:22141:1 171:21192:8 195:7196:8 196:17205:9 249:20250:12 250:15252:8 254:18255:14 255:16255:21 256:6256:9 256:9258:9 259:22
monitored 45:24
46:2 130:24
256:10
monitoring 25:2
33:16 47:1259:17 106:9172:11 183:5192:2 195:6195:21 204:23204:24 205:1256:10
monitors 25:3
130:14 205:10205:22 249:20259:22
monoxide 187:12
month 15:8 84:7
84:8 84:12 207:7207:8 238:19
monthly 90:17
90:20 95:20318:10
months 14:11
74:24 75:12259:11
month-to-month
27:9
Monument 119:15
119:17
moon 76:4
Morant 147:18
morning 3:4
3:11 4:22 5:166:18 6:23 7:115:18 32:12 39:271:12 121:25146:2 157:3185:13 185:17198:4 229:11236:9
Morris 281:4
287:6
mostly 68:8

10TH CONFERENCE OF AIR QUALITY MODELS 03/13/2012 CCR#16766-1 403
159:18 167:2168:17 174:21176:16 204:17249:21
motivated 71:2
motivators 56:4
motor 190:9
mountain 246:17
move 8:2 9:7
12:13 12:1415:13 19:1123:11 37:3119:23 121:8121:11 155:17235:25 242:3270:25 288:19
moved 119:1
129:12 145:24149:22 150:2
moves 8:2 8:17
188:25 191:15191:15 191:19192:12 192:13192:21 197:3206:6 206:14206:16 206:25207:4 207:6207:6 213:21221:15 307:19
moving 11:17
16:10 86:10185:12 262:13
MS8 250:15
252:8 254:18254:25
MSIP 294:18
much...but 136:15
much...unless
135:13
mud 26:24
Multi-Network
98:8
multiple 92:15
164:6 171:8172:19 239:19241:10 281:17281:20
multiplier 112:18
112:19
multiply 48:13
Multi-tiered
152:19
multi-year 286:18
Municipal 97:21
mutually 11:13
myriad 299:10
myself 4:5 54:7
MYSQL 196:20
N
NAAQS 7:18 7:19
8:23 9:1114:24 16:9 16:1021:10 21:15 23:724:17 40:17 43:443:4 43:14 43:1544:3 44:13 44:2245:15 45:16 46:646:16 46:1748:12 71:278:9 78:13 78:1579:22 82:7 139:9178:3 187:2187:3 187:25188:2 191:11196:20 196:21210:21 213:3213:6 230:24248:6 248:10249:15 255:17256:2
naive 225:10
narrow 124:22
140:19
nat 49:4
national 18:23
26:4 26:14 31:2240:11 92:12 97:198:23 171:10301:12 305:9
nature 41:15
45:25 52:25148:24 177:19225:17 229:7
naught 106:13
117:7
NCAR 120:16
301:11 301:15
NCDC 60:15
82:14 90:18 98:5
NCDC's 97:12
NCL 301:21
nearby 52:22
52:25 53:7 69:2469:24 99:5116:25 127:24173:6 173:7174:11 194:1195:22 195:24204:25 205:20212:24 254:4
nearest 61:7 61:9
63:6
near-field
15:25 18:2545:20 75:15231:4 243:12243:13 243:21244:5 244:8244:10 244:12245:7 245:11246:19 247:6247:17 248:2258:15 266:12267:16 268:7
10TH CONFERENCE OF AIR QUALITY MODELS 03/13/2012 CCR#16766-1 404
305:11
neatly 60:24
necessarily 52:12
52:14 52:2153:12 78:1479:17 113:19117:15 130:19166:16 202:17204:4 208:7223:4 237:12
necessary 12:16
22:14 47:7 52:1677:20 141:21185:1 232:19245:13 280:15292:25 312:6312:7
necessitate
233:11
necessitated
240:8
Necker 143:15
NED 76:9 118:13
118:17 119:1119:3 119:13121:4 122:7
negative 129:9
154:16
Nelson 317:5
NEPA 18:3
nest 86:12
nested 290:5
nests...it 86:11
net 72:20
NetCDF 299:9
300:20 301:4301:20 301:22302:15 314:9
network 78:23
Neutral 154:15
neutrally 153:15
new...the 91:15
newer 72:20 101:4
309:21
newly 82:12 121:3
news 58:14
nice 10:15
55:23 97:3 99:21100:5 101:16103:9 135:16135:19 185:23190:15 193:4304:5 318:6318:8 323:7
night 63:13 158:9
159:23
nighttime 63:11
71:9 159:20
nitrate 242:12
242:15 242:16243:4
nitrogen 321:22
NO2 7:19 16:9
20:7 21:1023:7 24:17 43:1443:16 43:1843:23 44:144:3 44:344:12 46:6 46:1046:10 46:1346:17 46:2048:18 49:3 49:2371:2 71:15 89:1890:1 223:13224:19 225:1
NOAA 161:16
Nobody 195:4
no-build 187:23
188:1
nocturnal
159:14 159:16
noise 115:3 130:2
nominally 243:15
non 9:16 55:19
69:8 88:691:21 99:19107:4 117:2260:8
non-airport 99:13
non-attainment
186:10 187:6205:22 248:9249:14
non-calm 88:8
88:12
non-default 32:20
101:10
none 101:18
206:10
nonetheless
25:9 33:13 34:1935:19
non-Gaussian
180:19
non-industrial
178:21
non-overlapping
87:25 88:5
non-regulatory
20:11
non-sonic 107:2
noon 63:14
normal 40:14
normalized 129:3
normally 5:21
176:7
north 3:5 7:1
14:19 24:2528:13 96:16102:10 105:20115:13 115:15
10TH CONFERENCE OF AIR QUALITY MODELS 03/13/2012 CCR#16766-1 405
289:9 289:11290:9 291:13316:5
northeast 201:5
255:15
Northern 159:17
northwest
107:19 115:21250:4
note 6:23 63:21
145:11 303:14
noted 292:14
notes 18:8
nothing 52:14
102:11 125:20
notice 36:17 68:8
108:18 110:19148:1 232:2233:12 234:7235:8
noticed 200:12
229:16 253:25260:14
notorious 147:1
November 89:7
now...there
125:15
nox 50:1 73:5
77:15
Nox 48:18
NSR 51:23
nuances 217:4
nuclear 267:13
267:14
numerical 276:1
276:3 279:22290:22 306:19307:10 308:19316:17 316:23
318:22
numerous 255:16
NWP 279:23
NWS 59:12 59:13
60:20 62:362:6 86:9
O
Oak 161:15
164:9 164:22
OAQPS 7:5 9:20
24:5 28:14 46:18202:3 233:15261:3 294:9313:18
object 152:24
objections 208:7
obligation 223:18
Obs 283:6
286:25 287:18288:10
obscuration 220:1
220:5 220:17
observation
81:9 81:15 83:1687:13 88:888:9 88:17 98:2298:24
observations
31:22 54:20 85:287:4 87:987:15 88:7 88:12135:5 163:6163:21 200:12277:3 277:3286:1 292:12294:16 297:5297:15 297:16297:18 297:20297:24 301:24
observer 54:19
57:22 58:7
obstacle 118:20
obstacles 183:17
obstructions
177:23
obtain 193:16
265:11
obtained 244:16
obtains 279:21
Obukhov 154:17
284:19 285:10
obvious 119:13
157:15 240:4290:19
obviously 9:17
11:14 20:7 27:1382:2 82:16160:14 188:6203:20 203:23214:23 274:5290:18 294:25318:20
occasions 13:3
occur 65:20
95:4 95:8 181:17182:14 241:2266:25 288:9
occurred 31:10
occurring 214:14
occurs 62:20
215:10 291:14306:14
ocean 34:19 34:22
o'clock 88:1
October 87:6
90:23
odd 85:10 87:25
88:5
of...I 91:4

10TH CONFERENCE OF AIR QUALITY MODELS 03/13/2012 CCR#16766-1 406
of...
interpretates
130:2
of...kind 130:2
offense 26:15
offer 194:22
312:15
offering 185:5
197:9 202:1
offers 304:5
office 4:3
17:18 24:20 27:728:4 28:628:11 28:2128:22 28:2530:18 30:1930:25 31:1 31:1832:1 32:18 33:1134:24 35:4 35:1635:20 35:2336:11 37:137:1 38:3 41:341:9 69:13144:24 186:1207:3 209:2209:4 226:22227:5 227:8234:19 271:11
offices 17:15
24:20 25:2025:22 38:640:6 40:14 61:18202:9 225:8227:7
office's 29:5
Offices 41:12
official 32:14
39:5
offset 83:18
Offshore 34:12
off-site 195:3
OGC 28:5 29:8
oh 6:13 79:20
119:23 263:3316:13 322:22
oil 89:21
okay 26:17
49:18 52:1353:16 54:864:4 70:22 74:1080:12 80:16 86:286:24 88:11 91:2119:24 137:22142:18 157:13165:25 194:25199:18 204:15206:5 222:14239:10 246:5262:18 263:25316:8 320:21321:21
old 79:15
115:19 116:5123:23 138:5149:18 161:16266:24 272:6
older 66:16
OLM 46:25 48:20
48:24 77:16 90:1
OMB 232:15
on...one 103:22
one...a 126:22
one...so 116:14
one-hour 82:7
one-minute
60:15 60:19 61:361:10 61:2162:16 63:2 64:1364:18 65:1 72:1574:1 91:21 102:1102:4
ones 31:12
37:20 38:2 85:18148:6 148:7158:3 299:2
ones...this 83:18
ongoing 226:1
236:13
on-site 81:11
171:12
on-the-fly 156:14
onto 308:9 320:18
open 6:19 13:16
100:7 100:10100:18 102:12103:8 108:3108:3 109:24110:20 110:23175:20 212:2239:9
operate 50:19
50:22 51:853:1 201:3 201:6
operated 63:14
operates 201:1
operating 25:15
48:19 50:251:3 63:16154:10 299:25302:12
operation
177:11 179:16274:10
operations
176:8 176:10
operatives 72:16
opinion 127:17
258:4
opinions 11:23
11:25 12:10
opportunities
42:13 121:2

10TH CONFERENCE OF AIR QUALITY MODELS 03/13/2012 CCR#16766-1 407
opportunity
9:13 12:113:11 13:2225:12 30:19 41:942:19 175:10223:21
opposite 319:19
321:15
option 55:14
55:18 55:2055:24 64:17 71:371:9 72:12 72:2273:4 73:873:25 90:1099:13 102:24117:3 117:16144:10 155:18155:24 168:22170:1 192:23194:23 202:21205:12 265:11265:25 266:13285:4 285:9286:7 287:18
optional 84:24
options 44:17
48:20 71:573:5 95:18 123:1128:14 168:2192:22 203:4205:8 229:25240:8 265:10276:2 280:14280:15 281:2281:2 283:4283:12 284:15285:21 321:4321:5
orange 96:19
100:4
oranges 103:10
ORD 120:16
order 5:22
84:20 84:22179:4 184:15238:8 264:25276:22 284:7285:16 292:25297:20 298:6300:6 315:17320:18 322:5
orders 65:16
organic 242:22
organizations
180:15 275:3275:13
organize 189:16
orientation 129:3
origin 160:9
160:16
original 38:8
38:9 71:24108:25 123:16147:3 147:8148:23 152:12158:2 178:13199:1 215:8250:13 254:11275:4 283:19285:15 286:23294:22 319:16
originally
65:22 146:25285:6 298:21310:14 320:5
originals 104:13
originated 172:15
OTAC 222:22
223:25
others 7:11 18:10
32:5 97:10 98:24145:20 210:12210:16 217:1217:6 303:22315:14
other's 11:25
otherwise 31:12
69:4 88:14 225:7
ought 133:15
ours 18:9 189:16
ourselves 11:14
30:7 39:15217:11 256:15
outliers 72:9
91:23 136:15136:16
outliers...two
136:16
outline 101:13
146:12
outlines 190:18
output 74:25 77:3
78:24 81:1081:13 82:2 85:1385:14 85:15 86:186:5 87:22 88:1588:22 269:9269:19 269:25270:13 274:8277:16 277:17281:13 285:22285:24 286:3286:16 298:19298:19 320:8
outputs 78:11
85:6 282:19298:24
outs 29:19
outside 5:5 72:17
84:17 107:12152:11 202:2233:1 264:24
outstanding
232:21
outward 113:20
overall 63:4

10TH CONFERENCE OF AIR QUALITY MODELS 03/13/2012 CCR#16766-1 408
73:21 108:14115:16 116:11130:3 130:23131:16 163:16164:22 165:5251:6 252:25256:12 257:7
overcast 56:20
58:6 58:16
overdo 53:5 53:6
overdue 30:4
overestimate
132:7
over-estimate
254:14
overestimated
72:9
overestimates
103:19
over-estimates
242:12
overestimation
129:22 130:9131:7 182:6
overlap 40:24
120:23 132:1186:1 251:19251:21 253:18
overlapped
269:6 269:8
overlay 119:8
overlooked 310:10
overly 53:19
overnight 185:4
over-predicted
182:20
over-predicting
164:15
over-prediction
163:4 164:10
164:17 180:21183:15 321:12
over-
predictions
163:17 163:22163:25 164:23183:23 257:11
oversight 55:22
277:6
overstatement
293:25
overview 186:12
271:25
overwhelm 167:8
overwhelming
171:17 173:1
Owen 10:1
owes 10:24
oxymoronic 26:15
OY 86:18
ozone 23:9
46:25 77:17231:8 234:12235:7 237:5242:19
P
p.m 63:15 323:11
Pace 217:1
paces 295:7
Pacific 207:16
package 34:14
45:1 299:13301:5
packages 322:20
page 27:12
33:19 33:2041:11 41:21 43:9
Paine 133:7 157:6
157:7 200:9214:1 260:13289:20 290:8316:14
Paine's 203:21
painful 279:1
298:11
pancake 158:12
panel 198:18
panelists 11:9
paper 61:16 89:20
105:13 112:20129:15 172:6
papers 152:9
paradigm 20:12
305:25
paragraph 245:4
245:5 245:10247:18
parallel 142:11
142:13 143:2310:20
parameter
200:10 321:20
parameterization
8:11 321:11
parameterizations
132:15
parameterize
223:16
parameters
94:24 106:22121:19 128:15132:19 158:17169:16 321:6
Pardon 166:3
parking 3:9
5:24 99:4 99:5194:7
partial 125:18

10TH CONFERENCE OF AIR QUALITY MODELS 03/13/2012 CCR#16766-1 409
125:22
participants
11:22 18:6
participation
18:15 23:16
particle 176:16
180:4 180:7184:25 242:20
particles 181:1
181:4 181:10181:12
particular 11:7
26:6 27:10 27:2128:21 35:2535:25 36:1 39:1041:11 47:1949:23 71:2277:13 90:1190:13 91:24 92:996:7 102:19134:23 134:23136:13 137:5137:5 137:6137:15 139:20166:4 202:9209:2 215:19224:14 224:25226:3 226:23237:3 275:3275:23 278:15285:24 289:4289:5 298:3308:4 310:9313:17 319:4321:10
particularly
174:23 175:21226:4 300:23
particulars 217:4
particulate 180:3
180:6 181:6242:17
parties 244:19
partly 100:19
partner 185:15
partners 13:2
partnership
198:16
party 143:2
pass 175:22 181:5
187:24 285:9288:12 319:17
passed 283:4
passes 283:8
passing 178:9
past 7:14 11:1
12:3 12:23 12:2318:5 24:426:19 28:9 36:1737:16 132:14143:20 146:15147:24 148:6148:7 157:21238:2 238:15261:3 271:10280:11
paste 37:25
path 15:22 132:18
138:12 139:12141:13 146:17155:15 156:24
pathway 79:6
Patrick 314:16
314:17
pattern 63:3
119:7 129:23288:1 290:18291:16 292:2292:5
patterns 287:24
288:2 288:6289:7 292:14321:2 321:16
321:23
Patulski 17:20
185:18 185:19198:9 205:5206:10 206:23207:13 212:9212:18 217:17221:14 222:14
pause 54:4
PAVE 299:1
paved 191:22
192:1 216:13
pay 6:17 145:12
262:10
PBL 283:4 283:8
PDF 37:21 90:21
peak 72:7 91:20
95:3 95:8 101:22102:5 102:7107:5 107:8107:11 108:16108:17 130:4135:9 254:14257:13
peaking 51:5
Pedco 220:19
pedigree 24:25
peeking 201:3
peer 20:20
22:13 34:9 242:8245:12
peers 7:11 207:22
pending 39:23
54:9 54:10 54:1155:4 64:1565:2 73:11134:13
penetration 300:7
302:8
Penn 317:6

10TH CONFERENCE OF AIR QUALITY MODELS 03/13/2012 CCR#16766-1 410
Pennsylvania
243:24 248:5
Penthouse
126:12 126:16
people 4:22 11:18
12:25 13:1813:21 20:1426:16 28:2 28:1128:16 29:22 44:849:11 52:1052:23 55:1055:25 67:776:2 139:9157:11 168:24185:21 189:13191:10 195:15195:16 195:20196:12 198:21209:7 216:6216:23 217:8217:20 218:10225:21 237:16238:4 244:20244:21 246:8265:7 270:13273:8 276:17304:12 313:12313:15 314:5317:20 323:4
Peoria 114:6
114:9 114:10
per 62:18 63:2
63:23 63:2464:10 64:1265:17 77:2 77:18106:15 111:11158:1 158:4158:4 158:6161:23 161:23165:3 198:11231:16
percent 48:22
55:12 59:859:9 59:20 59:24
61:24 61:25 62:162:1 62:4 62:762:12 63:1163:13 66:25 67:467:6 67:10 67:1468:12 68:1568:19 68:2188:12 89:189:2 89:4 89:489:12 100:10100:11 110:18136:25 138:19139:8 152:22189:23 256:23257:15
percentage 63:12
percentile 255:18
percentiles 90:7
perfect 185:25
247:3
perfectly
269:15 304:10
perform 161:11
161:24 245:14255:3 264:25266:1 283:12
performance 18:25
20:6 20:13 73:23131:20 132:3160:19 163:18164:4 165:4206:13 207:10245:15 247:2251:22 253:14254:9 258:1258:3 258:17258:24 265:11267:5 269:2269:3 270:4281:3 287:3297:4 297:13299:12 303:17303:20 303:21305:11 308:19
312:11 312:12313:6 313:7314:22 314:24315:22 316:2316:7
performed
182:18 248:12253:5 265:20
performing
249:5 252:6
performs 247:10
252:2 253:21265:13 265:18280:1 315:7
perhaps 41:15
177:21 268:11
period 12:19 34:7
74:18 84:18 85:886:17 86:2086:23 86:25107:9 107:13237:15 256:18257:2 257:18
periodic 296:3
296:5
periods 257:6
257:7
PERL 299:6
permit 15:9
16:5 23:228:21 41:21 43:643:10 50:2051:11 202:4209:11 210:24217:4 236:21
permits 19:1
226:9 226:11235:18
permitted 50:19
permitting
16:12 17:9 19:13137:9 239:16
10TH CONFERENCE OF AIR QUALITY MODELS 03/13/2012 CCR#16766-1 411
person 26:3
personally 13:9
perspective
29:5 43:568:22 134:1208:4 223:7
pertaining 232:6
Pete 210:3 218:15
Petersen 146:3
146:6
petition 23:12
234:7 234:10234:22 243:24248:4 248:15248:17 249:12257:5 257:24
Petroleum 277:14
PG 284:15 284:20
phase 32:8 54:4
159:7 161:13229:14 230:14230:15 233:7236:16 236:16236:17 236:23237:1 237:3242:21 246:21247:2 272:8273:4 273:13276:19 277:24278:10 280:13281:15 283:14294:7 296:17305:14
phenomena
127:16 137:8
phenomena...where
124:7
phenomenon 176:19
215:19
philosophical
305:25
philosophy 283:22
phone 28:15 37:15
238:6
photo 103:6 122:8
photochemical
20:19 25:5
photos 98:7 98:11
102:22 102:25108:5
phrase 60:10
physical 303:12
physics 276:2
pick 28:15 59:3
63:3 74:23 96:1799:7 109:22118:6 123:17124:3 124:14130:3 135:7150:20 179:14192:15
picked 105:19
126:12 127:9309:18
picks 103:9 110:6
115:2 116:2116:10 116:17119:9 119:10119:16 122:9124:10 124:11124:15 128:6129:19 129:23
picture 149:18
151:3 168:12215:24
pictures 97:7
150:8 191:20
pie 88:23
pieces 53:3
Pierce 56:7
piles 177:7
177:22
pilot 56:21
pilots 56:14
pin 114:9
pink 103:11
pit 177:12 177:16
182:7 183:19
pits 177:10
pixel 117:12
placement 76:24
293:23 294:14294:17
places 42:8 150:6
186:13 195:16197:8 212:13245:6 307:9312:1
placing 194:25
plan 10:4 72:21
117:14 117:21141:22 186:10205:4 224:16
Planet 235:1
planning 4:4
26:15 207:5271:12 275:12307:23
plans 92:9
117:5 118:10121:7 122:4122:18 141:4187:1 187:9225:15
plant 130:13
180:14 201:10217:24 246:25255:15 255:22257:1 289:17
plants 181:22
platform 297:7

10TH CONFERENCE OF AIR QUALITY MODELS 03/13/2012 CCR#16766-1 412
298:10 320:4320:7
platforms
298:18 299:10
play 25:12
26:23 46:195:7 95:10116:25
playing 309:18
322:7
please 10:13
10:22 13:1914:15 49:2056:11 133:3145:11 228:14260:11 323:5
pleased 7:5
268:21 270:14
plenty 67:22
201:22
plot 58:19
62:15 130:23251:4 254:10303:4
plots 130:22
251:2 253:4302:3
plotted 114:20
plow 92:3
plume 95:10
125:18 125:22134:23 143:25144:4 144:5144:9 151:3151:5 151:11151:18 151:19151:21 158:10158:11 158:12161:14 162:6162:7 162:8162:13 165:2165:19 168:14
168:20 169:17169:19 172:4172:7 172:8172:17 172:21172:22 173:12173:14 174:4176:12 181:12181:17 182:10200:13 200:14214:14 246:4293:23 294:11294:14 294:16
plumes 140:19
plus 54:8
109:21 115:11169:25 172:8172:18 172:20173:11 173:12188:9 247:4247:11 247:13247:15 247:16256:22
PM 19:1 185:17
187:15 187:18188:16 189:13189:19 191:21192:7 212:11230:15 231:8232:1 235:7
PM10 16:11 43:7
45:12 45:15
PM-10 176:18
186:9 187:12191:23 197:5205:12
PM2.5 16:12 17:19
20:9 23:3 23:925:3 33:733:21 43:4 43:1043:13 45:1045:14 45:1445:21 45:2245:25 46:1
PM-2.5 176:18
186:9 187:12192:1 196:20197:5 218:21222:3 222:4234:12 236:21237:5
podium 175:4
point 3:15 5:25
16:21 24:324:8 24:18 25:2230:14 49:1053:19 55:864:1 68:272:22 91:18 93:993:23 106:9110:12 111:14111:23 113:8113:14 113:15114:17 115:7123:9 123:13129:2 131:3132:13 134:12137:4 140:14142:23 145:2148:2 158:3160:8 160:16171:1 174:8180:1 180:4182:16 193:12194:18 196:3200:19 209:17216:18 218:9240:17 244:2245:5 246:9251:24 262:6263:12 266:11267:13 268:7276:15 276:23281:11 303:5305:24 318:21319:12 322:4
pointed 44:22
214:19 233:5
pointing 203:3

10TH CONFERENCE OF AIR QUALITY MODELS 03/13/2012 CCR#16766-1 413
270:15
points 23:23
24:23 29:1230:10 31:4 42:2368:6 70:16139:24 164:19178:7 262:20286:15 319:11322:2
polar 284:3
310:21 310:23
polarity 181:11
policy 16:10
16:11 20:623:4 27:2428:2 29:8 30:540:23 41:243:8 45:12134:17 198:4217:20 234:18
political 271:20
pollutant 68:13
218:21
pollutants 175:21
pollution 9:4 9:5
74:7 175:24
poor 106:16
pops 26:5
popular 14:21
168:22 169:25
population 120:20
porous 150:25
152:19 152:22152:22
port 190:5
portion 41:19
46:2 187:10294:7
portions 187:8
Portland 248:16
249:25 250:4255:15 255:22
ports 194:6
pose 177:1 267:25
position 146:20
150:6 166:16166:17 208:13239:25 240:3276:5
positioned 149:19
positive 12:8
13:17 14:13184:22
possibility 138:9
281:25
possible 14:5
120:3 135:6178:7 267:12285:17 318:12
possibly 51:9
73:4 205:10205:21
post 73:9 114:5
115:3 239:2
posted 32:10 42:5
144:15 166:10166:12 203:25
poster 59:6
posting 294:22
post-PM10 23:3
post-processing
32:2
post-sonic 114:14
114:19 114:21115:5
post-sonic...or
115:4
potential 17:17
19:12 174:9203:5 203:13
210:6 240:3304:13 305:2
potentially
217:14 267:15
pounding 297:24
power 130:13
246:25
powerful 300:23
301:8
ppb 77:18 255:19
PPM 77:18
practical
276:10 282:9
practically
317:17
practice 18:23
21:24 51:22272:5 274:23275:22 275:24276:14 276:23277:25 279:5281:9 304:1305:9
practices
179:20 179:23207:18 280:10
Prairie 158:3
Prakash 230:8
230:9
pre 114:5 115:3
184:9 312:18
preamble 45:1
75:10 75:12244:14
precedence 81:12
precip 289:6
291:13 291:23292:7 310:12322:15
precipitation

10TH CONFERENCE OF AIR QUALITY MODELS 03/13/2012 CCR#16766-1 414
291:22 292:6292:21 292:22310:9 321:2321:13 321:16321:19 321:23
precise 202:18
preclude 209:7
predates 35:17
predecessor
185:16
predict 129:18
231:22
predicted 71:25
160:15 160:22160:25 162:24163:3 191:6257:9 321:17321:18
predicting 161:11
162:11 164:21180:19
prediction
131:2 158:13159:8 159:22159:25 160:19161:1 276:2279:22 316:17
predictions
139:24 140:4155:4 159:23161:7 163:14163:19 163:24200:13 248:13
predicts 140:8
160:6
predominant
162:20
pre-empt 47:14
prefer 225:21
261:7
preference 194:22
preferred 45:20
46:7 75:15 143:7146:25 147:16218:13 225:22231:7 231:25240:1 240:13244:7 244:8244:10 247:5252:2 266:11281:1 281:1
prefix 77:7
preliminarily
267:9
preliminary
108:11 128:15129:2
premature
207:19 280:12
prematurely
305:22
prep 10:5
prepare 294:10
prepared 34:14
263:9
pre-processing
184:20 204:11
pre-processors
32:16
prescribe 260:18
prescription
179:3
prescriptive
224:10
presence 16:24
present 13:20
60:21 136:4155:6 184:18211:13 211:21
presentation
23:25 39:3 70:17
80:18 91:492:2 112:3133:11 165:21175:11 185:21186:3 203:21241:11 242:9245:25 271:5271:9 271:16277:13 282:17286:5 287:7
presentations
4:13 4:14 10:612:7 14:222:18 63:21144:15 146:3185:13 227:5227:19 228:20263:9 271:1323:7
presented 3:19
39:13 133:9209:8 211:8223:12 230:9237:20
presenting 3:25
146:9 146:11237:10
preserve 280:20
285:16
pre-sonic
114:13 114:18114:20 114:21136:9
press 26:23
presumptively
207:21
pretend 15:6
pretty 3:7
24:11 40:1948:23 50:20 51:658:8 62:162:17 63:1567:17 90:5

10TH CONFERENCE OF AIR QUALITY MODELS 03/13/2012 CCR#16766-1 415
94:5 96:18 102:8102:10 105:20105:22 106:2108:15 109:17110:4 110:7111:9 111:13112:19 112:20112:23 113:23114:9 114:15114:22 114:23114:24 115:12115:17 115:18115:20 116:8119:4 122:17129:13 130:3130:11 131:4131:6 135:8135:18 143:23145:22 145:24157:15 164:12185:13 206:8247:1 247:9247:15 251:7253:16 256:4285:18 301:18309:4 309:6313:13
prevalent
182:12 184:4
prevented 142:12
previous 36:13
36:15 36:17 65:765:10 65:1271:24 120:14139:24 232:25234:7 264:6
previously
182:9 229:18239:3 261:18262:3
primarily 5:13
187:17 190:3275:12
primary 45:21
299:23
PRIME 55:2
65:11 65:2067:16 67:20 78:2121:20 123:17123:19 123:20124:3 124:18125:9 125:13125:14 125:17127:23 129:19130:4 134:22138:3 149:17149:22 150:5152:12 254:1254:6 254:7254:13 254:20259:25 260:2260:8 265:25266:3 266:5266:9 266:10266:13 266:24322:5
prime...coming
121:20
print 278:24
prior 19:4
19:18 46:1648:21 57:5 59:1465:7 71:18 93:25178:24 244:16308:20
priorities
72:21 211:17216:11 238:14
prioritization
142:1 210:12
prioritize 20:4
priority 142:21
277:8
private 18:15
195:17
probably 5:22
23:24 35:9
36:9 45:850:25 53:1660:14 73:1378:15 100:16104:1 112:6122:22 124:18140:15 147:23149:1 157:5179:9 246:8290:8 292:6292:8 293:25294:1 307:2315:7 317:18
probe 75:25 76:12
175:25
problem 28:19
36:7 83:23109:13 116:23124:22 149:10156:15 167:17175:14 178:2191:11 214:13225:17 245:13247:12 317:24
problematic 216:3
problems 79:24
91:8 150:18180:18 183:9192:5 255:20260:10 264:3
procedure 52:9
52:11 179:3224:11 251:14
procedures 47:7
47:21 52:1232:12 232:17235:20 245:17273:1 279:19309:25 310:3310:11
Proceedings
200:18
process 16:6 22:7

10TH CONFERENCE OF AIR QUALITY MODELS 03/13/2012 CCR#16766-1 416
26:2 26:626:12 26:2126:21 27:928:8 39:1640:3 40:14 42:2152:24 56:1 73:1078:2 91:11 112:6148:15 149:8175:23 202:3202:6 207:25213:10 214:18215:10 224:1224:2 224:10229:5 232:25233:10 234:2235:19 235:25236:15 238:15238:16 239:23261:4 262:8264:18 275:8278:14 278:17279:1 279:20280:17 282:2283:11 297:10298:25 307:6309:22 311:14313:13 313:13
processed 86:20
processes 180:23
processing
55:14 73:8 74:2476:8 76:1180:1 84:684:18 86:17101:5 122:25184:10 273:21
processors 274:10
produce 284:7
321:8
produced 109:1
248:12 273:7304:8 304:14311:17
produces 71:22
production 242:13
productive 216:22
proffed 258:19
258:22
profile 151:9
258:20 286:9
profilers 25:14
profiles 153:20
153:22 318:3
profiling 180:13
prog 312:14
prognostic
31:23 74:3228:22 272:6272:12 272:19278:5 278:21280:21 281:11281:12 281:13281:23 282:1282:7 283:8284:2 285:16288:5 289:3289:6 291:14291:23 292:7292:18 292:22296:25 297:22298:2 300:2300:22 304:4304:23 306:1308:10 308:14308:15 310:4313:2 314:21320:19 320:25322:10 322:15
program 7:16 7:17
7:21 19:419:17 24:20 25:325:4 27:728:11 80:25 81:281:12 81:16 83:283:17 83:23 84:1
84:21 85:24123:17 131:22132:2 186:3186:11 227:8228:22 251:10270:7 271:22282:15 282:18295:25 296:23299:20 302:18304:23 314:20318:17
programmatic
322:9
programming
274:18 302:2
programs 187:1
188:22 189:7189:15 274:19302:20 306:9314:9
progress 74:6
122:18 231:9
prohibitive
278:19
project 36:22
47:22 167:18186:21 187:20187:22 187:24188:8 188:10188:11 188:21191:19 193:23194:8 197:5205:16 205:20212:21 213:4213:5 213:7218:5 267:7271:18 271:19304:18 305:1312:2 313:18
projected
124:23 125:2126:1 127:1127:3 129:4

10TH CONFERENCE OF AIR QUALITY MODELS 03/13/2012 CCR#16766-1 417
projection 283:20
285:15 310:22
projections 284:3
284:10 311:5
projects 186:25
187:13 187:17189:21 189:21189:23 190:5190:8 191:24193:24 194:1194:5 194:16194:23 196:7196:9 222:9265:17
promote 6:12
15:25 16:1818:21 19:2520:24 26:13280:15 298:7305:7
promotes 17:5
promoting
272:19 281:23
prompt 43:18
prompted 66:9
105:7
promulgate 15:8
222:18
promulgated
15:6 43:1655:8 66:4 71:8120:8 141:7244:9 246:22
promulgation 15:5
15:11 24:1430:13 36:1343:17 45:145:2 55:1120:8 120:11229:19 230:24236:17 236:25237:2 244:14
247:6
proper 202:11
properly 219:13
288:4
properties 94:15
property 195:17
propose 209:2
proposed 65:22
68:9 125:15177:24 236:5236:6 249:3250:24 255:8261:25
proprietary 143:4
protect 9:10
232:11
protected 191:11
protecting 9:7
PROTECTION 3:1
protocol 30:15
30:20 33:1236:25 60:6131:14 155:25156:4 156:12156:20 184:21229:12 244:18245:17 250:6252:5 252:23253:6 308:18309:1
protocols 4:20
30:25 156:6226:12 309:5
prototype
282:22 285:12286:23 310:15
proven 20:17
provide 15:15
21:8 22:450:17 53:25 54:3
59:16 67:13118:24 153:6165:11 223:23225:19 225:23226:16 232:12235:15 238:24241:11 243:3261:16 277:5284:8 293:14297:8 298:17300:7 300:7302:7 302:8302:25 304:6304:17 306:7306:7 306:8310:17 311:10311:14 312:10312:12 312:17312:22 312:23
provided 19:17
44:14 60:6 122:1134:21 143:12159:4 165:7234:11 239:1248:11 252:7261:18 263:9314:5
provides 9:12
232:16 241:10299:15 299:23300:9 300:10302:22 304:13
providing 22:13
42:24 210:24225:11 225:21226:23 235:15289:23 302:9
provisions 16:6
PSD 7:17 43:6
52:3 230:24234:12 239:16
pseudo 286:1
public 3:18 9:7
9:10 25:11 25:11

10TH CONFERENCE OF AIR QUALITY MODELS 03/13/2012 CCR#16766-1 418
29:22 37:14 42:174:17 133:15191:11 226:12233:14 241:8280:8 280:17
publication 272:8
273:4
publications
281:15
publish 155:20
156:14
published
105:13 200:17225:3
pull 23:19 301:24
pulled 172:11
271:5
pulp 89:20
pun 166:3
purely 289:6
290:12 291:23292:17
purpose 20:12
68:22 69:11 81:381:12 81:19150:12 185:9204:5 220:5232:7 247:19
purposes 42:11
69:6 87:14 99:22231:10 268:11311:8
pursue 73:23 74:2
141:5
pushed 291:15
pushes 291:12
putting 22:8 25:3
76:2 112:15171:2 295:7303:9 313:25
Puzzle 51:24
PVMRM 46:23
47:1 48:21 48:2573:5 77:16
Q
QA 75:20 78:5
82:12 83:11 84:2
Qiguo 142:5
QQ 130:22 130:23
Q-Q 251:2 251:4
253:4 254:10
quadratic 160:7
qualified 267:11
qualitative
188:23 286:21286:22 287:8287:11 287:15290:12
quality 3:2 3:7
4:3 7:3 7:4 7:127:21 8:17 8:189:1 16:1 17:1919:19 27:2040:20 40:23178:18 179:22180:22 186:2189:4 189:14191:2 191:5192:2 192:5193:7 193:10193:11 193:15193:19 193:21195:2 195:21196:1 196:8196:13 196:15205:25 206:11207:4 217:18232:4 233:8239:13 239:21271:12 277:16277:20 277:22284:18 287:5
293:9 302:22321:21
quantify 193:6
195:25 196:21
quantifying
192:14
quantitative
188:24 188:25286:21 287:3287:8 287:12293:1
quarter 62:5 62:7
quarterly 59:25
question 3:23
101:6 132:25133:5 137:24140:9 142:10142:13 142:19144:23 145:9198:18 200:2201:8 201:19203:17 204:19204:21 206:5207:16 210:4210:8 212:8214:1 214:1220:23 221:2221:20 224:8249:4 252:18261:15 314:19316:20
questionable
265:12 307:3
questioned 105:5
questions 16:22
23:19 79:18119:23 133:3133:20 133:21137:1 137:12142:6 145:7157:3 197:25200:21 202:1202:9 212:3

10TH CONFERENCE OF AIR QUALITY MODELS 03/13/2012 CCR#16766-1 419
218:17 218:19218:25 241:9258:25 270:23319:6
Quguo 199:25
quick 5:12 24:2
37:7 78:8119:2 119:12145:7 210:4323:3
quickly 25:25
120:2 145:24
quite 25:10 25:21
36:7 42:6 43:858:1 62:1763:9 85:21 89:2591:25 92:6 93:2397:11 100:3111:11 123:12125:5 128:5209:18 244:4251:7 254:16255:20 297:1
quote 280:12
quoted 59:8
quotes 273:12
R
radar 25:14
radiation 181:5
radio 220:6
radius 32:20 94:9
96:25 97:16101:10 103:6105:5 105:10108:22 109:11112:5 112:15113:20
radius/inward
113:20
RADM 242:21
rail 194:6
raise 139:17
raised 30:12 64:2
215:15 215:16250:20 252:8258:5
raising 68:25
Raj 234:18
Ralph 281:4 287:6
293:17
ramp 190:4
ramps 190:21
ran 103:15
110:8 171:8264:12
random 131:22
158:11 162:6162:13
randomize 61:14
Randy 17:12
165:23 166:1175:2 203:17207:16 208:16208:18 208:25209:8 209:13209:25 213:24214:2 219:23219:24 223:11
range 9:5 99:8
114:1 115:1127:19 144:10168:2 179:12233:9 242:6251:16 251:20272:7 272:13276:4 278:22282:2 304:20307:14 307:24309:3 315:16
ranged 129:7
169:2 169:21
ranging 168:20
169:17 209:8209:10
rank 250:22
ranked 252:10
ranking 215:11
Rao 234:18
rapid 242:19
rare 59:15
rarely 46:17
50:22 57:5
rate 176:3 181:14
201:11 201:14201:15 214:4231:9
rates 192:23
207:11
rather 17:6 68:13
103:4 126:9127:1 127:4260:23 285:6285:11 293:6299:5 307:6317:10
ratio 48:1 48:3
48:3 48:18 48:2349:2 49:14 49:1677:17 77:19 90:390:9 92:1994:4 94:15 94:1794:18 94:25 95:595:10 95:22101:21 257:15285:2
ration 257:10
rationale 253:23
ratios 49:8 89:19
89:23 90:190:5 135:11225:25 257:11299:17

10TH CONFERENCE OF AIR QUALITY MODELS 03/13/2012 CCR#16766-1 420
RAVI 231:16
raw 63:5 63:6
RDU 82:24 82:25
96:18 97:13100:5 107:14108:24 115:1115:8
RDU...again 115:2
re 154:23 219:5
308:13
REA 223:13
reached 59:22
197:23
reaches 113:9
readily 279:21
reads 75:3 85:3
298:24
ready 10:18 322:5
reaffirm 233:15
Reagan 98:23
real 5:12 8:4
24:2 37:751:19 92:14119:2 145:7170:6 174:9225:16 246:17323:3
realistic 217:15
realities 211:16
reality 181:18
201:3 216:17269:24
realization
24:6 69:17
realize 12:16
140:8 144:3193:5
realize...gee
109:5
realized 16:23
55:8 130:19266:2 270:9
really 7:5 8:24
9:8 10:3 10:810:9 12:2413:9 13:20 13:2114:4 16:2024:2 25:25 26:1327:3 28:1839:4 47:1449:2 50:256:14 58:5 58:1672:18 85:24 97:3102:20 108:20109:8 111:2114:15 125:3125:5 127:10128:4 131:13133:25 135:12136:4 136:6143:13 144:2148:17 148:20150:12 150:23153:16 154:20156:18 158:22160:10 162:19167:4 168:13170:8 174:3174:23 174:25178:3 178:16189:15 193:22203:9 206:1206:16 213:1213:9 219:21221:6 227:14229:20 245:19250:9 257:25263:7 265:22295:13 317:9318:16 318:18318:23 319:22322:22
realm 26:16
273:10
real-time 156:10
reason 58:11 59:9
95:25 134:1144:3 199:11265:15 283:24
reasonable
64:10 64:14105:17 112:19130:3 171:25172:2 172:18173:23 208:8231:15 256:14266:12
reasonably 122:10
164:25 185:7
reasons 42:11
95:12
reassess 280:9
reassessed 69:18
reassessment 32:9
66:9 66:10128:12 134:14229:14
recall 237:22
receive 18:18
received 245:12
282:6 296:11
receives 186:21
receiving 263:2
recent 7:18
35:6 35:7 40:441:19 47:24144:25 147:18149:11 150:1151:14 181:14230:3 249:3258:8
recently 21:9
24:16 34:8 40:1543:8 43:13 44:1044:23 69:17

10TH CONFERENCE OF AIR QUALITY MODELS 03/13/2012 CCR#16766-1 421
114:6 136:4233:14 243:23248:1
receptiveness
207:20
receptor 76:6
76:24 78:23142:25 143:18144:1 173:5173:6 195:13250:18 306:22307:15
receptors 76:13
76:14 130:1142:17 173:5173:8 193:16195:1 195:15
reclaim 81:16
81:20
reclaiming 89:5
re-clarify 55:21
recognition 39:11
recognize 21:14
121:2 238:10270:16 313:17314:3
recognized
10:14 120:22
recognizes 132:2
recognizing
235:16 237:11281:10 282:8298:5
recommend 33:24
48:11 49:1361:18 153:24156:9 173:8183:22 260:17260:24 265:18266:21 277:5280:13
recommendation
94:11 114:18126:6 166:18171:24 172:17172:18 173:1200:8 208:8223:10 252:11261:1 307:17307:20
recommendations
29:15 32:732:8 40:12 43:1052:19 52:2059:17 157:20165:6 166:9171:15 173:21173:24 229:15236:24 272:9272:10 272:11273:13 273:17278:10 280:13280:18 281:6283:14 296:17305:14 305:16306:18 310:11
recommendations..
.the 106:18
recommended 33:24
43:3 44:2545:5 47:25 65:2575:6 75:975:13 93:20105:1 106:10106:18 155:15156:23 172:23173:10 208:6229:24 278:10283:15
recommending
33:23 75:8236:18
recommends
59:20 60:2106:10 106:14
reconstituted
120:10
record 10:5 24:22
31:6 38:1560:5 83:22 85:22136:11 226:12
recorded 3:17
3:20 23:22
records 37:19
37:23 38:1 50:2185:17 85:1985:19 85:2385:25 86:1 86:5
Records.DAT 85:15
85:16
recreational
96:20 100:3103:5 103:10107:23 109:18
rectangles 83:9
rectangular 152:4
recycle 145:12
red 83:9 89:10
90:9 96:20129:18 193:1251:5 254:13
reddish 107:23
redefine 126:2
redeveloping 37:3
re-diagnose 283:4
re-diagnosed
283:7
re-diagnoses
288:10
re-diagnosis
288:13
redid 57:1
redo 179:25
redone 73:20

10TH CONFERENCE OF AIR QUALITY MODELS 03/13/2012 CCR#16766-1 422
reduce 81:13
131:6 132:6163:22 163:25268:5 304:17
reduced 58:19
72:9 136:24
reduces 61:24
240:3
reduction 183:3
re-examine 184:24
refer 231:14
235:21 281:1
reference 32:20
49:11 113:9232:14 245:6264:3
referenced 43:8
45:2
references
39:18 59:17
referred 106:15
262:4 263:20271:19
referred...
suggested 112:21
referring 320:9
refers 231:13
232:9
refined 78:10
78:16 78:19184:1 194:3
Refiners 217:5
reflect 74:8
107:12 118:18
reflected
179:24 229:20251:16 306:2
reflecting 118:15
reflectiveness
92:19
reflects 102:15
118:15
reflects...
clearly 102:15
refocus 121:14
refocusing 26:8
reformat 318:16
reformatted 73:14
reformatter
318:18
Reformatting
271:20
regain 16:17
regard 180:19
207:18 226:24235:24 279:24
regarding 44:12
47:13 53:764:8 69:15101:10 153:7233:16 294:6
Regardless 232:23
regards 36:14
region 26:5
27:6 28:16 28:1829:10 31:14 32:333:6 34:12 34:1334:13 101:9114:6 125:1150:7 165:24166:2 174:20208:5 229:12233:15 271:11271:17 284:4296:21 299:21305:19
regional 10:12
10:13 17:1518:12 20:2024:20 25:20
25:22 25:23 28:328:20 28:2228:25 29:5 29:1930:18 30:1930:25 31:1 31:1832:1 32:18 33:1034:24 35:4 35:1635:20 35:2336:11 37:137:1 38:3 38:640:6 40:1441:8 41:12 61:17166:25 182:18187:6 190:6202:8 208:17209:1 209:4211:24 218:5225:7 226:22227:3 227:5227:7 231:9233:17 275:12
regions 10:17
16:25 17:4 29:1730:23 226:2315:14
Register 179:2
registered 11:18
regret 199:5
regs 66:4 66:14
68:4 68:968:23 69:7 69:1269:21 70:2 70:16127:2 127:2134:2 138:14
regular 9:14 17:5
82:17 83:10
regulation 309:9
regulations
52:3 67:12 67:1370:19 138:11278:7 278:18278:20
regulator 76:14

10TH CONFERENCE OF AIR QUALITY MODELS 03/13/2012 CCR#16766-1 423
regulatory 7:16
9:16 9:17 12:120:11 21:3 22:2425:6 42:11 44:2455:12 55:1755:24 59:1893:10 120:5184:16 229:4229:25 230:21231:19 233:2233:12 237:24238:9 238:11243:13 244:8266:5 303:25304:2 312:19
rehash 39:13
re-ingest 304:24
reiterate 293:4
reiterated 238:6
rejected 127:23
148:12
relate 43:2
43:4 216:14233:17
related 15:16
16:10 16:2231:11 43:1454:14 55:3 74:2376:23 80:1121:18 147:24192:10 197:25200:22 204:18206:11 232:4239:22 264:1266:4 279:19293:9 296:9297:9 321:22
related...instead
112:15
relates 54:16
106:13 272:7284:19
relating 36:18
relation 40:18
123:21 125:1
relations 306:22
relationship
276:11 310:1
relationships
16:16 17:23307:15
relative 227:13
257:22 258:11299:16 319:16
relatively
176:8 322:6
relay 14:7
relaying 278:12
release 19:16
73:11 74:15 75:675:19 82:8 93:25117:14 117:21163:6 164:9169:8 169:8169:9 169:18170:10 170:16170:18 170:20170:21 172:7173:13 177:20177:21 228:21296:3 309:11309:11 309:16
release...
hopefully 117:13
released 19:3
64:16 74:1274:16 74:19 82:982:10 82:11 93:594:6 104:23188:16 191:16282:25 294:21295:21 305:14305:16 305:22
releases 94:24
95:3 95:4 95:8158:2 161:17165:20 177:20178:7 200:11220:15 293:13293:21 296:6
relevant 20:8
189:6 196:9247:24
reliable 98:17
98:21 214:11
reliable...but
98:9
relied 188:22
221:25
relies 284:18
rely 20:14 186:13
188:21 189:6194:2 194:10239:21 298:9
relying 221:25
223:6
remained...what
117:18
remedy 141:18
255:8
remember 12:8
101:24 218:22270:9 305:15323:5
remind 39:14
313:3
reminders 40:9
remiss 198:15
remodel 133:25
199:12 199:23
remove 66:11
138:23 182:4254:25
removed 15:10

10TH CONFERENCE OF AIR QUALITY MODELS 03/13/2012 CCR#16766-1 424
rename 77:10
renaming 85:25
repeat 60:9 243:4
307:21
repeats 85:16
replace 45:5
54:19 65:22 81:8117:15 174:16239:24 260:17
replacement
117:25 120:6
replacing 86:8
replicated 154:24
report 29:19 30:4
38:14 56:8 74:18156:15 156:16156:19 166:5166:10 174:24183:7 203:25207:25 246:21247:3 294:5
reported 21:11
60:18 61:661:6 61:962:23 65:13 81:682:1 82:2197:9 237:9294:23
reported...calm
81:22
reporting 54:20
72:14
reports 22:13
237:17 271:24295:12
represent 88:10
150:15 166:16171:2 176:13176:17 176:24183:10 195:23215:2
representation
158:6 179:16182:2
representative
19:22 60:761:1 61:462:10 63:1577:17 81:18 89:694:12 96:8 101:8111:21 195:3195:21 196:7196:15 204:22205:15 205:21205:23 233:4256:22 256:25319:3
representativenes
s 59:2 62:8
101:2 102:23135:12 195:11319:4
representatives
167:2 167:3174:22 174:22
represented
181:18 215:9
representing
10:21 48:4
represents
68:11 79:590:7 120:25180:7 290:3
reprocessed 286:2
reproduce 154:24
reproduction
242:16
request 31:14
33:13 238:24
requested 38:3
159:7 234:11239:3
requesting 27:6
require 64:9
92:17 141:10199:11 244:16278:20 284:9313:5
required 7:7 8:22
45:13 55:1262:12 221:22233:13 234:14249:12 273:17273:25 274:17274:20 278:6279:7 307:21307:22 309:9
requirement 55:21
55:24 59:25 62:366:3 92:21 93:14187:16 189:8222:19
requirements
47:15 59:1259:19 60:4 88:1988:19 143:9189:1 198:13221:18 221:21231:10 242:1245:8 245:9313:4
requires 213:2
239:14 276:21277:16 304:11
requiring 178:2
rerun 85:24 86:4
re-run 198:24
resampling 251:13
research 20:4
22:2 118:14144:24 158:23159:10 167:17213:17 223:1301:13

10TH CONFERENCE OF AIR QUALITY MODELS 03/13/2012 CCR#16766-1 425
reset 87:10
resetting 87:17
residential
96:3 100:13100:14 100:14101:15 103:4103:12 103:25104:11 104:19109:16 109:20109:21
residual 250:21
resolution 28:3
31:19 95:1795:21 98:13283:20 284:8285:15 286:25307:11 316:24317:8 318:11
resolutions 277:4
290:15 308:2
resolve 26:8
resolve...that
124:16
resolved 73:19
124:17 125:17202:7 217:9241:24 311:23
resource 102:2
108:9 119:18235:16
resources 24:13
91:7 210:13211:2 211:9261:10 275:2305:3
respect 3:14 22:6
32:2 32:332:15 33:7 33:1433:16 34:14198:3 227:2233:24 272:6274:23 279:18
293:12
respectful 4:17
11:24
respectfully
211:5
respecting 31:5
respond 306:6
responded 32:21
38:3 248:25
Responding 234:9
responds 279:6
response 27:7
29:10 32:432:7 34:20 34:2140:16 45:11 66:266:6 106:24107:1 112:8159:11 233:16249:11 250:25282:3 282:5305:18
responses 202:1
251:25
responsibility
223:18 232:11264:25 304:3306:16
responsible
279:11 279:15307:13 307:14
rest 126:14
126:14 224:21
restore 280:16
result 42:14
48:13 53:17120:7 136:14137:6 151:8154:4 155:13208:12 231:19246:6 251:17275:23 279:5
315:15
resulted 163:2
229:14 279:20
resulting 161:6
230:12 280:2
results 57:20
57:21 58:16 67:671:19 73:2 78:17102:9 105:16106:3 108:11111:22 115:16116:12 129:1129:14 136:8137:21 145:1147:10 153:5154:21 154:22154:23 155:3156:13 163:16164:22 165:7170:22 205:11206:15 226:13239:1 241:11243:22 246:23247:1 247:8247:22 249:6249:8 249:9249:9 249:11249:12 250:16251:9 251:11251:11 251:13251:15 251:17252:7 253:3253:20 254:5254:19 255:9256:19 257:10257:12 266:14266:17 277:22288:23 289:11292:15 292:24294:3 294:13
results...the
128:16
retain 283:19
285:14
10TH CONFERENCE OF AIR QUALITY MODELS 03/13/2012 CCR#16766-1 426
retains 238:7
rethink 52:24
53:18
retirement
80:24 271:14271:15
retrieval 60:4
return 323:5
reversals 240:24
review 8:18
22:6 28:130:19 32:1839:17 40:20 41:942:7 48:9 92:492:10 146:15153:3 157:16157:21 159:5210:2 212:4232:15 233:14234:19 243:13245:12 253:24261:2 279:12
reviewed 20:20
22:13 142:2155:25 226:11242:8
reviewing
143:11 199:7236:17 244:13245:3 276:6304:3 307:5308:17 308:20319:8
reviews 31:1 55:6
revise 149:3
264:22
revised 40:16
142:2 186:19
revision 24:17
42:18 105:4
revisions 16:9
42:14 186:19275:21 283:14306:2
revisit 214:21
revisited 21:10
104:8 128:11
revitalized 24:7
reward 39:8
RF 317:8 319:18
RFP 187:8
rich 302:17
Richardson
164:5 288:14
rid 110:12 111:17
ride 228:15
Ridge 161:16
164:9 164:23
riding 220:20
220:21
right...oh 119:24
rightfully 273:14
right-of-ways
195:17
rights 237:22
238:7
ripple 238:4
rise 40:13 225:6
risk 71:15 72:4
river 307:1
road 169:3 172:20
173:12 180:5181:21 182:4182:4 187:7188:13 191:22192:2 192:4192:7 192:20192:21 192:24214:4 218:8221:7 261:23
267:15
roads 166:4 166:5
166:16 167:5168:1 171:2171:16 174:11177:4 178:9183:10 190:25191:23 203:18203:21 213:16213:21 216:13220:3 221:5
roadway 169:13
169:24 169:24172:14 173:10177:20 204:18214:11 216:16
roadways 99:4
99:18 170:4172:13 177:4
Robinson 17:12
165:24 165:25166:2 203:17204:3 208:2
robust 250:8
252:10 259:18
robustness 279:4
rock 260:6
Roger 9:22
23:25 23:25 30:832:24 35:737:6 37:938:18 39:2 67:2575:5 75:1080:3 81:15 133:5133:9 135:1144:12 147:23149:5 195:9201:17 203:2221:3 223:8223:12 239:8243:8 259:3259:9 259:17268:21

10TH CONFERENCE OF AIR QUALITY MODELS 03/13/2012 CCR#16766-1 427
Roger's 265:5
role 16:18
39:15 42:2343:24 95:11117:1
roles 31:5
roll 275:20
277:24
Roller's 25:8
rolling 81:5
107:8 107:10135:9 165:23277:12
Ron 146:3 146:4
220:25
roof 177:9 178:6
room 3:13 4:8
25:8 32:532:13 35:1037:10 38:10139:9 144:14144:17 188:4228:12 228:13273:8
rotated 129:8
roughness 32:17
33:1 33:4 36:336:6 93:893:17 93:21 94:194:3 94:894:11 94:1494:21 95:296:7 96:896:25 97:899:8 100:6101:25 102:4102:10 102:14103:17 103:20105:2 105:15106:11 106:19108:17 109:11110:4 110:13
111:9 111:19111:21 112:11112:14 112:22112:23 113:11113:22 114:16114:25 115:8115:9 116:4116:5 116:6116:7 116:9116:20 117:15121:16 122:11130:25 149:12149:14 150:24153:8 158:16158:20 165:17284:20 285:11
roughness...
estimates 92:8
roughness...those
92:21
roughnesses
103:16 109:1
round 145:1
227:25 270:25323:1
rounded 82:22
91:10
rounded...you
82:21
route 79:14
routine 200:25
291:20 295:25
routinely 61:19
202:23 275:11276:17
routines 82:12
row 50:24
RPO 316:3
RPOs 316:1
RTI 267:8
RTP 3:5 267:8
rule 4:24 42:17
42:20 68:9133:18 141:10142:3 186:20187:11 213:2222:18 236:6236:6 244:15249:3 249:3250:25 255:8
rulemaking
232:3 233:10233:13 234:10235:4 315:12
rules 198:12
run 48:12 52:4
59:24 73:1 77:1378:24 79:1 95:13111:20 116:18119:5 139:18159:18 161:14162:18 173:17183:10 193:16221:8 246:6246:6 260:2264:10 265:12265:24 266:24270:7 283:3285:25 286:4300:2 302:11304:22 312:21314:23 317:22321:2
running 24:11
76:15 77:2286:15 260:10295:9 296:25317:8 317:13
runs 170:23
170:24 299:24
runway 99:4
100:18 100:18100:19 100:20100:23 103:7

10TH CONFERENCE OF AIR QUALITY MODELS 03/13/2012 CCR#16766-1 428
107:17 108:4110:13 111:1111:5
runways 96:21
99:18 100:4109:15 109:23110:8 118:23
rural 89:24
90:3 90:590:11 131:16
RWDI 204:17
Ryan 207:15
S
Sadar 134:25
safe 216:17
safety 179:21
said,.we 23:18
sample 252:19
286:14
samples 107:12
182:22 182:23252:20
sampling 106:25
samplings 168:15
SAMSON 85:4
sanity 287:1
287:16 291:17307:6
sat 198:7
save 133:5
saving 4:9
savings 305:2
saw 33:13 36:1
62:20 91:18105:18 106:1109:4 168:16168:18 170:1171:9 209:8226:25 257:25
303:1
saw...that 100:5
say...here 132:12
say...so 92:2
saying...well
127:4
scale 153:13
154:10 154:11217:10 240:17273:19 315:3316:22 317:3317:3
scan 176:1
scattered 115:16
scenario 187:25
188:1 188:1209:11
scenarios 289:15
schedule 4:6 4:15
14:2 14:330:20 79:19145:19 201:17227:24 239:12271:2 296:3296:6 313:9313:10
scheme 321:7
321:11
Schewe 144:19
219:19
school 76:16
SCICHEM 19:11
282:20 286:11294:11 294:15294:17 295:10310:16
science 8:1 8:1
8:16 16:18 18:2520:3 20:620:25 21:122:2 222:8
223:20 223:20281:11 281:25305:11
sciences 8:2
scientific
16:17 18:5280:16 301:16
SCIPUFF 286:11
Scire 238:2
262:19 319:5
scope 41:15
167:17 190:17
SCRAM 32:10 41:18
41:20 42:2 90:16144:16 166:11197:21 229:15241:20 294:22295:18
screen 74:25
75:21 78:9 79:1379:22 104:22
SCREEN3 45:5 75:9
75:16
screening 5:3
44:25 45:647:1 75:6222:2 274:16
scripting
301:14 301:23
Sea 284:5
Seaman 317:5
seamless 118:25
298:17 311:2312:23
search 38:12
searchable 37:24
Sears 99:6
seas 34:22 34:25
seasonal 95:20

10TH CONFERENCE OF AIR QUALITY MODELS 03/13/2012 CCR#16766-1 429
118:6 118:7
seasons 96:9
seat 228:6
seats 80:13
second 18:21
62:18 63:3 63:2363:24 64:1064:12 65:17106:15 107:5107:5 107:7107:8 111:11135:9 140:1153:2 158:1158:4 158:5158:6 161:23161:23 165:3220:24 232:9272:18 281:22305:6 306:3
second...that
111:13
secondary 43:13
45:22 46:1 60:21232:1 235:7237:5 242:22
section 60:3
60:24 63:25 66:493:21 106:9205:5 206:2221:23 231:11231:17 235:20244:6 245:2246:12 247:24248:4 248:7252:1 253:6278:7 307:22308:24 313:3313:4
sector 18:15
94:20 102:12114:10 115:13115:22
sectors 12:25
95:19 109:2110:8
secure 5:4
security 3:9 4:20
see...Orange
97:21
seeing 18:18
137:3 193:2278:4
seeking 32:18
seem 73:22
seemed 112:22
134:9 186:2244:21
seems 112:19
113:23 116:11130:11 167:1208:18 211:4224:9 265:19319:9
seen 7:14 33:11
50:21 58:22 87:890:23 105:16106:6 159:5213:10 221:6244:24 271:10271:16 272:14293:21 317:19
seen...a 118:1
select 193:14
285:22 285:23303:5
selected 155:8
selecting
194:25 222:22
self 216:3 271:14
send 29:2
sending 34:13
sense 40:7 53:4
109:6 110:5
111:8 137:4148:16 158:13168:1 185:25186:11 189:9191:9 193:9216:11 229:8253:4 253:21255:4 259:24291:20 292:16307:5 309:6
sensitive 38:12
38:12 171:7215:4 215:6267:1 321:11
sensitivity
57:1 57:357:19 57:24 58:158:18 77:4 90:1292:22 142:16168:3 169:14170:2 171:7173:18 174:24215:7
sent 29:16
separate 13:3
41:20 132:11242:7 282:20299:7
separately
59:22 125:15126:9
Sept 255:25
September
114:12 255:16256:18
series 251:12
251:12 255:25260:21 261:6300:12 300:17303:2 303:4303:6 303:7
serious 63:17

10TH CONFERENCE OF AIR QUALITY MODELS 03/13/2012 CCR#16766-1 430
seriously 135:18
served 120:15
server 118:25
service 18:24
31:22 40:956:9 86:792:12 92:1792:23 93:2142:10 171:11190:3 287:12288:21 290:21293:16 305:10314:7
services 185:5
298:22
session 29:22
132:25 133:1145:9 145:25157:4 185:12233:25 314:13314:14
sessions 3:24
201:19
sets 171:9
257:4 265:14276:3 276:7277:10 289:22289:23 301:17302:24 304:5304:7 304:14306:1 306:10307:21 308:10311:11 312:1312:5 312:7312:13 316:25317:1
setting 9:11
68:24 69:1 69:22236:9
settings 43:3
229:24
set-up 204:6
seven 8:24
197:8 221:23
several 14:10
23:23 42:8 42:22147:7 192:21205:10 217:25222:21 228:19242:11 294:20315:17
severe 285:18
shalt 235:9
shape 149:21
150:6 150:13
shapes 149:23
share 7:10 9:14
13:13 98:18243:21 311:9
shave 304:25
shed 255:12
sheer 274:8
shelf 34:12 210:9
Sherman 137:13
She's 228:12
shift 181:11
308:8 322:9322:9
shifted 24:14
83:20 86:3
shifting 311:19
shifts 306:15
307:4
shop 186:5 193:18
short 116:7 140:9
152:7
shortening 228:3
shorter 107:9
151:17 152:13
shortly 32:10
short-term 49:4
showed 45:15 57:2
58:1 101:18121:16 122:5155:1 247:14
showing 47:8
57:19 57:2358:19 108:1108:20 109:15129:15 183:6316:8
shown 67:2
71:18 102:17117:10 118:3238:16 245:15
shows 11:19 63:10
68:5 72:298:10 102:9102:10 102:13105:18 107:21108:23 110:9111:6 114:19115:10 115:12118:17 122:10139:1 151:3160:3 178:6188:6 192:4255:16 255:24291:4 300:16
shroud 152:21
shut 220:5 320:10
320:11
shuts 51:6
shuttle 118:14
shy 10:22
side-by-side
180:16
sides 319:19
Sierra 23:12
234:5 234:22
sigma 106:12

10TH CONFERENCE OF AIR QUALITY MODELS 03/13/2012 CCR#16766-1 431
135:22 139:21158:9 158:9161:22 162:1162:4 162:8162:14 163:6163:21 163:23164:4 164:16165:3 169:1170:19 172:21173:14 173:17200:4 200:6200:7 200:7200:9 200:11200:14
sigma-y 169:21
170:11 172:22
sign 90:19
signal 115:2
118:6 119:11135:7
signals 114:16
116:10
signature 37:22
signatures 37:20
signed 38:9
significance
268:22
significant 43:21
43:22 46:146:2 47:10 47:2252:6 53:953:13 53:23 55:262:1 65:12 65:1965:21 67:24105:24 106:2110:4 111:13131:18 131:19132:3 167:7189:21 192:4249:14 251:23253:2 253:19253:22 254:20255:4 257:6
257:11 269:7269:10 269:23270:2 270:3270:11 276:21292:13 304:19
significantly
47:23 50:12 51:151:12 67:21 69:970:8 72:9 103:19162:11 177:13202:15 242:12248:8 253:11269:18 291:4
signing 17:25
Signiore 230:6
SIL 47:9 47:11
52:5
silt 218:2
silver 303:18
309:13
similar 35:1 63:3
63:8 70:13 83:20131:6 166:23173:10 184:10205:17 236:20251:7 251:8253:15 257:9258:3 258:11282:3 287:1287:24 288:2288:6 291:7292:2 292:5312:15
similarities
43:19
Simmons 135:15
213:13
Simms 80:23
simple 15:24
48:14 94:2 132:5150:14 238:17261:4 261:5
simpler 127:22
simplistic 8:5
240:18
simply 172:21
173:9 260:17
simulate 8:4
9:5 36:3 171:4194:14
simulating 168:24
simulation
171:1 295:8295:9 297:23
simulations 295:6
311:16
since...I 135:8
single 61:5 90:13
91:22 106:11159:21 159:22164:6 172:19190:14 231:22237:4 239:17239:17 240:19
SIP 7:18 16:6
20:19 25:5 192:3231:12 272:16279:12 297:2297:22 322:14
SIPS 187:8
sit 133:1 198:5
241:22 242:2
site 33:16
47:16 59:19 60:360:8 60:2561:1 61:263:22 64:764:8 90:1894:4 94:10 94:1295:1 99:11102:19 103:1103:20 105:17106:19 108:1109:14 112:7
10TH CONFERENCE OF AIR QUALITY MODELS 03/13/2012 CCR#16766-1 432
112:13 113:4114:14 116:3117:18 118:6122:16 122:17150:15 155:6155:7 171:10195:5 195:8195:10 205:15256:20 257:19315:19 319:3
sites 60:20
86:9 97:7107:4 107:15177:5 177:6183:5 183:5
sites...it 98:6
site-specific
92:14
sitting 210:9
situation 17:9
32:19 97:18126:10 129:25140:16 147:21152:1 178:10182:13 203:9209:3 212:19213:4 224:12224:14 266:8280:8 309:2
situations 17:7
21:16 46:22128:9 141:19146:22 173:3202:23 211:18217:13 221:4222:1 225:6225:16 226:7231:3 240:4240:5 240:7240:24 244:17245:1 246:19
six 8:24 57:15
81:23 112:19113:10 117:20
136:12 136:25163:5 169:3172:9 172:10172:15 172:18172:20 173:11173:12 228:2230:11 260:21260:22 321:14
size 143:23
176:16 180:4180:7 181:10184:25 252:19315:10 315:11
sizes 169:8
skew 99:19
117:3 258:6
skewed 68:16
skills 274:9
274:18 302:2
skim 128:16
skims 64:24
skip 112:3
slag 177:10
slash 184:12
184:23
slice 110:17
139:8
slide 14:1 14:5
29:13 30:1130:14 34:2 57:18
slides 24:1 24:22
37:9 45:691:19 144:13151:2
slight 115:20
140:20
slightly 24:5
104:12 104:20124:1 131:2173:20 288:1
slope 164:12
273:20
sloped 152:19
small 5:23
42:16 178:8200:14 252:19
smaller 124:1
124:12 124:13253:12
smoke 220:15
220:16
snapshots 288:16
snow 96:12
96:13 159:17
Snyder 17:14
155:22
so...and 100:1
so...but 104:4
122:21 144:7
so...the 100:2
so...we 128:21
SO2 7:19 16:9
20:8 21:1023:7 43:14 43:1844:22 46:671:2 79:2190:5 137:16139:16 248:5249:20 250:12255:13
Society 105:14
SODAR 249:23
256:22 257:20258:18 258:20
software 91:15
263:2 264:8268:21 269:10272:2 272:22272:25 273:1274:12 274:14275:7 288:20

10TH CONFERENCE OF AIR QUALITY MODELS 03/13/2012 CCR#16766-1 433
296:9 298:9301:1 302:10
sold 237:22
solid 151:6
151:10 151:17151:18 151:23152:16 152:17152:24
solution 158:10
199:4 203:4246:5
solutions
141:17 158:13
somebody 5:9 97:7
157:5 215:21220:4 243:7320:13
somehow 80:2
143:8
someone 36:21
182:8 199:12208:5 209:1224:17
something...you
101:6
sometime 30:3
61:6 91:12101:12 149:3204:24
somewhat 24:12
31:11 47:491:3 163:18254:9 294:4298:15
somewhere 38:7
115:24 119:1174:15 204:11225:4
sonic 86:8
86:12 107:2107:4 107:7107:14 114:5
114:12 115:4135:9 158:17
sooner 17:6 219:4
sophisticated 8:3
242:14
sophistication
8:6 8:9 12:23192:14
sorry 38:22 198:7
202:13 230:9313:10
sort 25:1 39:19
39:20 41:1342:16 42:19 43:443:6 43:944:11 44:1344:13 44:23 45:645:18 46:12 47:148:4 48:5 49:151:5 51:21 52:2355:10 62:1662:18 63:866:5 66:570:25 91:5 92:1898:19 100:4101:13 105:5105:8 107:15109:22 113:4113:20 114:1114:8 114:17116:19 116:23117:12 119:3121:7 121:10123:10 124:6125:22 126:24128:13 131:20136:11 167:16168:1 168:14169:10 172:6174:4 185:16202:18 204:5204:9 204:19208:9 208:13215:11 243:12
244:2 247:10252:15 256:25258:12 279:2282:10 297:13316:11
so-to-speak 180:9
sound 31:23
sounded 148:5
sounds 149:3
source 16:1
28:1 49:949:20 50:1150:14 53:10 58:163:14 67:169:3 71:16 71:2072:22 72:24 75:175:2 76:1677:5 78:13 78:2090:16 132:15134:23 137:16139:1 139:2143:24 149:6168:18 169:8170:19 171:16172:3 172:25173:4 173:6173:8 173:11173:17 173:19174:8 174:14181:20 181:25181:25 182:1182:1 183:14187:7 188:20191:3 194:21195:24 200:23200:25 212:24214:15 215:2215:2 215:9215:10 224:18224:22 224:23231:22 234:19237:4 239:19240:2 240:19243:24 248:4

10TH CONFERENCE OF AIR QUALITY MODELS 03/13/2012 CCR#16766-1 434
249:24 260:3306:22 307:15318:1
sources 44:16
49:24 52:7 52:2352:25 53:853:9 53:1462:9 72:576:24 78:9 79:2394:23 95:2121:14 123:9123:10 139:18142:16 143:1143:22 167:7167:9 167:11167:20 168:5169:11 170:4170:5 170:6170:12 170:14171:1 171:18171:19 172:1174:16 174:17175:12 175:15175:17 175:19175:20 175:20176:4 176:5176:13 176:17176:23 176:24177:1 177:3177:18 178:2178:5 178:21178:21 179:6179:9 179:14180:20 180:22182:19 182:24183:11 183:12183:24 184:18184:23 185:24190:10 193:8193:12 193:12193:15 194:2194:10 194:12194:13 194:18195:7 195:22196:4 196:13200:25 201:2
201:9 204:7204:25 209:9215:5 218:13222:5 222:6225:7 226:3239:17 239:17240:16 248:18248:21 249:25250:2 256:5267:17
sources...I 123:5
south 108:8 110:1
110:5 110:20111:7 291:10291:15 316:5
southeast
108:20 116:24249:22
Southern 213:17
southwesterly
255:24
space 76:14 89:19
100:8 100:11100:19 108:3109:24 110:23176:6 247:20
space...orange
108:3
space...well
110:21
spaces 178:8
spacing 76:6
195:13 316:16
span 6:19 100:23
spans 99:7
spatial 177:19
288:2 290:15290:18 291:1291:16
speak 28:13 146:7
175:10 204:9
208:3 232:19
speaker 211:13
314:14
speakers 4:12
4:17 11:9198:3 227:24270:25
speaking 25:11
82:13 211:6317:18
special 274:19
specialty 18:10
22:11
specific 13:3
34:21 40:2 47:1659:19 60:3 63:2264:7 64:870:19 77:12106:19 117:18121:9 145:9149:20 195:5195:9 195:10201:10 202:1202:4 203:15218:1 218:5218:12 223:23225:21 232:17236:23 246:11256:20 257:19276:7 280:13295:3 306:22308:4 319:3
specifically 19:9
36:2 140:6 236:2320:10
specifics 31:16
specified 73:25
92:17 286:13
specify 64:17
76:12 77:3 77:16120:19 193:16280:15 283:16288:13 288:13

10TH CONFERENCE OF AIR QUALITY MODELS 03/13/2012 CCR#16766-1 435
320:9
specs 114:3
specs...the
106:24
speed 60:17 61:13
62:15 63:164:9 64:18 64:2076:11 80:1981:22 81:2381:25 82:583:5 83:7 83:883:13 85:1187:11 87:1288:15 88:1689:16 91:22102:7 106:12106:13 107:11111:10 111:14111:18 111:20111:20 131:8140:2 142:11142:14 142:15142:20 154:17157:8 158:16158:24 159:15161:5 164:2184:22 184:24192:22 192:23200:19 204:12210:7 214:8240:22
speeding 142:19
speeds 57:15 59:1
62:18 62:2263:19 87:1689:17 102:5111:6 111:7111:17 140:3140:8 143:17153:13 153:13157:14 157:25158:18 158:22161:7 165:16174:7 203:23
spelled 245:9
spend 54:5
123:5 261:11
spent 24:25
25:4 121:15
spiking 256:3
spirited 259:10
split 124:6 124:7
127:3 127:5
split...the
124:12
spoke 133:1
sponsor 242:5
sponsored 18:10
230:12 296:21296:22
sporadic 50:24
spot 17:19 186:13
187:11 187:16188:12 188:17189:10 189:20196:24 197:22205:6 221:24222:18
spots 212:11
221:11 222:20
spottiness
292:7 292:8
spread 89:25
90:10 165:1200:13
spreading 165:19
spreadsheet
97:1 162:3
spring 96:13
238:2
Springfield 88:23
squared 213:14
squeeze 135:25
SRDT 284:16
SRTM 118:14
118:15 118:25119:5 119:14121:4
stability 56:24
58:8 284:16284:20 292:19317:14
stable 62:19
71:10 95:5131:13 140:15153:14 154:15161:5 161:17162:21 162:23163:14 164:8164:24
stack 48:22 57:20
58:3 58:7 65:865:14 65:18 66:466:14 68:468:9 68:22 68:2368:25 69:269:6 69:12 69:2170:2 70:3 70:470:16 71:20 78:3123:18 123:21124:1 128:21129:12 130:6133:17 133:17134:2 134:3134:8 134:10138:2 138:6138:10 138:13139:25 149:20150:6 151:16151:16 152:21154:17 161:14171:7 171:8175:25 176:1176:2 176:8176:21 178:19178:25 179:1184:17 194:19

10TH CONFERENCE OF AIR QUALITY MODELS 03/13/2012 CCR#16766-1 436
225:25 289:16
stacked 128:24
stacks 66:19 67:8
67:19 67:24133:19 134:15171:2 175:17254:4
stacks...and
130:14
staff 27:20
74:5 274:4
stage 64:19 73:25
236:10 322:6
stagnation 240:23
246:16
stairs 5:25
stakeholder
277:19
stakeholders 11:6
stale 309:6
Stalfor 317:6
Stan 32:12
32:12 39:5
stand 8:1 10:13
10:22 133:3218:16
stand-alone
207:25 299:5299:6
standard 40:17
43:25 44:444:5 44:7 46:546:11 46:1346:14 46:1546:20 47:5 47:1947:24 48:248:6 48:7 48:848:22 49:349:4 49:649:23 50:350:4 50:6
51:12 52:353:5 53:18 54:1957:13 59:761:4 61:561:19 81:885:2 85:785:13 88:1088:17 98:19133:24 137:17137:19 139:17184:20 224:11252:16 255:19280:10
standardized
180:11
standards 4:4
8:18 8:19 8:259:1 9:3 12:2114:9 17:18 43:2046:9 71:3 178:18210:25 219:3227:14 271:12314:1
standing 33:21
standpoint 14:6
14:7 145:4209:16 219:11226:8 238:14
start 3:12
14:25 25:1736:22 80:884:6 84:7 84:784:11 113:6131:4 131:9215:1 288:9317:13 322:7323:3
started 4:7
25:2 80:1781:2 109:5 121:2122:4 145:16166:24 185:20256:1 258:6267:8 309:18
320:5 320:6320:14
starting 25:4
84:14 101:14228:6 234:2
starts 51:6 82:25
state 10:19 10:21
11:3 13:116:25 17:1518:13 18:2324:10 24:25 25:925:23 28:1328:18 28:2028:23 29:1930:17 30:2247:16 63:2263:25 98:16144:4 144:9166:25 167:2167:25 172:15174:21 176:12176:21 189:12189:12 202:8205:25 207:22208:16 211:24221:19 226:21227:3 227:4229:20 239:19246:4 248:10272:5 272:13274:22 274:23275:22 276:14276:23 277:25279:4 280:6281:8 281:10281:24 303:25305:9 317:6
stated 61:16
statement 27:13
29:3 231:12319:7
states 7:23
17:3 35:268:10 75:12
10TH CONFERENCE OF AIR QUALITY MODELS 03/13/2012 CCR#16766-1 437
168:17 170:7218:1 218:6225:7 227:7231:20 232:10236:3 247:19275:14 281:19281:20 284:1311:15 312:4
state-to-state
167:12
static 229:20
278:25
station 61:22
78:18 81:1882:18 82:18 84:986:15 87:589:5 89:19 90:1190:13 90:1991:14 97:298:6 98:20 195:6195:21 204:23205:1 250:3317:25 323:6
stationary 193:12
196:4
stations 60:21
86:13 87:487:7 90:25 97:19108:7 194:7204:24
station's 87:15
87:20
statistical
254:17 278:5281:3 282:11296:18 297:9299:12 299:15299:23 303:20
statistically
131:18 131:19132:2 251:23253:2 253:19253:22 254:19
255:3 270:10
statistics 131:23
131:24 265:6300:13 303:2312:12 316:8
status 15:1 22:23
44:24 74:11 75:5120:9 143:3143:6 143:8144:20 146:13147:22 228:25230:21 231:19231:24 232:20239:6 242:10243:13 245:7266:5
statutory 26:10
stay 66:18
staying 144:18
228:9 228:11228:13
stays 6:19
steady 24:10
63:25 144:4144:9 176:12176:21 246:4
steel 175:12
176:25 177:25180:14 181:22
step 21:12
42:16 45:1861:12 127:9184:10 184:20189:18 190:9190:14 269:1272:4
step-by-step 52:9
52:10
stepping 235:22
273:3 293:10296:10
steps 5:15 11:6
34:17 84:2189:17 190:12193:11 193:13208:24 245:21273:2 309:10
stereographic
284:3 310:21310:24
Steve 137:13
157:12 212:7268:18
stick 97:23 261:7
stitched 125:14
stones 235:22
stop 11:5 75:24
77:23 144:5178:19 199:4
stopped 164:18
265:21 276:17
storage 177:7
177:22
store 16:8
story 125:16
straddled 65:14
straddling 67:19
straight 28:11
79:2 160:9
strange 156:12
156:13
stratified 153:15
stream 175:23
181:24
streamline 21:5
streamlined 152:3
strengthened
16:19
strengthening
16:15
stress 24:18
10TH CONFERENCE OF AIR QUALITY MODELS 03/13/2012 CCR#16766-1 438
303:16 308:6
stretch 228:18
strictly 306:18
stride 26:13
string 82:24 83:4
stringency 227:13
strip 181:6
striving 22:4
strong 11:23
16:24 17:22177:22
stronger 239:25
239:25
strongly 260:17
267:18
structure 36:5
37:5 69:1979:5 79:10 79:1579:16 117:9126:13 127:8127:17 128:10150:25 151:4151:7 151:11151:16 151:20178:8 320:1
structures
69:22 69:2469:25 126:21126:23 127:1127:24 152:14152:20 155:6155:7 266:20
stuck 260:6
students 97:6
studies 130:13
146:24 147:6147:7 147:10147:16 148:4148:12 148:13148:19 148:20148:21 149:2
149:6 150:2150:4 155:20156:22 174:2174:3 174:6213:10 217:1221:3 221:7222:19 222:21242:11 267:25268:12 268:16
study...RDU 108:6
stuff 54:5
64:24 101:17185:16 204:19220:21 317:16318:5
stumbled 60:15
sub 136:11 315:13
317:2
sub-attainment
187:8
subdivision 76:17
subdomain 286:16
sub-grid 240:17
subgroup 80:22
subject 75:17
125:11 133:15244:13 245:8
sub-kilometer
317:3
subliminal 234:24
submit 208:22
264:19
submitted 30:25
31:20 155:25156:16 156:20182:15 224:17248:2 248:15249:4 249:7249:8 249:8251:2 257:24262:24
sub-regional
315:5 315:19315:24
subroutine 75:3
subsequent 293:9
subsequently
161:10
subset 283:11
substantial
164:23 241:5
substantially
165:4 242:23
substitute
62:10 88:16
substitution
59:21 60:6 81:11
success 11:1
successes
225:12 226:17
successful 307:23
successfully 7:17
223:25
sucked 151:18
sucker-punched
259:9
sudden 24:15
suddenly 50:6
254:25 255:1
sue 234:8
suffice 22:22
sufficient
52:15 222:3224:3 237:12237:13 279:17318:22
suggest 62:6
252:12 266:6
suggested 74:19
94:2 146:16

10TH CONFERENCE OF AIR QUALITY MODELS 03/13/2012 CCR#16766-1 439
159:24 161:9163:12 209:20
suggestions
50:9 52:20 74:2177:2 174:1
suggests 126:1
256:4
suitability 276:2
276:7 279:25307:20 320:19
suitable 235:15
suite 22:24 24:16
262:16 262:17322:20
suited 176:20
sulfate 242:12
242:15 243:3
sulfur 321:22
SUM 85:7
summaries 300:12
summarize 29:10
45:7 147:2
summarized 40:4
245:21
summary 70:15
85:7 119:20154:5 154:6156:24 182:15184:14 303:13
summer 198:21
Sunwrap 316:4
316:5 316:5
superimposed
287:21
superior 258:4
303:16
supplement
61:19 102:2118:1 284:17
supplied 170:7
supply 222:25
supplying 293:7
support 9:2
21:8 21:12 67:2368:4 71:372:14 101:4229:19 233:19237:2 243:23248:3 249:2249:2 253:20253:24 258:14267:18 268:15294:19 305:16
supportable
171:25 173:23208:9
supported 16:21
67:12 174:12
supporting
72:19 101:3273:1
supports 21:1
95:15 241:13
supposed 75:11
118:18
supposing 269:13
sure 4:19 9:2
11:21 27:8 27:1237:4 37:19 37:2338:8 41:5 50:351:18 55:2575:22 109:24119:1 120:9133:18 137:9139:9 142:18145:3 168:9174:17 179:10186:24 188:4193:18 198:17210:11 232:5237:15 263:14
263:23 306:20308:9
surf 84:23
surface 32:17
32:20 33:133:3 36:3 36:554:17 54:2078:17 78:19 92:492:6 92:8 92:892:19 92:20 93:893:17 93:21 94:194:3 94:11 94:1494:21 95:2 95:2196:6 96:896:25 99:8 104:6118:16 120:24158:19 163:5165:17 169:9169:18 170:20284:20 285:11285:24 286:9297:3 297:3297:4 297:11299:17 299:18310:6 318:4
surfaces 159:17
Surfer 279:1
298:10
surprised 259:7
surprising 170:9
surprisingly
129:23
surrogacy 16:11
23:3 43:7 45:12
surrogate 45:16
suspect 62:8
suspended 36:16
147:25 180:3
suspicious 15:7
85:20
switch 125:20

10TH CONFERENCE OF AIR QUALITY MODELS 03/13/2012 CCR#16766-1 440
switches 241:16
switching 291:22
symmetrical
129:13
symmetry 130:7
SYSADMIN 25:13
system 19:23 20:2
37:17 54:1881:15 93:10 98:9121:8 135:21145:5 229:17237:25 238:25258:21 275:6275:9 275:17278:23 279:15279:24 285:8298:23 300:6309:21 310:7310:20 318:19
systematic 131:21
systems 299:25
302:12
T
table 95:25
96:5 133:2154:13 154:25183:6 227:10256:15 285:12
tables 104:9
104:10
tailpipe 166:20
191:14
tails 90:6
take-offs 135:2
taking 41:22
135:21 228:5234:14 236:10274:21 281:21300:1 318:3
talent 11:22
talk 7:12 7:24
21:21 21:22 24:226:20 28:8 28:1529:8 30:832:25 33:8 39:1563:20 64:480:8 89:2292:6 96:2 101:20123:2 136:6138:25 146:2162:22 166:4166:7 185:17197:17 199:17216:5 216:7216:24 225:13226:5 228:11236:9 239:11243:11 263:22272:4 275:1281:4 285:20293:18 319:14
talked 78:22
81:16 87:20112:2 115:9117:7 118:11121:10 121:17122:13 122:24123:3 123:4125:11 126:19135:18 135:22136:3 136:10139:11 141:19147:18 148:3152:8 172:12182:7 230:6242:1 244:15246:1 259:3259:19 275:21277:2 277:25287:16 296:10296:12 305:7305:13 305:18305:20 305:24308:2 308:25
talking 14:10
17:21 27:427:9 28:18 28:2234:5 73:680:17 144:21166:20 176:16177:3 205:25212:20 215:1236:5 241:12259:8 267:17296:8 308:23315:19 317:10319:2 319:2
talks 271:3
273:16 277:15
tall 58:3 58:7
71:19 130:16161:14
tanks 220:7
220:21
tap 119:18
targeting 116:16
task 274:3 274:7
taxpayer 186:24
TBA 294:11
teach 276:20
teaches 241:9
team 10:16
27:16 206:25213:19 298:22313:22 314:8
Tech 237:22 275:4
298:6
technical 7:10
11:7 16:15 27:1927:24 32:2235:24 36:1140:25 41:268:3 69:7 134:17188:19 189:3212:1 232:22235:15 243:18

10TH CONFERENCE OF AIR QUALITY MODELS 03/13/2012 CCR#16766-1 441
249:2 253:23
technically 31:23
93:17 153:16171:25 173:23208:9
techniques
20:17 21:2221:23 23:8232:13 232:17233:25 235:6235:11 235:14236:25 262:11
technology 8:13
telephone 3:16
5:18
temperature 92:15
287:23 288:6299:16 303:5
temperatures
154:14 288:5
template 156:21
156:21 226:16
temporal 101:1
105:24 111:4177:19
ten 4:13 54:7
61:9 63:676:12 84:2 89:1294:19 94:19106:8 114:11164:15 169:18249:23 250:3256:10 256:11256:12 256:13256:16 257:13257:16 264:9264:13 287:18
tend 58:9
104:12 107:13113:12 113:17176:5 176:8176:10 249:10
266:20
tended 58:12
163:21 168:11169:11 170:15171:22
tendency 254:14
tends 68:15
108:15 178:8
ten-minute 136:12
136:23
term 22:25 23:1
117:12 122:4141:17 215:25227:21 227:21252:17 278:13
terminal 56:22
119:11 190:5
terminals 190:7
194:2 194:6194:18
terminology 59:14
terms 15:1
15:13 15:21 16:916:10 18:819:6 19:1320:3 20:15 21:1221:15 22:923:1 40:742:24 43:243:6 43:19 44:1847:5 47:10 47:2149:22 50:4 51:1152:22 54:2459:18 91:492:8 92:11 92:1293:25 117:8120:23 121:24140:7 141:6141:25 142:24158:17 209:14210:20 211:22217:4 217:10222:10 223:14
227:21 229:12231:14 231:19232:4 232:20234:2 235:17235:22 236:6237:19 237:24238:4 238:21261:3 261:5261:19 262:3262:4 262:13263:12 263:16263:21 266:11275:21 277:3279:3 286:20286:21 291:1292:2 294:4294:19 302:2302:23 304:2305:2 306:22309:19 320:11
terrain 74:24
80:1 200:11240:23 246:24246:25 247:5249:22 250:4273:20 278:16316:18 316:24318:7
test 36:4 77:5
110:1 160:11178:23 178:24180:10 180:13187:21 264:9264:11 264:15
tested 160:1
160:10 162:16264:24 277:17
testing 19:2
117:17 145:2149:12 175:25178:25 179:1180:25 271:24272:25 287:14287:22 288:19290:10 291:17

10TH CONFERENCE OF AIR QUALITY MODELS 03/13/2012 CCR#16766-1 442
292:13 293:11293:12 294:7294:8 303:13303:15 314:6
tests 179:25
180:2 181:15220:17 264:5264:11 265:21268:22 293:6
text 37:24 38:9
th 103:9
thank 4:15 5:9
6:1 10:1510:23 12:6 14:1214:16 23:20 80:980:25 132:22146:6 157:7174:25 175:1185:10 199:20204:15 219:14221:1 228:16243:5 260:12265:3 267:20289:23 290:9323:10
thanks 6:25 14:18
23:21 114:6145:15 157:1165:22 165:25185:19 186:5197:19 197:20207:14 221:13243:6 316:12
that...for 105:14
that...of 135:24
that...one 96:19
that...rename
86:4
that...so 141:24
that...that 111:3
that...the 111:16
that...to 117:3
that...what 83:17
that's 51:15
52:17 63:665:2 70:1177:8 79:10130:22 147:20148:16 148:17148:21 149:13149:24 150:12151:12 152:21152:22 153:21155:1 155:16156:23 157:14164:18 166:22172:5 172:10172:14 182:2182:13 185:23186:14 187:16188:11 191:15194:3 196:14196:21 199:14200:18 202:3202:17 202:18203:4 203:5204:3 210:23211:7 211:12212:1 214:7214:14 218:9221:21 221:21221:22 224:3226:4 226:25227:2 227:3227:10 229:15231:11 237:12239:6 239:11239:11 242:9242:10 244:9244:24 246:7246:24 247:11247:21 251:8251:24 251:24252:16 255:2256:2 258:12258:13 258:22
258:24 260:3260:9 260:24261:1 261:12262:3 262:8262:12 263:10263:13 263:22264:4 264:8264:24 265:20265:22 267:25271:4 273:9273:14 275:7278:19 291:17293:24 293:24294:23 296:23297:1 297:21299:17 299:25303:4 303:17306:17 307:1310:10 311:3312:21 314:21315:25 316:20317:20 317:21318:23 322:24323:2
That's...if 108:7
that's...those
104:21
the...a 124:5
the...and 88:25
the...based
134:21
the...in 140:2
the...of 88:19
the...this 105:6
the...what 81:7
theme 91:3
themselves 3:25
82:19 106:21180:10 262:23269:3
Theoretically
137:14

10TH CONFERENCE OF AIR QUALITY MODELS 03/13/2012 CCR#16766-1 443
theories 153:21
theory 103:13
150:11 150:14151:1 152:11
there...address
122:20
there...but
117:21
there...it 124:21
there...one
115:14
therefore 19:11
232:24 247:22248:14 307:17308:17 316:18318:1
there's 31:10
33:12 37:1572:10 147:16180:5 180:25181:23 183:14187:16 190:22192:21 197:6197:6 199:22212:12 214:14217:3 217:18219:9 225:8226:17 226:17230:2 232:17239:14 248:24250:19 252:12252:25 255:11255:24 257:12265:8 266:20271:23 271:24275:18 286:19286:19 288:17290:12 296:4297:12 298:12306:13 313:15318:11
theta 163:6
163:21 163:23
Thetas 135:23
they're 41:11
152:3 168:1175:19 177:18198:5 201:6214:11 263:7267:12 269:15269:18 312:7
they've 275:8
309:6 313:23313:23 314:1
think...it 133:23
third 19:24 143:2
201:2 205:12
thirty 54:8
Thompson 67:25
thorny 175:15
thorough 40:20
thoroughly 111:25
those...the 81:17
thou 235:9
thought...okay
110:10
thoughts 235:23
thousand 296:2
three-tier 46:10
three-tiered 44:2
46:12
three-year 34:7
47:13
threshold 63:23
64:11 64:1864:21 64:23 65:274:1 249:13
thresholds 64:9
79:24
threw 58:15
thrilled 13:21
through...I
137:24
throughout
20:22 23:20 24:6213:5
throw 221:14
thumb 4:24
Thurman 9:23
17:13 74:1080:14 80:16
Thursday 22:20
319:15
thus 121:11
242:13
tier 44:2 46:17
46:25 48:148:3 48:348:11 48:1148:14 48:20 71:4123:17 124:10126:8 126:9
tiers 124:11
127:1 127:10128:1 128:1128:3
tight 4:15 90:5
tighter 12:21
Tikvart 147:1
148:25
Tim 289:21
time...Atlanta
116:14
time...it 83:1
Time...the 83:2
timelines
304:18 305:1
timely 21:2
22:5 26:17 26:1826:20 26:22 31:3187:3 280:15

10TH CONFERENCE OF AIR QUALITY MODELS 03/13/2012 CCR#16766-1 444
tips 197:13
tire 168:24
191:14 216:19
title 146:5
175:11
Title-V 179:17
to...especially
128:14
to...so 121:6
to...which 112:10
to...why 127:13
to...you 124:19
today 3:8 7:6 8:3
8:14 10:15 11:1912:25 13:1417:21 22:19140:14 144:15175:10 176:17186:11 187:15204:9 219:1243:8 287:10323:1 323:8
Tom 56:7 79:20
216:25
tomorrow 6:15
17:14 21:2322:19 23:1389:22 185:17201:20 210:20225:14 226:5227:18 233:24235:12 236:9237:9 237:20262:11 281:4287:6 293:18323:4
Tony 134:25
too...no 119:24
tool 19:8 21:7
92:5 93:193:12 117:22
132:11 196:20196:22 222:8239:1 258:19271:20 293:13294:10 297:1298:12 299:6300:23 304:11311:8
tools 7:19 8:9
9:9 21:4197:13 222:2258:22 298:7300:5 300:21303:10 305:22305:23 306:8322:13 322:18
top 5:25 108:25
118:15 118:17131:4 135:20151:3 152:16154:17 168:19169:17 169:18172:4 172:7172:21 173:12179:10 179:12252:9 256:10256:11 256:12256:12 256:16257:12 257:16
topic 11:20 93:18
140:9 140:11216:2 227:2
topography 212:24
torture 271:8
torturous
313:13 318:7
tossed 57:17
total 64:3
162:6 180:2
totally 218:6
218:21
touch 166:6
touched 75:5
touches 138:10
tour 271:13
toward 45:18
117:3 123:12168:12 168:13245:16
towards 42:16
59:1 68:16 99:1899:18 99:20102:10 110:5113:11 113:17174:4 181:4209:23 322:9
tower 57:8
94:22 97:897:9 97:16 97:1698:4 98:12 98:15101:12 101:17102:13 103:6106:5 107:16108:10 109:16110:20 113:7113:12 113:13113:17 113:18115:24 115:25117:11 135:14249:24 256:21
Tower...not 99:7
towers 152:3
254:4
town 7:2 28:14
toxics 19:1
toying 79:2
toys 25:13
Trace 295:1
Tracer 157:19
158:25 159:9161:12 161:14200:12 293:13293:20 294:2

10TH CONFERENCE OF AIR QUALITY MODELS 03/13/2012 CCR#16766-1 445
295:1 295:4303:21
track 79:19
tracking 37:17
trade 29:23
trades 25:2
traditional
158:11
traffic 169:5
169:6 189:22190:2 190:23
train 321:15
321:17
trained 311:21
training 74:7
196:18 196:23196:24 197:1198:14
transcription 4:1
transcriptionist
3:19
transformation
242:21
transit 186:20
186:23 188:8188:11 188:20189:21 190:7194:5
transition
45:11 121:25160:8
translate 274:19
transparent 22:5
transport 17:24
23:9 183:3183:17 184:3184:6 184:7184:12 205:11233:9 242:6247:20 248:8
262:14 272:7272:13 276:4278:22 282:2292:5 292:23304:20 307:14307:24 309:3315:16
transportability
180:21
transportation
17:19 96:499:3 104:11107:24 109:19185:22 186:2186:7 186:9186:17 187:1188:18 189:11192:10 194:9194:24 195:5196:6 197:22198:11 207:3217:25 223:1
trapping 182:7
183:16 183:19192:24
traveling 14:18
tray 145:13
TRC 139:15 198:19
218:16 230:11237:23 237:23238:3 238:7238:24 241:7241:8 241:10241:11 242:24261:16 263:23275:4 276:20298:6
treat 55:16 86:14
87:3 114:5 126:9247:19
treated 55:14
55:15 60:5 87:18128:6 152:4
treatment 54:21
87:23 183:19
tree 108:18
trees 100:15
104:2 104:3107:19 108:19109:16 109:21109:25 110:5110:12 110:21110:24 111:1111:5 111:15111:16 111:18114:10 116:22117:1 119:10184:5
tremendous
109:8 190:13196:17
tremendously
275:18
trend 108:15
111:9
trends 171:9
tribal 10:20
10:21 11:4 13:1
tribes 7:23
tried 13:4
37:11 50:8 53:2153:25 83:1583:22 154:24298:16 298:16298:17
Trinity 142:6
144:20 200:1219:20 275:7
trouble 41:4 41:6
156:6 174:3
truck 169:3 169:3
169:22 216:19
trucks 166:22
177:8 177:14

10TH CONFERENCE OF AIR QUALITY MODELS 03/13/2012 CCR#16766-1 446
181:21 181:24190:1 190:4190:6 213:20220:7
true 12:3 12:4
83:14 176:2297:25 321:15
truly 11:19 219:2
237:14
truncated 61:7
62:25 82:2291:10
truncation
64:21 87:19
trust 4:8 4:9
14:11 316:17318:7 318:12
try 5:1 6:2
13:6 14:1118:4 18:1126:8 28:3 41:441:25 49:7 52:2352:24 53:553:5 53:653:24 55:25 73:374:2 83:10 83:2591:17 92:798:3 102:20111:24 114:8120:2 121:7122:12 123:6132:21 145:10158:22 176:22178:1 178:10178:20 178:22181:2 185:6189:16 214:22217:7 225:15225:16 258:19311:10 320:13
try...So 119:25
trying 6:12 26:14
29:13 37:11
37:18 37:1838:11 38:2338:25 45:1752:17 56:9 72:1383:24 91:12129:21 134:4135:24 141:15175:14 175:16191:9 211:1215:25 220:5220:7 278:24302:7 302:7306:6
TSDs 250:24
TSP 218:23
tunnel 35:13 36:2
36:22 128:18147:25 150:8153:4 153:15153:17 153:19155:5 155:9
turbine 89:21
turbulence 71:9
71:12 72:1 92:1694:15 101:23150:22 153:20153:22 162:1164:2 172:14
turn 6:22 23:14
55:20 113:15198:8 222:24239:7
turned 102:8
130:14
Turner 56:8
Turning 289:13
turnout 10:5
turns 71:11
107:15 110:21
tweaking 265:5
278:13
twenty 136:25
twice 95:14
128:23 198:25198:25 255:19269:15 315:8
two-minute
60:17 61:5 84:1691:22
two-thirds 38:7
Tyler 23:21 23:23
24:3 24:829:20 30:10 80:6144:11 186:5201:20 208:3208:14 215:21221:3 223:8241:12 241:22241:23 261:2272:10
Tyler's 193:18
type 29:1 38:13
39:8 98:22 114:2178:10 188:20209:8 209:21216:14 217:13237:13 240:20254:12 267:16
types 22:11 39:20
95:2 98:23 142:3176:24 185:24191:24 192:16194:5 194:12196:12 201:9209:9 216:15217:10 217:13218:3 218:14223:22 223:23226:3 226:6226:13 235:16237:19 245:25246:13 268:5268:15
typical 50:20

10TH CONFERENCE OF AIR QUALITY MODELS 03/13/2012 CCR#16766-1 447
107:17 169:22169:23
typical...you
103:7
typically 5:2
46:2 94:2095:4 95:8 168:18169:1 170:10170:23 196:16201:1 275:25279:21 315:17315:25
U
U.S 3:1 18:2
72:17 159:3184:2 198:21201:5 282:22288:20 293:15294:19 298:22
UARG 157:12
UCAR 300:25
ultimately 20:5
22:13 29:1142:17 150:5174:15 208:12223:24 236:16308:7
umpteenth 216:23
unaware 263:21
unbiased 161:1
247:10
UNC 302:19
uncertainties
96:22 215:8
uncertainty
140:25 269:5
underestimate
108:16 116:4
underestimated
162:12 162:13
underestimates
115:21
under-estimates
245:16
underlying 49:15
underneath 152:16
underpin 39:19
under-predict
161:5
Under-
predicting
160:23
underscore 307:18
underscored 322:3
understand 8:8
8:9 9:3 9:421:24 44:950:8 52:25 53:24107:16 138:20144:8 168:4225:16 229:7244:4 271:5283:22 285:18297:12
understanding
5:10 8:16 18:1217:22 232:6261:8 273:18276:10
understood 142:19
231:6
undertaken 92:7
unenviable 276:5
unfortunate
100:24 268:13
unfortunately
305:21 306:17310:4
unharvested 96:11
Unidata 300:25
uniform 231:9
292:9 292:11
uniformly 68:14
unihomogenous
142:10
uniquely 27:1
unit 51:5 201:6
United 35:2
144:21 159:16275:14 281:19284:1 311:15312:4
units 77:18
152:15 201:3
universe 272:14
303:10
University
284:6 317:6
Unix 300:3
unless 57:7 81:10
133:25 296:4
unlike 93:11
175:25 178:25
unload 177:6
unnecessarily
56:2
unobstructed
176:21
unpaired 89:19
unpaved 191:22
192:2 216:13
unreasonable
266:6
unreasonably
234:9
unreliable 97:4
98:3
unskilled 274:4
unstable 131:12

10TH CONFERENCE OF AIR QUALITY MODELS 03/13/2012 CCR#16766-1 448
154:15 164:25
up...it 122:10
upcoming 236:6
update 15:1
21:7 23:15 64:1570:23 74:6 74:1179:14 80:14 87:890:24 91:4 91:15104:23 117:6119:25 141:21199:22 207:5232:23 232:25238:11 239:1261:4 263:16265:2 295:21311:4
update...oh 92:1
updated 93:6
229:3 230:11234:13 238:13238:25 239:2295:17 295:18
updates 9:21 21:8
22:23 38:6 70:2472:10 212:6230:12 235:5235:10 237:24238:1 294:20310:13 318:9
updating 15:22
21:5 23:2199:4 227:21236:6
updraft 125:21
upgrade 164:16
upon 11:2 20:14
21:4 41:15 49:11158:13 181:9207:23 221:25278:12 281:3284:4 284:16284:18 285:5288:14 294:13
298:9 308:4308:16 310:6310:9 311:15316:3
upper 38:13 92:12
285:24 286:9310:8 310:12
U-PRIME 159:12
upwind 136:19
136:22 149:19149:23 151:16151:19 205:16
urban 26:15
71:8 71:1072:1 90:3 90:490:10 96:19100:3 103:5103:10 107:22109:18 120:18120:20 120:23120:25 121:25150:19 196:10212:11
urban...so 89:25
urge 210:2 262:10
urges 242:24
URS 224:6
usability 207:10
usage 276:12
use...keeping
126:1
useful 18:16
51:19 62:5 83:2593:13 102:9108:9 118:1153:25 210:17226:4
user 77:2 77:16
78:23 86:2392:17 95:18117:23 241:5
241:10 241:11274:15 274:18274:25 275:5275:16 275:24276:15 285:22300:8 306:16309:15 311:10
user-friendly
189:17
users 64:11 73:25
93:24 102:19103:22 189:11195:4 270:21
user's 94:1
282:24
Users 98:2
User's 90:16
104:25
USTAR 158:8
158:14 158:15159:8 159:13160:1 160:5160:6 160:13160:19 160:22160:22 160:24161:2 161:5163:24 165:2165:15 200:4
usually 68:20
82:5 85:23140:17 195:5196:16 252:18
utilities 278:23
utility 267:14
utilize 91:6
utilized 17:11
utilizing 121:3
V
vague 100:8
vain 86:8

10TH CONFERENCE OF AIR QUALITY MODELS 03/13/2012 CCR#16766-1 449
valid 57:14 85:20
87:16 87:24 88:6139:1 144:3199:11 246:9
validate 92:7
105:9 217:1250:17
validated 60:3
validation 136:20
222:10 222:12222:15 239:8243:12 243:22248:2 248:11249:4 251:3254:3 254:5258:2 259:3259:13 259:15293:5
validations
243:21
validity 250:10
valley 246:16
246:17 255:23307:1
valleys 220:16
valuable 18:16
211:2
valuation 254:5
value 11:15
34:7 47:847:14 47:17 61:572:7 72:778:12 78:15 96:9106:14 191:8196:11 197:7200:5 252:9253:12 254:22255:18
valued 89:18
values 47:6 50:13
51:2 51:13 89:2394:8 94:19
104:12 104:17107:7 116:15160:1 160:13160:14 160:15160:24 161:2169:1 189:5196:19 202:17227:16 232:4239:22 250:7252:10 252:15252:20 256:11256:17 257:9257:13 269:22274:16 285:11291:22 293:9303:7 321:22322:17
vane 135:21
vanilla 309:7
variable 57:13
57:16 58:25 59:959:22 59:2360:13 81:1381:21 81:23 82:4102:3 176:6176:11
variables 61:25
79:4 79:779:12 168:4225:1 299:24318:21
variation 118:7
variations 177:19
247:20
varied 169:16
169:17 169:20250:7 252:9252:21 257:7
varies 81:24
82:18
variety 26:5
35:15 37:14168:16 170:7
274:14 300:21
various 3:17
14:23 20:16162:25 189:9189:17 192:24195:25 235:14274:10 293:20
vary 98:22 259:21
varying 274:2
vegetation
96:10 216:15
vehicle 168:21
168:21 171:3171:3 172:5172:8 172:9172:18 173:11173:13 174:7190:9 191:14
velocities 154:15
317:15
velocity 158:8
159:23 317:15
vents 175:18
177:9 178:6
venue 7:10 202:11
209:21 227:6234:3
VERDI 299:1
302:16
verify 98:4
Vermont 88:23
versa 111:22
140:23
version 19:3 65:7
66:13 71:2474:16 74:2075:19 75:19 76:182:9 82:1193:4 93:495:15 104:21106:16 108:14

10TH CONFERENCE OF AIR QUALITY MODELS 03/13/2012 CCR#16766-1 450
109:2 110:9117:6 117:14194:3 198:23206:6 217:22229:4 229:9230:3 230:4230:4 230:11230:13 230:19232:21 238:12238:25 238:25241:8 241:12241:14 242:25260:1 260:2260:7 260:9260:15 260:15260:16 260:18260:18 260:21260:22 260:23261:7 261:9261:17 262:12264:2 264:6264:6 264:23284:24 285:2310:19 319:9319:9
versions 65:11
65:12 82:10143:3 143:4198:25 238:22
versus 41:2 57:12
57:21 58:1558:20 62:15 77:679:1 127:14135:3 136:21154:15 160:22160:22 288:25292:18
vertical 56:18
67:16 67:2070:15 169:10183:17 183:19317:14 317:15
very...I 84:1
very...produced
136:14
viable 138:8
144:10 262:13281:14 309:14
vice 111:22
140:23
vicinity 53:10
view 34:9
viewer 300:24
violate 78:14
violations
43:23 47:24187:2 187:3187:14 187:14
virtually 179:1
visibility 231:16
231:22 232:1237:6 242:13242:17 242:24
vision 15:13
15:16 15:1715:24 305:20306:2 311:9
visit 5:7
visitor 3:9
5:23 323:5
visits 14:22
VISTAS 229:6
289:10 312:15312:22
vis-that 261:8
visual 191:19
253:4 282:11
visualization
190:16 278:11278:17 278:24282:13 296:19298:7 298:18299:10 300:19301:5 301:16
302:4 302:16303:1 303:3303:10 306:9
visualize
300:11 301:7302:21
visualizing 301:2
302:19
Vlad 120:16
voice 45:9 243:10
volume 123:9
126:5 168:18168:19 168:22169:2 170:4170:5 170:12171:16 171:18171:19 172:1172:2 172:25173:4 173:6173:11 173:15173:19 181:25183:11 184:17184:23 190:1194:21 215:2274:8
volumes 172:24
192:16
W
wait 155:24
199:24
waiting 165:9
263:3
wake 67:17
67:20 68:568:7 125:1125:19 125:23150:22 152:17
walk 141:8
197:2 228:25314:12
WAQM 229:14

10TH CONFERENCE OF AIR QUALITY MODELS 03/13/2012 CCR#16766-1 451
warranted 323:2
Warringah
105:12 106:15112:20
was...let's 110:1
Washington 119:15
119:17
wasn't 26:17
34:23 34:24 50:554:5 55:22 120:9127:9 130:19170:8 171:17172:25 198:23218:25 248:19255:25 256:11263:5 266:15269:7
waste 146:10
152:8 200:17259:14
watch 4:10
water 177:11
285:1
wave 9:22
106:23 113:25317:7
waving 228:12
Wayland 6:24 6:25
7:3 234:17
ways 12:22 26:2
99:23 111:3142:24 172:2227:6 301:10
we...as 122:23
we...
determining
93:16
we...when 136:23
wear 191:14
191:14
weather 18:23
31:22 54:20 56:986:7 92:12171:10 276:1279:22 305:9306:19 307:10308:19 316:17316:23
web 144:16 323:8
webpage 41:20
webpages 42:2
website 41:18
82:14 97:2144:16 196:23197:12 197:18197:21 241:15241:20 241:20271:23 283:1294:6
we'd 214:23
241:24 258:16
Wednesday 13:24
14:2 146:11
week 74:22
week-long 30:1
weeks 166:11
week-to-week 27:8
weigh 181:7
weight 99:17
99:17 113:12113:18 181:2
weighted 94:2
94:8 104:15104:15 105:1162:7
weighting
104:14 158:12
weights 104:16
Weil 120:15
weird 91:9
welcome 3:5 3:5
6:4 6:10 7:1 7:610:9 14:18
we'll 49:9 145:16
149:1 149:2157:3 185:16210:19 211:22219:5 235:11236:9 236:10242:2 246:7246:10 263:22280:22 312:10
well...could
137:25
well...maybe
128:5
well-defined
175:23
well-received
196:22
we're 27:15 52:23
156:3 156:8165:8 166:13166:14 166:14166:20 167:11177:3 183:23185:25 188:7189:20 196:13197:9 198:13207:5 210:23211:1 211:10211:19 211:21212:22 216:18216:18 217:10218:20 218:24221:5 223:19224:14 226:18228:3 228:17228:19 229:1232:5 233:23235:12 237:14248:25 253:15255:20 261:13262:7 262:9

10TH CONFERENCE OF AIR QUALITY MODELS 03/13/2012 CCR#16766-1 452
263:13 263:22268:16 279:3288:22 291:21298:14 298:14302:7 302:7302:8 308:22309:4 311:14311:22 311:24312:14 323:3
were...it 129:10
were...you 97:24
West 230:17 233:4
312:2
western 312:3
wet 289:13 291:13
we've 38:8
73:11 145:19150:2 156:6166:7 175:16182:7 185:23197:8 197:23201:22 204:8216:9 216:20217:5 218:11222:21 223:12223:25 224:9227:4 237:19237:25 265:15265:16 268:1271:3 271:21272:14 274:22284:2 308:2309:4 309:17309:19 320:23
whatever 24:1
51:7 52:876:10 102:22118:14 150:15214:6 220:16222:17 223:1296:3 306:19307:7 318:17318:18 320:9
wheels 171:3
whenever 297:14
where...I 97:6
whereas 61:9
75:16 109:6163:4 280:11292:9 303:11318:10
whereby 279:20
WHEREUPON 80:10
145:14 323:11
wherever 40:6
77:22 144:18
whether 5:2 47:22
50:8 54:2565:5 95:20 101:7118:20 119:22126:23 127:24134:22 135:2137:8 143:11245:23 249:4250:9 252:18268:23 269:6295:1 298:1318:16 320:2
whining 313:19
whip 4:7
white 160:11
whoever 56:10
whole 3:10
24:16 25:437:8 53:3 61:762:23 63:176:9 77:12 82:2182:22 87:1088:13 91:10124:25 134:12150:15 151:23175:18 184:2203:22 239:11281:9 294:1
303:10 310:7
wholeheartedly
219:16
whose 9:20 199:18
wide 100:20
128:23 144:10200:13 209:8300:21
widely 66:7 225:1
wider 152:13
254:24
widespread
247:8 277:15
width 70:1 124:12
124:15 124:20126:2 126:4127:8 146:20169:4 169:12169:12 169:21169:22 169:23169:24 172:8172:8 172:9172:17 172:18172:20 172:22173:12
widths 95:19
169:2 169:3169:3 169:5169:11 173:10
wife 27:13
Wildlife 287:12
288:21 290:21
willing 67:5
214:23 214:23241:22
wind 35:13 36:1
36:22 56:1557:14 57:1457:15 59:1 60:1360:17 60:19 61:361:8 61:13 61:1562:15 62:15

10TH CONFERENCE OF AIR QUALITY MODELS 03/13/2012 CCR#16766-1 453
62:17 62:1962:23 63:5 63:1964:9 64:18 64:1864:20 73:12 74:180:19 81:9 81:2281:23 81:2381:24 81:25 82:182:4 82:5 82:683:5 83:5 83:783:8 83:883:12 83:1385:11 85:11 87:587:11 87:1187:12 87:1387:15 87:1687:20 88:1388:15 88:16 89:289:9 89:16 89:1790:22 91:2292:15 94:13 97:597:20 101:22101:22 102:5102:5 106:12107:8 107:11107:11 108:6111:10 111:10111:13 111:17111:18 111:20111:20 124:24124:24 125:3128:18 128:20130:17 130:21131:8 131:12131:12 135:9135:25 140:1140:3 140:8140:18 140:21143:17 147:25150:8 153:4153:12 153:14153:17 153:19153:22 154:17155:5 155:8157:8 157:14157:25 158:15158:18 158:22
158:24 159:15161:5 164:2165:16 182:9184:21 184:23200:3 200:19203:23 204:12210:6 214:8240:4 240:5240:7 240:22244:17 245:23246:15 246:19273:6 273:15274:24 277:11278:16 300:15309:1
wind...low 131:11
wind...no...yes
131:12
wind...that
121:22
wind...you 83:11
window 285:5
Windows 283:3
299:24 300:4300:6 301:6302:12
winds 57:14 58:25
58:25 60:1260:13 60:1361:10 61:2062:16 62:2362:25 64:12 81:481:5 81:13 81:2282:4 82:2084:9 84:13 84:1686:6 86:14 86:1687:3 87:6 87:987:17 87:2387:24 88:2 88:2089:7 91:10 91:2094:13 102:3106:8 106:14107:5 108:16111:7 113:11
115:14 136:12140:15 162:11163:14 171:11231:4 240:9244:12 244:22245:1 246:1246:3 246:13246:16 246:17247:21 248:24255:24 287:18299:15 319:16319:18 319:22321:21
winter 96:12
96:12
Wisconsin 197:10
wish 122:18
244:23 312:13
with...because
127:5
With...before
138:3
with...with 91:19
withhold 163:23
without...
before 96:15
witnessed 9:6
wondered 207:19
wonderful 11:18
wondering
135:23 221:9225:2 316:15
wondering...we
135:22
Wong 271:17
282:16
Wood 220:2 220:11
234:18
wording 252:12
work 9:18 9:20
10TH CONFERENCE OF AIR QUALITY MODELS 03/13/2012 CCR#16766-1 454
11:6 11:711:10 11:16 12:213:3 14:12 15:2015:21 17:3 17:1117:24 22:1 22:1727:19 28:129:9 30:2473:6 74:14 79:2179:25 80:2189:21 105:12113:23 123:12137:24 140:12146:15 146:23151:1 152:1152:11 155:19156:1 162:14168:11 172:16173:19 174:8174:12 174:14174:23 178:13178:25 179:1179:14 179:18179:19 184:15185:5 190:16193:17 198:10199:7 203:18204:2 204:18207:3 207:4208:1 208:15209:18 209:22209:23 210:6211:25 212:1212:4 215:13217:7 217:17219:10 221:10222:23 227:16230:5 230:10235:2 235:23240:16 242:4264:18 268:9283:10 284:4294:8 299:4299:14 312:16313:18 314:9317:5
worked 10:25 22:9
73:18 143:10148:19 148:25149:13 156:21164:6 199:14220:19 223:9227:16 229:22233:14 233:15
workgroup 166:5
166:10 166:12166:17 167:15174:19 174:21225:15 233:7239:22
working 10:17
10:19 13:1 16:1521:18 38:1 41:2446:12 77:2292:25 98:20107:1 113:24144:25 147:4198:13 198:22223:25 229:1229:6 230:22233:6 235:17237:23 238:8271:11 320:6
works 80:19 175:8
204:17 213:17221:4 284:23301:6
works...
recommends 106:7
workshop 18:13
18:14 25:2329:20 30:1 51:2352:21 166:25185:25 211:24227:3 227:11
workshops 22:10
world 7:18 35:2
45:17 186:1187:21 189:11189:15 193:20194:9 195:5
222:5 229:21
worried 180:2
218:23
worry 87:2 178:16
178:19 243:2
worse 60:14 99:23
111:3 265:11266:1 294:3303:22
worsen 187:2
187:14
worth 125:23
139:13 203:3278:21 278:24284:8
would...in 135:20
W-PRIME 159:12
WRAP 312:2
WRF 19:10
282:18 283:11283:19 284:8285:5 285:10311:15 311:16311:18 321:4321:7 321:10321:12
WRFed 294:18
write 30:3 56:8
221:22 259:15274:19
writing 83:23
274:13
written 26:10
32:10 44:3188:17 274:4274:13
wrong 52:14 75:25
106:5 289:21309:20
wrote 81:1 112:21

10TH CONFERENCE OF AIR QUALITY MODELS 03/13/2012 CCR#16766-1 455
X
x-axis 160:5
162:25
XY 76:7
XYZ 286:15
Y
y-axis 160:5
year's 7:13 18:12
143:5
years...that
110:3
yellow 89:24
190:17
Yes...so 124:6
yesterday 10:1
208:19
yet 6:5 61:16
68:21 69:13 87:8118:5 123:12124:20 125:17136:6 139:13144:25 237:17241:21 243:8244:25 322:5
yield 23:24
37:7 38:1839:3 271:6
yielded 8:13 54:6
you...if 111:15
134:8
you'll 179:8
197:4 227:18259:15 275:6283:22 285:17287:24 289:4291:7 293:17303:19 317:4
young 228:8
yours 175:4
314:14
yourself 133:4
you've 9:23 34:19
146:1 156:15156:18 156:21172:19 190:20191:17 193:1198:25 203:19271:22 271:22293:21 300:19322:1
Z
Zee 106:13
117:7 139:22
zero 87:9 87:18
87:18 88:1588:15 129:3131:25 158:19160:9 160:9169:9 169:18179:11 251:16251:18 251:19252:24 253:1253:18 256:4
Zimmer 220:20
zone 69:20 128:10
zones 316:2 316:7
zoom 96:16 98:11