us equity market correlation to yields/funding currencies · pulled the opposite ... in how the...
TRANSCRIPT

Page 1 of 8
For Personal Use Only—Do Not Forward
BespokePremium.com © Copyright 2015, Bespoke Investment Group, LLC. Bespoke Investment Group, LLC believes all information contained in this report to be accurate, but we do not guarantee its accuracy. None of the information in this report or any opinions expressed constitutes a solicitation of the purchase or sale of any securities or commodities.
Recent market price action has
started to depart noticeably from
the pattern we’ve been accus-
tomed to recently. For instance,
despite the recent “funding cur-
rency” behavior for risk assets
that has seen the EURUSD cross
sell off on rallies in global equity
indices, today EURUSD declined
sharply in tandem with equities,
as shown in the chart at right.
We’ve also seen bonds go from
positively correlated to equities
throughout August and early
September to a resumption of
their more familiar trend of in-
verse correlation to stocks, again
charted.
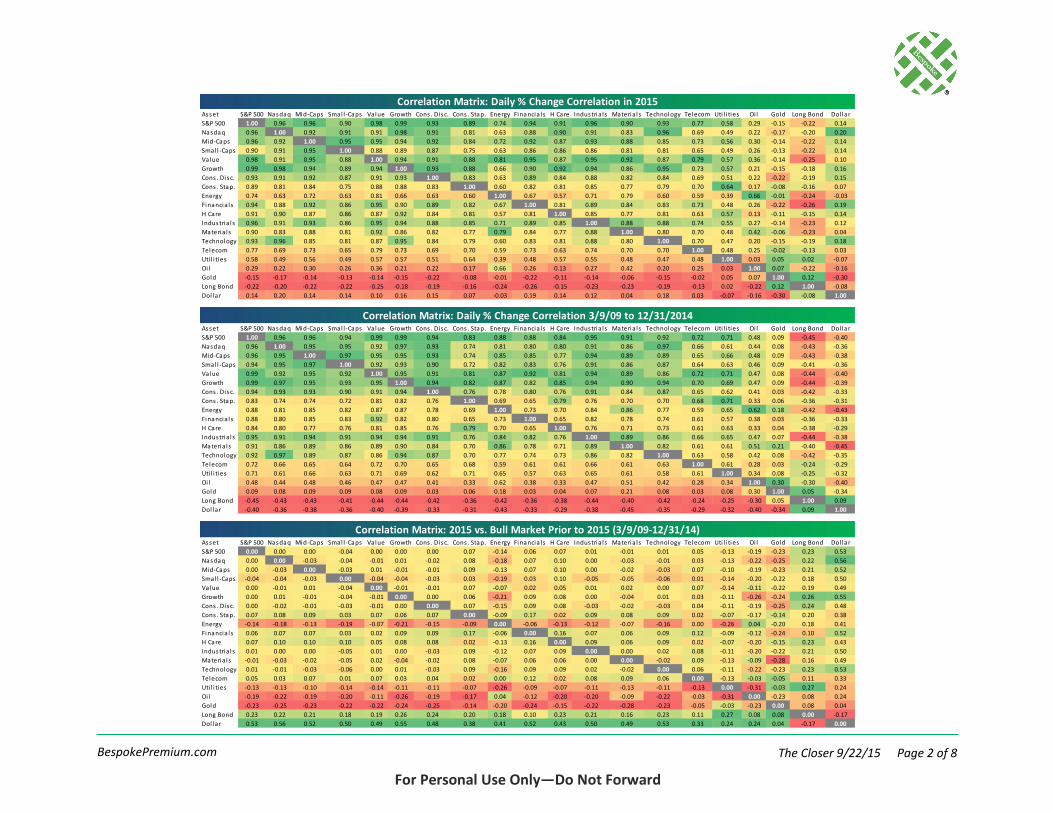
To get a handle on how some of
these different correlation chang-
es are playing out in the grander
scheme of things, on the follow-
ing page we’ve created three
matrices. The first two matrices
measure the daily price correla-
tion of 20 different assets and indices with each other. The first matrix shows the correlations between
each since the start of 2015. The second shows these correlations from the start of the bull market
through the end of 2014. Finally, in the third matrix we show the difference between the two, to high-
light where correlations are shifting. In the third matrix, lower readings indicate drops in correlation in
2015 versus the bull market, while higher readings indicate increases in correlation.
For most of the bull market, the USD was negatively correlated with stock indices of various types.
Since then, though, it has shifted to become positively correlated with the market. Commodities have
pulled the opposite move: after being relatively correlated with stocks for most of the bull run, they
are now sharply negatively correlated. Energy as a sector has broadly followed this move given its beta
to oil. We also think it’s interesting that bonds are becoming less and less negatively correlated to eq-
uities.
Overall, these matrices and the recent shift in how the equity market tracks EURUSD or the long bond
are a very good lesson that correlations are never stable in financial markets; while they can last for
long periods of time, the prices of different assets will never perfectly track one another indefinitely.
Pattern Breaks US Equity Market Correlation to Yields/Funding Currencies
1.110
1.115
1.120
1.125
1.130
1.135
1.140
1.145
1.150
1,900
1,920
1,940
1,960
1,980
2,000
2,020S&P 500 Futures (Left Axis)
EURUSD (Right Axis)
2.800
2.850
2.900
2.950
3.000
3.050
3.100
3.150
1,900
1,920
1,940
1,960
1,980
2,000
2,020S&P 500 Futures (Left Axis)
30 Year Yield (Right Axis)
Page 2 of 8 The Closer 9/22/15 BespokePremium.com
For Personal Use Only—Do Not Forward
Asset S&P 500 Nasdaq Mid-Caps Smal l -Caps Value Growth Cons . Disc. Cons . Stap. Energy Financia ls H Care Industria ls Materia ls Technology Telecom Uti l i ties Oi l Gold Long Bond Dol lar
S&P 500 1.00 0.96 0.96 0.90 0.98 0.99 0.93 0.89 0.74 0.94 0.91 0.96 0.90 0.93 0.77 0.58 0.29 -0.15 -0.22 0.14
Nasdaq 0.96 1.00 0.92 0.91 0.91 0.98 0.91 0.81 0.63 0.88 0.90 0.91 0.83 0.96 0.69 0.49 0.22 -0.17 -0.20 0.20
Mid-Caps 0.96 0.92 1.00 0.95 0.95 0.94 0.92 0.84 0.72 0.92 0.87 0.93 0.88 0.85 0.73 0.56 0.30 -0.14 -0.22 0.14
Smal l -Caps 0.90 0.91 0.95 1.00 0.88 0.89 0.87 0.75 0.63 0.86 0.86 0.86 0.81 0.81 0.65 0.49 0.26 -0.13 -0.22 0.14
Value 0.98 0.91 0.95 0.88 1.00 0.94 0.91 0.88 0.81 0.95 0.87 0.95 0.92 0.87 0.79 0.57 0.36 -0.14 -0.25 0.10
Growth 0.99 0.98 0.94 0.89 0.94 1.00 0.93 0.88 0.66 0.90 0.92 0.94 0.86 0.95 0.73 0.57 0.21 -0.15 -0.18 0.16
Cons . Disc. 0.93 0.91 0.92 0.87 0.91 0.93 1.00 0.83 0.63 0.89 0.84 0.88 0.82 0.84 0.69 0.51 0.22 -0.22 -0.19 0.15
Cons . Stap. 0.89 0.81 0.84 0.75 0.88 0.88 0.83 1.00 0.60 0.82 0.81 0.85 0.77 0.79 0.70 0.64 0.17 -0.08 -0.16 0.07
Energy 0.74 0.63 0.72 0.63 0.81 0.66 0.63 0.60 1.00 0.67 0.57 0.71 0.79 0.60 0.59 0.39 0.66 -0.01 -0.24 -0.03
Financia ls 0.94 0.88 0.92 0.86 0.95 0.90 0.89 0.82 0.67 1.00 0.81 0.89 0.84 0.83 0.73 0.48 0.26 -0.22 -0.26 0.19
H Care 0.91 0.90 0.87 0.86 0.87 0.92 0.84 0.81 0.57 0.81 1.00 0.85 0.77 0.81 0.63 0.57 0.13 -0.11 -0.15 0.14
Industria ls 0.96 0.91 0.93 0.86 0.95 0.94 0.88 0.85 0.71 0.89 0.85 1.00 0.88 0.88 0.74 0.55 0.27 -0.14 -0.23 0.12
Materia ls 0.90 0.83 0.88 0.81 0.92 0.86 0.82 0.77 0.79 0.84 0.77 0.88 1.00 0.80 0.70 0.48 0.42 -0.06 -0.23 0.04
Technology 0.93 0.96 0.85 0.81 0.87 0.95 0.84 0.79 0.60 0.83 0.81 0.88 0.80 1.00 0.70 0.47 0.20 -0.15 -0.19 0.18
Telecom 0.77 0.69 0.73 0.65 0.79 0.73 0.69 0.70 0.59 0.73 0.63 0.74 0.70 0.70 1.00 0.48 0.25 -0.02 -0.13 0.03
Uti l i ties 0.58 0.49 0.56 0.49 0.57 0.57 0.51 0.64 0.39 0.48 0.57 0.55 0.48 0.47 0.48 1.00 0.03 0.05 0.02 -0.07
Oi l 0.29 0.22 0.30 0.26 0.36 0.21 0.22 0.17 0.66 0.26 0.13 0.27 0.42 0.20 0.25 0.03 1.00 0.07 -0.22 -0.16
Gold -0.15 -0.17 -0.14 -0.13 -0.14 -0.15 -0.22 -0.08 -0.01 -0.22 -0.11 -0.14 -0.06 -0.15 -0.02 0.05 0.07 1.00 0.12 -0.30
Long Bond -0.22 -0.20 -0.22 -0.22 -0.25 -0.18 -0.19 -0.16 -0.24 -0.26 -0.15 -0.23 -0.23 -0.19 -0.13 0.02 -0.22 0.12 1.00 -0.08
Dol lar 0.14 0.20 0.14 0.14 0.10 0.16 0.15 0.07 -0.03 0.19 0.14 0.12 0.04 0.18 0.03 -0.07 -0.16 -0.30 -0.08 1.00
Asset S&P 500 Nasdaq Mid-Caps Smal l -Caps Value Growth Cons . Disc. Cons . Stap. Energy Financia ls H Care Industria ls Materia ls Technology Telecom Uti l i ties Oi l Gold Long Bond Dol lar
S&P 500 1.00 0.96 0.96 0.94 0.99 0.99 0.94 0.83 0.88 0.88 0.84 0.95 0.91 0.92 0.72 0.71 0.48 0.09 -0.45 -0.40
Nasdaq 0.96 1.00 0.95 0.95 0.92 0.97 0.93 0.74 0.81 0.80 0.80 0.91 0.86 0.97 0.66 0.61 0.44 0.08 -0.43 -0.36
Mid-Caps 0.96 0.95 1.00 0.97 0.95 0.95 0.93 0.74 0.85 0.85 0.77 0.94 0.89 0.89 0.65 0.66 0.48 0.09 -0.43 -0.38
Smal l -Caps 0.94 0.95 0.97 1.00 0.92 0.93 0.90 0.72 0.82 0.83 0.76 0.91 0.86 0.87 0.64 0.63 0.46 0.09 -0.41 -0.36
Value 0.99 0.92 0.95 0.92 1.00 0.95 0.91 0.81 0.87 0.92 0.81 0.94 0.89 0.86 0.72 0.71 0.47 0.08 -0.44 -0.40
Growth 0.99 0.97 0.95 0.93 0.95 1.00 0.94 0.82 0.87 0.82 0.85 0.94 0.90 0.94 0.70 0.69 0.47 0.09 -0.44 -0.39
Cons . Disc. 0.94 0.93 0.93 0.90 0.91 0.94 1.00 0.76 0.78 0.80 0.76 0.91 0.84 0.87 0.65 0.62 0.41 0.03 -0.42 -0.33
Cons . Stap. 0.83 0.74 0.74 0.72 0.81 0.82 0.76 1.00 0.69 0.65 0.79 0.76 0.70 0.70 0.68 0.71 0.33 0.06 -0.36 -0.31
Energy 0.88 0.81 0.85 0.82 0.87 0.87 0.78 0.69 1.00 0.73 0.70 0.84 0.86 0.77 0.59 0.65 0.62 0.18 -0.42 -0.43
Financia ls 0.88 0.80 0.85 0.83 0.92 0.82 0.80 0.65 0.73 1.00 0.65 0.82 0.78 0.74 0.61 0.57 0.38 0.03 -0.36 -0.33
H Care 0.84 0.80 0.77 0.76 0.81 0.85 0.76 0.79 0.70 0.65 1.00 0.76 0.71 0.73 0.61 0.63 0.33 0.04 -0.38 -0.29
Industria ls 0.95 0.91 0.94 0.91 0.94 0.94 0.91 0.76 0.84 0.82 0.76 1.00 0.89 0.86 0.66 0.65 0.47 0.07 -0.44 -0.38
Materia ls 0.91 0.86 0.89 0.86 0.89 0.90 0.84 0.70 0.86 0.78 0.71 0.89 1.00 0.82 0.61 0.61 0.51 0.21 -0.40 -0.45
Technology 0.92 0.97 0.89 0.87 0.86 0.94 0.87 0.70 0.77 0.74 0.73 0.86 0.82 1.00 0.63 0.58 0.42 0.08 -0.42 -0.35
Telecom 0.72 0.66 0.65 0.64 0.72 0.70 0.65 0.68 0.59 0.61 0.61 0.66 0.61 0.63 1.00 0.61 0.28 0.03 -0.24 -0.29
Uti l i ties 0.71 0.61 0.66 0.63 0.71 0.69 0.62 0.71 0.65 0.57 0.63 0.65 0.61 0.58 0.61 1.00 0.34 0.08 -0.25 -0.32
Oi l 0.48 0.44 0.48 0.46 0.47 0.47 0.41 0.33 0.62 0.38 0.33 0.47 0.51 0.42 0.28 0.34 1.00 0.30 -0.30 -0.40
Gold 0.09 0.08 0.09 0.09 0.08 0.09 0.03 0.06 0.18 0.03 0.04 0.07 0.21 0.08 0.03 0.08 0.30 1.00 0.05 -0.34
Long Bond -0.45 -0.43 -0.43 -0.41 -0.44 -0.44 -0.42 -0.36 -0.42 -0.36 -0.38 -0.44 -0.40 -0.42 -0.24 -0.25 -0.30 0.05 1.00 0.09
Dol lar -0.40 -0.36 -0.38 -0.36 -0.40 -0.39 -0.33 -0.31 -0.43 -0.33 -0.29 -0.38 -0.45 -0.35 -0.29 -0.32 -0.40 -0.34 0.09 1.00
Asset S&P 500 Nasdaq Mid-Caps Smal l -Caps Value Growth Cons . Disc. Cons . Stap. Energy Financia ls H Care Industria ls Materia ls Technology Telecom Uti l i ties Oi l Gold Long Bond Dol lar
S&P 500 0.00 0.00 0.00 -0.04 0.00 0.00 0.00 0.07 -0.14 0.06 0.07 0.01 -0.01 0.01 0.05 -0.13 -0.19 -0.23 0.23 0.53
Nasdaq 0.00 0.00 -0.03 -0.04 -0.01 0.01 -0.02 0.08 -0.18 0.07 0.10 0.00 -0.03 -0.01 0.03 -0.13 -0.22 -0.25 0.22 0.56
Mid-Caps 0.00 -0.03 0.00 -0.03 0.01 -0.01 -0.01 0.09 -0.13 0.07 0.10 0.00 -0.02 -0.03 0.07 -0.10 -0.19 -0.23 0.21 0.52
Smal l -Caps -0.04 -0.04 -0.03 0.00 -0.04 -0.04 -0.03 0.03 -0.19 0.03 0.10 -0.05 -0.05 -0.06 0.01 -0.14 -0.20 -0.22 0.18 0.50
Value 0.00 -0.01 0.01 -0.04 0.00 -0.01 -0.01 0.07 -0.07 0.02 0.05 0.01 0.02 0.00 0.07 -0.14 -0.11 -0.22 0.19 0.49
Growth 0.00 0.01 -0.01 -0.04 -0.01 0.00 0.00 0.06 -0.21 0.09 0.08 0.00 -0.04 0.01 0.03 -0.11 -0.26 -0.24 0.26 0.55
Cons . Disc. 0.00 -0.02 -0.01 -0.03 -0.01 0.00 0.00 0.07 -0.15 0.09 0.08 -0.03 -0.02 -0.03 0.04 -0.11 -0.19 -0.25 0.24 0.48
Cons . Stap. 0.07 0.08 0.09 0.03 0.07 0.06 0.07 0.00 -0.09 0.17 0.02 0.09 0.08 0.09 0.02 -0.07 -0.17 -0.14 0.20 0.38
Energy -0.14 -0.18 -0.13 -0.19 -0.07 -0.21 -0.15 -0.09 0.00 -0.06 -0.13 -0.12 -0.07 -0.16 0.00 -0.26 0.04 -0.20 0.18 0.41
Financia ls 0.06 0.07 0.07 0.03 0.02 0.09 0.09 0.17 -0.06 0.00 0.16 0.07 0.06 0.09 0.12 -0.09 -0.12 -0.24 0.10 0.52
H Care 0.07 0.10 0.10 0.10 0.05 0.08 0.08 0.02 -0.13 0.16 0.00 0.09 0.06 0.09 0.02 -0.07 -0.20 -0.15 0.23 0.43
Industria ls 0.01 0.00 0.00 -0.05 0.01 0.00 -0.03 0.09 -0.12 0.07 0.09 0.00 0.00 0.02 0.08 -0.11 -0.20 -0.22 0.21 0.50
Materia ls -0.01 -0.03 -0.02 -0.05 0.02 -0.04 -0.02 0.08 -0.07 0.06 0.06 0.00 0.00 -0.02 0.09 -0.13 -0.09 -0.28 0.16 0.49
Technology 0.01 -0.01 -0.03 -0.06 0.00 0.01 -0.03 0.09 -0.16 0.09 0.09 0.02 -0.02 0.00 0.06 -0.11 -0.22 -0.23 0.23 0.53
Telecom 0.05 0.03 0.07 0.01 0.07 0.03 0.04 0.02 0.00 0.12 0.02 0.08 0.09 0.06 0.00 -0.13 -0.03 -0.05 0.11 0.33
Uti l i ties -0.13 -0.13 -0.10 -0.14 -0.14 -0.11 -0.11 -0.07 -0.26 -0.09 -0.07 -0.11 -0.13 -0.11 -0.13 0.00 -0.31 -0.03 0.27 0.24
Oi l -0.19 -0.22 -0.19 -0.20 -0.11 -0.26 -0.19 -0.17 0.04 -0.12 -0.20 -0.20 -0.09 -0.22 -0.03 -0.31 0.00 -0.23 0.08 0.24
Gold -0.23 -0.25 -0.23 -0.22 -0.22 -0.24 -0.25 -0.14 -0.20 -0.24 -0.15 -0.22 -0.28 -0.23 -0.05 -0.03 -0.23 0.00 0.08 0.04
Long Bond 0.23 0.22 0.21 0.18 0.19 0.26 0.24 0.20 0.18 0.10 0.23 0.21 0.16 0.23 0.11 0.27 0.08 0.08 0.00 -0.17
Dol lar 0.53 0.56 0.52 0.50 0.49 0.55 0.48 0.38 0.41 0.52 0.43 0.50 0.49 0.53 0.33 0.24 0.24 0.04 -0.17 0.00
Correlation Matrix: Daily % Change Correlation in 2015
Correlation Matrix: Daily % Change Correlation 3/9/09 to 12/31/2014
Correlation Matrix: 2015 vs. Bull Market Prior to 2015 (3/9/09-12/31/14)

Page 3 of 8 The Closer 9/22/15 BespokePremium.com
For Personal Use Only—Do Not Forward
The Richmond Fed Services Index disap-
pointed significantly in its release today,
with several major indicators dropping
to multi-month lows in a huge decline
from up-beat readings in August. We
think the Services index is much more
important than its more frequently-
quoted Manufacturing cousin, which
also missed today. That’s because we
have few readings on the health of the
vast majority of American businesses—
services providers–and many, many
readings on the much less significant
manufacturing sector. As shown at left,
huge declines MoM for Services Reve-
nues and employment point to negative
readings from the ISM Non-
Manufacturing survey. In the case of
revenues, the upward trend is still very
much intact, but as shown in the em-
ployment chart, that reading is making
lower lows and lower highs since the
middle of 2014.
Broadly speaking, consumer incomes
remain high, along with employment.
Regardless of whether consumers will
spend savings from energy price de-
clines, the reality is that the typical con-
sumer has much more flexibility and
room to keep spending stable right now
than at previous points in the current
expansion or the last one. We covered
that to close The Bespoke Report last
week (please see page 31).
Richmond Fed Services Decline Sharply From Local Highs
0.0
0.5
1.0
1.5
2.0
2.5
3.0
3.5
2000
2001
2002
2003
2004
2005
2006
2007
2008
2009
2010
2011
2012
2013
2014
2015
Current Prices (3m Avg)
Expected Prices (3m Avg)
Core CPI
10
20
30
40
50
60
70
80
90
2000
2001
2002
2003
2004
2005
2006
2007
2008
2009
2010
2011
2012
2013
2014
2015
Revenues (Rebased to 50 scale)
ISM Non-Manufacturing Activity
15
25
35
45
55
65
75
2000
2001
2002
2003
2004
2005
2006
2007
2008
2009
2010
2011
2012
2013
2014
2015
Number of Employees (Rebased to 50)
ISM Non-Manufacturing (Employment)
1.32
1.64
60
64
5655
1.80

Page 4 of 8 The Closer 9/22/15 BespokePremium.com
For Personal Use Only—Do Not Forward
Looking at the like-for-like comparison
of the Services index to its Manufactur-
ing counterpart, we continue to see ro-
bust outperformance of Services versus
comparable Manufacturing indicators.
While there was a huge drop in Revenue
MoM, the uptrend visible at right re-
mains in place, which we can’t say for
the Manufacturing New Orders Series.
There’s a similar story for Employment,
with the Services industry seeing a back-
and-forth range of employment growth
versus a consistently weak and deterio-
rating employment picture. We would
note that Employment and Wages were
without doubt the two strongest areas
for the Manufacturing survey, sug-
gesting that the labor market continues
to outperform growth. Employment
indicators are also robust for Services,
where the outlook is still strong as well.
Overall, only one subindex registered
contraction (retailing employment).
All Services Sept Change Aug July June
Revenues 10 -20 30 32 19
Employees 5 -13 18 12 10
Wages 20 -6 26 25 21
Exp. Demand 24 -8 32 30 25
Retailers Sept Change Aug July June
Sales 16 -28 44 35 15
Employees -19 -24 5 10 -19
Wages 30 0 30 20 27
Inventories 35 23 12 15 8
Big Ticket 20 19 1 19 -2
Shoppers 39 -15 54 48 16
Exp. Demand 33 -12 45 27 11
Ex Retail Sept Change Aug July June
Revenues 10 -18 28 32 19
Employees 8 -12 20 12 15
Wages 19 -7 26 26 19
Exp. Demand 23 -8 31 31 27
Prices Sept Change Aug July June
Services 1.18 -0.35 1.53 1.26 1.36
Retail 1.25 -0.73 1.98 1.48 1.32
Non-Retail 1.17 -0.32 1.49 1.23 1.36
Exp. Prices Sept Change Aug July June
Services 1.65 -0.20 1.85 1.42 1.69
Retail 2.01 -0.23 2.24 1.32 1.65
Non-Retail 1.60 -0.21 1.81 1.44 1.70
Richmond Fed Services Sector Survey
Services "Catches Down" To Manufacturing; Still Stronger
-60
-50
-40
-30
-20
-10
0
10
20
30
40
2000
2001
2002
2003
2004
2005
2006
2007
2008
2009
2010
2011
2012
2013
2014
2015
Reveneus (Services)
New Orders (Manufacturing)
-40
-30
-20
-10
0
10
20
30
2000
2001
2002
2003
2004
2005
2006
2007
2008
2009
2010
2011
2012
2013
2014
2015
Number of Employees (Services)
Number of Employees (Manufacturing)
-20
-10
0
10
20
30
40
2000
2001
2002
2003
2004
2005
2006
2007
2008
2009
2010
2011
2012
2013
2014
2015
Wages (Services) Wages (Manufacturing)
-12
10
15
20
15

Page 5 of 8 The Closer 9/22/15 BespokePremium.com
For Personal Use Only—Do Not Forward
It’ll be a busy session overnight. We have a Fed speaker this evening, followed by China Flash Manufac-
turing for the month of September. While we don’t think this number is necessarily the best way to
view the Chinese economy given the relatively robust services/non-industrial data recently, markets
will be focused very, very closely on the figure. It’s also viewed as relatively reliable given the non-
official (read: less manipulated) nature of the data, and it's very close to “real time” versus other much
more lagging indicators. If there’s a big miss of expectations, expect a sharp correction in stocks and
higher-beta (growth– and commodity-oriented) FX, and a rally in Treasuries. Other data overnight in-
cludes insights on European growth from their Markit PMIs and revised French GDP. Tomorrow in the
US we get ECB chief Mario Draghi speaking right before the open of stocks; watch for hints at expan-
sion or lengthening of ECB QE given the higher EUR recently and the overall sideways move in Europe-
an data over the last few months. A small miss and sequential decline in Eurozone Consumer Confi-
dence this morning is a good example of the less impressive improvement relative to the beginning of
the year. Later in the US, we get flash Manufacturing PMI, which should be weak if regional Fed indices
so far (Empire, Philly, Richmond) are any indication.
Price action today was brutal, with copper off 3.5% . WTI had a grim day but rallied following the equi-
ty market close based on an inventory drawdown number from the API survey of oil inventories ahead
of official data tomorrow courtesy of the DoE. Bonds got back most of their losses from yesterday as
the yield curve bull-flattened, while the dollar was up versus every currency except USDJPY. USDMXN
soared, up 1.6% amidst reserve declines at the Bank of Mexico. Within the US equity market, every
sector was lower including a 2.9% decline in Autos & Parts in sympathy with the pain felt across the
Atlantic. Breadth was horrible, with over 93% of the S&P 500 lower on the day.
Time Release Period Estimate Reading Last
9:00 FHFA House Price Index Jul +0.4% +0.6% +0.2%
10:00 EZ Consumer Confidence (Flash) Sep -7.0 -7.1 -6.9
10:00 Richmond Fed Manufacturing Index Sep 2 -5 0
10:00 Richmond Fed Services Index Sep -- -- --
13:00 2 Year Note Auction ($26 billion): mixed auction results
16:30 API US Crude Oil Inventories (mm bbls) 22-Sep -- -3.68 -3.13
18:30 Atlanta Fed President Lockhart (voter) speaks on the economy
20:00 Australia Conf. Board Leading Indicatos Jul -- -- -0.2%
21:45 China Caixin Manf. PMI (Flash) Sep 47.5 -- 47.3
2:45 France GDP QoQ (Final) Q2 0.0% -- 0.0%
3:00 France Markit Manf. PMI (Flash) Sep 48.6 -- 48.3
3:00 France Markit Svcs. PMI (Flash) Sep 51.0 -- 50.6
3:30 Germany Markit Manf. PMI (Flash) Sep 52.6 -- 53.3
3:30 Germany Markit Svcs. PMI (Flash) Sep 54.5 -- 54.9
4:00 EZ Markit Manf. PMI (Flash) Sep 52.0 -- 52.3
4:00 EZ Markit Svcs. PMI (Flash) Sep 54.2 -- 54.4
7:00 MBA Mortgage Applications WoW 18-Sep -- -- -7.0%
8:30 Canada Retail Sales MoM Jul +0.7% -- +0.6%
8:30 Canada Retail Sales Ex Auto MoM Jul +0.5% -- +0.8%
9:00 ECB President Draghi Quarterly Hearing
9:35 Markit US Manufacturing PMI (Flash) Sep 52.8 -- 53.0
10:30 DoE US Crude Oil Inventories (mm barrels) 18-Sep -1162.5 -- -2104
11:30 2 Year Floating Rate Note Auction ($13 billion)
12:30 Atlanta Fed President Lockhart (voter) speaks on the economy
13:00 5 Year Note Auction ($35 billion)
US Data Recap and Overnight Preview

Page 6 of 8 The Closer 9/22/15 BespokePremium.com
For Personal Use Only—Do Not Forward
Popular Tweets From @bespokeinvest on Twitter
“German DAX on pace for a new short-term closing low. ” - 9:17
“Energy shares rallying here for the time being. $XLE ” - 9:58
“$XLE quickly approaching flat on the day, plenty of Energy stocks in the green. ” - 10:05
“75 stocks in the S&P 500 have hit 52-week lows following the decline on 8/24. ” - 16:12
Closing Charts & Tweets
Oil Future: Last 15 Trading Days Gold Front Month Future: Last 15 Trading Days
US Dollar Index: Last 15 Trading Days Long Bond Future Intraday: Last 15 Trading Days
S&P 500 Intraday: Last 15 Trading Days Nasdaq Composite: Last 15 Trading Days
42
43
44
45
46
47
48
49
9/1 9/3 9/8 9/10 9/14 9/16 9/18 9/22
94.0
94.5
95.0
95.5
96.0
96.5
97.0
9/2 9/4 9/8 9/10 9/14 9/16 9/18 9/22
151.0
152.0
153.0
154.0
155.0
156.0
157.0
9/1 9/3 9/8 9/10 9/14 9/16 9/18 9/22
1890
1910
1930
1950
1970
1990
2010
2030
9/1 9/3 9/8 9/10 9/14 9/16 9/18 9/22
4600
4650
4700
4750
4800
4850
4900
4950
5000
9/1 9/3 9/8 9/10 9/14 9/16 9/18 9/22
1090
1100
1110
1120
1130
1140
1150
9/1 9/3 9/8 9/10 9/14 9/16 9/18 9/22
Ticker Name Change Last 6 MosSPY S&P 500 -1.30IJH S&P 400 -1.34IJR S&P 600 -1.37DIA Dow 30 -1.15QQQ Nasdaq -1.50IWB Russel l 1000 -1.28IWM Russel l 2000 -1.52XLF Financia ls -1.27XLB Materia ls -1.86XLE Energy -1.06XLI Industria ls -1.45XLY Cons . Cycl ica l -1.33XLP Cons . Staples -1.09XLV Health Care -0.61IYZ Telecom -1.05XLK Technology -1.68XLU Uti l i ties -1.25GDX Gold Miners -4.57XME Metals & Mining -4.48XRT Reta i l -1.25XHB Homebui lders -1.97IYR US Real Estate -1.32KRE Regional Banks -0.86IWD Russel l 1000 Value -1.29IWF Russel l 1000 Growth -1.34VXX VIX 5.64AGG Total Bond Mkt 0.24TLT 20+ Yr Treasuries 1.39MUB Muni . Bonds 0.28LQD Invest. Gr. Bonds 0.43JNK High Yield Bonds -0.65BKLN Senior Loan -0.39GLD Gold -0.68SLV Si lver -2.42USO Oi l -0.86UNG Natura l Gas -0.33VT Tota l World -1.73CWI World Ex-US -2.43VEA Developed Mkts -2.35EEM Emerging Mkts -1.87EZU Eurozone -3.12DXJ Japan JPY Hdg'd -1.95EWZ Brazi l -2.71FXI China -1.74EWT Taiwan -2.20EWH Hong Kong -1.06EWW Mexico -1.86
Key ETFs (1 Day % Change)
ATML 12.72 MNK -10.18 ATML 826.98 SZMK -83.54
UNT 7.93 ZEUS -9.55 FOR 398.12 OMG -79.48
BBG 7.65 NEOG -9.30 MNK 218.02 SWI -79.26
MTRX 7.40 NRG -8.57 ANIP 199.70 RYAM -78.37
WRLD 5.84 SUPN -7.73 AEIS 180.91 CYT -76.86
CENTA 5.06 LCI -6.83 NEOG 175.41 KOPN -76.38
UFCS 4.83 VDSI -6.49 THO 138.67 NATI -76.02
DV 4.79 ENTA -6.41 AFFX 133.96 RAX -75.49
FOR 4.67 AVP -6.11 HUB/B 130.64 CTRE -75.40
SGY 4.32 BIIB -5.91 FSP 117.68 ASTE -75.40
SBRA 4.27 IO -5.60 LDR 117.32 VIAV -74.76
OFG 4.27 BLD -5.50 NRG 112.70 PCP -74.75
CC 4.22 AKS -5.34 HRC 104.96 VRTV -74.59
ANIP 4.11 LL -5.15 BWA 95.98 NPBC -74.33
ALK 4.04 VRTX -5.11 APOG 95.76 ESE -73.68
Most Down
Price (%)
S&P 1500 Biggest MoversVolume vs Historical Avg (%)
Most Up Most Down Most Up
The Tale of The Tape: 30 Year Treasury Yield (Left Axis) vs Front Month Copper (Right Axis)
228.50
229.00
229.50
230.00
230.50
231.00
1,928
1,933
1,938
1,943
1,94830 Year Treasury Yield (Left Axis)
Front Month Copper (Right Axis)

Page 7 of 8 The Closer 9/22/15 BespokePremium.com
For Personal Use Only—Do Not Forward
Sentiment Indicator vs Historical One Week Two Weeks One Month
CBOE Call Volume 1.3 ## -1.2 0.08 -0.11 -0.12
NYSE Up vs Total Volume (%) 46.5 ## -0.6 0.21 0.12 -0.13
Nasdaq Up vs Total Volume (%) 48.7 ## -0.3 0.13 0.12 0.37
Index vs Equity PC Ratio 0.9 ## 1.0 0.31 0.29 0.03
VIX 50-Day ROC (%) 61.4 ## 1.6 -0.61 -0.13 0.12
VIX 10-Day ROC (%) -9.9 ## -0.6 0.07 0.34 0.18
Investors Intelligence Bullish (%) 26.8 ## -2.7 0.59 1.18 2.08
Investors Intelligence Bearish (%) 26.8 ## 0.1 0.10 0.40 0.94
Inv Intell. Bull Bear Spread 0.0 ## -1.5 0.10 -0.90 -1.84
AAII Bullish (%) 33.3 ## -0.7 0.03 -0.15 -0.14
AAII Bearish (%) 29.1 ## -0.4 0.11 0.12 0.08
AAII Bull Bear Spread 4.1 ## -0.2 0.02 0.49 0.21
Overall Sentiment ## -0.4 0.10 0.12 0.10
Technical
S&P 500 10-Day Avg. Spread (%) -1.1 ## -0.6 0.35 0.46 0.28
S&P 500 50-Day Avg. Spread (%) -3.5 ## -1.0 0.20 0.15 0.04
S&P 500 200-Day Avg. Spread (%) -6.0 ## -0.9 0.20 0.32 0.70
S&P 500 Monthly ROC (%) 4.0 ## 0.8 0.08 0.11 0.20
S&P 500 Weekly ROC (%) -1.8 ## -0.8 0.31 0.37 0.22
S&P 500 Quarterly ROC 1 (%) -7.9 ## -1.2 -0.22 -0.66 -1.26
Group 10-Day A/D Line 8.0 ## 0.0 -0.02 -0.03 -0.19
Group 50-Day A/D Line -60.0 ## -1.1 0.64 0.82 1.55
S&P 500 10-Day A/D Line -280.0 ## -0.5 0.23 0.11 0.06
S&P 500 50-Day A/D Line -1204.0 ## -1.1 0.44 0.52 1.25
NYSE TRIN Index 1.3 ## 0.5 0.07 0.29 0.58
Overall Technical ## -0.5 0.20 0.29 0.22
Fundamental/Monetary
Corporate Spreads (10-Day ROC) -1.0 ## -0.1 0.26 0.20 0.55
Corporate Spreads (50-Day ROC) 18.0 ## 0.4 0.07 0.17 0.20
High Yield Spreads (10-Day ROC) 13.0 ## 0.3 0.07 0.01 0.47
High Yield Spreads (50-Day ROC) 84.0 ## 0.6 0.22 0.34 0.48
S&P 500 P/S Ratio 1.7 ## 1.1 -0.06 -0.36 -1.16
S&P 500 P/E Ratio 17.2 ## -0.1 0.37 0.33 0.24
S&P 500 P/B Ratio 2.9 ## 0.7 0.21 0.25 0.59
Yield Curve (50-Day ROC) -0.5 ## 0.0 -0.03 -0.04 -0.08
Yield Curve (10-Day ROC) -1.9 ## -0.1 0.05 0.18 0.54
Overall Fundamental ## 0.3 0.07 0.18 0.47
Bottom Line ## -0.3 0.10 0.17 0.20 Average S&P 500 Performance (All Days) 0.10 0.19 0.38
Average S&P 500 Performance (%)Current Level
Direction
Bespoke Market Timing Model: 9/22/15
Neutral Bearish Bullish

Page 8 of 8 The Closer 9/22/15 BespokePremium.com
For Personal Use Only—Do Not Forward
Sentiment Indicator vs Historical One Week Two Weeks One Month
CBOE Call Volume 1.7 0.6 0.6 0.13 -0.22 -0.44
Overall Sentiment 0.3 0.3 0.14 0.16 0.28
Bottom Line 0.3 0.3 0.12 0.21 0.27
Average S&P 500 Performance (All Days) 0.12 0.24 0.50
Current Level Average S&P 500 Performance (%)
Direction
The Bespoke Market Timing Model is a compilation of some widely (and not so widely) followed market indicators. While
most investors have one or two indicators they rely on, we all recognize that no indicator by itself is correct all of the time.
With this in mind, we set out to create a series of indicators from multiple disciplines in order to see what the 'crowd' of
indicators are telling us. Just as no individual is bigger than the market, we contend that no single indicator is more accurate
at forecasting the market than the sum of them all. What follows below is an explanation of the various fields in our report.
Indicator: Current level of the given indicator. In this example, CBOE call volume is 1.7 times CBOE put volume.
Direction: Change in the indicator (positive or negative) over the last week. In this example, calls relative to puts have
increased during the last week.
vs Historical: This field measures the distance in standard deviations that the indicator is currently at versus its average
over the last five years. In the above example, the volume of calls relative to puts is 0.6 standard deviations above its histori-
cal average.
Indicator: Current level of the given indicator. In this example, CBOE call volume is 1.7 times CBOE put volume.
Average S&P 500 Performance: This field displays the average performance of the S&P 500 following previously occasions
when the indicator was at similar levels to the present. Values highlighted in green indicate the two indicators for that
group which are predicting the biggest gains, while indicators highlighted in red highlight the indicators which are signaling
the most negative returns going forward.
Overall Scores: Averages all the indicators for a given category. In the example above, overall sentiment is 0.3 standard
deviations from its long-term average. At similar levels in the past, the S&P 500 has gone up an average of 0.14% over the
next week, 0.16% over the next two weeks, and 0.28% over the next month.
Bottom Line: This line shows the average of all the indicators in the study. In the example above, the aggregate level of
all the indicators is currently 0.3 standard deviations above the historical average, and based on prior experiences, the S&P
500 has gone up an average of 0.12% in the next week, 0.21% in the next two weeks, and 0.27% in the next month. Values
highlighted in red indicate returns that underperform the S&P 500 over the entire period covered (regardless of the indica-
tor level), while green highlights indicate that they outperformed the overall average S&P 500 performance.
Average S&P 500 Performance (All Days): This line measures the average historical performance of the S&P 500 over all
periods for one week, two week, and one month time frames. These levels are then compared to the average level the
indicators are predicting.in the next two weeks, and 0.27% in the next month. Values highlighted in red indicate returns
that underperform the S&P 500 over the entire period covered (regardless of the indicator level), while green highlights
indicate that they outperformed the overall average S&P 500 performance.