us esg minimum variance index nr - ossiam.eu · 1 us esg minimum variance index nr rebalancing...
TRANSCRIPT

1
US ESG Minimum Variance Index NRRebalancing Report - 22-Oct-2018
Stock Statistics
The US ESG Minimum Variance Index NR rebalances eachthird Friday of the month. The new composition is imple-mented at the opening of the next business day after the thirdFriday - usually the next Monday. The weights are computedusing closing prices four days prior to the third Friday. Boththe US ESG Minimum Variance Index NR and the benchmarkSolactive US Large Cap Index NR are computed in USD. Thecalculations in the document are performed by Ossiam usingSolactive, Sustanalytics and Datastream sources.The number of constituents in the index decreased from 86to 85. The Turnover is 41.48%, higher than its historicalmean at 39.37%. The weight of the Index Core Portfolio isstable.
Characteristics 22-Oct-2018Number of Stocks 85Added Stocks 14Deleted Stocks 15Core Number 71Old weight of Core 91.11%New weight of Core 92.13%Turnover 41.48%Historical Turnover 39.37%
Added and deleted stocks are relative to 22-Oct-2018. The Core is defined as the subsetof stocks that belong to the current as wellas the previous composition.
Volatility/Weight profile
The chart on the right shows the dis-tribution of the new US ESG MinimumVariance Index NR composition on 22-Oct-2018 in terms of annualized volatility(x-axis) and weight (y-axis). Volatilitycomputed over 125 days ending on 15-Oct-2018. On the upper left corner wefind low volatile stocks with big weight inthe index. On the lower right corner wefind high volatile stocks with low weightin the index. These stocks usually enterthe index for diversification purposes. Wedistinguish between Core index and addedstocks to appreciate how these newlyadded stock are positioned in terms ofvolatility and weight.
FOR PROFESSIONAL CLIENTS USE ONLY

2
Stock ESG Statistics
The table on the right gives an overview of the ESGcharacteristics of the US ESG Minimum Variance Index NR(STRAT) with respect to the Solactive US Large Cap IndexNR (BENCH).
The ESG score for US ESG Minimum Variance IndexNR is 61.54, higher than the ESG score of Solactive USLarge Cap Index NR at 58.11. The ESG score for US ESGMinimum Variance Index NR on 22-Oct-2018 is also in linewith the previous ESG score on 24-Sep-2018: 61.54 versus61.46.
STRAT BENCHCurrent ESG Score 61.54 58.11Previous ESG Score 61.46 57.99Weight Controversy 5 - 2.70%Weight Controversial Weapons - 2.70%Weight Non-Compliant - 3.06%
ESG scores are computed with weights as of 22-Oct-2018.Previous ESG scores are computed with weights as of 24-Sep-2018. The ESG score is computed as the weighted sum of ESGscores. Stocks excluded for normative reasons are assignedzero score.
Below the list of stocks excluded for ESG criteria or Missing ESG data:
Name Sector WW Vol Comment
APERGY CORP Energy 0.01% 42.45% Missing ESG DataBLACKROCK INC Financials 0.21% 20.59% Contr. Weapon.BOEING CO/THE Industrials 0.85% 23.33% Contr. Weapon.FREEPORT-MCMORAN INC Materials 0.08% 40.50% Contr.,Compl.GARRETT MOTION INC C.Discretionary 0.00% 29.65% Missing ESG DataGENERAL DYNAMICS Industrials 0.21% 18.16% Contr. Weapon.HONEYWELL INTERNATIONAL INC Industrials 0.50% 15.55% Contr. Weapon.JOHNSON & JOHNSON HealthCare 1.55% 14.71% Contr.,Compl.LOCKHEED MARTIN CORP Industrials 0.34% 20.55% Contr. Weapon.NORTHROP GRUMMAN CORP Industrials 0.23% 23.64% Contr. Weapon.PERSPECTA INC IT 0.02% 29.80% Missing ESG DataQURATE RETAIL INC C.Discretionary 0.04% 27.17% Missing ESG DataRAYTHEON B Industrials 0.24% 19.55% Contr. Weapon.ROCKWELL COLLINS INC Industrials 0.10% 9.81% Contr. Weapon.T ROWE PRICE GROUP INC Financials 0.10% 21.79% Contr. Weapon.TEXTRON INC Industrials 0.07% 15.86% Contr. Weapon.WELLS FARGO & CO Financials 1.01% 18.31% Contr.,Compl.
FOR PROFESSIONAL CLIENTS USE ONLY
3
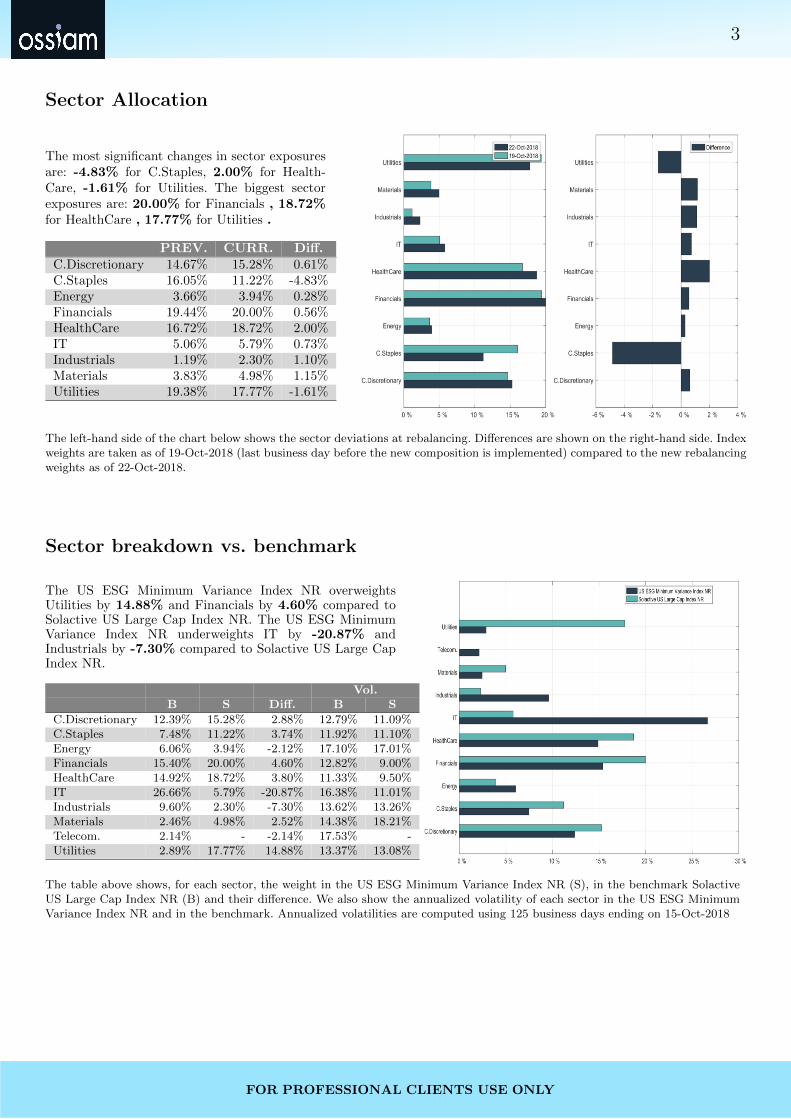
Sector Allocation
The most significant changes in sector exposuresare: -4.83% for C.Staples, 2.00% for Health-Care, -1.61% for Utilities. The biggest sectorexposures are: 20.00% for Financials , 18.72%for HealthCare , 17.77% for Utilities .
PREV. CURR. Diff.C.Discretionary 14.67% 15.28% 0.61%C.Staples 16.05% 11.22% -4.83%Energy 3.66% 3.94% 0.28%Financials 19.44% 20.00% 0.56%HealthCare 16.72% 18.72% 2.00%IT 5.06% 5.79% 0.73%Industrials 1.19% 2.30% 1.10%Materials 3.83% 4.98% 1.15%Utilities 19.38% 17.77% -1.61%
The left-hand side of the chart below shows the sector deviations at rebalancing. Differences are shown on the right-hand side. Indexweights are taken as of 19-Oct-2018 (last business day before the new composition is implemented) compared to the new rebalancingweights as of 22-Oct-2018.
Sector breakdown vs. benchmark
The US ESG Minimum Variance Index NR overweightsUtilities by 14.88% and Financials by 4.60% compared toSolactive US Large Cap Index NR. The US ESG MinimumVariance Index NR underweights IT by -20.87% andIndustrials by -7.30% compared to Solactive US Large CapIndex NR.
Vol.B S Diff. B S
C.Discretionary 12.39% 15.28% 2.88% 12.79% 11.09%C.Staples 7.48% 11.22% 3.74% 11.92% 11.10%Energy 6.06% 3.94% -2.12% 17.10% 17.01%Financials 15.40% 20.00% 4.60% 12.82% 9.00%HealthCare 14.92% 18.72% 3.80% 11.33% 9.50%IT 26.66% 5.79% -20.87% 16.38% 11.01%Industrials 9.60% 2.30% -7.30% 13.62% 13.26%Materials 2.46% 4.98% 2.52% 14.38% 18.21%Telecom. 2.14% - -2.14% 17.53% -Utilities 2.89% 17.77% 14.88% 13.37% 13.08%
The table above shows, for each sector, the weight in the US ESG Minimum Variance Index NR (S), in the benchmark SolactiveUS Large Cap Index NR (B) and their difference. We also show the annualized volatility of each sector in the US ESG MinimumVariance Index NR and in the benchmark. Annualized volatilities are computed using 125 business days ending on 15-Oct-2018
FOR PROFESSIONAL CLIENTS USE ONLY

4
ESG Allocation
The most significant changes in ESG bucketexposures are: 2.46% for bucket 50-55, -2.40%for bucket 65-70. The biggest ESG bucket ex-posures are: 30.89% for 55-60 bucket, 20.06%for 60-65 bucket.
PREV. CURR. Diff.50-55 16.73% 19.19% 2.46%55-60 31.86% 30.89% -0.97%60-65 20.94% 20.06% -0.88%65-70 19.08% 16.68% -2.40%70+ 11.40% 13.19% 1.79%
The left-hand side of the chart below shows the ESG deviations at rebalancing. Differences are shown on the right-hand side. Indexweights are taken as of 19-Oct-2018 (last business day before the new composition is implemented) compared to the new rebalancingweights as of 22-Oct-2018.
ESG breakdown vs. benchmark
The US ESG Minimum Variance Index NR overweights55-60 by 16.54% and 50-55 by 8.73% compared toSolactive US Large Cap Index NR. The US ESG MinimumVariance Index NR underweights 45-50 by -7.21% andContr./Weap./Compl. by -5.75% compared to Solactive USLarge Cap Index NR.
Vol.B S Diff. B S
40-45 4.83% - -4.83% 19.90% -45-50 7.21% - -7.21% 11.74% -50-55 10.46% 19.19% 8.73% 12.14% 8.89%55-60 14.35% 30.89% 16.54% 9.97% 7.80%60-65 23.03% 20.06% -2.97% 11.21% 8.04%65-70 16.59% 16.68% 0.09% 10.15% 8.41%70+ 17.74% 13.19% -4.55% 14.06% 10.54%Contr./Weap./Compl. 5.75% - -5.75% 12.63% -NoCoverage 0.03% - -0.03% 22.05% -
The table above shows, for each ESG bucket, the weight in the US ESG Minimum Variance Index NR (S), in the benchmarkSolactive US Large Cap Index NR (B) and their difference. We also show the annualized volatility of each ESG bucket in the USESG Minimum Variance Index NR and in the benchmark. Annualized volatilities are computed using 125 business days ending on15-Oct-2018
FOR PROFESSIONAL CLIENTS USE ONLY

5Added Stocks
The rebalancing has added 14 new stocks. In the table below, T is the current rebalancing date (22-Oct-2018), while T-1 is the previous rebalancing date (24-Sep-2018). Vol(T-1)and Vol(T) are the annualized volatilities computed over 125 business days ending, respectively, on 15-Oct-2018 and 17-Sep-2018. The average daily volumes ADV(T-1) andADV(T), expressed in mln USD, are computed over 50 business days ending on the same dates as before, with the relative ranking over the benchmark Solactive US Large CapIndex NR. WW(T) is the stock weight at the current rebalancing date. Finally, the column Reason Excl. details the reasons of exclusion at the previous rebalancing.
Vol ADVName Sector ESG WW(T) T-1 T T-1 T Reason Exclusion
ALBEMARLE CORP Materials 60-65 0.03% 27.58% 24.96% 141.06(233) 151.19(216) Excl. Minimum VarianceEXPRESS SCRIPTS HOLDING CO HealthCare 50-55 0.51% 25.60% 23.92% 360.61(74) 404.15(67) Excl. Minimum VarianceGOLDMAN SACHS GROUP INC Financials 65-70 0.79% 19.25% 16.73% 644.85(29) 613.11(37) Excl. Minimum VarianceHERSHEY CO/THE C.Staples 65-70 0.06% 20.96% 19.84% 114.47(268) 101.59(293) Excl. Minimum VarianceHILTON WORLDWIDE HOLDINGS INC C.Discretionary 65-70 1.07% 19.10% 16.58% 233.77(133) 255.30(122) Excl. Minimum VarianceHORMEL FOODS CORP C.Staples 60-65 0.25% 19.65% 17.85% 97.17(292) 101.52(294) Excl. Minimum VarianceIHS MARKIT LTD Industrials 60-65 0.22% 15.61% 16.44% 66.58(338) 81.32(323) Excl. LiquidityINTL BUSINESS MACHINES CORP IT 70+ 1.38% 19.72% 15.07% 588.40(37) 622.55(36) Excl. Minimum VarianceREGIONS FINANCIAL CORP Financials 50-55 0.36% 23.83% 20.66% 200.42(164) 196.28(173) Excl. Minimum VarianceREPUBLIC SERVICES INC Industrials 55-60 0.49% 14.92% 13.63% 98.23(290) 88.42(312) Excl. Minimum VarianceSCHLUMBERGER LTD Energy 65-70 0.01% 21.84% 19.88% 426.15(61) 468.58(57) Excl. Minimum VarianceUNITED CONTINENTAL HOLDINGS Industrials 50-55 0.32% 27.10% 24.96% 275.19(108) 238.61(134) Excl. Minimum VarianceUS BANCORP Financials 55-60 0.93% 16.60% 13.80% 312.88(85) 306.38(95) Excl. Minimum VarianceWILLIAMS COS INC Energy 50-55 1.42% 19.65% 18.11% -Inf(480) 407.29(66) Excl. Best In Class
FO
RP
RO
FE
SS
ION
AL
CL
IEN
TS
US
EO
NLY

6Deleted Stocks
The rebalancing has deleted 15 new stocks. In the table below, T is the current rebalancing date (22-Oct-2018), while T-1 is the previous rebalancing date (24-Sep-2018). Vol(T-1)and Vol(T) are the annualized volatilities computed over 125 business days ending, respectively, on 15-Oct-2018 and 17-Sep-2018. The average daily volumes ADV(T-1) andADV(T), expressed in mln USD, are computed over 50 business days ending on the same dates as before, with the relative ranking over the benchmark Solactive US Large CapIndex NR. WW(T-1) is the stock weight at the previous rebalancing date. Finally, the column Reason Excl. details the reasons of exclusion at the current rebalancing.
Vol ADVName Sector ESG WW(T-1) T-1 T T-1 T Reason Exclusion
AKAMAI TECHNOLOGIES INC IT 60-65 0.38% 25.36% 25.26% 117.49(261) 111.34(272) Excl. Minimum VarianceCELGENE CORP HealthCare 55-60 0.08% 25.88% 25.32% 445.59(59) 391.71(73) Excl. Minimum VarianceCOGNIZANT TECHNOLOGY SOLUTI CL A IT 60-65 0.31% 21.49% 20.68% 247.90(123) 230.49(140) Excl. Minimum VarianceCONOCOPHILLIPS Energy 65-70 0.22% 26.17% 26.02% 375.04(69) 409.09(65) Excl. Minimum VarianceEDWARDS LIFESCIENCES CORP HealthCare 65-70 0.11% 23.75% 28.00% 166.67(199) 225.09(143) Excl. Minimum VarianceELI LILLY & CO HealthCare 55-60 0.55% 17.09% 17.75% 368.76(71) 420.11(63) Excl. Minimum VarianceEVERSOURCE ENERGY Utilities 70+ 1.17% 14.28% 15.08% 86.22(305) 77.86(327) Excl. LiquidityKEURIG DR PEPPER INC C.Staples 65-70 3.90% 24.56% 25.72% 111.31(275) 55.44(348) Excl. LiquidityKROGER CO C.Staples 60-65 0.33% 30.03% 31.28% 269.37(113) 287.47(105) Excl. Minimum VarianceOCCIDENTAL PETROLEUM CORP Energy 65-70 0.12% 21.97% 21.94% 348.35(77) 370.27(78) Excl. Minimum VarianceREGENCY CENTERS CORP Financials 50-55 0.53% 17.36% 17.28% 85.41(307) 79.83(325) Excl. LiquiditySTARBUCKS CORP C.Discretionary 65-70 0.07% 22.02% 22.19% 510.97(48) 529.10(48) Excl. Minimum VarianceTWITTER INC IT 50-55 0.53% 55.15% 50.69% 1035.78(15) 710.16(29) Excl. Minimum VarianceVULCAN MATERIALS CO Materials 50-55 0.50% 24.15% 23.56% 143.91(229) 126.84(253) Excl. Minimum VarianceWW GRAINGER INC Industrials 70+ 0.08% 28.47% 27.73% 226.23(137) 203.35(163) Excl. Minimum Variance
FO
RP
RO
FE
SS
ION
AL
CL
IEN
TS
US
EO
NLY

7Ranking Index Constituents - Top 25
The table shows the top 25 positions in the US ESG Minimum Variance Index NR as of 22-Oct-2018. The column WW indicates the weights in the US ESG Minimum VarianceIndex NR as of 22-Oct-2018. The column Vol gives the annualized volatility computed over 125 business days ending on 15-Oct-2018. We also provide the ranking of these volatilities(Rank Vol) relative to the Filtered Selection at the rebalancing date. The column Corr gives the average correlation of each stock relative to the rest of the filtered selection,computed over 500 business days ending on 15-Oct-2018. We also provide the ranking of these correlations (Rank Corr) relative to the Filtered Selection at the rebalancing date.The Rank Blend is computed as 66% Rank Vol + 34% Rank Corr. The lower the stock’s Rank Blend, the higher the likelihood that the stock will be overweighted in the Index.Finally, the column Core shows whether the stock was in the US ESG Minimum Variance Index NR already (YES) or it entered at this rebalancing (NO).
Sector ESG WW Vol Rank Vol Corr Rank Corr Rank Blend CoreAETNA INC HealthCare 55-60 4.50% 13.50% 6 14.79% 88 33 YESHUMANA INC HealthCare 55-60 4.07% 15.48% 41 14.63% 80 54 YESNEWMONT MINING CORP Materials 70+ 3.62% 23.80% 315 5.58% 6 209 YESARCHER-DANIELS-MIDLAND CO C.Staples 55-60 3.38% 13.82% 11 16.31% 130 51 YESBUNGE LTD C.Staples 55-60 3.31% 19.46% 178 9.20% 15 122 YESAMERICAN TOWER CORP Financials 50-55 3.27% 15.44% 40 13.79% 63 47 YESNEXTERA ENERGY INC Utilities 65-70 3.27% 14.21% 13 9.08% 14 13 YESTJX COMPANIES INC C.Discretionary 60-65 2.75% 15.94% 62 16.81% 145 90 YESFIRST REPUBLIC BANK Financials 50-55 2.71% 17.20% 101 21.96% 289 164 YESDUKE ENERGY CORP Utilities 60-65 2.38% 15.18% 33 8.14% 10 25 YESEXELON CORP Utilities 70+ 2.31% 14.16% 12 12.05% 39 21 YESTARGET CORP C.Discretionary 55-60 2.07% 21.12% 230 13.47% 58 171 YESBRISTOL-MYERS SQUIBB CO HealthCare 65-70 2.02% 19.25% 167 14.66% 83 138 YESAMERICAN ELECTRIC POWER Utilities 65-70 1.98% 15.82% 55 7.84% 8 39 YESVIACOM INC-CLASS B C.Discretionary 55-60 1.96% 27.10% 392 9.26% 17 264 YESCITRIX SYSTEMS INC IT 55-60 1.91% 15.28% 36 24.18% 353 143 YESMERCK & CO. INC. HealthCare 65-70 1.89% 15.84% 56 18.19% 178 97 YESEDISON INTERNATIONAL Utilities 60-65 1.84% 16.52% 80 10.59% 26 61 YESTWENTY-FIRST CENTURY FOX INC C.Discretionary 50-55 1.77% 20.23% 206 14.21% 72 160 YESCOLGATE-PALMOLIVE CO C.Staples 70+ 1.74% 16.51% 78 14.62% 78 78 YESMEDTRONIC PLC HealthCare 65-70 1.61% 16.47% 75 20.94% 257 136 YESMOTOROLA SOLUTIONS INC IT 70+ 1.51% 16.47% 76 22.40% 305 153 YESCOCA-COLA CO/THE C.Staples 55-60 1.50% 12.43% 3 21.45% 271 94 YESAFLAC INC Financials 55-60 1.48% 13.61% 7 24.57% 364 128 YESSIMON PROPERTY GROUP INC Financials 55-60 1.48% 16.84% 89 13.89% 65 80 YES
FO
RP
RO
FE
SS
ION
AL
CL
IEN
TS
US
EO
NLY
8
DISCLAIMERS
This document is of a commercial and not of a regulatory nature.
Ossiam, a subsidiary of Natixis Investment Managers, is a French asset manager authorized by the Autorite desMarches Financiers (Agreement No. GP-10000016). Although information contained herein is from sources believedto be reliable, Ossiam makes no representation or warranty regarding the accuracy of any information of which it isnot the source. The information presented in this document is based on market data at a given moment and maychange from time to time.
This material has been prepared solely for informational purposes only and it is not intended to be and should notbe considered as an offer, or a solicitation of an offer, or an invitation or a personal recommendation to buy or sellparticipating shares in any Ossiam Fund, or any security or financial instrument, or to participate in any investmentstrategy, directly or indirectly. It is intended for use only by those recipients to whom it is made directly available byOssiam. Ossiam will not treat recipients of this material as its clients by virtue of their receiving this material.
This material reflects the views and opinions of the individual authors at this date and in no way the official positionor advices of any kind of these authors or of Ossiam and thus does not engage the responsibility of Ossiam nor ofany of its officers or employees. Past performance is not a guide to future performance. Any opinions expressed hereinare statements of our judgment on this date and are subject to change without notice. Ossiam assume no fiduciaryresponsibility or liability for any consequences, financial or otherwise, arising from, an investment in any security orfinancial instrument described herein or in any other security, or from the implementation of any investment strategy.This information contained herein is not intended for distribution to, or use by, any person or entity in any country orjurisdiction where to do so would be contrary to law or regulation or which would subject Ossiam to any registrationrequirements in these jurisdictions.The risks associated with the Fund and the Index are detailed in the “General Risk Considerations’ section of theProspectus, available in English on www.ossiam.com. Investments decision should only be made on the basis of theProspectus. Investors should also be well informed about the main characteristics of the Index (number of stocks,sector and or country breakdown, past evolution...) in order to have an overview of the risks and opportunities relatedto an exposure to the Index.
The financial instrument is not sponsored, promoted, sold or supported in any other manner by Solactive AGnor does Solactive AG offer any express or implicit guarantee or assurance either with regard to the results of usingthe Index and/or Index trade mark or the Index Price at any time or in any other respect. The Index is calculatedand published by Solactive AG. Solactive AG uses its best efforts to ensure that the Index is calculated correctly.Irrespective of its obligations towards the Issuer, Solactive AG has no obligation to point out errors in the Index tothird parties including but not limited to investors and/or financial intermediaries of the financial instrument. Neitherpublication of the Index by Solactive AG nor the licensing of the Index or Index trade mark for the purpose of usein connection with the financial instrument constitutes a recommendation by Solactive AG to invest capital in saidfinancial instrument nor does it in any way represent an assurance or opinion of Solactive AG with regard to anyinvestment in this financial instrumentThis material may not be distributed, published, or reproduced, in whole or in part.
FOR PROFESSIONAL CLIENTS USE ONLY