us etf compass 24 october 2017 synthetic equity & … october 2017 us etf compass etf monthly...
TRANSCRIPT
24 October 2017
US ETF Compass
North America Synthetic Equity & Index Strategy
US ETF CompassDate24 October 2017
Deutsche BankMarkets Research
Inflows to Equity ETPs Led inSeptemberDM equities rallied, while EM equities and fixed income lagged in SeptemberAsset returns were mostly positive for Equities and slightly negative for FixedIncome and Commodities. Global equities were up by 1.88% during last month,mainly driven by US and Intl DM equities with returns of 2.44% and 2.36%,respectively; meanwhile, EM equities registered a weak performance (-0.04%).Fixed income (-0.57%) was mostly negative; however, HY Corporates (+0.60%)and Senior Loans (+0.39%), and Corp. Floater (+0.23%) were the best performersposting gains; while, Intl DM Debt (-1.87%) and US Treasury (-0.88%) exposureswere among the weak areas during September. Commodities registered gains of1.99%, driven by Energy (+4.56%) and Agriculture (+1.82%).
US ETP assets rise 2.5% driven by inflows of $36bn in SeptemberSeptember inflows were led by Equity, followed by Fixed Income and CommodityETPs, with the remaining asset classes receiving mixed weak flows. ETPsregistered $36.0bn in new cash, helping assets rise by 2.5% from one monthearlier, reaching a total of $3.15 trillion at the end of September. Equity, FixedIncome and Commodity ETPs attracted inflows of $22.7bn, $11.3bn, and $2.0bn,respectively.
Management fees continue to drop as issuers compete for market shareCompetition continues to drive ETF management fees lower as issuers competefor market share. Within equity ETFs, this has been particularly true forinternational exposures where the premium issuers can charge for market accessis eroding. For US-only exposure, investors have been willing to pay a premiumin 2017 for exposure to alternative benchmarks (eg. QQQ) and industry-focusedproducts. ETF providers announce more fee cuts, and consolidation across theindustry continues.
How Active Is Passive?… Less so now for US Equity ETFsDespite significant growth in smart beta and sector ETFs, aggregate AUMallocated by these products to S&P 500 stocks has become less active. We use theconcept of "active share" to measure the percentage of the portfolio that deviatesfrom the benchmark. For S&P 500 stocks, the active share of the ETF portfoliodropped from 9.5% post-Brexit to 7.8% at the end of September, suggesting thatinflows to benchmark-tracking dominated. The last time active share of the ETFportfolio was this low was at the equity market low in 2009.
Hallie Martin
Strategist
+1-212-250-7994
Srineel Jalagani, CFA
Strategist
+1-212-250-4509
Deutsche Bank Securities Inc.
Note to U.S. investors: US regulators have not approved most foreign listed stock index futures and options for USinvestors. Eligible investors may be able to get exposure through over-the-counter products. Deutsche Bank does andseeks to do business with companies covered in its research reports. Thus, investors should be aware that the firm mayhave a conflict of interest that could affect the objectivity of this report. Investors should consider this report as onlya single factor in making their investment decision. DISCLOSURES AND ANALYST CERTIFICATIONS ARE LOCATED INAPPENDIX 1.MCI (P) 083/04/2017.
Distributed on: 24/10/2017 10:03:09 GMT
0bed7b6cf11c
24 October 2017
US ETF Compass
Table Of Contents
ETF Monthly Insights ....................................................... 3DM equities rallied, while EM and Fixed Income lagged ............................... 3US ETP assets rise 2.5% driven by inflows of $36bn in September ............... 4Management Fees continue to drop as issuers compete for market sh .......... 5How Active Is Passive?… Less so now for US Equity ETFs ............................ 6
Asset Allocation Heatmaps .............................................. 8Global Multi Asset Allocator heatmaps .......................................................... 8US Equity Allocator heatmaps ..................................................................... 10International Equity Allocator heatmaps ...................................................... 12Cross Asset Correlations .............................................................................. 1412-Month Relative Performance Monitor ..................................................... 15
Business Intelligence ...................................................... 16New Listings ................................................................................................. 16Delistings ...................................................................................................... 20Trends in products launched in the last 12 months ..................................... 21Popular Product Segments: Smart Beta & Currency Hedged ....................... 22Average Performance by Products Type and Size (Equity) ........................... 23Total Expense Ratio X-Ray ............................................................................ 25
ETF Statistics .................................................................. 26Global ETF Assets and Provider Ranking ..................................................... 26US Historical ETF Trends .............................................................................. 27ETF Issuer and Index Provider league tables ................................................ 28Monthly Snapshot ........................................................................................ 30Top 15 ETFs (includes ETNs) ........................................................................ 36
Appendix A: ETN Snapshot ............................................ 37
Appendix B: ETF List ...................................................... 38
Appendix C: Definitions ................................................. 41ETP Universe Definitions .............................................................................. 41Management Style or Product Strategy Definitions ..................................... 41Product Type Definitions .............................................................................. 42
Page 2 Deutsche Bank Securities Inc.
24 October 2017
US ETF Compass
ETF Monthly InsightsDM equities rallied, while EM and Fixed Income lagged
Asset returns were mostly positive for Equities and slightly negative for FixedIncome and Commodities. Equities in US and Developed Markets saw renewedinterest under a supportive macro environment, while Emerging Market equitiesand Fixed Income registered a weak month. Global equities were up by 1.88%during last month, mainly driven by US and Intl DM equities with returns of2.44% and 2.36%, respectively; meanwhile, EM equities were weighed downby stronger USD and barely moved . Fixed income (-0.57%) was slightlynegative; with HY Corporates (+0.60%), Senior Loans (+0.39%), and Corp. Floater(+0.23%) being the outperformers; while, Intl DM Debt (-1.87%) and US Treasury(-0.88%) underperformed during September. Most major Central banks continueto favor reducing their policy support that has helped keep rates subdued.Commodities registered gains of 1.99%, driven by Oil (+8.31%) which benefittedfrom speculation of reduced supply . On the FX side, USD gained against mostmajor foreign currencies (UUP was up by 0.62%) during last month. Heightenedgeopolitical risk from North Korea and Catalonia independence vote appeared tohave added to USD demand but did not dull investor appetite for Equities.
Overall, September had matching inflows with positive returns and outflowswith negative performance. However, there were some significant exceptions inEurozone, Japan, Commodities, and Energy Cmdty classes, which experiencedgains despite outflows, and US Treasury Long which experienced losses despitestrong positive flows. Latin America (+7.2% of their assets) and BRIC (+3.1% ofassets) exposures led the equity asset class flows during last month. Broad USequities experienced almost flat flows (+0.8% of their assets) and positive returns(+2.44%); with a big contribution from US Small Cap equity returns of 6.30% andinflows of 2.0% of their assets. Outperformance of small-cap vs. large cap equitiesin US has tracked sentiment on Trump's tax reform agenda.
Long US Treasury ETFs recorded strong inflows of 22.7% of their AUM. Theseinflows were concentrated in the first half of September leading up to the FOMCrate decision, with almost no expectations for a rake hike. Nonetheless, with thefinal decision perceived as near-term hawkish, the inflow trend reversed in thelast week of the month as long end rates continued to rise. Market expectationsof one more rate hike by December jumped from 35% to 70% in September.
Within US equities, with volatility subsiding, performance and flows were positiveacross most sectors and industries during last month. Energy and Financials werethe top sectors by performance with gains of 10.18% and 5.13%, respectively;meanwhile, Cons. Staples and Telecom recorded weak returns of -0.72% and-0.49%, respectively. In terms of flows, Cons. Staples recorded inflows (+4.4% ofassets), followed by Materials (+4.1%) and Financials (+2.9%); while, Industrials(-2.9%), and Telecom (-2.1%) had the largest outflows. At the industry level,Energy Eq. & Serv. and Household Durables had strong inflows and performance.
In international equity markets, Chile and Russia ETFs received the strongestinflows over 9.0% of their assets during September, performance was alsopositive with a gain of 0.98% and 4.55%, respectively. Brazil was anotherhighlight among foreign countries with inflows (+7.2% of assets), and returns of4.22%. Meanwhile, performance and flows were positive in developed Europe
Deutsche Bank Securities Inc. Page 3
24 October 2017
US ETF Compass
with Germany, Ireland and Portugal registering returns over 5.0%. EM countryoutperformers were Egypt and Argentina that posted returns of 7.56% and 7.03%,respectively. On the other contrary, Turkey and Greece recorded monthly returnsof -9.58% and -7.89%, respectively. Spain and South Korea noticeably did notsuffer any big outflows.
In terms of correlation trends, correlation between US Equities and otherInternational Equities continued to be high in September.
US ETP assets rise 2.5% driven by inflows of $36bn inSeptember
September flows were led by Equity, followed by Fixed Income and CommodityETPs, with the remaining asset classes receiving mixed weak flows. ETPsregistered $36.0bn in new cash, helping assets rise by 2.5% from one monthearlier, reaching a total of $3.15 trillion at the end of September. Equity, FixedIncome and Commodity ETPs attracted inflows of $22.7bn, $11.3bn, and $2.0bn,respectively.
Among the most relevant inflow trends, we saw US, Intl DM ex-US, and Globalequities with $12.6bn, $4.3bn, and $1.2bn, respectively. Furthermore, on thefixed income space, US Treasury, Corporates, and Broad exposures recorded$4.3bn, $2.8bn, and $2.7bn in positive flows, respectively. On the outflowsside, Japan and Germany-focused ETPs posted negative flows of $0.7bn and$0.5bn, respectively. Beta, Smart Beta, and Active products experienced inflowsof $29.1bn, $6.0bn, and $1.3bn, respectively; while, Beta+ (leveraged and inverse)posted outflow by $0.4bn.
Within Equity Smart Beta products, Style and Low-Risk ETFs were the mostpopular categories in September, attracting $2.4bn and $0.8bn in fresh newcash, respectively; all the remaining categories received positive flows. CurrencyHedged ETFs registered outflows of $1.0bn, mainly dragged by ETPs offering FXhedged exposure to JPY (-$0.4bn) and the EUR (-$0.4bn) currencies. In termsof product types, Asset Allocation, Pseudo Futures, and Cash Management,received inflows by $16.3bn, $10.4bn, and $9.7bn, respectively; meanwhile,Leveraged & Inverse posted outflows of $0.42bn.
Total ETP turnover was $1.21 trillion last month, down -11% from the previousmonth. Furthermore, ETF turnover represented 22.5% of all cash equity traded inthe US during September, under its 12-month average of 24.2%.
Page 4 Deutsche Bank Securities Inc.
24 October 2017
US ETF Compass
Management Fees continue to drop as issuers compete formarket share
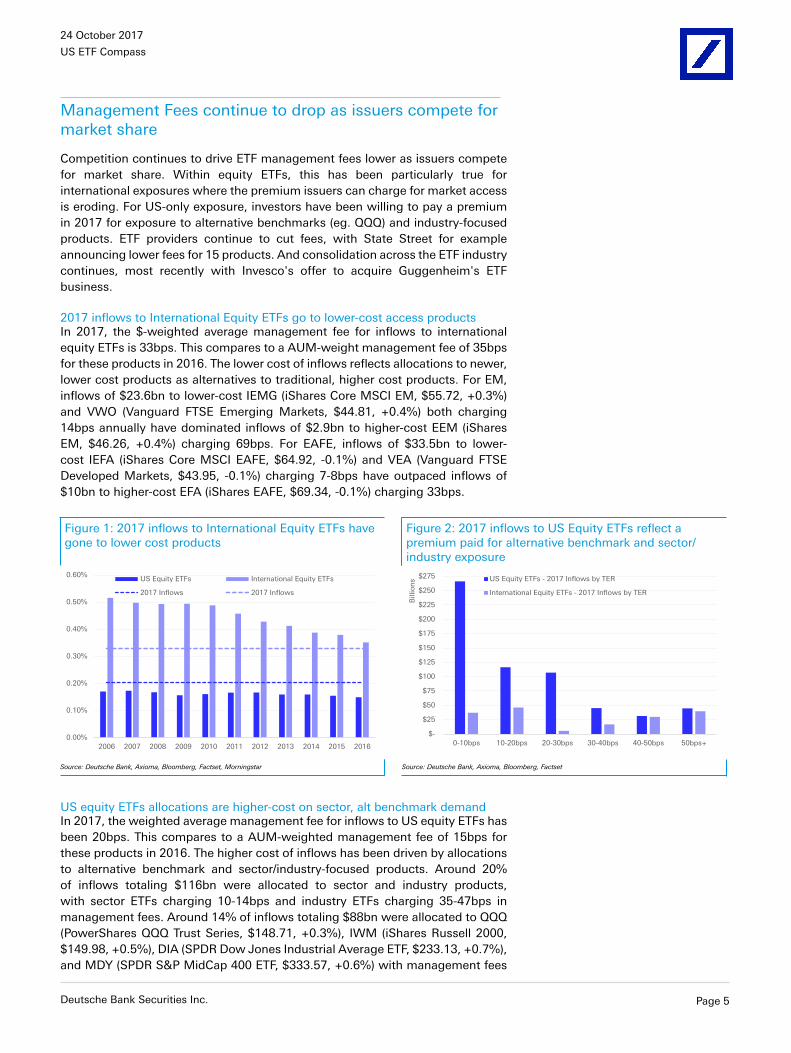
Competition continues to drive ETF management fees lower as issuers competefor market share. Within equity ETFs, this has been particularly true forinternational exposures where the premium issuers can charge for market accessis eroding. For US-only exposure, investors have been willing to pay a premiumin 2017 for exposure to alternative benchmarks (eg. QQQ) and industry-focusedproducts. ETF providers continue to cut fees, with State Street for exampleannouncing lower fees for 15 products. And consolidation across the ETF industrycontinues, most recently with Invesco's offer to acquire Guggenheim's ETFbusiness.
2017 inflows to International Equity ETFs go to lower-cost access productsIn 2017, the $-weighted average management fee for inflows to internationalequity ETFs is 33bps. This compares to a AUM-weight management fee of 35bpsfor these products in 2016. The lower cost of inflows reflects allocations to newer,lower cost products as alternatives to traditional, higher cost products. For EM,inflows of $23.6bn to lower-cost IEMG (iShares Core MSCI EM, $55.72, +0.3%)and VWO (Vanguard FTSE Emerging Markets, $44.81, +0.4%) both charging14bps annually have dominated inflows of $2.9bn to higher-cost EEM (iSharesEM, $46.26, +0.4%) charging 69bps. For EAFE, inflows of $33.5bn to lower-cost IEFA (iShares Core MSCI EAFE, $64.92, -0.1%) and VEA (Vanguard FTSEDeveloped Markets, $43.95, -0.1%) charging 7-8bps have outpaced inflows of$10bn to higher-cost EFA (iShares EAFE, $69.34, -0.1%) charging 33bps.
Figure 1: 2017 inflows to International Equity ETFs havegone to lower cost products
Figure 2: 2017 inflows to US Equity ETFs reflect apremium paid for alternative benchmark and sector/industry exposure
0.00%
0.10%
0.20%
0.30%
0.40%
0.50%
0.60%
2006 2007 2008 2009 2010 2011 2012 2013 2014 2015 2016
US Equity ETFs International Equity ETFs
2017 Inflows 2017 Inflows
$-
$25
$50
$75
$100
$125
$150
$175
$200
$225
$250
$275
0-10bps 10-20bps 20-30bps 30-40bps 40-50bps 50bps+
Billio
ns US Equity ETFs - 2017 Inflows by TER
International Equity ETFs - 2017 Inflows by TER
Source: Deutsche Bank, Axioma, Bloomberg, Factset, Morningstar Source: Deutsche Bank, Axioma, Bloomberg, Factset
US equity ETFs allocations are higher-cost on sector, alt benchmark demandIn 2017, the weighted average management fee for inflows to US equity ETFs hasbeen 20bps. This compares to a AUM-weighted management fee of 15bps forthese products in 2016. The higher cost of inflows has been driven by allocationsto alternative benchmark and sector/industry-focused products. Around 20%of inflows totaling $116bn were allocated to sector and industry products,with sector ETFs charging 10-14bps and industry ETFs charging 35-47bps inmanagement fees. Around 14% of inflows totaling $88bn were allocated to QQQ(PowerShares QQQ Trust Series, $148.71, +0.3%), IWM (iShares Russell 2000,$149.98, +0.5%), DIA (SPDR Dow Jones Industrial Average ETF, $233.13, +0.7%),and MDY (SPDR S&P MidCap 400 ETF, $333.57, +0.6%) with management fees
Deutsche Bank Securities Inc. Page 5
24 October 2017
US ETF Compass
of 17-25bps. Around 45% of YTD inflows or $274bn were allocated to ETFs withmanagement fees of 10bps or less, primarily broad-market benchmark products.
Consolidation and lower fees continue to drive the ETF landscapeInvesco recently offered $1.2bn to acquire Guggenheim's ETF business, whichadds low cost products to their platform. This is Invesco's second acquisitionthis year, as it previously purchased Source to expand into the European ETFmarket. Invesco will add 79 Guggenheim ETFs with $37 billion AUM to its existingPowerShares ETF products with $125bn AUM, making it the 4th largest provider.Perhaps more importantly, Invesco will acquire Guggenheim's regulatory approvalto self-index. This potentially lowers costs for the provider by eliminating the needto pay licensing fees to third-party benchmark index providers.
Providers continue to launch lower fee alternatives or slash management feeson older ETFs. State Street Global Advisors recently announced cuts to themanagement fee on 15 ETF products with $11 billion in assets. For three products,State Street is moving to in-house benchmarks to reduce costs. And BlackRock's"core" ETFs have been quite successful this year, with IEMG and IEFA capturingmore than 50% and 42% of inflows respectively to EM and DM ex-US products,more than the competing Vanguard products (VWO and VEA) or the highly-liquidbut higher-cost legacy iShares products (EEM and EFA).
How Active Is Passive?… Less so now for US Equity ETFs
ETFs own an increasing percentage of market-cap in equities, currently 6.1% ofS&P 500 market-cap and 9.1% of Russell 2000 from US-listed products. Despitesignificant growth in smart beta and sector ETFs, aggregate AUM in S&P 500equities has become less active. ETF Active Share for S&P 500 decreased to 7.8%at the end of September, the lowest since the Financial Crisis.
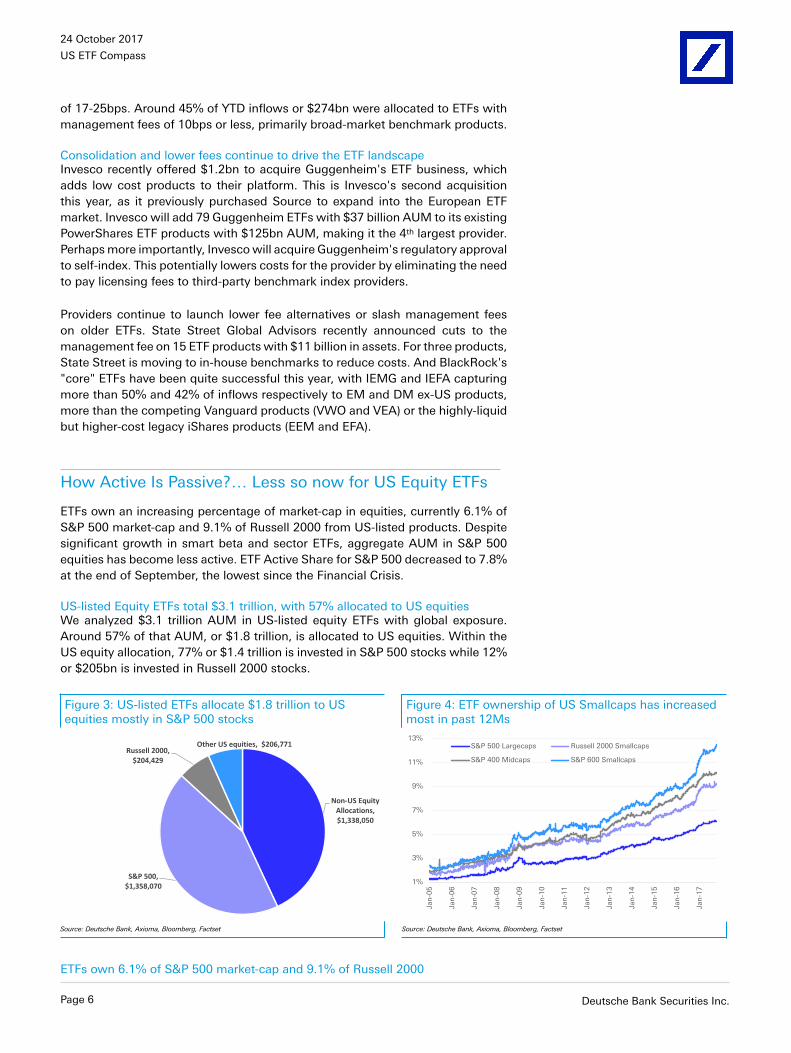
US-listed Equity ETFs total $3.1 trillion, with 57% allocated to US equitiesWe analyzed $3.1 trillion AUM in US-listed equity ETFs with global exposure.Around 57% of that AUM, or $1.8 trillion, is allocated to US equities. Within theUS equity allocation, 77% or $1.4 trillion is invested in S&P 500 stocks while 12%or $205bn is invested in Russell 2000 stocks.
Figure 3: US-listed ETFs allocate $1.8 trillion to USequities mostly in S&P 500 stocks
Figure 4: ETF ownership of US Smallcaps has increasedmost in past 12Ms
Non-US Equity
Allocations,
$1,338,050
S&P 500,
$1,358,070
Russell 2000,
$204,429
Other US equities, $206,771
1%
3%
5%
7%
9%
11%
13%
Jan
-05
Jan
-06
Jan
-07
Jan
-08
Jan
-09
Jan
-10
Jan
-11
Jan
-12
Jan
-13
Jan
-14
Jan
-15
Jan
-16
Jan
-17
S&P 500 Largecaps Russell 2000 Smallcaps
S&P 400 Midcaps S&P 600 Smallcaps
Source: Deutsche Bank, Axioma, Bloomberg, Factset Source: Deutsche Bank, Axioma, Bloomberg, Factset
ETFs own 6.1% of S&P 500 market-cap and 9.1% of Russell 2000
Page 6 Deutsche Bank Securities Inc.
24 October 2017
US ETF Compass
US-listed equity ETFs own 6.1% of market-cap for S&P 500 stocks and 9.1% forRussell 2000 stocks. ETF ownership is even higher for S&P 400 Midcap stocksand S&P 600 Smallcap stocks at 10.2% and 12.5% respectively. This is due tothe overlap between Russell and S&P indices tracked by different ETFs. ETFownership of US smallcap stocks has increased significantly in the past 12Ms onsignificant ETF inflows to the segment.
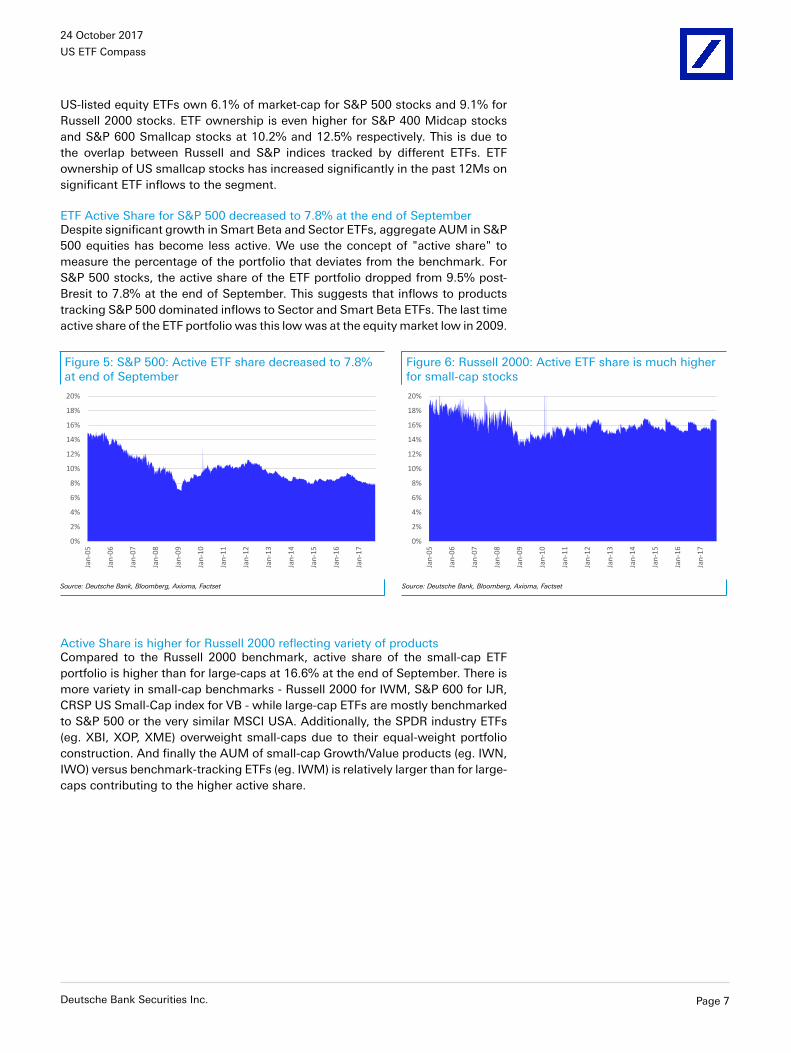
ETF Active Share for S&P 500 decreased to 7.8% at the end of SeptemberDespite significant growth in Smart Beta and Sector ETFs, aggregate AUM in S&P500 equities has become less active. We use the concept of "active share" tomeasure the percentage of the portfolio that deviates from the benchmark. ForS&P 500 stocks, the active share of the ETF portfolio dropped from 9.5% post-Bresit to 7.8% at the end of September. This suggests that inflows to productstracking S&P 500 dominated inflows to Sector and Smart Beta ETFs. The last timeactive share of the ETF portfolio was this low was at the equity market low in 2009.
Figure 5: S&P 500: Active ETF share decreased to 7.8%at end of September
Figure 6: Russell 2000: Active ETF share is much higherfor small-cap stocks
0%
2%
4%
6%
8%
10%
12%
14%
16%
18%
20%
Jan-05
Jan-06
Jan-07
Jan-08
Jan-09
Jan-10
Jan-11
Jan-12
Jan-13
Jan-14
Jan-15
Jan-16
Jan-17
0%
2%
4%
6%
8%
10%
12%
14%
16%
18%
20%
Jan-05
Jan-06
Jan-07
Jan-08
Jan-09
Jan-10
Jan-11
Jan-12
Jan-13
Jan-14
Jan-15
Jan-16
Jan-17
Source: Deutsche Bank, Bloomberg, Axioma, Factset Source: Deutsche Bank, Bloomberg, Axioma, Factset
Active Share is higher for Russell 2000 reflecting variety of productsCompared to the Russell 2000 benchmark, active share of the small-cap ETFportfolio is higher than for large-caps at 16.6% at the end of September. There ismore variety in small-cap benchmarks - Russell 2000 for IWM, S&P 600 for IJR,CRSP US Small-Cap index for VB - while large-cap ETFs are mostly benchmarkedto S&P 500 or the very similar MSCI USA. Additionally, the SPDR industry ETFs(eg. XBI, XOP, XME) overweight small-caps due to their equal-weight portfolioconstruction. And finally the AUM of small-cap Growth/Value products (eg. IWN,IWO) versus benchmark-tracking ETFs (eg. IWM) is relatively larger than for large-caps contributing to the higher active share.
Deutsche Bank Securities Inc. Page 7
24 October 2017
US ETF Compass
Asset Allocation HeatmapsGlobal Multi Asset Allocator heatmaps
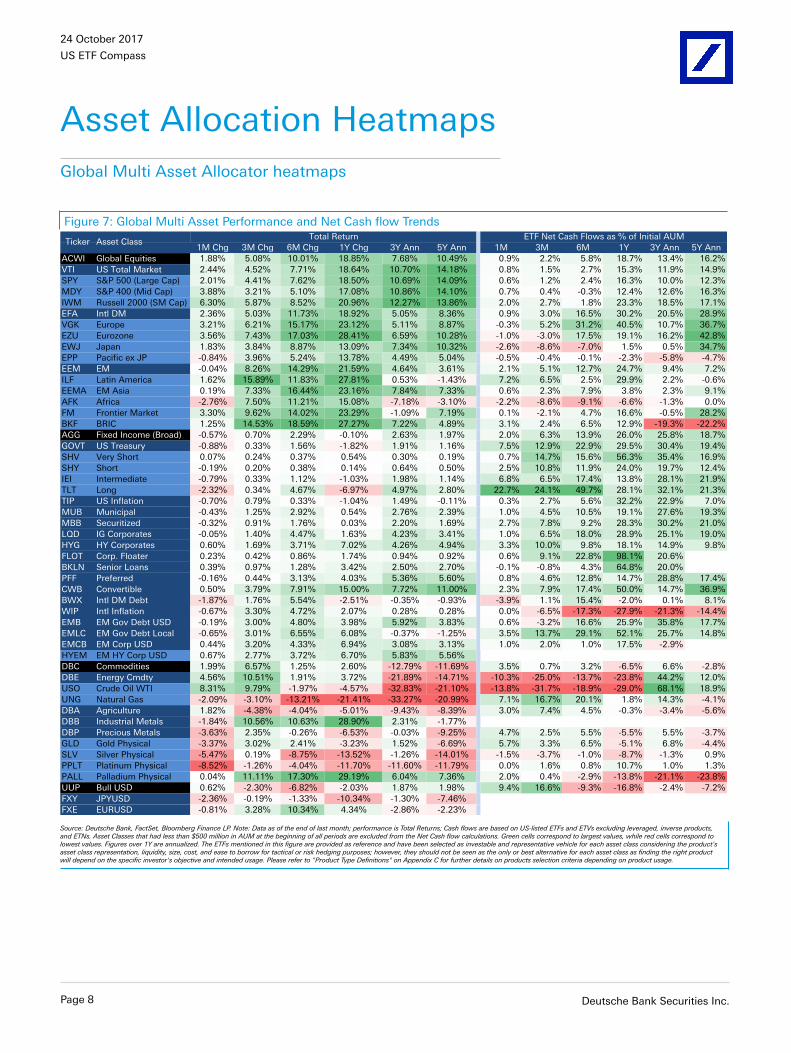
Figure 7: Global Multi Asset Performance and Net Cash flow Trends
1M Chg 3M Chg 6M Chg 1Y Chg 3Y Ann 5Y Ann 1M 3M 6M 1Y 3Y Ann 5Y Ann
ACWI Global Equities 1.88% 5.08% 10.01% 18.85% 7.68% 10.49% 0.9% 2.2% 5.8% 18.7% 13.4% 16.2%
VTI US Total Market 2.44% 4.52% 7.71% 18.64% 10.70% 14.18% 0.8% 1.5% 2.7% 15.3% 11.9% 14.9%
SPY S&P 500 (Large Cap) 2.01% 4.41% 7.62% 18.50% 10.69% 14.09% 0.6% 1.2% 2.4% 16.3% 10.0% 12.3%
MDY S&P 400 (Mid Cap) 3.88% 3.21% 5.10% 17.08% 10.86% 14.10% 0.7% 0.4% -0.3% 12.4% 12.6% 16.3%
IWM Russell 2000 (SM Cap) 6.30% 5.87% 8.52% 20.96% 12.27% 13.86% 2.0% 2.7% 1.8% 23.3% 18.5% 17.1%
EFA Intl DM 2.36% 5.03% 11.73% 18.92% 5.05% 8.36% 0.9% 3.0% 16.5% 30.2% 20.5% 28.9%
VGK Europe 3.21% 6.21% 15.17% 23.12% 5.11% 8.87% -0.3% 5.2% 31.2% 40.5% 10.7% 36.7%
EZU Eurozone 3.56% 7.43% 17.03% 28.41% 6.59% 10.28% -1.0% -3.0% 17.5% 19.1% 16.2% 42.8%
EWJ Japan 1.83% 3.84% 8.87% 13.09% 7.34% 10.32% -2.6% -8.6% -7.0% 1.5% 0.5% 34.7%
EPP Pacific ex JP -0.84% 3.96% 5.24% 13.78% 4.49% 5.04% -0.5% -0.4% -0.1% -2.3% -5.8% -4.7%
EEM EM -0.04% 8.26% 14.29% 21.59% 4.64% 3.61% 2.1% 5.1% 12.7% 24.7% 9.4% 7.2%
ILF Latin America 1.62% 15.89% 11.83% 27.81% 0.53% -1.43% 7.2% 6.5% 2.5% 29.9% 2.2% -0.6%
EEMA EM Asia 0.19% 7.33% 16.44% 23.16% 7.84% 7.33% 0.6% 2.3% 7.9% 3.8% 2.3% 9.1%
AFK Africa -2.76% 7.50% 11.21% 15.08% -7.18% -3.10% -2.2% -8.6% -9.1% -6.6% -1.3% 0.0%
FM Frontier Market 3.30% 9.62% 14.02% 23.29% -1.09% 7.19% 0.1% -2.1% 4.7% 16.6% -0.5% 28.2%
BKF BRIC 1.25% 14.53% 18.59% 27.27% 7.22% 4.89% 3.1% 2.4% 6.5% 12.9% -19.3% -22.2%
AGG Fixed Income (Broad) -0.57% 0.70% 2.29% -0.10% 2.63% 1.97% 2.0% 6.3% 13.9% 26.0% 25.8% 18.7%
GOVT US Treasury -0.88% 0.33% 1.56% -1.82% 1.91% 1.16% 7.5% 12.9% 22.9% 29.5% 30.4% 19.4%
SHV Very Short 0.07% 0.24% 0.37% 0.54% 0.30% 0.19% 0.7% 14.7% 15.6% 56.3% 35.4% 16.9%
SHY Short -0.19% 0.20% 0.38% 0.14% 0.64% 0.50% 2.5% 10.8% 11.9% 24.0% 19.7% 12.4%
IEI Intermediate -0.79% 0.33% 1.12% -1.03% 1.98% 1.14% 6.8% 6.5% 17.4% 13.8% 28.1% 21.9%
TLT Long -2.32% 0.34% 4.67% -6.97% 4.97% 2.80% 22.7% 24.1% 49.7% 28.1% 32.1% 21.3%
TIP US Inflation -0.70% 0.79% 0.33% -1.04% 1.49% -0.11% 0.3% 2.7% 5.6% 32.2% 22.9% 7.0%
MUB Municipal -0.43% 1.25% 2.92% 0.54% 2.76% 2.39% 1.0% 4.5% 10.5% 19.1% 27.6% 19.3%
MBB Securitized -0.32% 0.91% 1.76% 0.03% 2.20% 1.69% 2.7% 7.8% 9.2% 28.3% 30.2% 21.0%
LQD IG Corporates -0.05% 1.40% 4.47% 1.63% 4.23% 3.41% 1.0% 6.5% 18.0% 28.9% 25.1% 19.0%
HYG HY Corporates 0.60% 1.69% 3.71% 7.02% 4.26% 4.94% 3.3% 10.0% 9.8% 18.1% 14.9% 9.8%
FLOT Corp. Floater 0.23% 0.42% 0.86% 1.74% 0.94% 0.92% 0.6% 9.1% 22.8% 98.1% 20.6%
BKLN Senior Loans 0.39% 0.97% 1.28% 3.42% 2.50% 2.70% -0.1% -0.8% 4.3% 64.8% 20.0%
PFF Preferred -0.16% 0.44% 3.13% 4.03% 5.36% 5.60% 0.8% 4.6% 12.8% 14.7% 28.8% 17.4%
CWB Convertible 0.50% 3.79% 7.91% 15.00% 7.72% 11.00% 2.3% 7.9% 17.4% 50.0% 14.7% 36.9%
BWX Intl DM Debt -1.87% 1.76% 5.54% -2.51% -0.35% -0.93% -3.9% 1.1% 15.4% -2.0% 0.1% 8.1%
WIP Intl Inflation -0.67% 3.30% 4.72% 2.07% 0.28% 0.28% 0.0% -6.5% -17.3% -27.9% -21.3% -14.4%
EMB EM Gov Debt USD -0.19% 3.00% 4.80% 3.98% 5.92% 3.83% 0.6% -3.2% 16.6% 25.9% 35.8% 17.7%
EMLC EM Gov Debt Local -0.65% 3.01% 6.55% 6.08% -0.37% -1.25% 3.5% 13.7% 29.1% 52.1% 25.7% 14.8%
EMCB EM Corp USD 0.44% 3.20% 4.33% 6.94% 3.08% 3.13% 1.0% 2.0% 1.0% 17.5% -2.9%
HYEM EM HY Corp USD 0.67% 2.77% 3.72% 6.70% 5.83% 5.56%
DBC Commodities 1.99% 6.57% 1.25% 2.60% -12.79% -11.69% 3.5% 0.7% 3.2% -6.5% 6.6% -2.8%
DBE Energy Cmdty 4.56% 10.51% 1.91% 3.72% -21.89% -14.71% -10.3% -25.0% -13.7% -23.8% 44.2% 12.0%
USO Crude Oil WTI 8.31% 9.79% -1.97% -4.57% -32.83% -21.10% -13.8% -31.7% -18.9% -29.0% 68.1% 18.9%
UNG Natural Gas -2.09% -3.10% -13.21% -21.41% -33.27% -20.99% 7.1% 16.7% 20.1% 1.8% 14.3% -4.1%
DBA Agriculture 1.82% -4.38% -4.04% -5.01% -9.43% -8.39% 3.0% 7.4% 4.5% -0.3% -3.4% -5.6%
DBB Industrial Metals -1.84% 10.56% 10.63% 28.90% 2.31% -1.77%
DBP Precious Metals -3.63% 2.35% -0.26% -6.53% -0.03% -9.25% 4.7% 2.5% 5.5% -5.5% 5.5% -3.7%
GLD Gold Physical -3.37% 3.02% 2.41% -3.23% 1.52% -6.69% 5.7% 3.3% 6.5% -5.1% 6.8% -4.4%
SLV Silver Physical -5.47% 0.19% -8.75% -13.52% -1.26% -14.01% -1.5% -3.7% -1.0% -8.7% -1.3% 0.9%
PPLT Platinum Physical -8.52% -1.26% -4.04% -11.70% -11.60% -11.79% 0.0% 1.6% 0.8% 10.7% 1.0% 1.3%
PALL Palladium Physical 0.04% 11.11% 17.30% 29.19% 6.04% 7.36% 2.0% 0.4% -2.9% -13.8% -21.1% -23.8%
UUP Bull USD 0.62% -2.30% -6.82% -2.03% 1.87% 1.98% 9.4% 16.6% -9.3% -16.8% -2.4% -7.2%
FXY JPYUSD -2.36% -0.19% -1.33% -10.34% -1.30% -7.46%
FXE EURUSD -0.81% 3.28% 10.34% 4.34% -2.86% -2.23%
Ticker Asset ClassTotal Return ETF Net Cash Flows as % of Initial AUM
Source: Deutsche Bank, FactSet, Bloomberg Finance LP. Note: Data as of the end of last month; performance is Total Returns; Cash flows are based on US-listed ETFs and ETVs excluding leveraged, inverse products,and ETNs. Asset Classes that had less than $500 million in AUM at the beginning of all periods are excluded from the Net Cash flow calculations. Green cells correspond to largest values, while red cells correspond tolowest values. Figures over 1Y are annualized. The ETFs mentioned in this figure are provided as reference and have been selected as investable and representative vehicle for each asset class considering the product'sasset class representation, liquidity, size, cost, and ease to borrow for tactical or risk hedging purposes; however, they should not be seen as the only or best alternative for each asset class as finding the right productwill depend on the specific investor's objective and intended usage. Please refer to "Product Type Definitions" on Appendix C for further details on products selection criteria depending on product usage.
Page 8 Deutsche Bank Securities Inc.
24 October 2017
US ETF Compass
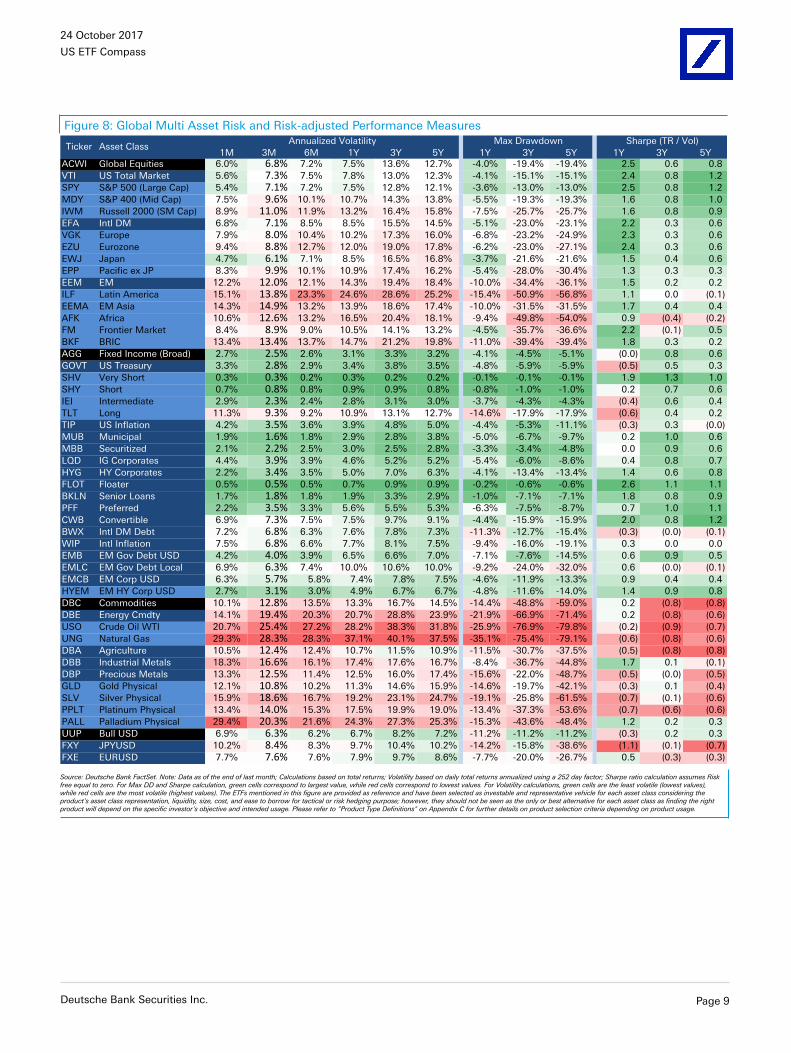
Figure 8: Global Multi Asset Risk and Risk-adjusted Performance Measures
1M 3M 6M 1Y 3Y 5Y 1Y 3Y 5Y 1Y 3Y 5Y
ACWI Global Equities 6.0% 6.8% 7.2% 7.5% 13.6% 12.7% -4.0% -19.4% -19.4% 2.5 0.6 0.8
VTI US Total Market 5.6% 7.3% 7.5% 7.8% 13.0% 12.3% -4.1% -15.1% -15.1% 2.4 0.8 1.2
SPY S&P 500 (Large Cap) 5.4% 7.1% 7.2% 7.5% 12.8% 12.1% -3.6% -13.0% -13.0% 2.5 0.8 1.2
MDY S&P 400 (Mid Cap) 7.5% 9.6% 10.1% 10.7% 14.3% 13.8% -5.5% -19.3% -19.3% 1.6 0.8 1.0
IWM Russell 2000 (SM Cap) 8.9% 11.0% 11.9% 13.2% 16.4% 15.8% -7.5% -25.7% -25.7% 1.6 0.8 0.9
EFA Intl DM 6.8% 7.1% 8.5% 8.5% 15.5% 14.5% -5.1% -23.0% -23.1% 2.2 0.3 0.6
VGK Europe 7.9% 8.0% 10.4% 10.2% 17.3% 16.0% -6.8% -23.2% -24.9% 2.3 0.3 0.6
EZU Eurozone 9.4% 8.8% 12.7% 12.0% 19.0% 17.8% -6.2% -23.0% -27.1% 2.4 0.3 0.6
EWJ Japan 4.7% 6.1% 7.1% 8.5% 16.5% 16.8% -3.7% -21.6% -21.6% 1.5 0.4 0.6
EPP Pacific ex JP 8.3% 9.9% 10.1% 10.9% 17.4% 16.2% -5.4% -28.0% -30.4% 1.3 0.3 0.3
EEM EM 12.2% 12.0% 12.1% 14.3% 19.4% 18.4% -10.0% -34.4% -36.1% 1.5 0.2 0.2
ILF Latin America 15.1% 13.8% 23.3% 24.6% 28.6% 25.2% -15.4% -50.9% -56.8% 1.1 0.0 (0.1)
EEMA EM Asia 14.3% 14.9% 13.2% 13.9% 18.6% 17.4% -10.0% -31.5% -31.5% 1.7 0.4 0.4
AFK Africa 10.6% 12.6% 13.2% 16.5% 20.4% 18.1% -9.4% -49.8% -54.0% 0.9 (0.4) (0.2)
FM Frontier Market 8.4% 8.9% 9.0% 10.5% 14.1% 13.2% -4.5% -35.7% -36.6% 2.2 (0.1) 0.5
BKF BRIC 13.4% 13.4% 13.7% 14.7% 21.2% 19.8% -11.0% -39.4% -39.4% 1.8 0.3 0.2
AGG Fixed Income (Broad) 2.7% 2.5% 2.6% 3.1% 3.3% 3.2% -4.1% -4.5% -5.1% (0.0) 0.8 0.6
GOVT US Treasury 3.3% 2.8% 2.9% 3.4% 3.8% 3.5% -4.8% -5.9% -5.9% (0.5) 0.5 0.3
SHV Very Short 0.3% 0.3% 0.2% 0.3% 0.2% 0.2% -0.1% -0.1% -0.1% 1.9 1.3 1.0
SHY Short 0.7% 0.8% 0.8% 0.9% 0.9% 0.8% -0.8% -1.0% -1.0% 0.2 0.7 0.6
IEI Intermediate 2.9% 2.3% 2.4% 2.8% 3.1% 3.0% -3.7% -4.3% -4.3% (0.4) 0.6 0.4
TLT Long 11.3% 9.3% 9.2% 10.9% 13.1% 12.7% -14.6% -17.9% -17.9% (0.6) 0.4 0.2
TIP US Inflation 4.2% 3.5% 3.6% 3.9% 4.8% 5.0% -4.4% -5.3% -11.1% (0.3) 0.3 (0.0)
MUB Municipal 1.9% 1.6% 1.8% 2.9% 2.8% 3.8% -5.0% -6.7% -9.7% 0.2 1.0 0.6
MBB Securitized 2.1% 2.2% 2.5% 3.0% 2.5% 2.8% -3.3% -3.4% -4.8% 0.0 0.9 0.6
LQD IG Corporates 4.4% 3.9% 3.9% 4.6% 5.2% 5.2% -5.4% -6.0% -8.6% 0.4 0.8 0.7
HYG HY Corporates 2.2% 3.4% 3.5% 5.0% 7.0% 6.3% -4.1% -13.4% -13.4% 1.4 0.6 0.8
FLOT Floater 0.5% 0.5% 0.5% 0.7% 0.9% 0.9% -0.2% -0.6% -0.6% 2.6 1.1 1.1
BKLN Senior Loans 1.7% 1.8% 1.8% 1.9% 3.3% 2.9% -1.0% -7.1% -7.1% 1.8 0.8 0.9
PFF Preferred 2.2% 3.5% 3.3% 5.6% 5.5% 5.3% -6.3% -7.5% -8.7% 0.7 1.0 1.1
CWB Convertible 6.9% 7.3% 7.5% 7.5% 9.7% 9.1% -4.4% -15.9% -15.9% 2.0 0.8 1.2
BWX Intl DM Debt 7.2% 6.8% 6.3% 7.6% 7.8% 7.3% -11.3% -12.7% -15.4% (0.3) (0.0) (0.1)
WIP Intl Inflation 7.5% 6.8% 6.6% 7.7% 8.1% 7.5% -9.4% -16.0% -19.1% 0.3 0.0 0.0
EMB EM Gov Debt USD 4.2% 4.0% 3.9% 6.5% 6.6% 7.0% -7.1% -7.6% -14.5% 0.6 0.9 0.5
EMLC EM Gov Debt Local 6.9% 6.3% 7.4% 10.0% 10.6% 10.0% -9.2% -24.0% -32.0% 0.6 (0.0) (0.1)
EMCB EM Corp USD 6.3% 5.7% 5.8% 7.4% 7.8% 7.5% -4.6% -11.9% -13.3% 0.9 0.4 0.4
HYEM EM HY Corp USD 2.7% 3.1% 3.0% 4.9% 6.7% 6.7% -4.8% -11.6% -14.0% 1.4 0.9 0.8
DBC Commodities 10.1% 12.8% 13.5% 13.3% 16.7% 14.5% -14.4% -48.8% -59.0% 0.2 (0.8) (0.8)
DBE Energy Cmdty 14.1% 19.4% 20.3% 20.7% 28.8% 23.9% -21.9% -66.9% -71.4% 0.2 (0.8) (0.6)
USO Crude Oil WTI 20.7% 25.4% 27.2% 28.2% 38.3% 31.8% -25.9% -76.9% -79.8% (0.2) (0.9) (0.7)
UNG Natural Gas 29.3% 28.3% 28.3% 37.1% 40.1% 37.5% -35.1% -75.4% -79.1% (0.6) (0.8) (0.6)
DBA Agriculture 10.5% 12.4% 12.4% 10.7% 11.5% 10.9% -11.5% -30.7% -37.5% (0.5) (0.8) (0.8)
DBB Industrial Metals 18.3% 16.6% 16.1% 17.4% 17.6% 16.7% -8.4% -36.7% -44.8% 1.7 0.1 (0.1)
DBP Precious Metals 13.3% 12.5% 11.4% 12.5% 16.0% 17.4% -15.6% -22.0% -48.7% (0.5) (0.0) (0.5)
GLD Gold Physical 12.1% 10.8% 10.2% 11.3% 14.6% 15.9% -14.6% -19.7% -42.1% (0.3) 0.1 (0.4)
SLV Silver Physical 15.9% 18.6% 16.7% 19.2% 23.1% 24.7% -19.1% -25.8% -61.5% (0.7) (0.1) (0.6)
PPLT Platinum Physical 13.4% 14.0% 15.3% 17.5% 19.9% 19.0% -13.4% -37.3% -53.6% (0.7) (0.6) (0.6)
PALL Palladium Physical 29.4% 20.3% 21.6% 24.3% 27.3% 25.3% -15.3% -43.6% -48.4% 1.2 0.2 0.3
UUP Bull USD 6.9% 6.3% 6.2% 6.7% 8.2% 7.2% -11.2% -11.2% -11.2% (0.3) 0.2 0.3
FXY JPYUSD 10.2% 8.4% 8.3% 9.7% 10.4% 10.2% -14.2% -15.8% -38.6% (1.1) (0.1) (0.7)
FXE EURUSD 7.7% 7.6% 7.6% 7.9% 9.7% 8.6% -7.7% -20.0% -26.7% 0.5 (0.3) (0.3)
Sharpe (TR / Vol)Ticker Asset Class
Annualized Volatility Max Drawdown
Source: Deutsche Bank FactSet. Note: Data as of the end of last month; Calculations based on total returns; Volatility based on daily total returns annualized using a 252 day factor; Sharpe ratio calculation assumes Riskfree equal to zero. For Max DD and Sharpe calculation, green cells correspond to largest value, while red cells correspond to lowest values. For Volatility calculations, green cells are the least volatile (lowest values),while red cells are the most volatile (highest values). The ETFs mentioned in this figure are provided as reference and have been selected as investable and representative vehicle for each asset class considering theproduct's asset class representation, liquidity, size, cost, and ease to borrow for tactical or risk hedging purpose; however, they should not be seen as the only or best alternative for each asset class as finding the rightproduct will depend on the specific investor's objective and intended usage. Please refer to "Product Type Definitions" on Appendix C for further details on product selection criteria depending on product usage.
Deutsche Bank Securities Inc. Page 9
24 October 2017
US ETF Compass
US Equity Allocator heatmaps
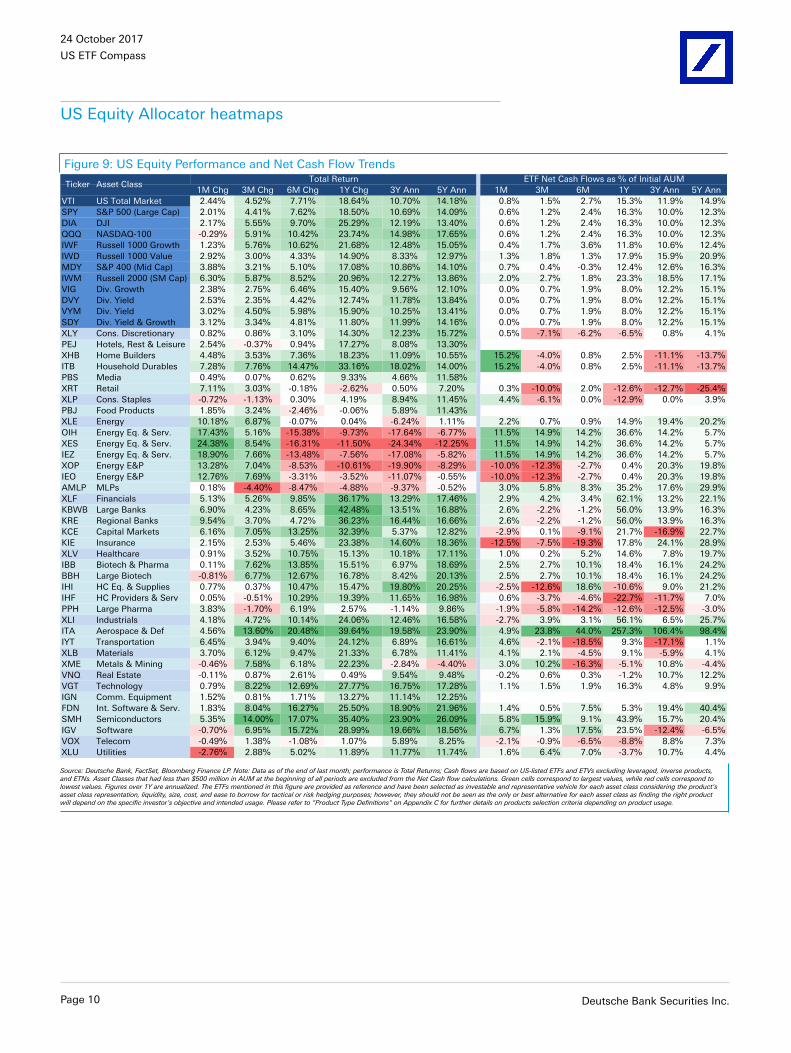
Figure 9: US Equity Performance and Net Cash Flow Trends
1M Chg 3M Chg 6M Chg 1Y Chg 3Y Ann 5Y Ann 1M 3M 6M 1Y 3Y Ann 5Y Ann
VTI US Total Market 2.44% 4.52% 7.71% 18.64% 10.70% 14.18% 0.8% 1.5% 2.7% 15.3% 11.9% 14.9%
SPY S&P 500 (Large Cap) 2.01% 4.41% 7.62% 18.50% 10.69% 14.09% 0.6% 1.2% 2.4% 16.3% 10.0% 12.3%
DIA DJI 2.17% 5.55% 9.70% 25.29% 12.19% 13.40% 0.6% 1.2% 2.4% 16.3% 10.0% 12.3%
QQQ NASDAQ-100 -0.29% 5.91% 10.42% 23.74% 14.98% 17.65% 0.6% 1.2% 2.4% 16.3% 10.0% 12.3%
IWF Russell 1000 Growth 1.23% 5.76% 10.62% 21.68% 12.48% 15.05% 0.4% 1.7% 3.6% 11.8% 10.6% 12.4%
IWD Russell 1000 Value 2.92% 3.00% 4.33% 14.90% 8.33% 12.97% 1.3% 1.8% 1.3% 17.9% 15.9% 20.9%
MDY S&P 400 (Mid Cap) 3.88% 3.21% 5.10% 17.08% 10.86% 14.10% 0.7% 0.4% -0.3% 12.4% 12.6% 16.3%
IWM Russell 2000 (SM Cap) 6.30% 5.87% 8.52% 20.96% 12.27% 13.86% 2.0% 2.7% 1.8% 23.3% 18.5% 17.1%
VIG Div. Growth 2.38% 2.75% 6.46% 15.40% 9.56% 12.10% 0.0% 0.7% 1.9% 8.0% 12.2% 15.1%
DVY Div. Yield 2.53% 2.35% 4.42% 12.74% 11.78% 13.84% 0.0% 0.7% 1.9% 8.0% 12.2% 15.1%
VYM Div. Yield 3.02% 4.50% 5.98% 15.90% 10.25% 13.41% 0.0% 0.7% 1.9% 8.0% 12.2% 15.1%
SDY Div. Yield & Growth 3.12% 3.34% 4.81% 11.80% 11.99% 14.16% 0.0% 0.7% 1.9% 8.0% 12.2% 15.1%
XLY Cons. Discretionary 0.82% 0.86% 3.10% 14.30% 12.23% 15.72% 0.5% -7.1% -6.2% -6.5% 0.8% 4.1%
PEJ Hotels, Rest & Leisure 2.54% -0.37% 0.94% 17.27% 8.08% 13.30%
XHB Home Builders 4.48% 3.53% 7.36% 18.23% 11.09% 10.55% 15.2% -4.0% 0.8% 2.5% -11.1% -13.7%
ITB Household Durables 7.28% 7.76% 14.47% 33.16% 18.02% 14.00% 15.2% -4.0% 0.8% 2.5% -11.1% -13.7%
PBS Media 0.49% 0.07% 0.62% 9.33% 4.66% 11.58%
XRT Retail 7.11% 3.03% -0.18% -2.62% 0.50% 7.20% 0.3% -10.0% 2.0% -12.6% -12.7% -25.4%
XLP Cons. Staples -0.72% -1.13% 0.30% 4.19% 8.94% 11.45% 4.4% -6.1% 0.0% -12.9% 0.0% 3.9%
PBJ Food Products 1.85% 3.24% -2.46% -0.06% 5.89% 11.43%
XLE Energy 10.18% 6.87% -0.07% 0.04% -6.24% 1.11% 2.2% 0.7% 0.9% 14.9% 19.4% 20.2%
OIH Energy Eq. & Serv. 17.43% 5.16% -15.38% -9.73% -17.64% -6.77% 11.5% 14.9% 14.2% 36.6% 14.2% 5.7%
XES Energy Eq. & Serv. 24.38% 8.54% -16.31% -11.50% -24.34% -12.25% 11.5% 14.9% 14.2% 36.6% 14.2% 5.7%
IEZ Energy Eq. & Serv. 18.90% 7.66% -13.48% -7.56% -17.08% -5.82% 11.5% 14.9% 14.2% 36.6% 14.2% 5.7%
XOP Energy E&P 13.28% 7.04% -8.53% -10.61% -19.90% -8.29% -10.0% -12.3% -2.7% 0.4% 20.3% 19.8%
IEO Energy E&P 12.76% 7.69% -3.31% -3.52% -11.07% -0.55% -10.0% -12.3% -2.7% 0.4% 20.3% 19.8%
AMLP MLPs 0.18% -4.40% -8.47% -4.88% -9.37% -0.52% 3.0% 5.8% 8.3% 35.2% 17.6% 29.9%
XLF Financials 5.13% 5.26% 9.85% 36.17% 13.29% 17.46% 2.9% 4.2% 3.4% 62.1% 13.2% 22.1%
KBWB Large Banks 6.90% 4.23% 8.65% 42.48% 13.51% 16.88% 2.6% -2.2% -1.2% 56.0% 13.9% 16.3%
KRE Regional Banks 9.54% 3.70% 4.72% 36.23% 16.44% 16.66% 2.6% -2.2% -1.2% 56.0% 13.9% 16.3%
KCE Capital Markets 6.16% 7.05% 13.25% 32.39% 5.37% 12.82% -2.9% 0.1% -9.1% 21.7% -16.9% 22.7%
KIE Insurance 2.15% 2.53% 5.46% 23.38% 14.60% 18.36% -12.5% -7.5% -19.3% 17.8% 24.1% 28.9%
XLV Healthcare 0.91% 3.52% 10.75% 15.13% 10.18% 17.11% 1.0% 0.2% 5.2% 14.6% 7.8% 19.7%
IBB Biotech & Pharma 0.11% 7.62% 13.85% 15.51% 6.97% 18.69% 2.5% 2.7% 10.1% 18.4% 16.1% 24.2%
BBH Large Biotech -0.81% 6.77% 12.67% 16.78% 8.42% 20.13% 2.5% 2.7% 10.1% 18.4% 16.1% 24.2%
IHI HC Eq. & Supplies 0.77% 0.37% 10.47% 15.47% 19.80% 20.25% -2.5% -12.6% 18.6% -10.6% 9.0% 21.2%
IHF HC Providers & Serv 0.05% -0.51% 10.29% 19.39% 11.65% 16.98% 0.6% -3.7% -4.6% -22.7% -11.7% 7.0%
PPH Large Pharma 3.83% -1.70% 6.19% 2.57% -1.14% 9.86% -1.9% -5.8% -14.2% -12.6% -12.5% -3.0%
XLI Industrials 4.18% 4.72% 10.14% 24.06% 12.46% 16.58% -2.7% 3.9% 3.1% 56.1% 6.5% 25.7%
ITA Aerospace & Def 4.56% 13.60% 20.48% 39.64% 19.58% 23.90% 4.9% 23.8% 44.0% 257.3% 106.4% 98.4%
IYT Transportation 6.45% 3.94% 9.40% 24.12% 6.89% 16.61% 4.6% -2.1% -18.5% 9.3% -17.1% 1.1%
XLB Materials 3.70% 6.12% 9.47% 21.33% 6.78% 11.41% 4.1% 2.1% -4.5% 9.1% -5.9% 4.1%
XME Metals & Mining -0.46% 7.58% 6.18% 22.23% -2.84% -4.40% 3.0% 10.2% -16.3% -5.1% 10.8% -4.4%
VNQ Real Estate -0.11% 0.87% 2.61% 0.49% 9.54% 9.48% -0.2% 0.6% 0.3% -1.2% 10.7% 12.2%
VGT Technology 0.79% 8.22% 12.69% 27.77% 16.75% 17.28% 1.1% 1.5% 1.9% 16.3% 4.8% 9.9%
IGN Comm. Equipment 1.52% 0.81% 1.71% 13.27% 11.14% 12.25%
FDN Int. Software & Serv. 1.83% 8.04% 16.27% 25.50% 18.90% 21.96% 1.4% 0.5% 7.5% 5.3% 19.4% 40.4%
SMH Semiconductors 5.35% 14.00% 17.07% 35.40% 23.90% 26.09% 5.8% 15.9% 9.1% 43.9% 15.7% 20.4%
IGV Software -0.70% 6.95% 15.72% 28.99% 19.66% 18.56% 6.7% 1.3% 17.5% 23.5% -12.4% -6.5%
VOX Telecom -0.49% 1.38% -1.08% 1.07% 5.89% 8.25% -2.1% -0.9% -6.5% -8.8% 8.8% 7.3%
XLU Utilities -2.76% 2.88% 5.02% 11.89% 11.77% 11.74% 1.6% 6.4% 7.0% -3.7% 10.7% 4.4%
Ticker Asset ClassTotal Return ETF Net Cash Flows as % of Initial AUM
Source: Deutsche Bank, FactSet, Bloomberg Finance LP. Note: Data as of the end of last month; performance is Total Returns; Cash flows are based on US-listed ETFs and ETVs excluding leveraged, inverse products,and ETNs. Asset Classes that had less than $500 million in AUM at the beginning of all periods are excluded from the Net Cash flow calculations. Green cells correspond to largest values, while red cells correspond tolowest values. Figures over 1Y are annualized. The ETFs mentioned in this figure are provided as reference and have been selected as investable and representative vehicle for each asset class considering the product'sasset class representation, liquidity, size, cost, and ease to borrow for tactical or risk hedging purposes; however, they should not be seen as the only or best alternative for each asset class as finding the right productwill depend on the specific investor's objective and intended usage. Please refer to "Product Type Definitions" on Appendix C for further details on products selection criteria depending on product usage.
Page 10 Deutsche Bank Securities Inc.
24 October 2017
US ETF Compass
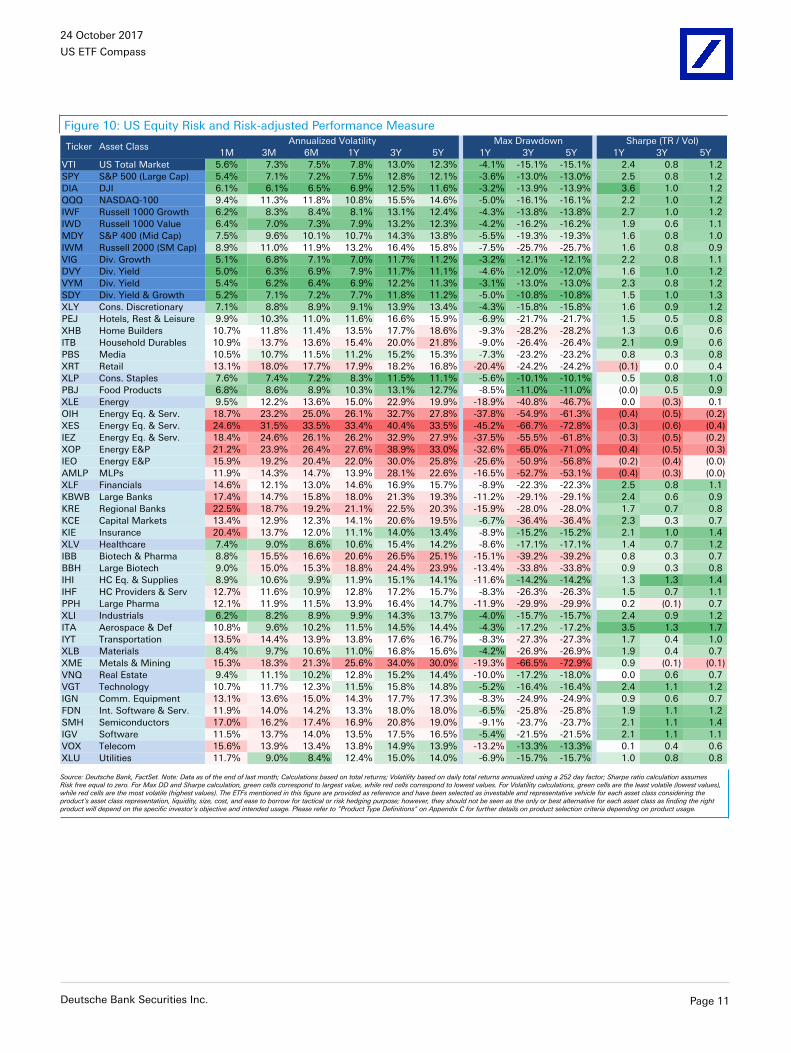
Figure 10: US Equity Risk and Risk-adjusted Performance Measure
1M 3M 6M 1Y 3Y 5Y 1Y 3Y 5Y 1Y 3Y 5Y
VTI US Total Market 5.6% 7.3% 7.5% 7.8% 13.0% 12.3% -4.1% -15.1% -15.1% 2.4 0.8 1.2
SPY S&P 500 (Large Cap) 5.4% 7.1% 7.2% 7.5% 12.8% 12.1% -3.6% -13.0% -13.0% 2.5 0.8 1.2
DIA DJI 6.1% 6.1% 6.5% 6.9% 12.5% 11.6% -3.2% -13.9% -13.9% 3.6 1.0 1.2
QQQ NASDAQ-100 9.4% 11.3% 11.8% 10.8% 15.5% 14.6% -5.0% -16.1% -16.1% 2.2 1.0 1.2
IWF Russell 1000 Growth 6.2% 8.3% 8.4% 8.1% 13.1% 12.4% -4.3% -13.8% -13.8% 2.7 1.0 1.2
IWD Russell 1000 Value 6.4% 7.0% 7.3% 7.9% 13.2% 12.3% -4.2% -16.2% -16.2% 1.9 0.6 1.1
MDY S&P 400 (Mid Cap) 7.5% 9.6% 10.1% 10.7% 14.3% 13.8% -5.5% -19.3% -19.3% 1.6 0.8 1.0
IWM Russell 2000 (SM Cap) 8.9% 11.0% 11.9% 13.2% 16.4% 15.8% -7.5% -25.7% -25.7% 1.6 0.8 0.9
VIG Div. Growth 5.1% 6.8% 7.1% 7.0% 11.7% 11.2% -3.2% -12.1% -12.1% 2.2 0.8 1.1
DVY Div. Yield 5.0% 6.3% 6.9% 7.9% 11.7% 11.1% -4.6% -12.0% -12.0% 1.6 1.0 1.2
VYM Div. Yield 5.4% 6.2% 6.4% 6.9% 12.2% 11.3% -3.1% -13.0% -13.0% 2.3 0.8 1.2
SDY Div. Yield & Growth 5.2% 7.1% 7.2% 7.7% 11.8% 11.2% -5.0% -10.8% -10.8% 1.5 1.0 1.3
XLY Cons. Discretionary 7.1% 8.8% 8.9% 9.1% 13.9% 13.4% -4.3% -15.8% -15.8% 1.6 0.9 1.2
PEJ Hotels, Rest & Leisure 9.9% 10.3% 11.0% 11.6% 16.6% 15.9% -6.9% -21.7% -21.7% 1.5 0.5 0.8
XHB Home Builders 10.7% 11.8% 11.4% 13.5% 17.7% 18.6% -9.3% -28.2% -28.2% 1.3 0.6 0.6
ITB Household Durables 10.9% 13.7% 13.6% 15.4% 20.0% 21.8% -9.0% -26.4% -26.4% 2.1 0.9 0.6
PBS Media 10.5% 10.7% 11.5% 11.2% 15.2% 15.3% -7.3% -23.2% -23.2% 0.8 0.3 0.8
XRT Retail 13.1% 18.0% 17.7% 17.9% 18.2% 16.8% -20.4% -24.2% -24.2% (0.1) 0.0 0.4
XLP Cons. Staples 7.6% 7.4% 7.2% 8.3% 11.5% 11.1% -5.6% -10.1% -10.1% 0.5 0.8 1.0
PBJ Food Products 6.8% 8.6% 8.9% 10.3% 13.1% 12.7% -8.5% -11.0% -11.0% (0.0) 0.5 0.9
XLE Energy 9.5% 12.2% 13.6% 15.0% 22.9% 19.9% -18.9% -40.8% -46.7% 0.0 (0.3) 0.1
OIH Energy Eq. & Serv. 18.7% 23.2% 25.0% 26.1% 32.7% 27.8% -37.8% -54.9% -61.3% (0.4) (0.5) (0.2)
XES Energy Eq. & Serv. 24.6% 31.5% 33.5% 33.4% 40.4% 33.5% -45.2% -66.7% -72.8% (0.3) (0.6) (0.4)
IEZ Energy Eq. & Serv. 18.4% 24.6% 26.1% 26.2% 32.9% 27.9% -37.5% -55.5% -61.8% (0.3) (0.5) (0.2)
XOP Energy E&P 21.2% 23.9% 26.4% 27.6% 38.9% 33.0% -32.6% -65.0% -71.0% (0.4) (0.5) (0.3)
IEO Energy E&P 15.9% 19.2% 20.4% 22.0% 30.0% 25.8% -25.6% -50.9% -56.8% (0.2) (0.4) (0.0)
AMLP MLPs 11.9% 14.3% 14.7% 13.9% 28.1% 22.6% -16.5% -52.7% -53.1% (0.4) (0.3) (0.0)
XLF Financials 14.6% 12.1% 13.0% 14.6% 16.9% 15.7% -8.9% -22.3% -22.3% 2.5 0.8 1.1
KBWB Large Banks 17.4% 14.7% 15.8% 18.0% 21.3% 19.3% -11.2% -29.1% -29.1% 2.4 0.6 0.9
KRE Regional Banks 22.5% 18.7% 19.2% 21.1% 22.5% 20.3% -15.9% -28.0% -28.0% 1.7 0.7 0.8
KCE Capital Markets 13.4% 12.9% 12.3% 14.1% 20.6% 19.5% -6.7% -36.4% -36.4% 2.3 0.3 0.7
KIE Insurance 20.4% 13.7% 12.0% 11.1% 14.0% 13.4% -8.9% -15.2% -15.2% 2.1 1.0 1.4
XLV Healthcare 7.4% 9.0% 8.6% 10.6% 15.4% 14.2% -8.6% -17.1% -17.1% 1.4 0.7 1.2
IBB Biotech & Pharma 8.8% 15.5% 16.6% 20.6% 26.5% 25.1% -15.1% -39.2% -39.2% 0.8 0.3 0.7
BBH Large Biotech 9.0% 15.0% 15.3% 18.8% 24.4% 23.9% -13.4% -33.8% -33.8% 0.9 0.3 0.8
IHI HC Eq. & Supplies 8.9% 10.6% 9.9% 11.9% 15.1% 14.1% -11.6% -14.2% -14.2% 1.3 1.3 1.4
IHF HC Providers & Serv 12.7% 11.6% 10.9% 12.8% 17.2% 15.7% -8.3% -26.3% -26.3% 1.5 0.7 1.1
PPH Large Pharma 12.1% 11.9% 11.5% 13.9% 16.4% 14.7% -11.9% -29.9% -29.9% 0.2 (0.1) 0.7
XLI Industrials 6.2% 8.2% 8.9% 9.9% 14.3% 13.7% -4.0% -15.7% -15.7% 2.4 0.9 1.2
ITA Aerospace & Def 10.8% 9.6% 10.2% 11.5% 14.5% 14.4% -4.3% -17.2% -17.2% 3.5 1.3 1.7
IYT Transportation 13.5% 14.4% 13.9% 13.8% 17.6% 16.7% -8.3% -27.3% -27.3% 1.7 0.4 1.0
XLB Materials 8.4% 9.7% 10.6% 11.0% 16.8% 15.6% -4.2% -26.9% -26.9% 1.9 0.4 0.7
XME Metals & Mining 15.3% 18.3% 21.3% 25.6% 34.0% 30.0% -19.3% -66.5% -72.9% 0.9 (0.1) (0.1)
VNQ Real Estate 9.4% 11.1% 10.2% 12.8% 15.2% 14.4% -10.0% -17.2% -18.0% 0.0 0.6 0.7
VGT Technology 10.7% 11.7% 12.3% 11.5% 15.8% 14.8% -5.2% -16.4% -16.4% 2.4 1.1 1.2
IGN Comm. Equipment 13.1% 13.6% 15.0% 14.3% 17.7% 17.3% -8.3% -24.9% -24.9% 0.9 0.6 0.7
FDN Int. Software & Serv. 11.9% 14.0% 14.2% 13.3% 18.0% 18.0% -6.5% -25.8% -25.8% 1.9 1.1 1.2
SMH Semiconductors 17.0% 16.2% 17.4% 16.9% 20.8% 19.0% -9.1% -23.7% -23.7% 2.1 1.1 1.4
IGV Software 11.5% 13.7% 14.0% 13.5% 17.5% 16.5% -5.4% -21.5% -21.5% 2.1 1.1 1.1
VOX Telecom 15.6% 13.9% 13.4% 13.8% 14.9% 13.9% -13.2% -13.3% -13.3% 0.1 0.4 0.6
XLU Utilities 11.7% 9.0% 8.4% 12.4% 15.0% 14.0% -6.9% -15.7% -15.7% 1.0 0.8 0.8
Ticker Asset ClassMax DrawdownAnnualized Volatility Sharpe (TR / Vol)
Source: Deutsche Bank, FactSet. Note: Data as of the end of last month; Calculations based on total returns; Volatility based on daily total returns annualized using a 252 day factor; Sharpe ratio calculation assumesRisk free equal to zero. For Max DD and Sharpe calculation, green cells correspond to largest value, while red cells correspond to lowest values. For Volatility calculations, green cells are the least volatile (lowest values),while red cells are the most volatile (highest values). The ETFs mentioned in this figure are provided as reference and have been selected as investable and representative vehicle for each asset class considering theproduct's asset class representation, liquidity, size, cost, and ease to borrow for tactical or risk hedging purpose; however, they should not be seen as the only or best alternative for each asset class as finding the rightproduct will depend on the specific investor's objective and intended usage. Please refer to "Product Type Definitions" on Appendix C for further details on product selection criteria depending on product usage.
Deutsche Bank Securities Inc. Page 11
24 October 2017
US ETF Compass
International Equity Allocator heatmaps
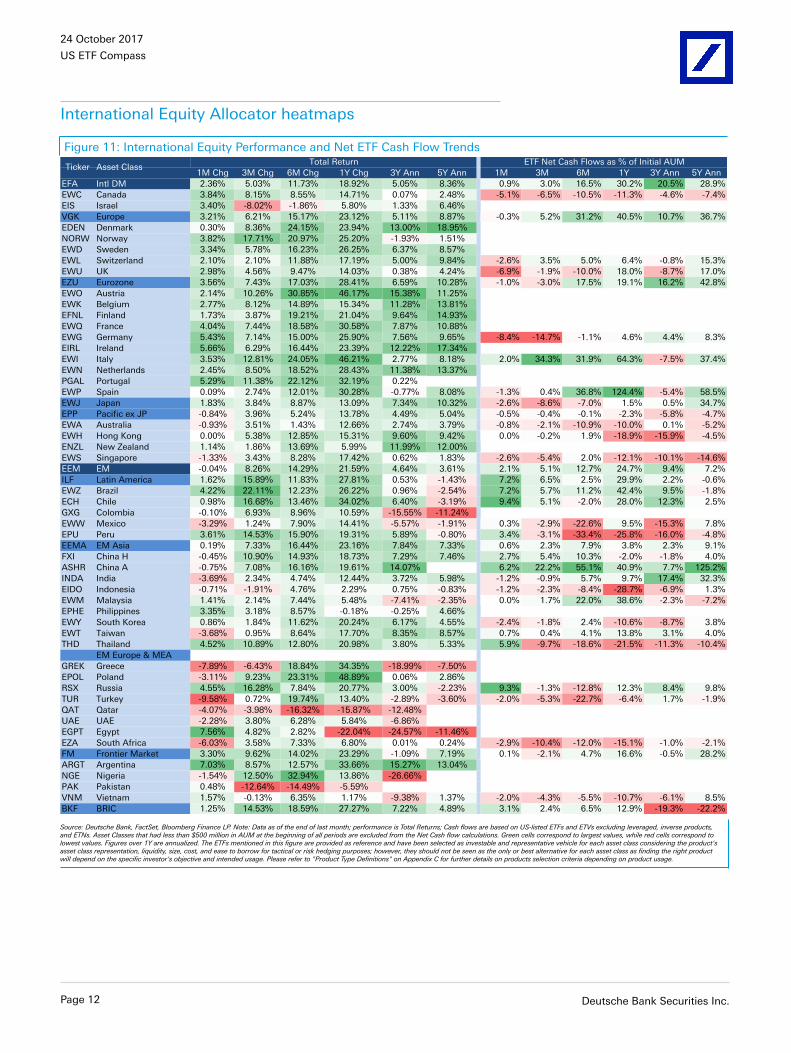
Figure 11: International Equity Performance and Net ETF Cash Flow Trends
1M Chg 3M Chg 6M Chg 1Y Chg 3Y Ann 5Y Ann 1M 3M 6M 1Y 3Y Ann 5Y Ann
EFA Intl DM 2.36% 5.03% 11.73% 18.92% 5.05% 8.36% 0.9% 3.0% 16.5% 30.2% 20.5% 28.9%
EWC Canada 3.84% 8.15% 8.55% 14.71% 0.07% 2.48% -5.1% -6.5% -10.5% -11.3% -4.6% -7.4%
EIS Israel 3.40% -8.02% -1.86% 5.80% 1.33% 6.46%
VGK Europe 3.21% 6.21% 15.17% 23.12% 5.11% 8.87% -0.3% 5.2% 31.2% 40.5% 10.7% 36.7%
EDEN Denmark 0.30% 8.36% 24.15% 23.94% 13.00% 18.95%
NORW Norway 3.82% 17.71% 20.97% 25.20% -1.93% 1.51%
EWD Sweden 3.34% 5.78% 16.23% 26.25% 6.37% 8.57%
EWL Switzerland 2.10% 2.10% 11.88% 17.19% 5.00% 9.84% -2.6% 3.5% 5.0% 6.4% -0.8% 15.3%
EWU UK 2.98% 4.56% 9.47% 14.03% 0.38% 4.24% -6.9% -1.9% -10.0% 18.0% -8.7% 17.0%
EZU Eurozone 3.56% 7.43% 17.03% 28.41% 6.59% 10.28% -1.0% -3.0% 17.5% 19.1% 16.2% 42.8%
EWO Austria 2.14% 10.26% 30.85% 46.17% 15.38% 11.25%
EWK Belgium 2.77% 8.12% 14.89% 15.34% 11.28% 13.81%
EFNL Finland 1.73% 3.87% 19.21% 21.04% 9.64% 14.93%
EWQ France 4.04% 7.44% 18.58% 30.58% 7.87% 10.88%
EWG Germany 5.43% 7.14% 15.00% 25.90% 7.56% 9.65% -8.4% -14.7% -1.1% 4.6% 4.4% 8.3%
EIRL Ireland 5.66% 6.29% 16.44% 23.39% 12.22% 17.34%
EWI Italy 3.53% 12.81% 24.05% 46.21% 2.77% 8.18% 2.0% 34.3% 31.9% 64.3% -7.5% 37.4%
EWN Netherlands 2.45% 8.50% 18.52% 28.43% 11.38% 13.37%
PGAL Portugal 5.29% 11.38% 22.12% 32.19% 0.22%
EWP Spain 0.09% 2.74% 12.01% 30.28% -0.77% 8.08% -1.3% 0.4% 36.8% 124.4% -5.4% 58.5%
EWJ Japan 1.83% 3.84% 8.87% 13.09% 7.34% 10.32% -2.6% -8.6% -7.0% 1.5% 0.5% 34.7%
EPP Pacific ex JP -0.84% 3.96% 5.24% 13.78% 4.49% 5.04% -0.5% -0.4% -0.1% -2.3% -5.8% -4.7%
EWA Australia -0.93% 3.51% 1.43% 12.66% 2.74% 3.79% -0.8% -2.1% -10.9% -10.0% 0.1% -5.2%
EWH Hong Kong 0.00% 5.38% 12.85% 15.31% 9.60% 9.42% 0.0% -0.2% 1.9% -18.9% -15.9% -4.5%
ENZL New Zealand 1.14% 1.86% 13.69% 5.99% 11.99% 12.00%
EWS Singapore -1.33% 3.43% 8.28% 17.42% 0.62% 1.83% -2.6% -5.4% 2.0% -12.1% -10.1% -14.6%
EEM EM -0.04% 8.26% 14.29% 21.59% 4.64% 3.61% 2.1% 5.1% 12.7% 24.7% 9.4% 7.2%
ILF Latin America 1.62% 15.89% 11.83% 27.81% 0.53% -1.43% 7.2% 6.5% 2.5% 29.9% 2.2% -0.6%
EWZ Brazil 4.22% 22.11% 12.23% 26.22% 0.96% -2.54% 7.2% 5.7% 11.2% 42.4% 9.5% -1.8%
ECH Chile 0.98% 16.68% 13.46% 34.02% 6.40% -3.19% 9.4% 5.1% -2.0% 28.0% 12.3% 2.5%
GXG Colombia -0.10% 6.93% 8.96% 10.59% -15.55% -11.24%
EWW Mexico -3.29% 1.24% 7.90% 14.41% -5.57% -1.91% 0.3% -2.9% -22.6% 9.5% -15.3% 7.8%
EPU Peru 3.61% 14.53% 15.90% 19.31% 5.89% -0.80% 3.4% -3.1% -33.4% -25.8% -16.0% -4.8%
EEMA EM Asia 0.19% 7.33% 16.44% 23.16% 7.84% 7.33% 0.6% 2.3% 7.9% 3.8% 2.3% 9.1%
FXI China H -0.45% 10.90% 14.93% 18.73% 7.29% 7.46% 2.7% 5.4% 10.3% -2.0% -1.8% 4.0%
ASHR China A -0.75% 7.08% 16.16% 19.61% 14.07% 6.2% 22.2% 55.1% 40.9% 7.7% 125.2%
INDA India -3.69% 2.34% 4.74% 12.44% 3.72% 5.98% -1.2% -0.9% 5.7% 9.7% 17.4% 32.3%
EIDO Indonesia -0.71% -1.91% 4.76% 2.29% 0.75% -0.83% -1.2% -2.3% -8.4% -28.7% -6.9% 1.3%
EWM Malaysia 1.41% 2.14% 7.44% 5.48% -7.41% -2.35% 0.0% 1.7% 22.0% 38.6% -2.3% -7.2%
EPHE Philippines 3.35% 3.18% 8.57% -0.18% -0.25% 4.66%
EWY South Korea 0.86% 1.84% 11.62% 20.24% 6.17% 4.55% -2.4% -1.8% 2.4% -10.6% -8.7% 3.8%
EWT Taiwan -3.68% 0.95% 8.64% 17.70% 8.35% 8.57% 0.7% 0.4% 4.1% 13.8% 3.1% 4.0%
THD Thailand 4.52% 10.89% 12.80% 20.98% 3.80% 5.33% 5.9% -9.7% -18.6% -21.5% -11.3% -10.4%
EM Europe & MEA
GREK Greece -7.89% -6.43% 18.84% 34.35% -18.99% -7.50%
EPOL Poland -3.11% 9.23% 23.31% 48.89% 0.06% 2.86%
RSX Russia 4.55% 16.28% 7.84% 20.77% 3.00% -2.23% 9.3% -1.3% -12.8% 12.3% 8.4% 9.8%
TUR Turkey -9.58% 0.72% 19.74% 13.40% -2.89% -3.60% -2.0% -5.3% -22.7% -6.4% 1.7% -1.9%
QAT Qatar -4.07% -3.98% -16.32% -15.87% -12.48%
UAE UAE -2.28% 3.80% 6.28% 5.84% -6.86%
EGPT Egypt 7.56% 4.82% 2.82% -22.04% -24.57% -11.46%
EZA South Africa -6.03% 3.58% 7.33% 6.80% 0.01% 0.24% -2.9% -10.4% -12.0% -15.1% -1.0% -2.1%
FM Frontier Market 3.30% 9.62% 14.02% 23.29% -1.09% 7.19% 0.1% -2.1% 4.7% 16.6% -0.5% 28.2%
ARGT Argentina 7.03% 8.57% 12.57% 33.66% 15.27% 13.04%
NGE Nigeria -1.54% 12.50% 32.94% 13.86% -26.66%
PAK Pakistan 0.48% -12.64% -14.49% -5.59%
VNM Vietnam 1.57% -0.13% 6.35% 1.17% -9.38% 1.37% -2.0% -4.3% -5.5% -10.7% -6.1% 8.5%
BKF BRIC 1.25% 14.53% 18.59% 27.27% 7.22% 4.89% 3.1% 2.4% 6.5% 12.9% -19.3% -22.2%
Ticker Asset ClassTotal Return ETF Net Cash Flows as % of Initial AUM
Source: Deutsche Bank, FactSet, Bloomberg Finance LP. Note: Data as of the end of last month; performance is Total Returns; Cash flows are based on US-listed ETFs and ETVs excluding leveraged, inverse products,and ETNs. Asset Classes that had less than $500 million in AUM at the beginning of all periods are excluded from the Net Cash flow calculations. Green cells correspond to largest values, while red cells correspond tolowest values. Figures over 1Y are annualized. The ETFs mentioned in this figure are provided as reference and have been selected as investable and representative vehicle for each asset class considering the product'sasset class representation, liquidity, size, cost, and ease to borrow for tactical or risk hedging purposes; however, they should not be seen as the only or best alternative for each asset class as finding the right productwill depend on the specific investor's objective and intended usage. Please refer to "Product Type Definitions" on Appendix C for further details on products selection criteria depending on product usage.
Page 12 Deutsche Bank Securities Inc.
24 October 2017
US ETF Compass
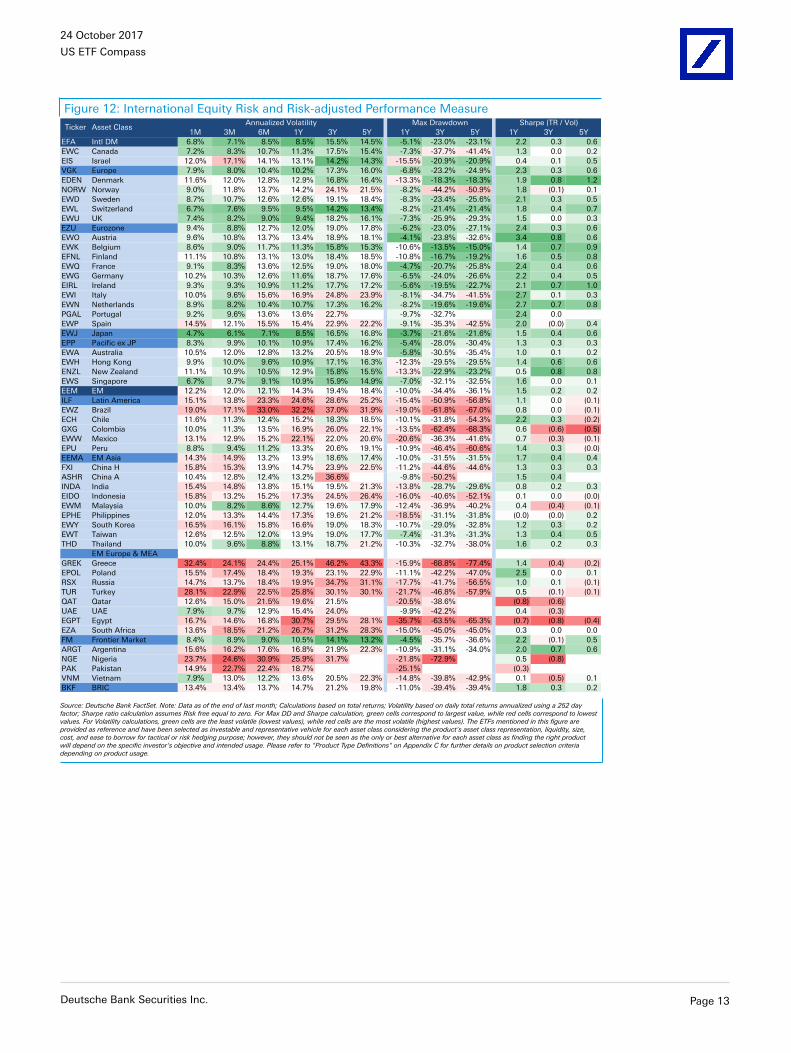
Figure 12: International Equity Risk and Risk-adjusted Performance Measure
1M 3M 6M 1Y 3Y 5Y 1Y 3Y 5Y 1Y 3Y 5Y
EFA Intl DM 6.8% 7.1% 8.5% 8.5% 15.5% 14.5% -5.1% -23.0% -23.1% 2.2 0.3 0.6
EWC Canada 7.2% 8.3% 10.7% 11.3% 17.5% 15.4% -7.3% -37.7% -41.4% 1.3 0.0 0.2
EIS Israel 12.0% 17.1% 14.1% 13.1% 14.2% 14.3% -15.5% -20.9% -20.9% 0.4 0.1 0.5
VGK Europe 7.9% 8.0% 10.4% 10.2% 17.3% 16.0% -6.8% -23.2% -24.9% 2.3 0.3 0.6
EDEN Denmark 11.6% 12.0% 12.8% 12.9% 16.8% 16.4% -13.3% -18.3% -18.3% 1.9 0.8 1.2
NORW Norway 9.0% 11.8% 13.7% 14.2% 24.1% 21.5% -8.2% -44.2% -50.9% 1.8 (0.1) 0.1
EWD Sweden 8.7% 10.7% 12.6% 12.6% 19.1% 18.4% -8.3% -23.4% -25.6% 2.1 0.3 0.5
EWL Switzerland 6.7% 7.6% 9.5% 9.5% 14.2% 13.4% -8.2% -21.4% -21.4% 1.8 0.4 0.7
EWU UK 7.4% 8.2% 9.0% 9.4% 18.2% 16.1% -7.3% -25.9% -29.3% 1.5 0.0 0.3
EZU Eurozone 9.4% 8.8% 12.7% 12.0% 19.0% 17.8% -6.2% -23.0% -27.1% 2.4 0.3 0.6
EWO Austria 9.6% 10.8% 13.7% 13.4% 18.9% 18.1% -4.1% -23.8% -32.6% 3.4 0.8 0.6
EWK Belgium 8.6% 9.0% 11.7% 11.3% 15.8% 15.3% -10.6% -13.5% -15.0% 1.4 0.7 0.9
EFNL Finland 11.1% 10.8% 13.1% 13.0% 18.4% 18.5% -10.8% -16.7% -19.2% 1.6 0.5 0.8
EWQ France 9.1% 8.3% 13.6% 12.5% 19.0% 18.0% -4.7% -20.7% -25.8% 2.4 0.4 0.6
EWG Germany 10.2% 10.3% 12.6% 11.6% 18.7% 17.6% -6.5% -24.0% -26.6% 2.2 0.4 0.5
EIRL Ireland 9.3% 9.3% 10.9% 11.2% 17.7% 17.2% -5.6% -19.5% -22.7% 2.1 0.7 1.0
EWI Italy 10.0% 9.6% 15.6% 16.9% 24.8% 23.9% -8.1% -34.7% -41.5% 2.7 0.1 0.3
EWN Netherlands 8.9% 8.2% 10.4% 10.7% 17.3% 16.2% -8.2% -19.6% -19.6% 2.7 0.7 0.8
PGAL Portugal 9.2% 9.6% 13.6% 13.6% 22.7% -9.7% -32.7% 2.4 0.0
EWP Spain 14.5% 12.1% 15.5% 15.4% 22.9% 22.2% -9.1% -35.3% -42.5% 2.0 (0.0) 0.4
EWJ Japan 4.7% 6.1% 7.1% 8.5% 16.5% 16.8% -3.7% -21.6% -21.6% 1.5 0.4 0.6
EPP Pacific ex JP 8.3% 9.9% 10.1% 10.9% 17.4% 16.2% -5.4% -28.0% -30.4% 1.3 0.3 0.3
EWA Australia 10.5% 12.0% 12.8% 13.2% 20.5% 18.9% -5.8% -30.5% -35.4% 1.0 0.1 0.2
EWH Hong Kong 9.9% 10.0% 9.6% 10.9% 17.1% 16.3% -12.3% -29.5% -29.5% 1.4 0.6 0.6
ENZL New Zealand 11.1% 10.9% 10.5% 12.9% 15.8% 15.5% -13.3% -22.9% -23.2% 0.5 0.8 0.8
EWS Singapore 6.7% 9.7% 9.1% 10.9% 15.9% 14.9% -7.0% -32.1% -32.5% 1.6 0.0 0.1
EEM EM 12.2% 12.0% 12.1% 14.3% 19.4% 18.4% -10.0% -34.4% -36.1% 1.5 0.2 0.2
ILF Latin America 15.1% 13.8% 23.3% 24.6% 28.6% 25.2% -15.4% -50.9% -56.8% 1.1 0.0 (0.1)
EWZ Brazil 19.0% 17.1% 33.0% 32.2% 37.0% 31.9% -19.0% -61.8% -67.0% 0.8 0.0 (0.1)
ECH Chile 11.6% 11.3% 12.4% 15.2% 18.3% 18.5% -10.1% -31.8% -54.3% 2.2 0.3 (0.2)
GXG Colombia 10.0% 11.3% 13.5% 16.9% 26.0% 22.1% -13.5% -62.4% -68.3% 0.6 (0.6) (0.5)
EWW Mexico 13.1% 12.9% 15.2% 22.1% 22.0% 20.6% -20.6% -36.3% -41.6% 0.7 (0.3) (0.1)
EPU Peru 8.8% 9.4% 11.2% 13.3% 20.6% 19.1% -10.9% -46.4% -60.6% 1.4 0.3 (0.0)
EEMA EM Asia 14.3% 14.9% 13.2% 13.9% 18.6% 17.4% -10.0% -31.5% -31.5% 1.7 0.4 0.4
FXI China H 15.8% 15.3% 13.9% 14.7% 23.9% 22.5% -11.2% -44.6% -44.6% 1.3 0.3 0.3
ASHR China A 10.4% 12.8% 12.4% 13.2% 36.6% -9.8% -50.2% 1.5 0.4
INDA India 15.4% 14.8% 13.8% 15.1% 19.5% 21.3% -13.8% -28.7% -29.6% 0.8 0.2 0.3
EIDO Indonesia 15.8% 13.2% 15.2% 17.3% 24.5% 26.4% -16.0% -40.6% -52.1% 0.1 0.0 (0.0)
EWM Malaysia 10.0% 8.2% 8.6% 12.7% 19.6% 17.9% -12.4% -36.9% -40.2% 0.4 (0.4) (0.1)
EPHE Philippines 12.0% 13.3% 14.4% 17.3% 19.6% 21.2% -18.5% -31.1% -31.8% (0.0) (0.0) 0.2
EWY South Korea 16.5% 16.1% 15.8% 16.6% 19.0% 18.3% -10.7% -29.0% -32.8% 1.2 0.3 0.2
EWT Taiwan 12.6% 12.5% 12.0% 13.9% 19.0% 17.7% -7.4% -31.3% -31.3% 1.3 0.4 0.5
THD Thailand 10.0% 9.6% 8.8% 13.1% 18.7% 21.2% -10.3% -32.7% -38.0% 1.6 0.2 0.3
EM Europe & MEA
GREK Greece 32.4% 24.1% 24.4% 25.1% 46.2% 43.3% -15.9% -68.8% -77.4% 1.4 (0.4) (0.2)
EPOL Poland 15.5% 17.4% 18.4% 19.3% 23.1% 22.9% -11.1% -42.2% -47.0% 2.5 0.0 0.1
RSX Russia 14.7% 13.7% 18.4% 19.9% 34.7% 31.1% -17.7% -41.7% -56.5% 1.0 0.1 (0.1)
TUR Turkey 28.1% 22.9% 22.5% 25.8% 30.1% 30.1% -21.7% -46.8% -57.9% 0.5 (0.1) (0.1)
QAT Qatar 12.6% 15.0% 21.5% 19.6% 21.5% -20.5% -38.6% (0.8) (0.6)
UAE UAE 7.9% 9.7% 12.9% 15.4% 24.0% -9.9% -42.2% 0.4 (0.3)
EGPT Egypt 16.7% 14.6% 16.8% 30.7% 29.5% 28.1% -35.7% -63.5% -65.3% (0.7) (0.8) (0.4)
EZA South Africa 13.6% 18.5% 21.2% 26.7% 31.2% 28.3% -15.0% -45.0% -45.0% 0.3 0.0 0.0
FM Frontier Market 8.4% 8.9% 9.0% 10.5% 14.1% 13.2% -4.5% -35.7% -36.6% 2.2 (0.1) 0.5
ARGT Argentina 15.6% 16.2% 17.6% 16.8% 21.9% 22.3% -10.9% -31.1% -34.0% 2.0 0.7 0.6
NGE Nigeria 23.7% 24.6% 30.9% 25.9% 31.7% -21.8% -72.9% 0.5 (0.8)
PAK Pakistan 14.9% 22.7% 22.4% 18.7% -25.1% (0.3)
VNM Vietnam 7.9% 13.0% 12.2% 13.6% 20.5% 22.3% -14.8% -39.8% -42.9% 0.1 (0.5) 0.1
BKF BRIC 13.4% 13.4% 13.7% 14.7% 21.2% 19.8% -11.0% -39.4% -39.4% 1.8 0.3 0.2
Ticker Asset ClassAnnualized Volatility Max Drawdown Sharpe (TR / Vol)
Source: Deutsche Bank FactSet. Note: Data as of the end of last month; Calculations based on total returns; Volatility based on daily total returns annualized using a 252 dayfactor; Sharpe ratio calculation assumes Risk free equal to zero. For Max DD and Sharpe calculation, green cells correspond to largest value, while red cells correspond to lowestvalues. For Volatility calculations, green cells are the least volatile (lowest values), while red cells are the most volatile (highest values). The ETFs mentioned in this figure areprovided as reference and have been selected as investable and representative vehicle for each asset class considering the product's asset class representation, liquidity, size,cost, and ease to borrow for tactical or risk hedging purpose; however, they should not be seen as the only or best alternative for each asset class as finding the right productwill depend on the specific investor's objective and intended usage. Please refer to "Product Type Definitions" on Appendix C for further details on product selection criteriadepending on product usage.
Deutsche Bank Securities Inc. Page 13
Pag
e 14
Deu
tsche B
ank S
ecurities In
c.
Cross Asset Correlations
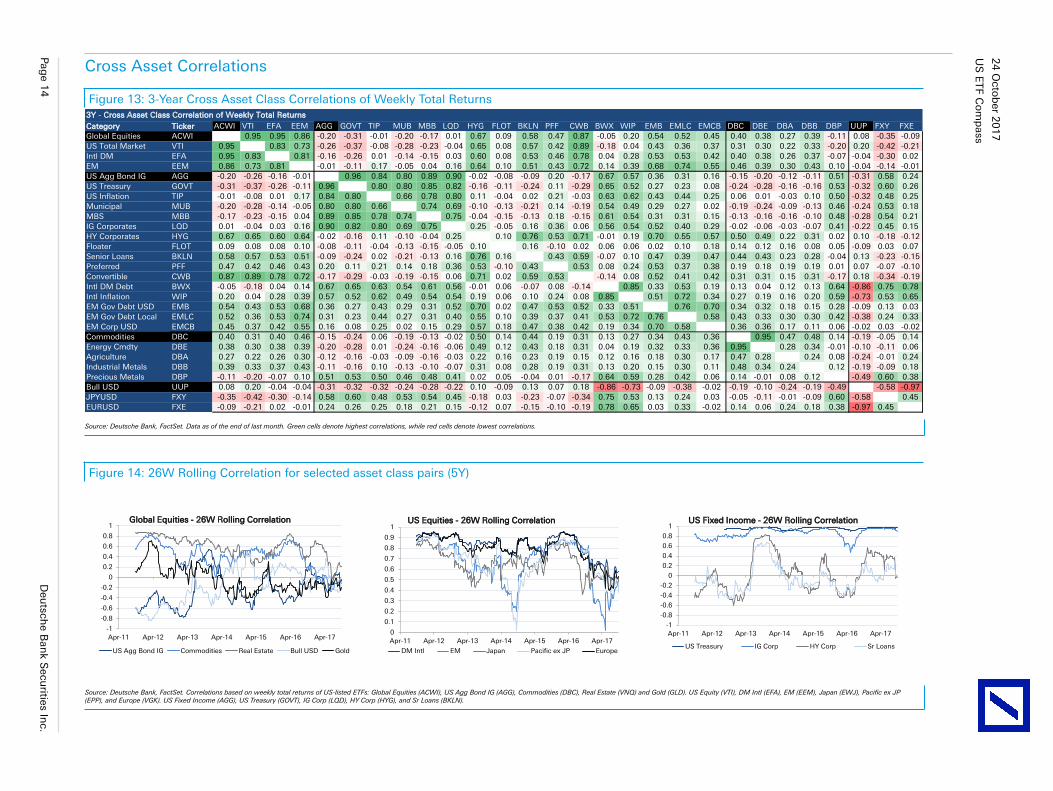
Figure 13: 3-Year Cross Asset Class Correlations of Weekly Total Returns3Y - Cross Asset Class Correlation of Weekly Total Returns
Category Ticker ACWI VTI EFA EEM AGG GOVT TIP MUB MBB LQD HYG FLOT BKLN PFF CWB BWX WIP EMB EMLC EMCB DBC DBE DBA DBB DBP UUP FXY FXE
Global Equities ACWI 0.95 0.95 0.86 -0.20 -0.31 -0.01 -0.20 -0.17 0.01 0.67 0.09 0.58 0.47 0.87 -0.05 0.20 0.54 0.52 0.45 0.40 0.38 0.27 0.39 -0.11 0.08 -0.35 -0.09
US Total Market VTI 0.95 0.83 0.73 -0.26 -0.37 -0.08 -0.28 -0.23 -0.04 0.65 0.08 0.57 0.42 0.89 -0.18 0.04 0.43 0.36 0.37 0.31 0.30 0.22 0.33 -0.20 0.20 -0.42 -0.21
Intl DM EFA 0.95 0.83 0.81 -0.16 -0.26 0.01 -0.14 -0.15 0.03 0.60 0.08 0.53 0.46 0.78 0.04 0.28 0.53 0.53 0.42 0.40 0.38 0.26 0.37 -0.07 -0.04 -0.30 0.02
EM EEM 0.86 0.73 0.81 -0.01 -0.11 0.17 -0.05 0.04 0.16 0.64 0.10 0.51 0.43 0.72 0.14 0.39 0.68 0.74 0.55 0.46 0.39 0.30 0.43 0.10 -0.04 -0.14 -0.01
US Agg Bond IG AGG -0.20 -0.26 -0.16 -0.01 0.96 0.84 0.80 0.89 0.90 -0.02 -0.08 -0.09 0.20 -0.17 0.67 0.57 0.36 0.31 0.16 -0.15 -0.20 -0.12 -0.11 0.51 -0.31 0.58 0.24
US Treasury GOVT -0.31 -0.37 -0.26 -0.11 0.96 0.80 0.80 0.85 0.82 -0.16 -0.11 -0.24 0.11 -0.29 0.65 0.52 0.27 0.23 0.08 -0.24 -0.28 -0.16 -0.16 0.53 -0.32 0.60 0.26
US Inflation TIP -0.01 -0.08 0.01 0.17 0.84 0.80 0.66 0.78 0.80 0.11 -0.04 0.02 0.21 -0.03 0.63 0.62 0.43 0.44 0.25 0.06 0.01 -0.03 0.10 0.50 -0.32 0.48 0.25
Municipal MUB -0.20 -0.28 -0.14 -0.05 0.80 0.80 0.66 0.74 0.69 -0.10 -0.13 -0.21 0.14 -0.19 0.54 0.49 0.29 0.27 0.02 -0.19 -0.24 -0.09 -0.13 0.46 -0.24 0.53 0.18
MBS MBB -0.17 -0.23 -0.15 0.04 0.89 0.85 0.78 0.74 0.75 -0.04 -0.15 -0.13 0.18 -0.15 0.61 0.54 0.31 0.31 0.15 -0.13 -0.16 -0.16 -0.10 0.48 -0.28 0.54 0.21
IG Corporates LQD 0.01 -0.04 0.03 0.16 0.90 0.82 0.80 0.69 0.75 0.25 -0.05 0.16 0.36 0.06 0.56 0.54 0.52 0.40 0.29 -0.02 -0.06 -0.03 -0.07 0.41 -0.22 0.45 0.15
HY Corporates HYG 0.67 0.65 0.60 0.64 -0.02 -0.16 0.11 -0.10 -0.04 0.25 0.10 0.76 0.53 0.71 -0.01 0.19 0.70 0.55 0.57 0.50 0.49 0.22 0.31 0.02 0.10 -0.18 -0.12
Floater FLOT 0.09 0.08 0.08 0.10 -0.08 -0.11 -0.04 -0.13 -0.15 -0.05 0.10 0.16 -0.10 0.02 0.06 0.06 0.02 0.10 0.18 0.14 0.12 0.16 0.08 0.05 -0.09 0.03 0.07
Senior Loans BKLN 0.58 0.57 0.53 0.51 -0.09 -0.24 0.02 -0.21 -0.13 0.16 0.76 0.16 0.43 0.59 -0.07 0.10 0.47 0.39 0.47 0.44 0.43 0.23 0.28 -0.04 0.13 -0.23 -0.15
Preferred PFF 0.47 0.42 0.46 0.43 0.20 0.11 0.21 0.14 0.18 0.36 0.53 -0.10 0.43 0.53 0.08 0.24 0.53 0.37 0.38 0.19 0.18 0.19 0.19 0.01 0.07 -0.07 -0.10
Convertible CWB 0.87 0.89 0.78 0.72 -0.17 -0.29 -0.03 -0.19 -0.15 0.06 0.71 0.02 0.59 0.53 -0.14 0.08 0.52 0.41 0.42 0.31 0.31 0.15 0.31 -0.17 0.18 -0.34 -0.19
Intl DM Debt BWX -0.05 -0.18 0.04 0.14 0.67 0.65 0.63 0.54 0.61 0.56 -0.01 0.06 -0.07 0.08 -0.14 0.85 0.33 0.53 0.19 0.13 0.04 0.12 0.13 0.64 -0.86 0.75 0.78
Intl Inflation WIP 0.20 0.04 0.28 0.39 0.57 0.52 0.62 0.49 0.54 0.54 0.19 0.06 0.10 0.24 0.08 0.85 0.51 0.72 0.34 0.27 0.19 0.16 0.20 0.59 -0.73 0.53 0.65
EM Gov Debt USD EMB 0.54 0.43 0.53 0.68 0.36 0.27 0.43 0.29 0.31 0.52 0.70 0.02 0.47 0.53 0.52 0.33 0.51 0.76 0.70 0.34 0.32 0.18 0.15 0.28 -0.09 0.13 0.03
EM Gov Debt Local EMLC 0.52 0.36 0.53 0.74 0.31 0.23 0.44 0.27 0.31 0.40 0.55 0.10 0.39 0.37 0.41 0.53 0.72 0.76 0.58 0.43 0.33 0.30 0.30 0.42 -0.38 0.24 0.33
EM Corp USD EMCB 0.45 0.37 0.42 0.55 0.16 0.08 0.25 0.02 0.15 0.29 0.57 0.18 0.47 0.38 0.42 0.19 0.34 0.70 0.58 0.36 0.36 0.17 0.11 0.06 -0.02 0.03 -0.02
Commodities DBC 0.40 0.31 0.40 0.46 -0.15 -0.24 0.06 -0.19 -0.13 -0.02 0.50 0.14 0.44 0.19 0.31 0.13 0.27 0.34 0.43 0.36 0.95 0.47 0.48 0.14 -0.19 -0.05 0.14
Energy Cmdty DBE 0.38 0.30 0.38 0.39 -0.20 -0.28 0.01 -0.24 -0.16 -0.06 0.49 0.12 0.43 0.18 0.31 0.04 0.19 0.32 0.33 0.36 0.95 0.28 0.34 -0.01 -0.10 -0.11 0.06
Agriculture DBA 0.27 0.22 0.26 0.30 -0.12 -0.16 -0.03 -0.09 -0.16 -0.03 0.22 0.16 0.23 0.19 0.15 0.12 0.16 0.18 0.30 0.17 0.47 0.28 0.24 0.08 -0.24 -0.01 0.24
Industrial Metals DBB 0.39 0.33 0.37 0.43 -0.11 -0.16 0.10 -0.13 -0.10 -0.07 0.31 0.08 0.28 0.19 0.31 0.13 0.20 0.15 0.30 0.11 0.48 0.34 0.24 0.12 -0.19 -0.09 0.18
Precious Metals DBP -0.11 -0.20 -0.07 0.10 0.51 0.53 0.50 0.46 0.48 0.41 0.02 0.05 -0.04 0.01 -0.17 0.64 0.59 0.28 0.42 0.06 0.14 -0.01 0.08 0.12 -0.49 0.60 0.38
Bull USD UUP 0.08 0.20 -0.04 -0.04 -0.31 -0.32 -0.32 -0.24 -0.28 -0.22 0.10 -0.09 0.13 0.07 0.18 -0.86 -0.73 -0.09 -0.38 -0.02 -0.19 -0.10 -0.24 -0.19 -0.49 -0.58 -0.97
JPYUSD FXY -0.35 -0.42 -0.30 -0.14 0.58 0.60 0.48 0.53 0.54 0.45 -0.18 0.03 -0.23 -0.07 -0.34 0.75 0.53 0.13 0.24 0.03 -0.05 -0.11 -0.01 -0.09 0.60 -0.58 0.45
EURUSD FXE -0.09 -0.21 0.02 -0.01 0.24 0.26 0.25 0.18 0.21 0.15 -0.12 0.07 -0.15 -0.10 -0.19 0.78 0.65 0.03 0.33 -0.02 0.14 0.06 0.24 0.18 0.38 -0.97 0.45
Source: Deutsche Bank, FactSet. Data as of the end of last month. Green cells denote highest correlations, while red cells denote lowest correlations.
Figure 14: 26W Rolling Correlation for selected asset class pairs (5Y)
-1
-0.8
-0.6
-0.4
-0.2
0
0.2
0.4
0.6
0.8
1
Apr-11 Apr-12 Apr-13 Apr-14 Apr-15 Apr-16 Apr-17
Global Equities - 26W Rolling Correlation
US Agg Bond IG Commodities Real Estate Bull USD Gold
0
0.1
0.2
0.3
0.4
0.5
0.6
0.7
0.8
0.9
1
Apr-11 Apr-12 Apr-13 Apr-14 Apr-15 Apr-16 Apr-17
US Equities - 26W Rolling Correlation
DM Intl EM Japan Pacific ex JP Europe
-1
-0.8
-0.6
-0.4
-0.2
0
0.2
0.4
0.6
0.8
1
Apr-11 Apr-12 Apr-13 Apr-14 Apr-15 Apr-16 Apr-17
US Fixed Income - 26W Rolling Correlation
US Treasury IG Corp HY Corp Sr Loans
Source: Deutsche Bank, FactSet. Correlations based on weekly total returns of US-listed ETFs: Global Equities (ACWI), US Agg Bond IG (AGG), Commodities (DBC), Real Estate (VNQ) and Gold (GLD). US Equity (VTI), DM Intl (EFA), EM (EEM), Japan (EWJ), Pacific ex JP(EPP), and Europe (VGK). US Fixed Income (AGG), US Treasury (GOVT), IG Corp (LQD), HY Corp (HYG), and Sr Loans (BKLN).
24
Octo
ber 2
017
US
ETF C
om
pass
24 October 2017
US ETF Compass
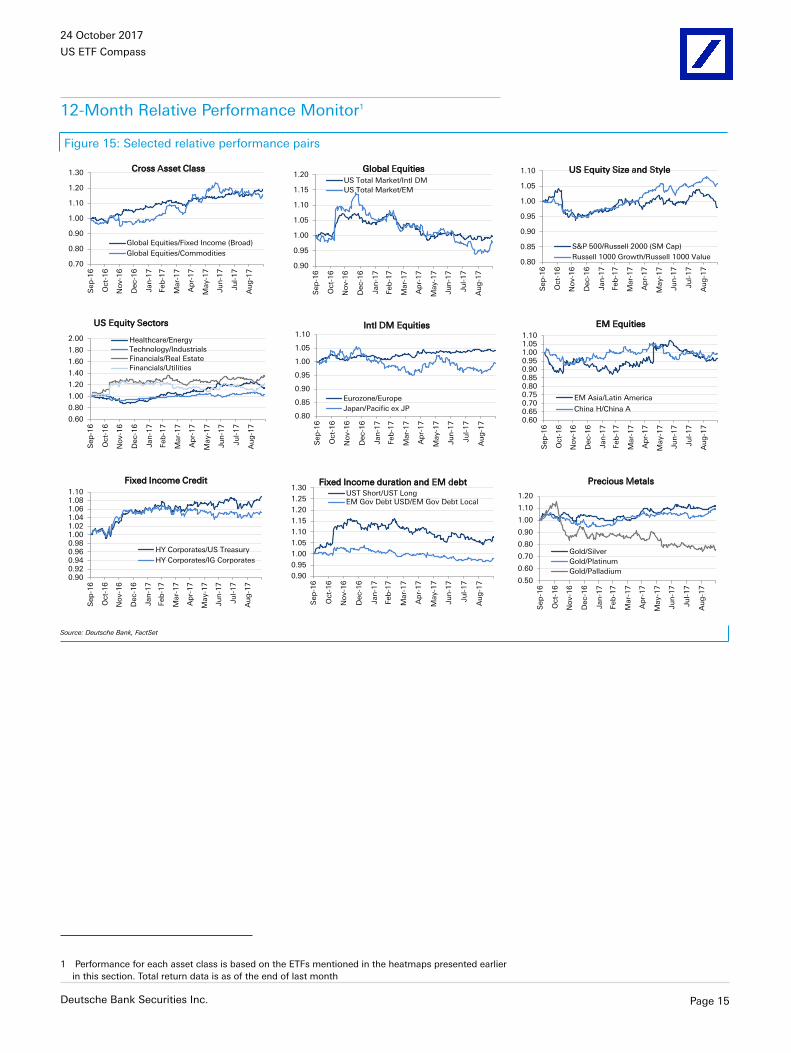
12-Month Relative Performance Monitor1
Figure 15: Selected relative performance pairs
0.60
0.80
1.00
1.20
1.40
1.60
1.80
2.00
Sep
-16
Oct-
16
No
v-1
6
Dec-1
6
Jan
-17
Feb
-17
Mar-
17
Ap
r-1
7
May-1
7
Ju
n-1
7
Ju
l-1
7
Au
g-1
7
US Equity Sectors
Healthcare/Energy
Technology/Industrials
Financials/Real Estate
Financials/Utilities
0.90
0.95
1.00
1.05
1.10
1.15
1.20
Sep
-16
Oct-
16
No
v-1
6
Dec-1
6
Jan
-17
Feb
-17
Mar-
17
Ap
r-1
7
May-1
7
Ju
n-1
7
Ju
l-1
7
Au
g-1
7
Global Equities
US Total Market/Intl DM
US Total Market/EM
0.80
0.85
0.90
0.95
1.00
1.05
1.10
Sep
-16
Oct-
16
No
v-1
6
Dec-1
6
Jan
-17
Feb
-17
Mar-
17
Ap
r-1
7
May-1
7
Ju
n-1
7
Ju
l-1
7
Au
g-1
7
Intl DM Equities
Eurozone/Europe
Japan/Pacific ex JP
0.80
0.85
0.90
0.95
1.00
1.05
1.10
Sep
-16
Oct-
16
No
v-1
6
Dec-1
6
Jan
-17
Feb
-17
Mar-
17
Ap
r-1
7
May-1
7
Ju
n-1
7
Ju
l-1
7
Au
g-1
7
US Equity Size and Style
S&P 500/Russell 2000 (SM Cap)
Russell 1000 Growth/Russell 1000 Value
0.60 0.65 0.70 0.75 0.80 0.85 0.90 0.95 1.00 1.05 1.10
Sep
-16
Oct-
16
No
v-1
6
Dec-1
6
Jan
-17
Feb
-17
Mar-
17
Ap
r-1
7
May-1
7
Ju
n-1
7
Ju
l-1
7
Au
g-1
7
EM Equities
EM Asia/Latin America
China H/China A
0.70
0.80
0.90
1.00
1.10
1.20
1.30
Sep
-16
Oct-
16
No
v-1
6
Dec-1
6
Jan
-17
Feb
-17
Mar-
17
Ap
r-1
7
May-1
7
Ju
n-1
7
Ju
l-1
7
Au
g-1
7
Cross Asset Class
Global Equities/Fixed Income (Broad)
Global Equities/Commodities
0.90 0.92 0.94 0.96 0.98 1.00 1.02 1.04 1.06 1.08 1.10
Sep
-16
Oct-
16
No
v-1
6
Dec-1
6
Jan
-17
Feb
-17
Mar-
17
Ap
r-1
7
May-1
7
Ju
n-1
7
Ju
l-1
7
Au
g-1
7
Fixed Income Credit
HY Corporates/US Treasury
HY Corporates/IG Corporates
0.50
0.60
0.70
0.80
0.90
1.00
1.10
1.20
Sep
-16
Oct-
16
No
v-1
6
Dec-1
6
Jan
-17
Feb
-17
Mar-
17
Ap
r-1
7
May-1
7
Ju
n-1
7
Ju
l-1
7
Au
g-1
7
Precious Metals
Gold/Silver
Gold/Platinum
Gold/Palladium 0.90
0.95
1.00
1.05
1.10
1.15
1.20
1.25
1.30
Sep
-16
Oct-
16
No
v-1
6
Dec-1
6
Jan
-17
Feb
-17
Mar-
17
Ap
r-1
7
May-1
7
Ju
n-1
7
Ju
l-1
7
Au
g-1
7
Fixed Income duration and EM debt
UST Short/UST Long
EM Gov Debt USD/EM Gov Debt Local
Source: Deutsche Bank, FactSet
1 Performance for each asset class is based on the ETFs mentioned in the heatmaps presented earlierin this section. Total return data is as of the end of last month
Deutsche Bank Securities Inc. Page 15
24 October 2017
US ETF Compass
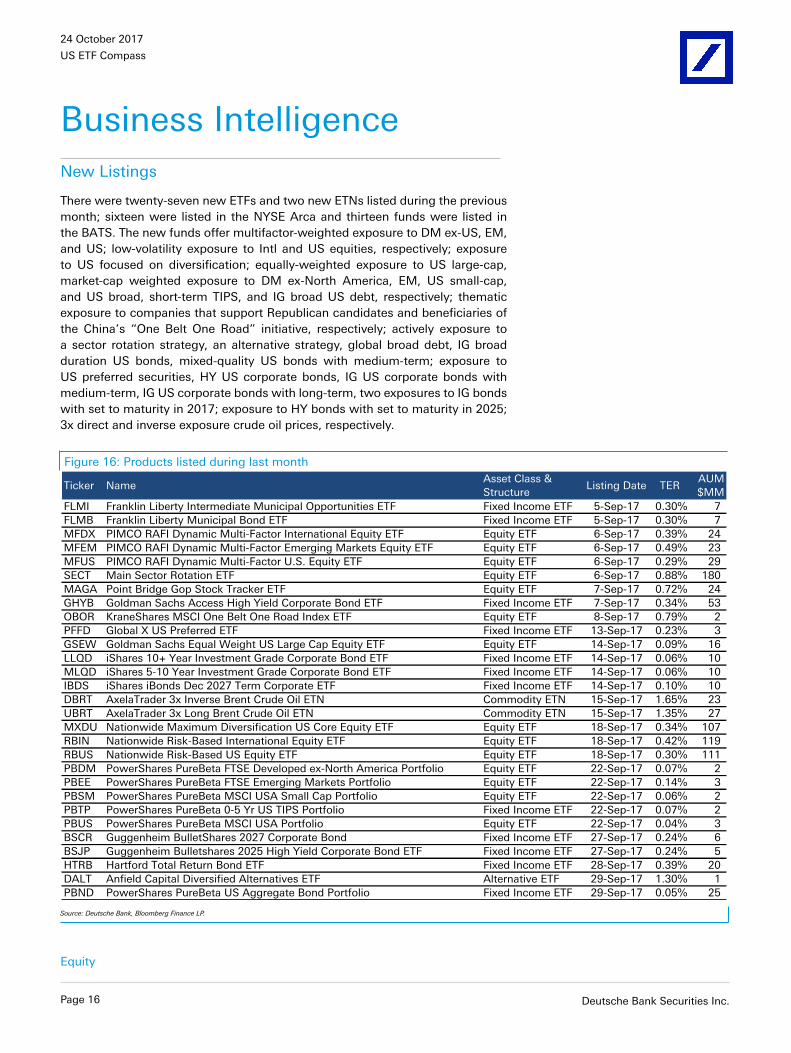
Business IntelligenceNew Listings
There were twenty-seven new ETFs and two new ETNs listed during the previousmonth; sixteen were listed in the NYSE Arca and thirteen funds were listed inthe BATS. The new funds offer multifactor-weighted exposure to DM ex-US, EM,and US; low-volatility exposure to Intl and US equities, respectively; exposureto US focused on diversification; equally-weighted exposure to US large-cap,market-cap weighted exposure to DM ex-North America, EM, US small-cap,and US broad, short-term TIPS, and IG broad US debt, respectively; thematicexposure to companies that support Republican candidates and beneficiaries ofthe China’s “One Belt One Road” initiative, respectively; actively exposure toa sector rotation strategy, an alternative strategy, global broad debt, IG broadduration US bonds, mixed-quality US bonds with medium-term; exposure toUS preferred securities, HY US corporate bonds, IG US corporate bonds withmedium-term, IG US corporate bonds with long-term, two exposures to IG bondswith set to maturity in 2017; exposure to HY bonds with set to maturity in 2025;3x direct and inverse exposure crude oil prices, respectively.
Figure 16: Products listed during last month
Ticker NameAsset Class &
StructureListing Date TER
AUM
$MM
FLMI Franklin Liberty Intermediate Municipal Opportunities ETF Fixed Income ETF 5-Sep-17 0.30% 7
FLMB Franklin Liberty Municipal Bond ETF Fixed Income ETF 5-Sep-17 0.30% 7
MFDX PIMCO RAFI Dynamic Multi-Factor International Equity ETF Equity ETF 6-Sep-17 0.39% 24
MFEM PIMCO RAFI Dynamic Multi-Factor Emerging Markets Equity ETF Equity ETF 6-Sep-17 0.49% 23
MFUS PIMCO RAFI Dynamic Multi-Factor U.S. Equity ETF Equity ETF 6-Sep-17 0.29% 29
SECT Main Sector Rotation ETF Equity ETF 6-Sep-17 0.88% 180
MAGA Point Bridge Gop Stock Tracker ETF Equity ETF 7-Sep-17 0.72% 24
GHYB Goldman Sachs Access High Yield Corporate Bond ETF Fixed Income ETF 7-Sep-17 0.34% 53
OBOR KraneShares MSCI One Belt One Road Index ETF Equity ETF 8-Sep-17 0.79% 2
PFFD Global X US Preferred ETF Fixed Income ETF 13-Sep-17 0.23% 3
GSEW Goldman Sachs Equal Weight US Large Cap Equity ETF Equity ETF 14-Sep-17 0.09% 16
LLQD iShares 10+ Year Investment Grade Corporate Bond ETF Fixed Income ETF 14-Sep-17 0.06% 10
MLQD iShares 5-10 Year Investment Grade Corporate Bond ETF Fixed Income ETF 14-Sep-17 0.06% 10
IBDS iShares iBonds Dec 2027 Term Corporate ETF Fixed Income ETF 14-Sep-17 0.10% 10
DBRT AxelaTrader 3x Inverse Brent Crude Oil ETN Commodity ETN 15-Sep-17 1.65% 23
UBRT AxelaTrader 3x Long Brent Crude Oil ETN Commodity ETN 15-Sep-17 1.35% 27
MXDU Nationwide Maximum Diversification US Core Equity ETF Equity ETF 18-Sep-17 0.34% 107
RBIN Nationwide Risk-Based International Equity ETF Equity ETF 18-Sep-17 0.42% 119
RBUS Nationwide Risk-Based US Equity ETF Equity ETF 18-Sep-17 0.30% 111
PBDM PowerShares PureBeta FTSE Developed ex-North America Portfolio Equity ETF 22-Sep-17 0.07% 2
PBEE PowerShares PureBeta FTSE Emerging Markets Portfolio Equity ETF 22-Sep-17 0.14% 3
PBSM PowerShares PureBeta MSCI USA Small Cap Portfolio Equity ETF 22-Sep-17 0.06% 2
PBTP PowerShares PureBeta 0-5 Yr US TIPS Portfolio Fixed Income ETF 22-Sep-17 0.07% 2
PBUS PowerShares PureBeta MSCI USA Portfolio Equity ETF 22-Sep-17 0.04% 3
BSCR Guggenheim BulletShares 2027 Corporate Bond Fixed Income ETF 27-Sep-17 0.24% 6
BSJP Guggenheim Bulletshares 2025 High Yield Corporate Bond ETF Fixed Income ETF 27-Sep-17 0.24% 5
HTRB Hartford Total Return Bond ETF Fixed Income ETF 28-Sep-17 0.39% 20
DALT Anfield Capital Diversified Alternatives ETF Alternative ETF 29-Sep-17 1.30% 1
PBND PowerShares PureBeta US Aggregate Bond Portfolio Fixed Income ETF 29-Sep-17 0.05% 25
Source: Deutsche Bank, Bloomberg Finance LP.
Equity
Page 16 Deutsche Bank Securities Inc.
24 October 2017
US ETF Compass
■ Nationwide made its debut in the ETF Market listing three new equityETFs. Two of them offer low risk exposure to International DevelopedMarkets (RBIN) and US (RBUS) equity stocks selected and weighted bylow volatility, cross-correlation, and the Sharpe ratio. RBIN tracks the RRisk-Based International Index and comes with an annual expense ratioof 0.42%; while, RBUS tracks the R Risk-Based US Index and comeswith an annual fee of 0.30%. The third fund (MXDU) offers exposure toan optimized portfolio of mid- and large-cap US stocks focused on lowvolatility and maximum diversification. The stocks during the selectionprocess are screened by minimum liquidity and socially responsibleinvestment (“SRI”) criteria, respectively. MXDU tracks the rules-basedTOBAM Maximum Diversification USA Index, and comes with an annualexpense ratio of 0.34%.
■ Main Management debuts in the ETF Market listing one new ETF (SECT)during September. The fund offers actively managed exposure to asector rotation strategy that aims to outperform the S&P 500 Index. The“fund of funds” ETF generally holds US large-cap equities; however, canhold stocks of any market-cap or geographic exposure. SECT comes withan annual expense ratio of 0.88%.
■ Point Bridge Capital debuts in the ETF Market listing one new ETF(MAGA) last month. MAGA offers thematic exposure to a portfolio of USlarge-cap companies whose employees and political action committeesare highly supportive of Republican Party candidates, and tracks theequally-weighted Point Bridge GOP Stock Tracker Index. MAGA comeswith an annual expense ratio of 0.72%.
■ PIMCO listed three new ETFs during September. The fundsoffer exposure to equity stocks from Developed Markets ex-US(MFDX), Emerging Markets (MFEM) and US (MFUS), selectedand dynamically-weighted by multi-factors, including: value, quality,volatility, momentum, and size. MFDX tracks the RAFI Dynamic Multi-Factor Developed Ex U.S. Index and comes with an annual fee of 0.39%.MFEM tracks the RAFI Dynamic Multi-Factor Emerging Markets Indexand come with a total expense ratio of 0.49%; while, MFUS tracks theRAFI Dynamic Multi-Factor U.S. Index and comes with an expense ratioof 0.29%.
■ PowerShares listed six new ETFs during last month. Four of them offermarket-cap weighted exposure to Developed Markets excluding US andCanada (PBDM), Emerging Markets (PBEE), and US focused on broad(PBUS) and small-cap (PBSM), respectively. PBDM tracks the FTSEDeveloped ex North America Index and comes with a total expense ratioof 0.07%; PBEE tracks the FTSE Emerging Index and comes with anannual expense ratio of 0.14%; PBSM tracks the MSCI USA Small Capand comes with expense ratio of 0.06%; finally, PBUS tracks the MSCIUSA Index with an annual fee of 0.04%.
■ KraneShares listed one new ETF (OBOR) which offers exposure tocompanies that potentially will be beneficiaries of the China’s OneBelt, One Road initiative. The One Belt One Road (“OBOR”) initiative,established by President Xi Jinping of China, is an extensive long-term infrastructure initiative modernizing the original Silk Road tradingroutes by land and by sea; the agreements include China and Eurasiancountries. OBOR tracks the market-cap-weighted MSCI Global China
Deutsche Bank Securities Inc. Page 17
24 October 2017
US ETF Compass
Infrastructure Exposure Index and comes with an annual expense ratioof 0.79%.
■ Goldman Sachs listed two new ETFs during September. One of them(GSEW) offers exposure to US large-cap equities. GSEW Tracks theSolactive U.S. Large Cap Equal Weighted Index and comes with anannual expense ratio of 0.09%.
Fixed Income■ Franklin Templeton Investments listed two ETFs during last month.
The funds offer actively managed exposure to intermediate-maturitymunicipal bonds of any credit quality (FLMI) and investment-grademunicipal bonds with broad-term (FLMB), respectively. The both dollar-weighted ETFs come with an annual expense ratio of 0.30%.
■ BlackRock listed three new fixed income ETFs during September. Two ofthem offer exposure to USD-denominated investment-grade corporatebonds with at least 10 years (LLQD) and 5 to 10 years (MLQD) remainingto maturity, respectively. LLQD tracks the Markit iBoxx USD LiquidInvestment Grade Long Index; while, MLQD tracks the Markit iBoxx USDLiquid Investment Grade Intermediate Index. Both ETFs come with anannual expense ratio of 0.30%. The last fund (IBDS) offers exposure toUSD-denominated, investment-grade corporate bonds maturing in 2027.IBDS tracks the Bloomberg Barclays December 2017 Maturity CorporateIndex and comes with an annual expense ratio of 0.10%.
■ PowerShares listed two new ETFs during last month. The fundsoffer market-cap weighted exposure to US Treasury inflation-protectedsecurities (PBTP) maturing in 5 year or less and to USD-denominatedinvestment-grade bonds (PBND) with broad-maturity, respectively. PBTPtracks the BofA Merrill Lynch 0-5 Year US Inflation-Linked Treasury Indexand comes with an annual expense ratio of 0.07%; meanwhile, PBNDtracks the BofA Merrill Lynch US Broad Market Index and comes with atotal expense ratio of 0.05%.
■ Guggenheim Investments listed two new fixed ETFs, offering exposureto USD-denominated investment-grade (BSCR) and high-yield (BSJP)corporate bonds maturing in 2027 and 2025, respectively. BSCR tracksthe NASDAQ BulletShares USD High Yield Corporate Bond 2027 Index;meanwhile, BSJP tracks the NASDAQ BulletShares USD High YieldCorporate Bond 2027 Index. Both funds come with an annual expenseratio of 0.24%.
■ Goldman Sachs listed one new fixed income ETF (GHYB) offeringexposure to USD-denominated high-yield corporate bonds with broadmaturity. GHYB tracks the Citi Goldman Sachs High Yield CorporateBond Index and comes with an annual expense ratio of 0.34%.
■ Global X Funds listed one new ETF (PFFD) which offers exposure toUS preferred securities. The market-value-weighted ETF tracks the BofAMerrill Lynch Diversified Core U.S. Preferred Securities Index and comeswith an annual expense ratio of 0.23%.
■ Hartford Funds listed one new ETF (HTRB) offering actively managedexposure to Global fixed income debt with at least one year to maturity.HTRB comes with annual expense ratio of 0.39%.
Page 18 Deutsche Bank Securities Inc.
24 October 2017
US ETF Compass
Commodity■ Credit Suisse listed two new ETNs during last month. The notes offer
3x direct (UBRT) and inverse (DBRT) leveraged exposure to the crudeoil prices, tracking the S&P GCI Brent Crude Oil Index. UBRT and DBRTcome with an annual expense ratio of 1.35% and 1.65%, respectively.
Alternative■ Anfield Capital debuts in the ETF Market listing one new “fund of funds”
ETF (DALT) offering actively managed exposure to alternative strategycomposed by a portfolio of four asset classes, including: equity, fixedincome, commodities, and alternative investments. DALT aims capitalgrowth and income, and comes with an annual expense ratio of 1.30%.
Deutsche Bank Securities Inc. Page 19
24 October 2017
US ETF Compass
Delistings
Figure 17: Delisted products during last month
Ticker NameAsset Class &
Structure
Delisting
dateTER
AUM at
Delisting $MM
IBMF iShares iBonds Sep 2017 Term Muni Bond ETF Fixed Income ETF 5-Sep-17 0.18% 171
SMK ProShares UltraShort MSCI Mexico Capped IMI Equity ETF 7-Sep-17 0.95% 1
KRS ProShares Short S&P Regional Banking Equity ETF 7-Sep-17 0.95% 2
KRU ProShares Ultra S&P Regional Banking Equity ETF 7-Sep-17 0.95% 8
UMX ProShares Ultra MSCI Mexico Capped IMI Equity ETF 7-Sep-17 0.95% 10
TPS ProShares UltraShort TIPS Fixed Income ETF 7-Sep-17 0.95% 1
TBZ ProShares UltraShort 3-7 Year Treasury Fixed Income ETF 7-Sep-17 0.95% 3
GGOV ProShares German Sovereign/Sub-Sovereign ETF Fixed Income ETF 7-Sep-17 0.45% 4
COBO ProShares USD Covered Bond Fixed Income ETF 7-Sep-17 0.35% 7
GDJJ ProShares Ultra Junior Miners Equity ETF 7-Sep-17 1.12% 6
UOP ProShares Ultra Oil & Gas Exploration & Production Equity ETF 7-Sep-17 0.95% 1
SOP ProShares UltraShort Oil & Gas Exploration & Production Equity ETF 7-Sep-17 0.95% 1
HGJP ProShares Hedged FTSE Japan ETF Equity ETF 7-Sep-17 0.23% 4
HGEU ProShares Hedged FTSE Europe ETF Equity ETF 7-Sep-17 0.27% 5
IMED ETFMG ETFx HealthTech ETF Equity ETF 7-Sep-17 0.75% 3
USMR Horizons USA Managed Risk ETF Equity ETF 11-Sep-17 0.50% 1
XD Elkhorn S&P MidCap Consumer Discretionary Portfolio Equity ETF 15-Sep-17 0.29% 1
XE Elkhorn S&P MidCap Energy Portfolio Equity ETF 15-Sep-17 0.29% 1
XF Elkhorn S&P MidCap Financials Portfolio Equity ETF 15-Sep-17 0.29% 1
XH Elkhorn S&P MidCap Health Care Portfolio Equity ETF 15-Sep-17 0.29% 1
XI Elkhorn S&P MidCap Industrials Portfolio Equity ETF 15-Sep-17 0.29% 1
XK Elkhorn S&P MidCap Information Technology Portfolio Equity ETF 15-Sep-17 0.29% 1
XM Elkhorn S&P MidCap Materials Portfolio Equity ETF 15-Sep-17 0.29% 1
XS Elkhorn S&P MidCap Consumer Staples Portfolio Equity ETF 15-Sep-17 0.29% 1
XU Elkhorn S&P MidCap Utilities Portfolio Equity ETF 15-Sep-17 0.29% 1
CLAW Direxion Daily Homebuilders & Supplies Bear 3X Shares Equity ETF 26-Sep-17 0.95% 1
HAKK Direxion Daily Cyber Security & IT Bull 2X Shares Equity ETF 26-Sep-17 0.80% 5
SICK Direxion Daily Healthcare Bear 3X Shares Equity ETF 26-Sep-17 0.95% 1
LABS Direxion Daily S&P Biotech Bear 1X Shares Equity ETF 26-Sep-17 0.45% 1
ERYY Direxion Daily Energy Bear 1X Shares Equity ETF 26-Sep-17 0.45% 1
FAZZ Direxion Daily Financial Bear 1X Shares Equity ETF 26-Sep-17 0.45% 2
TECZ Direxion Daily Technology Bear 1X Shares Equity ETF 26-Sep-17 0.45% 1
MELT Direxion Daily Gold Miners Index Bear 1X Shares Equity ETF 26-Sep-17 0.45% 2
EUFS Direxion Daily European Financials Bear 1X Shares Equity ETF 26-Sep-17 0.45% 2
DULL Direxion Daily Silver Miners Index Bear 2X Shares Equity ETF 26-Sep-17 0.82% 1
SPLZ Direxion Daily Consumer Staples Bear 1X Shares Equity ETF 26-Sep-17 0.45% 4
UTLZ Direxion Daily Utilities Bear 1X Shares Equity ETF 26-Sep-17 0.45% 2
FITS The Health and Fitness ETF Equity ETF 27-Sep-17 0.50% 3
Source: Deutsche Bank, Bloomberg Finance LP.
Page 20 Deutsche Bank Securities Inc.
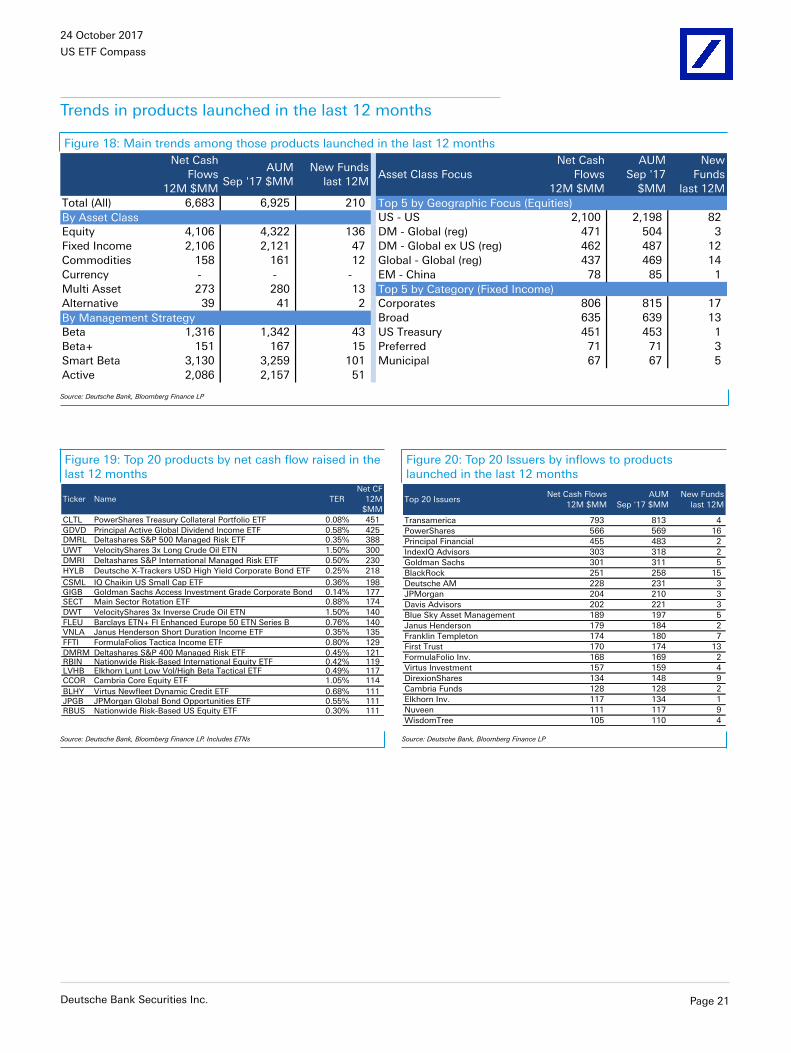
24 October 2017
US ETF Compass
Trends in products launched in the last 12 months
Figure 18: Main trends among those products launched in the last 12 months
Net Cash
Flows
12M $MM
AUM
Sep '17 $MM
New Funds
last 12MAsset Class Focus
Net Cash
Flows
12M $MM
AUM
Sep '17
$MM
New
Funds
last 12M
Total (All) 6,683 6,925 210 Top 5 by Geographic Focus (Equities)
By Asset Class US - US 2,100 2,198 82
Equity 4,106 4,322 136 DM - Global (reg) 471 504 3
Fixed Income 2,106 2,121 47 DM - Global ex US (reg) 462 487 12
Commodities 158 161 12 Global - Global (reg) 437 469 14
Currency - - - EM - China 78 85 1
Multi Asset 273 280 13 Top 5 by Category (Fixed Income)
Alternative 39 41 2 Corporates 806 815 17
By Management Strategy Broad 635 639 13
Beta 1,316 1,342 43 US Treasury 451 453 1
Beta+ 151 167 15 Preferred 71 71 3
Smart Beta 3,130 3,259 101 Municipal 67 67 5
Active 2,086 2,157 51
Source: Deutsche Bank, Bloomberg Finance LP
Figure 19: Top 20 products by net cash flow raised in thelast 12 months
Figure 20: Top 20 Issuers by inflows to productslaunched in the last 12 months
Ticker Name TER
Net CF
12M
$MM
CLTL PowerShares Treasury Collateral Portfolio ETF 0.08% 451
GDVD Principal Active Global Dividend Income ETF 0.58% 425 DMRL Deltashares S&P 500 Managed Risk ETF 0.35% 388
UWT VelocityShares 3x Long Crude Oil ETN 1.50% 300
DMRI Deltashares S&P International Managed Risk ETF 0.50% 230
HYLB Deutsche X-Trackers USD High Yield Corporate Bond ETF 0.25% 218
CSML IQ Chaikin US Small Cap ETF 0.36% 198 GIGB Goldman Sachs Access Investment Grade Corporate Bond 0.14% 177 SECT Main Sector Rotation ETF 0.88% 174
DWT VelocityShares 3x Inverse Crude Oil ETN 1.50% 140
FLEU Barclays ETN+ FI Enhanced Europe 50 ETN Series B 0.76% 140 VNLA Janus Henderson Short Duration Income ETF 0.35% 135
FFTI FormulaFolios Tactica Income ETF 0.80% 129
DMRM Deltashares S&P 400 Managed Risk ETF 0.45% 121 RBIN Nationwide Risk-Based International Equity ETF 0.42% 119 LVHB Elkhorn Lunt Low Vol/High Beta Tactical ETF 0.49% 117 CCOR Cambria Core Equity ETF 1.05% 114
BLHY Virtus Newfleet Dynamic Credit ETF 0.68% 111 JPGB JPMorgan Global Bond Opportunities ETF 0.55% 111 RBUS Nationwide Risk-Based US Equity ETF 0.30% 111
Top 20 IssuersNet Cash Flows
12M $MM
AUM
Sep '17 $MM
New Funds
last 12M
Transamerica 793 813 4
PowerShares 566 569 16
Principal Financial 455 483 2
IndexIQ Advisors 303 318 2
Goldman Sachs 301 311 5
BlackRock 251 258 15
Deutsche AM 228 231 3
JPMorgan 204 210 3
Davis Advisors 202 221 3
Blue Sky Asset Management 189 197 5
Janus Henderson 179 184 2
Franklin Templeton 174 180 7
First Trust 170 174 13
FormulaFolio Inv. 168 169 2
Virtus Investment 157 159 4
DirexionShares 134 148 9
Cambria Funds 128 128 2
Elkhorn Inv. 117 134 1
Nuveen 111 117 9
WisdomTree 105 110 4
Source: Deutsche Bank, Bloomberg Finance LP. Includes ETNs Source: Deutsche Bank, Bloomberg Finance LP
Deutsche Bank Securities Inc. Page 21
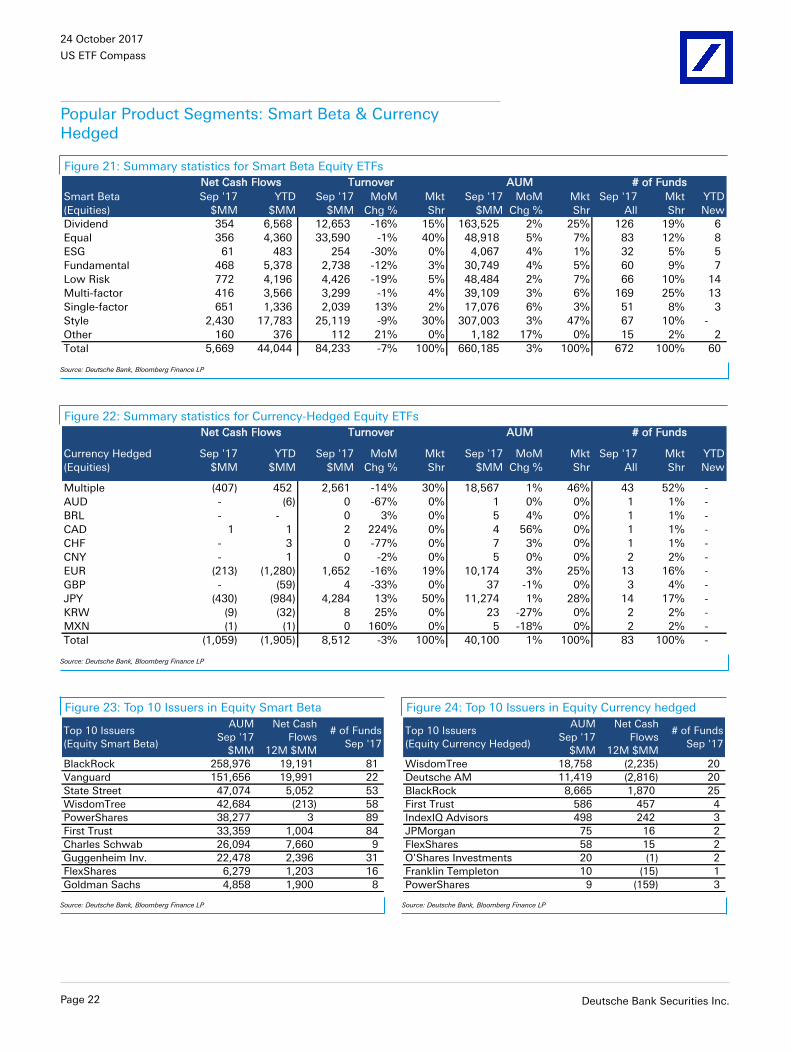
24 October 2017
US ETF Compass
Popular Product Segments: Smart Beta & CurrencyHedged
Figure 21: Summary statistics for Smart Beta Equity ETFs
Smart Beta
(Equities)
Sep '17
$MM
YTD
$MM
Sep '17
$MM
MoM
Chg %
Mkt
Shr
Sep '17
$MM
MoM
Chg %
Mkt
Shr
Sep '17
All
Mkt
Shr
YTD
New
Dividend 354 6,568 12,653 -16% 15% 163,525 2% 25% 126 19% 6
Equal 356 4,360 33,590 -1% 40% 48,918 5% 7% 83 12% 8
ESG 61 483 254 -30% 0% 4,067 4% 1% 32 5% 5
Fundamental 468 5,378 2,738 -12% 3% 30,749 4% 5% 60 9% 7
Low Risk 772 4,196 4,426 -19% 5% 48,484 2% 7% 66 10% 14
Multi-factor 416 3,566 3,299 -1% 4% 39,109 3% 6% 169 25% 13
Single-factor 651 1,336 2,039 13% 2% 17,076 6% 3% 51 8% 3
Style 2,430 17,783 25,119 -9% 30% 307,003 3% 47% 67 10% -
Other 160 376 112 21% 0% 1,182 17% 0% 15 2% 2
Total 5,669 44,044 84,233 -7% 100% 660,185 3% 100% 672 100% 60
Net Cash Flows Turnover AUM # of Funds
Source: Deutsche Bank, Bloomberg Finance LP
Figure 22: Summary statistics for Currency-Hedged Equity ETFs
Currency Hedged
(Equities)
Sep '17
$MM
YTD
$MM
Sep '17
$MM
MoM
Chg %
Mkt
Shr
Sep '17
$MM
MoM
Chg %
Mkt
Shr
Sep '17
All
Mkt
Shr
YTD
New
Multiple (407) 452 2,561 -14% 30% 18,567 1% 46% 43 52% -
AUD - (6) 0 -67% 0% 1 0% 0% 1 1% -
BRL - - 0 3% 0% 5 4% 0% 1 1% -
CAD 1 1 2 224% 0% 4 56% 0% 1 1% -
CHF - 3 0 -77% 0% 7 3% 0% 1 1% -
CNY - 1 0 -2% 0% 5 0% 0% 2 2% -
EUR (213) (1,280) 1,652 -16% 19% 10,174 3% 25% 13 16% -
GBP - (59) 4 -33% 0% 37 -1% 0% 3 4% -
JPY (430) (984) 4,284 13% 50% 11,274 1% 28% 14 17% -
KRW (9) (32) 8 25% 0% 23 -27% 0% 2 2% -
MXN (1) (1) 0 160% 0% 5 -18% 0% 2 2% -
Total (1,059) (1,905) 8,512 -3% 100% 40,100 1% 100% 83 100% -
Net Cash Flows Turnover AUM # of Funds
Source: Deutsche Bank, Bloomberg Finance LP
Figure 23: Top 10 Issuers in Equity Smart Beta Figure 24: Top 10 Issuers in Equity Currency hedged
Top 10 Issuers
(Equity Smart Beta)
AUM
Sep '17
$MM
Net Cash
Flows
12M $MM
# of Funds
Sep '17
BlackRock 258,976 19,191 81
Vanguard 151,656 19,991 22
State Street 47,074 5,052 53
WisdomTree 42,684 (213) 58
PowerShares 38,277 3 89
First Trust 33,359 1,004 84
Charles Schwab 26,094 7,660 9
Guggenheim Inv. 22,478 2,396 31
FlexShares 6,279 1,203 16
Goldman Sachs 4,858 1,900 8
Top 10 Issuers
(Equity Currency Hedged)
AUM
Sep '17
$MM
Net Cash
Flows
12M $MM
# of Funds
Sep '17
WisdomTree 18,758 (2,235) 20
Deutsche AM 11,419 (2,816) 20
BlackRock 8,665 1,870 25
First Trust 586 457 4
IndexIQ Advisors 498 242 3
JPMorgan 75 16 2
FlexShares 58 15 2
O'Shares Investments 20 (1) 2
Franklin Templeton 10 (15) 1
PowerShares 9 (159) 3
Source: Deutsche Bank, Bloomberg Finance LP Source: Deutsche Bank, Bloomberg Finance LP
Page 22 Deutsche Bank Securities Inc.
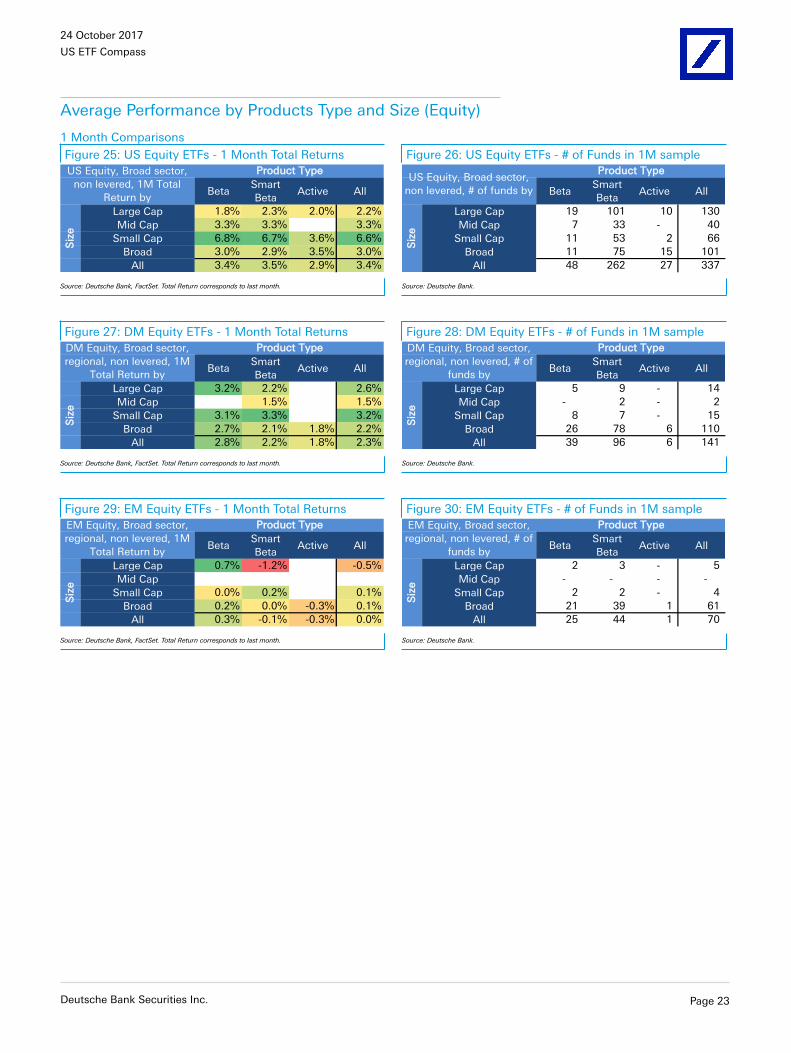
24 October 2017
US ETF Compass
Average Performance by Products Type and Size (Equity)
1 Month Comparisons
Figure 25: US Equity ETFs - 1 Month Total Returns Figure 26: US Equity ETFs - # of Funds in 1M sample
BetaSmart
BetaActive All
Large Cap 1.8% 2.3% 2.0% 2.2%
Mid Cap 3.3% 3.3% 3.3%
Small Cap 6.8% 6.7% 3.6% 6.6%
Broad 3.0% 2.9% 3.5% 3.0%
All 3.4% 3.5% 2.9% 3.4%
US Equity, Broad sector,
non levered, 1M Total
Return by
Product Type
Siz
e
BetaSmart
BetaActive All
Large Cap 19 101 10 130
Mid Cap 7 33 - 40
Small Cap 11 53 2 66
Broad 11 75 15 101
All 48 262 27 337
US Equity, Broad sector,
non levered, # of funds by
Product Type
Siz
e
Source: Deutsche Bank, FactSet. Total Return corresponds to last month. Source: Deutsche Bank.
Figure 27: DM Equity ETFs - 1 Month Total Returns Figure 28: DM Equity ETFs - # of Funds in 1M sample
BetaSmart
BetaActive All
Large Cap 3.2% 2.2% 2.6%
Mid Cap 1.5% 1.5%
Small Cap 3.1% 3.3% 3.2%
Broad 2.7% 2.1% 1.8% 2.2%
All 2.8% 2.2% 1.8% 2.3%
DM Equity, Broad sector,
regional, non levered, 1M
Total Return by
Product Type
Siz
e
BetaSmart
BetaActive All
Large Cap 5 9 - 14
Mid Cap - 2 - 2
Small Cap 8 7 - 15
Broad 26 78 6 110
All 39 96 6 141
DM Equity, Broad sector,
regional, non levered, # of
funds by
Product Type
Siz
e
Source: Deutsche Bank, FactSet. Total Return corresponds to last month. Source: Deutsche Bank.
Figure 29: EM Equity ETFs - 1 Month Total Returns Figure 30: EM Equity ETFs - # of Funds in 1M sample
BetaSmart
BetaActive All
Large Cap 0.7% -1.2% -0.5%
Mid Cap
Small Cap 0.0% 0.2% 0.1%
Broad 0.2% 0.0% -0.3% 0.1%
All 0.3% -0.1% -0.3% 0.0%
EM Equity, Broad sector,
regional, non levered, 1M
Total Return by
Product Type
Siz
e
BetaSmart
BetaActive All
Large Cap 2 3 - 5
Mid Cap - - - -
Small Cap 2 2 - 4
Broad 21 39 1 61
All 25 44 1 70
EM Equity, Broad sector,
regional, non levered, # of
funds by
Product Type
Siz
e
Source: Deutsche Bank, FactSet. Total Return corresponds to last month. Source: Deutsche Bank.
Deutsche Bank Securities Inc. Page 23
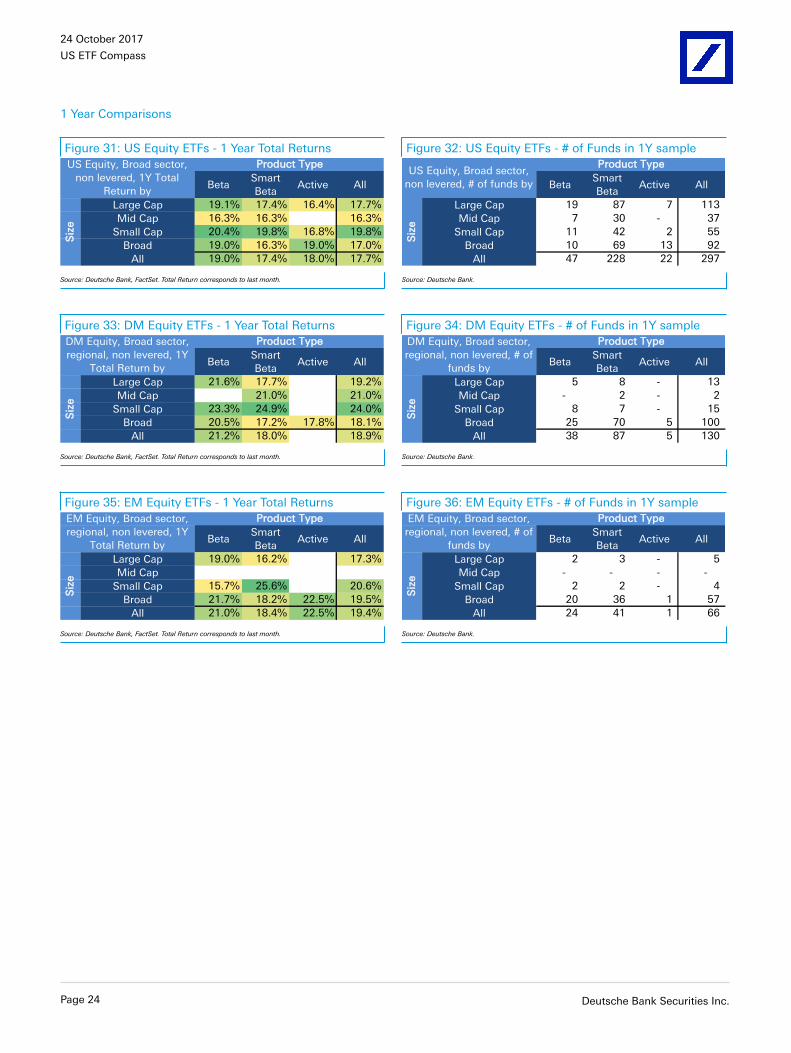
24 October 2017
US ETF Compass
1 Year Comparisons
Figure 31: US Equity ETFs - 1 Year Total Returns Figure 32: US Equity ETFs - # of Funds in 1Y sample
BetaSmart
BetaActive All
Large Cap 19.1% 17.4% 16.4% 17.7%
Mid Cap 16.3% 16.3% 16.3%
Small Cap 20.4% 19.8% 16.8% 19.8%
Broad 19.0% 16.3% 19.0% 17.0%
All 19.0% 17.4% 18.0% 17.7%
Product Type
Siz
e
US Equity, Broad sector,
non levered, 1Y Total
Return byBeta
Smart
BetaActive All
Large Cap 19 87 7 113
Mid Cap 7 30 - 37
Small Cap 11 42 2 55
Broad 10 69 13 92
All 47 228 22 297
US Equity, Broad sector,
non levered, # of funds by
Product Type
Siz
e
Source: Deutsche Bank, FactSet. Total Return corresponds to last month. Source: Deutsche Bank.
Figure 33: DM Equity ETFs - 1 Year Total Returns Figure 34: DM Equity ETFs - # of Funds in 1Y sample
BetaSmart
BetaActive All
Large Cap 21.6% 17.7% 19.2%
Mid Cap 21.0% 21.0%
Small Cap 23.3% 24.9% 24.0%
Broad 20.5% 17.2% 17.8% 18.1%
All 21.2% 18.0% 18.9%
DM Equity, Broad sector,
regional, non levered, 1Y
Total Return by
Product Type
Siz
e
BetaSmart
BetaActive All
Large Cap 5 8 - 13
Mid Cap - 2 - 2
Small Cap 8 7 - 15
Broad 25 70 5 100
All 38 87 5 130
DM Equity, Broad sector,
regional, non levered, # of
funds by
Product Type
Siz
e
Source: Deutsche Bank, FactSet. Total Return corresponds to last month. Source: Deutsche Bank.
Figure 35: EM Equity ETFs - 1 Year Total Returns Figure 36: EM Equity ETFs - # of Funds in 1Y sample
BetaSmart
BetaActive All
Large Cap 19.0% 16.2% 17.3%
Mid Cap
Small Cap 15.7% 25.6% 20.6%
Broad 21.7% 18.2% 22.5% 19.5%
All 21.0% 18.4% 22.5% 19.4%
EM Equity, Broad sector,
regional, non levered, 1Y
Total Return by
Product Type
Siz
e
BetaSmart
BetaActive All
Large Cap 2 3 - 5
Mid Cap - - - -
Small Cap 2 2 - 4
Broad 20 36 1 57
All 24 41 1 66
EM Equity, Broad sector,
regional, non levered, # of
funds by
Product Type
Siz
e
Source: Deutsche Bank, FactSet. Total Return corresponds to last month. Source: Deutsche Bank.
Page 24 Deutsche Bank Securities Inc.
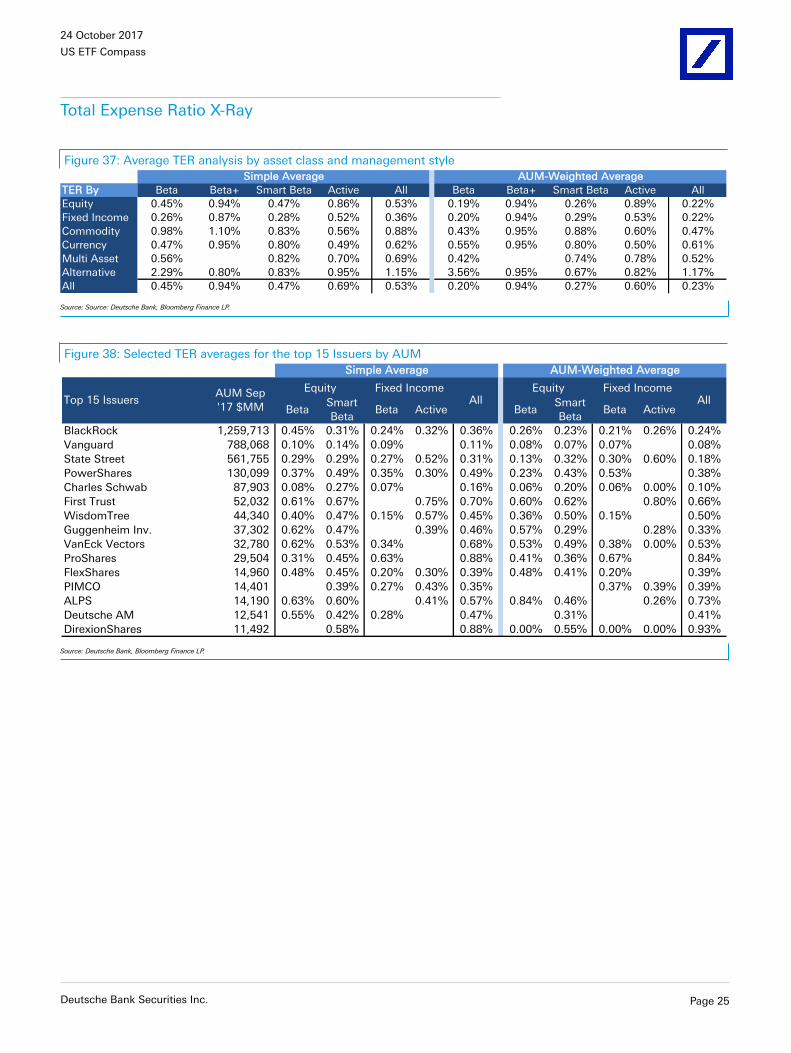
24 October 2017
US ETF Compass
Total Expense Ratio X-Ray
Figure 37: Average TER analysis by asset class and management style
TER By Beta Beta+ Smart Beta Active All Beta Beta+ Smart Beta Active All
Equity 0.45% 0.94% 0.47% 0.86% 0.53% 0.19% 0.94% 0.26% 0.89% 0.22%
Fixed Income 0.26% 0.87% 0.28% 0.52% 0.36% 0.20% 0.94% 0.29% 0.53% 0.22%
Commodity 0.98% 1.10% 0.83% 0.56% 0.88% 0.43% 0.95% 0.88% 0.60% 0.47%
Currency 0.47% 0.95% 0.80% 0.49% 0.62% 0.55% 0.95% 0.80% 0.50% 0.61%
Multi Asset 0.56% 0.82% 0.70% 0.69% 0.42% 0.74% 0.78% 0.52%
Alternative 2.29% 0.80% 0.83% 0.95% 1.15% 3.56% 0.95% 0.67% 0.82% 1.17%
All 0.45% 0.94% 0.47% 0.69% 0.53% 0.20% 0.94% 0.27% 0.60% 0.23%
Simple Average AUM-Weighted Average
Source: Source: Deutsche Bank, Bloomberg Finance LP.
Figure 38: Selected TER averages for the top 15 Issuers by AUM
BetaSmart
BetaBeta Active Beta
Smart
BetaBeta Active
BlackRock 1,259,713 0.45% 0.31% 0.24% 0.32% 0.36% 0.26% 0.23% 0.21% 0.26% 0.24%
Vanguard 788,068 0.10% 0.14% 0.09% 0.11% 0.08% 0.07% 0.07% 0.08%
State Street 561,755 0.29% 0.29% 0.27% 0.52% 0.31% 0.13% 0.32% 0.30% 0.60% 0.18%
PowerShares 130,099 0.37% 0.49% 0.35% 0.30% 0.49% 0.23% 0.43% 0.53% 0.38%
Charles Schwab 87,903 0.08% 0.27% 0.07% 0.16% 0.06% 0.20% 0.06% 0.00% 0.10%
First Trust 52,032 0.61% 0.67% 0.75% 0.70% 0.60% 0.62% 0.80% 0.66%
WisdomTree 44,340 0.40% 0.47% 0.15% 0.57% 0.45% 0.36% 0.50% 0.15% 0.50%
Guggenheim Inv. 37,302 0.62% 0.47% 0.39% 0.46% 0.57% 0.29% 0.28% 0.33%
VanEck Vectors 32,780 0.62% 0.53% 0.34% 0.68% 0.53% 0.49% 0.38% 0.00% 0.53%
ProShares 29,504 0.31% 0.45% 0.63% 0.88% 0.41% 0.36% 0.67% 0.84%
FlexShares 14,960 0.48% 0.45% 0.20% 0.30% 0.39% 0.48% 0.41% 0.20% 0.39%
PIMCO 14,401 0.39% 0.27% 0.43% 0.35% 0.37% 0.39% 0.39%
ALPS 14,190 0.63% 0.60% 0.41% 0.57% 0.84% 0.46% 0.26% 0.73%
Deutsche AM 12,541 0.55% 0.42% 0.28% 0.47% 0.31% 0.41%
DirexionShares 11,492 0.58% 0.88% 0.00% 0.55% 0.00% 0.00% 0.93%
Equity Fixed IncomeAll
Simple Average AUM-Weighted Average
AllEquity Fixed IncomeAUM Sep
'17 $MMTop 15 Issuers
Source: Deutsche Bank, Bloomberg Finance LP.
Deutsche Bank Securities Inc. Page 25
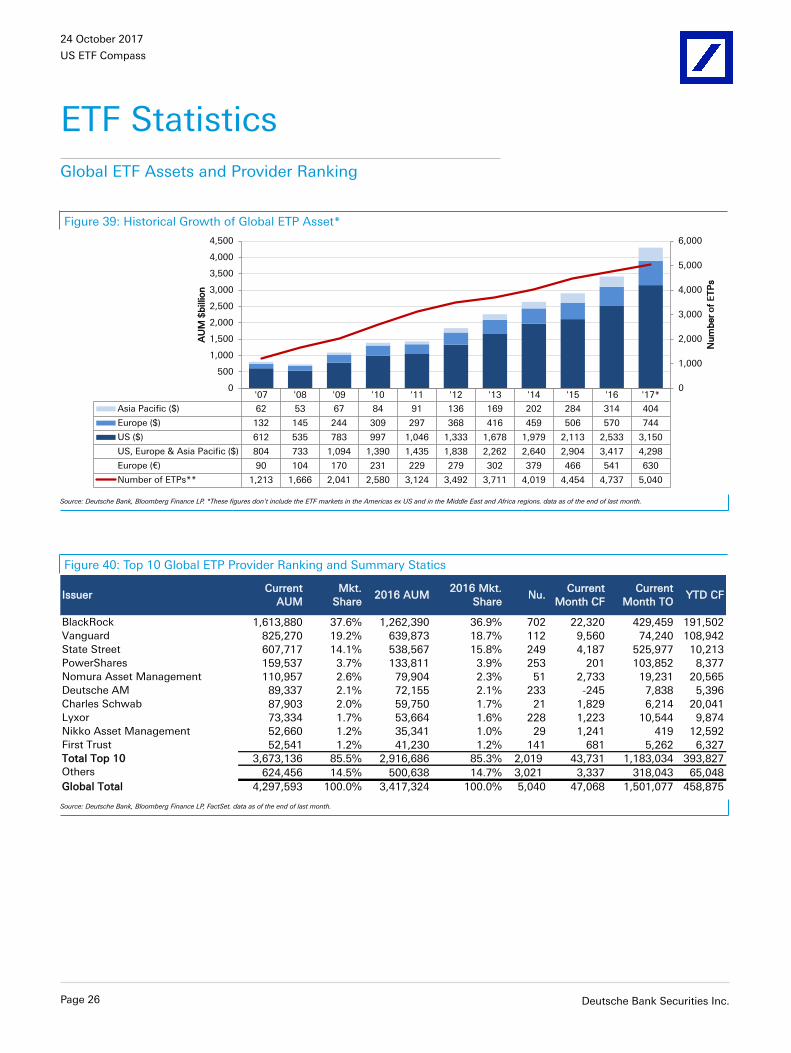
24 October 2017
US ETF Compass
ETF StatisticsGlobal ETF Assets and Provider Ranking
Figure 39: Historical Growth of Global ETP Asset*
'07 '08 '09 '10 '11 '12 '13 '14 '15 '16 '17*
Asia Pacific ($) 62 53 67 84 91 136 169 202 284 314 404
Europe ($) 132 145 244 309 297 368 416 459 506 570 744
US ($) 612 535 783 997 1,046 1,333 1,678 1,979 2,113 2,533 3,150
US, Europe & Asia Pacific ($) 804 733 1,094 1,390 1,435 1,838 2,262 2,640 2,904 3,417 4,298
Europe (€) 90 104 170 231 229 279 302 379 466 541 630
Number of ETPs** 1,213 1,666 2,041 2,580 3,124 3,492 3,711 4,019 4,454 4,737 5,040
0
1,000
2,000
3,000
4,000
5,000
6,000
0
500
1,000
1,500
2,000
2,500
3,000
3,500
4,000
4,500
Nu
mb
er
of
ET
Ps
AU
M $
billio
n
Source: Deutsche Bank, Bloomberg Finance LP. *These figures don't include the ETF markets in the Americas ex US and in the Middle East and Africa regions. data as of the end of last month.
Figure 40: Top 10 Global ETP Provider Ranking and Summary Statics
IssuerCurrent
AUM
Mkt.
Share2016 AUM
2016 Mkt.
Share
Current
Month CF
Current
Month TOYTD CF
BlackRock 1,613,880 37.6% 1,262,390 36.9% 702 22,320 429,459 191,502
Vanguard 825,270 19.2% 639,873 18.7% 112 9,560 74,240 108,942
State Street 607,717 14.1% 538,567 15.8% 249 4,187 525,977 10,213
PowerShares 159,537 3.7% 133,811 3.9% 253 201 103,852 8,377
Nomura Asset Management 110,957 2.6% 79,904 2.3% 51 2,733 19,231 20,565
Deutsche AM 89,337 2.1% 72,155 2.1% 233 -245 7,838 5,396
Charles Schwab 87,903 2.0% 59,750 1.7% 21 1,829 6,214 20,041
Lyxor 73,334 1.7% 53,664 1.6% 228 1,223 10,544 9,874
Nikko Asset Management 52,660 1.2% 35,341 1.0% 29 1,241 419 12,592
First Trust 52,541 1.2% 41,230 1.2% 141 681 5,262 6,327
Total Top 10 3,673,136 85.5% 2,916,686 85.3% 2,019 43,731 1,183,034 393,827
Others 624,456 14.5% 500,638 14.7% 3,021 3,337 318,043 65,048
Global Total 4,297,593 100.0% 3,417,324 100.0% 5,040 47,068 1,501,077 458,875
Source: Deutsche Bank, Bloomberg Finance LP, FactSet. data as of the end of last month.
Page 26 Deutsche Bank Securities Inc.
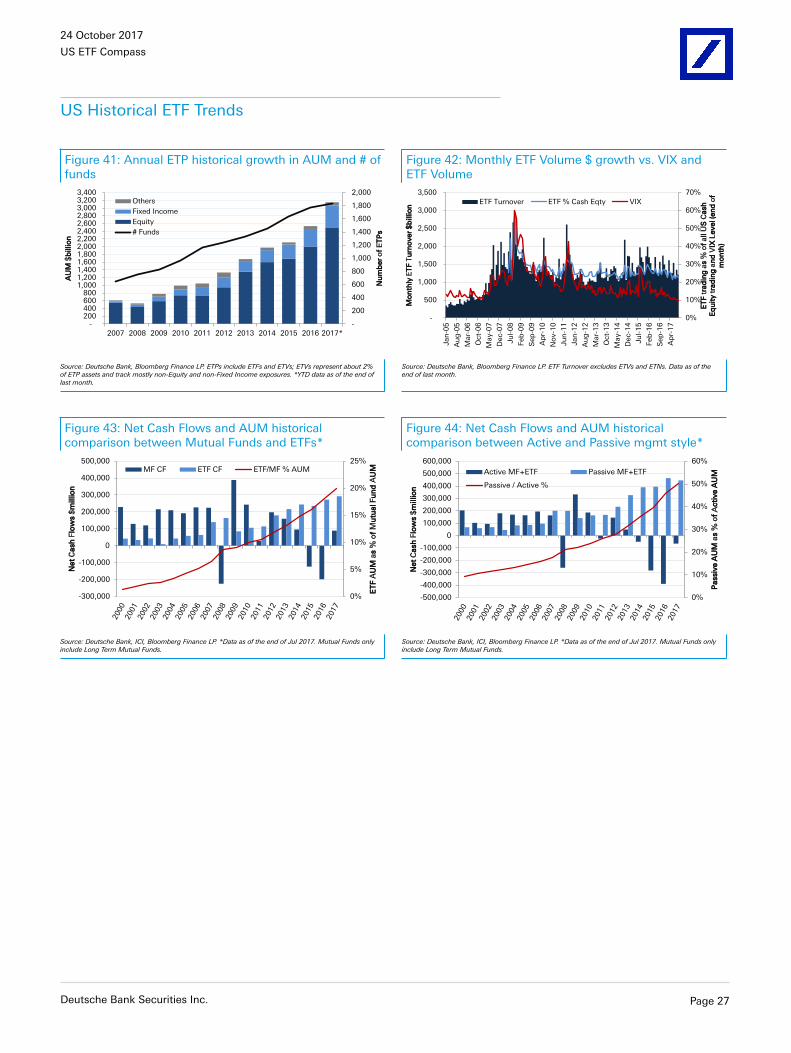
24 October 2017
US ETF Compass
US Historical ETF Trends
Figure 41: Annual ETP historical growth in AUM and # offunds
Figure 42: Monthly ETF Volume $ growth vs. VIX andETF Volume
-
200
400
600
800
1,000
1,200
1,400
1,600
1,800
2,000
- 200 400 600 800
1,000 1,200 1,400 1,600 1,800 2,000 2,200 2,400 2,600 2,800 3,000 3,200 3,400
2007 2008 2009 2010 2011 2012 2013 2014 2015 2016 2017*
Nu
mb
er
of
ET
Ps
AU
M $
billio
n
Others
Fixed Income
Equity
# Funds
0%
10%
20%
30%
40%
50%
60%
70%
-
500
1,000
1,500
2,000
2,500
3,000
3,500
Jan
-05
Au
g-0
5
Mar-
06
Oct-
06
May-0
7
Dec-0
7
Ju
l-0
8
Feb
-09
Sep
-09
Ap
r-1
0
No
v-1
0
Ju
n-1
1
Jan
-12
Au
g-1
2
Mar-
13
Oct-
13
May-1
4
Dec-1
4
Ju
l-1
5
Feb
-16
Sep
-16
Ap
r-1
7
ET
F t
rad
ing
as %
of
all U
S C
ash
E
qu
ity t
rad
ing
an
d V
IX L
evel (
en
d o
f m
on
th)
Mo
nth
ly E
TF T
urn
over
$b
illio
n ETF Turnover ETF % Cash Eqty VIX
Source: Deutsche Bank, Bloomberg Finance LP. ETPs include ETFs and ETVs; ETVs represent about 2%of ETP assets and track mostly non-Equity and non-Fixed Income exposures. *YTD data as of the end oflast month.
Source: Deutsche Bank, Bloomberg Finance LP. ETF Turnover excludes ETVs and ETNs. Data as of theend of last month.
Figure 43: Net Cash Flows and AUM historicalcomparison between Mutual Funds and ETFs*
Figure 44: Net Cash Flows and AUM historicalcomparison between Active and Passive mgmt style*
0%
5%
10%
15%
20%
25%
-300,000
-200,000
-100,000
0
100,000
200,000
300,000
400,000
500,000
ET
F A
UM
as %
of
Mu
tual Fu
nd
AU
M
Net
Cash
Flo
ws $
millio
n
MF CF ETF CF ETF/MF % AUM
0%
10%
20%
30%
40%
50%
60%
-500,000
-400,000
-300,000
-200,000
-100,000
0
100,000
200,000
300,000
400,000
500,000
600,000
Passiv
e A
UM
as %
of
Acti
ve A
UM
Net
Cash
Flo
ws $
millio
n
Active MF+ETF Passive MF+ETF
Passive / Active %
Source: Deutsche Bank, ICI, Bloomberg Finance LP. *Data as of the end of Jul 2017. Mutual Funds onlyinclude Long Term Mutual Funds.
Source: Deutsche Bank, ICI, Bloomberg Finance LP. *Data as of the end of Jul 2017. Mutual Funds onlyinclude Long Term Mutual Funds.
Deutsche Bank Securities Inc. Page 27
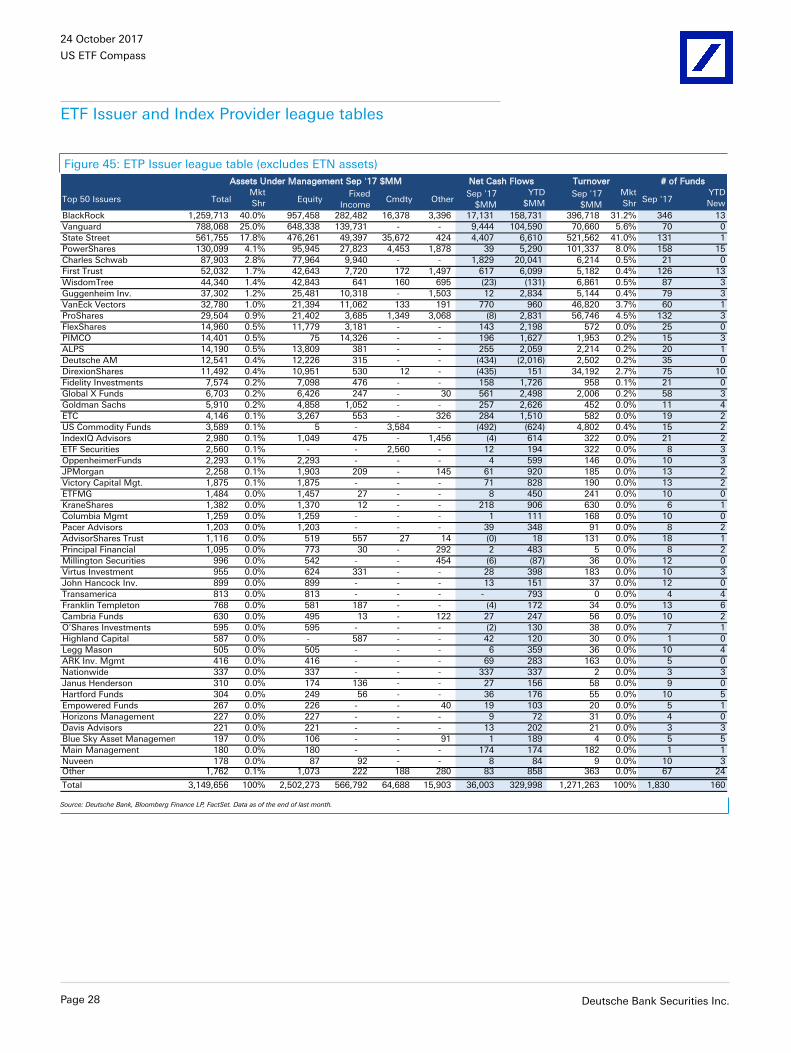
24 October 2017
US ETF Compass
ETF Issuer and Index Provider league tables
Figure 45: ETP Issuer league table (excludes ETN assets)
Top 50 Issuers TotalMkt
Shr EquityFixed
IncomeCmdty Other
Sep '17
$MM
YTD
$MMSep '17
$MM
Mkt
Shr Sep '17YTD
New
BlackRock 1,259,713 40.0% 957,458 282,482 16,378 3,396 17,131 158,731 396,718 31.2% 346 13
Vanguard 788,068 25.0% 648,338 139,731 - - 9,444 104,590 70,660 5.6% 70 0
State Street 561,755 17.8% 476,261 49,397 35,672 424 4,407 6,610 521,562 41.0% 131 1
PowerShares 130,099 4.1% 95,945 27,823 4,453 1,878 39 5,290 101,337 8.0% 158 15
Charles Schwab 87,903 2.8% 77,964 9,940 - - 1,829 20,041 6,214 0.5% 21 0
First Trust 52,032 1.7% 42,643 7,720 172 1,497 617 6,099 5,182 0.4% 126 13
WisdomTree 44,340 1.4% 42,843 641 160 695 (23) (131) 6,861 0.5% 87 3
Guggenheim Inv. 37,302 1.2% 25,481 10,318 - 1,503 12 2,834 5,144 0.4% 79 3
VanEck Vectors 32,780 1.0% 21,394 11,062 133 191 770 960 46,820 3.7% 60 1
ProShares 29,504 0.9% 21,402 3,685 1,349 3,068 (8) 2,831 56,746 4.5% 132 3
FlexShares 14,960 0.5% 11,779 3,181 - - 143 2,198 572 0.0% 25 0
PIMCO 14,401 0.5% 75 14,326 - - 196 1,627 1,953 0.2% 15 3
ALPS 14,190 0.5% 13,809 381 - - 255 2,059 2,214 0.2% 20 1
Deutsche AM 12,541 0.4% 12,226 315 - - (434) (2,016) 2,502 0.2% 35 0
DirexionShares 11,492 0.4% 10,951 530 12 - (435) 151 34,192 2.7% 75 10
Fidelity Investments 7,574 0.2% 7,098 476 - - 158 1,726 958 0.1% 21 0
Global X Funds 6,703 0.2% 6,426 247 - 30 561 2,498 2,006 0.2% 58 3
Goldman Sachs 5,910 0.2% 4,858 1,052 - - 257 2,626 452 0.0% 11 4
ETC 4,146 0.1% 3,267 553 - 326 284 1,510 582 0.0% 19 2
US Commodity Funds 3,589 0.1% 5 - 3,584 - (492) (624) 4,802 0.4% 15 2
IndexIQ Advisors 2,980 0.1% 1,049 475 - 1,456 (4) 614 322 0.0% 21 2
ETF Securities 2,560 0.1% - - 2,560 - 12 194 322 0.0% 8 3
OppenheimerFunds 2,293 0.1% 2,293 - - - 4 599 146 0.0% 10 3
JPMorgan 2,258 0.1% 1,903 209 - 145 61 920 185 0.0% 13 2
Victory Capital Mgt. 1,875 0.1% 1,875 - - - 71 828 190 0.0% 13 2
ETFMG 1,484 0.0% 1,457 27 - - 8 450 241 0.0% 10 0
KraneShares 1,382 0.0% 1,370 12 - - 218 906 630 0.0% 6 1
Columbia Mgmt 1,259 0.0% 1,259 - - - 1 111 168 0.0% 10 0
Pacer Advisors 1,203 0.0% 1,203 - - - 39 348 91 0.0% 8 2
AdvisorShares Trust 1,116 0.0% 519 557 27 14 (0) 18 131 0.0% 18 1
Principal Financial 1,095 0.0% 773 30 - 292 2 483 5 0.0% 8 2
Millington Securities 996 0.0% 542 - - 454 (6) (87) 36 0.0% 12 0
Virtus Investment 955 0.0% 624 331 - - 28 398 183 0.0% 10 3
John Hancock Inv. 899 0.0% 899 - - - 13 151 37 0.0% 12 0
Transamerica 813 0.0% 813 - - - - 793 0 0.0% 4 4
Franklin Templeton 768 0.0% 581 187 - - (4) 172 34 0.0% 13 6
Cambria Funds 630 0.0% 495 13 - 122 27 247 56 0.0% 10 2
O'Shares Investments 595 0.0% 595 - - - (2) 130 38 0.0% 7 1
Highland Capital 587 0.0% - 587 - - 42 120 30 0.0% 1 0
Legg Mason 505 0.0% 505 - - - 6 359 36 0.0% 10 4
ARK Inv. Mgmt 416 0.0% 416 - - - 69 283 163 0.0% 5 0
Nationwide 337 0.0% 337 - - - 337 337 2 0.0% 3 3
Janus Henderson 310 0.0% 174 136 - - 27 156 58 0.0% 9 0
Hartford Funds 304 0.0% 249 56 - - 36 176 55 0.0% 10 5
Empowered Funds 267 0.0% 226 - - 40 19 103 20 0.0% 5 1
Horizons Management 227 0.0% 227 - - - 9 72 31 0.0% 4 0
Davis Advisors 221 0.0% 221 - - - 13 202 21 0.0% 3 3
Blue Sky Asset Management 197 0.0% 106 - - 91 1 189 4 0.0% 5 5
Main Management 180 0.0% 180 - - - 174 174 182 0.0% 1 1
Nuveen 178 0.0% 87 92 - - 8 84 9 0.0% 10 3Other 1,762 0.1% 1,073 222 188 280 83 858 363 0.0% 67 24
Total 3,149,656 100% 2,502,273 566,792 64,688 15,903 36,003 329,998 1,271,263 100% 1,830 160
Assets Under Management Sep '17 $MM Net Cash Flows Turnover # of Funds
Source: Deutsche Bank, Bloomberg Finance LP, FactSet. Data as of the end of last month.
Page 28 Deutsche Bank Securities Inc.
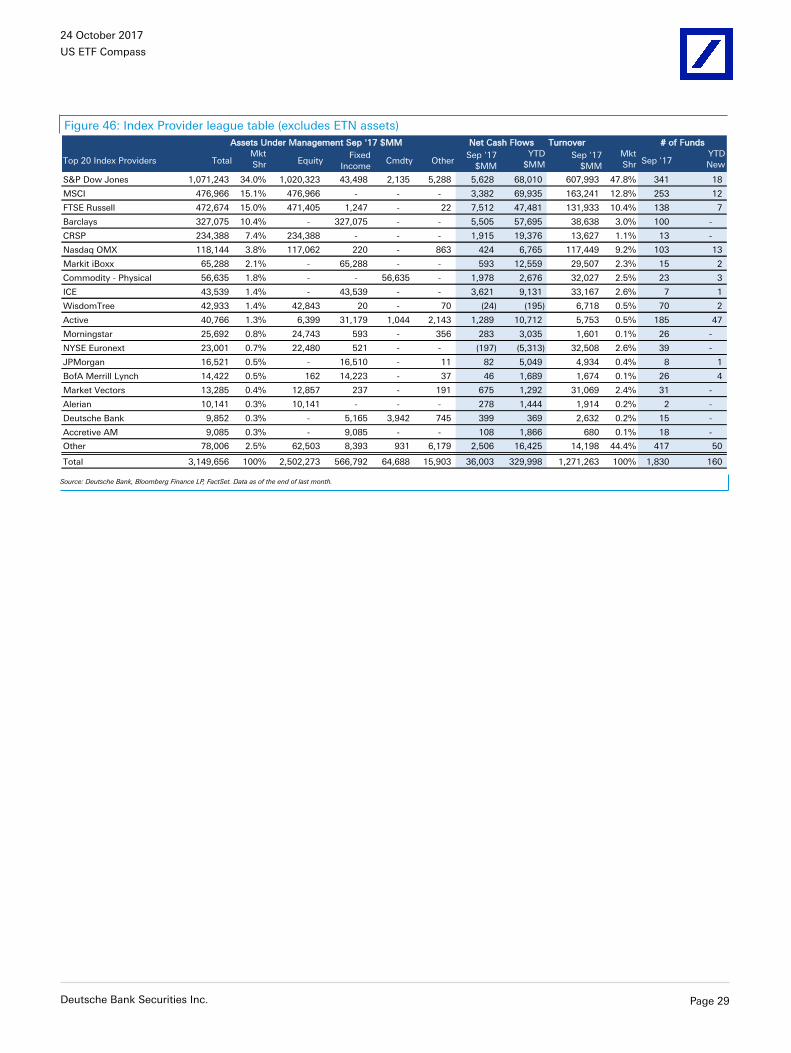
24 October 2017
US ETF Compass
Figure 46: Index Provider league table (excludes ETN assets)Turnover
Top 20 Index Providers TotalMkt
Shr EquityFixed
IncomeCmdty Other
Sep '17
$MM
YTD
$MMSep '17
$MM
Mkt
Shr Sep '17YTD
New
S&P Dow Jones 1,071,243 34.0% 1,020,323 43,498 2,135 5,288 5,628 68,010 607,993 47.8% 341 18
MSCI 476,966 15.1% 476,966 - - - 3,382 69,935 163,241 12.8% 253 12
FTSE Russell 472,674 15.0% 471,405 1,247 - 22 7,512 47,481 131,933 10.4% 138 7
Barclays 327,075 10.4% - 327,075 - - 5,505 57,695 38,638 3.0% 100 -
CRSP 234,388 7.4% 234,388 - - - 1,915 19,376 13,627 1.1% 13 -
Nasdaq OMX 118,144 3.8% 117,062 220 - 863 424 6,765 117,449 9.2% 103 13
Markit iBoxx 65,288 2.1% - 65,288 - - 593 12,559 29,507 2.3% 15 2
Commodity - Physical 56,635 1.8% - - 56,635 - 1,978 2,676 32,027 2.5% 23 3
ICE 43,539 1.4% - 43,539 - - 3,621 9,131 33,167 2.6% 7 1
WisdomTree 42,933 1.4% 42,843 20 - 70 (24) (195) 6,718 0.5% 70 2
Active 40,766 1.3% 6,399 31,179 1,044 2,143 1,289 10,712 5,753 0.5% 185 47
Morningstar 25,692 0.8% 24,743 593 - 356 283 3,035 1,601 0.1% 26 -
NYSE Euronext 23,001 0.7% 22,480 521 - - (197) (5,313) 32,508 2.6% 39 -
JPMorgan 16,521 0.5% - 16,510 - 11 82 5,049 4,934 0.4% 8 1
BofA Merrill Lynch 14,422 0.5% 162 14,223 - 37 46 1,689 1,674 0.1% 26 4
Market Vectors 13,285 0.4% 12,857 237 - 191 675 1,292 31,069 2.4% 31 -
Alerian 10,141 0.3% 10,141 - - - 278 1,444 1,914 0.2% 2 -
Deutsche Bank 9,852 0.3% - 5,165 3,942 745 399 369 2,632 0.2% 15 -
Accretive AM 9,085 0.3% - 9,085 - - 108 1,866 680 0.1% 18 -
Other 78,006 2.5% 62,503 8,393 931 6,179 2,506 16,425 14,198 44.4% 417 50
Total 3,149,656 100% 2,502,273 566,792 64,688 15,903 36,003 329,998 1,271,263 100% 1,830 160
Assets Under Management Sep '17 $MM Net Cash Flows # of Funds
Source: Deutsche Bank, Bloomberg Finance LP, FactSet. Data as of the end of last month.
Deutsche Bank Securities Inc. Page 29
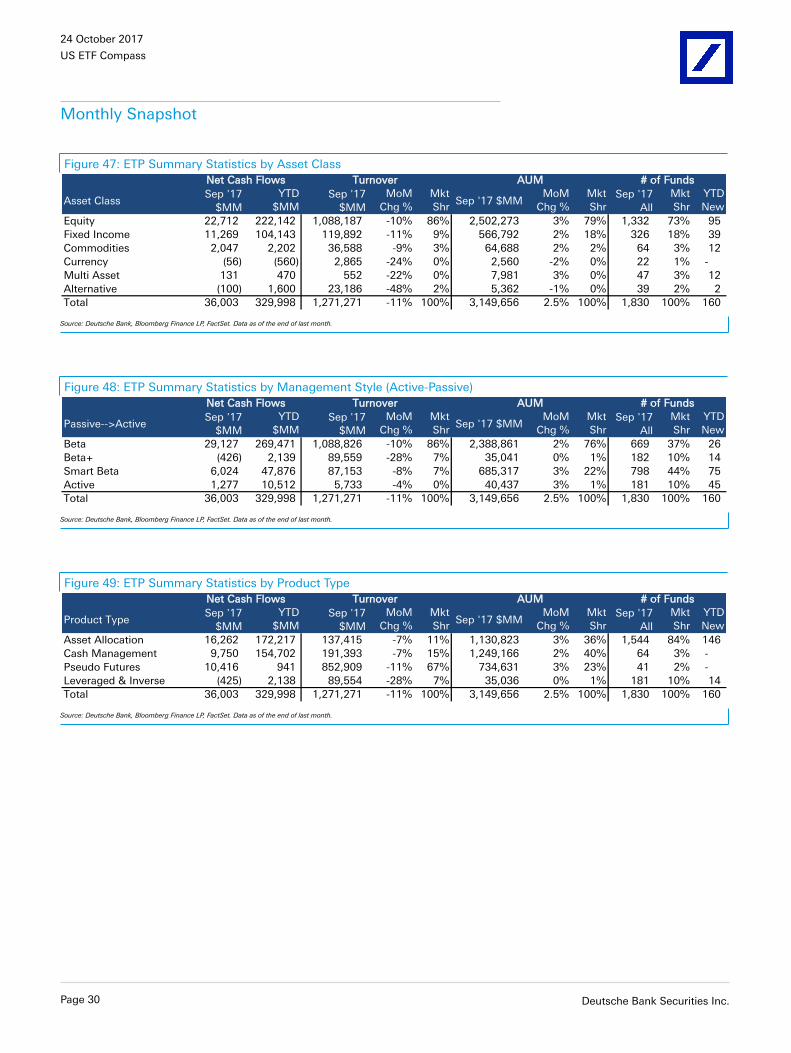
24 October 2017
US ETF Compass
Monthly Snapshot
Figure 47: ETP Summary Statistics by Asset Class
Asset ClassSep '17
$MM
YTD
$MMSep '17
$MM
MoM
Chg %
Mkt
ShrSep '17 $MM
MoM
Chg %
Mkt
ShrSep '17
All
Mkt
Shr
YTD
New
Equity 22,712 222,142 1,088,187 -10% 86% 2,502,273 3% 79% 1,332 73% 95
Fixed Income 11,269 104,143 119,892 -11% 9% 566,792 2% 18% 326 18% 39
Commodities 2,047 2,202 36,588 -9% 3% 64,688 2% 2% 64 3% 12
Currency (56) (560) 2,865 -24% 0% 2,560 -2% 0% 22 1% -
Multi Asset 131 470 552 -22% 0% 7,981 3% 0% 47 3% 12
Alternative (100) 1,600 23,186 -48% 2% 5,362 -1% 0% 39 2% 2
Total 36,003 329,998 1,271,271 -11% 100% 3,149,656 2.5% 100% 1,830 100% 160
AUMTurnover Net Cash Flows # of Funds
Source: Deutsche Bank, Bloomberg Finance LP, FactSet. Data as of the end of last month.
Figure 48: ETP Summary Statistics by Management Style (Active-Passive)
Passive-->ActiveSep '17
$MM
YTD
$MMSep '17
$MM
MoM
Chg %
Mkt
ShrSep '17 $MM
MoM
Chg %
Mkt
ShrSep '17
All
Mkt
Shr
YTD
New
Beta 29,127 269,471 1,088,826 -10% 86% 2,388,861 2% 76% 669 37% 26
Beta+ (426) 2,139 89,559 -28% 7% 35,041 0% 1% 182 10% 14
Smart Beta 6,024 47,876 87,153 -8% 7% 685,317 3% 22% 798 44% 75
Active 1,277 10,512 5,733 -4% 0% 40,437 3% 1% 181 10% 45
Total 36,003 329,998 1,271,271 -11% 100% 3,149,656 2.5% 100% 1,830 100% 160
Turnover AUMNet Cash Flows # of Funds
Source: Deutsche Bank, Bloomberg Finance LP, FactSet. Data as of the end of last month.
Figure 49: ETP Summary Statistics by Product Type
Product TypeSep '17
$MM
YTD
$MMSep '17
$MM
MoM
Chg %
Mkt
ShrSep '17 $MM
MoM
Chg %
Mkt
ShrSep '17
All
Mkt
Shr
YTD
New
Asset Allocation 16,262 172,217 137,415 -7% 11% 1,130,823 3% 36% 1,544 84% 146
Cash Management 9,750 154,702 191,393 -7% 15% 1,249,166 2% 40% 64 3% -
Pseudo Futures 10,416 941 852,909 -11% 67% 734,631 3% 23% 41 2% -
Leveraged & Inverse (425) 2,138 89,554 -28% 7% 35,036 0% 1% 181 10% 14
Total 36,003 329,998 1,271,271 -11% 100% 3,149,656 2.5% 100% 1,830 100% 160
Turnover AUMNet Cash Flows # of Funds
Source: Deutsche Bank, Bloomberg Finance LP, FactSet. Data as of the end of last month.
Page 30 Deutsche Bank Securities Inc.
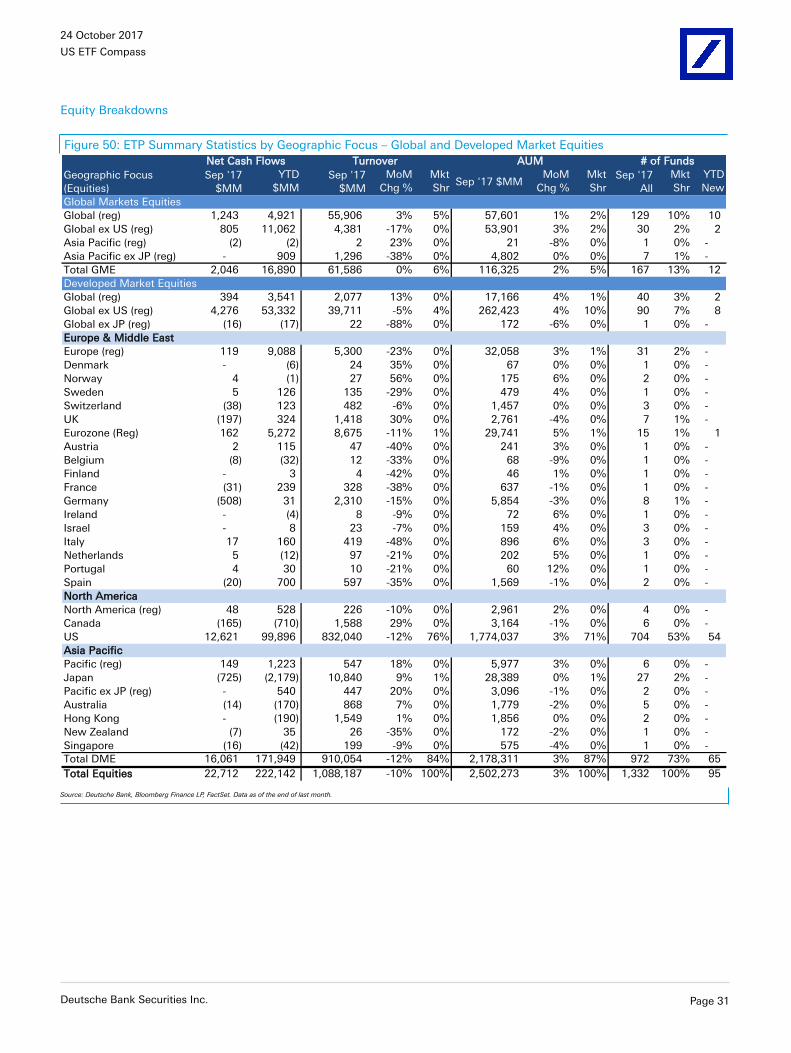
24 October 2017
US ETF Compass
Equity Breakdowns
Figure 50: ETP Summary Statistics by Geographic Focus – Global and Developed Market Equities
Geographic Focus
(Equities)
Sep '17
$MM
YTD
$MMSep '17
$MM
MoM
Chg %
Mkt
ShrSep '17 $MM
MoM
Chg %
Mkt
ShrSep '17
All
Mkt
Shr
YTD
New
Global Markets Equities
Global (reg) 1,243 4,921 55,906 3% 5% 57,601 1% 2% 129 10% 10
Global ex US (reg) 805 11,062 4,381 -17% 0% 53,901 3% 2% 30 2% 2
Asia Pacific (reg) (2) (2) 2 23% 0% 21 -8% 0% 1 0% -
Asia Pacific ex JP (reg) - 909 1,296 -38% 0% 4,802 0% 0% 7 1% -
Total GME 2,046 16,890 61,586 0% 6% 116,325 2% 5% 167 13% 12
Developed Market Equities
Global (reg) 394 3,541 2,077 13% 0% 17,166 4% 1% 40 3% 2
Global ex US (reg) 4,276 53,332 39,711 -5% 4% 262,423 4% 10% 90 7% 8
Global ex JP (reg) (16) (17) 22 -88% 0% 172 -6% 0% 1 0% -
Europe & Middle East
Europe (reg) 119 9,088 5,300 -23% 0% 32,058 3% 1% 31 2% -
Denmark - (6) 24 35% 0% 67 0% 0% 1 0% -
Norway 4 (1) 27 56% 0% 175 6% 0% 2 0% -
Sweden 5 126 135 -29% 0% 479 4% 0% 1 0% -
Switzerland (38) 123 482 -6% 0% 1,457 0% 0% 3 0% -
UK (197) 324 1,418 30% 0% 2,761 -4% 0% 7 1% -
Eurozone (Reg) 162 5,272 8,675 -11% 1% 29,741 5% 1% 15 1% 1
Austria 2 115 47 -40% 0% 241 3% 0% 1 0% -
Belgium (8) (32) 12 -33% 0% 68 -9% 0% 1 0% -
Finland - 3 4 -42% 0% 46 1% 0% 1 0% -
France (31) 239 328 -38% 0% 637 -1% 0% 1 0% -
Germany (508) 31 2,310 -15% 0% 5,854 -3% 0% 8 1% -
Ireland - (4) 8 -9% 0% 72 6% 0% 1 0% -
Israel - 8 23 -7% 0% 159 4% 0% 3 0% -
Italy 17 160 419 -48% 0% 896 6% 0% 3 0% -
Netherlands 5 (12) 97 -21% 0% 202 5% 0% 1 0% -
Portugal 4 30 10 -21% 0% 60 12% 0% 1 0% -
Spain (20) 700 597 -35% 0% 1,569 -1% 0% 2 0% -
North America
North America (reg) 48 528 226 -10% 0% 2,961 2% 0% 4 0% -
Canada (165) (710) 1,588 29% 0% 3,164 -1% 0% 6 0% -
US 12,621 99,896 832,040 -12% 76% 1,774,037 3% 71% 704 53% 54
Asia Pacific
Pacific (reg) 149 1,223 547 18% 0% 5,977 3% 0% 6 0% -
Japan (725) (2,179) 10,840 9% 1% 28,389 0% 1% 27 2% -
Pacific ex JP (reg) - 540 447 20% 0% 3,096 -1% 0% 2 0% -
Australia (14) (170) 868 7% 0% 1,779 -2% 0% 5 0% -
Hong Kong - (190) 1,549 1% 0% 1,856 0% 0% 2 0% -
New Zealand (7) 35 26 -35% 0% 172 -2% 0% 1 0% -
Singapore (16) (42) 199 -9% 0% 575 -4% 0% 1 0% -
Total DME 16,061 171,949 910,054 -12% 84% 2,178,311 3% 87% 972 73% 65
Total Equities 22,712 222,142 1,088,187 -10% 100% 2,502,273 3% 100% 1,332 100% 95
Net Cash Flows Turnover AUM # of Funds
Source: Deutsche Bank, Bloomberg Finance LP, FactSet. Data as of the end of last month.
Deutsche Bank Securities Inc. Page 31
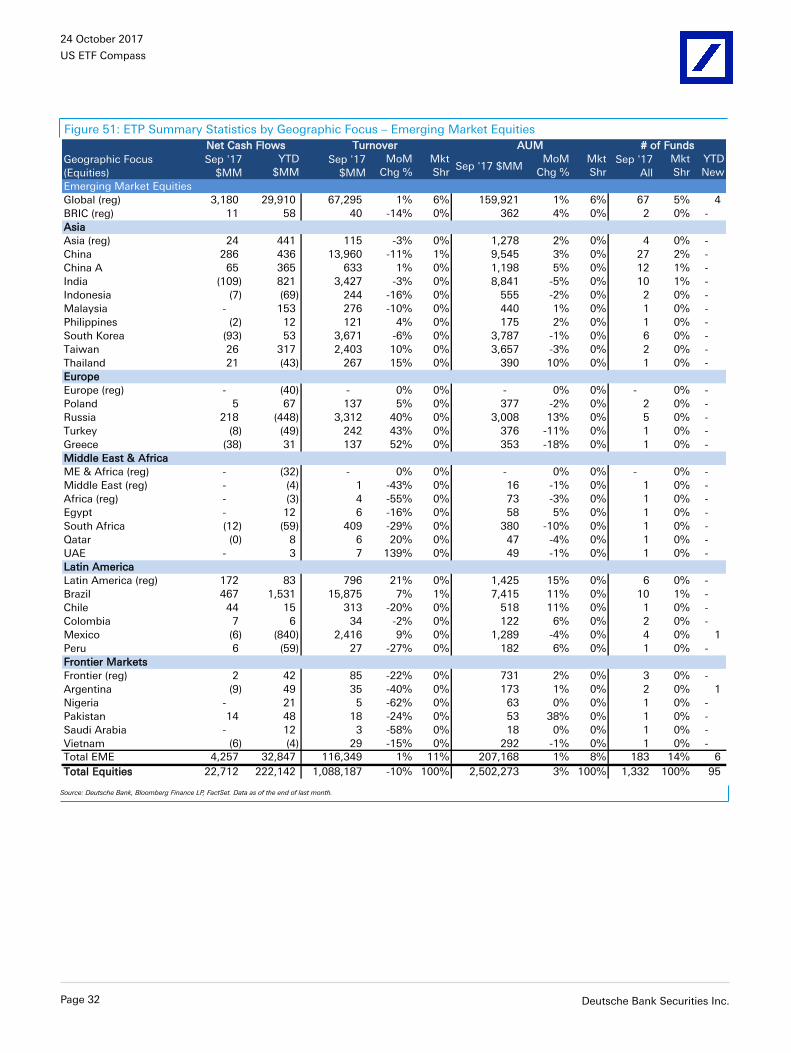
24 October 2017
US ETF Compass
Figure 51: ETP Summary Statistics by Geographic Focus – Emerging Market Equities
Geographic Focus
(Equities)
Sep '17
$MM
YTD
$MMSep '17
$MM
MoM
Chg %
Mkt
ShrSep '17 $MM
MoM
Chg %
Mkt
ShrSep '17
All
Mkt
Shr
YTD
New
Emerging Market Equities
Global (reg) 3,180 29,910 67,295 1% 6% 159,921 1% 6% 67 5% 4
BRIC (reg) 11 58 40 -14% 0% 362 4% 0% 2 0% -
Asia
Asia (reg) 24 441 115 -3% 0% 1,278 2% 0% 4 0% -
China 286 436 13,960 -11% 1% 9,545 3% 0% 27 2% -
China A 65 365 633 1% 0% 1,198 5% 0% 12 1% -
India (109) 821 3,427 -3% 0% 8,841 -5% 0% 10 1% -
Indonesia (7) (69) 244 -16% 0% 555 -2% 0% 2 0% -
Malaysia - 153 276 -10% 0% 440 1% 0% 1 0% -
Philippines (2) 12 121 4% 0% 175 2% 0% 1 0% -
South Korea (93) 53 3,671 -6% 0% 3,787 -1% 0% 6 0% -
Taiwan 26 317 2,403 10% 0% 3,657 -3% 0% 2 0% -
Thailand 21 (43) 267 15% 0% 390 10% 0% 1 0% -
Europe
Europe (reg) - (40) - 0% 0% - 0% 0% - 0% -
Poland 5 67 137 5% 0% 377 -2% 0% 2 0% -
Russia 218 (448) 3,312 40% 0% 3,008 13% 0% 5 0% -
Turkey (8) (49) 242 43% 0% 376 -11% 0% 1 0% -
Greece (38) 31 137 52% 0% 353 -18% 0% 1 0% -
Middle East & Africa
ME & Africa (reg) - (32) - 0% 0% - 0% 0% - 0% -
Middle East (reg) - (4) 1 -43% 0% 16 -1% 0% 1 0% -
Africa (reg) - (3) 4 -55% 0% 73 -3% 0% 1 0% -
Egypt - 12 6 -16% 0% 58 5% 0% 1 0% -
South Africa (12) (59) 409 -29% 0% 380 -10% 0% 1 0% -
Qatar (0) 8 6 20% 0% 47 -4% 0% 1 0% -
UAE - 3 7 139% 0% 49 -1% 0% 1 0% -
Latin America
Latin America (reg) 172 83 796 21% 0% 1,425 15% 0% 6 0% -
Brazil 467 1,531 15,875 7% 1% 7,415 11% 0% 10 1% -
Chile 44 15 313 -20% 0% 518 11% 0% 1 0% -
Colombia 7 6 34 -2% 0% 122 6% 0% 2 0% -
Mexico (6) (840) 2,416 9% 0% 1,289 -4% 0% 4 0% 1
Peru 6 (59) 27 -27% 0% 182 6% 0% 1 0% -
Frontier Markets
Frontier (reg) 2 42 85 -22% 0% 731 2% 0% 3 0% -
Argentina (9) 49 35 -40% 0% 173 1% 0% 2 0% 1
Nigeria - 21 5 -62% 0% 63 0% 0% 1 0% -
Pakistan 14 48 18 -24% 0% 53 38% 0% 1 0% -
Saudi Arabia - 12 3 -58% 0% 18 0% 0% 1 0% -
Vietnam (6) (4) 29 -15% 0% 292 -1% 0% 1 0% -
Total EME 4,257 32,847 116,349 1% 11% 207,168 1% 8% 183 14% 6
Total Equities 22,712 222,142 1,088,187 -10% 100% 2,502,273 3% 100% 1,332 100% 95
Net Cash Flows Turnover AUM # of Funds
Source: Deutsche Bank, Bloomberg Finance LP, FactSet. Data as of the end of last month.
Page 32 Deutsche Bank Securities Inc.
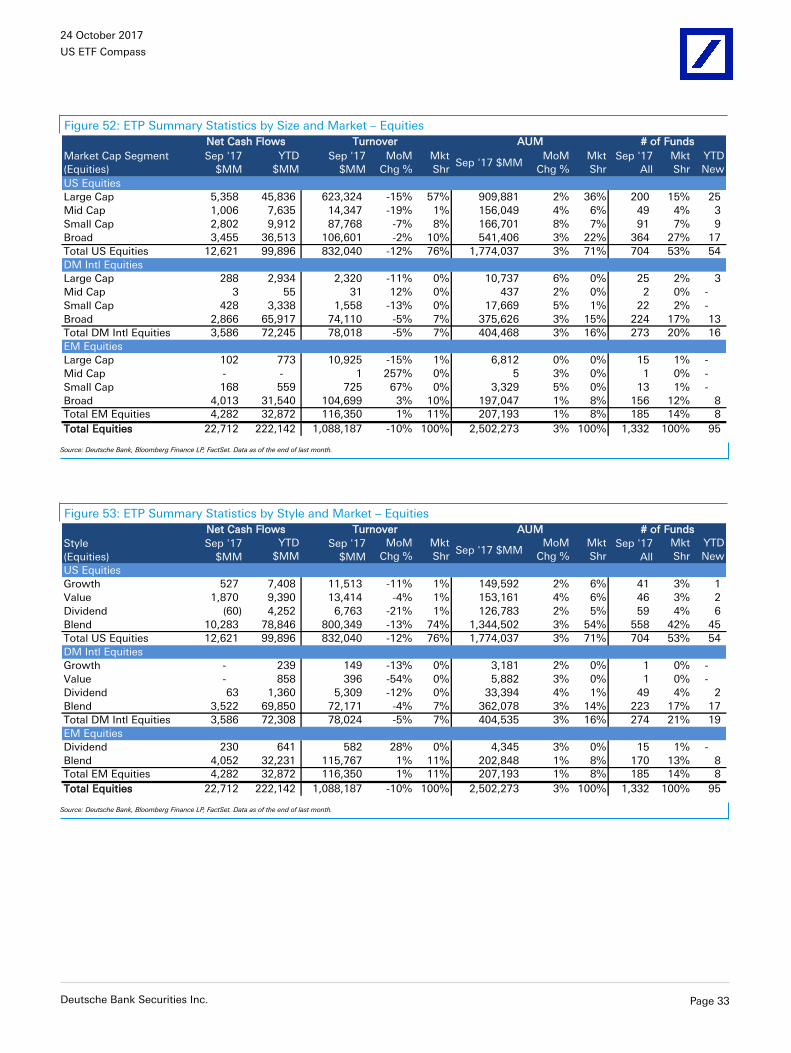
24 October 2017
US ETF Compass
Figure 52: ETP Summary Statistics by Size and Market – Equities
Market Cap Segment
(Equities)
Sep '17
$MM
YTD
$MM
Sep '17
$MM
MoM
Chg %
Mkt
ShrSep '17 $MM
MoM
Chg %
Mkt
Shr
Sep '17
All
Mkt
Shr
YTD
New
US Equities
Large Cap 5,358 45,836 623,324 -15% 57% 909,881 2% 36% 200 15% 25
Mid Cap 1,006 7,635 14,347 -19% 1% 156,049 4% 6% 49 4% 3
Small Cap 2,802 9,912 87,768 -7% 8% 166,701 8% 7% 91 7% 9
Broad 3,455 36,513 106,601 -2% 10% 541,406 3% 22% 364 27% 17
Total US Equities 12,621 99,896 832,040 -12% 76% 1,774,037 3% 71% 704 53% 54
DM Intl Equities
Large Cap 288 2,934 2,320 -11% 0% 10,737 6% 0% 25 2% 3
Mid Cap 3 55 31 12% 0% 437 2% 0% 2 0% -
Small Cap 428 3,338 1,558 -13% 0% 17,669 5% 1% 22 2% -
Broad 2,866 65,917 74,110 -5% 7% 375,626 3% 15% 224 17% 13
Total DM Intl Equities 3,586 72,245 78,018 -5% 7% 404,468 3% 16% 273 20% 16
EM Equities
Large Cap 102 773 10,925 -15% 1% 6,812 0% 0% 15 1% -
Mid Cap - - 1 257% 0% 5 3% 0% 1 0% -
Small Cap 168 559 725 67% 0% 3,329 5% 0% 13 1% -
Broad 4,013 31,540 104,699 3% 10% 197,047 1% 8% 156 12% 8
Total EM Equities 4,282 32,872 116,350 1% 11% 207,193 1% 8% 185 14% 8
Total Equities 22,712 222,142 1,088,187 -10% 100% 2,502,273 3% 100% 1,332 100% 95
Net Cash Flows Turnover AUM # of Funds
Source: Deutsche Bank, Bloomberg Finance LP, FactSet. Data as of the end of last month.
Figure 53: ETP Summary Statistics by Style and Market – Equities
Style
(Equities)
Sep '17
$MM
YTD
$MMSep '17
$MM
MoM
Chg %
Mkt
ShrSep '17 $MM
MoM
Chg %
Mkt
ShrSep '17
All
Mkt
Shr
YTD
New
US Equities
Growth 527 7,408 11,513 -11% 1% 149,592 2% 6% 41 3% 1
Value 1,870 9,390 13,414 -4% 1% 153,161 4% 6% 46 3% 2
Dividend (60) 4,252 6,763 -21% 1% 126,783 2% 5% 59 4% 6
Blend 10,283 78,846 800,349 -13% 74% 1,344,502 3% 54% 558 42% 45
Total US Equities 12,621 99,896 832,040 -12% 76% 1,774,037 3% 71% 704 53% 54
DM Intl Equities
Growth - 239 149 -13% 0% 3,181 2% 0% 1 0% -
Value - 858 396 -54% 0% 5,882 3% 0% 1 0% -
Dividend 63 1,360 5,309 -12% 0% 33,394 4% 1% 49 4% 2
Blend 3,522 69,850 72,171 -4% 7% 362,078 3% 14% 223 17% 17
Total DM Intl Equities 3,586 72,308 78,024 -5% 7% 404,535 3% 16% 274 21% 19
EM Equities
Dividend 230 641 582 28% 0% 4,345 3% 0% 15 1% -
Blend 4,052 32,231 115,767 1% 11% 202,848 1% 8% 170 13% 8
Total EM Equities 4,282 32,872 116,350 1% 11% 207,193 1% 8% 185 14% 8
Total Equities 22,712 222,142 1,088,187 -10% 100% 2,502,273 3% 100% 1,332 100% 95
Net Cash Flows Turnover AUM # of Funds
Source: Deutsche Bank, Bloomberg Finance LP, FactSet. Data as of the end of last month.
Deutsche Bank Securities Inc. Page 33
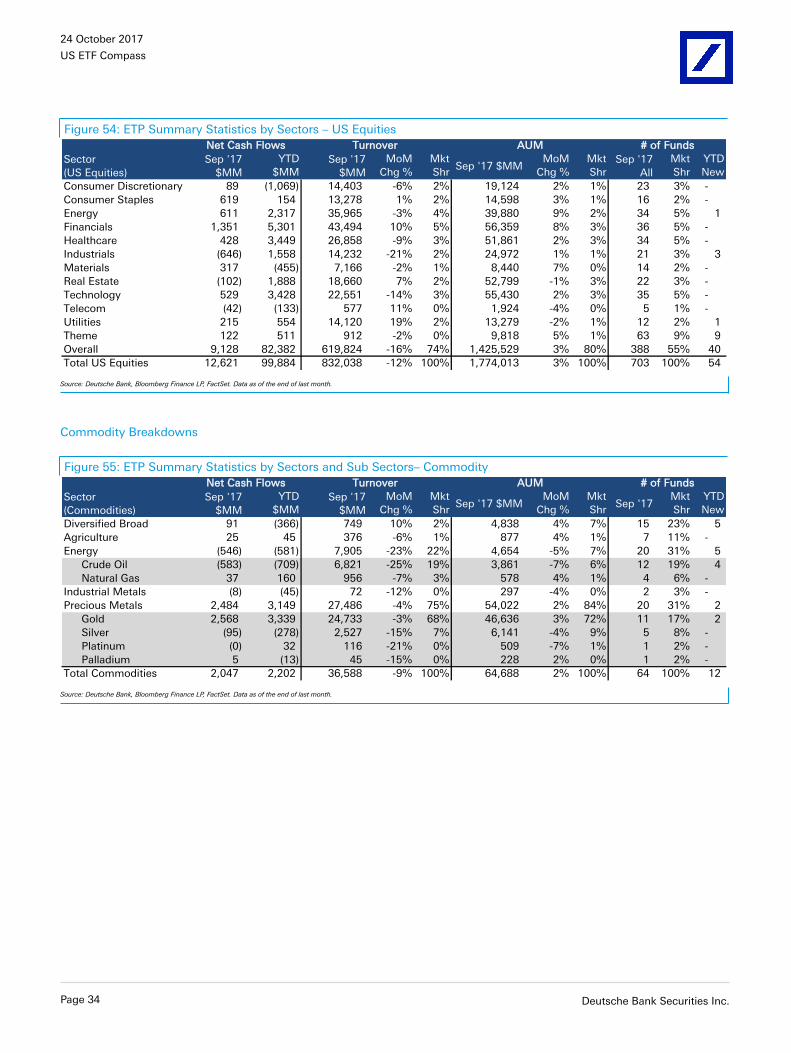
24 October 2017
US ETF Compass
Figure 54: ETP Summary Statistics by Sectors – US Equities
Sector
(US Equities)
Sep '17
$MM
YTD
$MMSep '17
$MM
MoM
Chg %
Mkt
ShrSep '17 $MM
MoM
Chg %
Mkt
ShrSep '17
All
Mkt
Shr
YTD
New
Consumer Discretionary 89 (1,069) 14,403 -6% 2% 19,124 2% 1% 23 3% -
Consumer Staples 619 154 13,278 1% 2% 14,598 3% 1% 16 2% -
Energy 611 2,317 35,965 -3% 4% 39,880 9% 2% 34 5% 1
Financials 1,351 5,301 43,494 10% 5% 56,359 8% 3% 36 5% -
Healthcare 428 3,449 26,858 -9% 3% 51,861 2% 3% 34 5% -
Industrials (646) 1,558 14,232 -21% 2% 24,972 1% 1% 21 3% 3
Materials 317 (455) 7,166 -2% 1% 8,440 7% 0% 14 2% -
Real Estate (102) 1,888 18,660 7% 2% 52,799 -1% 3% 22 3% -
Technology 529 3,428 22,551 -14% 3% 55,430 2% 3% 35 5% -
Telecom (42) (133) 577 11% 0% 1,924 -4% 0% 5 1% -
Utilities 215 554 14,120 19% 2% 13,279 -2% 1% 12 2% 1
Theme 122 511 912 -2% 0% 9,818 5% 1% 63 9% 9
Overall 9,128 82,382 619,824 -16% 74% 1,425,529 3% 80% 388 55% 40
Total US Equities 12,621 99,884 832,038 -12% 100% 1,774,013 3% 100% 703 100% 54
Net Cash Flows Turnover AUM # of Funds
Source: Deutsche Bank, Bloomberg Finance LP, FactSet. Data as of the end of last month.
Commodity Breakdowns
Figure 55: ETP Summary Statistics by Sectors and Sub Sectors– Commodity
Sector
(Commodities)
Sep '17
$MM
YTD
$MMSep '17
$MM
MoM
Chg %
Mkt
ShrSep '17 $MM
MoM
Chg %
Mkt
ShrSep '17
Mkt
Shr
YTD
New
Diversified Broad 91 (366) 749 10% 2% 4,838 4% 7% 15 23% 5
Agriculture 25 45 376 -6% 1% 877 4% 1% 7 11% -
Energy (546) (581) 7,905 -23% 22% 4,654 -5% 7% 20 31% 5
Crude Oil (583) (709) 6,821 -25% 19% 3,861 -7% 6% 12 19% 4
Natural Gas 37 160 956 -7% 3% 578 4% 1% 4 6% -
Industrial Metals (8) (45) 72 -12% 0% 297 -4% 0% 2 3% -
Precious Metals 2,484 3,149 27,486 -4% 75% 54,022 2% 84% 20 31% 2
Gold 2,568 3,339 24,733 -3% 68% 46,636 3% 72% 11 17% 2
Silver (95) (278) 2,527 -15% 7% 6,141 -4% 9% 5 8% -
Platinum (0) 32 116 -21% 0% 509 -7% 1% 1 2% -
Palladium 5 (13) 45 -15% 0% 228 2% 0% 1 2% -
Total Commodities 2,047 2,202 36,588 -9% 100% 64,688 2% 100% 64 100% 12
Net Cash Flows Turnover AUM # of Funds
Source: Deutsche Bank, Bloomberg Finance LP, FactSet. Data as of the end of last month.
Page 34 Deutsche Bank Securities Inc.
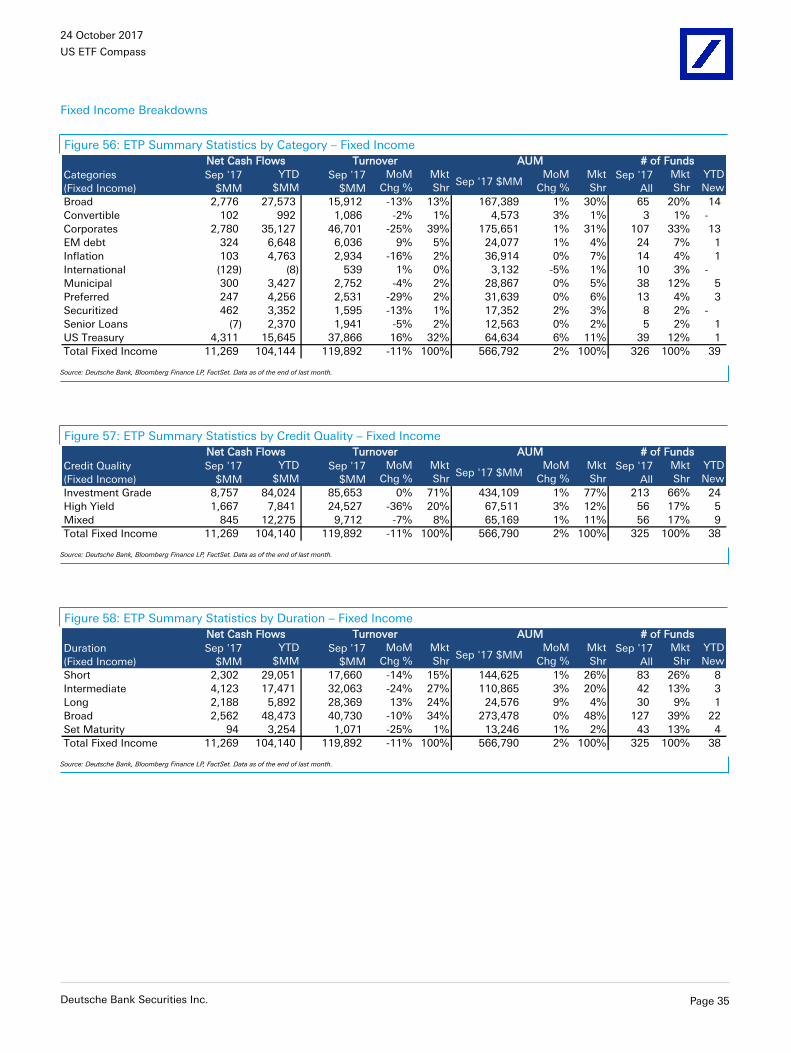
24 October 2017
US ETF Compass
Fixed Income Breakdowns
Figure 56: ETP Summary Statistics by Category – Fixed Income
Categories
(Fixed Income)
Sep '17
$MM
YTD
$MMSep '17
$MM
MoM
Chg %
Mkt
ShrSep '17 $MM
MoM
Chg %
Mkt
ShrSep '17
All
Mkt
Shr
YTD
New
Broad 2,776 27,573 15,912 -13% 13% 167,389 1% 30% 65 20% 14
Convertible 102 992 1,086 -2% 1% 4,573 3% 1% 3 1% -
Corporates 2,780 35,127 46,701 -25% 39% 175,651 1% 31% 107 33% 13
EM debt 324 6,648 6,036 9% 5% 24,077 1% 4% 24 7% 1
Inflation 103 4,763 2,934 -16% 2% 36,914 0% 7% 14 4% 1
International (129) (8) 539 1% 0% 3,132 -5% 1% 10 3% -
Municipal 300 3,427 2,752 -4% 2% 28,867 0% 5% 38 12% 5
Preferred 247 4,256 2,531 -29% 2% 31,639 0% 6% 13 4% 3
Securitized 462 3,352 1,595 -13% 1% 17,352 2% 3% 8 2% -
Senior Loans (7) 2,370 1,941 -5% 2% 12,563 0% 2% 5 2% 1
US Treasury 4,311 15,645 37,866 16% 32% 64,634 6% 11% 39 12% 1
Total Fixed Income 11,269 104,144 119,892 -11% 100% 566,792 2% 100% 326 100% 39
# of FundsNet Cash Flows Turnover AUM
Source: Deutsche Bank, Bloomberg Finance LP, FactSet. Data as of the end of last month.
Figure 57: ETP Summary Statistics by Credit Quality – Fixed Income
Credit Quality
(Fixed Income)
Sep '17
$MM
YTD
$MMSep '17
$MM
MoM
Chg %
Mkt
ShrSep '17 $MM
MoM
Chg %
Mkt
ShrSep '17
All
Mkt
Shr
YTD
New
Investment Grade 8,757 84,024 85,653 0% 71% 434,109 1% 77% 213 66% 24
High Yield 1,667 7,841 24,527 -36% 20% 67,511 3% 12% 56 17% 5
Mixed 845 12,275 9,712 -7% 8% 65,169 1% 11% 56 17% 9
Total Fixed Income 11,269 104,140 119,892 -11% 100% 566,790 2% 100% 325 100% 38
Net Cash Flows Turnover AUM # of Funds
Source: Deutsche Bank, Bloomberg Finance LP, FactSet. Data as of the end of last month.
Figure 58: ETP Summary Statistics by Duration – Fixed Income
Duration
(Fixed Income)
Sep '17
$MM
YTD
$MMSep '17
$MM
MoM
Chg %
Mkt
ShrSep '17 $MM
MoM
Chg %
Mkt
ShrSep '17
All
Mkt
Shr
YTD
New
Short 2,302 29,051 17,660 -14% 15% 144,625 1% 26% 83 26% 8
Intermediate 4,123 17,471 32,063 -24% 27% 110,865 3% 20% 42 13% 3
Long 2,188 5,892 28,369 13% 24% 24,576 9% 4% 30 9% 1
Broad 2,562 48,473 40,730 -10% 34% 273,478 0% 48% 127 39% 22
Set Maturity 94 3,254 1,071 -25% 1% 13,246 1% 2% 43 13% 4
Total Fixed Income 11,269 104,140 119,892 -11% 100% 566,790 2% 100% 325 100% 38
Net Cash Flows Turnover AUM # of Funds
Source: Deutsche Bank, Bloomberg Finance LP, FactSet. Data as of the end of last month.
Deutsche Bank Securities Inc. Page 35
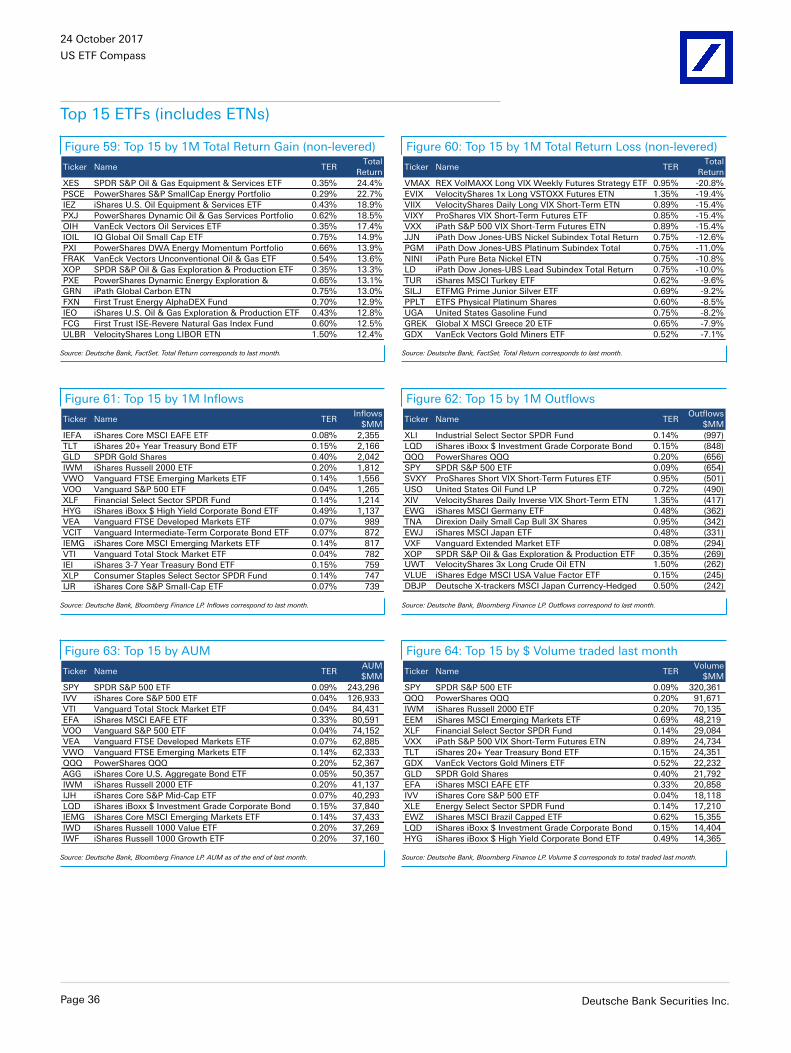
24 October 2017
US ETF Compass
Top 15 ETFs (includes ETNs)
Figure 59: Top 15 by 1M Total Return Gain (non-levered) Figure 60: Top 15 by 1M Total Return Loss (non-levered)
Ticker Name TERTotal
Return
XES SPDR S&P Oil & Gas Equipment & Services ETF 0.35% 24.4%
PSCE PowerShares S&P SmallCap Energy Portfolio 0.29% 22.7%
IEZ iShares U.S. Oil Equipment & Services ETF 0.43% 18.9%
PXJ PowerShares Dynamic Oil & Gas Services Portfolio 0.62% 18.5%
OIH VanEck Vectors Oil Services ETF 0.35% 17.4%
IOIL IQ Global Oil Small Cap ETF 0.75% 14.9%
PXI PowerShares DWA Energy Momentum Portfolio 0.66% 13.9%
FRAK VanEck Vectors Unconventional Oil & Gas ETF 0.54% 13.6%
XOP SPDR S&P Oil & Gas Exploration & Production ETF 0.35% 13.3%
PXE PowerShares Dynamic Energy Exploration & 0.65% 13.1%
GRN iPath Global Carbon ETN 0.75% 13.0%
FXN First Trust Energy AlphaDEX Fund 0.70% 12.9%
IEO iShares U.S. Oil & Gas Exploration & Production ETF 0.43% 12.8%
FCG First Trust ISE-Revere Natural Gas Index Fund 0.60% 12.5%
ULBR VelocityShares Long LIBOR ETN 1.50% 12.4%
Ticker Name TERTotal
Return
VMAX REX VolMAXX Long VIX Weekly Futures Strategy ETF 0.95% -20.8%
EVIX VelocityShares 1x Long VSTOXX Futures ETN 1.35% -19.4%
VIIX VelocityShares Daily Long VIX Short-Term ETN 0.89% -15.4%
VIXY ProShares VIX Short-Term Futures ETF 0.85% -15.4%
VXX iPath S&P 500 VIX Short-Term Futures ETN 0.89% -15.4%
JJN iPath Dow Jones-UBS Nickel Subindex Total Return 0.75% -12.6%
PGM iPath Dow Jones-UBS Platinum Subindex Total 0.75% -11.0%
NINI iPath Pure Beta Nickel ETN 0.75% -10.8%
LD iPath Dow Jones-UBS Lead Subindex Total Return 0.75% -10.0%
TUR iShares MSCI Turkey ETF 0.62% -9.6%
SILJ ETFMG Prime Junior Silver ETF 0.69% -9.2%
PPLT ETFS Physical Platinum Shares 0.60% -8.5%
UGA United States Gasoline Fund 0.75% -8.2%
GREK Global X MSCI Greece 20 ETF 0.65% -7.9%
GDX VanEck Vectors Gold Miners ETF 0.52% -7.1%
Source: Deutsche Bank, FactSet. Total Return corresponds to last month. Source: Deutsche Bank, FactSet. Total Return corresponds to last month.
Figure 61: Top 15 by 1M Inflows Figure 62: Top 15 by 1M Outflows
Ticker Name TERInflows
$MM
IEFA iShares Core MSCI EAFE ETF 0.08% 2,355
TLT iShares 20+ Year Treasury Bond ETF 0.15% 2,166
GLD SPDR Gold Shares 0.40% 2,042
IWM iShares Russell 2000 ETF 0.20% 1,812
VWO Vanguard FTSE Emerging Markets ETF 0.14% 1,556
VOO Vanguard S&P 500 ETF 0.04% 1,265
XLF Financial Select Sector SPDR Fund 0.14% 1,214
HYG iShares iBoxx $ High Yield Corporate Bond ETF 0.49% 1,137
VEA Vanguard FTSE Developed Markets ETF 0.07% 989
VCIT Vanguard Intermediate-Term Corporate Bond ETF 0.07% 872
IEMG iShares Core MSCI Emerging Markets ETF 0.14% 817
VTI Vanguard Total Stock Market ETF 0.04% 782
IEI iShares 3-7 Year Treasury Bond ETF 0.15% 759
XLP Consumer Staples Select Sector SPDR Fund 0.14% 747
IJR iShares Core S&P Small-Cap ETF 0.07% 739
Ticker Name TEROutflows
$MM
XLI Industrial Select Sector SPDR Fund 0.14% (997)
LQD iShares iBoxx $ Investment Grade Corporate Bond 0.15% (848)
QQQ PowerShares QQQ 0.20% (656)
SPY SPDR S&P 500 ETF 0.09% (654)
SVXY ProShares Short VIX Short-Term Futures ETF 0.95% (501)
USO United States Oil Fund LP 0.72% (490)
XIV VelocityShares Daily Inverse VIX Short-Term ETN 1.35% (417)
EWG iShares MSCI Germany ETF 0.48% (362)
TNA Direxion Daily Small Cap Bull 3X Shares 0.95% (342)
EWJ iShares MSCI Japan ETF 0.48% (331)
VXF Vanguard Extended Market ETF 0.08% (294)
XOP SPDR S&P Oil & Gas Exploration & Production ETF 0.35% (269) UWT VelocityShares 3x Long Crude Oil ETN 1.50% (262)
VLUE iShares Edge MSCI USA Value Factor ETF 0.15% (245)
DBJP Deutsche X-trackers MSCI Japan Currency-Hedged 0.50% (242)
Source: Deutsche Bank, Bloomberg Finance LP. Inflows correspond to last month. Source: Deutsche Bank, Bloomberg Finance LP. Outflows correspond to last month.
Figure 63: Top 15 by AUM Figure 64: Top 15 by $ Volume traded last month
Ticker Name TERAUM
$MM
SPY SPDR S&P 500 ETF 0.09% 243,296
IVV iShares Core S&P 500 ETF 0.04% 126,933
VTI Vanguard Total Stock Market ETF 0.04% 84,431
EFA iShares MSCI EAFE ETF 0.33% 80,591
VOO Vanguard S&P 500 ETF 0.04% 74,152
VEA Vanguard FTSE Developed Markets ETF 0.07% 62,885
VWO Vanguard FTSE Emerging Markets ETF 0.14% 62,333
QQQ PowerShares QQQ 0.20% 52,367
AGG iShares Core U.S. Aggregate Bond ETF 0.05% 50,357
IWM iShares Russell 2000 ETF 0.20% 41,137
IJH iShares Core S&P Mid-Cap ETF 0.07% 40,293
LQD iShares iBoxx $ Investment Grade Corporate Bond 0.15% 37,840
IEMG iShares Core MSCI Emerging Markets ETF 0.14% 37,433
IWD iShares Russell 1000 Value ETF 0.20% 37,269
IWF iShares Russell 1000 Growth ETF 0.20% 37,160
Ticker Name TERVolume
$MM
SPY SPDR S&P 500 ETF 0.09% 320,361
QQQ PowerShares QQQ 0.20% 91,671
IWM iShares Russell 2000 ETF 0.20% 70,135
EEM iShares MSCI Emerging Markets ETF 0.69% 48,219
XLF Financial Select Sector SPDR Fund 0.14% 29,084
VXX iPath S&P 500 VIX Short-Term Futures ETN 0.89% 24,734
TLT iShares 20+ Year Treasury Bond ETF 0.15% 24,351
GDX VanEck Vectors Gold Miners ETF 0.52% 22,232
GLD SPDR Gold Shares 0.40% 21,792
EFA iShares MSCI EAFE ETF 0.33% 20,858
IVV iShares Core S&P 500 ETF 0.04% 18,118
XLE Energy Select Sector SPDR Fund 0.14% 17,210
EWZ iShares MSCI Brazil Capped ETF 0.62% 15,355
LQD iShares iBoxx $ Investment Grade Corporate Bond 0.15% 14,404
HYG iShares iBoxx $ High Yield Corporate Bond ETF 0.49% 14,365
Source: Deutsche Bank, Bloomberg Finance LP. AUM as of the end of last month. Source: Deutsche Bank, Bloomberg Finance LP. Volume $ corresponds to total traded last month.
Page 36 Deutsche Bank Securities Inc.
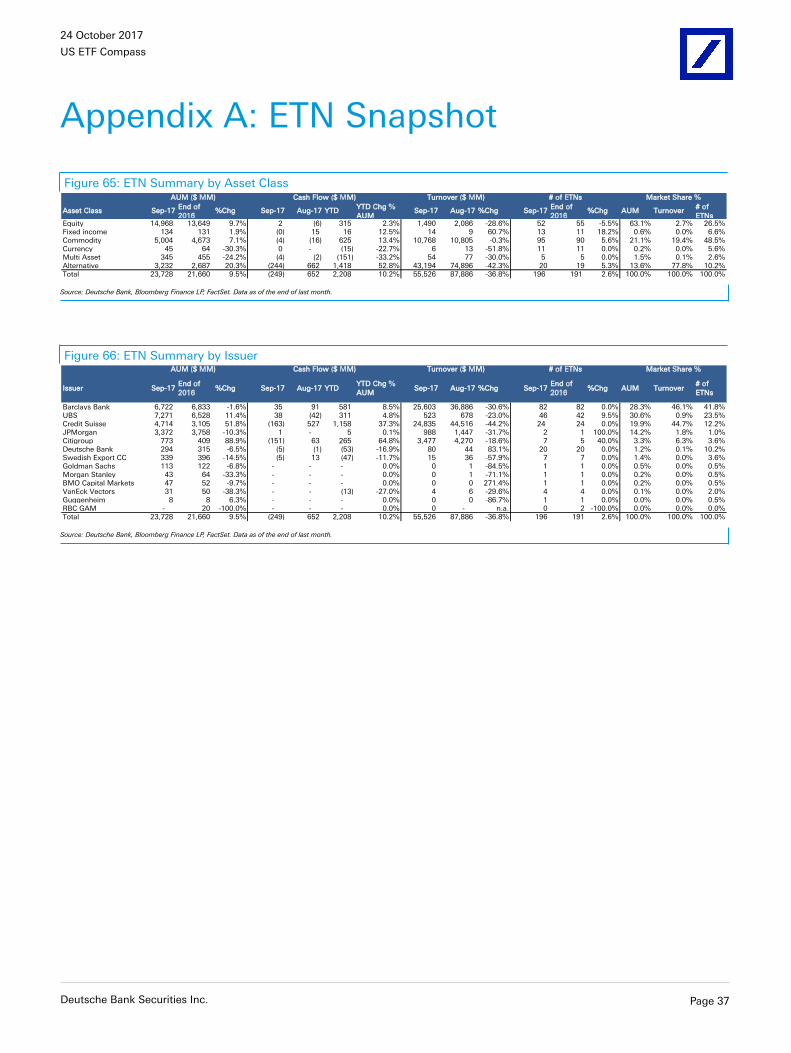
24 October 2017
US ETF Compass
Appendix A: ETN Snapshot
Figure 65: ETN Summary by Asset Class
Asset Class Sep-17End of
%Chg Sep-17 Aug-17 YTDYTD Chg %
AUMSep-17 Aug-17 %Chg Sep-17
End of %Chg AUM Turnover
# of
ETNsEquity 14,968 13,649 9.7% 2 (6) 315 2.3% 1,490 2,086 -28.6% 52 55 -5.5% 63.1% 2.7% 26.5%Fixed income 134 131 1.9% (0) 15 16 12.5% 14 9 60.7% 13 11 18.2% 0.6% 0.0% 6.6%Commodity 5,004 4,673 7.1% (4) (16) 625 13.4% 10,768 10,805 -0.3% 95 90 5.6% 21.1% 19.4% 48.5%Currency 45 64 -30.3% 0 - (15) -22.7% 6 13 -51.8% 11 11 0.0% 0.2% 0.0% 5.6%Multi Asset 345 455 -24.2% (4) (2) (151) -33.2% 54 77 -30.0% 5 5 0.0% 1.5% 0.1% 2.6%Alternative 3,232 2,687 20.3% (244) 662 1,418 52.8% 43,194 74,896 -42.3% 20 19 5.3% 13.6% 77.8% 10.2%Total 23,728 21,660 9.5% (249) 652 2,208 10.2% 55,526 87,886 -36.8% 196 191 2.6% 100.0% 100.0% 100.0%
AUM ($ MM) Cash Flow ($ MM) Turnover ($ MM) # of ETNs Market Share %
Source: Deutsche Bank, Bloomberg Finance LP, FactSet. Data as of the end of last month.
Figure 66: ETN Summary by Issuer
Issuer Sep-17End of
%Chg Sep-17 Aug-17 YTDYTD Chg %
AUMSep-17 Aug-17 %Chg Sep-17
End of %Chg AUM Turnover
# of
ETNs
Barclays Bank 6,722 6,833 -1.6% 35 91 581 8.5% 25,603 36,886 -30.6% 82 82 0.0% 28.3% 46.1% 41.8%UBS 7,271 6,528 11.4% 38 (42) 311 4.8% 523 678 -23.0% 46 42 9.5% 30.6% 0.9% 23.5%Credit Suisse 4,714 3,105 51.8% (163) 527 1,158 37.3% 24,835 44,516 -44.2% 24 24 0.0% 19.9% 44.7% 12.2%JPMorgan 3,372 3,758 -10.3% 1 - 5 0.1% 988 1,447 -31.7% 2 1 100.0% 14.2% 1.8% 1.0%Citigroup 773 409 88.9% (151) 63 265 64.8% 3,477 4,270 -18.6% 7 5 40.0% 3.3% 6.3% 3.6%Deutsche Bank 294 315 -6.5% (5) (1) (53) -16.9% 80 44 83.1% 20 20 0.0% 1.2% 0.1% 10.2%Swedish Export CC 339 396 -14.5% (5) 13 (47) -11.7% 15 36 -57.9% 7 7 0.0% 1.4% 0.0% 3.6%Goldman Sachs 113 122 -6.8% - - - 0.0% 0 1 -84.5% 1 1 0.0% 0.5% 0.0% 0.5%Morgan Stanley 43 64 -33.3% - - - 0.0% 0 1 -71.1% 1 1 0.0% 0.2% 0.0% 0.5%BMO Capital Markets 47 52 -9.7% - - - 0.0% 0 0 271.4% 1 1 0.0% 0.2% 0.0% 0.5%VanEck Vectors 31 50 -38.3% - - (13) -27.0% 4 6 -29.6% 4 4 0.0% 0.1% 0.0% 2.0%Guggenheim 8 8 6.3% - - - 0.0% 0 0 -86.7% 1 1 0.0% 0.0% 0.0% 0.5%RBC GAM - 20 -100.0% - - - 0.0% 0 - n.a. 0 2 -100.0% 0.0% 0.0% 0.0%Total 23,728 21,660 9.5% (249) 652 2,208 10.2% 55,526 87,886 -36.8% 196 191 2.6% 100.0% 100.0% 100.0%
AUM ($ MM) Cash Flow ($ MM) Turnover ($ MM) # of ETNs Market Share %
Source: Deutsche Bank, Bloomberg Finance LP, FactSet. Data as of the end of last month.
Deutsche Bank Securities Inc. Page 37
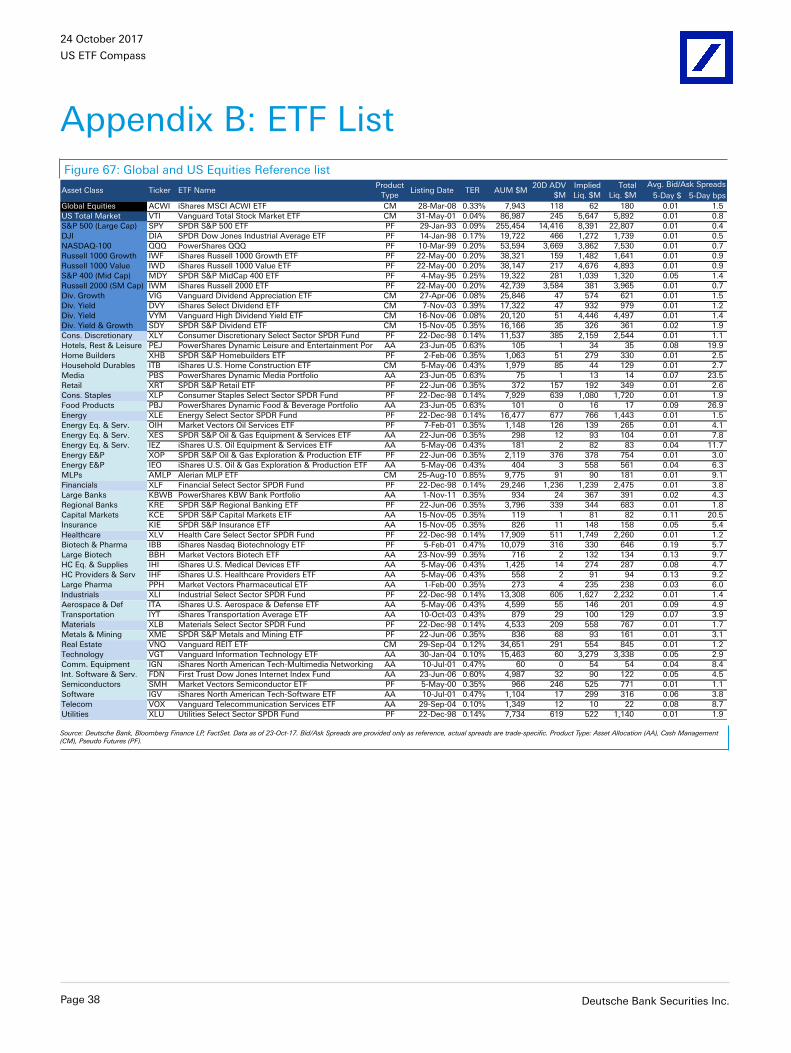
24 October 2017
US ETF Compass
Appendix B: ETF ListFigure 67: Global and US Equities Reference list
5-Day $ 5-Day bps
Global Equities ACWI iShares MSCI ACWI ETF CM 28-Mar-08 0.33% 7,943 118 62 180 0.01 1.5
US Total Market VTI Vanguard Total Stock Market ETF CM 31-May-01 0.04% 86,987 245 5,647 5,892 0.01 0.8
S&P 500 (Large Cap) SPY SPDR S&P 500 ETF PF 29-Jan-93 0.09% 255,454 14,416 8,391 22,807 0.01 0.4
DJI DIA SPDR Dow Jones Industrial Average ETF PF 14-Jan-98 0.17% 19,722 466 1,272 1,739 0.01 0.5
NASDAQ-100 QQQ PowerShares QQQ PF 10-Mar-99 0.20% 53,594 3,669 3,862 7,530 0.01 0.7
Russell 1000 Growth IWF iShares Russell 1000 Growth ETF PF 22-May-00 0.20% 38,321 159 1,482 1,641 0.01 0.9
Russell 1000 Value IWD iShares Russell 1000 Value ETF PF 22-May-00 0.20% 38,147 217 4,676 4,893 0.01 0.9
S&P 400 (Mid Cap) MDY SPDR S&P MidCap 400 ETF PF 4-May-95 0.25% 19,322 281 1,039 1,320 0.05 1.4
Russell 2000 (SM Cap) IWM iShares Russell 2000 ETF PF 22-May-00 0.20% 42,739 3,584 381 3,965 0.01 0.7
Div. Growth VIG Vanguard Dividend Appreciation ETF CM 27-Apr-06 0.08% 25,846 47 574 621 0.01 1.5
Div. Yield DVY iShares Select Dividend ETF CM 7-Nov-03 0.39% 17,322 47 932 979 0.01 1.2
Div. Yield VYM Vanguard High Dividend Yield ETF CM 16-Nov-06 0.08% 20,120 51 4,446 4,497 0.01 1.4
Div. Yield & Growth SDY SPDR S&P Dividend ETF CM 15-Nov-05 0.35% 16,166 35 326 361 0.02 1.9
Cons. Discretionary XLY Consumer Discretionary Select Sector SPDR Fund PF 22-Dec-98 0.14% 11,537 385 2,159 2,544 0.01 1.1
Hotels, Rest & Leisure PEJ PowerShares Dynamic Leisure and Entertainment PortfolAA 23-Jun-05 0.63% 105 1 34 35 0.08 19.9
Home Builders XHB SPDR S&P Homebuilders ETF PF 2-Feb-06 0.35% 1,063 51 279 330 0.01 2.5
Household Durables ITB iShares U.S. Home Construction ETF CM 5-May-06 0.43% 1,979 85 44 129 0.01 2.7
Media PBS PowerShares Dynamic Media Portfolio AA 23-Jun-05 0.63% 75 1 13 14 0.07 23.5
Retail XRT SPDR S&P Retail ETF PF 22-Jun-06 0.35% 372 157 192 349 0.01 2.6
Cons. Staples XLP Consumer Staples Select Sector SPDR Fund PF 22-Dec-98 0.14% 7,929 639 1,080 1,720 0.01 1.9
Food Products PBJ PowerShares Dynamic Food & Beverage Portfolio AA 23-Jun-05 0.63% 101 0 16 17 0.09 26.9
Energy XLE Energy Select Sector SPDR Fund PF 22-Dec-98 0.14% 16,477 677 766 1,443 0.01 1.5
Energy Eq. & Serv. OIH Market Vectors Oil Services ETF PF 7-Feb-01 0.35% 1,148 126 139 265 0.01 4.1
Energy Eq. & Serv. XES SPDR S&P Oil & Gas Equipment & Services ETF AA 22-Jun-06 0.35% 298 12 93 104 0.01 7.8
Energy Eq. & Serv. IEZ iShares U.S. Oil Equipment & Services ETF AA 5-May-06 0.43% 181 2 82 83 0.04 11.7
Energy E&P XOP SPDR S&P Oil & Gas Exploration & Production ETF PF 22-Jun-06 0.35% 2,119 376 378 754 0.01 3.0
Energy E&P IEO iShares U.S. Oil & Gas Exploration & Production ETF AA 5-May-06 0.43% 404 3 558 561 0.04 6.3
MLPs AMLP Alerian MLP ETF CM 25-Aug-10 0.85% 9,775 91 90 181 0.01 9.1
Financials XLF Financial Select Sector SPDR Fund PF 22-Dec-98 0.14% 29,246 1,236 1,239 2,475 0.01 3.8
Large Banks KBWB PowerShares KBW Bank Portfolio AA 1-Nov-11 0.35% 934 24 367 391 0.02 4.3
Regional Banks KRE SPDR S&P Regional Banking ETF PF 22-Jun-06 0.35% 3,796 339 344 683 0.01 1.8
Capital Markets KCE SPDR S&P Capital Markets ETF AA 15-Nov-05 0.35% 119 1 81 82 0.11 20.5
Insurance KIE SPDR S&P Insurance ETF AA 15-Nov-05 0.35% 826 11 148 158 0.05 5.4
Healthcare XLV Health Care Select Sector SPDR Fund PF 22-Dec-98 0.14% 17,909 511 1,749 2,260 0.01 1.2
Biotech & Pharma IBB iShares Nasdaq Biotechnology ETF PF 5-Feb-01 0.47% 10,079 316 330 646 0.19 5.7
Large Biotech BBH Market Vectors Biotech ETF AA 23-Nov-99 0.35% 716 2 132 134 0.13 9.7
HC Eq. & Supplies IHI iShares U.S. Medical Devices ETF AA 5-May-06 0.43% 1,425 14 274 287 0.08 4.7
HC Providers & Serv IHF iShares U.S. Healthcare Providers ETF AA 5-May-06 0.43% 558 2 91 94 0.13 9.2
Large Pharma PPH Market Vectors Pharmaceutical ETF AA 1-Feb-00 0.35% 273 4 235 238 0.03 6.0
Industrials XLI Industrial Select Sector SPDR Fund PF 22-Dec-98 0.14% 13,308 605 1,627 2,232 0.01 1.4
Aerospace & Def ITA iShares U.S. Aerospace & Defense ETF AA 5-May-06 0.43% 4,599 55 146 201 0.09 4.9
Transportation IYT iShares Transportation Average ETF AA 10-Oct-03 0.43% 879 29 100 129 0.07 3.9
Materials XLB Materials Select Sector SPDR Fund PF 22-Dec-98 0.14% 4,533 209 558 767 0.01 1.7
Metals & Mining XME SPDR S&P Metals and Mining ETF PF 22-Jun-06 0.35% 836 68 93 161 0.01 3.1
Real Estate VNQ Vanguard REIT ETF CM 29-Sep-04 0.12% 34,651 291 554 845 0.01 1.2
Technology VGT Vanguard Information Technology ETF AA 30-Jan-04 0.10% 15,463 60 3,279 3,338 0.05 2.9
Comm. Equipment IGN iShares North American Tech-Multimedia Networking AA 10-Jul-01 0.47% 60 0 54 54 0.04 8.4
Int. Software & Serv. FDN First Trust Dow Jones Internet Index Fund AA 23-Jun-06 0.60% 4,987 32 90 122 0.05 4.5
Semiconductors SMH Market Vectors Semiconductor ETF PF 5-May-00 0.35% 966 246 525 771 0.01 1.1
Software IGV iShares North American Tech-Software ETF AA 10-Jul-01 0.47% 1,104 17 299 316 0.06 3.8
Telecom VOX Vanguard Telecommunication Services ETF AA 29-Sep-04 0.10% 1,349 12 10 22 0.08 8.7
Utilities XLU Utilities Select Sector SPDR Fund PF 22-Dec-98 0.14% 7,734 619 522 1,140 0.01 1.9
AUM $M20D ADV
$M
Implied
Liq. $M
Total
Liq. $M
Avg. Bid/Ask SpreadsListing Date TER
Product
TypeAsset Class Ticker ETF Name
Source: Deutsche Bank, Bloomberg Finance LP, FactSet. Data as of 23-Oct-17. Bid/Ask Spreads are provided only as reference, actual spreads are trade-specific. Product Type: Asset Allocation (AA), Cash Management(CM), Pseudo Futures (PF).
Page 38 Deutsche Bank Securities Inc.
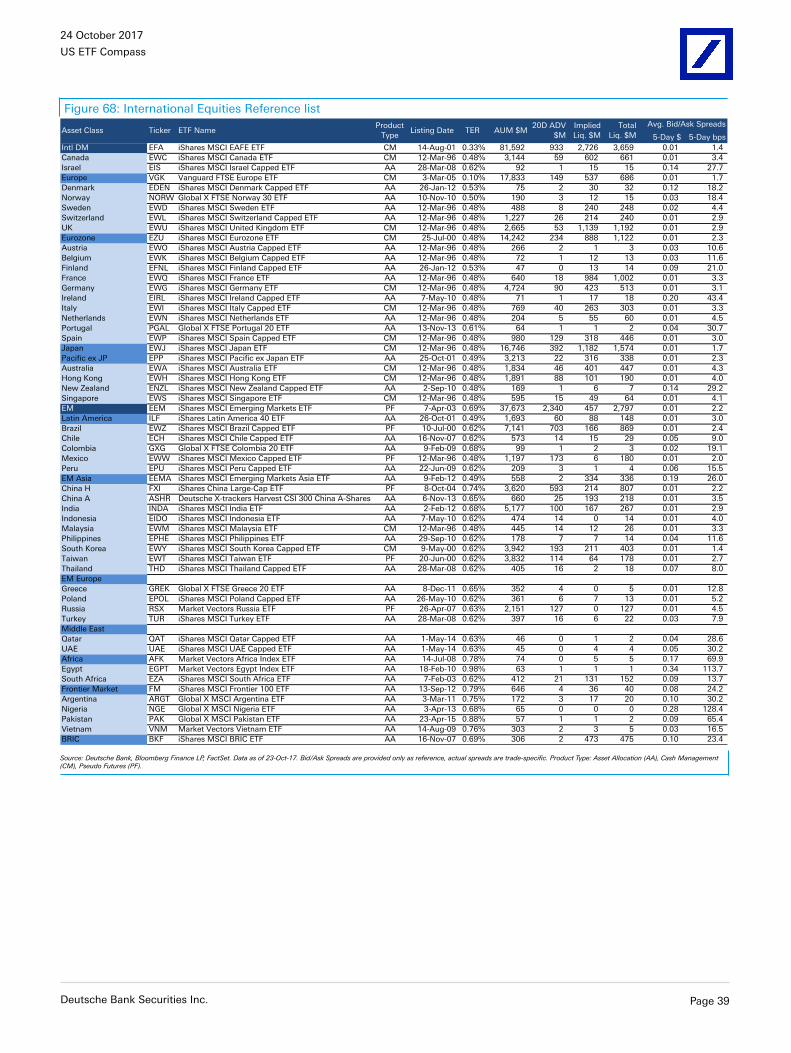
24 October 2017
US ETF Compass
Figure 68: International Equities Reference list
5-Day $ 5-Day bps
Intl DM EFA iShares MSCI EAFE ETF CM 14-Aug-01 0.33% 81,592 933 2,726 3,659 0.01 1.4
Canada EWC iShares MSCI Canada ETF CM 12-Mar-96 0.48% 3,144 59 602 661 0.01 3.4
Israel EIS iShares MSCI Israel Capped ETF AA 28-Mar-08 0.62% 92 1 15 15 0.14 27.7
Europe VGK Vanguard FTSE Europe ETF CM 3-Mar-05 0.10% 17,833 149 537 686 0.01 1.7
Denmark EDEN iShares MSCI Denmark Capped ETF AA 26-Jan-12 0.53% 75 2 30 32 0.12 18.2
Norway NORW Global X FTSE Norway 30 ETF AA 10-Nov-10 0.50% 190 3 12 15 0.03 18.4
Sweden EWD iShares MSCI Sweden ETF AA 12-Mar-96 0.48% 488 8 240 248 0.02 4.4
Switzerland EWL iShares MSCI Switzerland Capped ETF AA 12-Mar-96 0.48% 1,227 26 214 240 0.01 2.9
UK EWU iShares MSCI United Kingdom ETF CM 12-Mar-96 0.48% 2,665 53 1,139 1,192 0.01 2.9
Eurozone EZU iShares MSCI Eurozone ETF CM 25-Jul-00 0.48% 14,242 234 888 1,122 0.01 2.3
Austria EWO iShares MSCI Austria Capped ETF AA 12-Mar-96 0.48% 266 2 1 3 0.03 10.6
Belgium EWK iShares MSCI Belgium Capped ETF AA 12-Mar-96 0.48% 72 1 12 13 0.03 11.6
Finland EFNL iShares MSCI Finland Capped ETF AA 26-Jan-12 0.53% 47 0 13 14 0.09 21.0
France EWQ iShares MSCI France ETF AA 12-Mar-96 0.48% 640 18 984 1,002 0.01 3.3
Germany EWG iShares MSCI Germany ETF CM 12-Mar-96 0.48% 4,724 90 423 513 0.01 3.1
Ireland EIRL iShares MSCI Ireland Capped ETF AA 7-May-10 0.48% 71 1 17 18 0.20 43.4
Italy EWI iShares MSCI Italy Capped ETF CM 12-Mar-96 0.48% 769 40 263 303 0.01 3.3
Netherlands EWN iShares MSCI Netherlands ETF AA 12-Mar-96 0.48% 204 5 55 60 0.01 4.5
Portugal PGAL Global X FTSE Portugal 20 ETF AA 13-Nov-13 0.61% 64 1 1 2 0.04 30.7
Spain EWP iShares MSCI Spain Capped ETF CM 12-Mar-96 0.48% 980 129 318 446 0.01 3.0
Japan EWJ iShares MSCI Japan ETF CM 12-Mar-96 0.48% 16,746 392 1,182 1,574 0.01 1.7
Pacific ex JP EPP iShares MSCI Pacific ex Japan ETF AA 25-Oct-01 0.49% 3,213 22 316 338 0.01 2.3
Australia EWA iShares MSCI Australia ETF CM 12-Mar-96 0.48% 1,834 46 401 447 0.01 4.3
Hong Kong EWH iShares MSCI Hong Kong ETF CM 12-Mar-96 0.48% 1,891 88 101 190 0.01 4.0
New Zealand ENZL iShares MSCI New Zealand Capped ETF AA 2-Sep-10 0.48% 169 1 6 7 0.14 29.2
Singapore EWS iShares MSCI Singapore ETF CM 12-Mar-96 0.48% 595 15 49 64 0.01 4.1
EM EEM iShares MSCI Emerging Markets ETF PF 7-Apr-03 0.69% 37,673 2,340 457 2,797 0.01 2.2
Latin America ILF iShares Latin America 40 ETF AA 26-Oct-01 0.49% 1,693 60 88 148 0.01 3.0
Brazil EWZ iShares MSCI Brazil Capped ETF PF 10-Jul-00 0.62% 7,141 703 166 869 0.01 2.4
Chile ECH iShares MSCI Chile Capped ETF AA 16-Nov-07 0.62% 573 14 15 29 0.05 9.0
Colombia GXG Global X FTSE Colombia 20 ETF AA 9-Feb-09 0.68% 99 1 2 3 0.02 19.1
Mexico EWW iShares MSCI Mexico Capped ETF PF 12-Mar-96 0.48% 1,197 173 6 180 0.01 2.0
Peru EPU iShares MSCI Peru Capped ETF AA 22-Jun-09 0.62% 209 3 1 4 0.06 15.5
EM Asia EEMA iShares MSCI Emerging Markets Asia ETF AA 9-Feb-12 0.49% 558 2 334 336 0.19 26.0
China H FXI iShares China Large-Cap ETF PF 8-Oct-04 0.74% 3,620 593 214 807 0.01 2.2
China A ASHR Deutsche X-trackers Harvest CSI 300 China A-Shares E AA 6-Nov-13 0.65% 660 25 193 218 0.01 3.5
India INDA iShares MSCI India ETF AA 2-Feb-12 0.68% 5,177 100 167 267 0.01 2.9
Indonesia EIDO iShares MSCI Indonesia ETF AA 7-May-10 0.62% 474 14 0 14 0.01 4.0
Malaysia EWM iShares MSCI Malaysia ETF CM 12-Mar-96 0.48% 445 14 12 26 0.01 3.3
Philippines EPHE iShares MSCI Philippines ETF AA 29-Sep-10 0.62% 178 7 7 14 0.04 11.6
South Korea EWY iShares MSCI South Korea Capped ETF CM 9-May-00 0.62% 3,942 193 211 403 0.01 1.4
Taiwan EWT iShares MSCI Taiwan ETF PF 20-Jun-00 0.62% 3,832 114 64 178 0.01 2.7
Thailand THD iShares MSCI Thailand Capped ETF AA 28-Mar-08 0.62% 405 16 2 18 0.07 8.0
EM Europe
Greece GREK Global X FTSE Greece 20 ETF AA 8-Dec-11 0.65% 352 4 0 5 0.01 12.8
Poland EPOL iShares MSCI Poland Capped ETF AA 26-May-10 0.62% 361 6 7 13 0.01 5.2
Russia RSX Market Vectors Russia ETF PF 26-Apr-07 0.63% 2,151 127 0 127 0.01 4.5
Turkey TUR iShares MSCI Turkey ETF AA 28-Mar-08 0.62% 397 16 6 22 0.03 7.9
Middle East
Qatar QAT iShares MSCI Qatar Capped ETF AA 1-May-14 0.63% 46 0 1 2 0.04 28.6
UAE UAE iShares MSCI UAE Capped ETF AA 1-May-14 0.63% 45 0 4 4 0.05 30.2
Africa AFK Market Vectors Africa Index ETF AA 14-Jul-08 0.78% 74 0 5 5 0.17 69.9
Egypt EGPT Market Vectors Egypt Index ETF AA 18-Feb-10 0.98% 63 1 1 1 0.34 113.7
South Africa EZA iShares MSCI South Africa ETF AA 7-Feb-03 0.62% 412 21 131 152 0.09 13.7
Frontier Market FM iShares MSCI Frontier 100 ETF AA 13-Sep-12 0.79% 646 4 36 40 0.08 24.2
Argentina ARGT Global X MSCI Argentina ETF AA 3-Mar-11 0.75% 172 3 17 20 0.10 30.2
Nigeria NGE Global X MSCI Nigeria ETF AA 3-Apr-13 0.68% 65 0 0 0 0.28 128.4
Pakistan PAK Global X MSCI Pakistan ETF AA 23-Apr-15 0.88% 57 1 1 2 0.09 65.4
Vietnam VNM Market Vectors Vietnam ETF AA 14-Aug-09 0.76% 303 2 3 5 0.03 16.5
BRIC BKF iShares MSCI BRIC ETF AA 16-Nov-07 0.69% 306 2 473 475 0.10 23.4
Total
Liq. $MAsset Class Ticker ETF Name
Product
TypeListing Date
Avg. Bid/Ask SpreadsTER AUM $M
20D ADV
$M
Implied
Liq. $M
Source: Deutsche Bank, Bloomberg Finance LP, FactSet. Data as of 23-Oct-17. Bid/Ask Spreads are provided only as reference, actual spreads are trade-specific. Product Type: Asset Allocation (AA), Cash Management(CM), Pseudo Futures (PF).
Deutsche Bank Securities Inc. Page 39
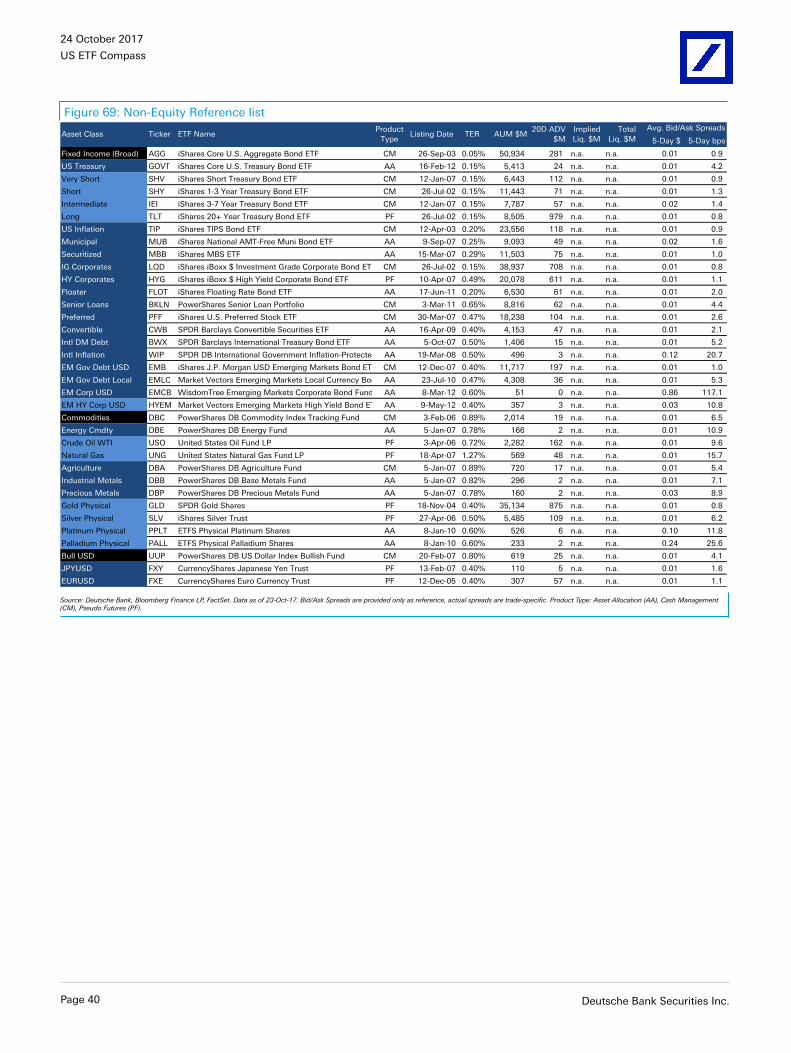
24 October 2017
US ETF Compass
Figure 69: Non-Equity Reference list
5-Day $ 5-Day bps
Fixed Income (Broad) AGG iShares Core U.S. Aggregate Bond ETF CM 26-Sep-03 0.05% 50,934 281 n.a. n.a. 0.01 0.9
US Treasury GOVT iShares Core U.S. Treasury Bond ETF AA 16-Feb-12 0.15% 5,413 24 n.a. n.a. 0.01 4.2
Very Short SHV iShares Short Treasury Bond ETF CM 12-Jan-07 0.15% 6,443 112 n.a. n.a. 0.01 0.9
Short SHY iShares 1-3 Year Treasury Bond ETF CM 26-Jul-02 0.15% 11,443 71 n.a. n.a. 0.01 1.3
Intermediate IEI iShares 3-7 Year Treasury Bond ETF CM 12-Jan-07 0.15% 7,787 57 n.a. n.a. 0.02 1.4
Long TLT iShares 20+ Year Treasury Bond ETF PF 26-Jul-02 0.15% 8,505 979 n.a. n.a. 0.01 0.8
US Inflation TIP iShares TIPS Bond ETF CM 12-Apr-03 0.20% 23,556 118 n.a. n.a. 0.01 0.9
Municipal MUB iShares National AMT-Free Muni Bond ETF AA 9-Sep-07 0.25% 9,093 49 n.a. n.a. 0.02 1.6
Securitized MBB iShares MBS ETF AA 15-Mar-07 0.29% 11,503 75 n.a. n.a. 0.01 1.0
IG Corporates LQD iShares iBoxx $ Investment Grade Corporate Bond ETF CM 26-Jul-02 0.15% 38,937 708 n.a. n.a. 0.01 0.8
HY Corporates HYG iShares iBoxx $ High Yield Corporate Bond ETF PF 10-Apr-07 0.49% 20,078 611 n.a. n.a. 0.01 1.1
Floater FLOT iShares Floating Rate Bond ETF AA 17-Jun-11 0.20% 6,530 61 n.a. n.a. 0.01 2.0
Senior Loans BKLN PowerShares Senior Loan Portfolio CM 3-Mar-11 0.65% 8,816 62 n.a. n.a. 0.01 4.4
Preferred PFF iShares U.S. Preferred Stock ETF CM 30-Mar-07 0.47% 18,238 104 n.a. n.a. 0.01 2.6
Convertible CWB SPDR Barclays Convertible Securities ETF AA 16-Apr-09 0.40% 4,153 47 n.a. n.a. 0.01 2.1
Intl DM Debt BWX SPDR Barclays International Treasury Bond ETF AA 5-Oct-07 0.50% 1,406 15 n.a. n.a. 0.01 5.2
Intl Inflation WIP SPDR DB International Government Inflation-Protected AA 19-Mar-08 0.50% 496 3 n.a. n.a. 0.12 20.7
EM Gov Debt USD EMB iShares J.P. Morgan USD Emerging Markets Bond ETF CM 12-Dec-07 0.40% 11,717 197 n.a. n.a. 0.01 1.0
EM Gov Debt Local EMLC Market Vectors Emerging Markets Local Currency Bon AA 23-Jul-10 0.47% 4,308 36 n.a. n.a. 0.01 5.3
EM Corp USD EMCB WisdomTree Emerging Markets Corporate Bond Fund AA 8-Mar-12 0.60% 51 0 n.a. n.a. 0.86 117.1
EM HY Corp USD HYEM Market Vectors Emerging Markets High Yield Bond ET AA 9-May-12 0.40% 357 3 n.a. n.a. 0.03 10.8
Commodities DBC PowerShares DB Commodity Index Tracking Fund CM 3-Feb-06 0.89% 2,014 19 n.a. n.a. 0.01 6.5
Energy Cmdty DBE PowerShares DB Energy Fund AA 5-Jan-07 0.78% 166 2 n.a. n.a. 0.01 10.9
Crude Oil WTI USO United States Oil Fund LP PF 3-Apr-06 0.72% 2,282 162 n.a. n.a. 0.01 9.6
Natural Gas UNG United States Natural Gas Fund LP PF 18-Apr-07 1.27% 569 48 n.a. n.a. 0.01 15.7
Agriculture DBA PowerShares DB Agriculture Fund CM 5-Jan-07 0.89% 720 17 n.a. n.a. 0.01 5.4
Industrial Metals DBB PowerShares DB Base Metals Fund AA 5-Jan-07 0.82% 296 2 n.a. n.a. 0.01 7.1
Precious Metals DBP PowerShares DB Precious Metals Fund AA 5-Jan-07 0.78% 160 2 n.a. n.a. 0.03 8.9
Gold Physical GLD SPDR Gold Shares PF 18-Nov-04 0.40% 35,134 875 n.a. n.a. 0.01 0.8
Silver Physical SLV iShares Silver Trust PF 27-Apr-06 0.50% 5,485 109 n.a. n.a. 0.01 6.2
Platinum Physical PPLT ETFS Physical Platinum Shares AA 8-Jan-10 0.60% 526 6 n.a. n.a. 0.10 11.8
Palladium Physical PALL ETFS Physical Palladium Shares AA 8-Jan-10 0.60% 233 2 n.a. n.a. 0.24 25.6
Bull USD UUP PowerShares DB US Dollar Index Bullish Fund CM 20-Feb-07 0.80% 619 25 n.a. n.a. 0.01 4.1
JPYUSD FXY CurrencyShares Japanese Yen Trust PF 13-Feb-07 0.40% 110 5 n.a. n.a. 0.01 1.6
EURUSD FXE CurrencyShares Euro Currency Trust PF 12-Dec-05 0.40% 307 57 n.a. n.a. 0.01 1.1
Asset Class Ticker ETF NameProduct
TypeListing Date TER AUM $M
20D ADV
$M
Implied
Liq. $M
Total
Liq. $M
Avg. Bid/Ask Spreads
Source: Deutsche Bank, Bloomberg Finance LP, FactSet. Data as of 23-Oct-17. Bid/Ask Spreads are provided only as reference, actual spreads are trade-specific. Product Type: Asset Allocation (AA), Cash Management(CM), Pseudo Futures (PF).
Page 40 Deutsche Bank Securities Inc.
24 October 2017
US ETF Compass
Appendix C: DefinitionsETP Universe Definitions
Exchange-Traded Products (ETPs)We define an exchange-traded product (ETP) as a secure (funded or collateralized)open-ended exchange-traded equity with no embedded optionality and market-wide appeal to investors. This includes exchange traded funds (ETF), andexchange-traded vehicles (ETV). The vast majority of instruments are ETFs (~98%in AUM).
Exchange-Traded Funds (ETFs)ETFs are open-ended funds which are listed on an exchange and offer intra-daydual liquidity to access diversified investments in a transparent, cheap, and taxefficient way. ETFs indexed to equity and fixed income benchmarks are registeredunder the investment company act of 1940. Only physical index replicationtechniques are permissible by this legislation while synthetic replication is notallowed.
Exchange-traded vehicles (ETVs)This terminology typically refers to grantor trusts that exist in the US market.These instruments track primarily commodity benchmarks. They differ fromETFs in that they are registered under the Securities Act of 1933 and not theInvestment Company Act of 1940, hence they are not classed as funds. Vehiclesthat replicate commodity benchmarks, more often known as pools, and fundstargeting alternative index returns are formed under the Commodities ExchangeAct and are listed under the 33 Securities Act, and report under 34 Corporate Act.
Management Style or Product Strategy Definitions
BetaThis is the main group with the largest number of products and assets.Within this category we account for all those ETFs that track an index whichemploys a market capitalization weighting methodology, and a simple selectionmethodology usually involving screenings such as minimum market cap andliquidity levels, or profitability levels. ETFs in this group are also referred to as“plain-vanilla” ETFs. Some examples of indices falling within this category are:S&P 500, S&P 400, S&P 600, MSCI EAFE, MSCI EM, Russell 2000, and Russell1000, to name a few.
Beta+In this group we include every product that offers any level of leverage or inverseimplementation. For example, an ETF offering access to twice the daily returnsof the S&P 500 on either direction (long or short) would be classified under thiscategory.
ActiveClassifying products in this group is still easy; basically if the ETF doesn’t trackany index then we classify the fund as active.
Enhanced Beta (aka Smart Beta)This category is reserved for those ETFs that also track an index, but whichfollow more elaborated strategies. After defining an index universe, there aretwo main levers that determine most of the risk/return profile of the index: (1)
Deutsche Bank Securities Inc. Page 41
24 October 2017
US ETF Compass
the selection criteria, and (2) the weighting criteria. In their selection process,enhanced beta ETFs usually employ additional screening processes and scoringsystems involving multiple factors beyond just minimum market cap and liquiditylevels. For example, they could include growth or value scores, dividends paidor dividend yield, earnings, volatility, or momentum screens, to name a few. Theweighting methodology of enhanced beta ETFs is usually anything but marketcap weighted, it can include simple equal weighting or variations of it, optimizedweights, and other metric-specific weights such as those based on dividendspaid, inverse volatility, dividend yield, fundamental multi factor scores, earnings,and revenues, to name a few. An enhanced beta ETF will either have a non-traditional selection methodology, a non-traditional weighting methodology, or acombination of both.
Product Type Definitions
Asset Allocation ETFsThis group covers all ETFs with exception of levered and inverse products. Theseare usually good products for market access strategies, portfolio completion, andcore positions. They are also efficient building blocks for multi asset strategies.When selecting these products, major emphasis should be set on the desiredexposure, tracking efficiency, primary liquidity (i.e. the liquidity of the underlyingbasket), and cost.
Cash Management ETFsThis group covers a more selected group of ETFs which in addition to beinggood asset allocation tools, also serves a series of cash management portfolioneeds. For example, these products are very good for equitizing cash betweentransitions, around reporting periods (window dressing), and during tax lossharvesting. These ETFs usually have good liquidity, large fund size, and lowcost, all of which makes it easier to execute sizeable short-term transactions,therefore secondary market liquidity and fund size tend to be a more relevantfactor compared to asset allocation ETFs. The most popular asset allocation usageof these funds is as core building blocks.
Pseudo Futures ETFsThis group covers an even more selected sample of ETFs which in additionto being good asset allocation and cash management tools can also be usedfor fulfilling risk management functions such as risk hedging, portable alphastrategies, or tactical shorts. Many times they also trade at a cheaper level thantheir underlying basket, and offer large amounts of liquidity which can make themattractive for market making activities as well. Secondary and short liquidity (easeto borrow), and fund size tend to be more relevant characteristics at the momentof selecting this type of ETFs. There is usually no more than one pseudo futuresETF per asset class. The most popular asset allocation usage of these fundsis among portfolios that require more liquidity given their size or more tacticalnature.
Page 42 Deutsche Bank Securities Inc.

24 October 2017
US ETF Compass
Figure 70: Selection Criteria depending on intended ETF usageCriteria Measured by Source Pseudo Futures Cash Mgmt Asset Allocation
Secondary Liquidity (quantity) Avg. Daily Value traded in $ FactSet More Relevant More Relevant Less Relevant
Secondary Liquidity (cost) Avg. Bid/Ask Spreads Bloomberg Finance LP More Relevant More Relevant Less Relevant
Primary Liquidity Implied liquidity of basket Bloomberg Finance LP Less Relevant Less Relevant More Relevant
Short Liquidity (quantity) Short Interest/ Shrs. Out. % Bloomberg Finance LP More Relevant Less Relevant Less Relevant
Short Liquidity (cost) Avg. Borrow Rate Deutsche Bank More Relevant Less Relevant Less Relevant
Size AUM $ Bloomberg Finance LP More Relevant More Relevant Less Relevant
Ownership:
Brokers+Hedge Funds Ownership % FactSet More Relevant Relevant Less Relevant
Mutual Funds+Pension Funds Ownership % FactSet Relevant More Relevant Relevant
Invest. Adviser+Private Bank/WM+Retail Ownership % FactSet Less Relevant Less Relevant More Relevant
Flow Activity Abs(Daily Flows Median) $ Bloomberg Finance LP More Relevant Less Relevant Less Relevant
Cost Total Expense Ratio ETF Issuer Less Relevant Relevant More Relevant
Exposure/Benchmark Investor's objective Investor Relevant Relevant More Relevant
Tracking efficiency to Index NAV-Index Performance dif. Bloomberg Finance LP Less Relevant Relevant More Relevant
Tracking efficiency to NAV Price-NAV premium/discounts Bloomberg Finance LP Less Relevant Relevant More Relevant
Product Provider Assets, products, years Combination of above Less Relevant Less Relevant Relevant
Source: Deutsche Bank.
Deutsche Bank Securities Inc. Page 43
24 October 2017
US ETF Compass
The authors of this report wish to acknowledge the contribution made by AlfonsoDelgado Valdivia, employee of Evalueserve, a third-party provider of offshoreresearch support services to Deutsche Bank.
Page 44 Deutsche Bank Securities Inc.
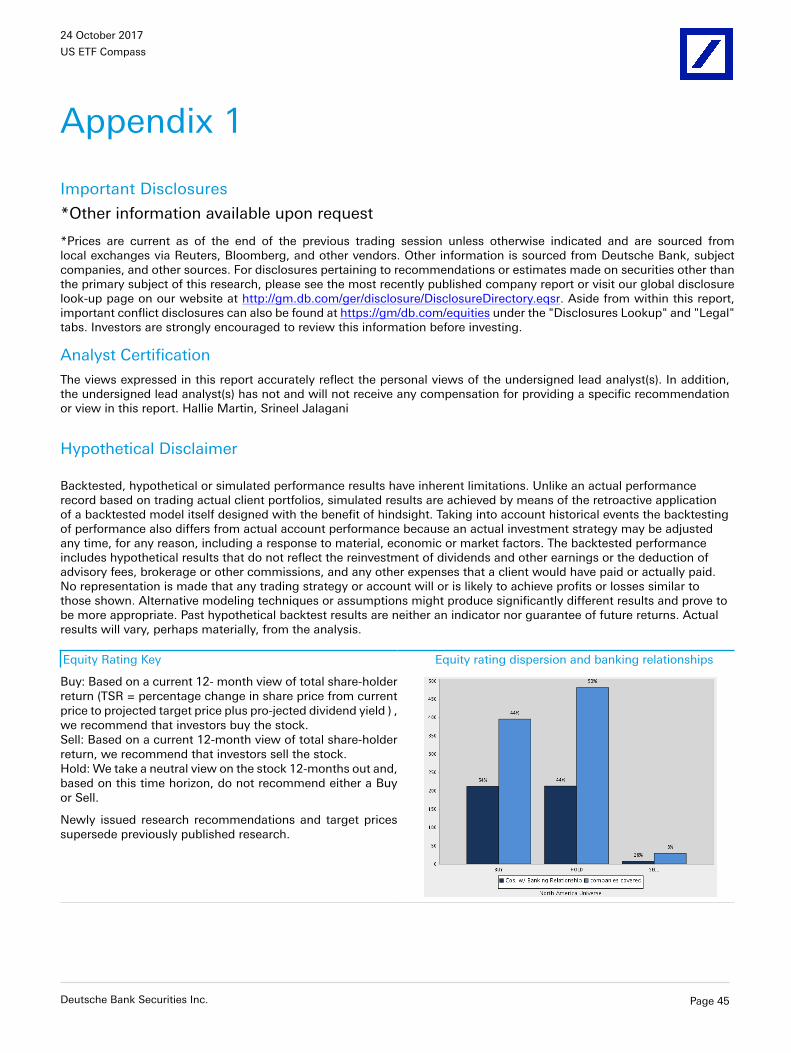
24 October 2017
US ETF Compass
Appendix 1
Important Disclosures
*Other information available upon request
*Prices are current as of the end of the previous trading session unless otherwise indicated and are sourced fromlocal exchanges via Reuters, Bloomberg, and other vendors. Other information is sourced from Deutsche Bank, subjectcompanies, and other sources. For disclosures pertaining to recommendations or estimates made on securities other thanthe primary subject of this research, please see the most recently published company report or visit our global disclosurelook-up page on our website at http://gm.db.com/ger/disclosure/DisclosureDirectory.eqsr. Aside from within this report,important conflict disclosures can also be found at https://gm/db.com/equities under the "Disclosures Lookup" and "Legal"tabs. Investors are strongly encouraged to review this information before investing.
Analyst Certification
The views expressed in this report accurately reflect the personal views of the undersigned lead analyst(s). In addition,the undersigned lead analyst(s) has not and will not receive any compensation for providing a specific recommendationor view in this report. Hallie Martin, Srineel Jalagani
Hypothetical Disclaimer
Backtested, hypothetical or simulated performance results have inherent limitations. Unlike an actual performancerecord based on trading actual client portfolios, simulated results are achieved by means of the retroactive applicationof a backtested model itself designed with the benefit of hindsight. Taking into account historical events the backtestingof performance also differs from actual account performance because an actual investment strategy may be adjustedany time, for any reason, including a response to material, economic or market factors. The backtested performanceincludes hypothetical results that do not reflect the reinvestment of dividends and other earnings or the deduction ofadvisory fees, brokerage or other commissions, and any other expenses that a client would have paid or actually paid.No representation is made that any trading strategy or account will or is likely to achieve profits or losses similar tothose shown. Alternative modeling techniques or assumptions might produce significantly different results and prove tobe more appropriate. Past hypothetical backtest results are neither an indicator nor guarantee of future returns. Actualresults will vary, perhaps materially, from the analysis.
Equity Rating Key Equity rating dispersion and banking relationships
Buy: Based on a current 12- month view of total share-holderreturn (TSR = percentage change in share price from currentprice to projected target price plus pro-jected dividend yield ) ,we recommend that investors buy the stock.Sell: Based on a current 12-month view of total share-holderreturn, we recommend that investors sell the stock.Hold: We take a neutral view on the stock 12-months out and,based on this time horizon, do not recommend either a Buyor Sell.
Newly issued research recommendations and target pricessupersede previously published research.
Deutsche Bank Securities Inc. Page 45
24 October 2017
US ETF Compass
Additional Information
?The information and opinions in this report were prepared by Deutsche Bank AG or one of its affiliates (collectively"Deutsche Bank"). Though the information herein is believed to be reliable and has been obtained from public sourcesbelieved to be reliable, Deutsche Bank makes no representation as to its accuracy or completeness. Hyperlinks to third-party websites in this report are provided for reader convenience only. Deutsche Bank neither endorses the content noris responsible for the accuracy or security controls of these websites.
If you use the services of Deutsche Bank in connection with a purchase or sale of a security that is discussed in this report,or is included or discussed in another communication (oral or written) from a Deutsche Bank analyst, Deutsche Bank mayact as principal for its own account or as agent for another person.
Deutsche Bank may consider this report in deciding to trade as principal. It may also engage in transactions, for itsown account or with customers, in a manner inconsistent with the views taken in this research report. Others withinDeutsche Bank, including strategists, sales staff and other analysts, may take views that are inconsistent with those takenin this research report. Deutsche Bank issues a variety of research products, including fundamental analysis, equity-linkedanalysis, quantitative analysis and trade ideas. Recommendations contained in one type of communication may differfrom recommendations contained in others, whether as a result of differing time horizons, methodologies or otherwise.Deutsche Bank and/or its affiliates may also be holding debt or equity securities of the issuers it writes on. Analysts arepaid in part based on the profitability of Deutsche Bank AG and its affiliates, which includes investment banking, tradingand principal trading revenues.
Opinions, estimates and projections constitute the current judgment of the author as of the date of this report. They donot necessarily reflect the opinions of Deutsche Bank and are subject to change without notice. Deutsche Bank providesliquidity for buyers and sellers of securities issued by the companies it covers. Deutsche Bank research analysts sometimeshave shorter-term trade ideas that are consistent or inconsistent with Deutsche Bank's existing longer term ratings. Tradeideas for equities can be found at the SOLAR link at http://gm.db.com. A SOLAR idea represents a high conviction beliefby an analyst that a stock will outperform or underperform the market and/or sector delineated over a time frame of noless than two weeks. In addition to SOLAR ideas, the analysts named in this report may from time to time discuss withour clients, Deutsche Bank salespersons and Deutsche Bank traders, trading strategies or ideas that reference catalystsor events that may have a near-term or medium-term impact on the market price of the securities discussed in this report,which impact may be directionally counter to the analysts' current 12-month view of total return or investment return asdescribed herein. Deutsche Bank has no obligation to update, modify or amend this report or to otherwise notify a recipientthereof if any opinion, forecast or estimate contained herein changes or subsequently becomes inaccurate. Coverage andthe frequency of changes in market conditions and in both general and company specific economic prospects make itdifficult to update research at defined intervals. Updates are at the sole discretion of the coverage analyst concerned or ofthe Research Department Management and as such the majority of reports are published at irregular intervals. This reportis provided for informational purposes only and does not take into account the particular investment objectives, financialsituations, or needs of individual clients. It is not an offer or a solicitation of an offer to buy or sell any financial instrumentsor to participate in any particular trading strategy. Target prices are inherently imprecise and a product of the analyst ’ sjudgment. The financial instruments discussed in this report may not be suitable for all investors and investors must maketheir own informed investment decisions. Prices and availability of financial instruments are subject to change withoutnotice and investment transactions can lead to losses as a result of price fluctuations and other factors. If a financialinstrument is denominated in a currency other than an investor's currency, a change in exchange rates may adverselyaffect the investment. Past performance is not necessarily indicative of future results. Unless otherwise indicated, pricesare current as of the end of the previous trading session, and are sourced from local exchanges via Reuters, Bloombergand other vendors. Data is sourced from Deutsche Bank, subject companies, and in some cases, other parties.
The Deutsche Bank Research Department is independent of other business areas divisions of the Bank. Details regardingour organizational arrangements and information barriers we have to prevent and avoid conflicts of interest with respectto our research is available on our website under Disclaimer found on the Legal tab.??Macroeconomic fluctuations often account for most of the risks associated with exposures to instruments that promiseto pay fixed or variable interest rates. For an investor who is long fixed rate instruments (thus receiving these cash flows),
Page 46 Deutsche Bank Securities Inc.
24 October 2017
US ETF Compass
increases in interest rates naturally lift the discount factors applied to the expected cash flows and thus cause a loss.The longer the maturity of a certain cash flow and the higher the move in the discount factor, the higher will be theloss. Upside surprises in inflation, fiscal funding needs, and FX depreciation rates are among the most common adversemacroeconomic shocks to receivers. But counterparty exposure, issuer creditworthiness, client segmentation, regulation(including changes in assets holding limits for different types of investors), changes in tax policies, currency convertibility(which may constrain currency conversion, repatriation of profits and/or the liquidation of positions), and settlement issuesrelated to local clearing houses are also important risk factors to be considered. The sensitivity of fixed income instrumentsto macroeconomic shocks may be mitigated by indexing the contracted cash flows to inflation, to FX depreciation, or tospecified interest rates – these are common in emerging markets. It is important to note that the index fixings may -- byconstruction -- lag or mis-measure the actual move in the underlying variables they are intended to track. The choice of theproper fixing (or metric) is particularly important in swaps markets, where floating coupon rates (i.e., coupons indexed toa typically short-dated interest rate reference index) are exchanged for fixed coupons. It is also important to acknowledgethat funding in a currency that differs from the currency in which coupons are denominated carries FX risk. Naturally,options on swaps (swaptions) also bear the risks typical to options in addition to the risks related to rates movements.??Derivative transactions involve numerous risks including, among others, market, counterparty default and illiquidity risk.The appropriateness or otherwise of these products for use by investors is dependent on the investors' own circumstancesincluding their tax position, their regulatory environment and the nature of their other assets and liabilities, and as such,investors should take expert legal and financial advice before entering into any transaction similar to or inspired by thecontents of this publication. The risk of loss in futures trading and options, foreign or domestic, can be substantial. As aresult of the high degree of leverage obtainable in futures and options trading, losses may be incurred that are greaterthan the amount of funds initially deposited. Trading in options involves risk and is not suitable for all investors. Priorto buying or selling an option investors must review the "Characteristics and Risks of Standardized Options”, at http://www.optionsclearing.com/about/publications/character-risks.jsp. If you are unable to access the website please contactyour Deutsche Bank representative for a copy of this important document.?
Participants in foreign exchange transactions may incur risks arising from several factors, including the following: ( i)exchange rates can be volatile and are subject to large fluctuations; ( ii) the value of currencies may be affected bynumerous market factors, including world and national economic, political and regulatory events, events in equity anddebt markets and changes in interest rates; and (iii) currencies may be subject to devaluation or government imposedexchange controls which could affect the value of the currency. Investors in securities such as ADRs, whose values areaffected by the currency of an underlying security, effectively assume currency risk.?
Unless governing law provides otherwise, all transactions should be executed through the Deutsche Bank entity in theinvestor's home jurisdiction. Aside from within this report, important conflict disclosures can also be found at https://gm.db.com/equities under the "Disclosures Lookup" and "Legal" tabs. Investors are strongly encouraged to review thisinformation before investing.
Deutsche Bank (which includes Deutsche Bank AG, its branches and all affiliated companies) is not acting as a financialadviser, consultant or fiduciary to you, any of your agents (collectively, "You" or "Your") with respect to any informationprovided in the materials attached hereto. Deutsche Bank does not provide investment, legal, tax or accounting advice,Deutsche Bank is not acting as Your impartial adviser, and does not express any opinion or recommendation whatsoeveras to any strategies, products or any other information presented in the materials. Information contained herein is beingprovided solely on the basis that the recipient will make an independent assessment of the merits of any investmentdecision, and it does not constitute a recommendation of, or express an opinion on, any product or service or any tradingstrategy.
The information presented is general in nature and is not directed to retirement accounts or any specific person or accounttype, and is therefore provided to You on the express basis that it is not advice, and You may not rely upon it in makingYour decision. The information we provide is being directed only to persons we believe to be financially sophisticated,who are capable of evaluating investment risks independently, both in general and with regard to particular transactionsand investment strategies, and who understand that Deutsche Bank has financial interests in the offering of its productsand services. If this is not the case, or if You are an IRA or other retail investor receiving this directly from us, we askthat you inform us immediately.
Deutsche Bank Securities Inc. Page 47
24 October 2017
US ETF Compass
United States: Approved and/or distributed by Deutsche Bank Securities Incorporated, a member of FINRA, NFA and SIPC.Analysts located outside of the United States are employed by non-US affiliates that are not subject to FINRA regulations.
Germany: Approved and/or distributed by Deutsche Bank AG, a joint stock corporation with limited liability incorporatedin the Federal Republic of Germany with its principal office in Frankfurt am Main. Deutsche Bank AG is authorized underGerman Banking Law and is subject to supervision by the European Central Bank and by BaFin, Germany ’ s FederalFinancial Supervisory Authority.
United Kingdom: Approved and/or distributed by Deutsche Bank AG acting through its London Branch at WinchesterHouse, 1 Great Winchester Street, London EC2N 2DB. Deutsche Bank AG in the United Kingdom is authorised by thePrudential Regulation Authority and is subject to limited regulation by the Prudential Regulation Authority and FinancialConduct Authority. Details about the extent of our authorisation and regulation are available on request.??Hong Kong: Distributed by Deutsche Bank AG, Hong Kong Branch or Deutsche Securities Asia Limited.??India: Prepared by Deutsche Equities India Pvt Ltd, which is registered by the Securities and Exchange Board of India (SEBI)as a stock broker. Research Analyst SEBI Registration Number is INH000001741. DEIPL may have received administrativewarnings from the SEBI for breaches of Indian regulations.
Japan: Approved and/or distributed by Deutsche Securities Inc.(DSI). Registration number - Registered as a financialinstruments dealer by the Head of the Kanto Local Finance Bureau (Kinsho) No. 117. Member of associations: JSDA, TypeII Financial Instruments Firms Association and The Financial Futures Association of Japan. Commissions and risks involvedin stock transactions - for stock transactions, we charge stock commissions and consumption tax by multiplying thetransaction amount by the commission rate agreed with each customer. Stock transactions can lead to losses as a resultof share price fluctuations and other factors. Transactions in foreign stocks can lead to additional losses stemming fromforeign exchange fluctuations. We may also charge commissions and fees for certain categories of investment advice,products and services. Recommended investment strategies, products and services carry the risk of losses to principaland other losses as a result of changes in market and/or economic trends, and/or fluctuations in market value. Beforedeciding on the purchase of financial products and/or services, customers should carefully read the relevant disclosures,prospectuses and other documentation. "Moody's", "Standard & Poor's", and "Fitch" mentioned in this report are notregistered credit rating agencies in Japan unless Japan or "Nippon" is specifically designated in the name of the entity.Reports on Japanese listed companies not written by analysts of DSI are written by Deutsche Bank Group's analysts withthe coverage companies specified by DSI. Some of the foreign securities stated on this report are not disclosed accordingto the Financial Instruments and Exchange Law of Japan. Target prices set by Deutsche Bank's equity analysts are basedon a 12-month forecast period.
Korea: Distributed by Deutsche Securities Korea Co.?
South Africa: Deutsche Bank AG Johannesburg is incorporated in the Federal Republic of Germany (Branch RegisterNumber in South Africa: 1998/003298/10).??Singapore: by Deutsche Bank AG, Singapore Branch or Deutsche Securities Asia Limited, Singapore Branch (One RafflesQuay #18-00 South Tower Singapore 048583, +65 6423 8001), which may be contacted in respect of any matters arisingfrom, or in connection with, this report. Where this report is issued or promulgated in Singapore to a person who is not anaccredited investor, expert investor or institutional investor (as defined in the applicable Singapore laws and regulations),they accept legal responsibility to such person for its contents.
Taiwan: Information on securities/investments that trade in Taiwan is for your reference only. Readers shouldindependently evaluate investment risks and are solely responsible for their investment decisions. Deutsche Bank researchmay not be distributed to the Taiwan public media or quoted or used by the Taiwan public media without written consent.Information on securities/instruments that do not trade in Taiwan is for informational purposes only and is not to beconstrued as a recommendation to trade in such securities/instruments. Deutsche Securities Asia Limited, Taipei Branchmay not execute transactions for clients in these securities/instruments.??
Page 48 Deutsche Bank Securities Inc.
24 October 2017
US ETF Compass
Qatar: Deutsche Bank AG in the Qatar Financial Centre (registered no. 00032) is regulated by the Qatar Financial CentreRegulatory Authority. Deutsche Bank AG - QFC Branch may only undertake the financial services activities that fall withinthe scope of its existing QFCRA license. Principal place of business in the QFC: Qatar Financial Centre, Tower, WestBay, Level 5, PO Box 14928, Doha, Qatar. This information has been distributed by Deutsche Bank AG. Related financialproducts or services are only available to Business Customers, as defined by the Qatar Financial Centre RegulatoryAuthority.
Russia: This information, interpretation and opinions submitted herein are not in the context of, and do not constitute,any appraisal or evaluation activity requiring a license in the Russian Federation.
?Kingdom of Saudi Arabia: Deutsche Securities Saudi Arabia LLC Company, (registered no. 07073-37) is regulated bythe Capital Market Authority. Deutsche Securities Saudi Arabia may only undertake the financial services activities thatfall within the scope of its existing CMA license. Principal place of business in Saudi Arabia: King Fahad Road, Al OlayaDistrict, P.O. Box 301809, Faisaliah Tower - 17th Floor, 11372 Riyadh, Saudi Arabia.??United Arab Emirates: Deutsche Bank AG in the Dubai International Financial Centre (registered no. 00045) is regulatedby the Dubai Financial Services Authority. Deutsche Bank AG - DIFC Branch may only undertake the financial servicesactivities that fall within the scope of its existing DFSA license. Principal place of business in the DIFC: Dubai InternationalFinancial Centre, The Gate Village, Building 5, PO Box 504902, Dubai, U.A.E. This information has been distributed byDeutsche Bank AG. Related financial products or services are only available to Professional Clients, as defined by theDubai Financial Services Authority.
Australia: Retail clients should obtain a copy of a Product Disclosure Statement (PDS) relating to any financial productreferred to in this report and consider the PDS before making any decision about whether to acquire the product. Pleaserefer to Australian specific research disclosures and related information at https://australia.db.com/australia/content/research-information.html??Australia and New Zealand: This research is intended only for "wholesale clients" within the meaning of the AustralianCorporations Act and New Zealand Financial Advisors Act respectively.?
Additional information relative to securities, other financial products or issuers discussed in this report is available uponrequest. This report may not be reproduced, distributed or published without Deutsche Bank's prior written consent.??Copyright © 2017 Deutsche Bank AG
Deutsche Bank Securities Inc. Page 49
David Folkerts-LandauGroup Chief Economist and Global Head of Research
Raj HindochaGlobal Chief Operating Officer
Research
Michael SpencerHead of APAC Research
Global Head of Economics
Steve PollardHead of Americas Research
Global Head of Equity Research
Anthony KlarmanGlobal Head ofDebt Research
Paul ReynoldsHead of EMEA
Equity Research
Dave ClarkHead of APAC
Equity Research
Pam FinelliGlobal Head of
Equity Derivatives Research
Andreas NeubauerHead of Research - Germany
Spyros MesomerisGlobal Head of Quantitative
and QIS Research
International locations
Deutsche Bank AGDeutsche Bank PlaceLevel 16Corner of Hunter & Phillip StreetsSydney, NSW 2000AustraliaTel: (61) 2 8258 1234
Deutsche Bank AGMainzer Landstrasse 11-1760329 Frankfurt am MainGermanyTel: (49) 69 910 00
Deutsche Bank AGFiliale HongkongInternational Commerce Centre,1 Austin Road West,Kowloon,Hong KongTel: (852) 2203 8888
Deutsche Securities Inc.2-11-1 NagatachoSanno Park TowerChiyoda-ku, Tokyo 100-6171JapanTel: (81) 3 5156 6770
Deutsche Bank AG London1 Great Winchester StreetLondon EC2N 2EQUnited KingdomTel: (44) 20 7545 8000
Deutsche Bank Securities Inc.60 Wall StreetNew York, NY 10005United States of AmericaTel: (1) 212 250 2500