u.s. fish & wildlife service hydro... · yurok tribe, trinity river division, willow creek,...
TRANSCRIPT

Arcata Fisheries Technical Series Report TR 2015-24
Development and Validation of Two-Dimensional Hydrodynamic Models on the Trinity River, California
Justin Alvarez1, Damon H. Goodman2, Aaron Martin3, Nicholas A. Som2, Katrina A. Wright2 and Thomas B. Hardy4
1Hoopa Valley Tribe, Fisheries Department, Hoopa, California 2U.S. Fish and Wildlife Service, Arcata Fish and Wildlife Office, Arcata, California 3Yurok Tribe, Trinity River Division, Willow Creek, California 4Texas State University, Department of Biology, Meadows Center for Water and the Environment, San Marcos, Texas
July 2015
U.S. Fish & Wildlife Service

ii
Disclaimer: The mention of trade names or commercial products in this report does not constitute endorsement or recommendation for use by the Federal Government.
key words: Two Dimensional Hydrodynamic Model, River Restoration, Streamflow Management, Aquatic Habitat
The correct citation for this report is:
Alvarez, J., D.H. Goodman, A. Martin, N.A. Som, K.A. Wright and T.B. Hardy. 2015. Development and validation of two-dimensional hydrodynamic models on the Trinity River, California. U.S. Fish and Wildlife Service. Arcata Fish and Wildlife Office, Arcata Fisheries Technical Report Number TR 2015-24, Arcata, California.
The Arcata Fish and Wildlife Office Fisheries Program reports its study findings through two publication series. The Arcata Fisheries Data Series was established to provide timely dissemination of data to local managers and for inclusion in agency databases. The Arcata Fisheries Technical Reports publishes scientific findings from single and multi-year studies that have undergone more extensive peer review and statistical testing. Additionally, some study results are published in a variety of professional fisheries journals.
This study was conducted as part of the Trinity River Restoration Program, with financial support provided by the Bureau of Reclamation and the Arcata Fish and Wildlife Office, U. S. Fish and Wildlife Service.

iii
Table of Contents page
Introduction ............................................................................................................... 2
Methods ..................................................................................................................... 3
Study sites ............................................................................................................. 3 Hydrodynamic model ............................................................................................. 5 Data collection ....................................................................................................... 5
Results ..................................................................................................................... 11
Discussion ............................................................................................................... 16
Acknowledgements.................................................................................................. 18
Literature Cited ....................................................................................................... 18
List of Tables
Table 1. The rotating panel revisit sampling design for rearing habitat assessments on the Trinity River, CA. ................................................................ 3
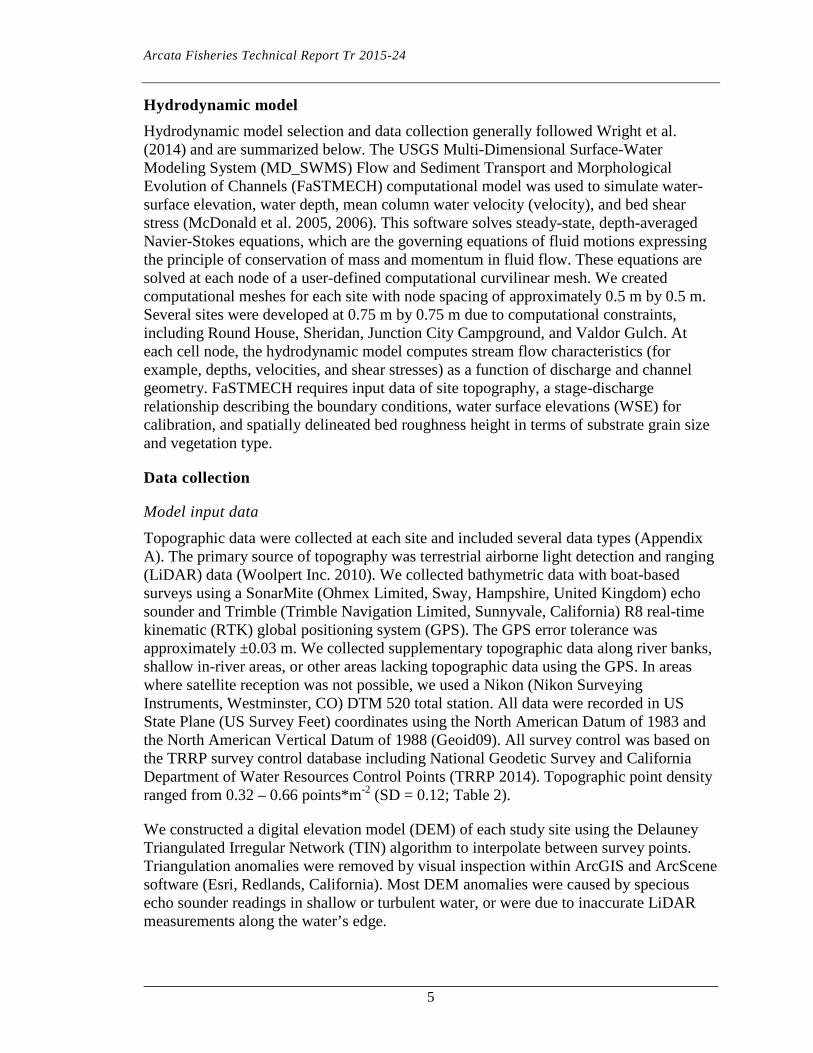
Table 2. Summary of topographic measurements used in the development of 11 hydrodynamic models on the Trinity River. ................................................... 6
Table 3. Summary of substrate measurements used in the development of 11 hydrodynamic models on the Trinity River......................................................... 7
Table 4. Roughness heights assigned to vegetation types mapped on the Trinity River ....................................................................................................... 7
Table 5. Summary of calibration and validation data types collected at each site by streamflow. ............................................................................................. 9
Table 6. Hydraulic model input parameters for the 11 study sites on the Trinity River. .................................................................................................... 12
iv
List of Figures page
Figure 1. Two-dimensional hydrodynamic model sites in the restoration reach of the Trinity River. ............................................................................................ 4
Figure 2. Residual distances between observed and predicted thalweg water surface elevations ............................................................................................. 14
Figure 3. Residual distances between observed and predicted water’s edges for all streamflows and sites evaluated in this study ......................................... 15
Figure 4. Mean column velocity residuals between observed and predicted velocities for all streamflows and sites evaluated in this study ......................... 15
List of Appendices
Appendix A. Maps of topographic model data by source. ...................................... 22
Appendix B. Grain size and vegetation maps. ....................................................... 33
Appendix C. Stage-discharge relationships............................................................ 45
Appendix D. Summary of observed and predicted water surface elevation profiles. ............................................................................................................ 51
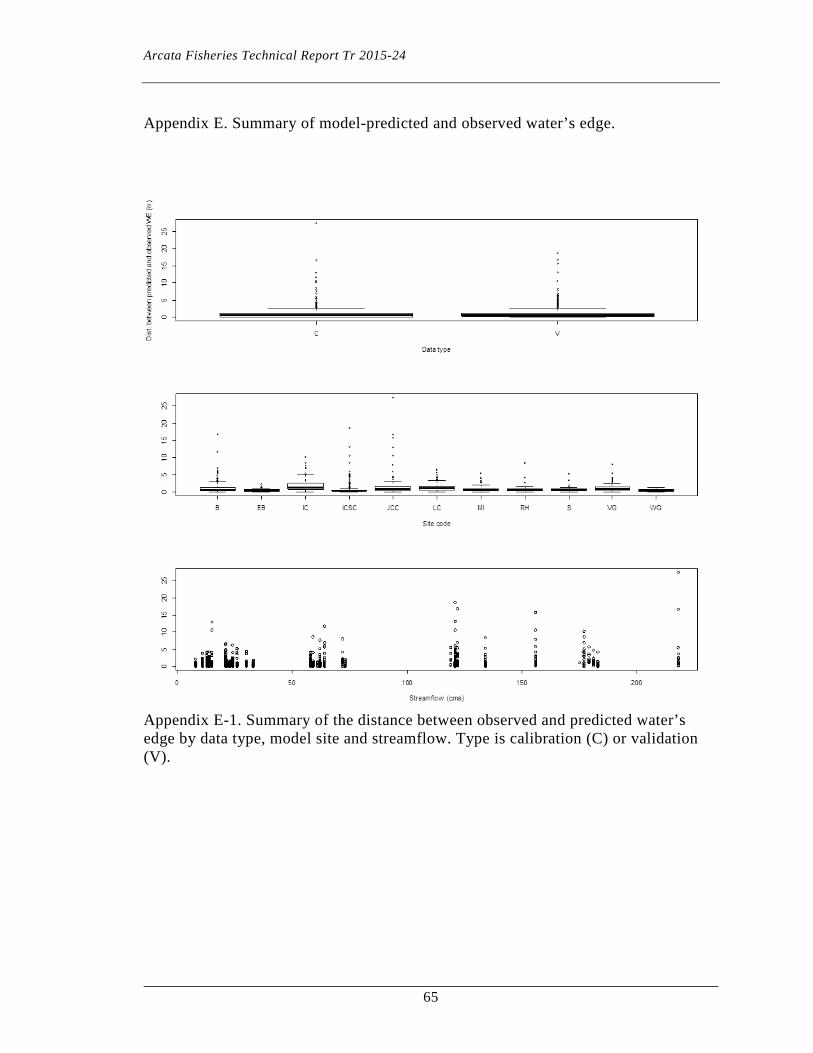
Appendix E. Summary of model-predicted and observed water’s edge. ................. 65
Appendix F. Summary of mean column velocity residuals. ................................... 68

Arcata Fisheries Technical Report Tr 2015-24
Development and Validation of Two-Dimensional Hydrodynamic Models
on the Trinity River, California
Justin Alvarez, Damon H. Goodman*, Aaron Martin, Nicholas A. Som, Katrina A.
Wright and Thomas B. Hardy
*Corresponding author U.S. Fish and Wildlife Service, Arcata Fish and Wildlife Office
1655 Heindon Road; Arcata, California [email protected]
(707) 825-7201
Abstract. The Trinity River is the focus of a large-scale restoration program with a primary goal of improving riverine habitat conditions for anadromous species over a 64-km reach below Lewiston Dam. We developed eleven hydrodynamic models to predict habitat area at a range of streamflows to inform decisions about streamflow management for the restoration effort. This report describes the study site selection, data collection, calibration, and validation performed to build the models and test their performance. Model sites were selected using a generalized random tessellation stratified sample throughout the restoration reach. Models were developed at 0.5 to 0.75 m predictive resolution and calibrated using extensive hydraulic datasets spanning a range of streamflows from 8.4 to 177.7 m3s-1 and encompassing streamflows for rearing and spawning salmonids. Hydrodynamic model predictions showed strong agreement with observed water-surface elevations, area of inundation, and mean column water velocity. The hydrodynamic models were calibrated to predict water surface elevations within an average of 0.065 m of the measured values. We observed slightly higher error in predicting WSE at independent validation streamflows, but predictions were still within an average of 0.071 m of measured values. On average, the predicted water’s edge was 1.11 m from the observed water’s edge at calibration discharges and 1.16 m at validation discharges. Velocity predictions were positively biased by an average of 0.02 ms-1 for calibration datasets and <0.00 ms-1 for validation datasets. The suite of hydraulic models will provide the Trinity River Restoration Program with a tool to evaluate the effects of streamflow releases on fine scale depth and velocity distributions. Future publications will leverage the hydraulic models in combination with salmonid biological preference models to predict streamflow to habitat relationships and inform restoration management decisions. Finally, the hydrodynamic model development and validation described in this report are applicable to other studies involving salmonid rearing habitat, such as in their ability to provide a unified approach to channel rehabilitation design and assessment.
Arcata Fisheries Technical Report Tr 2015-24
2
Introduction Several noteworthy anthropogenic impacts have altered the ecology of the Trinity River. During the California Gold Rush, placer mining operations rearranged the river bed and floodplain of the Trinity River and its tributaries (Bailey 2008). The mine tailings from these operations are still clearly visible within the drainage and affect the geomorphic and biological aspects of the river system (Davis 1966; Fuller et al. 2011). In the 1960s, two dams were constructed to facilitate trans-basin water export from the watershed. The dams led to habitat degradation via removal of streamflow variability and magnitude, as well as interruption of coarse sediment and large wood supplies (USFWS and Hoopa Valley Tribe 1999). These alterations resulted in changes to the general channel shape of the Trinity River, isolating the low-streamflow channel from its historic floodplain. In addition, the dams blocked anadromous fish access to approximately one quarter of the 7,700 km2 watershed. The loss and degradation of salmonid age-0 winter and early spring rearing habitat prompted drastic declines in three Pacific salmon species present in the river: Oncorhynchus tshawytscha (Chinook Salmon), the federally endangered O. kisutch (Coho Salmon), and O. mykiss (Steelhead Trout).
A large scale effort was initiated in 2000 to improve conditions over a 64-km reach between Lewiston Dam and the North Fork Trinity River (hereafter restoration reach) (USDOI 2000; Locke et al. 2008). Restoration actions were designed to induce fluvial processes (Barinaga 1996; USFWS and Hoopa Valley Tribe 1999) and included increases in annual streamflow, increases in streamflow variability, coarse sediment and large wood additions, and mechanical channel rehabilitation at 44 locations. The first channel rehabilitation site was completed in 2005 and approximately half of the channel rehabilitation sites are completed to date. Restoration actions are applied and modified on an annual basis through an adaptive management framework (Holling 1978) intended to improve future restoration based on performance of prior actions and improvements in restoration science. To facilitate this process, physical and biological response from restoration actions is used to influence restoration planning and maximize benefits.
An instream flow study was conducted to evaluate salmonid habitat conditions in the 1980s and 1990s (summarized in USFWS and Hoopa Valley Tribe 1999) and in-part led to the initiation of the Trinity River Restoration Program (TRRP). The instream flow study identified an artificially confined channel from riparian berms. The confined channel resulted in a streamflow to habitat relationship with poor habitat for rearing salmonids at intermediate streamflows. At high streamflows riparian berms were overtopped and the river was re-connected with its historic bar surfaces as well as preferred rearing habitats. Re-connecting the Trinity River with its floodplain to provide rearing habitats at intermediate and higher streamflows (>8.4 to 56 m3s-1) is one of the primary objectives of current restoration actions. Recent before-and-after studies at channel rehabilitation sites have documented changes in channel form and resulting streamflow to habitat relationships. The habitat response from channel rehabilitation varies by site and relates to not only the types of rehabilitation actions implemented, but also variation in the inherent channel-forms. Total habitat area increased from channel
Arcata Fisheries Technical Report Tr 2015-24
3
rehabilitation in all cases at all measured streamflows (Goodman et al. 2010; Martin et al. 2013; Alvarez et al. forthcoming).
However, no restoration reach scale assessments of changes in streamflow to habitat relationships have occurred since initiation of the TRRP. Due to the lack of contemporary, systemic streamflow to habitat relationships current streamflow management continues to be based on the pre-restoration channel configuration and static low streamflows throughout the salmonid spawning period and much of the rearing period.
This report describes the development of two-dimensional hydrodynamic models (hydrodynamic models hereafter) that will support a re-assessment of streamflow to habitat relationships in the restoration reach. These models are one component of a suite of tools available to the TRRP to address this issue. The primary objective of this report is to describe the hydrodynamic model site selection, data collection techniques, model calibration, and validation of predictions.
Methods
Study sites The TRRP is engaged in a companion study designed to track trends in salmonid rearing habitat areas at a 12.7 m3s-1 index streamflow in the restoration reach (Goodman et al. 2012). The selection of hydrodynamic model sites was designed to integrate with the rotating panel design developed by Goodman et al. (2012). To summarize the existing design, sample units were selected using the generalized random tessellation stratified (GRTS) sample unit selection protocol (Stevens and Olsen 2004) nested within a rotating panel revisit design (McDonald 2003) (Table 1).
Table 1. The rotating panel revisit sampling design for rearing habitat assessments on the Trinity River, CA. Each panel is unique (sampling without replacement) and composed of 16 randomly selected, spatially balanced sample units
Year Panel # 2009 2010 2011 2012 2013
1 X X 2 X X 3 X X 4 X X 5 X X
Arcata Fisheries Technical Report Tr 2015-24
4
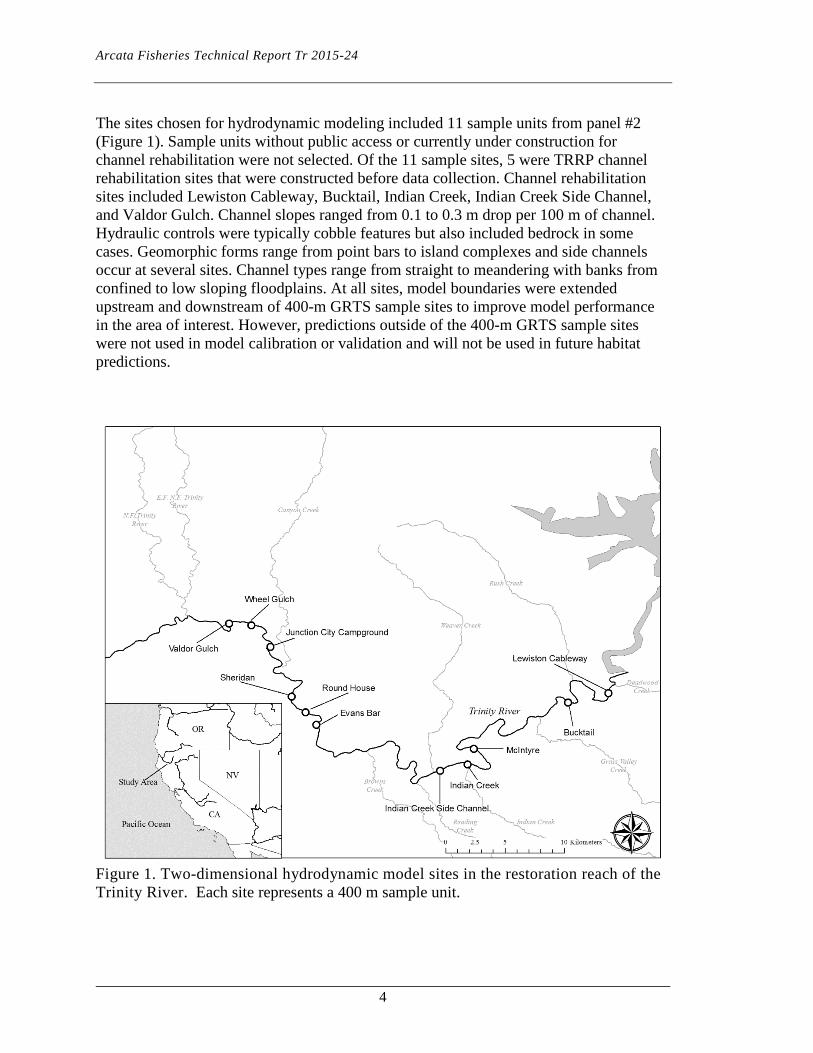
The sites chosen for hydrodynamic modeling included 11 sample units from panel #2 (Figure 1). Sample units without public access or currently under construction for channel rehabilitation were not selected. Of the 11 sample sites, 5 were TRRP channel rehabilitation sites that were constructed before data collection. Channel rehabilitation sites included Lewiston Cableway, Bucktail, Indian Creek, Indian Creek Side Channel, and Valdor Gulch. Channel slopes ranged from 0.1 to 0.3 m drop per 100 m of channel. Hydraulic controls were typically cobble features but also included bedrock in some cases. Geomorphic forms range from point bars to island complexes and side channels occur at several sites. Channel types range from straight to meandering with banks from confined to low sloping floodplains. At all sites, model boundaries were extended upstream and downstream of 400-m GRTS sample sites to improve model performance in the area of interest. However, predictions outside of the 400-m GRTS sample sites were not used in model calibration or validation and will not be used in future habitat predictions.
Figure 1. Two-dimensional hydrodynamic model sites in the restoration reach of the Trinity River. Each site represents a 400 m sample unit.
Arcata Fisheries Technical Report Tr 2015-24
5
Hydrodynamic model Hydrodynamic model selection and data collection generally followed Wright et al. (2014) and are summarized below. The USGS Multi-Dimensional Surface-Water Modeling System (MD_SWMS) Flow and Sediment Transport and Morphological Evolution of Channels (FaSTMECH) computational model was used to simulate water-surface elevation, water depth, mean column water velocity (velocity), and bed shear stress (McDonald et al. 2005, 2006). This software solves steady-state, depth-averaged Navier-Stokes equations, which are the governing equations of fluid motions expressing the principle of conservation of mass and momentum in fluid flow. These equations are solved at each node of a user-defined computational curvilinear mesh. We created computational meshes for each site with node spacing of approximately 0.5 m by 0.5 m. Several sites were developed at 0.75 m by 0.75 m due to computational constraints, including Round House, Sheridan, Junction City Campground, and Valdor Gulch. At each cell node, the hydrodynamic model computes stream flow characteristics (for example, depths, velocities, and shear stresses) as a function of discharge and channel geometry. FaSTMECH requires input data of site topography, a stage-discharge relationship describing the boundary conditions, water surface elevations (WSE) for calibration, and spatially delineated bed roughness height in terms of substrate grain size and vegetation type.
Data collection
Model input data Topographic data were collected at each site and included several data types (Appendix A). The primary source of topography was terrestrial airborne light detection and ranging (LiDAR) data (Woolpert Inc. 2010). We collected bathymetric data with boat-based surveys using a SonarMite (Ohmex Limited, Sway, Hampshire, United Kingdom) echo sounder and Trimble (Trimble Navigation Limited, Sunnyvale, California) R8 real-time kinematic (RTK) global positioning system (GPS). The GPS error tolerance was approximately ±0.03 m. We collected supplementary topographic data along river banks, shallow in-river areas, or other areas lacking topographic data using the GPS. In areas where satellite reception was not possible, we used a Nikon (Nikon Surveying Instruments, Westminster, CO) DTM 520 total station. All data were recorded in US State Plane (US Survey Feet) coordinates using the North American Datum of 1983 and the North American Vertical Datum of 1988 (Geoid09). All survey control was based on the TRRP survey control database including National Geodetic Survey and California Department of Water Resources Control Points (TRRP 2014). Topographic point density ranged from 0.32 – 0.66 points*m-2 (SD = 0.12; Table 2).
We constructed a digital elevation model (DEM) of each study site using the Delauney Triangulated Irregular Network (TIN) algorithm to interpolate between survey points. Triangulation anomalies were removed by visual inspection within ArcGIS and ArcScene software (Esri, Redlands, California). Most DEM anomalies were caused by specious echo sounder readings in shallow or turbulent water, or were due to inaccurate LiDAR measurements along the water’s edge.
Arcata Fisheries Technical Report Tr 2015-24
6
Table 2. Summary of topographic measurements used in the development of 11 hydrodynamic models on the Trinity River.
Site Model Site Area (m2) n Density (m-2) Cableway 75,767 47,549 0.63 Bucktail 116,655 76,883 0.66 McIntyre 81,550 48,245 0.59 Indian Creek 94,311 47,248 0.50 Indian Creek Side Channel 132,191 75,994 0.57 Evans Bar 97,731 44,653 0.46 Round House 152,743 56,990 0.37 Sheridan 179,872 70,404 0.39 Junction City Campground 96,215 36,602 0.38 Wheel Gulch 148,162 64,006 0.43 Valdor Gulch 187,547 59,083 0.32
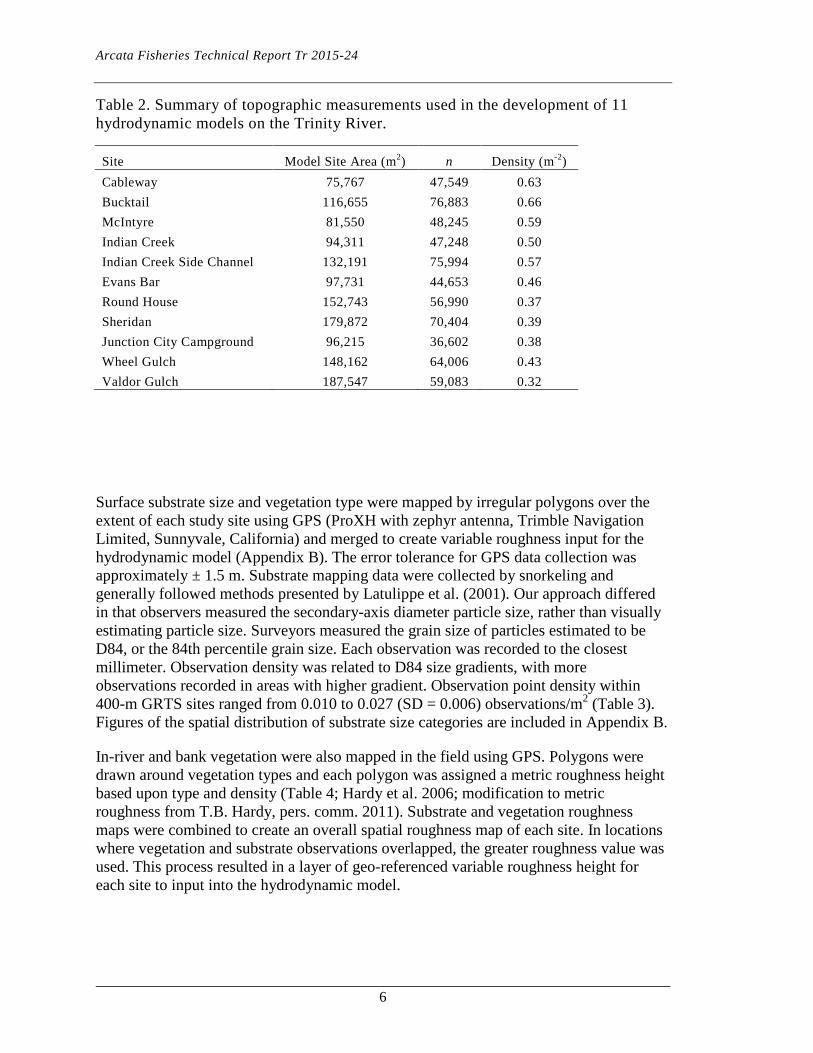
Surface substrate size and vegetation type were mapped by irregular polygons over the extent of each study site using GPS (ProXH with zephyr antenna, Trimble Navigation Limited, Sunnyvale, California) and merged to create variable roughness input for the hydrodynamic model (Appendix B). The error tolerance for GPS data collection was approximately ± 1.5 m. Substrate mapping data were collected by snorkeling and generally followed methods presented by Latulippe et al. (2001). Our approach differed in that observers measured the secondary-axis diameter particle size, rather than visually estimating particle size. Surveyors measured the grain size of particles estimated to be D84, or the 84th percentile grain size. Each observation was recorded to the closest millimeter. Observation density was related to D84 size gradients, with more observations recorded in areas with higher gradient. Observation point density within 400-m GRTS sites ranged from 0.010 to 0.027 (SD = 0.006) observations/m2 (Table 3). Figures of the spatial distribution of substrate size categories are included in Appendix B.
In-river and bank vegetation were also mapped in the field using GPS. Polygons were drawn around vegetation types and each polygon was assigned a metric roughness height based upon type and density (Table 4; Hardy et al. 2006; modification to metric roughness from T.B. Hardy, pers. comm. 2011). Substrate and vegetation roughness maps were combined to create an overall spatial roughness map of each site. In locations where vegetation and substrate observations overlapped, the greater roughness value was used. This process resulted in a layer of geo-referenced variable roughness height for each site to input into the hydrodynamic model.

Arcata Fisheries Technical Report Tr 2015-24
7
Table 3. Summary of substrate measurements used in the development of 11 hydrodynamic models on the Trinity River.
Site Substrate Tin Area (m2) n Density (m-2) Cableway 42,309 823 0.019 Bucktail 49,350 686 0.014 McIntyre 34,503 729 0.021 Indian Creek 31,330 647 0.021 Indian Creek Side Channel 42,641 1,157 0.027 Evans Bar 29,245 358 0.012 Round House 21,420 414 0.019 Sheridan 38,887 492 0.013 Junction City Campground 64,713 655 0.010 Wheel Gulch 24,985 256 0.010 Valdor Gulch 44,295 457 0.010
Table 4. Roughness heights assigned to vegetation types mapped on the Trinity River (modified from Hardy et al. 2006; pers. comm. T.B. Hardy 2011). Roughness height values are in meters, and vary by vegetation density (dense or sparse).
Roughness height (m) Vegetation type Dense Sparse Aquatic Non Emergent 0.07 0.07 Aquatic Emergent 1.2 0.6 Grass 0.23 0.07 Grape Vines 1.2 0.23 Willows 1.2 0.23 Berry Vines 1.2 0.23 Trees <4" Diameter at Breast-Height (dbh) 0.6 0.23 Trees >4" dbh 0.6 0.23 Aggregates of Small Vegetation (<4" in height) 1.2 0.23 Aggregates of Large Vegetation (>4" in height) 1.2 0.23

Arcata Fisheries Technical Report Tr 2015-24
8
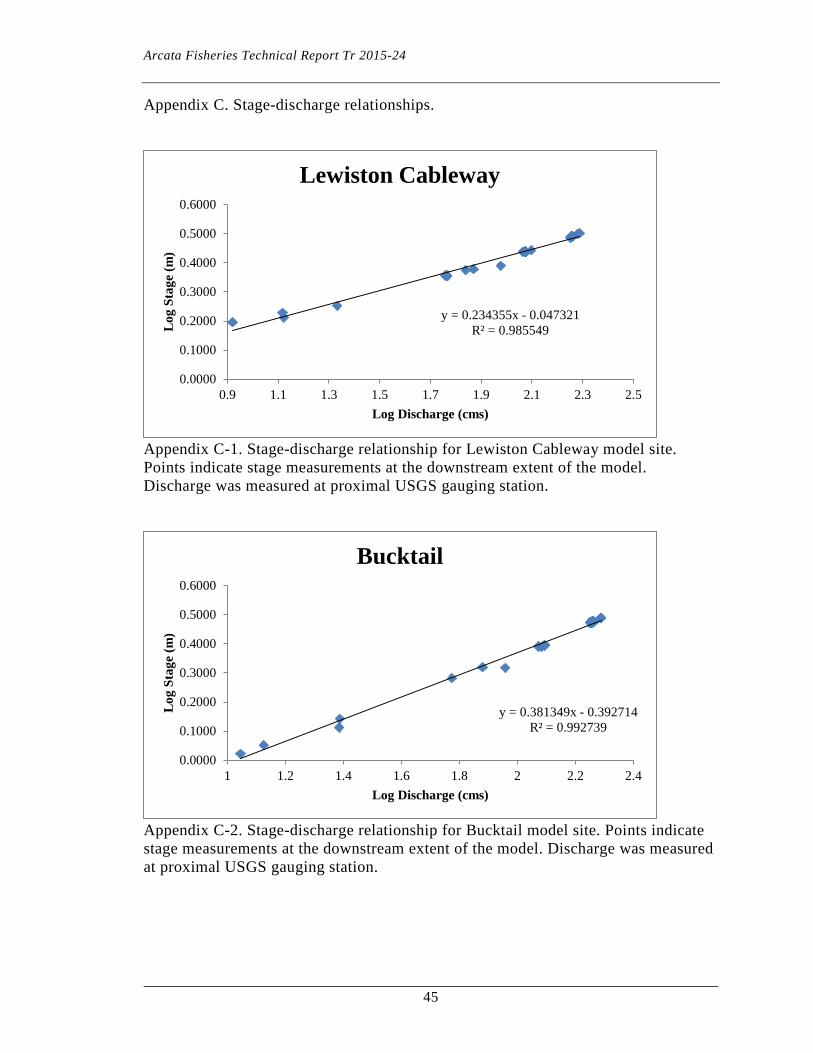
We developed stage-discharge relationships for each model site. Stage was measured and the downstream extent of each model site. The number of stage measurements ranged from 13 to 26 by site and spanned from 8.3 to 222.9 m3s-1 at a range of discharges. Discharge was associated with each stage measurement using instantaneous data (15 minute measurement intervals) from proximal USGS gauging stations. Log-linear stage-discharge relationships were produced for each site to estimate downstream input stage height conditions for simulations at a variety of discharges (Appendix C). In all cases log-linear stage-discharge relationships fit well to measured data (0.96 ≤ R2 ≤ 0.99).
Most model data were collected between spring and early fall 2010 on the descending limb of the spring high streamflow release. Data collection was timed to prevent topographic changes from high streamflow releases intended to transport coarse sediment. The only exception was the terrestrial LiDAR dataset collected in 2009 that was used to supplement ground topography measurements.
Hydraulic data for model calibration and validation Hydraulic datasets were collected for either model calibration or validation (Table 5). Measured data included longitudinal WSE profiles, water’s edge locations, and velocities. We measured WSE in the middle of the channel by attaching an RTK GPS to a boat at a known distance above the water and floating the thalweg of the river while recording continuous observations (one measurement per second), which captured the WSE profile in the center of the channel. WSE elevation measurements were then compared to the nearest model predictions. We typically measured WSE during 3 passes for a given streamflow to capture variation inherent in the moving water due to water boils or waves. Water’s edge was surveyed using RTK-GPS. Velocities were measured using Flow Tracker handheld acoustic Doppler velocimeters (SonTek Inc, San Diego, CA). Velocities were measured following USGS standards including 40 sec. averaged measurements taken at 0.6 m column depth for depths <0.76 m and at 0.2 and 0.8 m column depth for deeper areas. Velocity measurements were filtered using Flow Tracker internal software using an adaptive quality control procedure to remove points with high signal to noise ratios and low measurement correlations. Modeled point velocities were sampled longitudinally throughout each site and were typically in near shore areas to evaluate predictions associated with rearing habitat areas. Comparisons between hydraulic datasets and model calibration or validation were calculated only within 400-m GRTS sample sites (not to model boundaries).
Models were calibrated using an iterative process, adjusting multiple input parameters until the predicted WSE and water’s edge points matched observations. Model fit was assessed by root mean square error (RMSE) and visual assessment of predicted versus observed plots. The primary parameter used to adjust WSE was variable roughness. Roughness was modified by a global scalar to minimize RMSE. Lateral eddy viscosity and water surface drag coefficient input parameters were simultaneously adjusted to improve model fit. Lateral eddy viscosity is the exchange in momentum from turbulence and interactions that are not with the stream bed and is measured in m2s-1. Water surface drag coefficient (m) adjusts the change in water surface slope over long reaches, similarly to how roughness affects the water surface. Relaxation parameters were adjusted within

Arcata Fisheries Technical Report Tr 2015-24
9
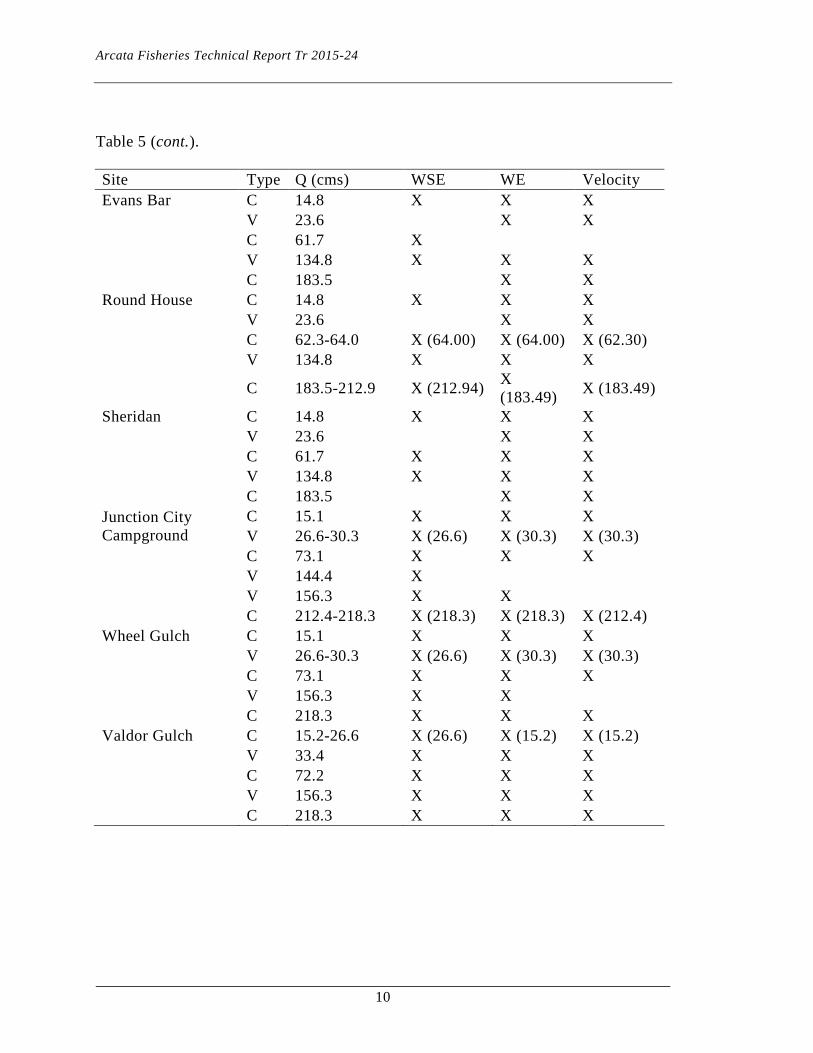
Table 5. Summary of calibration and validation data types collected at each site by streamflow. Type indicates if a dataset is used for calibration (C) or validation (V). Data used for calibration or validation includes longitudinal profiles of water surface elevation (WSE), water’s edge location and mean column velocity (Velocity).
Site Type Q (cms) WSE WE Velocity Lewiston Cableway
C 8.4 X X X V 13.2 X X X
V 21.8 X X X
C 58.1 X X X
C 179.5 X X X
Bucktail C 11.1 X X X
V 13.3 X X X
V 24.7 X X X
C 64.5 X X X
V 122.1 X X X
C 182.0-196.5 X (196.49) X (181.96) X (181.96)
McIntyre C 14.3 X X X
V 22.8
X X
C 58.3 X X X
V 119.2 X
C 175.3 X X Indian Creek C 14.7
X X
V 26.3
X X
C 62.2 X X X
V 121.6 X X X
C 177.7 X X Indian Creek
Side Channel C 14.8 X X X V 26.1-26.3
X (26.34) X (26.11)
C 59.8 X X X
V 121.6 X X X
C 177.7 X X
Arcata Fisheries Technical Report Tr 2015-24
10
Table 5 (cont.). Site Type Q (cms) WSE WE Velocity Evans Bar C 14.8 X X X
V 23.6 X X
C 61.7 X
V 134.8 X X X
C 183.5 X X
Round House C 14.8 X X X
V 23.6 X X
C 62.3-64.0 X (64.00) X (64.00) X (62.30)
V 134.8 X X X
C 183.5-212.9 X (212.94) X (183.49) X (183.49)
Sheridan C 14.8 X X X
V 23.6 X X
C 61.7 X X X
V 134.8 X X X
C 183.5 X X
Junction City Campground
C 15.1 X X X V 26.6-30.3 X (26.6) X (30.3) X (30.3)
C 73.1 X X X
V 144.4 X
V 156.3 X X
C 212.4-218.3 X (218.3) X (218.3) X (212.4)
Wheel Gulch C 15.1 X X X
V 26.6-30.3 X (26.6) X (30.3) X (30.3)
C 73.1 X X X
V 156.3 X X
C 218.3 X X X
Valdor Gulch C 15.2-26.6 X (26.6) X (15.2) X (15.2)
V 33.4 X X X
C 72.2 X X X
V 156.3 X X X
C 218.3 X X X
Arcata Fisheries Technical Report Tr 2015-24
11
acceptable ranges to allow convergence (Ekaterina Saraeva, personal communication). Relaxation coefficients are unit-less parameters that constrain the rate of change in WSE and elevation between model iterations. It was necessary to make slight changes to the model inputs, specifically topography, which included small sections of Lewiston Cableway, Indian Creek Side Channel, Indian Creek, and Junction City Campground model sites. These areas were typically composed of LiDAR topography data and are identified in Appendix A along with the spatial distribution of survey measurements. Hydrodynamic model input parameters for each calibration flow at each site are presented in Table 6. Calibrated models were run for 6,000 iterations and converged with less than one percent mean error in the computed versus simulated discharge.
Model predictions were iteratively compared to WSE and water’s edge measurements during the calibration process. We compared the horizontal position of the predicted and observed water’s edge points for each calibration discharge through each study reach. To normalize comparisons among different sites, we calculated each site’s mean channel width at each discharge by dividing the predicted wetted area by the site length (400 m).
After the model input parameters were calibrated, a secondary model calibration step consisted of comparing the predicted water inundation extent to the observed water’s edge locations. We compared the horizontal position of the predicted and observed water’s edge points for each calibration discharge through each study reach. To normalize comparisons among different sites, we calculated each site’s mean channel width at each discharge by dividing the predicted wetted area by the site length (400 m).
For model validation, we utilized independent discharges not used for calibration. At each site, the roughness coefficients, lateral eddy viscosities, and water surface drag coefficients were estimated with log-linear relationships from calibrated parameter values. Predicted values were compared with measured WSE, water’s edge, and velocity by site and streamflow. For all variables, residuals were calculated to represent the difference between observed and predicted values, and summarized via descriptive statistics to quantify prediction errors. Velocity predictions within a 2 m radius of each measurement location were used for comparison with the measured value given the known measurement uncertainty in the observation location versus computational grid locations. Velocity residuals were generated by subtracting the most similar predicted value within a 2 m radius of each observed value.
Results The hydrodynamic models were evaluated by comparing predictions of WSE, water inundation, and velocity with observed measurements at calibration and validation discharges. The models were calibrated to predict WSE within an average of 0.065 m of the measured values (n = 16,803). For WSE profiles, the model predictions matched observations closely with 90% of all predictions within 0.11 m of observed values (Figure 2). The models exhibited slightly higher residuals in predicting WSE at independent validation streamflows, but were still within an average of 0.071 m of measured values (n = 7,799). In addition, profiles captured slope changes at hydraulic drops (Appendix D).
Arcata Fisheries Technical Report Tr 2015-24
12
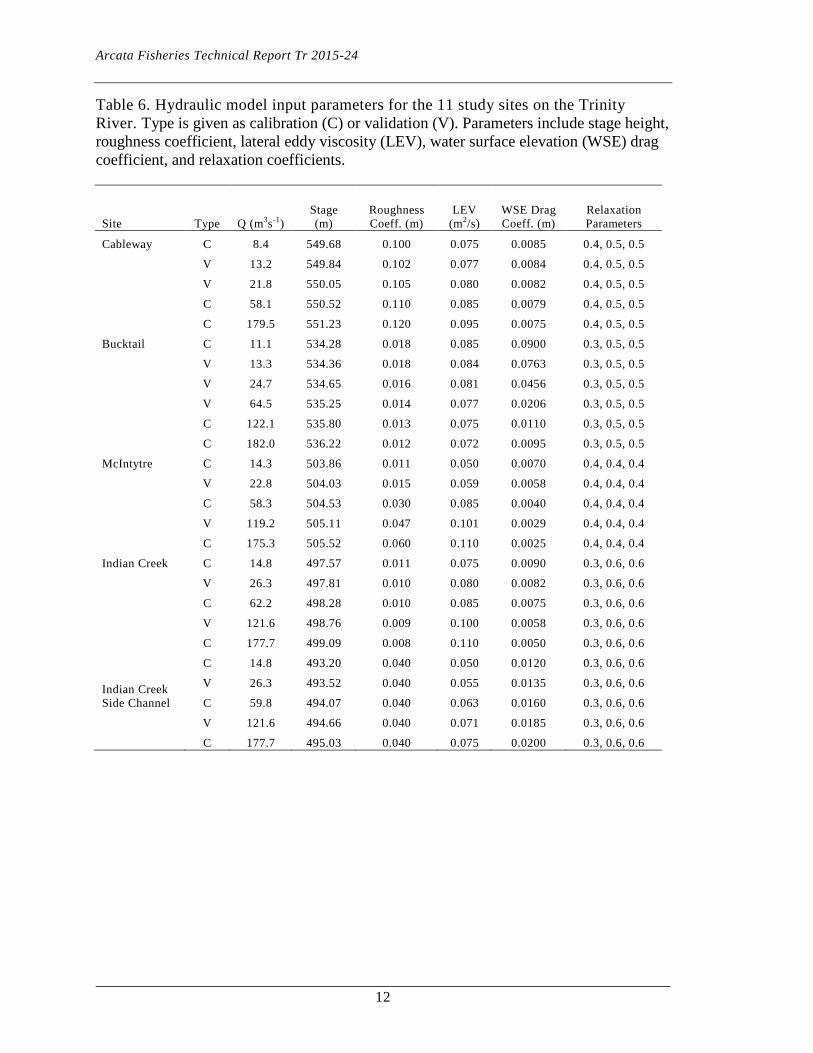
Table 6. Hydraulic model input parameters for the 11 study sites on the Trinity River. Type is given as calibration (C) or validation (V). Parameters include stage height, roughness coefficient, lateral eddy viscosity (LEV), water surface elevation (WSE) drag coefficient, and relaxation coefficients.
Site Type Q (m3s-1) Stage (m)
Roughness Coeff. (m)
LEV (m2/s)
WSE Drag Coeff. (m)
Relaxation Parameters
Cableway C 8.4 549.68 0.100 0.075 0.0085 0.4, 0.5, 0.5
V 13.2 549.84 0.102 0.077 0.0084 0.4, 0.5, 0.5
V 21.8 550.05 0.105 0.080 0.0082 0.4, 0.5, 0.5
C 58.1 550.52 0.110 0.085 0.0079 0.4, 0.5, 0.5
C 179.5 551.23 0.120 0.095 0.0075 0.4, 0.5, 0.5
Bucktail C 11.1 534.28 0.018 0.085 0.0900 0.3, 0.5, 0.5
V 13.3 534.36 0.018 0.084 0.0763 0.3, 0.5, 0.5
V 24.7 534.65 0.016 0.081 0.0456 0.3, 0.5, 0.5
V 64.5 535.25 0.014 0.077 0.0206 0.3, 0.5, 0.5
C 122.1 535.80 0.013 0.075 0.0110 0.3, 0.5, 0.5
C 182.0 536.22 0.012 0.072 0.0095 0.3, 0.5, 0.5
McIntytre C 14.3 503.86 0.011 0.050 0.0070 0.4, 0.4, 0.4
V 22.8 504.03 0.015 0.059 0.0058 0.4, 0.4, 0.4
C 58.3 504.53 0.030 0.085 0.0040 0.4, 0.4, 0.4
V 119.2 505.11 0.047 0.101 0.0029 0.4, 0.4, 0.4
C 175.3 505.52 0.060 0.110 0.0025 0.4, 0.4, 0.4
Indian Creek C 14.8 497.57 0.011 0.075 0.0090 0.3, 0.6, 0.6
V 26.3 497.81 0.010 0.080 0.0082 0.3, 0.6, 0.6
C 62.2 498.28 0.010 0.085 0.0075 0.3, 0.6, 0.6
V 121.6 498.76 0.009 0.100 0.0058 0.3, 0.6, 0.6
C 177.7 499.09 0.008 0.110 0.0050 0.3, 0.6, 0.6
Indian Creek Side Channel
C 14.8 493.20 0.040 0.050 0.0120 0.3, 0.6, 0.6
V 26.3 493.52 0.040 0.055 0.0135 0.3, 0.6, 0.6
C 59.8 494.07 0.040 0.063 0.0160 0.3, 0.6, 0.6
V 121.6 494.66 0.040 0.071 0.0185 0.3, 0.6, 0.6
C 177.7 495.03 0.040 0.075 0.0200 0.3, 0.6, 0.6

Arcata Fisheries Technical Report Tr 2015-24
13
Table 6 (cont.).
Site Type Q (m3s-1) Stage (m)
Roughness Coeff. (m)
LEV (m2/s)
WSE Drag Coeff. (m)
Relaxation Parameters
Evans Bar C 14.8 454.95 0.025 0.070 0.0055 0.4, 0.6, 0.6
V 23.6 455.15 0.025 0.073 0.0059 0.4, 0.6, 0.6
C 61.7 455.70 0.024 0.079 0.0069 0.4, 0.6, 0.6
V 134.8 456.33 0.024 0.081 0.0075 0.4, 0.6, 0.6
V 212.9 456.80 0.024 0.088 0.0084 0.4, 0.6, 0.6
C 183.5 456.64 0.024 0.090 0.0085 0.4, 0.6, 0.6
Round House
C 14.8 451.88 0.007 0.030 0.0090 0.3, 0.6, 0.6
V 23.6 452.10 0.005 0.032 0.0094 0.3, 0.6, 0.6
C 64.0 452.75 0.003 0.035 0.0100 0.3, 0.6, 0.6
V 134.8 453.47 0.001 0.044 0.0177 0.3, 0.6, 0.6
C 183.5 453.85 0.001 0.049 0.0236 0.3, 0.6, 0.6
Sheridan C 14.8 448.64 0.004 0.070 0.0040 0.4, 0.6, 0.6
V 23.6 448.81 0.004 0.070 0.0044 0.4, 0.6, 0.6
C 61.7 449.30 0.006 0.070 0.0055 0.4, 0.6, 0.6
V 134.8 449.89 0.007 0.070 0.0065 0.4, 0.6, 0.6
C 183.5 450.19 0.007 0.070 0.0070 0.4, 0.6, 0.6
Junction City Campground
C 15.1 432.65 0.040 0.078 0.0250 0.2, 0.2, 0.4
V 30.3 432.95 0.050 0.078 0.0197 0.2, 0.2, 0.4
C 73.1 433.41 0.070 0.078 0.0146 0.2, 0.2, 0.4
V 144.4 433.84 0.076 0.078 0.0115 0.2, 0.2, 0.4
V 156.3 433.90 0.078 0.078 0.0112 0.2, 0.2, 0.4
C 218.3 434.14 0.080 0.078 0.0100 0.2, 0.2, 0.4
Wheel Gulch C 15.1 426.52 0.009 0.050 0.0085 0.4, 0.6, 0.6
V 30.3 426.77 0.100 0.053 0.0092 0.4, 0.6, 0.6
C 73.1 427.19 0.030 0.055 0.0100 0.4, 0.6, 0.6
V 156.3 427.67 0.054 0.065 0.0113 0.4, 0.6, 0.6
C 218.3 427.93 0.070 0.070 0.0120 0.4, 0.6, 0.6
Valdor Gulch C 15.2 422.84 0.052 0.070 0.0200 0.3, 0.6, 0.6
V 33.4 423.17 0.050 0.075 0.0155 0.3, 0.6, 0.6
C 72.2 423.66 0.048 0.081 0.0120 0.3, 0.6, 0.6
V 153.3 424.38 0.046 0.087 0.0095 0.3, 0.6, 0.6
C 218.3 424.78 0.045 0.090 0.0085 0.3, 0.6, 0.6
Arcata Fisheries Technical Report Tr 2015-24
14
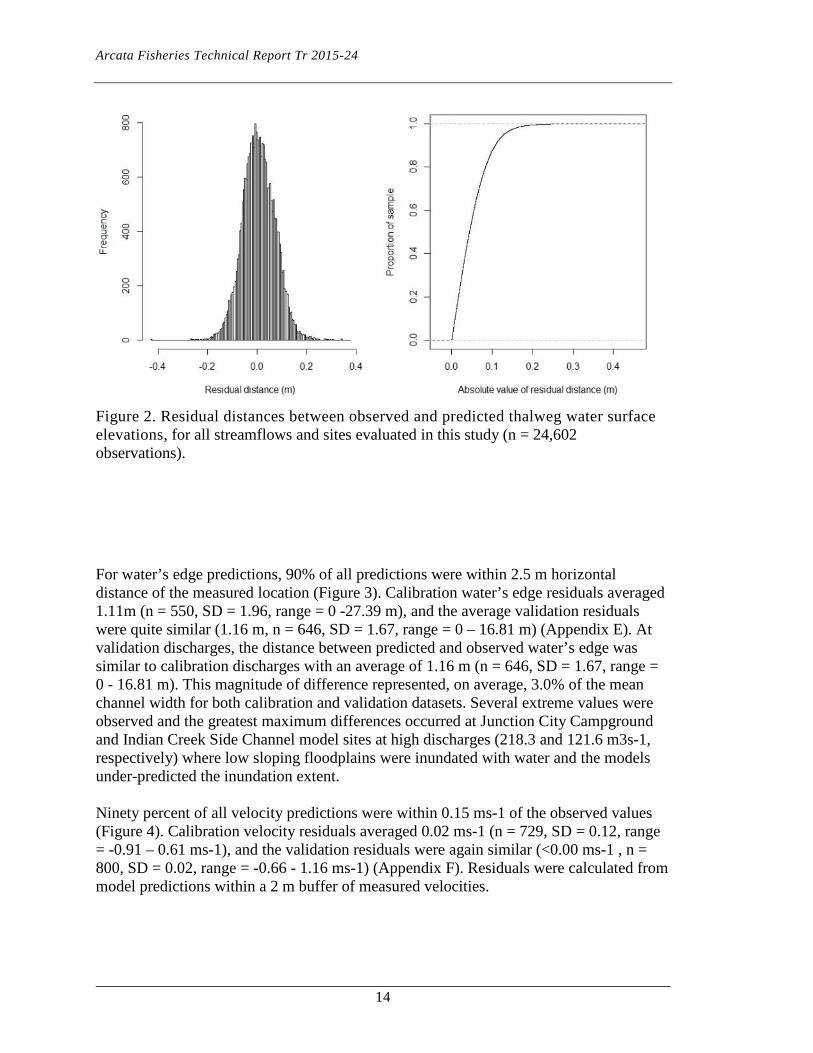
Figure 2. Residual distances between observed and predicted thalweg water surface elevations, for all streamflows and sites evaluated in this study (n = 24,602 observations).
For water’s edge predictions, 90% of all predictions were within 2.5 m horizontal distance of the measured location (Figure 3). Calibration water’s edge residuals averaged 1.11m (n = 550, SD = 1.96, range = 0 -27.39 m), and the average validation residuals were quite similar (1.16 m, n = 646, SD = 1.67, range = 0 – 16.81 m) (Appendix E). At validation discharges, the distance between predicted and observed water’s edge was similar to calibration discharges with an average of 1.16 m (n = 646, SD = 1.67, range = 0 - 16.81 m). This magnitude of difference represented, on average, 3.0% of the mean channel width for both calibration and validation datasets. Several extreme values were observed and the greatest maximum differences occurred at Junction City Campground and Indian Creek Side Channel model sites at high discharges (218.3 and 121.6 m3s-1, respectively) where low sloping floodplains were inundated with water and the models under-predicted the inundation extent. Ninety percent of all velocity predictions were within 0.15 ms-1 of the observed values (Figure 4). Calibration velocity residuals averaged 0.02 ms-1 (n = 729, SD = 0.12, range = -0.91 – 0.61 ms-1), and the validation residuals were again similar (<0.00 ms-1 , n = 800, SD = 0.02, range = -0.66 - 1.16 ms-1) (Appendix F). Residuals were calculated from model predictions within a 2 m buffer of measured velocities.

Arcata Fisheries Technical Report Tr 2015-24
15
Figure 3. Residual distances between observed and predicted water’s edges for all streamflows and sites evaluated in this study (n = 1234 observations). Seventeen extreme values were not included in the figure for display purposes.
Figure 4. Mean column velocity residuals between observed and predicted velocities for all streamflows and sites evaluated in this study (n = 1529 observations).
Arcata Fisheries Technical Report Tr 2015-24
16
Discussion The hydrodynamic models developed on the Trinity River were calibrated and validated to levels comparable to other hydrodynamic modeling studies. Our results are comparable to three hydrodynamic models calibrated and validated using similar methods on the Klamath River (Wright et al. 2014). We provide a detailed comparison to this companion effort as well as other two-dimensional hydrodynamic modeling efforts using similar assessment metrics.
Water surface elevation residuals were similar between the Trinity and Klamath models. Differences in WSE were centered around zero (Figure 2) and within measurement error (±0.03 m), providing support for model performance (Pasternack 2011). On average, the Trinity River models have 0.017 m higher residuals for calibration discharges but have 0.001 m to 0.006 m lower residuals for validation discharges when compared to the Klamath models. Differences between observed and expected WSE are also similar to those reported in other studies (Hardy et al. 2006, Legleiter et al. 2011).
The Trinity River models exhibited slightly higher error in predicting average distance between predicted and observed water’s edge by site when compared to the Klamath River models. However, these differences typically related to a small proportion of each site and associated with very low gradient channels, a bankform less common in the Klamath River model sites. For calibration and validation discharges, the Trinity models had on average 2% higher error in predicting inundation extent relative to channel width when compared to the Klamath models. The higher level of error is likely related to a wider diversity of channel-forms represented in the 11 Trinity River hydrodynamic models. The largest discrepancies occurred in low sloping floodplains at higher discharges. In these cases, small differences in WSE or topography can lead to large differences in inundation. The errors may be caused by topographic errors or difficulties predicting streamflow interstitially through cobbles. These feature types are a common design feature of the TRRP channel rehabilitation sites and are present in several of the Trinity River models. Therefore, model results at these feature types should be interpreted with caution. In future modeling studies, additional model input and calibration data at these feature types may improve prediction success.
We observed differences between predicted and observed velocities with a similar level of error as observed in other studies. For example, Waddle (2010) found mean velocity residuals ranging from 0.02 to 0.03 ms-1 at one site in the South Platte River in Colorado. Velocity residuals at our sites averaged 0.02 ms-1 for calibration and less for validation streamflows. However, at Valdor Gulch at the highest calibration discharge (218.3 m3s-1) we observed an average velocity residual of 0.18 ms-1 higher than Waddle (2010), which was an extreme value for our dataset. This may be related to the large low sloping floodplain and large cobbles at this site. Higher mean velocity residuals at some locations were expected based on the number of sites and diverse range of channel configurations evaluated in our study. Velocity errors in hydrodynamic model predictions commonly average 20 to 30% based on reported study results (Pasternack et al. 2006; Waddle 2010; Legleiter et al. 2011), and are attributed to uncertain topographic input and computational mesh coarseness. Gard (2010) found that increasing the density of topographic surveying

Arcata Fisheries Technical Report Tr 2015-24
17
points appreciably increased the accuracy of velocity predictions. By increasing survey point density from 0.0265 (Gard 2009) to 0.4 points*m-2, the correlation coefficient between measured and predicted velocities increased from 0.23 to a range of 0.64-0.82. Our models had a topographic survey density similar to Gard (2010): 0.32-0.66 points*m2.
Our hydrodynamic models have been used in a wide range of TRRP management decisions and monitoring activities, and will provide a foundation for a wide range of future studies. For example, winter rearing habitat is considered the primary limiting factor for salmonids in the restoration reach (USFWS and Hoopa Valley Tribe 1999) and the TRRP has the opportunity to manage streamflows to improve habitat availability. These hydrodynamic models in combination with biological models and supplementary datasets (in-water escape cover maps) have been used to develop recommendations for annual streamflow management processes (e.g., TRRP 2013). In other cases, predictions from these hydrodynamic models been used as a foundation for monitoring study designs. Additionally, an ongoing TRRP study is evaluating the potential for coarse resolution (average computational grid area = 22 m2 at the time of this report) modeling of streamflow to habitat relationships for the entire 64-km restoration reach. The high resolution models presented herein will provide tools to evaluate the efficacy of the coarse resolution models for predicting habitat parameters.
The hydrodynamic model development and validation presented in this study has the potential for additional applications in the Trinity River including its use as a unified approach to channel rehabilitation site design and assessment. Hydrodynamic modeling has been used by the TRRP for channel rehabilitation site design processes (i.e., Brown and Pasternack 2009; Hoopa Valley Tribal Fisheries et al. 2011; Cardno Entrix 2011). However, design models developed on the Trinity River have never been revisited after construction to test design hypotheses and effects of other restoration actions (streamflow releases and coarse sediment augmentation). Habitat assessments have been conducted by the TRRP at most channel rehabilitation sites to document change from channel rehabilitation efforts (e.g., De Juilio et al. 2014). The current habitat assessment approach implements a technique much less expensive (Goodman et al. 2015), but may not encompass the range of conditions or variables included in rehabilitation site design hypotheses generated using hydrodynamic modeling. Adopting hydrodynamic modeling to evaluate change from channel rehabilitation actions may increase the cost for channel rehabilitation assessments for the TRRP. Benefits of adopting hydrodynamic modeling include higher resolution and more accurate channel rehabilitation site design predictions and a closer connection to habitat assessment results.
The approach used to develop hydrodynamic models has direct consequences on prediction accuracy and has been evaluate on the Trinity River. Our evaluation of hydrodynamic models used for the design of Lowden Meadows and Reading Creek channel rehabilitation sites, identified substantial errors between model predictions of habitat area and those measured in the field (Alvarez et al. forthcoming). Model errors were likely due to the resolution of input topography (photogrammetry and bathymetric LiDAR) and calibration data (limited WSE data) (Hoopa Valley Tribal Fisheries et al. 2011), and could lead to spurious conclusions if habitat area is used to select between
Arcata Fisheries Technical Report Tr 2015-24
18
design alternatives. Implementing a standardized model development framework as described in this report may avoid these issues in future applications.
The hydrodynamic models presented in this report represent an approach similar to that used by peer-reviewed modeling efforts designed to predict salmonid rearing and spawning habitat (e.g., Hardy et al. 2006); however, this approach may be refined through future research. Topographic input data resolution and coverage, as well as, predictive grid resolution are primary drivers in accuracy of inundation extents, depth predictions, and velocity predictions (Hardy et al. 1999; Legleiter et al. 2011; Conner and Tonina 2014). The importance of model resolution extends to the ability of a model to predict habitats at spatial scales relevant to target organisms (Crowder and Diplas 2000). Further research on model resolution and topographic input data may lead to reductions in data requirements or computational time. In this study, we included calibration datasets spanning the range of streamflows used to manage for salmonid habitat. In addition, we analyzed independent validation datasets (not used for calibration) to evaluate prediction errors both within and outside of calibration streamflows. Further research could be used to evaluate the effect of varying levels of calibration data on predictive accuracy. These research directions could improve the application of future hydrodynamic models within the TRRP, as well as, the greater ecohydraulics community.
Acknowledgements We would like to acknowledge the support of the many individuals that contributed to the success of this project. In particular we would like to thank Joel Chase of Hoopa Valley Tribe, Jeremy Alameda of the Yurok Tribe, Matt Smith-Caggiano, Oliver Miano and Charles Chamberlain for support in data collection and processing. We would like to thank Joe Polos (USFWS), Nicholas J. Hetrick (USFWS), Robert Stewart (USBR), Wes Smith (NOAA) and the California Department of Water Resources for their thoughtful reviews of this report.
Literature Cited Alvarez, J., Hilton, A., Bair, J., Hales, G., McBain, S., Goodman, D.H., Polos, J., and
Martin, A. Forthcoming. Integrated Habitat Assessment of the Upper Trinity River, 2009. U.S. Fish and Wildlife Service. Arcata Fish and Wildlife Office, Arcata Fisheries Technical Report, Arcata, California.
Bailey, J. 2008. The other California Gold: Trinity County Placer Mining, 1848-1962. Technical Service Center, U.S. Bureau of Reclamation. Project Tracking Number 07-NCAO-211, Denver, CO.
Barinaga, M. 1996. A recipe for river recovery? Science, New Series 273:1648-1650.
Brown, R.A. and G.B. Pasternack. 2008. Comparison of methods for analysing salmon habitat rehabilitation designs for regulated rivers. River Res. Applic. 25:745-772.

Arcata Fisheries Technical Report Tr 2015-24
19
Cardno Entrix. 2011. Trinity River modeling memo Lorenz Gulch-Goat Hole. Final report prepared for Bureau of Reclamation, Trinity River Restoration Program, Weaverville, CA.
Conner J.T. and D. Tonina. 2014. Effect of cross-section interpolated bathymetry on 2D hydrodynamic model results in a large river. Earth Surface Processes and Landforms 39: 463-475.
Crowder D.W. and P. Diplas. 2000. Using two-dimensional hydrodynamic models at scales of ecological importance. Journal of Hydrology 230: 172-191.
Davis, W.E. 1966. The effects of physical degradation on the benthos of a northern California Stream. Master’s thesis Humboldt State College, Arcata, CA.
De Juilio, K., A. Martin, J. Alvarez, and D. H. Goodman. 2014. Age-0 Chinook and Coho salmon rearing habitat assessment: Sawmill rehabilitation site, three years after construction at winter base flow, upper Trinity River. U.S. Fish and Wildlife Service. Arcata Fish and Wildlife Office, Arcata Fisheries Data Series Report Number DS 2014-37, Arcata, California.
Fuller, T.E., K.L. Pope, D.T. Ashton and H.H. Welsh. 2011. Linking the distribution of an invasive amphibian (Rana catesbeiana) to habitat conditions in a managed river system in northern California. Restoration Ecology 19: 204 213.
Gard, M. 2009. Comparison of spawning habitat predictions of PHABSIM and River2D models. International Journal of River Basin Management 7: 55-71.
Gard, M. 2010. Response to Williams (2010) on Gard (2009): Comparison of spawning habitat predictions of PHABSIM and River2D models. International Journal of River Basin Management 8: 121-125.
Goodman, D.H., A.M. Martin, J. Alvarez, A. Davis, and J. Polos. 2010. Assessing Trinity River salmonid habitat at channel rehabilitation sites, 2007-2008. United States Fish and Wildlife Service, Arcata Fish and Wildlife Office, Yurok Tribe, and Hoopa Valley Tribe. Arcata Fisheries Technical Report Number TR 2010-13, Arcata, California.
Goodman, D.H., J. Alvarez, A. Martin, N.A. Som, and J. Polos. 2012. Estimation of age-0 Chinook and coho salmon rearing habitat area within the restoration reach of the Trinity River at an index streamflow - Annual Report 2010. Arcata Fisheries Technical Report Number TR 2012-17. U.S. Fish and Wildlife Service, Arcata, California.
Goodman, D.H., N.A. Som, J. Alverez and A. Martin. 2015. A mapping technique to evaluate age-0 salmon habitat response from restoration. Restoration Ecology doi: 10.1111/rec.12148.
Hardy, R.J., P.D. Bates, M.G. Anderson. 1999. The importance of spatial resolution in hydraulic models for floodplain environments. Journal of Hydrology 216:124-136.
Arcata Fisheries Technical Report Tr 2015-24
20
Hardy, T.B., R.C. Addley, and E. Saraeva. 2006. Evaluation of instream flow needs in the lower Klamath River, Phase II, Final Report. Prepared for the U.S. Department of the Interior. Institute for Natural Systems Engineering, Utah Water Research Laboratory, Utah State University, Logan, Utah.Holling, C.S. 1978. Adaptive Environmental assessment and management. John Wiley and Sons, Chinchester, England.
Hoopa Valley Tribal Fisheries, McBain and Trush Inc., Northern Hydrology and Engineering. 2011. Preliminary demonstration of the capabilities of a 2D model to assess and improve Trinity River rehabilitation designs. Technical memorandum submitted to Trinity River Restoration Program, Weaverville, CA.
Latulippe C., M.F. LaPointe, and T. Talbot. 2001. Visual characterization technique for gravel-cobble river bed surface sediments. Earth Surface Processes and Landforms 26:307-318.
Legleiter, C.J., P.C. Kyriakidis, R.R. McDonald, and J.M. Nelson. 2011. Effects of uncertain topographic input data on two-dimensional flow modeling in a gravel-bed river. Water Resources Research 47.Locke, A., C. Stalnaker, S. Zellmer, K. Williams, H. Beecher, T. Richards, C. Robertson, A. Wald, A. Paul, and T. Annear. 2008. Integrated approaches to riverine resource management: case studies, science, law, people, and policy. Instream Flow Council, Cheyenne, Wyoming.
Martin, A., D.H. Goodman, and J. Alvarez. 2013. Age 0 Chinook and Coho salmon rearing habitat assessment of Lowden, Reading Creek, and Trinity House Gulch rehabilitation sites 2009-2011, Upper Trinity River. U.S. Fish and Wildlife Service. Arcata Fish and Wildlife Office, Arcata, California. Arcata Fisheries Data Series Number DS 2013-33.
McDonald, T.L. 2003. Review of environmental monitoring methods: survey designs. Environmental Monitoring and Assessment 85:277-292.
McDonald, R.R., J.M. Nelson, and J.P. Bennett. 2005. Multi-dimensional surface-water modeling system user’s guide. U.S. Geological Survey Techniques and Methods, 6-B2.
McDonald, R.R., J.M. Nelson, P.J. Kinzel, and J.S. Conaway. 2006. Modeling surface-water flow and sediment mobility with the multi-dimensional surface water modeling system. U.S. Geological Survey Fact Sheet 2005-3078.
Pasternack, G.B. 2011. 2D Modeling and Ecohydraulic Analysis. Createspace: Seattle, WA.
Pasternack, G.B., A.T. Gilbert, J.M. Wheaton, and E.M. Buckland. 2006. Error propagation for velocity and shear stress prediction using 2D models for environmental management. Journal of Hydrology 328: 227-241.
Stevens, D.L., and A.R. Olsen. 2004. Spatially balanced sampling of natural resources. Journal of the American Statistical Association 99:262-278.

Arcata Fisheries Technical Report Tr 2015-24
21
TRRP (2013) Trinity River Restoration Flow Release Schedule Design for Water Year 2013. Technical Memorandum WG-TRRP-Flow-2013-1. Trinity River Restoration Program. Weaverville, California.
TRRP (Trinity River Restoration Program). 2014. Survey control database, 2014 edition. Data package by the Trinity River Restoration Program, Weaverville, California (based upon prior version by Water Works Engineers, Redding, California).
USFWS (United States Fish and Wildlife Service) and Hoopa Valley Tribe. 1999. Trinity River flow evaluation final report. U.S. Fish and Wildlife Service, Arcata Fish and Wildlife Office, Arcata, California and Hoopa, California.
USDOI (U.S. Department of the Interior). 2000. Record of decision Trinity River mainstem fishery restoration, final environmental impact statement/environmental impact report.
Waddle, T. 2010. Field evaluation of a two-dimensional hydrodynamic model near boulders for habitat calculation. River Research and Applications 26: 730-741.
Woolpert, Inc. 2010. Report of data development and QC analysis: Trinity River bathymetry, airborne laser data and photogrammetric DTM ranging, verification and certification. U. S. Bureau of Reclamation IDIQ contract: 08-CA-40-8258, Task Order R1OPD40022, Weaverville, California.
Wright, K.A., D.H. Goodman, N.A. Som, and T.B. Hardy. 2014. Development of two-dimensional hydraulic models to predict distribution of Manayunkia speciosa in the Klamath River. U.S. Fish and Wildlife Service. Arcata Fish and Wildlife Office, Arcata Fisheries Technical Report Number TR 2014-19, Arcata, California.

Arcata Fisheries Technical Report Tr 2015-24
22
Appendices Appendix A. Maps of topographic model data by source.
Figure A-1. Spatial distribution of topographic survey measurements at Lewiston Cableway model site, Trinity River, CA. Red lines indicate boundaries of 400-m GRTS sample site and arrow indicates streamflow direction.
Arcata Fisheries Technical Report Tr 2015-24
23
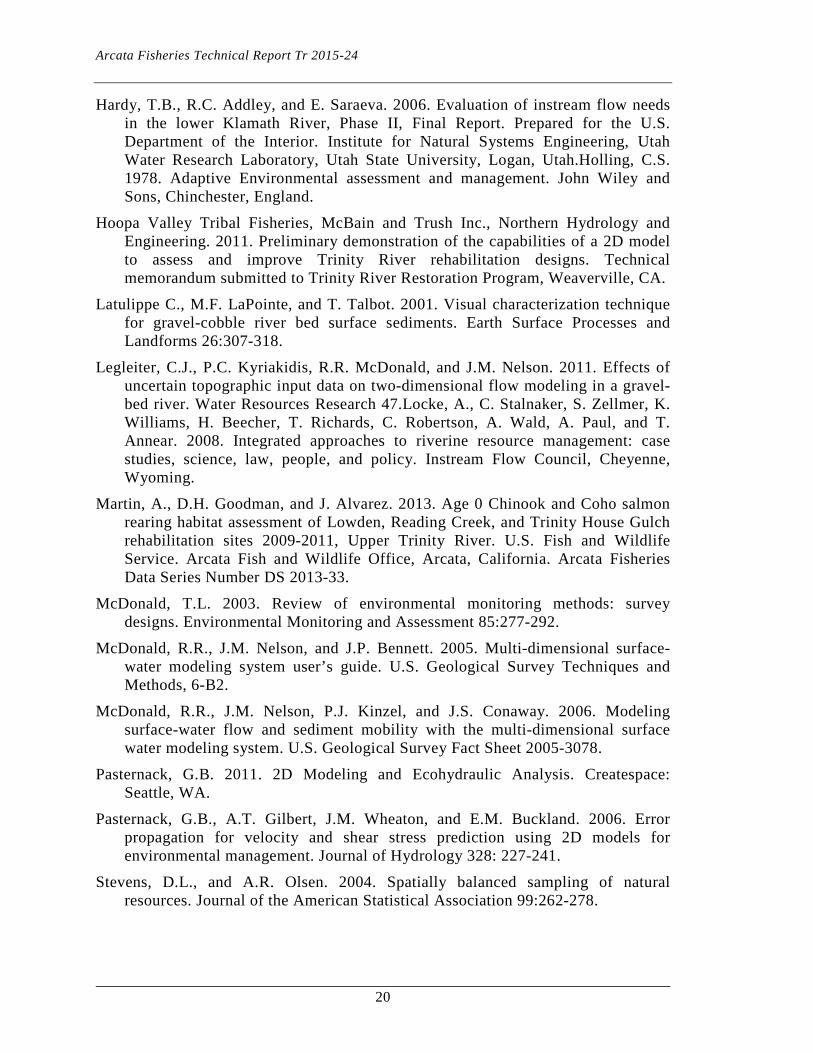
Figu
re A
-2. S
patia
l dis
tribu
tion
of to
pogr
aphi
c su
rvey
mea
sure
men
ts a
t Buc
ktai
l mod
el si
te, T
rinity
Riv
er, C
A. R
ed
lines
indi
cate
bou
ndar
ies o
f 400
-m G
RTS
sam
ple
site
and
arr
ow in
dica
tes s
tream
flow
dire
ctio
n.
Arcata Fisheries Technical Report Tr 2015-24
24
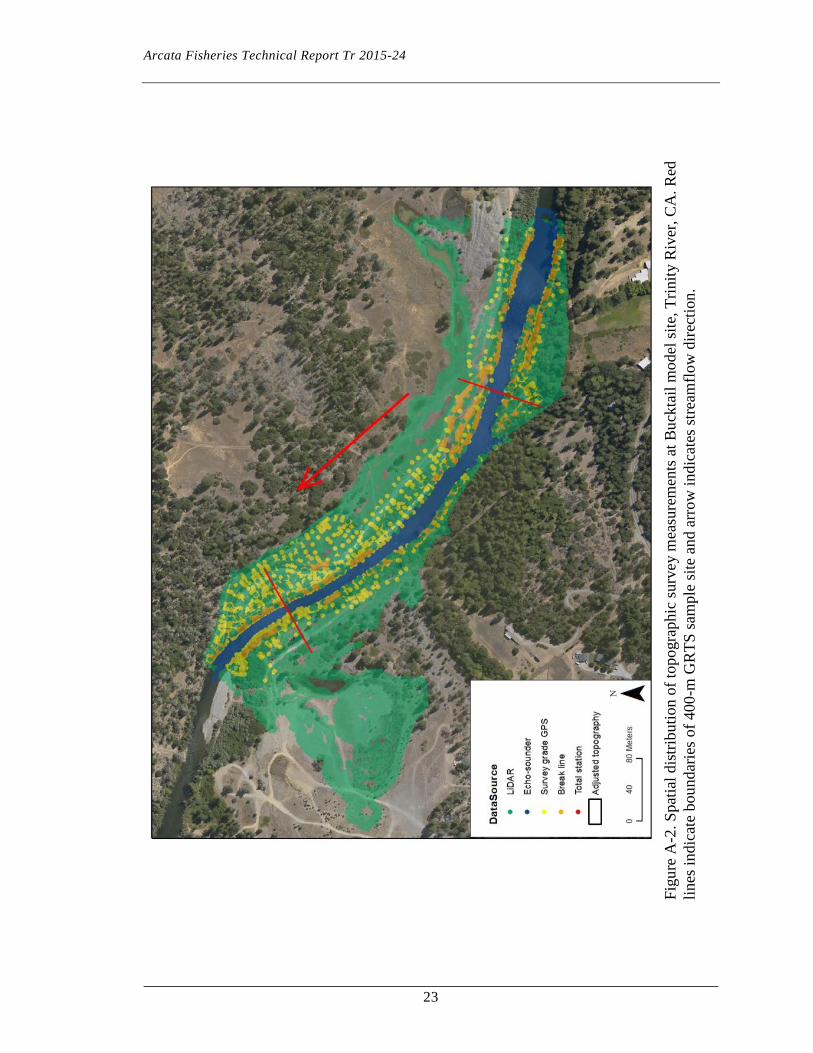
Figu
re A
-3. S
patia
l dis
tribu
tion
of to
pogr
aphi
c su
rvey
mea
sure
men
ts a
t McI
ntyr
e m
odel
site
, Trin
ity R
iver
, CA
. Red
lin
es in
dica
te b
ound
arie
s of 4
00-m
GR
TS sa
mpl
e si
te a
nd a
rrow
indi
cate
s stre
amflo
w d
irect
ion.
Arcata Fisheries Technical Report Tr 2015-24
25
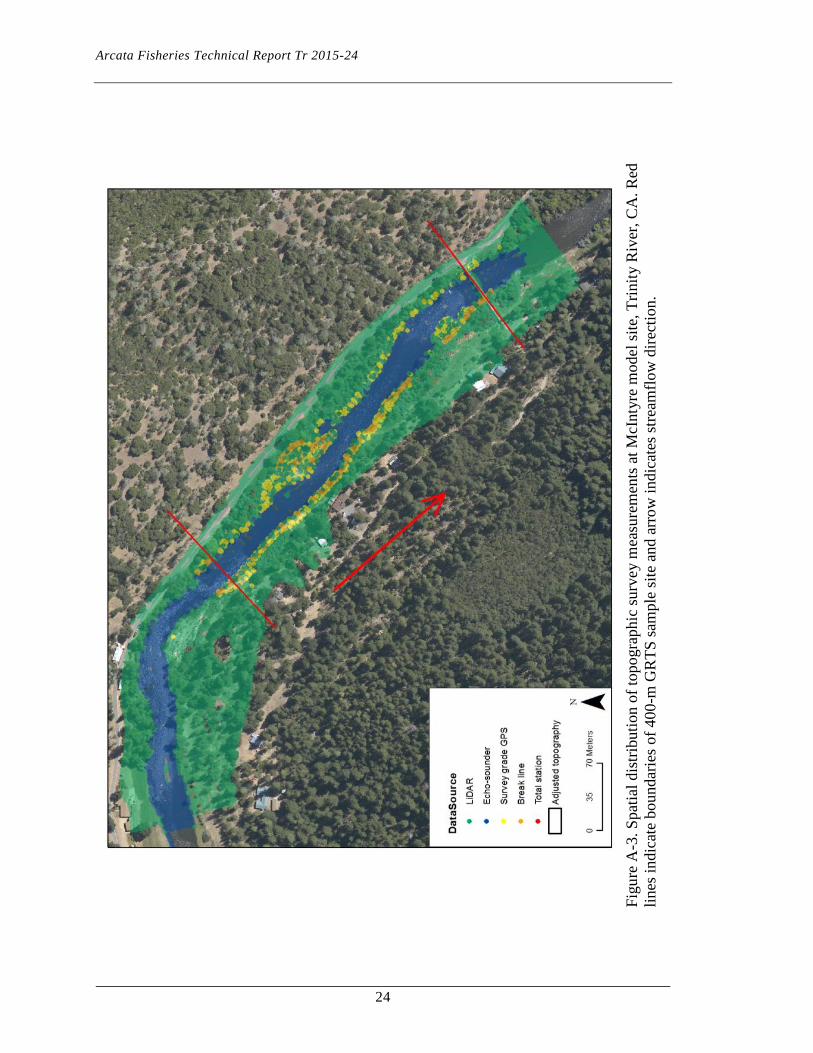
Fi
gure
A-4
. Spa
tial d
istri
butio
n of
topo
grap
hic
surv
ey m
easu
rem
ents
at I
ndia
n C
reek
mod
el si
te, T
rinity
Riv
er, C
A.
Red
line
s ind
icat
e bo
unda
ries o
f 400
-m G
RTS
sam
ple
site
and
arr
ow in
dica
tes s
tream
flow
dire
ctio
n.
Arcata Fisheries Technical Report Tr 2015-24
26
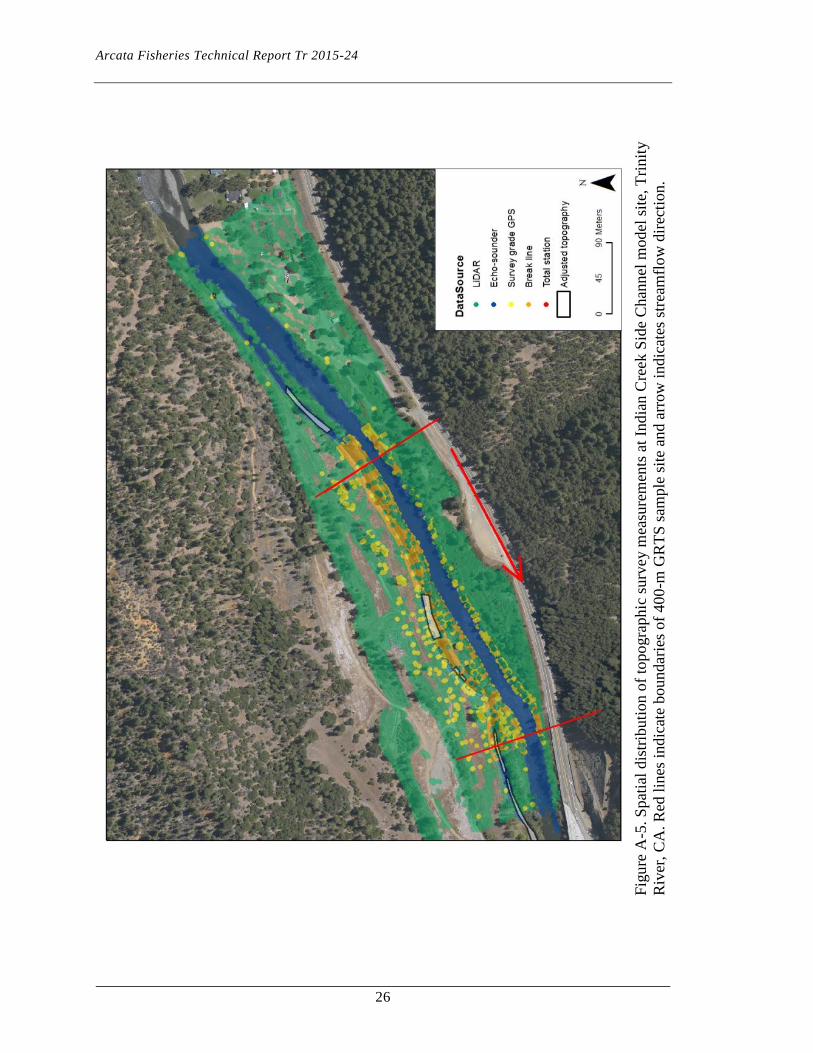
Figu
re A
-5. S
patia
l dis
tribu
tion
of to
pogr
aphi
c su
rvey
mea
sure
men
ts a
t Ind
ian
Cre
ek S
ide
Cha
nnel
mod
el si
te, T
rinity
R
iver
, CA
. Red
line
s ind
icat
e bo
unda
ries o
f 400
-m G
RTS
sam
ple
site
and
arr
ow in
dica
tes s
tream
flow
dire
ctio
n.
Arcata Fisheries Technical Report Tr 2015-24
27
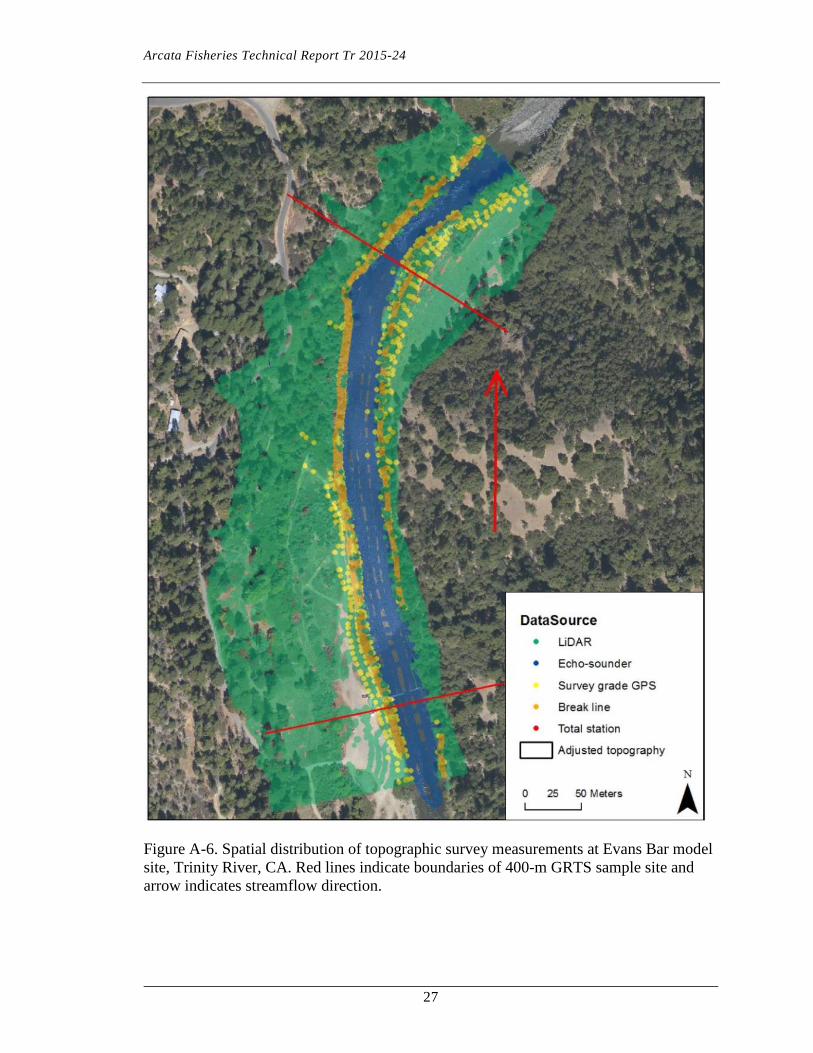
Figure A-6. Spatial distribution of topographic survey measurements at Evans Bar model site, Trinity River, CA. Red lines indicate boundaries of 400-m GRTS sample site and arrow indicates streamflow direction.

Arcata Fisheries Technical Report Tr 2015-24
28
Figu
re A
-7. S
patia
l dis
tribu
tion
of to
pogr
aphi
c su
rvey
mea
sure
men
ts a
t Rou
nd H
ouse
mod
el si
te, T
rinity
Riv
er, C
A.
Red
line
s ind
icat
e bo
unda
ries o
f 400
-m G
RTS
sam
ple
site
and
arr
ow in
dica
tes s
tream
flow
dire
ctio
n.
Arcata Fisheries Technical Report Tr 2015-24
29
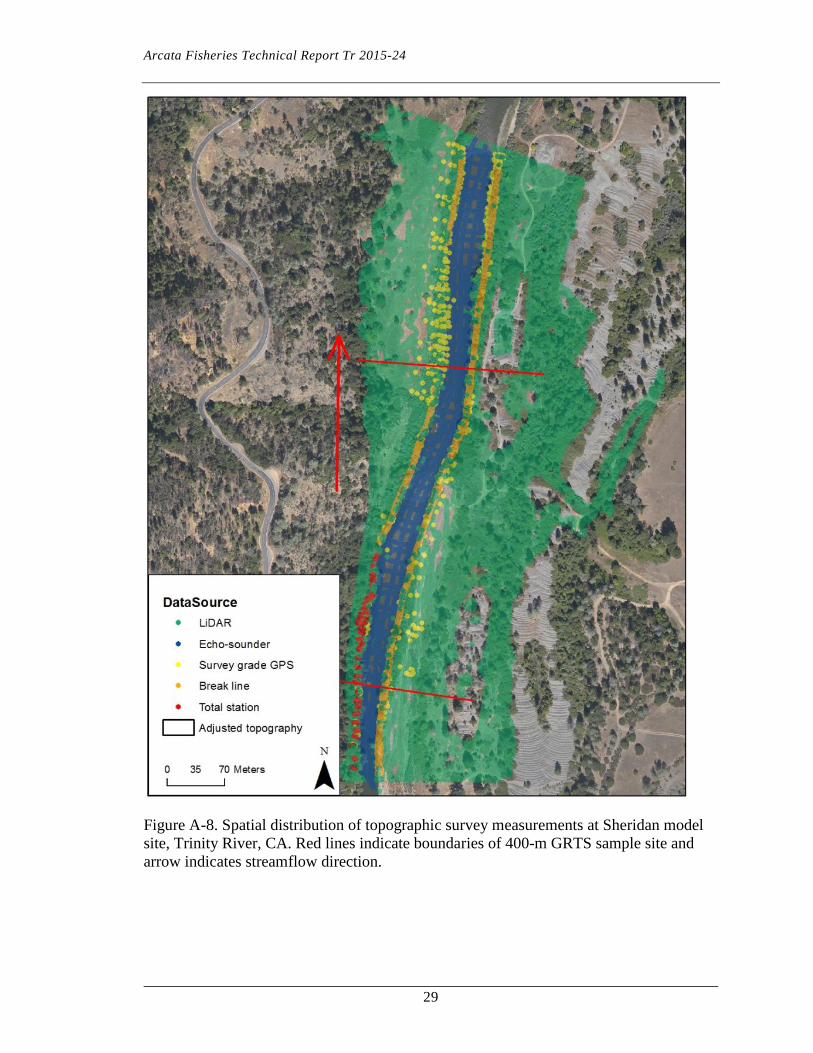
Figure A-8. Spatial distribution of topographic survey measurements at Sheridan model site, Trinity River, CA. Red lines indicate boundaries of 400-m GRTS sample site and arrow indicates streamflow direction.
Arcata Fisheries Technical Report Tr 2015-24
30
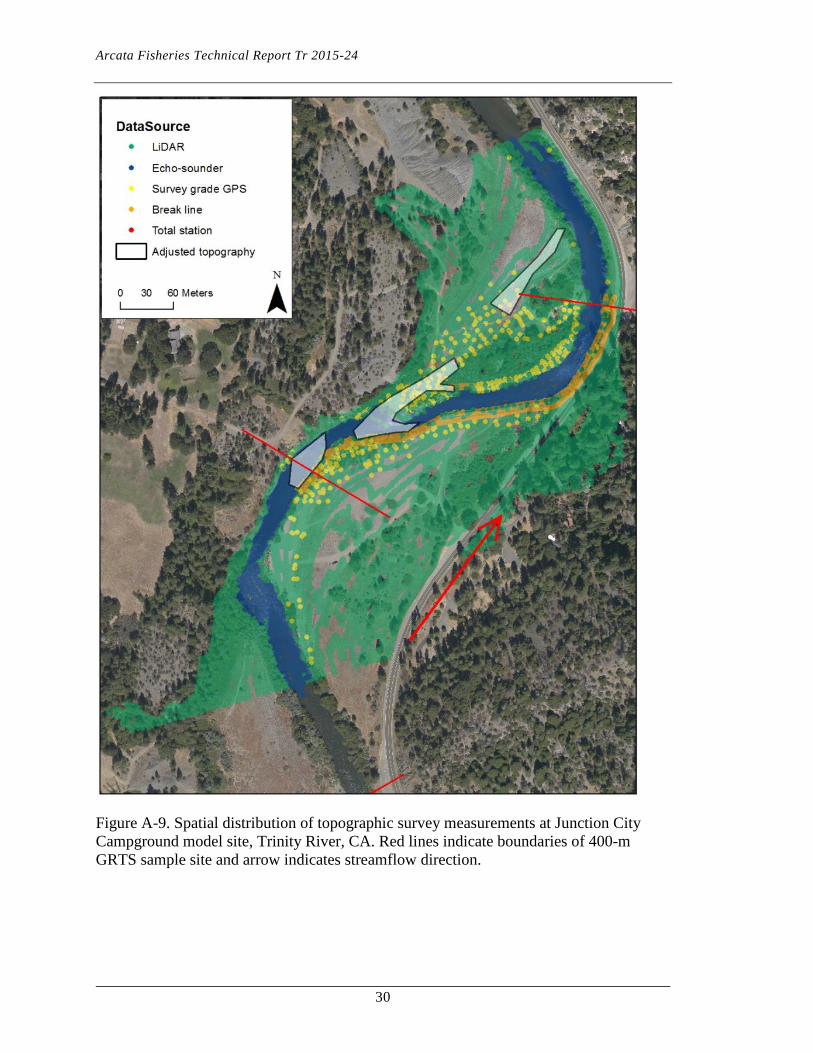
Figure A-9. Spatial distribution of topographic survey measurements at Junction City Campground model site, Trinity River, CA. Red lines indicate boundaries of 400-m GRTS sample site and arrow indicates streamflow direction.

Arcata Fisheries Technical Report Tr 2015-24
31
Figu
re A
-10.
Spa
tial d
istri
butio
n of
topo
grap
hic
surv
ey m
easu
rem
ents
at W
heel
Gul
ch m
odel
site
, Trin
ity R
iver
, C
A. R
ed li
nes i
ndic
ate
boun
darie
s of 4
00-m
GR
TS sa
mpl
e si
te a
nd a
rrow
indi
cate
s stre
amflo
w d
irect
ion.
Arcata Fisheries Technical Report Tr 2015-24
32
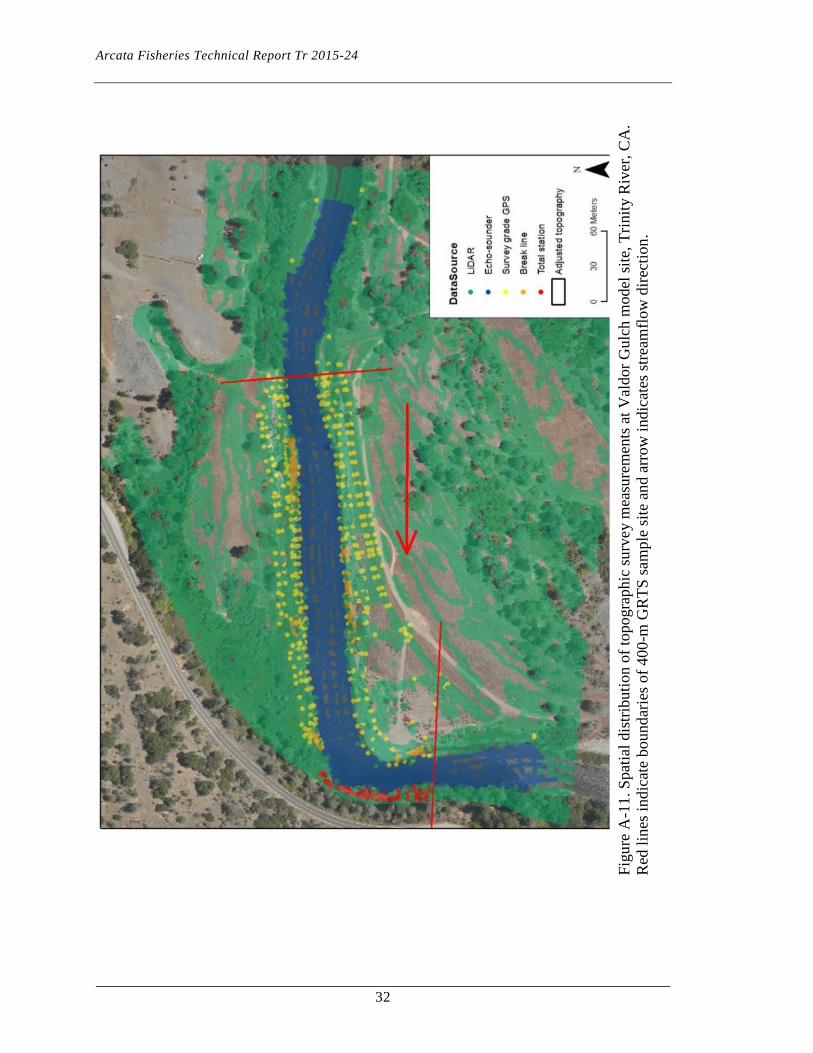
Figu
re A
-11.
Spa
tial d
istri
butio
n of
topo
grap
hic
surv
ey m
easu
rem
ents
at V
aldo
r Gul
ch m
odel
site
, Trin
ity R
iver
, CA
. R
ed li
nes i
ndic
ate
boun
darie
s of 4
00-m
GR
TS sa
mpl
e si
te a
nd a
rrow
indi
cate
s stre
amflo
w d
irect
ion.
Arcata Fisheries Technical Report Tr 2015-24
33
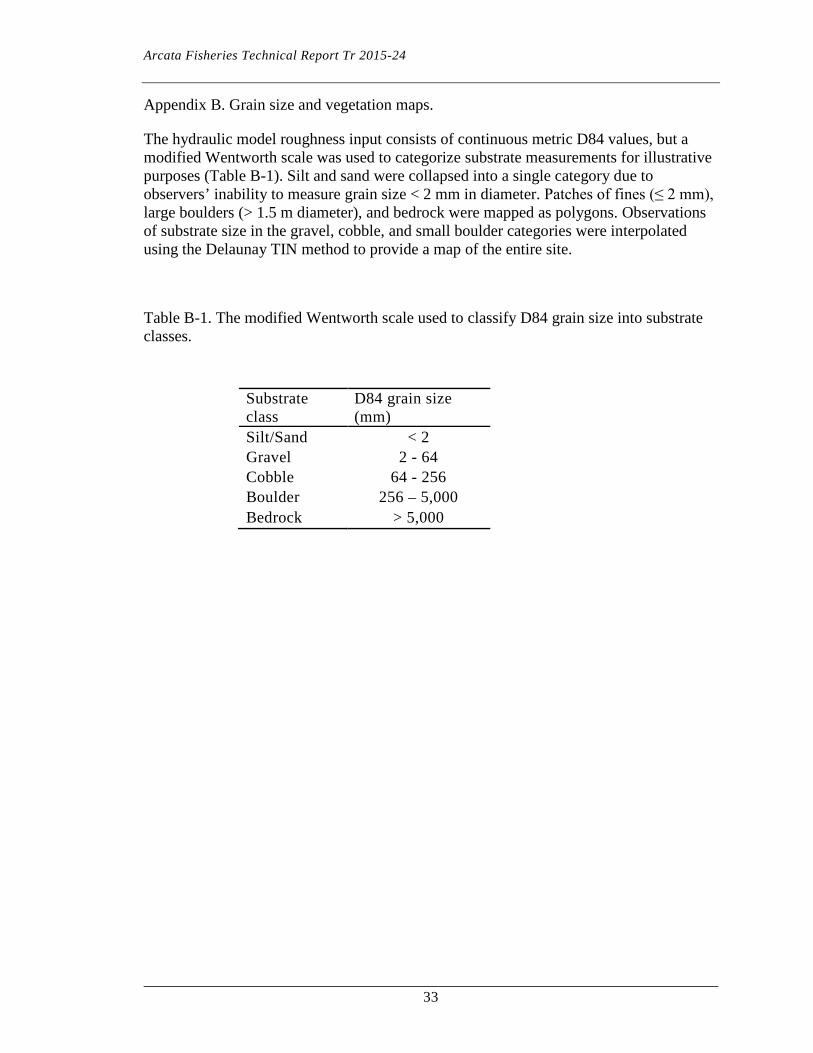
Appendix B. Grain size and vegetation maps.
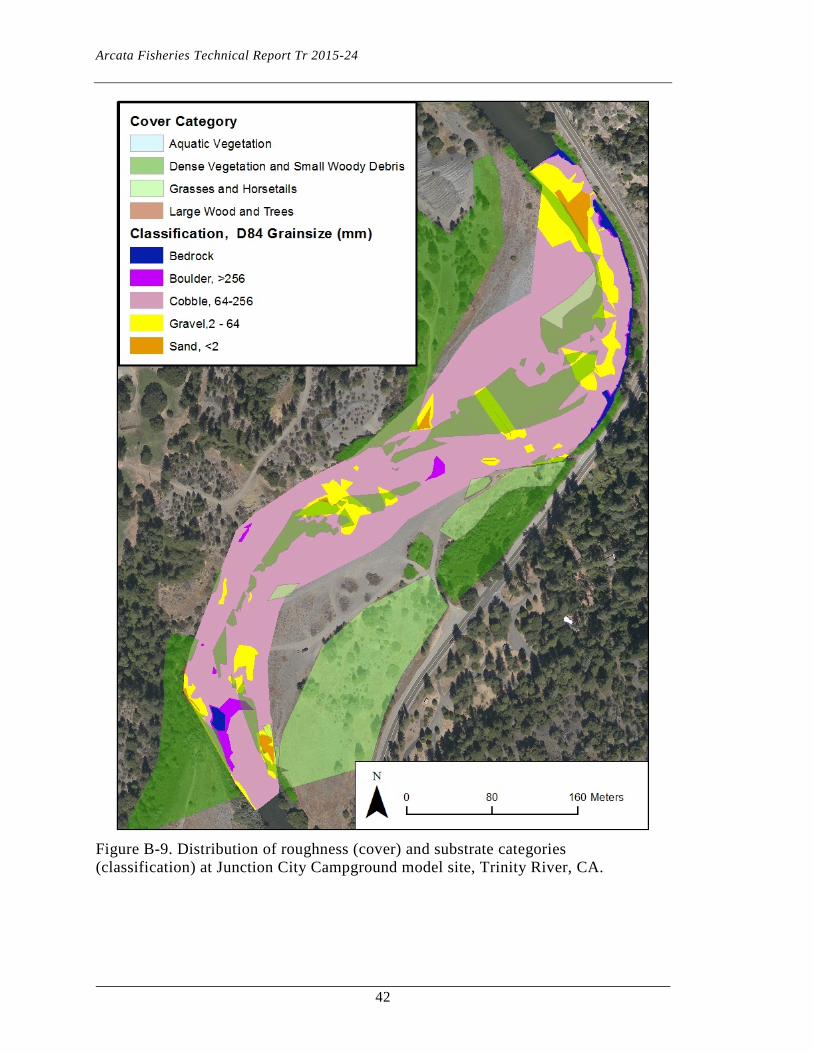
The hydraulic model roughness input consists of continuous metric D84 values, but a modified Wentworth scale was used to categorize substrate measurements for illustrative purposes (Table B-1). Silt and sand were collapsed into a single category due to observers’ inability to measure grain size < 2 mm in diameter. Patches of fines (≤ 2 mm), large boulders (> 1.5 m diameter), and bedrock were mapped as polygons. Observations of substrate size in the gravel, cobble, and small boulder categories were interpolated using the Delaunay TIN method to provide a map of the entire site.
Table B-1. The modified Wentworth scale used to classify D84 grain size into substrate classes.
Substrate class
D84 grain size (mm)
Silt/Sand < 2 Gravel 2 - 64 Cobble 64 - 256 Boulder 256 – 5,000 Bedrock > 5,000

Arcata Fisheries Technical Report Tr 2015-24
34
Figure B-1. Distribution of roughness (cover) and substrate categories (classification) at Lewiston Cableway model site, Trinity River, CA.

Arcata Fisheries Technical Report Tr 2015-24
35
Figu
re B
-2. D
istr
ibut
ion
of ro
ughn
ess
(cov
er) a
nd s
ubst
rate
cat
egor
ies
(cla
ssifi
catio
n) a
t Buc
ktai
l mod
el s
ite,
Trin
ity R
iver
, CA
.

Arcata Fisheries Technical Report Tr 2015-24
36
Figu
re B
-3. D
istr
ibut
ion
of ro
ughn
ess
(cov
er) a
nd s
ubst
rate
cat
egor
ies
(cla
ssifi
catio
n) a
t McI
ntyr
e m
odel
si
te, T
rinity
Riv
er, C
A.

Arcata Fisheries Technical Report Tr 2015-24
37
Figu
re B
-4. D
istr
ibut
ion
of ro
ughn
ess
(cov
er) a
nd s
ubst
rate
cat
egor
ies
(cla
ssifi
catio
n) a
t Ind
ian
Cre
ek m
odel
si
te, T
rinity
Riv
er, C
A.
Arcata Fisheries Technical Report Tr 2015-24
38
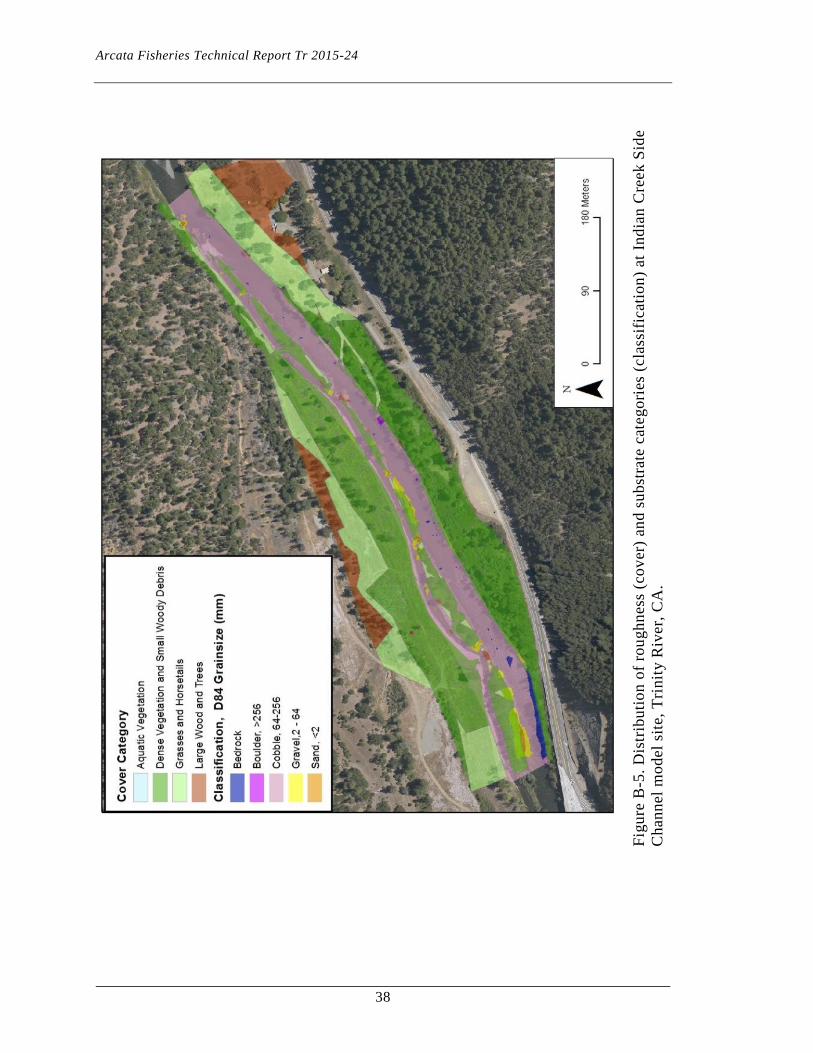
Figu
re B
-5. D
istr
ibut
ion
of ro
ughn
ess
(cov
er) a
nd s
ubst
rate
cat
egor
ies
(cla
ssifi
catio
n) a
t Ind
ian
Cre
ek S
ide
Cha
nnel
mod
el s
ite, T
rini
ty R
iver
, CA
.

Arcata Fisheries Technical Report Tr 2015-24
39
Figure B-6. Distribution of roughness (cover) and substrate categories (classification) at Evans Bar model site, Trinity River, CA.
Arcata Fisheries Technical Report Tr 2015-24
40
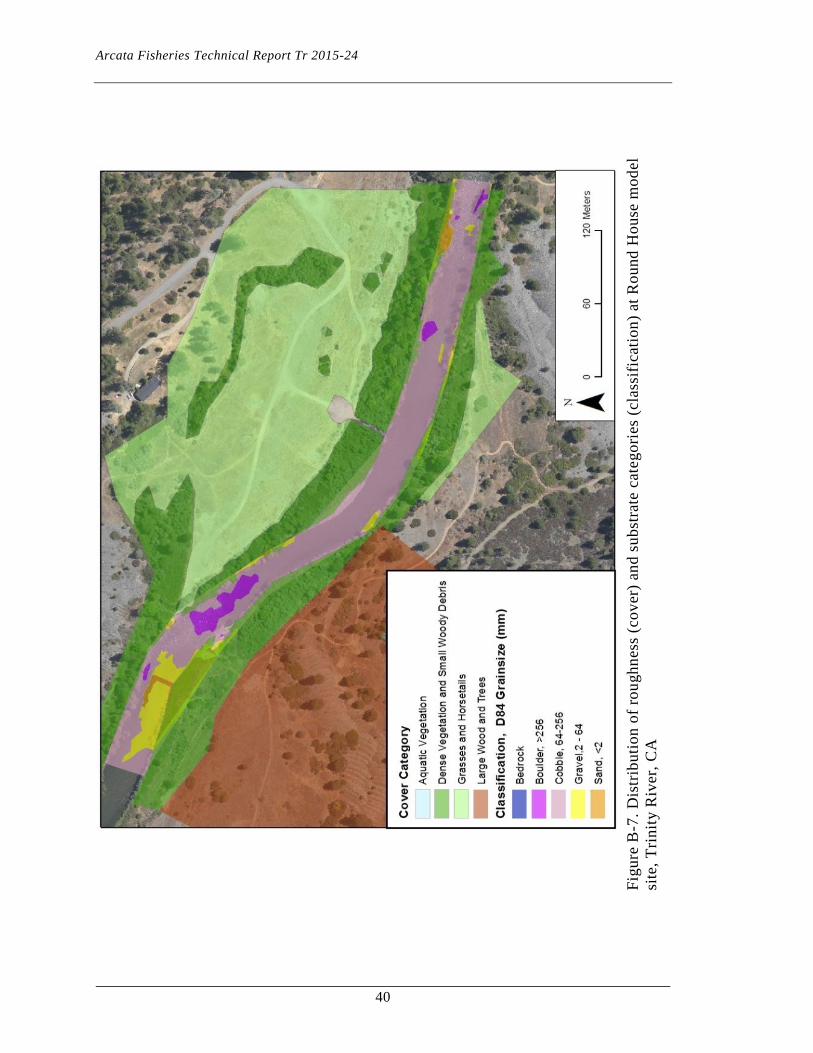
Fi
gure
B-7
. Dis
trib
utio
n of
roug
hnes
s (c
over
) and
sub
stra
te c
ateg
orie
s (c
lass
ifica
tion)
at R
ound
Hou
se m
odel
si
te, T
rinity
Riv
er, C
A

Arcata Fisheries Technical Report Tr 2015-24
41
Figure B-8. Distribution of roughness (cover) and substrate categories (classification) at Sheridan model site, Trinity River, CA.
Arcata Fisheries Technical Report Tr 2015-24
42
Figure B-9. Distribution of roughness (cover) and substrate categories (classification) at Junction City Campground model site, Trinity River, CA.
Arcata Fisheries Technical Report Tr 2015-24
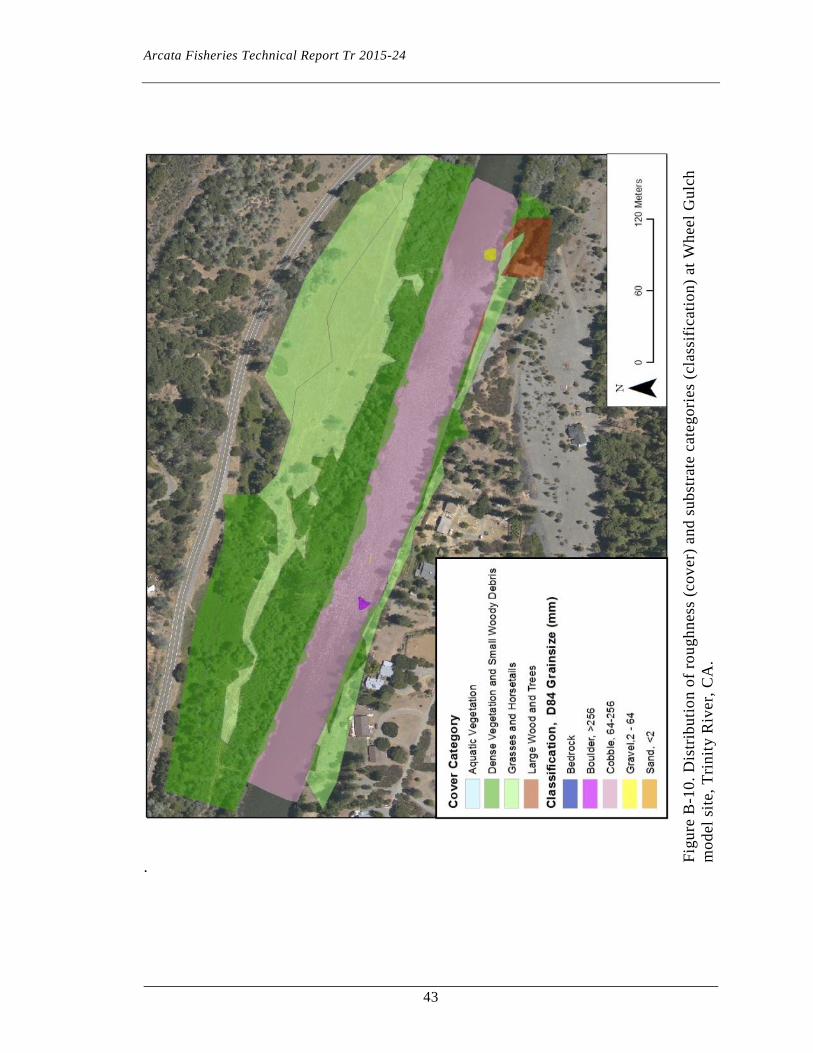
43
. Fi
gure
B-1
0. D
istri
butio
n of
roug
hnes
s (c
over
) and
sub
stra
te c
ateg
orie
s (c
lass
ifica
tion)
at W
heel
Gul
ch
mod
el s
ite, T
rinity
Riv
er, C
A.
Arcata Fisheries Technical Report Tr 2015-24
44
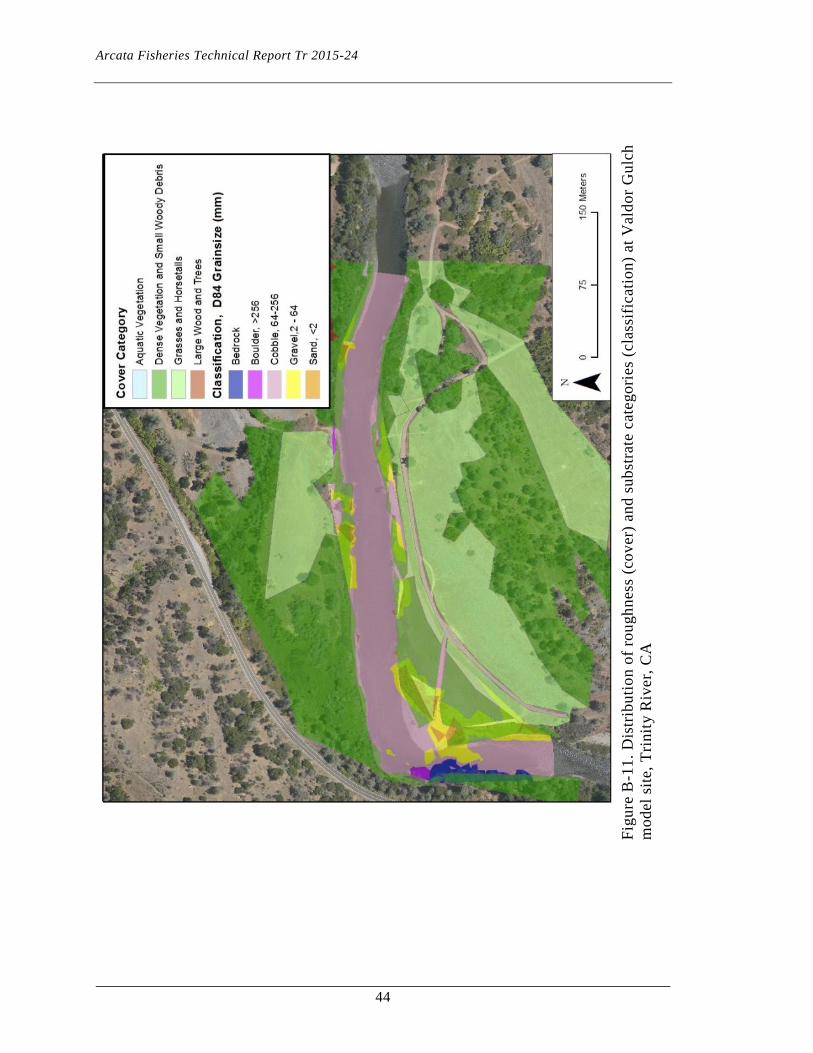
Figu
re B
-11.
Dis
tribu
tion
of ro
ughn
ess
(cov
er) a
nd s
ubst
rate
cat
egor
ies
(cla
ssifi
catio
n) a
t Val
dor G
ulch
m
odel
site
, Trin
ity R
iver
, CA
Arcata Fisheries Technical Report Tr 2015-24
45
Appendix C. Stage-discharge relationships.
Appendix C-1. Stage-discharge relationship for Lewiston Cableway model site. Points indicate stage measurements at the downstream extent of the model. Discharge was measured at proximal USGS gauging station.
Appendix C-2. Stage-discharge relationship for Bucktail model site. Points indicate stage measurements at the downstream extent of the model. Discharge was measured at proximal USGS gauging station.
y = 0.234355x - 0.047321 R² = 0.985549
0.0000
0.1000
0.2000
0.3000
0.4000
0.5000
0.6000
0.9 1.1 1.3 1.5 1.7 1.9 2.1 2.3 2.5
Log
Sta
ge (m
)
Log Discharge (cms)
Lewiston Cableway
y = 0.381349x - 0.392714 R² = 0.992739
0.0000
0.1000
0.2000
0.3000
0.4000
0.5000
0.6000
1 1.2 1.4 1.6 1.8 2 2.2 2.4
Log
Sta
ge (m
)
Log Discharge (cms)
Bucktail

Arcata Fisheries Technical Report Tr 2015-24
46
Appendix C-3. Stage-discharge relationship for McIntyre model site. Points indicate stage measurements at the downstream extent of the model. Discharge was measured at proximal USGS gauging station.
Appendix C-4. Stage-discharge relationship for Indian Creek model site. Points indicate stage measurements at the downstream extent of the model. Discharge was measured at proximal USGS gauging station.
y = 0.514105x - 0.793061 R² = 0.980440
-0.3000-0.2000-0.10000.00000.10000.20000.30000.40000.5000
1.1 1.3 1.5 1.7 1.9 2.1 2.3 2.5
Log
Sta
ge (m
)
Log Discharge (cms)
McIntyre
y = 0.362566x - 0.407929 R² = 0.996994
0.00000.05000.10000.15000.20000.25000.30000.35000.40000.4500
1.16 1.36 1.56 1.76 1.96 2.16 2.36
Log
Sta
ge (m
)
Log Discharge (cms)
Indian Creek
Arcata Fisheries Technical Report Tr 2015-24
47
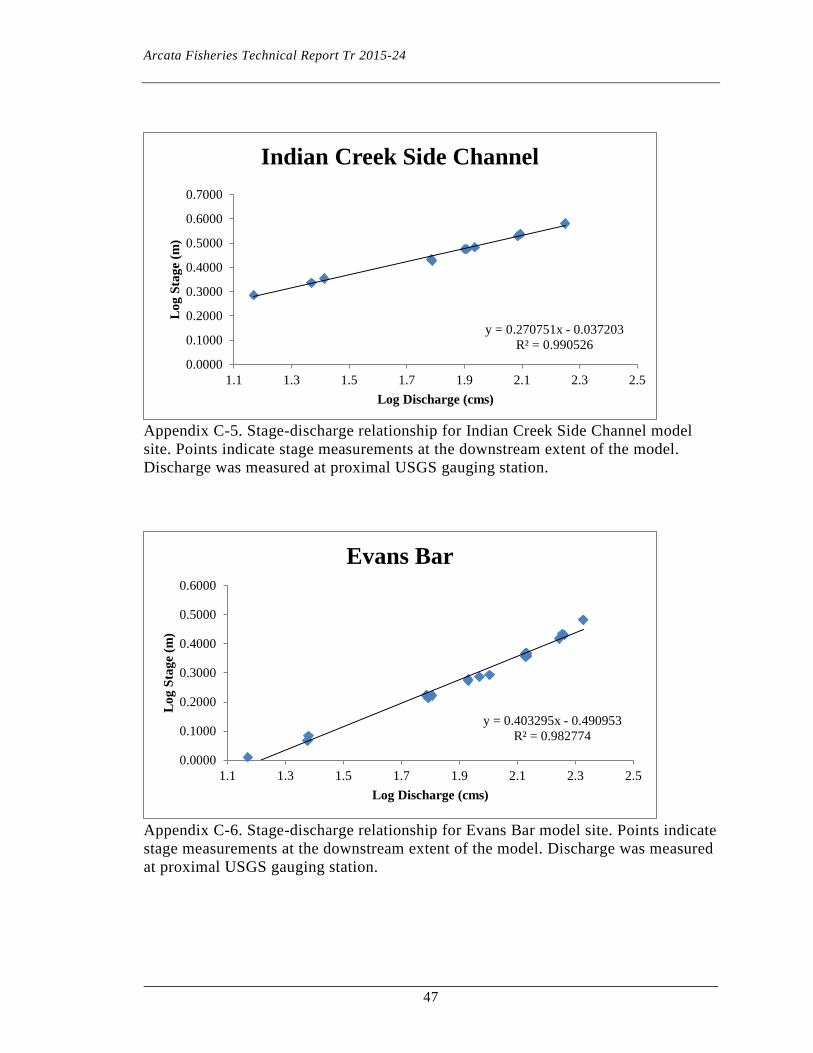
Appendix C-5. Stage-discharge relationship for Indian Creek Side Channel model site. Points indicate stage measurements at the downstream extent of the model. Discharge was measured at proximal USGS gauging station.
Appendix C-6. Stage-discharge relationship for Evans Bar model site. Points indicate stage measurements at the downstream extent of the model. Discharge was measured at proximal USGS gauging station.
y = 0.270751x - 0.037203 R² = 0.990526
0.0000
0.1000
0.2000
0.3000
0.4000
0.5000
0.6000
0.7000
1.1 1.3 1.5 1.7 1.9 2.1 2.3 2.5
Log
Sta
ge (m
)
Log Discharge (cms)
Indian Creek Side Channel
y = 0.403295x - 0.490953 R² = 0.982774
0.0000
0.1000
0.2000
0.3000
0.4000
0.5000
0.6000
1.1 1.3 1.5 1.7 1.9 2.1 2.3 2.5
Log
Sta
ge (m
)
Log Discharge (cms)
Evans Bar

Arcata Fisheries Technical Report Tr 2015-24
48
Appendix C-7. Stage-discharge relationship for Round House model site. Points indicate stage measurements at the downstream extent of the model. Discharge was measured at proximal USGS gauging station.
Appendix C-8. Stage-discharge relationship for Sheridan model site. Points indicate stage measurements at the downstream extent of the model. Discharge was measured at proximal USGS gauging station.
y = 0.450721x - 0.557164 R² = 0.994066
-0.1000
0.0000
0.1000
0.2000
0.3000
0.4000
0.5000
0.6000
1.1 1.3 1.5 1.7 1.9 2.1 2.3 2.5
Log
Sta
ge (m
)
Log Discharge (cms)
Round House
y = 0.457454x - 0.679144 R² = 0.988266
-0.2000
-0.1000
0.0000
0.1000
0.2000
0.3000
0.4000
0.5000
1.1 1.3 1.5 1.7 1.9 2.1 2.3 2.5
Log
Sta
ge (m
)
Log Discharge (cms)
Sheridan

Arcata Fisheries Technical Report Tr 2015-24
49
Appendix C-9. Stage-discharge relationship for Junction City Campground model site. Points indicate stage measurements at the downstream extent of the model. Discharge was measured at proximal USGS gauging station.
Appendix C-10. Stage-discharge relationship for Wheel Gulch model site. Points indicate stage measurements at the downstream extent of the model. Discharge was measured at proximal USGS gauging station.
y = 0.240189x - 0.063223 R² = 0.976546
0.0000
0.1000
0.2000
0.3000
0.4000
0.5000
0.6000
1.1 1.3 1.5 1.7 1.9 2.1 2.3 2.5
Log
Sta
ge (m
)
Log Discharge (cms)
Junction City Campground
y = 0.357427x - 0.478315 R² = 0.969809
-0.1000
0.0000
0.1000
0.2000
0.3000
0.4000
0.5000
1.1 1.3 1.5 1.7 1.9 2.1 2.3 2.5
Log
Sta
ge (m
)
Log Discharge (cms)
Wheel Gulch
Arcata Fisheries Technical Report Tr 2015-24
50
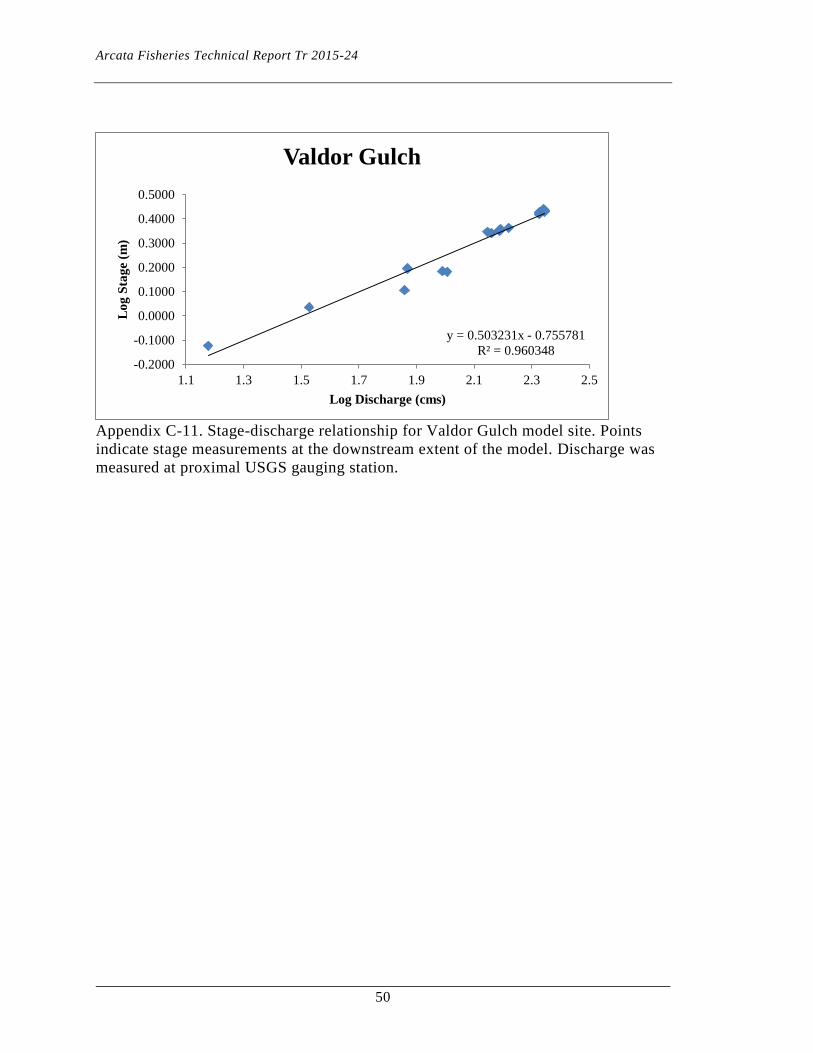
Appendix C-11. Stage-discharge relationship for Valdor Gulch model site. Points indicate stage measurements at the downstream extent of the model. Discharge was measured at proximal USGS gauging station.
y = 0.503231x - 0.755781 R² = 0.960348
-0.2000
-0.1000
0.0000
0.1000
0.2000
0.3000
0.4000
0.5000
1.1 1.3 1.5 1.7 1.9 2.1 2.3 2.5
Log
Sta
ge (m
)
Log Discharge (cms)
Valdor Gulch

Arcata Fisheries Technical Report Tr 2015-24
51
Appendix D. Summary of observed and predicted water surface elevation profiles.
Appendix D-1. Longitudinal water surface elevation plots comparing predicted (red) and observed (black) values at the Lewiston Cableway model site. Figures are labeled by streamflow and as either calibration or validation data types. Multiple elevations observed at the upstream segment of the site at 21.80 cms correspond to the entrance of the side channel. Distance downstream does not incorporate meanders and therefore are shorter than the wetted channel centerline.
Arcata Fisheries Technical Report Tr 2015-24
52
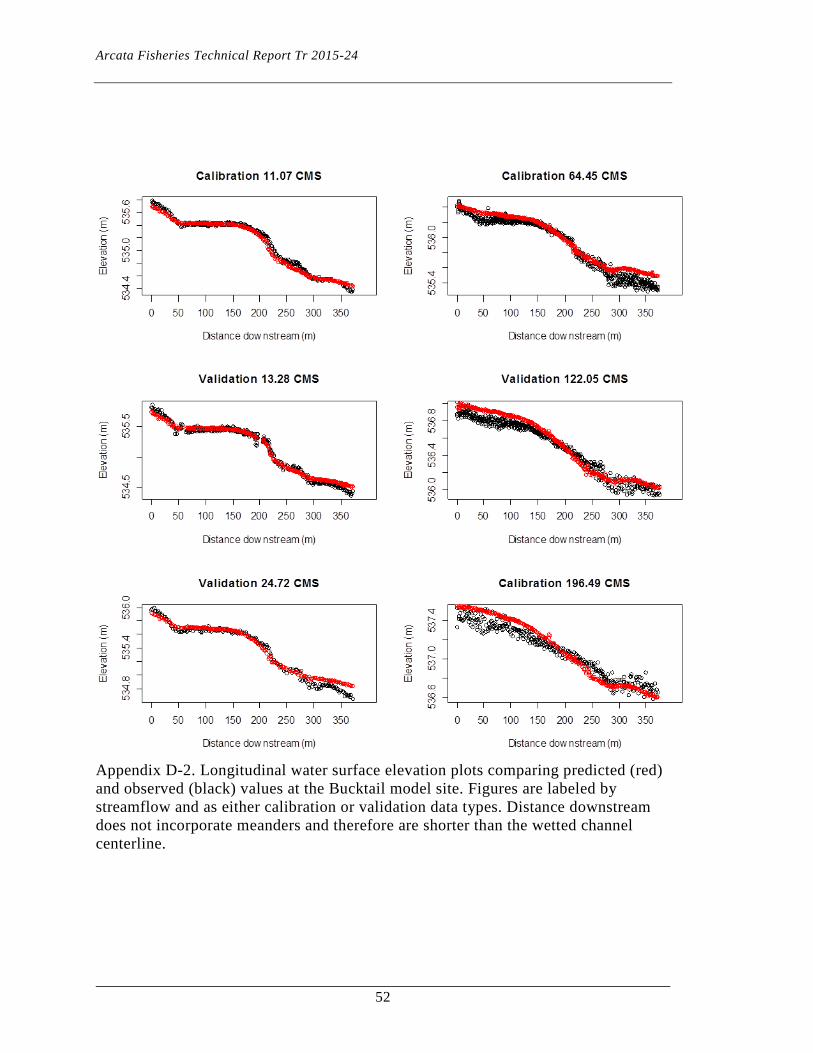
Appendix D-2. Longitudinal water surface elevation plots comparing predicted (red) and observed (black) values at the Bucktail model site. Figures are labeled by streamflow and as either calibration or validation data types. Distance downstream does not incorporate meanders and therefore are shorter than the wetted channel centerline.

Arcata Fisheries Technical Report Tr 2015-24
53
Appendix D-3. Longitudinal water surface elevation plots comparing predicted (red) and observed (black) values at the McIntyre model site. Figures are labeled by streamflow and as either calibration or validation data types. Distance downstream does not incorporate meanders and therefore are shorter than the wetted channel centerline.

Arcata Fisheries Technical Report Tr 2015-24
54
Appendix D-4. Longitudinal water surface elevation plots comparing predicted (red) and observed (black) values at the Indian Creek model site. Figures are labeled by streamflow and as either calibration or validation data types. Distance downstream does not incorporate meanders and therefore are shorter than the wetted channel centerline.
Arcata Fisheries Technical Report Tr 2015-24
55
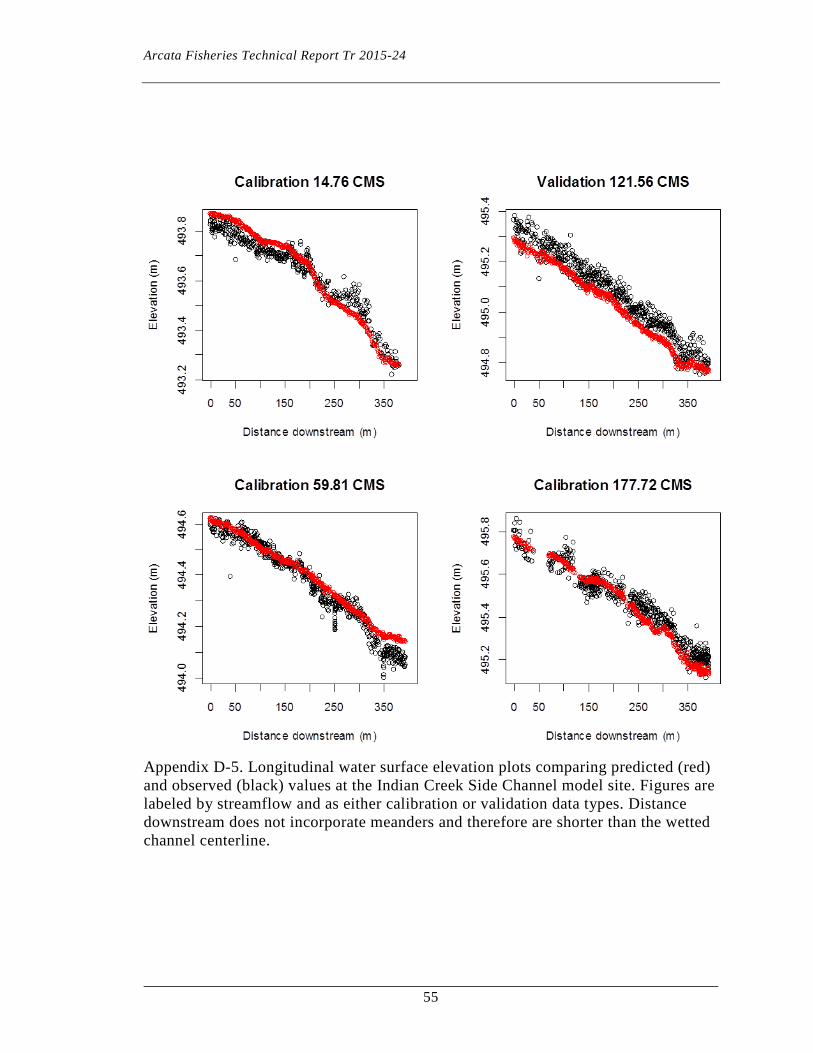
Appendix D-5. Longitudinal water surface elevation plots comparing predicted (red) and observed (black) values at the Indian Creek Side Channel model site. Figures are labeled by streamflow and as either calibration or validation data types. Distance downstream does not incorporate meanders and therefore are shorter than the wetted channel centerline.
Arcata Fisheries Technical Report Tr 2015-24
56
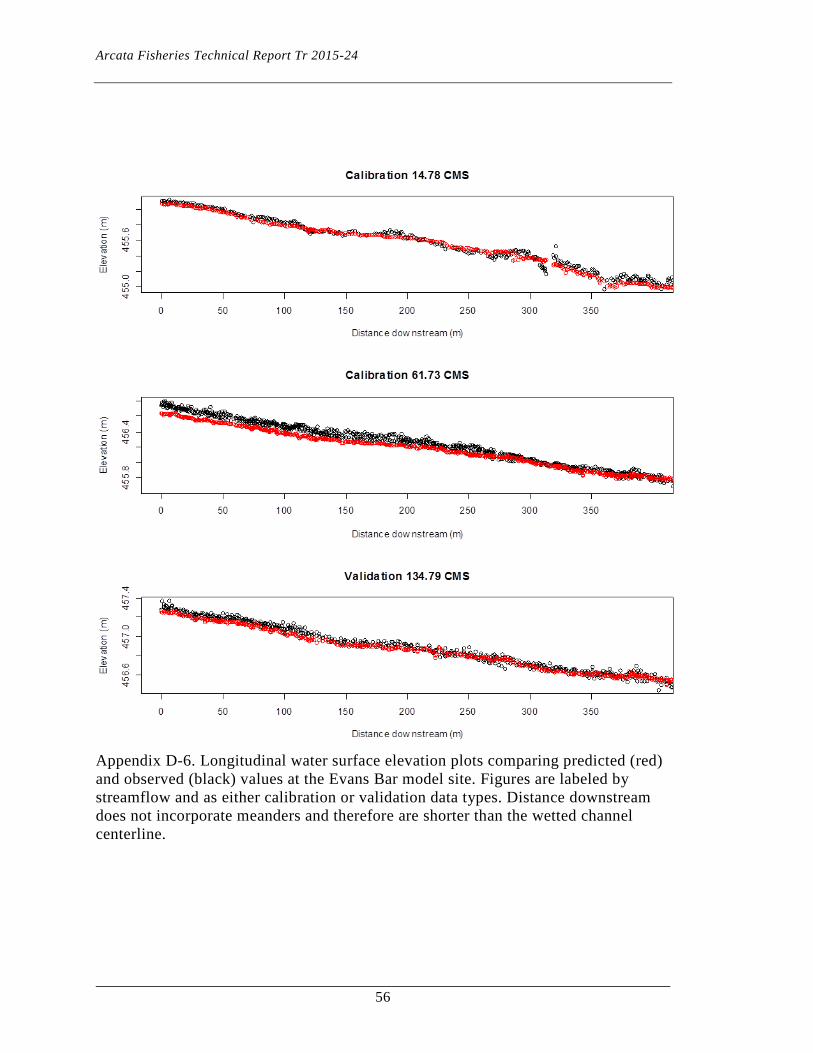
Appendix D-6. Longitudinal water surface elevation plots comparing predicted (red) and observed (black) values at the Evans Bar model site. Figures are labeled by streamflow and as either calibration or validation data types. Distance downstream does not incorporate meanders and therefore are shorter than the wetted channel centerline.

Arcata Fisheries Technical Report Tr 2015-24
57
Appendix D-7. Longitudinal water surface elevation plots comparing predicted (red) and observed (black) values at the Round House model site. Figures are labeled by streamflow and as either calibration or validation data types. Distance downstream does not incorporate meanders and therefore are shorter than the wetted channel centerline.
Arcata Fisheries Technical Report Tr 2015-24
58
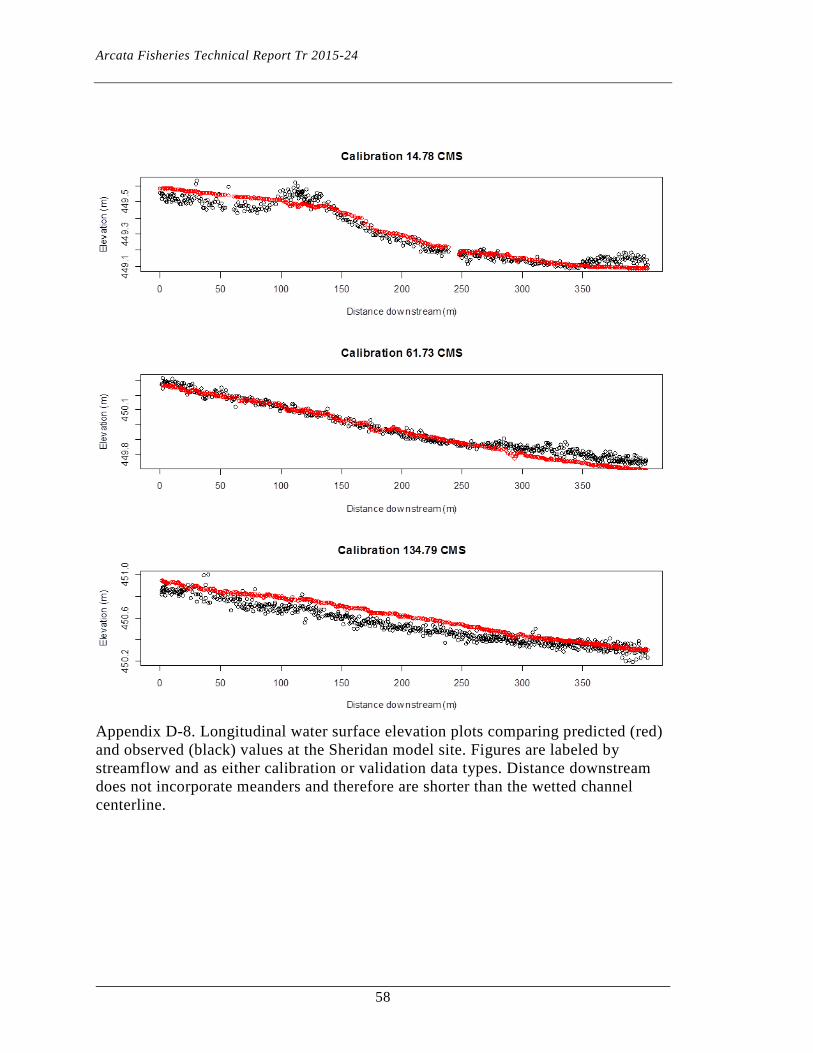
Appendix D-8. Longitudinal water surface elevation plots comparing predicted (red) and observed (black) values at the Sheridan model site. Figures are labeled by streamflow and as either calibration or validation data types. Distance downstream does not incorporate meanders and therefore are shorter than the wetted channel centerline.

Arcata Fisheries Technical Report Tr 2015-24
59
Appendix D-9. Longitudinal water surface elevation plots comparing predicted (red) and observed (black) values at the Junction City Campground model site. Figures are labeled by streamflow and as either calibration or validation data types. Distance downstream does not incorporate meanders and therefore are shorter than the wetted channel centerline.

Arcata Fisheries Technical Report Tr 2015-24
60
Appendix D-10. Longitudinal water surface elevation plots comparing predicted (red) and observed (black) values at Wheel Gulch model site. Figures are labeled by streamflow and as either calibration or validation data types. Distance downstream does not incorporate meanders and therefore are shorter than the wetted channel centerline.

Arcata Fisheries Technical Report Tr 2015-24
61
Appendix D-11. Longitudinal water surface elevation plots comparing predicted (red) and observed (black) values at Valdor Gulch model site. Figures are labeled by streamflow and as either calibration or validation data types. Distance downstream does not incorporate meanders and therefore are shorter than the wetted channel centerline.

Arcata Fisheries Technical Report Tr 2015-24
62
Appendix D-12. Water surface elevation residuals from eleven two-dimensional hydrodynamic models. Residuals are presented by validation or calibration data types, by model site and streamflow.
Arcata Fisheries Technical Report Tr 2015-24
63
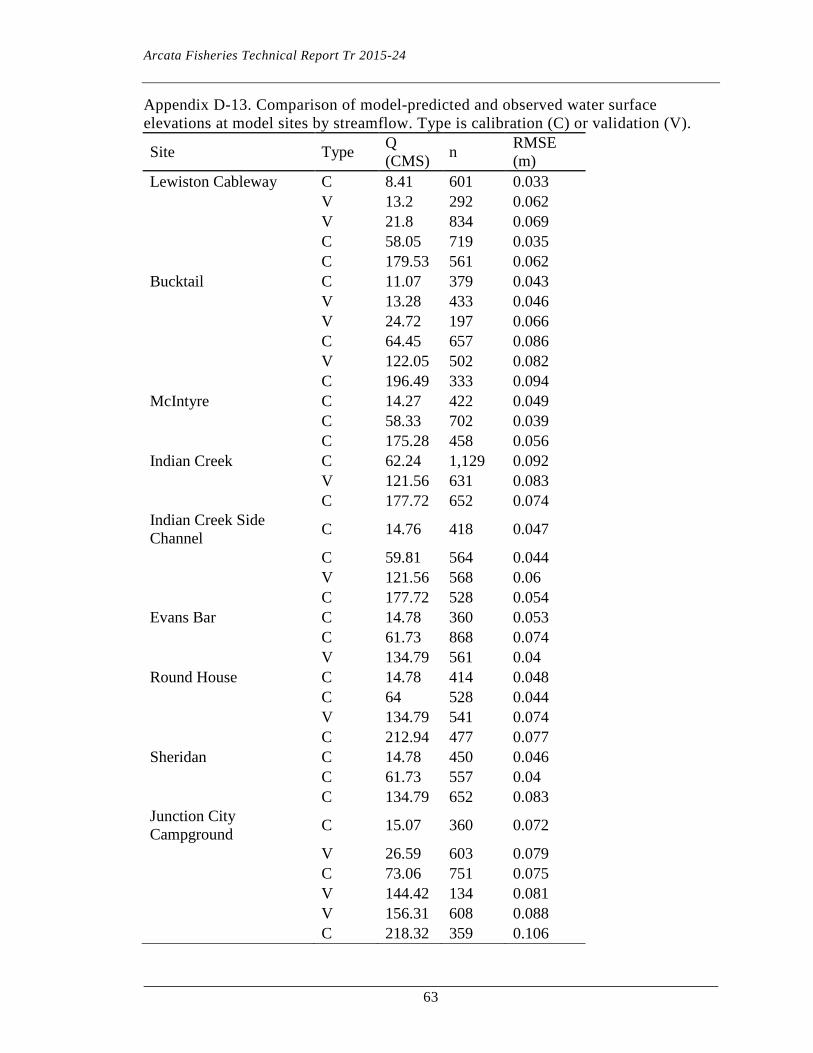
Appendix D-13. Comparison of model-predicted and observed water surface elevations at model sites by streamflow. Type is calibration (C) or validation (V).
Site Type Q (CMS) n RMSE
(m) Lewiston Cableway C 8.41 601 0.033
V 13.2 292 0.062
V 21.8 834 0.069
C 58.05 719 0.035
C 179.53 561 0.062
Bucktail C 11.07 379 0.043
V 13.28 433 0.046
V 24.72 197 0.066
C 64.45 657 0.086
V 122.05 502 0.082
C 196.49 333 0.094
McIntyre C 14.27 422 0.049
C 58.33 702 0.039
C 175.28 458 0.056
Indian Creek C 62.24 1,129 0.092
V 121.56 631 0.083
C 177.72 652 0.074
Indian Creek Side Channel C 14.76 418 0.047
C 59.81 564 0.044
V 121.56 568 0.06
C 177.72 528 0.054
Evans Bar C 14.78 360 0.053
C 61.73 868 0.074
V 134.79 561 0.04
Round House C 14.78 414 0.048
C 64 528 0.044
V 134.79 541 0.074
C 212.94 477 0.077
Sheridan C 14.78 450 0.046
C 61.73 557 0.04
C 134.79 652 0.083
Junction City Campground C 15.07 360 0.072
V 26.59 603 0.079
C 73.06 751 0.075
V 144.42 134 0.081
V 156.31 608 0.088
C 218.32 359 0.106
Arcata Fisheries Technical Report Tr 2015-24
64
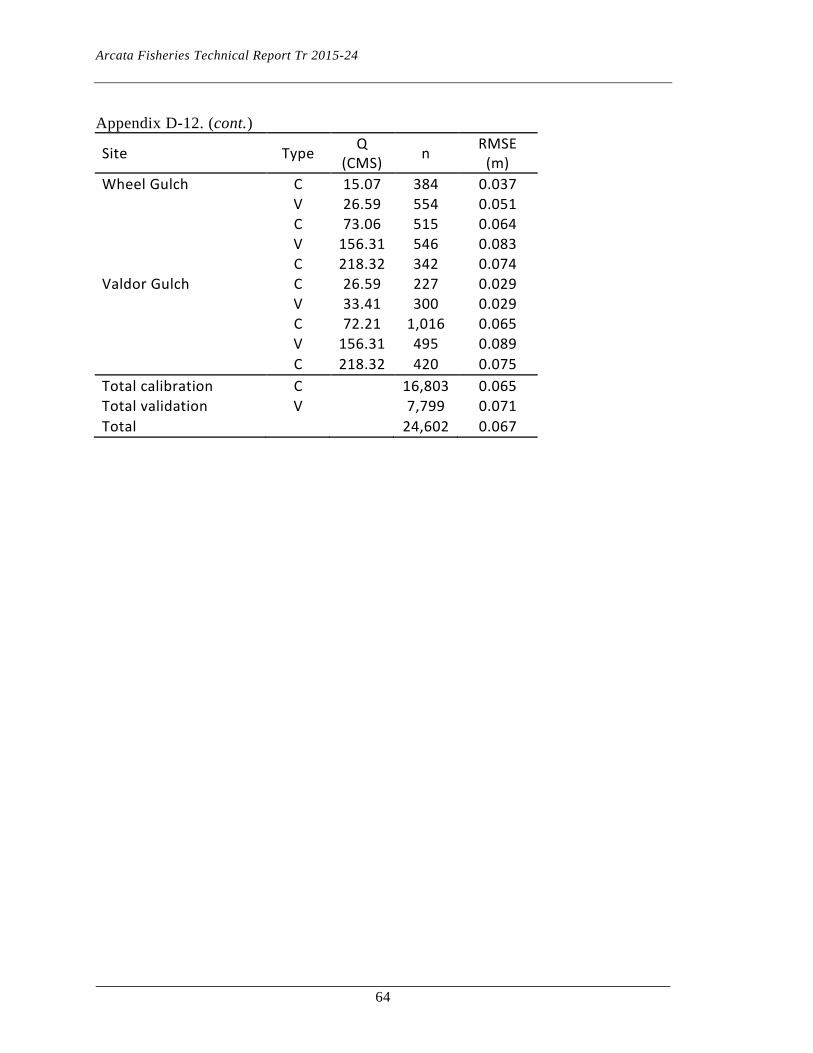
Appendix D-12. (cont.)
Site Type Q (CMS) n RMSE
(m) Wheel Gulch C 15.07 384 0.037
V 26.59 554 0.051
C 73.06 515 0.064
V 156.31 546 0.083
C 218.32 342 0.074
Valdor Gulch C 26.59 227 0.029
V 33.41 300 0.029
C 72.21 1,016 0.065
V 156.31 495 0.089
C 218.32 420 0.075 Total calibration C
16,803 0.065
Total validation V
7,799 0.071 Total 24,602 0.067
Arcata Fisheries Technical Report Tr 2015-24
65
Appendix E. Summary of model-predicted and observed water’s edge.
Appendix E-1. Summary of the distance between observed and predicted water’s edge by data type, model site and streamflow. Type is calibration (C) or validation (V).

Arcata Fisheries Technical Report Tr 2015-24
66
Appendix E-2. Summary of model-predicted and observed water’s edge locations by model site and streamflow. Type is calibration (C) or validation (V) and all distance measures are in m. ISS indicates insufficient sample size.
Q
(cms)
Distance between measured and predicted
Site Type Mean Channel Width (m) n Mean SD IQR Min Max
Lewiston Cableway C 8.41 34.2 14 0.69 0.58 0.7 0.04 2.18
V 13.2 37.9 56 1.2 1 1.07 0.02 4.27
V 21.8 40.9 96 1.37 1.33 1.29 0 6.53
C 58.05 59.4 63 1.27 0.75 0.7 0.01 4.06
C 179.53 72.7 9 2.43 1.5 1.96 1.07 5.6
Bucktail C 11.07 28.8 28 0.78 0.88 0.78 0.02 3.86
V 13.28 29.6 26 0.57 0.61 0.57 0.02 2.65
V 24.72 34.5 51 0.81 1.12 0.67 0.03 6.19
C 64.45 45.8 43 1.47 2.33 1.51 0.02 11.71
V 122.05 65.1 55 1.34 1.37 1.04 0.08 6.86
C 181.96 74.7 13 1.44 1.17 0.75 0.22 4.76
McIntyre C 14.27 34.8 40 0.59 0.47 0.66 0.03 1.78
V 22.82 36.3 34 0.59 0.4 0.45 0.01 1.66
C 58.33 40.3 28 0.76 0.95 0.78 0.03 4.26
V 119.21 46.1 7 2.06 1.94 2.34 0.3 5.49
C 175.28 53.7 1 1.11 ISS ISS ISS ISS
Indian Creek C 14.65 29.7 19 1.29 1.11 1.52 0.04 4.2
V 26.33 32.9 19 1.66 1.7 1.63 0.37 5.22
C 62.24 39.0 26 1.64 1.63 1.09 0.05 7.67
V 121.56 45.6 11 1.68 0.87 0.94 0.71 3.58
C 177.72 52.3 10 4.8 2.95 3.56 0.9 10.17
Indian Creek Side Channel C 14.76 34.3 23 0.38 0.35 0.41 0.07 1.5
V 26.34 36.5 49 0.3 0.34 0.25 0.01 2.3
C 59.81 40.7 48 0.56 1.34 0.35 0 8.54
V 121.56 47.4 49 2.33 3.58 2.92 0 18.62
C 177.72 60.4 6 0.51 0.43 0.68 0.05 1.1
Evans Bar C 14.78 35.6 23 0.37 0.26 0.44 0.02 0.91
V 23.62 36.5 16 0.43 0.23 0.31 0.1 0.92
V 134.79 42.2 10 0.92 0.54 0.65 0.48 2.13
C 183.49 46.5 5 0.73 0.6 1.04 0.06 1.38
Round House C 14.78 28.4 25 0.62 0.38 0.61 0.07 1.38
V 23.62 30.0 22 0.63 0.34 0.38 0.01 1.45
C 64 32.5 12 0.51 0.34 0.44 0.16 1.24
V 134.79 36.2 18 1.47 1.82 0.86 0.35 8.41
C 183.49 39.5 3 1.7 ISS ISS ISS ISS

Arcata Fisheries Technical Report Tr 2015-24
67
Appendix E. (cont.)
Q
(cms)
Distance between measured and predicted
Site Type Mean Channel Width (m)
n Mean SD IQR Min Max
Sheridan C 14.78 38.2 15 0.64 0.39 0.52 0.09 1.64 V 23.62 38.7 19 0.65 0.36 0.24 0.03 1.6 C 61.73 39.8 6 0.72 0.48 0.65 0.01 1.21 V 134.79 43.7 23 0.9 1.22 0.66 0.01 5.35 C 183.49 53.1 6 0.37 0.24 0.27 0.03 0.7 Junction City Campground C 15.07 24.7 14 2.52 4.02 1.05 0 13.01 V 30.3 27.2 18 1.18 1.08 0.51 0.27 4.3 C 73.06 32.4 21 0.63 0.54 0.58 0.05 1.99 V 156.31 37.6 13 4.21 4.68 4.84 0.31 15.78 C 218.32 41.9 7 7.04 10.75 9.28 0.12 27.39 Wheel Gulch C 15.06 42.3 10 0.33 0.28 0.36 0.09 0.88 V 30.3 43.6 18 0.49 0.34 0.42 0.07 1.26 C 73.06 44.9 2 0.05 ISS ISS ISS ISS V 156.31 47.2 3 0.54 ISS ISS ISS ISS C 218.32 48.8 2 0.23 ISS ISS ISS ISS Valdor Gulch C 15.21 38.2 22 1.09 0.89 0.56 0.16 3.93 V 33.41 41.0 28 0.66 0.47 0.52 0.02 1.83 C 72.21 45.9 24 1.52 1.78 1.17 0.05 8.1 V 156.31 60.9 14 1.11 0.95 1.09 0.18 3.07 C 218.32 75.3 11 2.31 1.77 1.79 0.43 5.44 Total calibration 579 1.14 1.96 1.03 0 27.39 Total validation 655 1.15 1.67 0.98 0 18.62 Total 1234 1.15 1.81 0.98 0 27.39
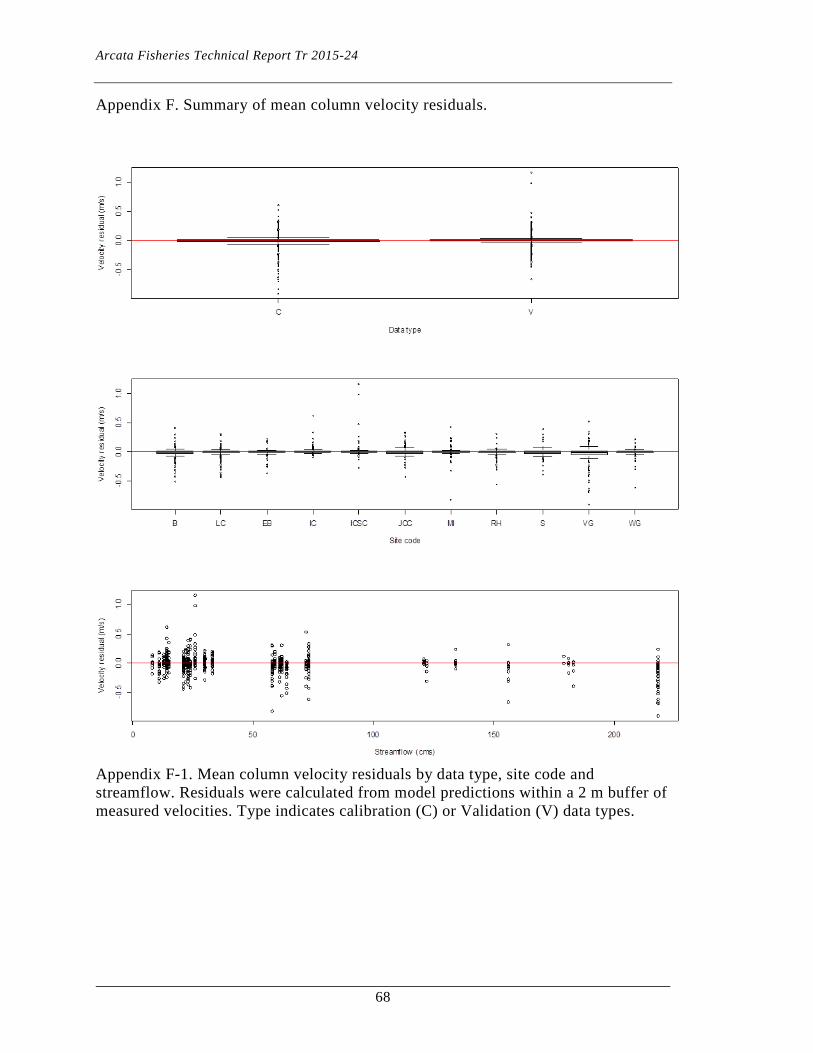
Arcata Fisheries Technical Report Tr 2015-24
68
Appendix F. Summary of mean column velocity residuals.
Appendix F-1. Mean column velocity residuals by data type, site code and streamflow. Residuals were calculated from model predictions within a 2 m buffer of measured velocities. Type indicates calibration (C) or Validation (V) data types.

Arcata Fisheries Technical Report Tr 2015-24
69
Appendix F-2. Mean column velocity residuals by model site and streamflow. Residuals in m*s-1 were calculated from model predictions within a 2 m buffer of measured velocities and were summarized by descriptive statistics. Type indicates calibration (C) or validation (V) data types. Site Type Q (cms) n Mean SD IQR 0% 100% Lewiston Cableway C 8.41 16 -0.01 0.07 0.02 -0.18 0.13
V 13.2 19 -0.02 0.08 0.02 -0.26 0.08
V 21.8 115 -0.01 0.09 0.02 -0.45 0.19
C 58.05 62 -0.03 0.11 0.06 -0.38 0.31
C 179.53 3 0.04 0.07 0.06 -0.01 0.11
Bucktail C 11.07 48 -0.03 0.09 0.03 -0.32 0.18
V 13.28 20 0.01 0.05 0.01 -0.08 0.14
V 24.72 57 0 0.12 0.03 -0.42 0.41
C 64.45 34 -0.07 0.13 0.07 -0.52 0.02
V 122.05 11 -0.06 0.1 0.05 -0.31 0.04
C 181.96 13 -0.01 0.05 0.01 -0.17 0.08
McIntyre C 14.27 38 0.04 0.12 0.01 -0.1 0.47
V 22.82 55 0.03 0.11 0.03 -0.17 0.62
C 58.33 33 -0.03 0.15 0.01 -0.82 0.03
Indian Creek C 14.65 18 0.07 0.15 0.08 -0.01 0.61
V 26.33 60 0.02 0.06 0.01 -0.1 0.33
C 62.24 39 0.01 0.05 0.02 -0.06 0.18
V 121.56 8 0.02 0.03 0.02 -0.01 0.06
Indian Creek Side Channel C 14.76 20 -0.01 0.04 0.02 -0.13 0.08
V 26.11 77 0.04 0.2 0.01 -0.27 1.19
C 59.81 56 0.01 0.05 0.01 -0.08 0.19
V 121.56 8 0.02 0.03 0.02 -0.01 0.06
Evans Bar C 14.78 19 -0.01 0.06 0.02 -0.14 0.19
V 23.62 52 -0.01 0.09 0.02 -0.37 0.23
V 134.79 5 -0.01 0.02 0.01 -0.04 0.01
C 183.49 2 0.01 0.01 0 0 0.01
Round House C 14.78 18 -0.01 0.07 0.03 -0.24 0.14
V 23.62 59 -0.03 0.08 0.03 -0.31 0.06
C 62.3 50 -0.01 0.1 0.03 -0.56 0.31
V 134.79 9 0.02 0.09 0.01 -0.1 0.24
C 183.49 1 0 ISS ISS ISS ISS
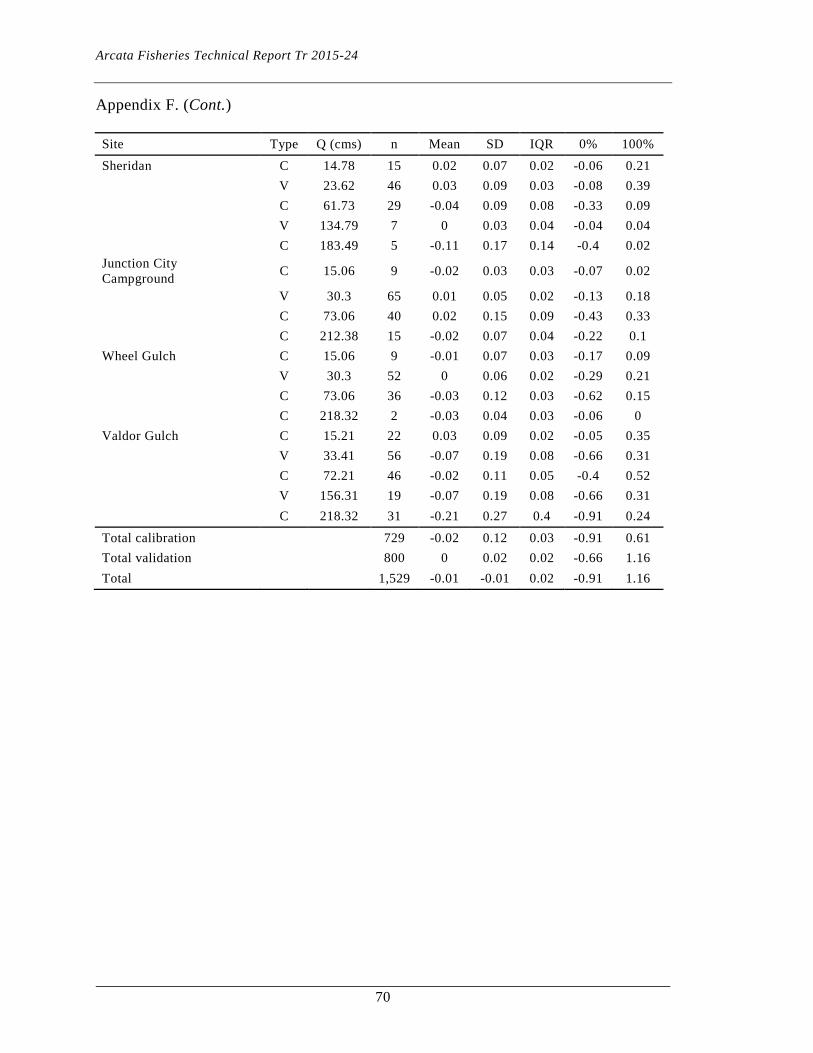
Arcata Fisheries Technical Report Tr 2015-24
70
Appendix F. (Cont.) Site Type Q (cms) n Mean SD IQR 0% 100% Sheridan C 14.78 15 0.02 0.07 0.02 -0.06 0.21
V 23.62 46 0.03 0.09 0.03 -0.08 0.39
C 61.73 29 -0.04 0.09 0.08 -0.33 0.09
V 134.79 7 0 0.03 0.04 -0.04 0.04
C 183.49 5 -0.11 0.17 0.14 -0.4 0.02
Junction City Campground C 15.06 9 -0.02 0.03 0.03 -0.07 0.02
V 30.3 65 0.01 0.05 0.02 -0.13 0.18
C 73.06 40 0.02 0.15 0.09 -0.43 0.33
C 212.38 15 -0.02 0.07 0.04 -0.22 0.1
Wheel Gulch C 15.06 9 -0.01 0.07 0.03 -0.17 0.09
V 30.3 52 0 0.06 0.02 -0.29 0.21
C 73.06 36 -0.03 0.12 0.03 -0.62 0.15
C 218.32 2 -0.03 0.04 0.03 -0.06 0
Valdor Gulch C 15.21 22 0.03 0.09 0.02 -0.05 0.35
V 33.41 56 -0.07 0.19 0.08 -0.66 0.31
C 72.21 46 -0.02 0.11 0.05 -0.4 0.52
V 156.31 19 -0.07 0.19 0.08 -0.66 0.31
C 218.32 31 -0.21 0.27 0.4 -0.91 0.24
Total calibration
729 -0.02 0.12 0.03 -0.91 0.61 Total validation
800 0 0.02 0.02 -0.66 1.16
Total 1,529 -0.01 -0.01 0.02 -0.91 1.16