u.s. global investors funds annual report · u.s. global investors funds the famous author e.l....
TRANSCRIPT

U.S
. G
lob
al
Inve
sto
rs
P.O. B
ox 78
1234
San
Anto
nio,
Texa
s78
278-
1234
U.S. Global Investors Funds Annual Report
December 31, 2008
09-058_InvestorsAnnualCover.indd 109-058_InvestorsAnnualCover.indd 1 2/13/09 12:03:35 PM2/13/09 12:03:35 PM


U.S. Global Investors Funds
Annual Report
December 31, 2008
Table of Contents
Letter to Shareholders 1
Management Teams’ Perspectives 10
Expense Example 69
Portfolios of Investments 72
Notes to Portfolios of Investments 133
Statements of Assets and Liabilities 140
Statements of Operations 146
Statements of Changes in Net Assets 156
Notes to Financial Statements 165
Financial Highlights 182
Report of Independent RegisteredPublic Accounting Firm 195
Trustees and Officers 196
Additional Information 199

Nasdaq Symbols
U.S. Global Investors Funds
U.S. Treasury Securities Cash Fund USTXX
U.S. Government Securities Savings Fund UGSXX
Near-Term Tax Free Fund NEARX
Tax Free Fund USUTX
All American Equity Fund GBTFX
Holmes Growth Fund ACBGX
Global MegaTrends Fund MEGAX
Global Resources Fund PSPFX
World Precious Minerals Fund UNWPX
Gold and Precious Metals Fund USERX
Eastern European Fund EUROX
Global Emerging Markets Fund GEMFX
China Region Fund USCOX
P.O. Box 781234San Antonio, Texas 78278-1234Tel 1•800•US•FUNDSFax 1•210•308•1217www.usfunds.com

Dear Shareholder:
U.S. Global Investors Funds
The famous author E.L. Doctorow oncedescribed the process of writing a book: ‘‘It’slike driving at night. You never see further thanyour headlights, but you can make the wholetrip that way.’’
That’s also an appropriate way to describe theprocess of investing during the darkest and most treacherous mar-kets since the early 1930s. The past year has been a challenge thatwe have met by striving to look as far forward as we could see andthen adjusting the wheel as needed to keep ourselves on the road.
The U.S. Global Investors Funds were not immune from the painthat plagued domestic and global markets in 2008. Every time itlooked like things couldn’t get any worse, another dose of dismalnews would drive the markets down another notch.
The United States spent the year in a recession that officially beganin December 2007, and much of Europe and Asia was in official orde facto recession. China’s phenomenal growth slowed considera-bly, as did that of the other BRIC nations of Brazil, Russia andIndia. The credit crisis arising from the subprime debt catastrophetook down many formidable companies in the financial world –Bear Stearns, Lehman Brothers, Merrill Lynch – and left othersbadly wounded. Forced de-leveraging by banks, hedge funds andothers cratered stock markets, while in Detroit, the economicslowdown and high gas prices in place most of the year left theAmerican auto industry languishing on life support.
Plunging oil prices in the second half of 2008 brought some reliefand governments around the world pumped out hundreds of bil-lions of dollars in economic stimulus spending to try to reverse theglobal downturn, but that didn’t stop U.S. unemployment fromclimbing to a multi-year high, consumer confidence from droppingto a multi-decade low and housing prices from continuing theirfreefall.
�1

U.S. Global Investors Funds
The recession began just as financial regulators were implementinga rule known as FAS 157, which made some changes in howcompanies establish the value of securities when there is little or noactive trading in those securities. As a result of this rule change,many financial companies have written off untold billions of dollarsworth of securities on their balance sheets, even if these securitiescontinued to produce income because valuations are now requiredto reflect exit or market prices. While there’s no doubt that thisrule was enacted with the best of intentions, FAS 157 may haveplayed an unintended yet significant role in the seizing-up ofAmerica’s credit markets.
Leverage was another key factor. Wall Street, Main Street andgovernment agencies were all excessively leveraged, and a rulechange for short-selling that eliminated the uptick rule set off afeeding frenzy by predatory short sellers. Banks and brokeragessought to raise capital to rebuild their balance sheets, but short-selling mercilessly drove down the value of their shares andimpaired their ability to raise enough new money.
Lacking capital, the banks had to cut back on new loans, whichhurts manufacturers and others that need access to short-termworking capital to run their businesses. Products don’t get made,workers don’t get paid and before long the economy has ground toa halt.�2

U.S. Global Investors Funds
The banks also made margin calls against existing loans, includingthose to highly leveraged hedge funds. To get their hands on cash,the hedge funds sold liquid assets, among them natural resourcesand emerging markets equities that had been performing so well.This forced selling was detrimental to our funds that were in thesame sectors.
Capital-deficient banks had to stop facilitating the auction-ratesecurities market for very short-term trading in commercial debt.This destroyed the auction-rate paper market in early 2008, in theprocess locking up hundreds of billions of dollars in investors’money. We were fortunate to not be directly affected by thatcollapse in any of our products.
Before discussing the funds in greater detail, I would like to recapthe results of a special election in 2008. Shareholders approved amomentous change for our fund family — the merger of the nineU.S. Global Investors Funds and the four U.S. Global AccoladeFunds into a single trust. The new trust, which began operations onOctober 1, 2008, is known as U.S. Global Investors Funds.
The combination of the funds into a single trust created a morecost-efficient business structure by removing a number of duplica-tive processes, including the preparation and printing of two sets ofsemi-annual and annual reports each year. In addition, we nowhave a single board of trustees.
Also approved by shareholders in the special election was theaddition of performance fees to the nine equity mutual fundsmanaged by U.S. Global Investors. If a fund surpasses its desig-nated benchmark by five percentage points or more over a 12-month rolling period, the fund adviser will receive a 0.25 percentperformance fee. If a fund’s returns are five percentage points ormore below its benchmark, the adviser will forfeit 0.25 percent ofits base advisory fee.
We believe the performance fee structure benefits shareholders byaligning their interests to an even greater degree to the interests ofthe fund managers. Our portfolio managers have significant invest-ments in the funds they manage and, hence, have exposure to thefunds’ ups and downs just like other shareholders. Along with theportfolio managers, many other U.S. Global employees invest inthe funds we manage. In this way, the financial interests of ourentire company – both at a corporate level and an individual level –are aligned with those of the other shareholders. �3
U.S. Global Investors Funds
I offer my sincere thanks to fund shareholders for their vote ofconfidence in the special election. We have worked hard over theyears to earn your trust, and we were gratified that you supportedus during a particularly difficult period in the markets.
Another noteworthy event came in early November 2008, whenU.S. Global Investors took over day-to-day management of theEastern European Fund and the Global Emerging Markets Fund.We restructured our relationship with Charlemagne Capital (IOM)Ltd., which had previously overseen the daily operation of thosefunds. We will use the services of Charlemagne Capital, who isproviding non-discretionary advisory services, when managing thefunds.
We have expanded our investment team to enable us to handle themanagement of these two funds, just as we did when we assumeddirect management of the Global MegaTrends Fund more than ayear ago. Adding experienced personnel from Eastern Europe tothat of our specialists in China-East Asia and natural resourcesfurther broadens our global perspective, which we believe willserve the fund shareholders well.
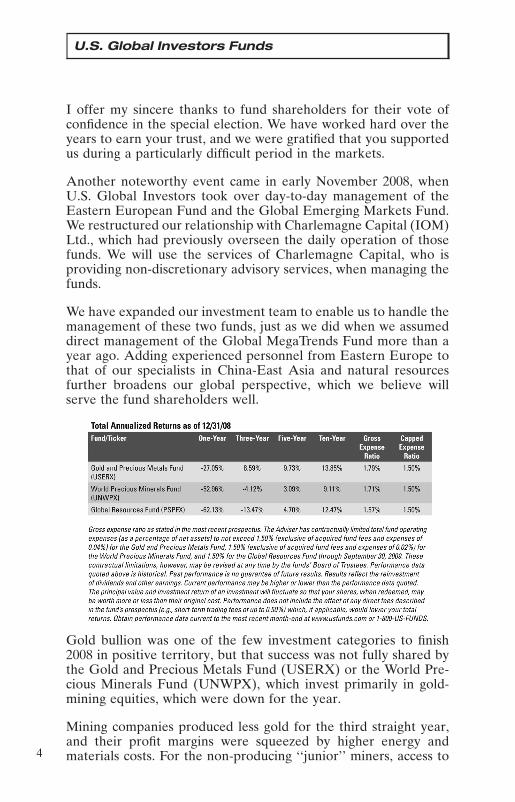
Gold bullion was one of the few investment categories to finish2008 in positive territory, but that success was not fully shared bythe Gold and Precious Metals Fund (USERX) or the World Pre-cious Minerals Fund (UNWPX), which invest primarily in gold-mining equities, which were down for the year.
Mining companies produced less gold for the third straight year,and their profit margins were squeezed by higher energy andmaterials costs. For the non-producing ‘‘junior’’ miners, access to�4

U.S. Global Investors Funds
capital for exploration and development work was very difficult tofind, though there were signs at year-end that this may be changing.
Oil prices peaked near $150 a barrel shortly after mid-year, andthen prices nosedived. By the end of 2008, that same barrel ofcrude was under $40. The Global Resources Fund (PSPFX) wasadversely affected by oil’s price reversal, as well as the drop inprice of industrial metals like copper and aluminum as the globaleconomy slowed.
Early in the six-month period, the All American Equity Fund(GBTFX) was more invested in materials and energy and held alower weighting in financials and health care compared to itsbenchmark, the S&P 500 Index, and those relative weightingscaused the fund to underperform. In the second half of the timeperiod, the fund was helped by a high cash position that themanagers were able to invest during a year-end rally.
The China Region Fund (USCOX) maintained an above averagecash position for most of the six-month period in light of China’seconomic slowdown. But following Beijing’s announcement of ahuge stimulus program, the nation’s stock market climbed. In thisscenario, the defensive cash position contributed to the fund per-forming below its benchmark, the Hang Seng Composite Index.
�5

U.S. Global Investors Funds
We previously reported results for the four former U.S. GlobalAccolade Funds as of October 31, 2008, so this report will onlycover the final two months of the year. Going forward, these fourfunds will be reported at six-month intervals with the remainder ofthe U.S. Global Investors Funds.
In November and December, the Holmes Growth Fund (ACBGX)benefited from its exposure to education and health care stocks,while its performance was hampered by its energy holdings and itslimited exposure to telecom and utilities, two of the best-perform-ing sectors.
The Global MegaTrends Fund (MEGAX), which focuses on infra-structure opportunities in the U.S. and around the world, was alsohelped by some sectors and hurt by others during the two-monthperiod after the fund outperformed the S&P 500 for most of 2008.President Obama has made infrastructure spending in the U.S. akey component of his economic recovery program, which is a goodsign for the sector.
The Eastern European Fund (EUROX) and Global EmergingMarkets Fund (GEMFX) struggled in November and December,and while more short-term volatility is likely, over the longer termgrowth prospects remain bright for Eastern Europe and theworld’s emerging markets on the whole. The BRIC nations –Brazil, Russia, India and China – are all still largely underdevel-oped and need better housing, transport and other infrastructure.�6

U.S. Global Investors Funds
There and elsewhere, consumers have embraced the lifestyles ofthe West, and this should create investment opportunities.
Our municipal bond and money market funds were impacted bythe Federal Reserve’s dramatic cuts in the fed funds rate in itseffort to kick-start the faltering domestic economy. At year-end,the fed funds rate was effectively zero.
These funds were affected by the extremely tight credit conditionsthat prevailed for most of 2008 and that escalated following thecollapse of Lehman Brothers in September. The stimulative effortsof global central banks have increased the chances that we will seean economic recovery in 2009, but that likely remains some monthsaway.
We take a long-term perspective in managing the U.S. GlobalInvestors Funds, and we continue to search for long-term invest-ment opportunities in domestic markets, emerging markets andglobal infrastructure. All of these markets can be very volatile, aswe have seen in 2008, but I provide you this reminder as a way foryou to manage your expectations and make appropriate decisions.
We strive to deliver superior market returns and serve as a sourceof useful information on the trends that influence domestic andglobal markets. That information is available in the ‘‘Frank Talk’’investment blog, as well as in replays of our informative webcastsand in our Weekly Investor Alert electronic newsletter. Iencourage you to sign up for the Investor Alert on our web sitewww.usfunds.com. �7

U.S. Global Investors Funds
And as always, we urge investors to avoid chasing performance.One way to do that is to consider a portfolio allocation modelsimilar to one cited by prominent financial planner Roger Gibsonin his excellent book ‘‘Asset Allocation: Balancing FinancialRisk.’’ In this model, assets are divided among four broad catego-ries – domestic stocks, international stocks, fixed-income securitiesand hard assets – and rebalanced periodically to maintain thedesired exposure.
Thank you for placing your trust in U.S. Global Investors. We takethat trust very seriously, and we look forward to serving you in theyears ahead.
Sincerely,
Frank HolmesCEO and Chief Investment OfficerU.S. Global Investors, Inc.
Please consider carefully the fund’s investment objectives, risks,charges and expenses. For this and other important information,obtain a fund prospectus by visiting www.usfunds.com or by calling1-800-US-FUNDS (1-800-873-8637). Read it carefully before invest-ing. Distributed by U.S. Global Brokerage, Inc. An investment in amoney market fund is neither insured nor guaranteed by the FederalDeposit Insurance Corporation or any other government agency.Although the fund seeks to preserve the value of your investment at$1.00 per share, it is possible to lose money by investing in the fund.
All opinions expressed and data provided are subject to changewithout notice. Some of these opinions may not be appropriate toevery investor. The MSCI Emerging Markets Index is a free float-adjusted market capitalization index that is designed to measureequity market performance in the global emerging markets. TheS&P 500 Stock Index is a widely recognized capitalization-weighted index of 500 common stock prices in U.S. companies. TheHang Seng Composite Index is a market capitalization-weightedindex that comprises the top 200 companies listed on StockExchange of Hong Kong, based on average market cap for the 12months. Diversification does not protect an investor from marketrisks and does not assure a profit. Foreign and emerging marketinvesting involves special risks such as currency fluctuation and less�8

U.S. Global Investors Funds
public disclosure, as well as economic and political risk. By invest-ing in a specific geographic region, a regional fund’s returns andshare price may be more volatile than those of a less concentratedportfolio. Gold funds may be susceptible to adverse economic,political or regulatory developments due to concentrating in asingle theme. The price of gold is subject to substantial pricefluctuations over short periods of time and may be affected byunpredicted international monetary and political policies. We sug-gest investing no more than 5% to 10% of your portfolio in gold orgold stocks. Because the Global Resources Fund concentrates itsinvestments in a specific industry, the fund may be subject togreater risks and fluctuations than a portfolio representing abroader range of industries. Tax-exempt income is federal incometax free. A portion of this income may be subject to state and localincome taxes, and if applicable, may subject certain investors to theAlternative Minimum Tax as well. Bond funds are subject tointerest-rate risk; their value declines as interest rates rise. Allopinions expressed and data provided are subject to change with-out notice. Some of these opinions may not be appropriate to everyinvestor. The Eastern European Fund invests at least 25% of itstotal assets in companies involved in the oil, gas or banking indus-tries. The risk of concentrating investments in this group of indus-tries will make the fund more susceptible to risk in these industriesthan funds which do not concentrate their investments in an indus-try and may make the fund’s performance more volatile.
�9

Management Team’s Perspective
Money Market Funds
INTRODUCTION
The U.S. Treasury Securities Cash Fund (USTXX) seeks to obtain a highlevel of current income while maintaining the highest degree of safety ofprincipal and liquidity. The U.S. Government Securities Savings Fund(UGSXX) seeks to achieve a consistently high yield with safety ofprincipal.
PERFORMANCE
U.S. Treasury Securities Cash Fund As of December 31, 2008
7-Day Yield 0.01%
7-Day Effective Yield 0.01%
Weighted Average Days to Maturity 54
U.S. Government Securities Savings Fund As of December 31, 2008
7-Day Yield 0.78%
7-Day Effective Yield 0.78%
Weighted Average Days to Maturity 44
An investment in either the U.S. Government Securities Savings Fund or the U.S.Treasury Securities Cash Fund is not insured or guaranteed by the Federal DepositInsurance Corporation (FDIC) or by any other government agency. Although thefunds seek to preserve the value of your investments at $1.00 per share, it is possible tolose money by investing in the funds.
The Adviser has contractually limited total fund operating expenses (as a percentageof net assets) to not exceed 1.00% for the U.S. Treasury Securities Cash Fund and0.45% for the U.S. Government Securities Savings Fund on an annualized basisthrough September 30, 2009. These contractual limitations, however, may be revisedat any time by the funds’ Board of Trustees. In addition, the yields reported above forthe U.S. Treasury Securities Cash Fund include the effects of the Adviser’s voluntarywaiver of fees and/or reimbursement of expenses to maintain a minimum net yield forthe fund. The Adviser can modify or terminate this arrangement at any time.
PERFORMANCE COMMENTARY
The U.S. Government Securities Savings Fund outperformed the Lippergovernment-only money market funds for the six months ended Decem-ber 31, 2008, returning 0.67 percent versus 0.60 percent for the peer group.The U.S. Treasury Securities Cash Fund underperformed the Lipper treas-ury money market funds for the six months ended December 31, 2008,returning 0.23 percent versus 0.33 percent for the peer group. �10

Money Market Funds
THE SIX-MONTH PERIOD IN REVIEW -ECONOMIC AND POLITICAL ISSUES THATAFFECTED THE FUNDS
September was extremely volatile as the deterioration in the U.S. andglobal economies accelerated rapidly. During the third calendar quarter of2008, the financial crisis essentially froze the global financial system. Theextreme volatility continued into the fourth quarter. Economists deter-mined in retrospect that the U.S. economy officially fell into recession inDecember 2007, and it will likely be the deepest recession in decades.Most economic indicators are at multi-decade lows, among them housingstarts, consumer confidence, manufacturing indicators and unemploy-ment. The economy lost jobs every month this year, raising the unemploy-ment rate to 7.2 percent, the highest level in 15 years. The economy lost 2.6million jobs during 2008, the worst year in absolute terms since 1945.Housing prices nationally fell 18 percent year over year, and in manyplaces around the country the decline in value was even greater. Inflationdeclined sharply after the collapse of global demand, and energy pricesended the year at just a fraction of their level just six months earlier. Anumber of prominent financial firms filed for bankruptcy or survived onlywith the help of government intervention. In early October, the FederalReserve, European Central Bank and other central banks around theworld simultaneously cut interest rates to try to stem the credit crisis. TheFed continued to cut interest rates during the quarter, ultimately drivingrates to virtually zero. Central banks around the globe followed the Fed’slead by aggressively cutting interest rates to stimulate their economies. Asa result, yields collapsed across the money market spectrum. The yield onthe three-month Treasury bill fell 165 basis points to 0.08 percent, whileyields on the six-month T-Bills fell 189 basis points to 0.26 percent. Yieldson longer-term money market instruments, such as 1-year agency bonds,fell 195 basis points to 0.85 percent.
INVESTMENT HIGHLIGHTS
For much of the period, the U.S. Government Securities Savings Fundtook a laddered approach by buying fixed-rate securities across the moneymarket spectrum. The fund averaged a weighted average maturity of 47days over the six-month period. The fund took advantage of higher yieldsby selectively extending its ladder. The U.S. Treasury Securities Cash Fundfollowed a similar approach – its weighted average maturity was 23 daysover the period. The market dynamics for Treasuries changed as a tremen-dous amount of money flowed into the safest and most liquid securities,pushing yields to very low levels relative to other money market alterna-tives. The U.S. Treasury Securities Cash Fund took advantage of relatively
�11

Money Market Funds
high repurchase rates, which kept the weighted average maturity lowerthan the U.S. Government Securities Savings Fund.
CURRENT OUTLOOK
The Federal Reserve went to extraordinary measures during the past sixmonths, cutting interest rates essentially to zero, buying assets directly inthe market and providing other liquidity backstops. The U.S. governmentalso took steps to ensure that the economy did not slide from recessioninto depression. The combined efforts of policy makers in the U.S. andabroad increased the odds of a recovery in 2009, but that is likely somemonths away. The economic stimulus efforts have pushed yields in thegovernment money markets down to very low absolute levels, where theywill likely remain for at least the next six months.
�12

Management Team’s Perspective
Tax Free Funds
INTRODUCTION
The Near-Term Tax Free Fund (NEARX) and Tax Free Fund (USUTX)seek to provide a high level of current income exempt from federal incometaxation and to preserve capital. However, a portion of any distributionmay be subject to federal and/or state income taxes. The Near-Term TaxFree Fund will maintain a weighted average maturity of less than fiveyears, while the Tax Free Fund will generally maintain a longer weightedaverage maturity.
PERFORMANCE GRAPHS
Near-Term Tax Free Fund
Average Annual Performance For the Periods EndedDecember 31, 2008
Six Month One Year Five Year Ten YearNear-Term Tax Free Fund 2.55% 3.25% 2.67% 3.52%
Barclays Capital 3-YearMunicipal Bond Index 3.66% 5.53% 3.23% 4.02%
Performance data quoted above is historical. Past performance is no guarantee of futureresults. Current performance may be higher or lower than the performance data quoted.Investment return and principal value of an investment will fluctuate so that an investor’sshares, when redeemed, may be worth more or less than their original cost. The graph andtable do not reflect the deduction of taxes that a shareholder would pay on fund distributionsor the redemption of fund shares.The Barclays Capital (formerly Lehman Brothers) 3-Year Municipal Bond Index is a totalreturn benchmark designed for municipal assets. The index includes bonds with a minimumcredit rating of BAA3, are issued as part of a deal of at least $50 million, have an amountoutstanding of at least $5 million and have a maturity of two to four years. The returns for theindex reflects no deduction for fees, expenses or taxes.The Adviser has agreed to limit the fund’s total operating expenses to 0.45% throughSeptember 30, 2009; however, the limitation may be revised at any time by the funds’ Board ofTrustees. �13

Tax Free Funds
Tax Free Fund
Average Annual Performance For the Periods EndedDecember 31, 2008
Six Month One Year Five Year Ten YearTax Free Fund 0.22% 0.54% 2.65% 3.63%
Barclays Capital 10-YearMunicipal Bond Index 1.15% 1.52% 3.47% 4.68%
Performance data quoted above is historical. Past performance is no guarantee of futureresults. Current performance may be higher or lower than the performance data quoted.Investment return and principal value of an investment will fluctuate so that an investor’sshares, when redeemed, may be worth more or less than their original cost. The graph andtable do not reflect the deduction of taxes that a shareholder would pay on fund distributionsor the redemption of fund sharesThe Barclays Capital (fomerly Lehman Brothers) 10-Year Municipal Bond Index is a totalreturn benchmark designed for long-term municipal assets. The index includes bonds with aminimum credit rating of BAA3, are issued as part of a deal of at least $50 million, have anamount outstanding of at least $5 million and have a maturity of 8 to 12 years. The returns forthe index reflects no deduction for fees, expenses or taxes.The Adviser has agreed to limit the fund’s total operating expenses to 0.70% throughSeptember 30, 2009; however, the limitation may be revised at any time by the funds’ Board ofTrustees.
Please visit our website at usfunds.com for updated performance informa-tion for different time periods.
PERFORMANCE COMMENTARY
Over the six-month period ended December 31, 2008, the Near-Term TaxFree Fund posted a 2.55 percent return, while the Tax Free Fund returned0.22 percent. The Near-Term Tax Free Fund trailed the performance of itsbenchmark, the Barclays Capital 3-Year Municipal Bond Index, whichreturned 3.66 percent. The Tax Free Fund trailed the performance of itsbenchmark, the Barclays Capital 10-Year Municipal Bond Index, which�14

Tax Free Funds
returned 1.15 percent. The performance difference for the funds wasprimarily driven by fund maturity preferences, as the funds maintainedexposure across a wide range of maturities versus the bullet structure ofeach index.
Both funds significantly outperformed their respective Lipper peer groupsfor the six-month period. The Lipper Short-Intermediate Municipal DebtFund peer group averaged a return of 0.04 percent and the Lipper GeneralMunicipal Debt Fund peer group averaged a return of -8.48 percent. Bothfunds benefited from a conservative credit profile, which was the primarydriver for peer group outperformance. As the subprime debt marketimploded, liquidity dried up and credit spreads widened. This primarilyaffected higher-yielding securities and longer-dated securities.
THE SIX-MONTH PERIOD IN REVIEW -ECONOMIC AND POLITICAL ISSUES THATAFFECTED THE FUNDS
The third quarter of 2008 was extremely volatile, with the Barclays CapitalMunicipal Bond Index(1) falling 3.21 percent during that period. Septem-ber was a particularly treacherous month for the financial markets, andmunicipals were not immune. The municipal bond index suffered itslargest monthly decline (4.69 percent) in more than 20 years. Many of thesame factors generally affecting the financial markets came to bear on themunicipal market, most notably an extreme lack of liquidity as a result ofconstrained brokerage firm balance sheets, brokerage consolidation, tur-moil at insurance firms and other traditional municipal buyers and arbi-trage players exiting the market. The long end of the municipal yield curve(maturities 20 years and longer) suffered the most, with third quarterlosses of 6.5 percent to 8 percent. The short end of the municipal curveoutperformed, as 1- to 5-year bonds generated positive total returns.
The fourth quarter saw some improvement for high-quality municipals,but long-term and lower-quality bonds continued to suffer. The BarclaysCapital Municipal Bond Index rose 0.74 percent during the fourth quarter,but this masked the underlying volatility in certain segments of the mar-ket, particularly the high-yield sector, which declined by more than 21percent. The Barclays Capital Municipal Bond Index fell 2.47 percentduring 2008, its worst decline since 1994. The index fell 2.49 percent in thesecond half of the year.
Virtually all of the factors that impacted municipals in the third quartercontinued into the fourth quarter. The long end of the municipal yieldcurve suffered the bulk of the underperformance, with quarterly losses ofmore than 5 percent for maturities 22 years and longer. The short-interme-diate portion of the municipal curve outperformed with gains approaching �15

Tax Free Funds
4 percent in the 5- to 7-year range. The municipal yield curve steepenedsignificantly, as short-term yields fell by as much as 125 basis points, while30-year bond yields rose by about 5 basis points.
For the six-month period, revenue-backed municipals underperformedgeneral obligation bonds, falling more than 6 percent as credit spreadswidened. Generally speaking, credit quality and total returns were highlycorrelated. High-quality securities outperformed, with performance wors-ening as one moved down the credit scale. Industrial development bondsfared the worst, driven by poor performance of tobacco-backed issuers.The Federal Reserve cut interest rates effectively to zero to combat thewidening financial crisis. The Fed and other government policymakers inWashington pulled out all the stops to avert a financial and economiccollapse.
INVESTMENT HIGHLIGHTS
Strengths
• Both funds maintained a conservative credit profile, which significantlyenhanced performance relative to their peer groups.
• Both funds were significantly overweight Texas municipals, which out-performed.
• Both funds avoided the hardest-hit sectors of the market, notablytobacco, housing and lower quality bonds.
Weaknesses
• Both funds maintained an overweight position relative to the bench-mark in longer term securities, which generally underperformed.
• The funds did have some exposure to low-quality investment-gradebonds, which underperformed.
• The funds maintained significant exposure to hospital-backedmunicipals, which underperformed.
CURRENT OUTLOOK
Opportunities
• Municipals are historically ‘‘cheap’’ compared to other fixed-incomealternatives such as treasuries, agency bonds and corporate bonds.
• The extremely poor performance of high-yield-related securities offersopportunities at much more attractive prices.
�16

Tax Free Funds
Threats
• The slowing economy has taken a toll on municipal issuers. Tax receiptshave fallen sharply and the potential for bankruptcies has increased.
• The Fed has taken interest rates to zero and is now employing ‘‘quanti-tative’’ easing measures (buying assets directly, in addition to directequity injections into financial institutions) to prevent a systematicfinancial collapse. The threat involved in this approach is this is likelysowing the seeds of inflation, but it may be some time before inflationmaterializes.
(1)The Barclays Capital Municipal Bond Index is an unmanaged index representa-tive of the tax-exempt bond market.
�17
Tax Free Funds
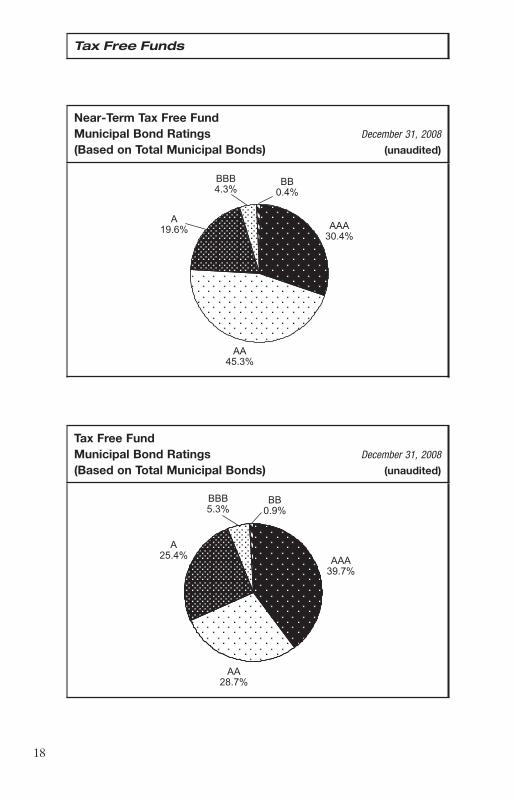
Near-Term Tax Free FundMunicipal Bond Ratings(Based on Total Municipal Bonds) (unaudited)
December 31, 2008
Tax Free FundMunicipal Bond Ratings(Based on Total Municipal Bonds) (unaudited)
December 31, 2008
�18

Management Team’s Perspective
All American Equity Fund
INTRODUCTION
The principal objective of the All American Equity Fund (GBTFX) is toseek capital appreciation by investing primarily in a broadly diversifiedportfolio of domestic common stocks. The fund invests in large-capitaliza-tion stocks, while retaining the flexibility to seek out promising individualstock opportunities. The fund seeks capital appreciation and does notemphasize income.
PERFORMANCE GRAPH
All American Equity Fund
Average Annual Performance For the Periods EndedDecember 31, 2008
Six Month One Year Five Year Ten YearAll American Equity Fund (36.42)% (39.72)% (0.04)% (3.17)%
S&P 500 Index (28.48)% (37.00)% (2.19)% (1.38)%Performance data quoted above is historical. Past performance is no guarantee of futureresults. Current performance may be higher or lower than the performance data quoted.Investment return and principal value of an investment will fluctuate so that an investor’sshares, when redeemed, may be worth more or less than their original cost. The graph andtable do not reflect the deduction of taxes that a shareholder would pay on fund distributionsor the redemption of fund shares.The S&P 500 Index is a widely recognized capitalization-weighted index of 500 commonstock prices in U.S. companies. The returns for the index reflects no deduction for fees,expenses or taxes.The Adviser has agreed to limit the fund’s total operating expenses to 1.75% throughSeptember 30, 2009; however, the limitation may be revised at any time by the funds’ Board ofTrustees.
Please visit our website at usfunds.com for updated performance informa-tion for different time periods. �19

All American Equity Fund
THE SIX-MONTH PERIOD IN REVIEW -ECONOMIC AND POLITICAL ISSUES THATAFFECTED THE FUND
The federal funds rate was lowered three times in the last six months of2008 and is now targeted between 0 and 0.25 percent, with the three cutstotaling between 175 and 200 basis points. The U.S. has officially been inrecession since December 2007. Fourth-quarter 2008 GDP was a negative3.8 percent on a quarter-over-quarter basis, and recent economic reportspoint towards negative growth in the first quarter of 2009. The unemploy-ment picture weakened significantly with the unemployment rate risingfrom 5.6 percent in June to 7.2 percent in December, the highest rate in 15years.
Despite lower inflation, the investment climate became more challenging.The Consumer Price Index (including food and energy) fell from 5.0percent in June 2008 to 0.1 percent in December, while core CPI (exclud-ing food and energy) declined from 2.4 percent to 1.8 percent.
Oil prices averaged $89 per barrel over the six-month period but finishedat $45 – a decline of more than 67 percent in six months.
The yield on the 10-year U.S. Treasury note fell from 3.97 percent at thestart of the time period to 2.21 percent at the end of December. Thisreflects the weakening of the U.S. economy over the time period.
Sector performance was all negative, with staples, healthcare and telecomdeclining the least. The largest declines were seen in materials, energy andfinancials.
INVESTMENT HIGHLIGHTS
Overview
The fund returned negative 36.42 percent for the six-month period endedDecember 31, 2008, compared to a negative 28.48 percent return for theS&P 500 Index.
Being overweight materials and energy and underweight financials hurtthe fund, as dramatic sector rotation took place at the start of July. Theoutperformance only lasted for the first two months of the period. All ofthese gains and more were lost in the last four months. In addition,investors sought the safety of the staples and healthcare sectors, whichwere also underrepresented in the fund at the beginning of the period. Inthe second half of the time period, the fund benefited from a high cash
�20

All American Equity Fund
position that was put to work at the end of the year to participate in a year-end rally.
For the most part, the fund was able to correct the issues that hurt it in thefirst half of the time period. The fund ended the year overweight health-care and financials.
Our top-down analysis reviews global trends that include economic out-looks, the current political and legislative environment, government policychanges, socioeconomic trends, currency effects and other items. This iscombined with a bottom-up analysis that emphasizes companies that webelieve have prospects to generate long-term, sustainable growth in cashflow and relatively high returns on capital.
Strengths
• Consumer staples was the best performing sector, and the fund bene-fited during the time period by owning Altria Group, Inc.,(1) PhilipMorris International, Inc.(2) and General Mills, Inc.(1) During the uncer-tain times, the relative certainty of staples tends to be beneficial.
• Healthcare was the second-best performing sector on the back ofstrength in biotechnology and healthcare supplies. The fund benefitedby being overweight this sector and biotech in particular. Positions inbiotech stocks during the time period included Gilead Sciences, Inc.,(3)
Celgene Corp.,(4) Sequenom, Inc.(5) and United Therapeutics Corp.(6)
Weaknesses
• The worst performing sectors were energy and materials. The fund washurt by being overweight both of these sectors at the start of the timeperiod. Positions that hurt the fund included Potash Corp. of Saskatche-wan, Inc.,(1) The Mosaic Co.,(1) Monsanto Co.,(1) Nabors Industries,Ltd.(1) and Diamond Offshore Drilling, Inc.(1) Other money managerswere unwinding their long positions in commodities and short positionsin financial stocks, which drove down the energy and materials marketsand, for a time, drove the market up for financials.
• Although the financial sector ended up as the third worst performingsector by the end of the time period, it was one of the best performingsectors in the first three months. The fund entered the time period morethan 12 percent underweight financials, which hurt performance for theperiod. We were overweight in financials at the end of the period inexpectations of a rally in early 2009.
�21

All American Equity Fund
Sector Weightings—All American Equity Fund and S&P 500 Index(% of Investments as of December 31, 2008)
All American Equity S&P 500 OverFund Index (Under)
% Weights % Weights % WeightSectorsFinancials 24.4 13.3 11.1Healthcare 17.4 14.8 2.6Technology 13.8 15.3 (1.5)Energy 13.6 13.3 0.3Consumer Discretion 7.0 8.4 (1.4)Materials 6.8 2.9 3.9Utilities 6.0 4.2 1.8Industrials 3.5 11.1 (7.6)Consumer Staples 2.2 12.9 (10.7)Telecommunications 1.6 3.8 (2.2)Cash Equivalent 3.7 0.0 3.7
Total 100.0 100.0 0.0
From a fund construction viewpoint, at December 31, 2008, the fund waspositioned to benefit from a weakening economy with rising inflation.
Fund Metrics
Return P/E toOn Growth Average
Revenue Earnings Equity - Ratio - MarketGrowth Growth ROE PEG Capitalization
All American $23.5Equity Fund 27% 22% 19.1% 1.2X Billion
$15.8S&P 500 Index 8% -10% 20.6% 1.3X Billion
As of December 31, 2008, the average revenue growth in the last 12months for the stocks in the fund was 54 percent, compared to 8 percentfor the stocks in the S&P 500 Index. The high relative growth also appliedto earnings of the stocks in the fund, which on average grew 150 percentyear-over-year over the last 12 months while the S&P 500 Index sawearnings growth of negative 14 percent. The fund’s holdings also exhibitedstronger return on equity, which demonstrated the quality of these compa-nies. Despite higher growth rates, the price-to-projected-earnings-per-share growth rate (PEG ratio) was slightly lower than that of the S&P 500Index.
�22

All American Equity Fund
The fund is actively managed, and holding period is not generally aconsideration in investment decisions. Its portfolio turnover is, and isexpected to continue to be, over 100 percent.
CURRENT OUTLOOK
Opportunities
• Given the massive sell-off in equities, 2009 may be a better year as far asrelative performance.
• The unprecedented fiscal and monetary response to the current eco-nomic weakness could begin to have an impact by midyear.
• Stocks appear to be cheap on a historical basis, given the level of interestrates and assuming estimates are accurate.
Threats
• Stocks historically rally on interest rate cuts. However, the U.S. hasbasically cut rates as low as they possibly can with a targeted fed fundsrate between 0 and 0.25 percent.
• Trade could become an issue in light of record trade deficits and a moreconfrontational Congress.
(1)The fund did not hold this security as of December 31, 2008. (2)This security comprised 2.14% of the total net assets of the fund as of December
31, 2008. (3)This security comprised 2.84% of the total net assets of the fund as of December
31, 2008. (4)This security comprised 1.36% of the total net assets of the fund as of December
31, 2008. (5)This security comprised 0.98% of the total net assets of the fund as of December
31, 2008. (6)This security comprised 0.58% of the total net assets of the fund as of December
31, 2008.
�23

All American Equity Fund
Top 10 Holdings Based on Total InvestmentsDecember 31, 2008
(excluding repurchase agreements)
FIRST FINANCIAL BANKSHARES, INC. 4.44%FINANCIAL SERVICES
VORNADO REALTY TRUST 3.49%REAL ESTATE INVESTMENT TRUSTS
HATTERAS FINANCIAL GROUP 3.42%REAL ESTATE INVESTMENT TRUSTS
JOHNSON & JOHNSON 3.08%MEDICAL - PRODUCTS
VMWARE, INC. 3.05%SOFTWARE TOOLS
GILEAD SCIENCES, INC. 2.96%THERAPEUTICS
LOWE’S COS., INC. 2.77%RETAIL
UNITEDHEALTH GROUP, INC. 2.40%MEDICAL - HMO
MCDONALD’S CORP. 2.40%RESTAURANTS
OCWEN FINANCIAL CORP. 2.36%FINANCIAL SERVICES
TOTAL TOP TEN HOLDINGS 30.37%
Portfolio Profile December 31, 2008
Country Distribution* % of Investments
United States 84.88%
People’s Republic of China 4.17%
Canada 3.23%
Hong Kong 2.86%
Other Foreign 4.86%
* Country distribution shown is based on domicile and is not intended to conform to the‘‘all American’’ definition in the prospectus.
�24

Management Team’s Perspective
Holmes Growth Fund
INTRODUCTION
The Holmes Growth Fund (ACBGX) focuses on companies with goodgrowth prospects and strong positive earnings momentum. Our primaryobjective is long-term capital appreciation.
PERFORMANCE GRAPH
Holmes Growth Fund
Average Annual Performance For the Periods EndedDecember 31, 2008
Two Month One Year Five Year Ten YearHolmes Growth Fund (9.55)% (46.97)% (1.23)% 0.06%
S&P 500 Index (6.19)% (37.00)% (2.19)% (1.38)%
S&P 1500 Index (6.10)% (36.70)% (1.85)% (0.74)%Performance data quoted above is historical. Past performance is no guarantee of futureresults. Current performance may be higher or lower than the performance data quoted.Investment return and principal value of an investment will fluctuate so that an investor’sshares, when redeemed, may be worth more or less than their original cost.The graph and table do not reflect the deduction of taxes that a shareholder would pay on funddistributions or the redemption of fund shares.The S&P 500 Index is a widely recognized capitalization-weighted index of 500 commonstock prices in U.S. companies. The S&P 1500 Index is a broad-based capitalization-weightedindex of 1500 U.S. companies and is comprised of the S&P 400, S&P 500 and the S&P 600.The returns for the indexes reflect no deduction for fees, expenses or taxes.The Adviser has agreed to limit the fund’s total operating expenses to 1.75% on an annualizedbasis through September 30, 2009; however, the limitation may be revised at any time by thefunds’ Board of Trustees.
Please visit our website at usfunds.com for updated performance informa-tion for different time periods.
�25

Holmes Growth Fund
THE TWO-MONTH PERIOD IN REVIEW -ECONOMIC AND POLITICAL ISSUES THATAFFECTED THE FUND
The federal funds rate was lowered in mid-December to a target between 0and 0.25 percent in an effort to energize the U.S. economy, which hasofficially been in recession since December 2007. Economic reports pointtoward a continuation of the recession in the first quarter of 2009. Theunemployment picture weakened significantly to 7.2 percent in December,the highest rate of unemployment in 15 years.
The Consumer Price Index (including food and energy) came in at 0.1percent as of December 2008. Core CPI (excluding food and energy) was1.8 percent. Oil prices averaged $50 per barrel over the last two months,and finished 2008 at $45. The price range for oil over the period was a highof $71 per barrel and a low of $34.
The yield on the 10-year U.S. Treasury note fell from 3.95 percent at thestart of the time period to 2.21 percent, reflecting the weakening of theU.S. economy over the time period.
Sector performance was mixed, with telecom and utilities in positiveterritory and all other sectors declining. The largest declines were seen inenergy, materials and consumer discretion.
INVESTMENT HIGHLIGHTS
Overview
The fund returned a negative 9.55 percent for the two-month time period,compared to a negative 6.10 percent return for the S&P 1500 Index, thefund’s benchmark.
The fund benefited from its exposure to healthcare and education stocks.The fund’s energy equities tended to be the biggest drags on performance.
Our top down analysis reviews global trends that include economic out-looks, political and legislative environment, government policy changes,socioeconomic trends, currency effects and other similar items. The bot-tom up analysis emphasizes companies that we believe have prospects togenerate long-term, sustainable growth in cash flow and relatively highreturns on capital.
Strengths
• Although consumer discretion was the third worst performing sector,the fund’s holdings in education stocks were positive contributors toperformance. Both ITT Educational Services, Inc.(1) and Strayer Educa-tion, Inc.(2) worked out well for the fund.�26

Holmes Growth Fund
• The fund’s healthcare picks, including Bristol-Myers Squibb Co.,(3)
Humana, Inc.(4) and Emergent Biosolutions, Inc.(5), were positive con-tributors to performance.
Weaknesses
• The decline in oil prices was the biggest reason for energy being theworst performing sector. Holdings that detracted from performanceincluded Peabody Energy Corp.,(6) Helmerich & Payne, Inc.(7) andTransocean, Inc.(8)
• The best performing sectors, telecom and utilities, were under-represented in the fund. The fund had no utility exposure and wasunderweight the telecom sector.
Sector Weightings—Holmes Growth Fund and S&P 1500 Index(As of December 31, 2008 in %)
Holmes Growth S&P 1500 OverFund Index (Under)
% Weights % Weights % WeightSectorsHealthcare 30.1 14.5 15.6Financials 17.2 14.1 3.1Consumer Discretion 13.6 9.0 4.6Energy 10.3 12.5 (2.2)Technology 8.0 15.1 (7.1)Industrials 6.2 11.6 (5.4)Materials 4.5 3.3 1.2Telecom 2.9 3.5 (0.6)Consumer Staples 2.8 11.9 (9.1)Utilities 0.0 4.5 (4.5)Cash Equivalent 4.4 0.0 4.4
Total 100.0 100.0 0.0
From a fund construction viewpoint, at December 31, 2008, the fund isdefensively positioned with a significant presence in healthcare.
Fund Metrics
Return P/E toOn Growth Average
Revenue Earnings Equity - Ratio - MarketGrowth Growth ROE PEG Capitalization
Holmes Growth Fund 19% 56% 24.5% 1.0X $28.2 Billion
S&P 1500 Index 9% -12% 16.9% 1.3X $5.5 Billion
�27

Holmes Growth Fund
As of December 31, 2008, the average revenue growth for the stocks in thefund was 19 percent, compared to 9 percent for the stocks in the S&P 1500Index. The high relative growth also applies to earnings of the stocks in thefund, which on average grew 56 percent year-over-year compared to anegative 12 percent for the S&P 1500 Index. The fund’s holdings exhibitedhigher return on equity. Despite these higher growth rates, the price-to-projected-earnings-per-share growth rate (PEG ratio) is less than that ofthe S&P 1500 Index (1.0x for the fund compared to 1.3x for the index).
CURRENT OUTLOOK
Opportunities
• Given the massive sell-off in equities, 2009 may be a better year as far asrelative performance.
• The unprecedented fiscal and monetary response to the current eco-nomic weakness could begin to have an impact by midyear.
• Stocks appear to be cheap on a historical basis, given the level of interestrates and assuming estimates are accurate.
Threats
• Stocks historically rally on interest rate cuts. However, the U.S. hasbasically cut rates as low as they possibly can with a targeted fed fundsrate between 0 and 0.25 percent.
• Trade could become an issue, given record trade deficits and the possi-bility of a more confrontational Congress.
(1)This security comprised 3.51% of the total net assets of the fund as of December31, 2008.
(2)This security comprised 3.30% of the total net assets of the fund as of December31, 2008.
(3)This security comprised 3.04% of the total net assets of the fund as of December31, 2008.
(4)This security comprised 2.30% of the total net assets of the fund as of December31, 2008.
(5)This security comprised 1.61% of the total net assets of the fund as of December31, 2008.
(6)This security comprised 1.05% of the total net assets of the fund as of December31, 2008.
(7)This security comprised 1.68% of the total net assets of the fund as of December31, 2008.
(8)The fund did not hold this security as of December 31, 2008.
�28

Holmes Growth Fund
Top 10 Holdings Based on Total InvestmentsDecember 31, 2008
(excluding repurchase agreements)
ITT EDUCATIONAL SERVICES, INC. 3.71%SCHOOLS
BAXTER INTERNATIONAL, INC. 3.66%MEDICAL PRODUCTS
STRAYER EDUCATION, INC. 3.49%SCHOOLS
BRISTOL-MYERS SQUIBB CO. 3.22%MEDICAL - PRODUCTS
PETMED EXPRESS, INC. 3.16%RETAIL
CUBIST PHARMACEUTICALS, INC. 3.15%MEDICAL - BIOMEDICAL
STIFEL FINANCIAL CORP. 2.99%FINANCIAL SERVICES
EZCORP, INC. 2.97%RETAIL
ILLUMINA, INC. 2.54%MEDICAL - BIOMEDICAL
FIRST SOLAR, INC. 2.47%ENERGY
TOTAL TOP TEN HOLDINGS 31.36%
Portfolio Profile December 31, 2008
Country Distribution* % of Investments
United States 94.34%
Canada 4.21%
Switzerland 1.45%
* Country distribution shown is based on domicile and the locale of company operationsmay be different. American Depositary (ADRs) and Global Depositary Receipts (GDRs) areincluded as United States investments in accordance with the prospectus.
�29

Management Team’s Perspective
Global MegaTrends Fund
INTRODUCTION
The Global MegaTrends Fund (MEGAX) focuses on companies that arewell positioned to benefit from future investments in global infrastructure,both in the private and public sectors. The fund considers a broad range ofinvestable opportunities, including publicly-traded infrastructure assets(such as airports and toll roads), select utilities, construction and engineer-ing firms, telecom operators, select companies in the alternative energyspace, and companies in the steel, cement and raw materials sectors.
PERFORMANCE GRAPH
Global MegaTrends Fund
Average Annual Performance For the Periods EndedDecember 31, 2008
Two Month One Year Five Year Ten YearGlobal MegaTrends Fund (4.74)% (47.65)% (3.70)% (0.04)%
S&P 500 Index (6.19)% (37.00)% (2.19)% (1.38)%
S&P Global Infrastructure Index 1.13% (38.98)% 9.51% n/aPerformance data quoted above is historical. Past performance is no guarantee of futureresults. Current performance may be higher or lower than the performance data quoted.Investment return and principal value of an investment will fluctuate so that an investor’sshares, when redeemed, may be worth more or less than their original cost.The graph and table do not reflect the deduction of taxes that a shareholder would pay on funddistributions or the redemption of fund shares.The S&P 500 Index is a widely recognized capitalization-weighted index of 500 commonstock prices in U.S. companies. The S&P Global Infrastructure Index provides liquid andtradable exposure to 75 companies from around the world that represent the listed infrastruc-ture universe. The index has balanced weights across three distinct infrastructure clusters:utilities, transportation and energy. The index commenced November 2001; it is not includedin the graph as it had less than the full period of data. The returns for the indexes reflect nodeduction for fees, expenses or taxes.The Adviser has agreed to limit the fund’s total operating expenses to 1.85% on an annualizedbasis through September 30, 2009; however, the limitation may be revised at any time by thefunds’ Board of Trustees.
Please visit our website at usfunds.com for updated performance informa-tion for different time periods.�30

Global MegaTrends Fund
THE TWO-MONTH PERIOD IN REVIEW -ECONOMIC AND POLITICAL ISSUES THATAFFECTED THE FUND
The last two months of 2008 saw a continuation of the themes featuredduring the U.S. presidential election. Then President-elect Obama fre-quently mentioned during his campaign a need to increase domesticinfrastructure spending and to broaden the nation’s commitment to alter-native energy. We believe this was one of the reasons Vestas Wind SystemsA/S,(1) a wind turbine company, appreciated by over 40 percent in antici-pation of investments in the space.
In Canada, where the government also remains committed to infrastruc-ture spending, SNC-Lavalin Group, Inc.,(2) a diversified engineering firm,saw its price rise by 24 percent. However, the performance of the infra-structure-related companies was uneven. The heavy equipment manufac-turer The Manitowoc Co., Inc.(3) saw its share price fall by 12 percent.
Volatility in Russia, which started in July 2008 with an investigation by theRussian government of alleged coal price-fixing by steel companies andwas later exacerbated by the conflict between Russia and Georgia,affected Evraz Group S.A.,(4) one of the vertically integrated steel produc-ers, which suffered a 44 percent depreciation in its share price.
INVESTMENT HIGHLIGHTS
Overview
The fund had a negative 4.74 percent return in the two-month periodended December 31, 2008, compared to a negative 6.19 percent return forthe S&P 500 Index, the fund’s benchmark, and a positive 1.13 percentreturn for the S&P Global Infrastructure Index.
Strengths
• The fund benefited from select international holdings that saw signifi-cant price appreciation. China Communications Construction Co.,Ltd.(5) is seen as one of the potential beneficiaries of the forthcominginfrastructure boom in China, while Hyflux Ltd.,(6) a water infrastruc-ture play in Asia and the Middle East, posted record profit.
• In the U.S., Granite Construction, Inc.,(7) specializing in roads, bridgesand tunnels construction, returned 24 percent as President-elect Obamareiterated his commitment to the infrastructure cause. FPL Group,Inc.,(8) another U.S. company and the fund’s largest holding at year-end,also had a positive contribution to the fund’s performance for theperiod. �31
Global MegaTrends Fund
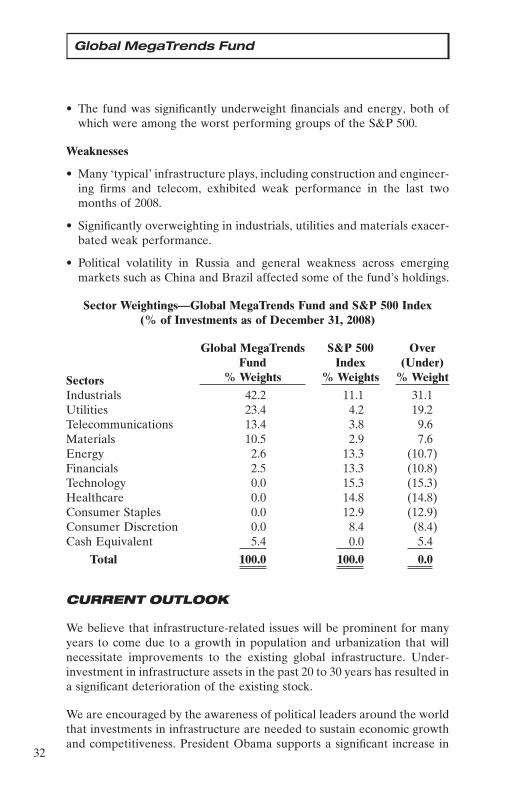
• The fund was significantly underweight financials and energy, both ofwhich were among the worst performing groups of the S&P 500.
Weaknesses
• Many ‘typical’ infrastructure plays, including construction and engineer-ing firms and telecom, exhibited weak performance in the last twomonths of 2008.
• Significantly overweighting in industrials, utilities and materials exacer-bated weak performance.
• Political volatility in Russia and general weakness across emergingmarkets such as China and Brazil affected some of the fund’s holdings.
Sector Weightings—Global MegaTrends Fund and S&P 500 Index(% of Investments as of December 31, 2008)
Global MegaTrends S&P 500 OverFund Index (Under)
% Weights % Weights % WeightSectorsIndustrials 42.2 11.1 31.1Utilities 23.4 4.2 19.2Telecommunications 13.4 3.8 9.6Materials 10.5 2.9 7.6Energy 2.6 13.3 (10.7)Financials 2.5 13.3 (10.8)Technology 0.0 15.3 (15.3)Healthcare 0.0 14.8 (14.8)Consumer Staples 0.0 12.9 (12.9)Consumer Discretion 0.0 8.4 (8.4)Cash Equivalent 5.4 0.0 5.4
Total 100.0 100.0 0.0
CURRENT OUTLOOK
We believe that infrastructure-related issues will be prominent for manyyears to come due to a growth in population and urbanization that willnecessitate improvements to the existing global infrastructure. Under-investment in infrastructure assets in the past 20 to 30 years has resulted ina significant deterioration of the existing stock.
We are encouraged by the awareness of political leaders around the worldthat investments in infrastructure are needed to sustain economic growthand competitiveness. President Obama supports a significant increase in�32

Global MegaTrends Fund
infrastructure spending that, by some estimates, could total hundreds ofbillions of dollars.
In addition, growing recognition of the need for alternative energy sourceswill continue despite a recent decline in crude oil prices. The U.S. Senateoverwhelmingly approved tax credits for solar and wind power in late2008, and this will likely support continued investment in this sector.
Opportunities
• Market volatility allowed the fund to buy shares in some companies inthe infrastructure space that recently saw a price correction after astellar performance last year.
• Although the lower price of oil may change relative attractiveness ofwind and solar, we believe that investments in alternative energysources will gain traction due to a growing need for additional powerglobally.
• The privatization of Chicago Midway Airport in October 2008 illus-trates interest in quality infrastructure assets.
Threats
• While many countries remain committed to improving their infrastruc-ture, it remains to be seen how tighter credit conditions and the issue ofproperty rights impact some of the projects.
• Investors began to move to more defensive sectors at the beginning of2008 in expectation of weaker economic activity.
• Government support/subsidies are still required for a sustainable devel-opment of alternative energy and these can vary with changes in apolitical climate.
(1)This security comprised 1.36% of the fund’s total net assets as of December 31,2008.
(2)This security comprised 1.48% of the fund’s total net assets as of December 31,2008.
(3)This security comprised 1.18% of the fund’s total net assets as of December 31,2008.
(4)This security comprised 0.27% of the fund’s total net assets as of December 31,2008.
(5)This security comprised 1.47% of the fund’s total net assets as of December 31,2008.
(6)This security comprised 1.72% of the fund’s total net assets as of December 31,2008.
(7)This security comprised 1.00% of the fund’s total net assets as of December 31,2008.
(8)This security comprised 5.02% of the fund’s total net assets as of December 31,2008. �33

Global MegaTrends Fund
Top 10 Holdings Based on Total InvestmentsDecember 31, 2008
(excluding repurchase agreements)
FPL GROUP, INC. 5.03%ELECTRIC UTILITIES
CHINA MOBILE LTD. 4.84%WIRELESS TELECOMMUNICATIONS
BURLINGTON NORTHERN SANTA FE CORP. 4.47%TRANSPORTATION
GRUPO AEROPORTUARIO DEL SURESTE S.A.B. DE C.V. 3.73%AIRPORTS
EXELON CORP. 3.53%ELECTRIC UTILITIES
AT&T, INC. 3.23%TELECOMMUNICATIONS
FIRST SOLAR, INC. 3.13%ENERGY
FIRSTENERGY CORP. 2.87%ELECTRIC GENERATION
STANTEC, INC. 2.80%COMMERCIAL SERVICES
FLUOR CORP. 2.65%ENGINEERING/RESEARCH & DEVELOPMENT
TOTAL TOP TEN HOLDINGS 36.28%
Portfolio Profile December 31, 2008
Country Distribution* % of Investments
United States 52.97%
Brazil 10.84%
Canada 8.32%
Hong Kong 7.13%
Mexico 5.98%
People’s Republic of China 5.75%
Turkey 1.99%
Singapore 1.72%
Other Foreign 5.30%
* Country distribution shown is based on domicile and the locale of company operationsmay be different. Investments in companies that are economically tied to foreigncountries were 51% of total assets at December 31, 2008.�34

Management Team’s Perspective
Global Resources Fund
INTRODUCTIONThe Global Resources Fund (PSPFX) is a diversified natural resourcesfund with the principal objective of achieving long-term growth of capitalwhile providing protection against inflation and monetary instability. Thefund invests globally in companies involved in the exploration, production,transportation and processing of petroleum, natural gas, industrial com-modities, metals, minerals and forestry.PERFORMANCE GRAPH
Global Resources Fund
Average Annual Performance For the Periods EndedDecember 31, 2008
Six Month One Year Five Year Ten YearGlobal Resources Fund (67.70)% (62.13)% 4.70% 12.47%
S&P 500 Index (28.48)% (37.00)% (2.19)% (1.38)%
Morgan Stanley CommodityRelated Equity Index (46.70)% (41.21)% 10.09% 12.77%
S&P Energy and Materials Index (41.90)% (37.99)% 9.13% 8.18%Performance data quoted above is historical. Past performance is no guarantee of futureresults. Current performance may be higher or lower than the performance data quoted.Investment return and principal value of an investment will fluctuate so that an investor’sshares, when redeemed, may be worth more or less than their original cost. The graph andtable do not reflect the deduction of taxes that a shareholder would pay on fund distributionsor the redemption of fund shares.The S&P 500 Index is a widely recognized capitalization-weighted index of 500 common stockprices in U.S. companies. The Morgan Stanley Commodity Related Equity Index is an equal-dollar weighted index based on shares of widely held companies involved in commodity-related industries such as energy, non-ferrous metals, agriculture and forest products. In thefuture, this index will be used as the primary benchmark comparison for this fund as theAdviser believes it is more representative of the investments in the fund. The previousbenchmark was the S&P Energy and Materials Index. The S&P Energy and Materials Index isa combination of the S&P 500 Energy Index and the S&P 500 Materials Index calculated on a70% and 30% weighting, respectively, with monthly rebalancing of weights. The returns forthe indexes reflect no deduction for fees, expenses or taxes.The Adviser has agreed to limit the fund’s total operating expenses to 1.50% on an annualizedbasis through September 30, 2009; however, the limitation may be revised at any time by thefunds’ Board of Trustees.
Please visit our website at usfunds.com for updated performance informa-tion for different time periods. �35

Global Resources Fund
THE SIX-MONTH PERIOD IN REVIEW -ECONOMIC AND POLITICAL ISSUES THATAFFECTED THE FUND
The economy contracted significantly in the second half of the year asnegative fallout from overleveraged banks and speculative loans acceler-ated, causing severe dislocation in the international equity markets. TheStandard & Poor’s 500 Index declined 37 percent in 2008 (the last sixmonths had a 28 percent decline), with periods of extreme volatility thatwere on par with the Great Depression era of the 1930s.
Credit markets froze when investment banking giant Lehman Brothersfiled for bankruptcy in September. Mortgage underwriters Fannie Maeand Freddie Mac were nationalized by the federal government in order toavoid a complete financial collapse. As a result, credit spreads betweenbanks, corporations and sovereign nations ballooned, making it virtuallyimpossible to roll over or secure new loans.
Barack Obama won the 2008 presidential election and quickly respondedto rising unemployment and deteriorating economic fundamentals. Presi-dent Obama pledged to introduce a stimulus package that would createjobs and revitalize the economy.
The Russian army invaded the Republic of Georgia in an effort to regaininfluence in the Caucasus region. This invasion strained relations withNATO countries and threatened oil supplies that move through the BTCpipeline. Russian oil production declined in 2008, mainly due to resourcenationalism and declining foreign investment. It was Russia’s first outputshortfall in 13 years.
INVESTMENT HIGHLIGHTS
Overview
For the six-month period ended December 31, 2008, the Global ResourcesFund posted a negative return of 67.70 percent versus the fund’s bench-mark, the Morgan Stanley Commodity Related Equity Index (CRX),which declined by 46.70 percent. The S&P 500 Index saw a 28.48 percentdecline as volatility reached historic levels due to the global banking crisis.
The fund reduced its exposure to small and mid-sized oil and gas equitiesin response to the $100 per barrel decline in the price of crude oil and a 58percent reduction in the price of natural gas. The managers also reducedequity holdings with exposure to economically sensitive metals, such ascopper and aluminum, due to weakening global industrial production.Additionally, the fund lowered exposure to certain emerging market�36

Global Resources Fund
equities due to the strength of the U.S. dollar. As a result of increasedcommodity and equity market volatility, the fund’s portfolio turnoverincreased to 100 percent from 67 percent for the same period in the prioryear as the managers increased the average cash position, and the fre-quency of sub-sector rotations in accordance with our proprietary models.
INVESTMENT PROCESS
Our top-down analysis reviews global trends, including economic outlook,the current political and legislative environment, government policychanges, socioeconomic trends, supply and demand fundamentals, cur-rency effects and other similar items. We combine that with a bottom-upanalysis that emphasizes companies that we believe have prospects togenerate meaningful per-share growth in reserves, production and cashflow and high returns on capital.
The fund typically invests in equity derivatives, including warrants andexchange-traded options, to manage risk and volatility when the managersidentify opportunities to exploit the pricing of equity derivatives relativeto the underlying equity.
Strengths
• Fund performance benefited from exposure to gold and related miningequities. Holdings in Goldcorp, Inc.(1) and the SPDR Gold Trust(2)
outperformed the benchmark.
• The AMEX Oil Index(3) outperformed the S&P 500 Energy Index(4) by500 basis points in the period. Management’s decision to rotate intolarge-cap oil stocks aided fund performance as positions in Exxon MobilCorp.,(5) Chevron,(6) ConocoPhillips,(7) and BP plc(8) made positivecontributions.
• The late fourth quarter recovery in refining margins and the fund’scorresponding holdings in Valero Energy Corp.,(9) Tesoro Corp.(10) andSunoco, Inc.(11) made a meaningful contribution to the portfolio.
• The fund’s ability to employ defensive positions in inverse exchange-traded funds and covered call writing helped offset downside volatilityand added to performance in the period.
Weaknesses
• The price of crude oil and natural gas fell by an average of 63 percent inthe period to $44.60 a barrel and $5.60 per thousand cubic feet. Accord-ingly, the fund’s holdings in oil and gas exploration and productioncompanies adversely affected performance.
�37

Global Resources Fund
• In response to lower commodity prices, producers significantly reducedexploration and development budgets, which negatively impacted thefund’s holdings in oil service and equipment contractors. The Philadel-phia Oil Service Sector Index(12) declined nearly 66 percent in the lastsix months.
• The divergence between large-cap natural resource equities and juniorexploration companies weighed on performance during the period. TheS&P/TSX Venture Composite Index(13) fell 75 percent in U.S. dollarterms, which materially underperformed the fund’s large-cap bench-mark.
• The fund’s foreign holdings listed in Canada, Australia and LatinAmerica were particularly impaired by the strength of the trade-weighted U.S. dollar, which increased by 12 percent in the period.
• The Baltic Dry Freight Index(14) fell 92 percent as global trade seized inresponse to the credit crisis. Additionally, the price of coal was weak-ened by lower exports and soft utility demand, which resulted in a near80 percent drop in coal equities.
CURRENT OUTLOOK
Opportunities
• In response to the weakening global economy, the U.S., Europe andChina have committed more than $2 trillion in a synchronized effort tojump-start economic growth. Much of the stimulus is aimed at commod-ity intensive infrastructure projects.
• In an effort to support falling oil prices, OPEC agreed to cut productionby 2.2 million barrels a day. Since September, members of the oil cartelhave pledged cuts totaling 4.2 million barrels a day, or nearly 12 percentof their capacity.
• According to the International Energy Agency’s latest World EnergyOutlook report, $26.3 trillion of cumulative investment will be necessarythrough 2030 for energy supply infrastructure.
• President Obama promised to spend $150 billion over the next 10 yearsto develop alternative clean energy technologies. The InternationalEnergy Agency forecasts crude oil demand to rise from 87 millionbarrels a day to 94 million barrels by 2013, or 1.6 percent per annum.OPEC spare capacity is expected to fall to 2.2 percent over the sametime period.
�38

Global Resources Fund
Threats
• The International Monetary Fund expects developed economies tocontract by 0.3 percent in 2009 based on further deterioration in pro-ducer and consumer confidence and continued financial de-leveraging.
• An economic recovery could be at risk if the government is unable toput together a viable plan to clean up bad loans within the bankingsector in order to normalize credit markets and restart growth.
• According to the Energy Information Administration, U.S. oil demandis expected to grow only 1 million barrels per day, or 0.2 percent, overthe next two decades, as higher vehicle fuel standards and increased useof renewable fuels constrain petroleum consumption.
• The global financial and credit crises combined with a recession, haveexposed several emerging market countries to serious financial marketrisks that could further disrupt an economic recovery.
(1)This security comprised 3.17% of the total net assets of the fund as of December31, 2008.
(2)This security comprised 3.91% of the total net assets of the fund as of December31, 2008.
(3)The AMEX Oil Index (XOI) is a price weighted index designed to measure theperformance of the oil industry through changes in the prices of a cross sectionof widely-held corporations involved in the exploration, production, and devel-opment of petroleum.
(4)The S&P 500 Energy Index is a capitalization-weighted index that tracks thecompanies in the energy sector as a subset of the S&P 500.
(5)This security comprised 4.30% of the total net assets of the fund as of December31, 2008.
(6)The fund did not hold this security as of December 31, 2008. (7)This security comprised 2.34% of the total net assets of the fund as of December
31, 2008. (8)This security comprised 1.61% of the total net assets of the fund as of December
31, 2008. (9)This security comprised 0.89% of the total net assets of the fund as of December
31, 2008. (10)This security comprised 1.13% of the total net assets of the fund as of December
31, 2008. (11)This security comprised 1.22% of the total net assets of the fund as of December
31, 2008. (12)The Philadelphia Oil Service Sector Index is a price-weighted index composed of
15 companies that provide oil drilling and production services, oil field equip-ment, support services and geophysical/reservoir services.
(13)The S&P/TSX Venture Composite Index is a value-weighted index that tracksthe continuous price only performance of stocks traded in meaningful levels onthe Canadian Venture Exchange.
(14)The Baltic Dry Freight Index is an economic indicator that portrays an assessedprice of moving major raw materials by sea as compiled by the London-basedBaltic Exchange. �39

Global Resources Fund
Top 10 Holdings Based on Total InvestmentsDecember 31, 2008
(excluding repurchase agreements)
EXXON MOBIL CORP. 4.49%OIL & GAS - INTEGRATED
SPDR GOLD TRUST 4.09%EXCHANGE-TRADED FUND
CHINA SHENHUA ENERGY CO., LTD. 3.62%COAL
GOLDCORP, INC. 3.32%GOLD & SILVER MINING
PETROCHINA CO. LTD. 3.20%OIL & GAS - INTEGRATED
RANGE RESOURCES CORP. 2.82%OIL & GAS EXPLORATION & PRODUCTION - SENIOR
XTO ENERGY, INC. 2.58%OIL & GAS EXPLORATION & PRODUCTION - SENIOR
OCCIDENTAL PETROLEUM CORP. 2.50%OIL & GAS - INTEGRATED
CONOCOPHILLIPS 2.45%OIL & GAS - INTEGRATED
BHP BILLITON LTD. 2.41%GENERAL METAL & MINERAL MINING
TOTAL TOP TEN HOLDINGS 31.48%
Portfolio Profile December 31, 2008
Country Distribution* % of Investments
United States 61.94%
Canada 20.27%
People’s Republic of China 9.01%
Australia 2.77%
United Kingdom 1.96%
Other Foreign 4.05%
* Country distribution shown is based on domicile and is not intended to conform to theclassification of economic ties as described in the prospectus. Investments in companiesthat are economically tied to foreign countries were 40% of total assets at December 31,2008.�40

Global Resources Fund
Portfolio Allocation by Industry SectorBased on Total Investments
December 31, 2008
Energy:Oil & Gas Exploration & Production 24.5%Oil & Gas - Integrated (includes Refining and 22.0%
Marketing)Oil & Gas Drilling 3.9%Oil & Gas Equipment & Services 1.8%
Total Energy 52.2%Basic Materials:
Precious Metals (includes Gold/Silver Mining and 17.8%Platinum Group Metals)
Metals & Mining (includes Copper, Uranium and 12.9%Coal)
General Basic Materials 10.2%Total Basic Materials 40.9%Other Sectors 1.5%Cash Equivalent 5.4%
Total Investments 100.0%
�41

Management Team’s Perspective
Precious Metals and Minerals Funds
INTRODUCTIONThe World Precious Minerals Fund (UNWPX) and the Gold and PreciousMetals Fund (USERX) pursue an objective of long-term capital growththrough investments in gold and precious metals and minerals companies.The Gold and Precious Metals Fund also pursues current income as asecondary objective and focuses on established, gold-producing compa-nies. The World Precious Minerals Fund focuses on equity securities ofcompanies principally engaged in the exploration, mining and processingof precious minerals such as gold, silver, platinum, and diamonds.Although this fund has the latitude to invest in a broad range of preciousminerals, it currently remains focused on the gold sector.PERFORMANCE GRAPHS
World Precious Minerals Fund
Average Annual Performance For the Periods EndedDecember 31, 2008
Six Month One Year Five Year Ten YearWorld Precious Minerals Fund (51.23)% (52.96)% 3.09% 9.11%
S&P 500 Index (28.48)% (37.00)% (2.19)% (1.38)%
NYSE Arca Gold Miners Index* (30.55)% (26.79)% 4.00% 12.05%
AMEX Gold BUGS Index (32.49)% (25.63)% 5.33% 16.93%* These are not total returns. These returns reflect simple appreciation only and do not reflectdividend reinvestment.Performance data quoted above is historical. Past performance is no guarantee of futureresults. Current performance may be higher or lower than the performance data quoted.Investment return and principal value of an investment will fluctuate so that an investor’sshares, when redeemed, may be worth more or less than their original cost. The graph andtable do not reflect the deduction of taxes that a shareholder would pay on fund distributionsor the redemption of fund shares.The S&P 500 Index is a widely recognized capitalization-weighted index of 500 commonstock prices in U.S. companies. The NYSE Arca Gold Miners Index is a modified marketcapitalization-weighted index comprised of publicly-traded companies involved primarily inthe mining for gold and silver. In the future, this index will be used as the primary benchmarkcomparison for this fund as the Adviser believes it is more representative of the investments inthe fund. The previous benchmark was the AMEX Gold BUGS Index. The AMEX GoldBUGS Index is a modified equal-dollar weighted index of companies involved in major goldmining. The returns for the indexes reflect no deduction for fees, expenses or taxes.The Adviser has agreed to limit the fund’s total operating expenses to 1.50% on an annualizedbasis through September 30, 2009; however, the limitation may be revised at any time by thefunds’ Board of Trustees.�42

Precious Metals and Minerals Funds
Gold and Precious Metals Fund
Average Annual Performance For the Periods EndedDecember 31, 2008
Six Month One Year Five Year Ten Year
Gold and Precious Metals Fund (31.51)% (27.05)% 9.73% 13.85%
S&P 500 Index (28.48)% (37.00)% (2.19)% (1.38)%
FTSE Gold Mines Index* (24.91)% (19.88)% 5.37% 9.75%
Philadelphia Stock ExchangeGold & Silver Index (36.11)% (27.73)% 3.79% 8.23%
* These are not total returns. These returns reflect simple appreciation only and do not reflectdividend reinvestment.Performance data quoted above is historical. Past performance is no guarantee of futureresults. Current performance may be higher or lower than the performance data quoted.Investment return and principal value of an investment will fluctuate so that an investor’sshares, when redeemed, may be worth more or less than their original cost. The graph andtable do not reflect the deduction of taxes that a shareholder would pay on fund distributionsor the redemption of fund shares.The S&P 500 Index is a widely recognized capitalization-weighted index of 500 commonstock prices in U.S. companies. The FTSE Gold Mines Index encompasses all gold miningcompanies that have a sustainable and attributable gold production of at least 300,000 ouncesa year and that derive 75% or more of their revenue from mined gold. In the future, this indexwill be used as the primary benchmark comparison for this fund as the Adviser believes it ismore representative of the investments in the fund. The previous benchmark was the Philadel-phia Stock Exchange Gold & Silver Index. The Philadelphia Stock Exchange Gold & SilverIndex is a capitalization-weighted index which includes the leading companies involved in themining of gold and silver. The returns for the indexes reflect no deduction for fees, expenses ortaxes.The Adviser has agreed to limit the fund’s total operating expenses to 1.50% on an annualizedbasis through September 30, 2009; however, the limitation may be revised at any time by thefunds’ Board of Trustees.
Please visit our website at usfunds.com for updated performance informa-tion for different time periods. �43

Precious Metals and Minerals Funds
PERFORMANCE COMMENTARY
For the six-month period ending December 31, 2008, the Gold and Pre-cious Metals Fund declined 31.51 percent. The FTSE Gold Mines Indexfell 24.91 percent. The World Precious Minerals Fund posted a negativereturn of 51.23 percent. The NYSE Arca Gold Miners Index fell 30.55percent. Spot gold finished the period at $882.05, down $43.35, or 4.68percent. The S&P 500 Index also posted a negative return of 28.48 percent,the U.S. Trade Weighted Dollar Index(1) gained 12.21 percent and theyield on the Bloomberg Generic 90 Day Treasury Bill fell from 1.76percent to 0.03 percent.
As of October 1, 2008, both the Gold and Precious Metals Fund and theWorld Precious Minerals Fund adopted the FTSE Gold Mines Index andthe NYSE Arca Gold Miners Index as their new performancebenchmarks, respectively. The FTSE Gold Mines Index attempts toinclude all gold mining companies that produce at least 300,000 ounces ofgold per year and derive 75 percent or more of their revenue from minedgold. The NYSE Arca Gold Miners Index extends its scope beyond thesenior gold mining companies to pick up more of the mid-tier goldproducers, though it underrepresents the pure exploration and develop-ment stage companies.
The junior mining and exploration companies were still out of favor withinvestors due to the unraveling of credit markets. A good proxy for theperformance of exploration and development stage companies is the S&P/TSX Venture Composite Index,(2) which was down almost 75 percent inthe six-month period. As the chart below shows, the NYSE Arca GoldMiners Index began to rally in November but the S&P/TSX VentureComposite Index continued to languish. Corporate activity began to pickup in December with Agnico-Eagle Mines Ltd.(3) completing one of thefirst successful stock offerings. We expect to see more consolidation takeplace in the coming months, which may lift current valuations higher in theventure stage arena.
�44

Precious Metals and Minerals Funds
Relative Performance S&P/TSE Venture Composite Index(SPTSXVEN) vs. NYSE Arca Gold Miners Index (GDM)
Over Last Six Months Shows Venture Stage CompaniesLagging on the Recent Rally
Source: Bloomberg. Canadian index values converted to USD returns.
THE SIX-MONTH PERIOD IN REVIEW -ECONOMIC AND POLITICAL ISSUES THATAFFECTED THE FUND
Very few investable assets had positive returns over the last six months as amajor deleveraging took place to meet cash calls and settle up trades indollars. Despite the extraordinary efforts by central banks around theworld to shore up the economy, most investors found out what a hardlanding really feels like.
Investment demand for gold coins and bars was strong. Scarce AmericanEagle one-ounce coins sold at up to 50 percent premiums to spot marketprices. Gold refineries and mints in Switzerland, South Africa and Austra-lia commented that their production increased dramatically as theyworked to meet investor demand. India started a successful program forselling small denomination gold coins at post offices.
According to the World Gold Council, there was strong retail demand forgold bars and coins, but institutional sales totaled 300 tonnes just in theSeptember quarter amid a scramble for cash. As we closed out the yearwith higher gold prices, much of the jewelry buying was brought to astandstill in India and Dubai. Jewelers in Dubai commented that tradi-tional gold sales were off as much as 80 percent in the first two weeks ofDecember. Indian dealers reported buyers had stronger interest at the$765 level. �45

Precious Metals and Minerals Funds
INVESTMENT HIGHLIGHTS
Strengths
• As 2008 came to a close, there were signs of improvement in capitalmarkets for gold mining stocks.
• Consolidation activity increased and a number of gold mining compa-nies successfully raised capital and traded at higher levels. Approxi-mately $1 billion in deals were booked.
• The mantra of ‘‘sell at any price’’ gave way to the realization that goldstocks now have some of the most compelling valuations in years. Worldgold mine production has fallen for the past three years and centralbank selling of bullion has been greatly curtailed as their inventories areat record lows.
• Over the six months, our best results came from overweight positions inRandgold Resources Ltd.,(4) Kinross Gold Corp.,(5) Agnico-EagleMines Ltd.,(3) and puts purchased on the Philadelphia Stock ExchangeGold & Silver Index.(6)
Weaknesses
• The collapse of credit markets shut down the ability of junior miningand exploration companies to fund their growth, while rising energy andmaterial costs for most of the gold miners squeezed their profit margins.Thus share price performance for most of the gold mining companieswas dismal.
• Tax loss selling by Canadians was intense. Canadians can refile taxreturns to obtain tax refunds by using current-year losses to offset gainsbooked in the previous three years.
• Over the last six-months, the S&P/TSX Venture Composite Index (agood barometer for the price performance of exploration stage compa-nies) fell 75 percent.
• Our most unfavorable investments included Eastern Platinum Ltd.,(7)
Silver Wheaton Corp.,(8) and Yamana Gold, Inc.(9)
CURRENT OUTLOOK
Opportunities
• The latest United Nations economic study called the recent dollarstrength temporary and said that ‘‘the U.S. currency risks a hard landingin 2009.’’ The report recommends that international reserves diversifyout of the dollar toward a multi-currency system. Such a move to�46

Precious Metals and Minerals Funds
diversify could lead to a spillover into additional gold purchases sincecentral bank gold reserves are at more than a 50-year low.
• J.P. Morgan recently cited the complicated and expensive nature of goldmining as reason for the price of gold to increase another 20 percent tomake new investments economically feasible. One of the top SouthAfrican gold miners commented that it would need to see a gold price of$2,000 an ounce to replace its infrastructure.
Threats
• Wall Street analysts say that mining supply will be ‘‘tighter than ever’’ asa result of the financial crisis. Mining companies are expected to eitherdelay or cancel up to $50 billion in development projects next year dueto limited access to capital and the fall in metals prices.
• Deutsche Bank declared the commodities supercycle over because ofsliding oil prices that will have an adverse effect on gold and cause it tofall to around $650 per ounce.
• A senior economist at the Bank of Montreal supports this notion andexpressed the bank’s belief that the commodity boom is history and theentrance into a bear market is on the way. This comes after the Cana-dian dollar reached its lowest level over a one-year period.
• There is still uncertainty over how much farther the dollar will rise asliquidity demands appear unabated in the near-term.
(1)The U.S. Trade Weighted Dollar Index provides a general indication of theinternational value of the U.S. dollar.
(2)The S&P/TSX Venture Composite Index is a value-weighted index that tracks thecontinuous price only performance of stocks traded in meaningful levels on theCanadian Venture Exchange.
(3)This security comprised 5.88% of the total net assets of the World PreciousMinerals Fund and 6.73% of the total net assets of the Gold and Precious MetalsFund as of December 31, 2008.
(4)This security comprised 10.86% of the total net assets of the World PreciousMinerals Fund and 7.34% of the total net assets of the Gold and Precious MetalsFund as of December 31, 2008.
(5)This security comprised 5.76% of the total net assets of the World PreciousMinerals Fund and 8.31% of the total net assets of the Gold and Precious MetalsFund as of December 31, 2008.
(6)Neither the World Precious Minerals Fund nor the Gold and Precious MetalsFund held this security as of December 31, 2008.
(7)This security comprised 1.25% of the total net assets of the World PreciousMinerals Fund and 0.73% of the total net assets of the Gold and Precious MetalsFund as of December 31, 2008.
(8)This security comprised 2.51% of the total net assets of the World PreciousMinerals Fund and 0.83% of the total net assets of the Gold and Precious MetalsFund as of December 31, 2008.
�47

Precious Metals and Minerals Funds
(9)This security comprised 1.93% of the total net assets of the World PreciousMinerals Fund and 1.33% of the total net assets of the Gold and Precious MetalsFund as of December 31, 2008.
World Precious Minerals Fund
Top 10 Holdings Based on Total InvestmentsDecember 31, 2008
(excluding repurchase agreements)
GOLDCORP, INC. 11.17%SENIOR GOLD PRODUCERS
RANDGOLD RESOURCES LTD. 10.85%INTERMEDIATE & JUNIOR GOLD PRODUCERS
AGNICO-EAGLE MINES LTD. 5.87%SENIOR GOLD PRODUCERS
KINROSS GOLD CORP. 5.76%SENIOR GOLD PRODUCERS
JAGUAR MINING, INC. 3.36%INTERMEDIATE & JUNIOR GOLD PRODUCERS
RED BACK MINING, INC. 2.66%INTERMEDIATE & JUNIOR GOLD PRODUCERS
SILVER WHEATON CORP. 2.50%METAL & MINERAL MINING & EXPLORATION
NEWMONT MINING CORP. 2.44%SENIOR GOLD PRODUCERS
ROYAL GOLD, INC. 2.16%GOLD/MINERAL ROYALTY COMPANIES
IAMGOLD CORP. 2.08%INTERMEDIATE & JUNIOR GOLD PRODUCERS
TOTAL TOP TEN HOLDINGS 48.85%
�48

Precious Metals and Minerals Funds
Gold and Precious Metals Fund
Top 10 Holdings Based on Total InvestmentsDecember 31, 2008
(excluding repurchase agreements)
KINROSS GOLD CORP. 8.15%GOLD MINING
RANDGOLD RESOURCES LTD. 7.20%GOLD MINING
AGNICO-EAGLE MINES LTD. 6.60%GOLD MINING
GOLDCORP, INC. 5.65%GOLD MINING
BARRICK GOLD CORP. 5.19%GOLD MINING
NEWMONT MINING CORP. 4.71%GOLD MINING
ROYAL GOLD, INC. 4.22%GOLD ROYALTY COMPANY
GOLD FIELDS LTD. 4.19%GOLD MINING
SPDR GOLD TRUST 3.96%EXCHANGE-TRADED FUND
ANGLOGOLD ASHANTI LTD. 3.32%GOLD MINING
TOTAL TOP TEN HOLDINGS 53.19%
�49

Precious Metals and Minerals Funds
World Precious Minerals Fund
Portfolio Profile December 31, 2008
Country Distribution* % of Investments
Canada 60.38%
United States 14.85%
Jersey, Channel Islands 11.37%
Australia 5.57%
South Africa 4.06%
Other Foreign 3.77%
* Country distribution shown is based on domicile and is not intended to conform to theclassification of economic ties as described in the prospectus. Investments in companiesthat are economically tied to foreign countries were 88% of total assets at December 31,2008.
Gold and Precious Metals Fund
Portfolio Profile December 31, 2008
Country Distribution* % of Investments
Canada 43.22%
United States 27.23%
South Africa 10.91%
Jersey, Channel Islands 7.95%
Bermuda 2.60%
Australia 1.98%
Other Foreign 6.11%
* Country distribution shown is based on domicile and the locale of company operationsmay be different.
�50

Precious Metals and Minerals Funds
World Precious Minerals FundPortfolio Allocation by IndustryBased on Total Investments
December 31, 2008
Gold and Precious Metals FundPortfolio Allocation by IndustryBased on Total Investments
December 31, 2008
�51

Management Team’s Perspective
Eastern European Fund
INTRODUCTION
The investment objective of the Eastern European Fund (EUROX) is toachieve long-term capital growth by investing in a non-diversified port-folio of equity securities of companies located in the emerging markets ofEastern Europe.(1)
PERFORMANCE GRAPH
Eastern European Fund
Average Annual Performance For the Periods EndedDecember 31, 2008
Two Month One Year Five Year Ten YearEastern European Fund (19.37)% (69.20)% 3.11% 11.90%
S&P 500 Index (6.19)% (37.00)% (2.19)% (1.38)%
MSCI Emerging MarketsEurope 10/40 Index(Net Total Return) (16.15)% (66.83)% 4.81% 9.80%
Performance data quoted above is historical. Past performance is no guarantee of futureresults. Current performance may be higher or lower than the performance data quoted.Investment return and principal value of an investment will fluctuate so that an investor’sshares, when redeemed, may be worth more or less than their original cost. Foreign andemerging market investing involves special risks such as currency fluctuation and less publicdisclosure, as well as economic and political risk.The graph and table do not reflect the deduction of taxes that a shareholder would pay on funddistributions or the redemption of fund shares.The S&P 500 Index is a widely recognized capitalization-weighted index of 500 commonstock prices in U.S. companies. The MSCI Emerging Markets Europe 10/40 Index (Net TotalReturn) is a free float-adjusted market capitalization index that is designed to measure equityperformance in the emerging market countries of Europe (Czech Republic, Hungary, Poland,Russia, and Turkey). The index is calculated on a net return basis (i.e., reflects the minimumpossible dividend reinvestment after deduction of the maximum rate withholding tax). Theindex is periodically rebalanced relative to the constituents’ weights in the parent index. Thereturns for the indexes reflect no deduction for fees, expenses or taxes, except as noted above.The Adviser has agreed to limit the fund’s total operating expenses to 2.25% on an annualizedbasis through September 30, 2009; however, the limitation may be revised at any time by thefunds’ Board of Trustees.
Please visit our website at usfunds.com for updated performance informa-tion for different time periods.�52

Eastern European Fund
THE TWO-MONTH PERIOD IN REVIEW -ECONOMIC AND POLITICAL ISSUES THATAFFECTED THE FUND
The situation in Russia began to deteriorate in July 2008 when PrimeMinister Putin criticized steel and coal producer Mechel(2) for selling coalon the international market at a price lower than in Russia. The subse-quent Russian incursion into the Georgian territories of South Ossetia andAbkhazia gave investors an additional excuse to avoid the country. Asignificant weakening of the ruble gave investors another reason to shyaway from the Russian market despite compelling valuations.
The price of crude oil, from which Russia derives a significant portion of itsexport revenue, declined significantly in the second half of 2008. Thiscaused deterioration of market conditions in the country that spread toother sectors. Turkey, on the other hand, was a beneficiary of lower energyand materials prices, and this was reflected in the positive contribution tothe performance of the fund.
INVESTMENT HIGHLIGHTS
As the fund is focused on relatively few securities (typically it holds sharesin 30 to 40 companies), the performance of an individual holding can havea significant impact on overall fund performance.
The fund had a negative return of 19.37 percent for the two-month periodending December 31, 2008, compared to a total return of negative 6.19percent for the S&P 500 Index and negative 16.15 percent for the MSCIEmerging Markets Europe 10/40 (Net Total Return) Index, the fund’sbenchmark.
The fund’s portfolio allocation is driven by country and sector investmentthemes, combined with bottom-up stock selection criteria that is based onsales growth, return on common equity, free cash flow to equity, and priceto book ratio. The fund invests at least 25 percent of its total assets incompanies involved in the oil, gas or banking industries.
Russian equities comprised the largest component of the fund and werethe main reason for the underperformance compared to the MSCI indexfor the reasons discussed above. Fund holdings that underperformedtended to be concentrated in the energy and materials sectors, which werenegatively impacted by falling demand and prices. Fund holdings thatunderperformed during the two-month period under review includednatural gas producer Gazprom OAO(3) and fertilizer maker Uralkali.(4)
Russian telecom companies also underperformed, with Vimple-Communi-cations(5) leading the decline. �53

Eastern European Fund
Turkey, the second-largest country exposure in the fund, fared better.Turkish banks led the advance on mild inflation news and a stand-by loanguarantee by the International Monetary Fund. In the November-Decem-ber period, the best performer for the fund was the leasing companyFinans Finansal Kiralama a.s.,(6) followed by mobile phone operatorTurkcell Iletisim Hizmetleri a.s.(7) We continue to look for quality namesin the Turkish market, one of the most attractive in terms of valuations,but we remain vigilant about political risks in that country.
The Czech Republic, with the third-largest weighting in the fund, wasdown 2.1 percent in the two-month period. We have underweighted Hun-gary relative to the index base on a view that the country’s economy ispoised to slip into recession next year. Poland was another country thatwas relatively underweight in the fund.
The fund reduced its exposure to the real estate sector in anticipation ofcontinued lack of demand for commercial and residential properties. Wealso trimmed exposure to the financial sector in light of ruble depreciationand its impact on banks. We have added positions in the Russian steelsector in anticipation that it will be one of the early beneficiaries ofgovernment stimulus, rebounding export prices and lower-cost rawmaterials.
U.S. Global Investors restructured its relationship with subadviserCharlemagne Capital (IOM) Limited regarding the management of theEastern European Fund. U.S. Global assumed day-to-day management ofthe fund from Charlemagne Capital on November 7, 2008.
CURRENT OUTLOOK
The short-term outlook for Eastern Europe and other emerging markets ishard to predict with any degree of certainty. The world’s financial marketsare still in turmoil and economic activity is slowing around the globe.Governments are working to stabilize markets and economies, though theextent to which they will succeed is as yet unknown. The longer termoutlook, however, remains encouraging. Russia, the driving force of theregion, remains largely underdeveloped and has an enormous need forbetter housing, transport and other infrastructure. We expect demand forits massive natural resources to recover when global growth resumes. Andfrom Turkey to Kazakhstan, the desire of consumers to catch up with thelifestyles of their western counterparts remains as powerful as ever. Thesetrends give companies operating in the region every chance to growearnings and thus share price.
�54

Eastern European Fund
In addition, the current depressed state of world stock markets means thatvaluations, on both an historical and comparative basis, have rarely beenmore attractive. Most of the region’s stock markets are trading at less than10 times 2008 earnings, with some (notably Russia and Turkey) trading onless than five times 2008 earnings. In the past, such low valuations haveproved to be attractive entry points into markets. They more than discounteven the most gloomy of economic predictions over the year ahead. Thereis, therefore, reason to be optimistic over the longer term.
(1)The following countries are considered to be in the Eastern European region:Albania, Armenia, Azerbaijan, Belarus, Bulgaria, Croatia, Czech Republic, Esto-nia, FYR Macedonia, Georgia, Hungary, Latvia, Lithuania, Moldova, Poland,Romania, Russia, Slovakia, Slovenia, Turkey and Ukraine.
(2)The fund did not hold this security as of December 31, 2008. (3)This security comprised 9.13% of the fund’s total net assets as of December 31,
2008. (4)This security comprised 1.89% of the fund’s total net assets as of December 31,
2008. (5)This security comprised 4.69% of the fund’s total net assets as of December 31,
2008. (6)This security comprised 1.21% of the fund’s total net assets as of December 31,
2008. (7)This security comprised 4.23% of the fund’s total net assets as of December 31,
2008.
Country Distribution*Based on Total Investments
December 31, 2008
* Country distribution shown is based on domicile and the locale of companyoperations may be different.
�55

Eastern European Fund
Top 10 Holdings Based on Total InvestmentsDecember 31, 2008
(excluding repurchase agreements)
GAZPROM OAO 9.27%OIL & GAS - INTEGRATED
LUKOIL 7.72%OIL & GAS - INTEGRATED
SBERBANK RF 7.02%DIVERSIFIED BANKS
CEZ A.S. 6.79%ELECTRIC UTILITY
TURKIYE GARANTI BANKASI A.S. 6.13%DIVERSIFIED BANKS
KAZMUNAIGAS EXPLORATION PRODUCTION 5.75%OIL & GAS EXPLORATION & PRODUCTION
ROSNEFT OIL CO. OJSC 5.01%OIL & GAS - INTEGRATED
VIMPEL-COMMUNICATIONS 4.76%COMMUNICATIONS
OTP BANK NYRT. 4.67%DIVERSIFIED BANKS
TURKCELL ILETISIM HIZMETLERI A.S. 4.29%WIRELESS TELECOMMUNICATION SERVICES
TOTAL TOP TEN HOLDINGS 61.41%
Top 5 Industries Based on Total Investments December 31, 2008
Diversified Banks 26.20%Oil & Gas - Integrated 22.00%Oil & Gas Exploration & Production 12.18%Communications 8.57%Electric Utility 6.79%
�56

Management Team’s Perspective
Global Emerging Markets Fund
INTRODUCTION
The investment objective of the Global Emerging Markets Fund(GEMFX) is to achieve long-term capital growth by investing in a non-diversified portfolio of the equity securities of companies located in orwith a significant business presence in emerging countries.(1)
PERFORMANCE GRAPH
Global Emerging Markets Fund
Average Annual Performance For the Periods EndedDecember 31, 2008
Two Month One Year InceptionGlobal Emerging Markets Fund
(Inception 2/24/05) (9.59)% (68.02)% (7.95)%
S&P 500 Index (6.19)% (37.00)% (5.24)%
MSCI Emerging MarketsTotal Net Return Index (0.32)% (53.33)% 1.96%
Performance data quoted above is historical. Past performance is no guarantee of futureresults. Current performance may be higher or lower than the performance data quoted.Investment return and principal value of an investment will fluctuate so that an investor’sshares, when redeemed, may be worth more or less than their original cost. Foreign andemerging market investing involves special risks such as currency fluctuation and less publicdisclosure, as well as economic and political risk.The graph and table do not reflect the deduction of taxes that a shareholder would pay on funddistributions or the redemption of fund shares.The S&P 500 Index is a widely recognized capitalization-weighted index of 500 common stockprices in U.S. companies. The MSCI Emerging Markets Total Net Return Index is a free float-adjusted market capitalization index that is designed to measure equity market performance inemerging market countries on a net return basis (i.e., reflects the minimum possible dividendreinvestment after deduction of the maximum rate withholding tax). The returns for theindexes reflect no deduction for fees, expenses or taxes, except as noted above.The Adviser has agreed to limit the fund’s total operating expenses to 2.50% on an annualizedbasis through September 30, 2009; however, the limitation may be revised at any time by thefunds’ Board of Trustees.
Please visit our website at usfunds.com for updated performance informa-tion for different time periods. �57

Global Emerging Markets Fund
THE TWO-MONTH PERIOD IN REVIEW -ECONOMIC AND POLITICAL ISSUES THATAFFECTED THE FUND
When China began reporting its monthly macro economic figures, itbecame clear that the nation’s economy had slowed. Inflation (as meas-ured by the CPI) was the primary focus of the government for most of2008, but in the final months of the year, inflation concerns cooled off andthe government began to focus on growth by cutting interest rates andintroducing a massive RMB 4 trillion stimulus package that would focuson infrastructure building.
Hong Kong and South Korea are the largest and third-largest weightings inthe fund, and both officially entered recession. Hong Kong’s economy isclosely tied to that of China. In South Korea, the government proposed astimulus package to lessen the impact of the recession.
The situation in Russia began to deteriorate in July when Prime MinisterPutin criticized Mechel,(2) a steel and coal producer, for selling coal on theinternational market at a price lower than in Russia. The Russian incur-sion into the Georgian territories of South Ossetia and Abkhazia gaveinvestors an additional excuse to avoid the country, as did the weakeningof the ruble by 14 percent between October and December. The price ofcrude oil, from which Russia derives a significant portion of its exportrevenue, declined significantly during 2008, which caused deterioration ofmarket conditions in the country and spread to other sectors.
INVESTMENT HIGHLIGHTS
As the fund is focused on a relatively few securities (typically the fundholds shares in 60 to 80 companies), the performance of an individualholding can have a significant impact on the performance of the fund as awhole.
The fund had a negative return of 9.59 percent for the two-month periodending December 31, 2008, compared to a total return of negative 6.19percent for the S&P 500 Index and negative 0.32 percent for the MSCIEmerging Markets Total Net Return Index, the fund’s benchmark. Theunderperformance stems primarily from underweighting the energy sectorin the fund and overweighting the telecom and information technologysector during the period.
The fund’s portfolio allocation is driven by country and sector investmentthemes, combined with bottom up stock selection criteria that is based onsales growth, return on common equity, free cash flow to equity, and priceto book ratio.�58

Global Emerging Markets Fund
The bright spots were in China and Hong Kong, which had a combined 26percent weighting in the fund at December 31, 2008. In this market,Shenzhen International Holdings Ltd.(3) and China Grand Forestry GreenResources Group Ltd.(4) were two of the best performers, returning 31percent and 25 percent for the two-month period, respectively. ChinaMobile Ltd.,(5) which was the fund’s largest holding at December 31, 2008,returned 16 percent for the period. The fund also had a positive impactfrom South Africa, which accounted for 8 percent of the fund. AnglogoldAshanti Ltd.(6) was one of the best performers from this country.
South Korea was the third largest country weighting at December 31, 2008,at 11 percent. Samsung Electronics Co., Ltd.,(7) down 11 percent inNovember-December, was one of the weakest performers. The fund’sexposure to India, at 7 percent, was adversely impacted by a 40 percentprice decline in the IT provider Satyam Computer Services Ltd.(8)
The biggest price declines in the fund came in Russia, which accounted for9 percent of the allocation. The coal miner Raspadskaya(9) and the mobileoperator Vimpel-Communications(10) were the weakest performers, losingjust over 50 percent of their respective values in the two-month period.The sentiment was particularly bearish in Russia in the fourth quarter of2008 in light of lower commodities prices, political instability and theweakening ruble.
Brazil, which had an 8 percent weighting, was up 0.8 percent in November-December 2008. Positive momentum came from M&A activity in thebanking sector following an acquisition of Unibanco(11) by Banco Itau.(2)
This was followed by an acquisition of Banco Nossa Caixa S.A.,(2) whoseshares skyrocketed by 111 percent, by Banco do Brasil.(2) However, theperformance of the Brazilian bourse was uneven, with some commodity-related stocks declining due to lower commodities prices.
We adjusted our portfolio allocations during the period, increasing sectorweights in energy, power, and materials, and reducing the exposure totelecom.
U.S. Global Investors restructured its relationship with subadviserCharlemagne Capital (IOM) Limited regarding the management of theGlobal Emerging Markets Fund. U.S. Global assumed day-to-day man-agement of the fund on November 7, 2008.
CURRENT OUTLOOK
The short-term outlook for emerging markets remains especially difficultand is hard to predict with any degree of certainty. The world’s financialmarkets are still in turmoil and economic activity is slowing around the �59

Global Emerging Markets Fund
globe. Government attempts at stability are in progress, though the extentto which they will succeed is as yet unknown.
The longer term outlook, however, remains encouraging. The BRICnations — Brazil, Russia, India and China – are all still largely underdevel-oped and have enormous pent-up need for better housing, transport andother infrastructure. The demand for natural resources will likely recoverover time given the demand that remains in place across the region.Elsewhere, from Mexico to Malaysia, the desire on the part of consumersto catch up with the lifestyles of the West remains as powerful as ever, andit is in the interests of democratic governments to work toward fulfillingsuch desires. These trends give companies operating in emerging marketsa good chance of growing earnings significantly with a consequent impacton their share prices.
In addition, the current depressed state of world stock markets means thatvaluations, on both an historical and comparative basis, have rarely beenmore attractive. Many of the region’s stock markets are trading at less than10 times 2008 earnings, while Russia and Turkey are trading at less thanfive times 2008 earnings. In the past, such low valuations have proved to beattractive entry points into markets. They more than discount even thegloomiest of economic predictions over the year ahead. There is, there-fore, reason to be optimistic over the longer term.
(1)Emerging market countries are those countries defined as such by the WorldBank, the International Finance Corporation, the United Nations or the Euro-pean Bank for Reconstruction and Development or included in the MSCIEmerging Markets Index.
(2)The fund did not hold this security as of December 31, 2008. (3)This security comprised 1.53% of the fund’s total net assets as of December 31,
2008. (4)This security comprised 1.45% of the fund’s total net assets as of December 31,
2008. (5)This security comprised 6.73% of the fund’s total net assets as of December 31,
2008. (6)This security comprised 1.97% of the fund’s total net assets as of December 31,
2008. (7)This security comprised 5.58% of the fund’s total net assets as of December 31,
2008. (8)This security comprised 0.98% of the fund’s total net assets as of December 31,
2008. (9)This security comprised 0.48% of the fund’s total net assets as of December 31,
2008. (10)This security comprised 0.47% of the fund’s total net assets as of December 31,
2008. (11)This security comprised 2.01% of the fund’s total net assets as of December 31,
2008.
�60

Global Emerging Markets Fund
Country Distribution*Based on Total Investments
December 31, 2008
* Country distribution shown is based on domicile and the locale of companyoperations may be different.
�61

Global Emerging Markets Fund
Top 10 Holdings Based on Total InvestmentsDecember 31, 2008
(excluding repurchase agreements)
CHINA MOBILE LTD. 7.08%COMMUNICATIONS
SAMSUNG ELECTRONICS CO., LTD. 5.88%SEMICONDUCTORS
INDUSTRIAL AND COMMERCIAL BANK OF CHINA LTD. 4.55%DIVERSIFIED BANKS
AMERICA MOVIL SAB DE C.V. 3.91%COMMUNICATIONS
METAGE SPECIAL EMERGING MARKETS FUND LTD. 3.86%CLOSED-END FUND
KB FINANCIAL GROUP, INC. 3.23%DIVERSIFIED BANKS
SASOL LTD. 3.12%OIL & GAS - INTEGRATED
SHIMAO PROPERTY HOLDINGS LTD. 3.05%REAL ESTATE COMPANIES
GAZPROM OAO 2.50%OIL & GAS - INTEGRATED
SILICONWARE PRECISION INDUSTRIES CO. 2.41%SEMICONDUCTORS
TOTAL TOP TEN HOLDINGS 39.59%
Top 5 Industries Based on Total Investments December 31, 2008
Diversified Banks 18.52%Communications 14.98%Semiconductors 8.63%Oil & Gas - Integrated 8.00%Gold Mining 3.16%
�62

Management Team’s Perspective
China Region Fund
INTRODUCTION
The China Region Fund (USCOX) seeks capital appreciation by focusingon the economic growth in the greater China region, including China,Hong Kong, Singapore, Korea, Taiwan and other Asian countries.(1) Thefund emphasizes a long-term growth approach over current income.
PERFORMANCE GRAPH
China Region Fund
Average Annual Performance For the Periods EndedDecember 31, 2008
Six Month One Year Five Year Ten YearChina Region Fund (38.50)% (56.12)% 2.77% 7.17%
Hang Seng Composite Index (34.43)% (47.32)% 7.61% n/a
MSCI All Country Far East Freeex Japan Index* (40.48)% (51.96)% 2.07% 2.79%
* These are not total returns. These returns reflect simple appreciation only and do not reflectdividend reinvestment.Performance data quoted above is historical. Past performance is no guarantee of futureresults. Current performance may be higher or lower than the performance data quoted.Investment return and principal value of an investment will fluctuate so that an investor’sshares, when redeemed, may be worth more or less than their original cost. The graph andtable do not reflect the deduction of taxes that a shareholder would pay on fund distributionsor the redemption of fund shares.The Hang Seng Composite Index is a market-capitalization weighted index that comprises thetop 200 companies listed on the Stock Exchange of Hong Kong, based on average marketcapitalization for the twelve months. The index commenced January 2000; it is not included inthe graph as it had less than ten years of data. The MSCI All Country Far East Free ex JapanIndex is a free float-adjusted market capitalization-weighted index that is designed to measurethe equity market performance of the Far East, excluding Japan. The index consists of thefollowing developed and emerging market country indices: China, Hong Kong, Indonesia,Korea, Malaysia, New Zealand, Philippines, Singapore, Taiwan and Thailand. The returnsfor the indexes reflect no deduction for fees, expenses or taxes.The Adviser has agreed to limit the fund’s total operating expenses to 2.00% on an annualizedbasis through September 30, 2009; however, the limitation may be revised at any time by thefunds’ Board of Trustees.
Please visit our website at usfunds.com for updated performance informa-tion for different time periods. �63

China Region Fund
THE SIX-MONTH PERIOD IN REVIEW -ECONOMIC AND POLITICAL ISSUES THATAFFECTED THE FUND
China’s economy showed signs of significantly slowing down for the sixmonths ended December 31, 2008. Third quarter GDP was 9 percent,which was the first quarter in nearly three years that the growth rate wasless than 10 percent. Expectations are for even further weakness for thefourth quarter of 2008.
The Chinese government was quick to try to slow down a runawayeconomy, and it has moved just as quickly in response to the currentweakness. China has reduced interest rates five times to its current level of5.31 percent. It also reduced the required reserve ratio to 15.5 percent inorder to increase liquidity in the banking system.
Fixed asset investment (FAI) averaged 27 percent growth from Julythrough November (December figures not yet released), as the govern-ment intended for FAI to make up for export slowdowns. Exports aver-aged 13.9 percent growth over the six months, but became a drag on GDPgrowth in the last two months as exports fell in November and Decembercompared to a year earlier. Although a slowdown in exports was expected,the magnitude and speed of the decline was surprising. Another contribu-tor to China’s growth is domestic consumption — retail sales were fairlystable at 21.9 percent growth during the time period.
Despite moves to increase the liquidity within the financial markets,money supply as measured by M2(2) averaged 15.9 percent growth duringthe time period, in line with the government target of 16 percent. M1(2)
money supply growth averaged 9.9 percent, indicating that liquidity wasnot a major concern of individuals.
The performance of the various sectors in the Hang Seng Composite Index(HSCI), the fund’s benchmark, was all negative during the six months.Utilities, telecom and consumer goods declined the least, while materials,energy and services declined the most.
INVESTMENT HIGHLIGHTS
Overview
The fund returned a negative 38.50 percent for the six-month time period,compared to a negative 34.43 percent return for the HSCI.
The fund was defensively positioned with above average cash levels formuch of the time period, but upon China’s announcement of a massive�64

China Region Fund
stimulus program totaling 4 trillion RMB, interest in China-related stocksrose and the fund’s higher cash position contributed to performance belowits benchmark.
Strengths
• Companies doing business in China that were winners for the fundincluded Zijin Mining Group Co., Ltd.,(3) China Mobile Ltd.,(4) ChinaOverseas Land & Investment Ltd.(5) and China Resources Land Ltd.(6)
• The Chinese B-share markets performed the worst over the six months.The fund had no exposure in these stocks.
• Since South Korea did not perform well overall during the period, thefund benefited from being under-represented in this market comparedto the benchmark. The fund’s investment in this region, KT&G Corp.,(7)
a seller of tobacco products, performed relatively well.
Weaknesses
• The price volatility in the markets provided a very good trading environ-ment, but a bad one for investing. It is not clear that the environment forinvesting has improved.
• Financial stocks were another source of weakness over concerns aboutrising credit losses and a poor environment for lending in general. Whilethe fund was underweight in this sector relative to the benchmark, theexposure that the fund did have to financials was a source of negativereturn for the period. Stocks that the fund held that underperformedinclude Industrial & Commercial Bank of China Ltd.(8) and ChinaConstruction Bank Corp.(9)
�65

China Region Fund
Sector Weightings—China Region Fundand Hang Seng Composite Index
(% of Investments as of December 31, 2008)
Hang SengChina Region Composite Over
Fund Index (Under)% Weights % Weights % WeightSectors
Financial 26.8 47.6 (20.8)Industrials 21.5 11.6 9.9Oil & Resources 18.9 8.7 10.2Consumer 14.9 5.3 9.6Telecommunications 6.1 20.1 (14.0)Utilities 4.6 4.6 0.0Technology 4.5 2.1 2.4Cash Equivalent 2.7 0.0 2.7
Total 100.0 100.0 0.0
Country Weightings—China Region Fund(% of Investments as of December 31, 2008)
China RegionFund
% WeightsCountry*People’s Republic of China 54.4Hong Kong 37.0United States 3.1Korea, Republic of 1.7Other Foreign 3.8
Total 100.0
* Country distribution shown is based on domicile and not intended to conform to the China regiondefinition in the prospectus.
At the start of the time period, the fund was properly positioned by takinga defensive stance. Being underweight in energy and materials proved tobe the right move for most of the time period, until the announcement of avery large stimulus package by the Chinese government in mid-November,which proved to be beneficial to the materials sector.
Given the sharp sell-off in China stocks, valuations have become veryattractive. We are not expecting any more tightening policies and inflationshould continue to trend downward in 2009. China has the luxury of a�66

China Region Fund
large current account surplus as well as strong foreign exchange reserves.This will allow the country to invest its way out of the current growthslowdown.
The fund is actively managed, and holding period is not generally aconsideration in investment decisions. Its portfolio turnover is, and isexpected to continue to be, over 100 percent.
CURRENT OUTLOOK
Opportunities
• The primary focus in 2008 was inflation. Given the global slowdown,inflation should not be a problem in 2009 and the government can focuson resuscitating growth.
• Although China has cut interest rates five times in the fourth quarter of2008, its benchmark 1-year lending rate is still high relative to othercountries. Therefore, it has the opportunity to cut rates further.
Threats
• Anti-China rhetoric may heat up as the Obama administration takesover the White House and in light of larger Democratic majorities inCongress.
• Unemployment appears to be picking up, although this is not evident inthe ‘‘official’’ numbers. Social unrest could result from highunemployment.
(1)The China region is defined as any country that either shares a border with Chinaor is located in the South China Sea or the East China Sea and includes: thePeople’s Republic of China (PRC or China), Bangladesh, Hong Kong, India,Indonesia, Kazakhstan, Korea, Kyrgyzstan, Laos, Malaysia, Mongolia, Nepal,Pakistan, Philippines, Singapore, Taiwan, Tajikistan, Thailand, and Vietnam.
(2)M1 and M2 are measures of total money supplies. The M1 money supply includesonly checkable demand deposits. M2 includes everything in M1 and also savingsand other time deposits.
(3)This security comprised 3.20% of the fund’s total net assets as of December 31,2008.
(4)This security comprised 5.29% of the fund’s total net assets as of December 31,2008.
(5)This security comprised 4.40% of the fund’s total net assets as of December 31,2008.
(6)This security comprised 4.84% of the fund’s total net assets as of December 31,2008.
(7)This security comprised 1.63% of the fund’s total net assets as of December 31,2008.
(8)This security comprised 3.46% of the fund’s total net assets as of December 31,2008.
(9)The fund did not hold this security as of December 31, 2008. �67

China Region Fund
Top 10 Holdings Based on Total InvestmentsDecember 31, 2008
(excluding repurchase agreements)
CHINA MOBILE LTD. 5.64%CELLULAR TELECOMMUNICATIONS
CHEUNG KONG INFRASTRUCTURE HOLDINGS LTD. 5.24%CONSTRUCTION
CHINA RESOURCES LAND LTD. 5.16%REAL ESTATE COMPANIES
CHINA LIFE INSURANCE CO., LTD. 5.14%INSURANCE
CHINA COMMUNICATIONS CONSTRUCTION CO., LTD. 4.86%CONSTRUCTION
CHINA OVERSEAS LAND & INVESTMENT LTD. 4.73%REAL ESTATE COMPANIES
TENCENT HOLDINGS LTD. 4.52%INTERNET
HENGAN INTERNATIONAL GROUP CO., LTD. 4.48%HEALTH & PERSONAL CARE
INDUSTRIAL & COMMERCIAL BANK OF CHINA LTD. 3.69%BANKS
BANK OF COMMUNICATIONS CO., LTD. 3.64%BANKS
TOTAL TOP TEN HOLDINGS 47.10%
�68

Expense Example (unaudited) December 31, 2008
As a shareholder of the funds, you incur two types of costs: (1) transaction costs,including short-term trading fees and exchange fees; and (2) ongoing costs, includ-ing management fees and other fund expenses. This example is intended to help youunderstand your ongoing costs (in dollars) of investing in other mutual funds.
The example is based on an investment of $1,000 invested at the beginning of theperiod and held for the entire period as indicated below.
• Actual Expenses. The first line of the following table for each fund providesinformation about actual account values and actual expenses. You may use theinformation in this line, together with the amount you invested, to estimate theexpenses you paid over the period. Simply divide your account value by $1,000(for example, an $8,600 account value divided by $1,000 = 8.6), then multiply theresult by the number in the first line under the heading ‘‘Expenses Paid DuringPeriod’’ to estimate the expenses you paid on your account during this period.
• Hypothetical Example for Comparison Purposes. The second line of the follow-ing table for each fund provides information about hypothetical account valuesand hypothetical expenses based on the fund’s actual expense ratio and anassumed rate of return of 5 percent per year before expenses, which is not thefund’s actual return. The hypothetical account values and expenses may not beused to estimate the actual ending account balance or expenses you paid for theperiod. You may use this information to compare the ongoing costs of investing inthese funds and other funds. To do so, compare this 5 percent hypotheticalexample with the 5 percent hypothetical examples that appear in the shareholderreports of other funds.
Please note that the expenses shown in the table are meant to highlight yourongoing costs only and do not reflect any direct or transactional costs, such as smallaccount, exchange or short-term trading fees. Therefore, the second line of the tableis useful in comparing ongoing costs only, and will not help you determine therelative total costs of owning different funds. In addition, if these direct or transac-tional costs were included, your costs would have been higher.
�69

Expense Example (unaudited) December 31, 2008
Period Ended December 31, 2008 Beginning EndingAccount Value Account Value Expenses
July 1, December 31, Paid During2008 2008*** Period*/***
U.S. Treasury Securities Cash FundBased on Actual Fund Return $1,000.00 $1,002.30 $ 3.68Based on Hypothetical 5% Yearly Return $1,000.00 $1,021.53 $ 3.72U.S. Government Securities Savings FundBased on Actual Fund Return $1,000.00 $1,006.70 $ 2.38Based on Hypothetical 5% Yearly Return $1,000.00 $1,022.84 $ 2.40Near-Term Tax Free FundBased on Actual Fund Return $1,000.00 $1,025.50 $ 2.30Based on Hypothetical 5% Yearly Return $1,000.00 $1,022.94 $ 2.29Tax Free FundBased on Actual Fund Return $1,000.00 $1,002.20 $ 3.53Based on Hypothetical 5% Yearly Return $1,000.00 $1,021.68 $ 3.57All American Equity FundBased on Actual Fund Return $1,000.00 $ 635.80 $ 7.22Based on Hypothetical 5% Yearly Return $1,000.00 $1,016.38 $ 8.89Global Resources FundBased on Actual Fund Return $1,000.00 $ 323.00 $ 3.60Based on Hypothetical 5% Yearly Return $1,000.00 $1,019.76 $ 5.50World Precious Minerals FundBased on Actual Fund Return $1,000.00 $ 487.70 $ 4.69Based on Hypothetical 5% Yearly Return $1,000.00 $1,018.90 $ 6.36Gold and Precious Metals FundBased on Actual Fund Return $1,000.00 $ 684.90 $ 5.90Based on Hypothetical 5% Yearly Return $1,000.00 $1,018.20 $ 7.07China Region FundBased on Actual Fund Return $1,000.00 $ 615.00 $ 8.91Based on Hypothetical 5% Yearly Return $1,000.00 $1,014.17 $11.12
Period Ended December 31, 2008 Beginning EndingAccount Value Account Value ExpensesNovember 1, December 31, Paid During
2008 2008 Period**Holmes Growth FundBased on Actual Fund Return $1,000.00 $ 904.50 $2.79Based on Hypothetical 5% Yearly Return $1,000.00 $1,005.43 $2.93Global MegaTrends FundBased on Actual Fund Return $1,000.00 $ 952.60 $3.02Based on Hypothetical 5% Yearly Return $1,000.00 $1,005.26 $3.10Eastern European FundBased on Actual Fund Return $1,000.00 $ 807.60 $3.17Based on Hypothetical 5% Yearly Return $1,000.00 $1,004.85 $3.52Global Emerging Markets FundBased on Actual Fund Return $1,000.00 $ 904.10 $3.98Based on Hypothetical 5% Yearly Return $1,000.00 $1,004.18 $4.19
*These calculations are based on expenses incurred in the most recent fiscal half-year. Thefunds’ annualized expense ratios (after reimbursements and offsets) for the six-month periodended December 31, 2008, were 0.73%, 0.47%, 0.45%, 0.70%, 1.75%, 1.08%, 1.25%, 1.39%and 2.19%, respectively, for the U.S. Treasury Securities Cash, U.S. Government SecuritiesSavings, Near-Term Tax Free, Tax Free, All American Equity, Global Resources, WorldPrecious Minerals and Gold and Precious Metals and China Region Funds. The dollaramounts shown as ‘‘Expenses Paid’’ are equal to the annualized expense ratio multiplied bythe average account value over the period, multiplied by 184, the number of days in the mostrecent fiscal half-year, and then divided by 365 days.
�70

Expense Example (unaudited) December 31, 2008
**These calculations are based on expenses incurred in the most recent fiscal period. Thefunds’ annualized expense ratios (after reimbursements and offsets) for the two-month periodended December 31, 2008, were 1.75%, 1.85%, 2.10% and 2.50%, respectively, for the HolmesGrowth, Global MegaTrends, Eastern European and Global Emerging Markets Funds. Thedollar amounts shown as ‘‘Expenses Paid’’ are equal to the annualized expense ratiomultiplied by the average account value over the period, multiplied by 61, the number of daysin the most recent fiscal period, and then divided by 365 days.
***As detailed in the Notes to Financial Statements, there were several changes in agreementsand fees during the six-month period. Had the current fees and expense limitations been inplace throughout the entire six-month period, the values in the first table above would beshown as below. The values shown in the second table above would not be affected.
Period Ended December 31, 2008 Beginning EndingAccount Value Account Value Expenses
July 1, December 31, Paid During2008 2008 Period*
U.S. Treasury Securities Cash FundBased on Actual Fund Return $1,000.00 $1,002.30 $ 3.68Based on Hypothetical 5% Yearly Return $1,000.00 $1,021.53 $ 3.72U.S. Government Securities Savings FundBased on Actual Fund Return $1,000.00 $1,006.70 $ 2.38Based on Hypothetical 5% Yearly Return $1,000.00 $1,022.84 $ 2.40Near-Term Tax Free FundBased on Actual Fund Return $1,000.00 $1,025.50 $ 2.30Based on Hypothetical 5% Yearly Return $1,000.00 $1,022.94 $ 2.29Tax Free FundBased on Actual Fund Return $1,000.00 $1,002.20 $ 3.53Based on Hypothetical 5% Yearly Return $1,000.00 $1,021.68 $ 3.57All American Equity FundBased on Actual Fund Return $1,000.00 $ 635.80 $ 7.22Based on Hypothetical 5% Yearly Return $1,000.00 $1,016.38 $ 8.89Global Resources FundBased on Actual Fund Return $1,000.00 $ 320.88 $ 5.00Based on Hypothetical 5% Yearly Return $1,000.00 $1,017.64 $ 7.63World Precious Minerals FundBased on Actual Fund Return $1,000.00 $ 486.44 $ 5.62Based on Hypothetical 5% Yearly Return $1,000.00 $1,017.64 $ 7.63Gold and Precious Metals FundBased on Actual Fund Return $1,000.00 $ 684.35 $ 6.37Based on Hypothetical 5% Yearly Return $1,000.00 $1,017.64 $ 7.63China Region FundBased on Actual Fund Return $1,000.00 $ 615.96 $ 8.14Based on Hypothetical 5% Yearly Return $1,000.00 $1,015.12 $10.16
�71

U.S. TREASURY SECURITIES CASH FUND
Portfolio of Investments December 31, 2008
UNITED STATESGOVERNMENT Coupon Maturity PrincipalOBLIGATIONS 53.41% Rate Date Amount Value
United States Treasury Bills 53.41%Yield 0.10% 01/02/09 $ 5,000,000 $ 4,999,986Yield 0.41% 04/02/09 35,000,000 34,963,853Yield 1.03% 06/04/09 10,000,000 9,956,367Yield 1.28% 07/02/09 10,000,000 9,935,794Yield 0.29% 09/15/09 5,000,000 4,989,649
Total United States Government Obligations 64,845,649
(cost $64,845,649)
REPURCHASE AGREEMENTS 46.85%
Joint Tri-Party Repurchase Agreements,12/31/08, collateralized by U.S. Treasurysecurities held in joint tri-partyrepurchase accounts:
0.01% Morgan Stanley, repurchase price$6,000,003 0.01% 01/02/09 6,000,000 6,000,000
0.02% UBS Financial Services, Inc.,repurchase price $20,376,147 0.02% 01/02/09 20,376,124 20,376,124
0.03% Credit Suisse First Boston,repurchase price $30,500,051 0.03% 01/02/09 30,500,000 30,500,000
Total Repurchase Agreements 56,876,124
(cost $56,876,124)
Total Investments 100.26% 121,721,773
(cost $121,721,773)Other assets and liabilities, net (0.26)% (311,636)
NET ASSETS 100% $121,410,137
See notes to portfolios of investments and notes to financial statements.
�72

U.S. GOVERNMENT SECURITIES SAVINGS FUND
Portfolio of Investments December 31, 2008
UNITED STATESGOVERNMENT AND AGENCY Coupon Maturity PrincipalOBLIGATIONS 100.02% Rate Date Amount Value
Federal Farm Credit Bank 21.02%Discount Notes:
Yield 0.01% 01/02/09 $ 29,871,000 $ 29,870,993Yield 2.27% 01/08/09 7,087,000 7,083,899Yield 1.41% 06/19/09 3,905,000 3,879,335Yield 1.93% 09/14/09 5,000,000 4,932,444
Fixed Rates:3.88% 01/12/09 2,000,000 2,001,0185.01% 01/22/09 2,880,000 2,884,3054.75% 02/02/09 1,509,000 1,512,3905.13% 02/17/09 5,000,000 5,018,7285.08% 03/16/09 5,000,000 5,028,5032.75% 06/05/09 4,000,000 4,000,0004.13% 07/17/09 6,758,000 6,896,4715.25% 08/03/09 2,055,000 2,100,831
75,208,917
Federal Home Loan Bank 79.00%Discount Notes:
Yield 2.34% 01/02/09 24,970,000 24,968,390Yield 0.02% 01/05/09 14,378,000 14,377,969Yield 2.29% 01/08/09 5,000,000 4,997,793Yield 3.34% 01/09/09 6,387,000 6,382,302Yield 0.52% 01/12/09 17,593,000 17,590,235Yield 0.07% 01/13/09 8,372,000 8,371,805Yield 0.34% 01/14/09 38,960,000 38,955,276Yield 2.76% 01/16/09 5,000,000 4,994,333Yield 0.10% 01/20/09 1,185,000 1,184,937Yield 0.12% 01/23/09 10,000,000 9,999,267Yield 0.09% 01/27/09 4,764,000 4,763,705Yield 2.96% 02/02/09 8,660,000 8,637,470Yield 0.15% 02/03/09 4,460,000 4,459,387Yield 2.76% 02/11/09 10,000,000 9,969,022Yield 0.05% 02/12/09 20,027,000 20,025,832Yield 2.27% 03/02/09 2,075,000 2,067,219Yield 0.08% 03/11/09 7,496,000 7,494,851Yield 2.50% 03/17/09 5,000,000 4,974,271Yield 2.91% 05/01/09 8,000,000 7,923,833Yield 0.22% 05/11/09 552,000 551,561Yield 0.90% 07/01/09 8,039,000 8,002,884Yield 0.89% 09/08/09 1,428,000 1,419,273
Fixed Rates:2.15% 01/21/09 5,000,000 4,998,6132.16% 01/30/09 5,000,000 4,997,637
See notes to portfolios of investments and notes to financial statements.
�73

U.S. GOVERNMENT SECURITIES SAVINGS FUND
Portfolio of Investments December 31, 2008
UNITED STATESGOVERNMENT AND Coupon Maturity PrincipalAGENCY OBLIGATIONS Rate Date Amount Value
Federal Home Loan Bank (Cont’d)3.50% 02/13/09 $ 1,000,000 $ 1,001,2784.04% 03/09/09 1,000,000 1,002,8752.90% 03/24/09 5,000,000 5,018,0782.13% 04/01/09 5,680,000 5,677,1912.35% 04/21/09 3,000,000 3,000,0003.75% 04/27/09 5,000,000 5,012,2242.75% 05/07/09 3,000,000 3,000,0002.50% 05/28/09 4,000,000 3,997,1575.38% 07/17/09 2,900,000 2,953,797
Variable Rates:0.66% 02/18/09 10,000,000 10,000,0000.32% 02/19/09 10,000,000 9,994,4000.43% 04/08/09 10,000,000 10,000,000
282,764,865
Total Investments 100.02% 357,973,782
(cost $357,973,782)Other assets and liabilities, net (0.02)% (63,759)
NET ASSETS 100% $357,910,023
See notes to portfolios of investments and notes to financial statements.
�74

NEAR-TERM TAX FREE FUND
Portfolio of Investments December 31, 2008
Coupon Maturity PrincipalMUNICIPAL BONDS 90.74% Rate Date Amount Value
Alabama 7.18%Bessemer, Alabama Water Revenue 4.00% 01/01/16 $ 300,000 $ 248,151DCH Health Care Authority Facilities Revenue 5.00% 06/01/09 250,000 253,273Mountain Brook City Board of Education Capital
Outlay 4.00% 02/15/15 200,000 211,196University of Alabama at Birmingham, Hospital
Revenue, Series A 5.00% 09/01/15 300,000 292,098
1,004,718
Alaska 2.19%Alaska Municipal Bond Bank Authority, Series A 4.00% 02/01/16 300,000 306,108
Arizona 2.17%Pima County Unified School District, GO Unlimited,
Refunding 3.70% 07/01/12 300,000 304,218
California 1.68%San Diego, California Community College District,
Capital Appreciation, Election 2002, GOUnlimited (ZCB) 4.34%(1) 05/01/15 300,000 234,735
Connecticut 3.54%Connecticut State, Series D, GO Unlimited 5.38% 11/15/18 250,000 281,175Connecticut State, Series E, GO Unlimited 5.13% 11/15/14 200,000 213,476
494,651
District of Columbia 1.09%District of Columbia, Unrefunded, Series B 5.50% 06/01/09 150,000 152,183
Florida 2.75%Florida State Board of Education Capital Outlay,
Series B, GO 5.25% 06/01/11 175,000 176,381Florida State Department of Environmental
Protection Preservation Revenue, FloridaForever, Series B 5.00% 07/01/09 205,000 208,241
384,622
Illinois 7.11%Cook County, Illinois Capital Improvement, GO
Unlimited, Prerefunded, Series A 5.25% 11/15/14 300,000 314,241Illinois Finance Authority Revenue, Refunding 5.00% 07/01/16 390,000 424,623
See notes to portfolios of investments and notes to financial statements.
�75
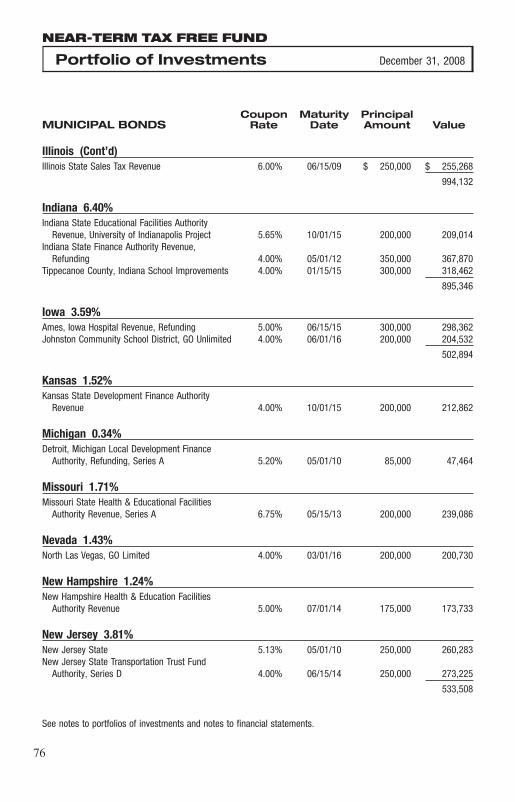
NEAR-TERM TAX FREE FUND
Portfolio of Investments December 31, 2008
Coupon Maturity PrincipalMUNICIPAL BONDS Rate Date Amount Value
Illinois (Cont’d)Illinois State Sales Tax Revenue 6.00% 06/15/09 $ 250,000 $ 255,268
994,132
Indiana 6.40%Indiana State Educational Facilities Authority
Revenue, University of Indianapolis Project 5.65% 10/01/15 200,000 209,014Indiana State Finance Authority Revenue,
Refunding 4.00% 05/01/12 350,000 367,870Tippecanoe County, Indiana School Improvements 4.00% 01/15/15 300,000 318,462
895,346
Iowa 3.59%Ames, Iowa Hospital Revenue, Refunding 5.00% 06/15/15 300,000 298,362Johnston Community School District, GO Unlimited 4.00% 06/01/16 200,000 204,532
502,894
Kansas 1.52%Kansas State Development Finance Authority
Revenue 4.00% 10/01/15 200,000 212,862
Michigan 0.34%Detroit, Michigan Local Development Finance
Authority, Refunding, Series A 5.20% 05/01/10 85,000 47,464
Missouri 1.71%Missouri State Health & Educational Facilities
Authority Revenue, Series A 6.75% 05/15/13 200,000 239,086
Nevada 1.43%North Las Vegas, GO Limited 4.00% 03/01/16 200,000 200,730
New Hampshire 1.24%New Hampshire Health & Education Facilities
Authority Revenue 5.00% 07/01/14 175,000 173,733
New Jersey 3.81%New Jersey State 5.13% 05/01/10 250,000 260,283New Jersey State Transportation Trust Fund
Authority, Series D 4.00% 06/15/14 250,000 273,225
533,508
See notes to portfolios of investments and notes to financial statements.
�76

NEAR-TERM TAX FREE FUND
Portfolio of Investments December 31, 2008
Coupon Maturity PrincipalMUNICIPAL BONDS Rate Date Amount Value
New York 4.46%New York, New York, Series B 5.25% 08/01/09 $ 200,000 $ 203,900New York, New York, Subseries L-1, GO Unlimited 4.00% 04/01/15 300,000 303,456Schenectady Metroplex Development Authority
Revenue, Series A 5.00% 12/15/12 110,000 116,606
623,962
Oregon 0.92%Oregon State Department of Transportation
Highway 5.00% 11/15/09 125,000 129,185
Pennsylvania 2.16%Pennsylvania State Turnpike Commission, Bond
Anticipation Notes, Series A 4.00% 10/15/09 300,000 301,626
South Carolina 6.64%Horry County Hospitality Fee Special Obligation 5.00% 04/01/10 200,000 206,140Jasper County School District, GO Unlimited 4.00% 03/01/15 195,000 206,439Piedmont Municipal Power Agency Electric
Revenue, Refunding, Series B 5.25% 01/01/09 200,000 200,000Spartanburg County School District 3.88% 04/01/12 300,000 315,606
928,185
Tennessee 2.29%Tennessee State, GO Unlimited, Refunding,
Series A 5.00% 05/01/11 300,000 320,361
Texas 12.42%Addison, Texas Certificates of Obligation, GO
Unlimited 4.00% 02/15/20 250,000 246,025Bexar County Hospital District, GO Limited 3.50% 02/15/10 300,000 306,735Conroe, Texas, GO Limited 2.75% 03/01/10 170,000 164,543Katy, Texas Independent School District, School
Building, Series D, GO Unlimited 4.50% 02/15/19 325,000 332,329Killeen, Texas Independent School District, GO
Unlimited, Unrefunded 5.00% 02/15/09 90,000 90,029Lewisville, Texas Independent School District, GO
Unlimited, Refunding (ZCB) 4.04%(1) 08/15/15 400,000 316,804San Antonio Water System Revenue 5.00% 05/15/13 100,000 105,194San Patricio, Texas Municipal Water District,
Refunded 4.00% 07/10/18 200,000 175,564
1,737,223
See notes to portfolios of investments and notes to financial statements.
�77

NEAR-TERM TAX FREE FUND
Portfolio of Investments December 31, 2008
Coupon Maturity PrincipalMUNICIPAL BONDS Rate Date Amount Value
Utah 2.37%Utah State, Refunding, Series B, GO Unlimited 5.38% 07/01/12 $ 300,000 $ 331,902
Virginia 4.76%Virginia College Building Authority Educational
Facilities Revenue, Prerefunded, Series A 5.00% 09/01/15 10,000 11,477Virginia College Building Authority Educational
Facilities Revenue, Unrefunded, Series A 5.00% 09/01/15 290,000 326,035Virginia State Public Building Authority & Public
Facilities Revenue, Refunding, Series A 5.00% 08/01/12 300,000 327,816
665,328
Washington 4.81%Clark County, Washington School District, GO
Unlimited 5.13% 12/01/11 100,000 108,209King County, Washington School District No. 401
Highline Public Schools, GO Unlimited 5.50% 12/01/13 240,000 262,601Seattle, Washington Municipal Light and Power
Revenue, Refunding 5.00% 07/01/17 300,000 302,424
673,234
Wisconsin 2.16%Wisconsin State, Refunding, Series 2, GO
Unlimited 4.13% 11/01/16 300,000 301,800
Total Municipal Bonds 12,693,796
(cost $12,536,792)
REPURCHASE AGREEMENT 8.36%
Joint Tri-Party Repurchase Agreement, MorganStanley, 12/31/08, 0.01%, due 01/02/09,repurchase price $1,170,076, collateralized byU.S. Treasury securities held in a joint tri-partyaccount (cost $1,170,075) 0.01% 01/02/09 1,170,075 1,170,075
Total Investments 99.10% 13,863,871
(cost $13,706,867)Other assets and liabilities, net 0.90% 125,267
NET ASSETS 100% $13,989,138
(1)Represents Yield
See notes to portfolios of investments and notes to financial statements.
�78

TAX FREE FUND
Portfolio of Investments December 31, 2008
Coupon Maturity PrincipalMUNICIPAL BONDS 96.75% Rate Date Amount Value
Alabama 7.55%Alabama 21st Century Authority, Tobacco
Settlement Revenue 5.75% 12/01/19 $ 275,000 $ 240,149Alabama State, GO Unlimited, Series A 4.63% 09/01/22 375,000 375,338Bessemer, Alabama Water Revenue 4.00% 01/01/16 200,000 165,434Mountain Brook City Board of Education Capital
Outlay 4.00% 02/15/15 195,000 205,916University of Alabama at Birmingham, Hospital
Revenue, Series A 5.00% 09/01/15 300,000 292,098
1,278,935
California 7.76%Anaheim, California City School District, Capital
Appreciation, Election 2002, GO Unlimited (ZCB) 4.60%(1) 08/01/28 580,000 154,663California State, GO Unlimited 4.75% 03/01/34 205,000 169,105California State, GO Unlimited 5.00% 06/01/37 455,000 387,278Campbell, California Union High School District,
GO Unlimited 4.75% 08/01/34 300,000 252,354San Diego, California Community College District,
Capital Appreciation, Election 2002, GOUnlimited (ZCB) 4.34%(1) 05/01/15 450,000 352,103
1,315,503
Colorado 0.82%Colorado Health Facilities Authority Revenue 5.00% 09/01/16 150,000 138,527
Connecticut 1.89%Connecticut State, Series E, GO Unlimited 5.13% 11/15/14 300,000 320,214
Florida 4.23%Florida Board of Education, GO Unlimited,
Refunding, Series C 4.50% 06/01/28 300,000 257,991St. Lucie County Florida Sales Tax Revenue 5.25% 10/01/23 465,000 459,327
717,318
Georgia 2.93%Atlanta Development Authority Revenue 5.25% 07/01/22 500,000 496,185
Illinois 7.78%Du Page County, Refunding 5.60% 01/01/21 490,000 560,510Illinois Development Financing Authority Hospital
Revenue, Adventist Health System 5.65% 11/15/24 435,000 456,937
See notes to portfolios of investments and notes to financial statements.
�79

TAX FREE FUND
Portfolio of Investments December 31, 2008
Coupon Maturity PrincipalMUNICIPAL BONDS Rate Date Amount Value
Illinois (Cont’d)Illinois Regional Transportation Authority Revenue,
Series A 7.20% 11/01/20 $ 250,000 $ 301,313
1,318,760
Indiana 1.60%Indianapolis Local Public Improvement Bond Bank,
Waterworks Project, Series 2007 L 5.25% 01/01/33 305,000 271,926
Kansas 8.26%Kansas State Development Finance Authority
Hospital Revenue, Series Z 5.00% 12/15/12 500,000 497,165Kansas State Development Finance Authority
Revenue 4.00% 10/01/15 250,000 266,078University of Kansas Hospital Authority Health
Facilities Revenue 5.63% 09/01/12 570,000 634,956
1,398,199
Kentucky 1.33%Bowling Green, Kentucky, GO Unlimited, Series B 4.00% 09/01/16 215,000 225,840
Maryland 1.92%Maryland Health & Higher Educational Facilities
Authority Revenue 5.75% 07/01/21 300,000 325,704
Michigan 2.64%Detroit, Michigan Local Development Financing
Authority, Refunding, Series A 5.38% 05/01/18 300,000 150,348Macomb County Building Authority, GO Limited 4.50% 11/01/23 300,000 296,784
447,132
Missouri 2.47%St. Louis Airport Development Program,
Prerefunded, Series A 5.00% 07/01/11 165,000 178,241St. Louis Airport Development Program,
Unrefunded, Series A 5.00% 07/01/11 235,000 241,124
419,365
New Hampshire 2.98%Manchester, New Hampshire School Facilities
Revenue, Refunding 5.50% 06/01/26 300,000 325,683
See notes to portfolios of investments and notes to financial statements.
�80

TAX FREE FUND
Portfolio of Investments December 31, 2008
Coupon Maturity PrincipalMUNICIPAL BONDS Rate Date Amount Value
New Hampshire (Cont’d)New Hampshire Health & Education Facilities
Authority Revenue 5.00% 07/01/14 $ 180,000 $ 178,697
504,380
New Jersey 2.66%New Jersey Health Care Facilities Financing
Authority Revenue 4.38% 07/01/10 460,000 451,232
New York 1.51%New York, GO Unlimited, Prerefunded, Series J 5.00% 05/15/12 225,000 230,699New York, GO Unlimited, Unrefunded Balance,
Series J 5.00% 05/15/12 25,000 25,629
256,328
Ohio 2.79%Ohio State Mental Health Facilities Revenue 5.50% 06/01/15 300,000 327,168South Euclid Special Assessment, GO Limited Tax 6.70% 12/01/14 130,000 145,920
473,088
Rhode Island 3.41%Rhode Island State Health & Educational Building
Corporation Revenue 6.50% 08/15/32 500,000 577,749
South Carolina 1.23%South Carolina Jobs Economic Development
Authority Revenue 5.00% 11/01/23 250,000 208,938
Tennessee 1.28%Memphis, Tennessee Sanitary Sewage System
Revenue, Refunding 5.00% 05/01/20 200,000 216,726
Texas 22.91%Baytown, Texas, GO Limited 4.50% 02/01/27 250,000 224,183Dallas, Texas Waterworks & Sewer Systems
Revenue, Refunding 4.50% 10/01/19 225,000 230,378Duncanville, Texas Independent School District,
GO Unlimited, Prerefunded, Series B 5.25% 02/15/32 495,000 547,025Duncanville, Texas Independent School District,
GO Unlimited, Unrefunded, Series B 5.25% 02/15/32 5,000 5,005Forney, Texas, GO Limited 5.00% 02/15/27 500,000 498,205
See notes to portfolios of investments and notes to financial statements.
�81

TAX FREE FUND
Portfolio of Investments December 31, 2008
Coupon Maturity PrincipalMUNICIPAL BONDS Rate Date Amount Value
Texas (Cont’d)Goose Creek, Texas Independent School District
Schoolhouse, Series A 5.25% 02/15/18 $ 370,000 $ 407,392Greenville, Texas Independent School District, GO
Unlimited, Refunding 4.00% 08/15/17 120,000 122,684Houston Community College System Revenue,
Refunding 4.00% 04/15/17 300,000 299,775North Texas Municipal Water District Regional
Solid Waste Disposal System Revenue 4.25% 09/01/17 385,000 394,852North Texas Tollway Authority Revenue, Series F 5.75% 01/01/38 250,000 208,533Prosper, Texas Independent School District,
Capital Appreciation, School Building, GOUnlimited (ZCB) 6.00%(1) 08/15/33 1,000,000 223,630
San Marcos, Texas Tax & Toll Revenue, GOLimited 5.10% 08/15/27 400,000 401,916
White Settlement, Texas Independent SchoolDistrict, GO Unlimited 4.13% 08/15/15 300,000 319,161
3,882,739
Utah 3.35%Utah State Building Ownership Authority, Lease
Revenue, Refunded, Series C 5.50% 05/15/19 500,000 567,719
Washington 3.45%King County, Washington School District No. 401
Highline Public Schools, GO Unlimited 5.50% 12/01/13 300,000 328,251Spokane County School District No. 81 Spokane 5.05% 06/01/22 255,000 255,678
583,929
Total Municipal Bonds 16,396,436
(cost $16,616,634)
See notes to portfolios of investments and notes to financial statements.
�82

TAX FREE FUND
Portfolio of Investments December 31, 2008
REPURCHASE Coupon Maturity PrincipalAGREEMENT 2.06% Rate Date Amount Value
Joint Tri-Party Repurchase Agreement, MorganStanley, 12/31/08, 0.01%, due 01/02/09,repurchase price $348,497, collateralized byU.S. Treasury securities held in a joint tri-partyaccount (cost $348,497) 0.01% 01/2/2009 $ 348,497 $ 348,497
Total Investments 98.81% 16,744,933
(cost $16,965,131)Other assets and liabilities, net 1.19% 201,099
NET ASSETS 100% $16,946,032
(1)Represents Yield.
See notes to portfolios of investments and notes to financial statements.
�83

ALL AMERICAN EQUITY FUND
Portfolio of Investments December 31, 2008
COMMON STOCKS 79.40% Shares Value
Applications Software 2.06%Activision Blizzard, Inc. 25,000 $ 216,000*Citrix Systems, Inc. 5,000 117,850*
333,850
Cellular Telecommunications 1.57%China Mobile Ltd., Sponsored ADR 5,000 254,250
Chemicals 0.56%The Dow Chemical Co. 6,000 90,540
Computers 2.10%Apple, Inc. 4,000 341,400*
Diversified Minerals 1.86%Compania Vale do Rio Doce, Sponsored ADR 25,000 302,750
Electric Generation 1.80%Huaneng Power International, Inc., Sponsored ADR 10,000 291,800
Electronics & Components 0.99%NVIDIA Corp. 20,000 161,400*
Energy 1.27%First Solar, Inc. 1,500 206,940*
Financial Services 10.92%First Financial Bankshares, Inc. 12,500 690,125Ocwen Financial Corp. 40,000 367,200*People’s United Financial, Inc. 10,000 178,300U.S. Bancorp 12,000 300,120Wells Fargo & Co. 8,000 235,840
1,771,585
Gas - Distribution 3.41%New Jersey Resources Corp. 6,000 236,100Piedmont Natural Gas Co. 10,000 316,700
552,800
Insurance 0.72%Stewart Information Services Corp. 5,000 117,450
See notes to portfolios of investments and notes to financial statements.
�84

ALL AMERICAN EQUITY FUND
Portfolio of Investments December 31, 2008
COMMON STOCKS Shares Value
Internet 1.80%F5 Networks, Inc. 12,500 $ 285,750*Stockhouse, Inc. 131,125 7,212*
292,962
Machinery 1.07%The Manitowoc Co., Inc. 20,000 173,200
Medical - Biomedical 4.69%Celgene Corp. 4,000 221,120*Illumina, Inc. 11,000 286,550*Sequenom, Inc. 8,000 158,720*United Therapeutics Corp. 1,500 93,825*
760,215
Medical - Drugs 2.87%Novartis AG, ADR 4,000 199,040Pfizer, Inc. 15,000 265,650
464,690
Medical - HMO 2.29%UnitedHealth Group, Inc. 14,000 372,400
Medical - Products 5.33%Johnson & Johnson 8,000 478,640Quality Systems, Inc. 5,000 218,100ResMed, Inc. 4,500 168,660*
865,400
Office Supplies 0.55%Office Depot, Inc. 30,000 89,400*
Oil & Gas - Integrated 4.50%Chevron Corp. 2,500 184,925CNOOC Ltd. 2,000 190,480PetroChina Co. Ltd., ADR 4,000 355,920
731,325
Oil & Gas Equipment & Services 0.83%Weatherford International Ltd. 12,500 135,250*
See notes to portfolios of investments and notes to financial statements.
�85

ALL AMERICAN EQUITY FUND
Portfolio of Investments December 31, 2008
COMMON STOCKS Shares Value
Oil & Gas Exploration & Production 4.44%Anadarko Petroleum Corp. 9,000 $ 346,950Goodrich Petroleum Corp. 5,000 149,750*Linn Energy LLC 15,000 224,550
721,250
Oil & Gas Field Services 0.78%Schlumberger Ltd. 3,000 126,990*
Oil & Gas Royalty Trust 0.84%Permian Basin Royalty Trust 10,000 137,000*
Restaurants 2.30%McDonald’s Corp. 6,000 373,140
Retail 2.65%Lowe’s Cos, Inc. 20,000 430,400
Retail - Discount 1.20%Family Dollar Stores, Inc. 7,500 195,525
Silver Mining 3.05%Pan American Silver Corp. 15,000 256,050*Silver Standard Resources, Inc. 15,000 239,100*
495,150
Software Tools 2.92%VMware, Inc., Class A 20,000 473,800*
Telecommunications 1.99%QUALCOMM, Inc. 9,000 322,470
Therapeutics 2.84%Gilead Sciences, Inc. 9,000 460,260*
Tobacco 2.14%Philip Morris International, Inc. 8,000 348,080
See notes to portfolios of investments and notes to financial statements.
�86

ALL AMERICAN EQUITY FUND
Portfolio of Investments December 31, 2008
COMMON STOCKS Shares Value
Transportation 2.49%Atlas Air Worldwide Holdings, Inc. 8,000 $ 151,200*Nordic American Tanker Shipping 7,500 253,125
404,325
Water 0.57%California Water Service Group 2,000 92,860
Total Common Stocks 12,890,857
(cost $13,583,122)
REAL ESTATE INVESTMENT TRUSTS (REIT) 9.34%
Boston Properties, Inc. 4,500 247,500Hatteras Financial Corp. 20,000 532,000SL Green Realty Corp. 7,500 194,250Vornado Realty Trust 9,000 543,150
Total Real Estate Investment Trusts 1,516,900
(cost $1,386,531)
EXCHANGE-TRADED FUNDS (ETF) 2.18%
SPDR Gold Trust 2,000 173,100*SPDR KBW Insurance ETF 6,500 179,465
Total Exchange-Traded Funds 352,565
(cost $339,651)
PURCHASED OPTION 0.00% Contracts
Internet 0.00%Yahoo!, Inc., Strike Price 25, Call, Expiration Jan. 2009 200 600*
(premium $16,800)
See notes to portfolios of investments and notes to financial statements.
�87

ALL AMERICAN EQUITY FUND
Portfolio of Investments December 31, 2008
MASTER LIMITED PARTNERSHIP 1.28% Units Value
Financial Services 1.28%AllianceBernstein Holding LP 10,000 $ 207,900
(cost $218,389)
Total Securities 14,968,822
(cost $15,544,493)
PrincipalREPURCHASE AGREEMENT 3.53% Amount
Joint Tri-Party Repurchase Agreement, UBS Financial Services, Inc.,12/31/08, 0.02%, due 01/02/09, repurchase price $572,528,collateralized by U.S. Treasury securities held in a joint tri-partyaccount (cost $572,527) $ 572,527 572,527
Total Investments 95.73% 15,541,349
(cost $16,117,020)Other assets and liabilities, net 4.27% 692,997
NET ASSETS 100% $16,234,346
See notes to portfolios of investments and notes to financial statements.
�88

HOLMES GROWTH FUND
Portfolio of Investments December 31, 2008
COMMON STOCKS 85.80% Shares Value
Apparel 2.16%The Buckle, Inc. 15,000 $ 327,300True Religion Apparel, Inc. 30,000 373,200*
700,500
Banks 0.90%Bancolombia S.A., Sponsored ADR 12,500 291,875
Cable & Wire Products 0.95%General Cable Corp. 17,500 309,575*
Cellular Telecommunications 0.94%China Mobile Ltd., Sponsored ADR 6,000 305,100
Coal 1.05%Peabody Energy Corp. 15,000 341,250
Communications 1.75%AT&T, Inc. 20,000 570,000
Computer Software & Hardware 2.05%Oracle Corp. 37,500 664,875*
Cosmetics/Personal Care 1.48%Avon Products, Inc. 20,000 480,600
Diversified Minerals 1.86%Compania Vale do Rio Doce, ADR 50,000 605,500
Diversified Operations 1.71%Team, Inc. 20,000 554,000*
E-Commerce 0.92%CYBERplex, Inc. 1,073,000 299,819*
Electronics & Components 2.45%Altera Corp. 20,000 334,200FLIR Systems, Inc. 15,000 460,200*
794,400
See notes to portfolios of investments and notes to financial statements.
�89

HOLMES GROWTH FUND
Portfolio of Investments December 31, 2008
COMMON STOCKS Shares Value
Energy 2.34%First Solar, Inc. 5,500 $ 758,780*
Engineering & Construction 0.83%Fluor Corp. 6,000 269,220
Entertainment 2.13%Activision Blizzard, Inc. 80,000 691,200*
Financial Services 9.37%Charles Schwab Corp. 20,000 323,400Citigroup, Inc. 25,000 167,750GMP Capital Trust 63,800 265,833Jovian Capital Corp. 685,000 140,738*JPMorgan Chase & Co. 8,000 252,240Northern Trust Corp. 3,000 156,420Stifel Financial Corp. 20,000 917,000*The Goldman Sachs Group, Inc. 4,500 379,755U.S. Bancorp 7,000 175,070Wells Fargo & Co. 9,000 265,320
3,043,526
Food Products 1.13%CoolBrands International, Inc. 995,200 368,048*
Gold & Copper Exploration and Development 0.02%New Gold, Inc. 4,338 6,310*
Healthcare Services 4.43%Almost Family, Inc. 16,000 719,680*LHC Group, Inc. 20,000 720,000*
1,439,680
Medical - Biomedical 8.01%Celgene Corp. 6,000 331,680*Cubist Pharmaceuticals, Inc. 40,000 966,400*Emergent Biosolutions, Inc. 20,000 522,200*Illumina, Inc. 30,000 781,500*
2,601,780
Medical - HMO 2.30%Humana, Inc. 20,000 745,600*
See notes to portfolios of investments and notes to financial statements.
�90

HOLMES GROWTH FUND
Portfolio of Investments December 31, 2008
COMMON STOCKS Shares Value
Medical - Products 10.03%Alcon, Inc. 5,000 $ 445,950Baxter International, Inc. 21,000 1,125,390Bristol-Myers Squibb Co. 42,500 988,125Varian Medical Systems, Inc. 20,000 700,800*
3,260,265
Metal & Mineral Mining 0.09%Eastern Platinum Ltd. 108,800 29,954*
Oil & Gas - Integrated 2.21%Exxon Mobil Corp. 9,000 718,470
Oil & Gas Drilling 1.68%Helmerich & Payne, Inc. 24,000 546,000
Oil & Gas Exploration & Production 0.91%Noble Energy, Inc. 6,000 295,320
Oil & Gas Field Machinery 2.13%Cameron International Corp. 20,000 410,000*Weatherford International Ltd. 26,000 281,320*
691,320
Oil & Gas Royalty Trusts 1.79%Canadian Oil Sands Trust 5,000 86,703San Juan Basin Royalty Trust 16,000 495,520
582,223
Pharmaceuticals 3.72%Pfizer, Inc. 40,000 708,400United Therapeutics Corp. 8,000 500,400*
1,208,800
Restaurants 0.95%Chipotle Mexican Grill, Inc., Class A 5,000 309,900*
Retail 5.79%EZCORP, Inc., Class A 60,000 912,600*PetMed Express, Inc. 55,000 969,650*
1,882,250
See notes to portfolios of investments and notes to financial statements.
�91

HOLMES GROWTH FUND
Portfolio of Investments December 31, 2008
COMMON STOCKS Shares Value
Schools 6.80%ITT Educational Services, Inc. 12,000 $ 1,139,760*Strayer Education, Inc. 5,000 1,072,050
2,211,810
Steel 0.92%United States Steel 8,000 297,600
Total Common Stocks 27,875,550
(cost $34,198,564)
REAL ESTATE INVESTMENT TRUST (REIT) 1.49%
Vornado Realty Trust (cost $622,446) 8,000 482,800
EXCHANGE-TRADED FUNDS (ETF) 2.80%
SPDR Gold Trust 4,000 346,200*SPDR KBW Insurance ETF 12,500 345,125SPDR KBW Regional Banking ETF 7,500 218,700
Total Exchange-Traded Funds 910,025
(cost $944,832)
WARRANTS 0.30%
Gold & Copper Exploration and Development 0.00%New Gold, Inc., Warrants (April 2012) 23,500 386*
Metal & Mineral Mining 0.30%Eastern Platinum Ltd., Warrants (March 2009) 2,543 21*Silver Wheaton Corp., Warrants (December 2010) 32,500 96,154*
96,175
Total Warrants 96,561
(cost $36,766)
Total Securities 29,364,936
(cost $35,802,608)
See notes to portfolios of investments and notes to financial statements.
�92

HOLMES GROWTH FUND
Portfolio of Investments December 31, 2008
PrincipalREPURCHASE AGREEMENT 4.14% Amount Value
Joint Tri-Party Repurchase Agreement, Morgan Stanley, 12/31/08,0.01%, due 01/02/09, repurchase price $1,347,193, collateralizedby U.S. Treasury securities held in a joint tri-party account(cost $1,347,192) $ 1,347,192 $ 1,347,192
Total Investments 94.53% 30,712,128
(cost $37,149,800)Other assets and liabilities, net 5.47% 1,775,556
NET ASSETS 100% $32,487,684
See notes to portfolios of investments and notes to financial statements.
�93

GLOBAL MEGATRENDS FUND
Portfolio of Investments December 31, 2008
COMMON STOCKS 88.99% Shares Value
Airports 3.73%Grupo Aeroportuario del Sureste S.A.B. de C.V., ADR 22,000 $ 822,360
Cable & Wire Products 1.00%General Cable Corp. 12,500 221,125*
Coal 1.03%Peabody Energy Corp. 10,000 227,500
Commercial Services 2.80%Stantec, Inc. 25,000 617,500*
Construction 3.70%Aecon Group, Inc. 30,000 271,203China Communications Construction Co., Ltd., H shares 260,000 324,954Granite Construction, Inc. 5,000 219,650
815,807
Consulting Services 1.60%Hill International, Inc. 50,000 352,000*
Diversified Operations 1.38%Team, Inc. 11,000 304,700*
Electric Generation 11.18%China Resources Power Holdings Co., Ltd. 100,000 194,351Compania Energetica de Minas Gerais, Sponsored ADR 32,161 441,892CPFL Energia S.A., ADR 12,500 488,375FirstEnergy Corp. 13,000 631,540Huaneng Power International, Inc., Sponsored ADR 14,000 408,520Vestas Wind Systems A/S 5,000 298,639*
2,463,317
Electric Utilities 9.49%CEZ a.s. 5,000 205,278Exelon Corp. 14,000 778,540FPL Group, Inc. 22,000 1,107,260
2,091,078
Electronics & Components 0.83%China High Speed Transmission Equipment Group Co., Ltd. 150,000 183,053
See notes to portfolios of investments and notes to financial statements.
�94

GLOBAL MEGATRENDS FUND
Portfolio of Investments December 31, 2008
COMMON STOCKS Shares Value
Energy 4.73%Energy Conversion Devices, Inc. 14,000 $ 352,940*First Solar, Inc. 5,000 689,800*
1,042,740
Engineering/Research & Development 6.27%ABB Ltd., Sponsored ADR 15,000 225,150Aecom Technology Corp. 8,000 245,840*Fluor Corp. 13,000 583,310SNC-Lavalin Group, Inc. 10,000 326,183
1,380,483
Environmental Control 1.55%Energy Recovery, Inc. 45,000 341,100*
Holding Company 2.48%Berkshire Hathaway, Inc., Class B 170 546,380*
Machinery 1.40%Lonking Holdings Ltd. 600,000 309,537
Manufacturing 2.33%ITT Corp. 5,500 252,945The Manitowoc Co., Inc. 30,000 259,800
512,745
Metal & Mineral Mining 2.56%Compania Vale do Rio Doce, ADR 35,000 423,850Eastern Platinum Ltd. 19,400 5,341*Novolipetsk Steel, GDR 13,000 134,412
563,603
Oil & Gas Exploration & Production 0.05%Pacific Rubiales Energy Corp. 6,233 11,218*
Oil & Gas Extraction & Services 0.58%Schlumberger Ltd. 3,000 126,990
Public Thoroughfares 1.87%Compania de Concessoes Rodoviarias 40,000 412,596
See notes to portfolios of investments and notes to financial statements.
�95

GLOBAL MEGATRENDS FUND
Portfolio of Investments December 31, 2008
COMMON STOCKS Shares Value
Steel Manufacturing 5.62%Compania Siderurgica Nacional S.A., Sponsored ADR 17,500 $ 224,175Evraz Group S.A. 7,000 60,200Gerdau S.A., Sponsored ADR 60,000 396,000United States Steel 15,000 558,000
1,238,375
Telecommunications 6.33%AT&T, Inc. 25,000 712,500NTT DoCoMo, Inc., Sponsored ADR 12,500 245,250Turkcell Iletisim Hizmetleri A.S., ADR 30,000 437,400
1,395,150
Transport & Storage 1.61%Westshore Terminals Income Fund 45,000 355,030
Transportation 6.06%Burlington Northern Santa Fe Corp. 13,000 984,230China Railway Group Ltd., H shares 500,000 350,897*
1,335,127
Water Treatment Systems 1.72%Hyflux Ltd. 300,000 378,005
Wireless Telecommunications 7.09%America Movil SAB de C.V., ADR, Series L 16,000 495,840China Mobile Ltd. 75,000 760,396China Mobile Ltd., Sponsored ADR 6,000 305,100
1,561,336
Total Common Stocks 19,608,855
(cost $24,405,002)
EXCHANGE-TRADED FUNDS (ETF) 3.55%
SPDR Gold Trust 3,000 259,650*Utilities Select Sector SPDR Fund 18,000 522,540
Total Exchange-Traded Funds 782,190
(cost $764,202)
See notes to portfolios of investments and notes to financial statements.
�96

GLOBAL MEGATRENDS FUND
Portfolio of Investments December 31, 2008
WARRANTS 0.00% Shares Values
Oil & Gas Exploration & Production 0.00%Pacific Rubiales Energy Corp., Warrants (July 2012) 58 $ 16*
(cost $326)
MASTER LIMITED PARTNERSHIP 0.93% Units
Oil & Gas Transportation 0.93%NuStar Energy L.P. 5,000 205,300
(cost $216,248)
UNITS 1.12%
Construction 1.12%Polaris Minerals Corp. (RS) 200,000 246,549*@
(cost $262,543)
Total Securities 20,842,910
(cost $25,648,321)
PrincipalREPURCHASE AGREEMENT 5.37% Amount
Joint Tri-Party Repurchase Agreement, Morgan Stanley, 12/31/08,0.01%, due 01/02/09, repurchase price $1,182,811, collateralizedby U.S. Treasury securities held in a joint tri-party account(cost $1,182,810) $ 1,182,810 1,182,810
Total Investments 99.96% 22,025,720
(cost $26,831,131)Other assets and liabilities, net 0.04% 9,421
NET ASSETS 100% $22,035,141
See notes to portfolios of investments and notes to financial statements.
�97

GLOBAL RESOURCES FUND
Portfolio of Investments December 31, 2008
COMMON STOCKS 76.02% Shares Value
Agricultural Chemicals & Fertilizers 4.35%Archer-Daniels-Midland Co. 300,000 $ 8,649,000*Monsanto Co. 77,500 5,452,125Potash Corporation of Saskatchewan, Inc. 82,500 6,040,650Spur Ventures, Inc. 274,867 49,697*
20,191,472
Chemicals 0.49%The Dow Chemical Co. 150,000 2,263,500*
Coal 7.10%Bounty Mining Ltd. 22,000,000 704,236*+Caledon Resources plc 4,000,000 503,511*China Shenhua Energy Co. Ltd. 7,500,000 16,083,150Coalcorp Mining, Inc. 5,782,661 926,709*CONSOL Energy, Inc. 265,000 7,573,700Peabody Energy Corp. 285,000 6,483,750Western Canadian Coal Corp., 144A 1,200,000 700,197*
32,975,253
Diamond Mining & Exploration 0.02%Diamond Fields International Ltd. 22,400 644*Diamond Fields International Ltd., 144A 1,800,000 51,775*Rockwell Diamonds, Inc., 144A 950,000 50,748*Vaaldiam Resources Ltd. 1,044,001 12,870*
116,037
Financial Services 0.35%GMP Capital Trust 341,600 1,423,333Jovian Capital Corp. 1,038,100 213,285*
1,636,618
Food & Beverages 0.22%CoolBrands International, Inc. 2,714,200 1,003,772*
Forestry 0.95%Weyerhaeuser Co. 145,000 4,438,450
General Metal & Mineral Mining 4.01%Atacama Minerals Corp. 1,025,000 204,276*Baja Mining Corp. 1,381,050 249,697*BHP Billiton Ltd., Sponsored ADR 250,000 10,725,000Calibre Mining Corp. 811,400 10,002*
See notes to portfolios of investments and notes to financial statements.
�98

GLOBAL RESOURCES FUND
Portfolio of Investments December 31, 2008
COMMON STOCKS Shares Value
General Metal & Mineral Mining (Cont’d)Canada Zinc Metals Corp. 1,000,000 $ 123,274*Century Mining Corp. 225,911 4,642*Crowflight Minerals, Inc. 1,129,000 171,651*Jiangxi Copper Co. Ltd., H shares 7,000,000 5,203,784Natasa Mining Ltd. 1,099,160 838,031*+Red Dragon Resources Corp. 3,720,000 305,720*+Revett Minerals, Inc. 5,048,000 248,915*+Savant Explorations Ltd. 54,191 2,227*Selwyn Resources Ltd. 500,000 34,928*Starfield Resources, Inc. 1,000,000 119,165*Sterling Group Ventures, Inc. 500,000 10,000*Terrane Metals Corp. 2,337,000 259,283*Titanium Resources Group Ltd. 1,000,000 67,857*@Toledo Mining Corp. plc 426,200 65,440*
18,643,892
Gold & Copper Mining 2.17%Continental Minerals Corp. 1,026,227 278,057*Fortress Minerals Corp. 431,425 74,457*Freeport-McMoRan Copper & Gold, Inc. 100,000 2,444,000Los Andes Copper Ltd. 754,000 34,081*Lumina Copper Corp. 168,600 56,810*New Gold, Inc. 1,276,522 1,856,874*Northern Dynasty Minerals Ltd. 1,150,000 4,252,959*Northern Dynasty Minerals Ltd., 144A 200,000 739,645*Orsu Metals Corp. 1,476,050 121,306*Suramina Resources, Inc. 1,184,200 214,106*
10,072,295
Gold & Silver Mining 2.50%Canadian Gold Hunter Corp. 1,061,000 226,709*Chesapeake Gold Corp. 716,350 1,872,118*Corona Gold Ltd. 50,000 2,223*@Dundee Precious Metals, Inc. 1,250,000 1,530,654*Kinross Gold Corp. 1 18MAG Silver Corp. 150,600 677,007*Medoro Resources Ltd. 3,255,514 107,019*Olympus Pacific Minerals, Inc. 375,000 23,114*Planet Exploration, Inc. 160,000 26,298*Red Back Mining, Inc. 310,844 2,194,403*Red Back Mining, Inc., 144A 385,000 2,717,908*Rusoro Mining Ltd. 3,567,500 1,905,716*Rusoro Mining Ltd., 144A 433,333 231,481*Silk Road Resources Ltd. 240,000 13,807*
See notes to portfolios of investments and notes to financial statements.
�99

GLOBAL RESOURCES FUND
Portfolio of Investments December 31, 2008
COMMON STOCKS Shares Value
Gold & Silver Mining (Cont’d)TVI Pacific, Inc. 6,037,428 $ 74,426*
11,602,901
Gold/Mineral Royalty Company 0.02%Aberdeen International, Inc. 1,274,750 110,001*
Iron and Steel 3.97%Angang Steel Co. Ltd., H shares 4,000,000 4,526,399Consolidated Thompson Iron Mines Ltd. 1,060,000 818,869*Schnitzer Steel Industries, Inc., Class A 200,000 7,530,000United States Steel 150,000 5,580,000
18,455,268
Oil & Gas - Integrated 16.72%BP plc, Sponsored ADR 160,000 7,478,400ConocoPhillips 210,000 10,878,000Exxon Mobil Corp. 250,000 19,957,500Murphy Oil Corp. 150,000 6,652,500Occidental Petroleum Corp. 185,000 11,098,150PetroChina Co. Ltd., ADR 160,000 14,236,800Petroleo Brasileiro S.A., ADR 300,000 7,347,000
77,648,350
Oil & Gas Drilling 3.63%Helmerich & Payne, Inc. 200,000 4,550,000Transocean Ltd. 198,500 9,379,125*Vantage Drilling Co. 2,674,000 2,941,400*
16,870,525
Oil & Gas Equipment & Services 1.72%Oil States International, Inc. 200,000 3,738,000*Schlumberger Ltd. 100,000 4,233,000
7,971,000
Oil & Gas Exploration & Production - Junior 9.90%Abraxas Petroleum Corp. 589,294 424,292*Americas Petrogas, Inc. 4,325,000 710,881*Arena Resources, Inc. 250,000 7,022,500*Bankers Petroleum Ltd. 1,016,667 618,289*Birchcliff Energy Ltd. 500,000 2,075,115*BNK Petroleum, Inc. 140,000 13,807*Cano Petroleum, Inc. 2,725,000 1,199,000*+
See notes to portfolios of investments and notes to financial statements.
�100

GLOBAL RESOURCES FUND
Portfolio of Investments December 31, 2008
COMMON STOCKS Shares Value
Oil & Gas Exploration & Production - Junior (Cont’d)CARBO Ceramics, Inc. 185,000 $ 6,573,050Coastal Energy Co. 1,322,000 1,618,820*Foothills Resources, Inc. 1,278,667 19,180*Gran Tierra Energy, Inc. 2,763,000 7,736,400*Green Dragon Gas Ltd. 828,831 3,522,532*Ivanhoe Energy, Inc. 1,830,000 872,288*Ivory Energy, Inc. 4,138,166 255,064*+Legacy Energy LLC, 144A (RS) 2,631,580 5,157,897*@North Peace Energy Corp. 3,233,400 704,184*+Pacific Rubiales Energy Corp. 3,794,500 6,829,352*Royalite Petroleum Co., Inc. 2,266,333 90,653*Verona Development Corp. 708,800 21,844*@White Nile Ltd. 13,247,308 506,358*
45,971,506
Oil & Gas Exploration & Production - Senior 12.59%Devon Energy Corp. 135,000 8,870,850Petrohawk Energy Corp. 600,000 9,378,000*Range Resources Corp. 365,000 12,552,350Southwestern Energy Co. 280,000 8,111,600*Ultra Petroleum Corp. 235,000 8,109,850*XTO Energy, Inc. 325,000 11,462,750
58,485,400
Oil & Gas Refining and Marketing 3.36%Sunoco, Inc. 130,000 5,649,800Tesoro Corp. 400,000 5,268,000Valero Energy Corp. 190,000 4,111,600Value Creation, Inc. (RS) 282,137 579,670*@
15,609,070
Platinum Group Metals 0.81%Anooraq Resources Corp. 725,000 226,413*Beartooth Platinum Corp. 2,657,500 52,416*@Eastern Platinum Ltd. 9,936,186 2,735,554*Ivanhoe Nickel and Platinum Ltd. (RS) 15,000 9,418*@Osmium Holdings S.A. (RS) 104 0*@Platinum Group Metals Ltd. 492,700 753,141*
3,776,942
See notes to portfolios of investments and notes to financial statements.
�101

GLOBAL RESOURCES FUND
Portfolio of Investments December 31, 2008
COMMON STOCKS Shares Value
Sugar/Ethanol 0.21%Bioenergy Africa Ltd. (RS) 8,750,000 $ 867,007*+@Infinity Bio-Energy Ltd. 682,400 85,300*
952,307
Transportation 0.76%Diana Shipping, Inc. 275,000 3,509,000*
Uranium 0.17%Govi Uranium, Inc. (RS) 750,000 735,000*@GoviEx IP Holdings, Inc. (RS) 750,000 15,000*@UMC Energy plc 1,000,000 54,724*Uranium North Resources Corp. 12,500 925*
805,649
Total Common Stocks 353,109,208
(cost $614,279,170)
PREFERRED STOCK 0.22%
Oil & Gas Exploration & Production - Junior 0.22%Trident Resources Corp., Series B, Preferred Stock (RS) 80,000 1,012,400*@
(cost $5,000,000)
EXCHANGE-TRADED FUNDS (ETF) 6.10%
Market Vectors Gold Miners ETF 300,000 10,164,000*SPDR Gold Trust 210,000 18,175,500*
Total Exchange-Traded Funds 28,339,500
(cost $27,063,619)
WARRANTS 5.48%
Coal 0.07%Bounty Mining Ltd., Warrants (December 2011) 5,500,000 58,686*Coalcorp Mining, Inc., Warrants (February 2011) 1,228,071 5,046*Coalcorp Mining, Inc., Warrants (August 2011) 885,500 3,639*Coalcorp Mining, Inc., Warrants (June 2013) 3,803,000 125,017*
See notes to portfolios of investments and notes to financial statements.
�102

GLOBAL RESOURCES FUND
Portfolio of Investments December 31, 2008
WARRANTS Shares Value
Coal (Cont’d)Western Canadian Coal Corp., Warrants (June 2012) 425,000 $ 99,544*
291,932
Diamond Mining & Exploration 0.00%Rockwell Diamonds, Inc., Warrants (November 2009) 950,000 0*@
General Metal & Mineral Mining 0.05%Baja Mining Corp., Warrants (April 2009) 55,070 226*Baja Mining Corp., Warrants (April 2011) 1,055,500 0*@Stingray Copper, Inc., Warrants (April 2009) 1,000,000 4,109*Terrane Metals Corp., Warrants (June 2012) 562,500 23,114*Thompson Creek Metals Co. Inc., Warrants (October 2011) 240,291 217,225*
244,674
Gold & Copper Mining 0.15%New Gold, Inc., Warrants (April 2012) 1,478,000 24,294*New Gold, Inc., Warrants (November 2012) 5,394,000 443,294*New Gold, Inc., Warrants (June 2017) 822,570 202,803*Orsu Metals Corp., Warrants (April 2010) 950,000 11,711*Orsu Metals Corp., Warrants (March 2011) 660,000 18,984*
701,086
Gold & Silver Mining 4.44%Chesapeake Gold Corp., Warrants (February 2012) 91,023 75,927*Dundee Precious Metals, Inc., Warrants (November 2015) 625,000 308,185*Goldcorp, Inc., Warrants (June 2011) 1,463,766 14,674,329*Medoro Resources Ltd., Warrants (March 2010) 1,125,000 0*@Rusoro Mining Ltd., Warrants (November 2011) 216,667 0*@Rusoro Mining Ltd., Warrants (November 2012) 3,150,000 297,707*Silver Wheaton Corp., Warrants (December 2010) 1,385,840 4,100,118*Silver Wheaton Corp., Warrants (September 2013) 239,044 382,494*Yamana Gold, Inc., Warrants (February 2010) 712,643 784,798*
20,623,558
Gold/Mineral Royalty Companies 0.00%Aberdeen International, Inc., Warrants (July 2012) 500,000 14,382*
Oil & Gas Drilling 0.05%Vantage Drilling Co., Warrants (May 2011) 2,461,400 246,140*
See notes to portfolios of investments and notes to financial statements.
�103

GLOBAL RESOURCES FUND
Portfolio of Investments December 31, 2008
WARRANTS Shares Value
Oil & Gas Exploration & Production - Junior 0.70%Americas Petrogas, Inc., Warrants (June 2009) 2,162,500 $ 0*@Bankers Petroleum Ltd., Warrants (November 2009) 144A 994,866 120,597*Coastal Energy Co., Warrants (July 2010) 250,000 0*@Energy XXI Bermuda Ltd., Warrants (October 2009) 790,000 335,750*Foothills Resources, Inc., Warrants (September 2011) 633,334 0*@Gran Tierra Energy, Inc., Warrants (June 2012) 1,550,000 2,712,500*@North Peace Energy Corp., Warrants (February 2010) 1,616,700 0*@Pacific Rubiales Energy Corp., Warrants (July 2012) 347,749 94,311*Trident Resources Corp., Warrants (March 2013) (RS) 80,000 0*@
3,263,158
Platinum Group Metals 0.00%Eastern Platinum Ltd., Warrants (March 2009) 1,175,258 9,658*
Uranium 0.02%Denison Mines Corp., Warrants (March 2011) 231,050 94,942*
Total Warrants 25,489,530
(cost $37,750,162)
PURCHASED OPTIONS 0.03% Contracts
Agricultural Chemicals & Fertilizers 0.00%The Mosaic Co., Strike Price 60, Call, Expiration Jan. 2009
(premium $2,935,130) 1,100 5,500
Aluminum 0.00%Alcoa, Inc., Strike Price 45, Call, Expiration Jan. 2009
(premium $252) 21 21
Coal 0.00%Alpha Natural Resources, Inc., Strike Price 100, Call,
Expiration Jan. 2009 (premium $3,082,901) 2,050 10,250
Engineering & Construction 0.00%Fluor Corp., Strike Price 100, Call, Expiration Jan. 2009
(premium $1,067,912) 1,020 5,100
General Metal & Mineral Mining 0.00%BHP Billiton Ltd., Strike Price 80, Call, Expiration Jan. 2009
(premium $1,517,996) 1,100 5,500
See notes to portfolios of investments and notes to financial statements.
�104

GLOBAL RESOURCES FUND
Portfolio of Investments December 31, 2008
PURCHASED OPTIONS Contracts Value
Gold & Silver Mining 0.01%Goldcorp, Inc., Strike Price 15, Put, Expiration Apr. 2009
(premium $413,467) 1,703 $ 66,417
Oil & Gas Drilling 0.01%Helmerich & Payne, Inc., Strike Price 70, Call, Expiration Jan. 2009
(premium $1,792,954) 1,975 19,750
Oil & Gas Exploration & Production - Senior 0.01%Range Resources Corp., Strike Price 45, Call, Expiration Jan. 2010
(premium $4,012) 6 4,200Southwestern Energy Co., Strike Price 50, Call, Expiration Jan. 2009
(premium $912,925) 1,325 39,750
43,950
Total Purchased Options 156,488
(cost $11,727,549)
MASTER LIMITED PARTNERSHIP 0.97% Units
Oil & Gas Transportation 0.97%NuStar Energy L.P.
(cost $4,666,046) 110,000 4,516,600
PrincipalCONVERTIBLE DEBENTURE 0.51% Amount
Coal 0.51%Western Canadian Coal Corp., 7.50%, maturity 3/24/11 $ 4,000,000 2,350,427
(cost $3,073,403)
NOTES 1.19%
Coal 0.39%Coalcorp Mining, Inc., 12.00%, maturity 8/31/11 2,999,000 1,814,395
See notes to portfolios of investments and notes to financial statements.
�105

GLOBAL RESOURCES FUND
Portfolio of Investments December 31, 2008
PrincipalNOTES Amount Value
Gold & Copper Mining 0.80%New Gold, Inc., 10.00%, maturity 6/28/17 $ 7,000,000 $ 3,710,552
Total Notes 5,524,947
(cost $9,538,611)
Total Securities 420,499,100
(cost $713,098,560)
REPURCHASE AGREEMENT 5.18%
Joint Tri-Party Repurchase Agreement, UBS Financial Services, Inc.,12/30/08, 0.02%, due 01/02/09, repurchase price $24,069,244,collateralized by U.S. Treasury securities held in a join tri-partyaccount (cost $24,069,217) 24,069,217 24,069,217
Total Investments 95.70% 444,568,317
(cost $737,167,777)Other assets and liabilities, net 4.30% 19,955,671
NET ASSETS 100% $464,523,988
See notes to portfolios of investments and notes to financial statements.
�106

WORLD PRECIOUS MINERALS FUND
Portfolio of Investments December 31, 2008
COMMON STOCKS 74.75% Shares Value
Diamond Mining & Exploration 0.40%Diagem, Inc. 406,350 $ 14,694*@Diamond Fields International Ltd. 448,600 12,904*Diamonds North Resources Ltd. 2,804,200 691,371*Metalex Ventures Ltd. 204,000 10,897*Olivut Resources Ltd. 664,000 133,695*Rockwell Diamonds, Inc. 123,800 6,613*Rockwell Diamonds, Inc., 144A 2,575,000 137,553*Shore Gold, Inc. 1,126,500 416,605*Vaaldiam Resources Ltd. 1,513,999 18,664*
1,442,996
Financial Services 0.66%GMP Capital Trust 474,800 1,978,333Jovian Capital Corp. 1,975,100 405,798*
2,384,131
Gold/Mineral Exploration & Development 17.60%African Gold Group, Inc. 1,084,400 75,751*Amarc Resources Ltd. 695,545 70,023*Amerix Precious Metals Corp. 792,175 13,021*Andean Resources Ltd. 5,302,356 4,160,667*Andina Minerals, Inc. 1,241,700 1,102,101*Atikwa Minerals Corp. 3,062,333 75,501*+AuEx Ventures, Inc. 746,600 1,135,117*Bendigo Mining NL 1,500,000 155,240*Brazauro Resources Corp. 1,475,000 315,171*Canadian Gold Hunter Corp. 1,980,400 423,162*Candente Resource Corp. 328,100 43,143*Carnavale Resources Ltd. 3,348,857 220,354*+Carpathian Gold, Inc. 1,187,800 136,663*Centerra Gold, Inc. 233,000 850,197*Chesapeake Gold Corp. 1,974,219 5,159,448*+Continental Minerals Corp. 758,946 205,829*Continental Precious Minerals, Inc. 267,000 102,034*Corona Gold Ltd. 812,500 36,123*@Corriente Resources, Inc., Class A 500,000 1,598,455*Crystallex International Corp. 312,000 48,718*Eastmain Resources, Inc. 620,000 550,296*ECU Silver Mining, Inc. 1,090,000 806,213*Entree Gold, Inc. 1,020,000 888,560*Erdene Resource Development Corp. 731,500 114,222*EXMIN Resources, Inc. 1,424,000 35,108*EXMIN Resources, Inc., 144A 1,000,000 24,655*Farallon Resources Ltd. 850,000 104,783*First Point Minerals Corp. 2,423,000 79,652*
See notes to portfolios of investments and notes to financial statements.
�107

WORLD PRECIOUS MINERALS FUND
Portfolio of Investments December 31, 2008
COMMON STOCKS Shares Value
Gold/Mineral Exploration & Development (Cont’d)Fortress Minerals Corp. 870,525 $ 150,239*Fortress Minerals Corp. (RS) 1,400,000 229,536*@Gold Summit Corp. 273,000 3,365*Golden Odyssey Mining, Inc. 1,646,500 54,126*Grandview Gold, Inc. 1,513,000 62,172*Grayd Resource Corp. 1,133,200 447,022*Great Basin Gold Ltd. 2,208,500 2,849,560*Greystar Resources Ltd. 557,900 875,731*Guyana Goldfields, Inc. 1,389,000 2,168,886*Hainan Mining Corp. (RS) 2,018,700 294,589*@Helio Resource Corp. 234,100 55,793*Inca Pacific Resources, Inc. 337,000 38,774*Inter-Citic Minerals, Inc. 120,000 43,393*Ivanhoe Mines Ltd. 631,100 1,696,003*Ivanhoe Nickel and Platinum Ltd. (RS) 135,000 84,763*@Kings Minerals NL 15,275,000 1,253,346*Lake Shore Gold Corp. 1,020,000 1,190,335*Leyshon Resources Ltd. 2,220,000 105,616*Linear Gold Corp. 1,225,000 765,122*MAG Silver Corp. 366,800 1,648,912*Marengo Mining Ltd. 1,300,000 74,388*Medoro Resources Ltd. 3,732,942 122,714*Metallic Ventures Gold, Inc. 1,426,800 644,921*Metorex Ltd. 450,000 104,371*Mindoro Resources Ltd. 1,484,000 195,135*Mindoro Resources Ltd., 144A 1,500,000 197,239*Mirasol Resources Ltd. 649,500 74,729*Moss Lake Gold Mines Ltd. 3,162,000 493,738*+Moto Goldmines Ltd. 2,002,500 3,044,564*Moydow Mines International, Inc. 495,000 34,578*Nautilus Minerals, Inc. 252,000 207,101*New Pacific Metals Corp. 610,700 245,926*Northern Dynasty Minerals Ltd. 748,750 2,769,046*Northern Dynasty Minerals Ltd., 144A 250,000 924,556*Olympus Pacific Minerals, Inc. 1,539,000 94,859*Osisko Mining Corp. 800,000 2,393,162*Oxus Gold plc 200,000 16,236*Pacific North West Capital Corp. 1,727,466 113,574*Pacific Rim Mining Corp. 5,674,500 803,988*Paragon Minerals Corp. 174,000 6,435*Paramount Gold and Silver Corp. 857,500 415,627*PDX Resources, Inc. 1,595,000 2,162,845Pelangio Mines, Inc. 1,560,000 83,333*Planet Exploration, Inc. 1,020,500 167,735*Platte River Gold U.S., Inc. (RS) 1,098,900 1,340,236*@Premier Gold Mines Ltd. 393,900 524,423*
See notes to portfolios of investments and notes to financial statements.
�108

WORLD PRECIOUS MINERALS FUND
Portfolio of Investments December 31, 2008
COMMON STOCKS Shares Value
Gold/Mineral Exploration & Development (Cont’d)Q2 Gold Resources, Inc. (RS) 201,333 $ 0*@Radius Gold, Inc. 1,698,200 139,563*Reunion Gold Corp. 2,129,500 175,008*Romarco Minerals, Inc. 22,301,706 3,115,787*+Rubicon Minerals Corp., 144A 1,179,600 1,376,588*San Anton Resource Corp. 1,298,200 320,069*San Gold Corp. 682,100 672,682*SEMAFO, Inc. 1,102,400 1,087,179*Simberi Mining Corp. 1,262,000 7,779*Solitario Exploration & Royalty Corp. 934,100 1,397,158*Southwestern Resources Corp. 20,000 3,123*St Andrew Goldfields Ltd. 927,549 175,326*Staccato Gold Resources Ltd. 3,091,500 190,551*Strongbow Exploration, Inc. 880,500 32,563*Terrane Metals Corp. 9,010,400 999,674*+Verena Minerals Corp. 1,741,000 200,313*Verona Development Corp. 48,500 1,495*@VG Gold Corp. 5,936,510 317,121*+Victoria Gold Corp. 1,590,000 300,542*Virginia Mines, Inc. 589,700 1,938,527*Wesdome Gold Mines Ltd. 418,200 395,242*West Timmins Mining, Inc. 1,135,000 541,009*
63,190,248
Gold/Mineral Royalty Companies 2.64%Aberdeen International, Inc. 2,371,500 204,641*Gold Wheaton Gold Corp. 3,750,000 611,234*International Royalty Corp. 655,550 905,099Royal Gold, Inc. 157,800 7,765,338
9,486,312
Intermediate & Junior Gold Producers 26.74%Aurizon Mines Ltd. 630,000 2,054,882*Central Sun Mining, Inc. 1,335,098 318,194*Century Mining Corp. 2,940,559 60,416*DRDGOLD Ltd., Sponsored ADR 2,500 13,925*Dundee Precious Metals, Inc. 2,492,000 3,051,513*Eldorado Gold Corp. 210,000 1,669,500*Golden Star Resources Ltd. 1,462,900 1,462,900*IAMGOLD Corp. 1,207,901 7,464,242Jaguar Mining, Inc. 2,354,197 12,072,805*Kingsgate Consolidated Ltd. 347,776 906,261*New Gold, Inc. 2,193,466 3,190,569*OceanaGold Corp. 950,000 117,110*Orsu Metals Corp. 3,008,000 247,206*
See notes to portfolios of investments and notes to financial statements.
�109

WORLD PRECIOUS MINERALS FUND
Portfolio of Investments December 31, 2008
COMMON STOCKS Shares Value
Intermediate & Junior Gold Producers (Cont’d)Randgold Resources Ltd., ADR 880,000 $ 38,649,600Red Back Mining, Inc. 582,906 4,115,025*Red Back Mining, Inc., 144A 770,000 5,435,815*Resolute Mining Ltd. 1,350,000 230,477*@Rusoro Mining Ltd. 7,811,600 4,172,863*Rusoro Mining Ltd., 144A 1,120,000 598,291*Sino Gold Mining Ltd. 1,585,610 5,668,905*St Barbara Ltd. 5,405,344 1,222,028*TVI Pacific, Inc. 15,255,856 188,065*Zhaojin Mining Industry Co., Ltd., H shares 3,678,450 2,867,544Zijin Mining Group Co., Ltd., H shares 379,400 232,625
96,010,761
Internet 0.02%Stockhouse, Inc. 1,027,000 79,466*
Metal & Mineral Mining & Exploration 3.57%AMT International Mining 1,000,000 10,700*@Avion Resources Corp. 3,900,000 272,436*+Baja Mining Corp. 685,450 123,931*Breakwater Resources Ltd. 450,000 42,530*Brilliant Mining Corp. 317,800 52,235*Calibre Mining Corp. 2,378,400 29,320*Coalcorp Mining, Inc. 32,071 5,140*Dia Bras Exploration, Inc. 1,375,800 62,187*Freewest Resources Canada, Inc. 1,090,000 152,285*Independence Group NL 363,950 564,075JNR Resources, Inc. 456,800 108,869*Linear Metals Corp. 1,004,410 57,782*Lundin Mining Corp. 1,386,000 1,355,473*Mineral Deposits Ltd. 1,000,000 499,636*Mines Management, Inc. 887,830 1,110,763*Natasa Mining Ltd. 503,045 359,404*North American Tungsten Corp. 1,289,000 158,900*North Arrow Minerals, Inc. 261,500 15,044*Odyssey Resources Ltd. 414,900 43,474*Red Hill Energy, Inc. 145,000 36,941*Revett Minerals, Inc. 3,194,500 157,520*Ridge Mining plc 1,653,000 796,846*Silvercorp Metals, Inc. 2,813,020 6,033,845Stingray Copper, Inc. 300,000 54,241*Suramina Resources, Inc. 1,337,700 241,859*Taseko Mines Ltd. 359,000 209,476*Toledo Mining Corp. plc 432,900 66,469*Uranium North Resources Corp. 517,035 38,242*
See notes to portfolios of investments and notes to financial statements.
�110

WORLD PRECIOUS MINERALS FUND
Portfolio of Investments December 31, 2008
COMMON STOCKS Shares Value
Metal & Mineral Mining & Exploration (Cont’d)Wallbridge Mining Co. Ltd. 1,541,000 $ 63,322*Western Copper Corp. 499,400 98,501*
12,821,446
Oil & Gas Exploration & Production 0.58%Big Sky Energy Corp. 2,000,000 2,000*Pacific Rubiales Energy Corp. 1,158,232 2,084,589*
2,086,589
Platinum Group Metals 2.00%Anooraq Resources Corp. 3,472,400 1,084,411*Beartooth Platinum Corp. 5,478,500 108,057*@Eastern Platinum Ltd. 16,280,475 4,482,215*Osmium Holdings S.A. (RS) 891 0*@Platinum Group Metals Ltd. 985,900 1,507,046*
7,181,729
Senior Gold Producers 20.32%Agnico-Eagle Mines Ltd. 181,520 9,363,914Agnico-Eagle Mines Ltd. (RS) 220,000 11,292,600@AngloGold Ashanti Ltd., Sponsored ADR 186,000 5,154,060Barrick Gold Corp. 133,574 4,911,516^Gold Fields Ltd. 548,600 5,434,364Harmony Gold Mining Co., Ltd., Sponsored ADR 317,000 3,477,490*^Kinross Gold Corp. 757,754 13,957,829^Lihir Gold Ltd., Sponsored ADR 255,300 5,598,729*Newcrest Mining Ltd. 87,000 2,105,264Newmont Mining Corp. 192,900 7,851,030Polyus Gold Co., Sponsored ADR 89,600 1,068,032Yamana Gold, Inc. 356,293 2,767,068
72,981,896
Sugar/Ethanol 0.16%Bioenergy Africa Ltd. (RS) 5,750,000 569,747*+@
Wireless Equipment 0.06%Active Control Technology, Inc. 4,575,000 206,792*
Total Common Stocks 268,442,113
(cost $481,260,765)
See notes to portfolios of investments and notes to financial statements.
�111
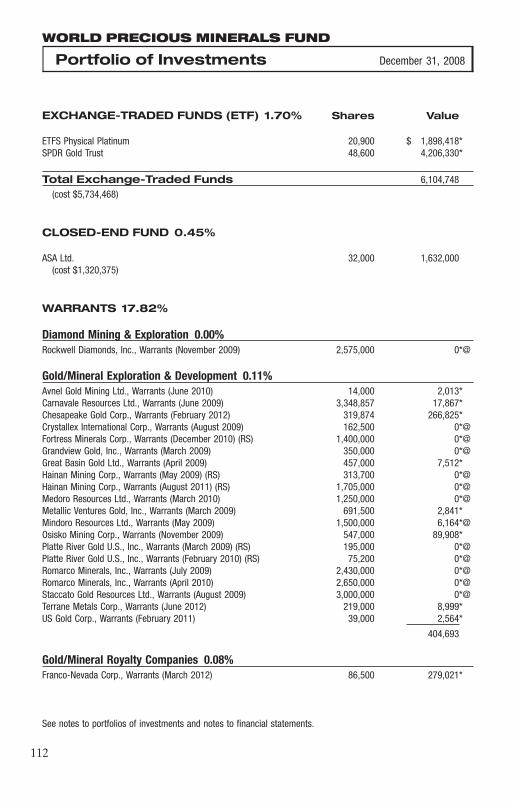
WORLD PRECIOUS MINERALS FUND
Portfolio of Investments December 31, 2008
EXCHANGE-TRADED FUNDS (ETF) 1.70% Shares Value
ETFS Physical Platinum 20,900 $ 1,898,418*SPDR Gold Trust 48,600 4,206,330*
Total Exchange-Traded Funds 6,104,748
(cost $5,734,468)
CLOSED-END FUND 0.45%
ASA Ltd. 32,000 1,632,000(cost $1,320,375)
WARRANTS 17.82%
Diamond Mining & Exploration 0.00%Rockwell Diamonds, Inc., Warrants (November 2009) 2,575,000 0*@
Gold/Mineral Exploration & Development 0.11%Avnel Gold Mining Ltd., Warrants (June 2010) 14,000 2,013*Carnavale Resources Ltd., Warrants (June 2009) 3,348,857 17,867*Chesapeake Gold Corp., Warrants (February 2012) 319,874 266,825*Crystallex International Corp., Warrants (August 2009) 162,500 0*@Fortress Minerals Corp., Warrants (December 2010) (RS) 1,400,000 0*@Grandview Gold, Inc., Warrants (March 2009) 350,000 0*@Great Basin Gold Ltd., Warrants (April 2009) 457,000 7,512*Hainan Mining Corp., Warrants (May 2009) (RS) 313,700 0*@Hainan Mining Corp., Warrants (August 2011) (RS) 1,705,000 0*@Medoro Resources Ltd., Warrants (March 2010) 1,250,000 0*@Metallic Ventures Gold, Inc., Warrants (March 2009) 691,500 2,841*Mindoro Resources Ltd., Warrants (May 2009) 1,500,000 6,164*@Osisko Mining Corp., Warrants (November 2009) 547,000 89,908*Platte River Gold U.S., Inc., Warrants (March 2009) (RS) 195,000 0*@Platte River Gold U.S., Inc., Warrants (February 2010) (RS) 75,200 0*@Romarco Minerals, Inc., Warrants (July 2009) 2,430,000 0*@Romarco Minerals, Inc., Warrants (April 2010) 2,650,000 0*@Staccato Gold Resources Ltd., Warrants (August 2009) 3,000,000 0*@Terrane Metals Corp., Warrants (June 2012) 219,000 8,999*US Gold Corp., Warrants (February 2011) 39,000 2,564*
404,693
Gold/Mineral Royalty Companies 0.08%Franco-Nevada Corp., Warrants (March 2012) 86,500 279,021*
See notes to portfolios of investments and notes to financial statements.
�112

WORLD PRECIOUS MINERALS FUND
Portfolio of Investments December 31, 2008
WARRANTS Shares Value
Intermediate & Junior Gold Producers 0.59%Dundee Precious Metals, Inc., Warrants (November 2015) 1,125,000 $ 554,734*GBS Gold International, Inc., Warrants (May 2010) 630,000 0*@New Gold, Inc., Warrants (April 2012) 6,531,600 107,357*New Gold, Inc., Warrants (June 2017) 1,452,430 358,095*New Gold, Inc., Warrants (November 2012) 4,470,000 367,357*Orsu Metals Corp., Warrants (April 2010) 2,476,000 30,523*Orsu Metals Corp., Warrants (March 2011) 4,082,000 117,414*Rusoro Mining Ltd., Warrants (November 2011) 600,000 0*@Rusoro Mining Ltd., Warrants (November 2012) 6,302,750 595,674*
2,131,154
Metal & Mineral Mining & Exploration 2.67%Avion Resources Corp., Warrants (May 2010) 1,950,000 0*@Baja Mining Corp., Warrants (April 2009) 1,007,090 4,138*Baja Mining Corp., Warrants (April 2011) 527,750 0*@Breakwater Resources Ltd., Warrants (January 2009) 604,650 2,485*Coalcorp Mining, Inc., Warrants (February 2011) 113,214 465*Denison Mines Corp., Warrants (March 2011) 188,295 77,373*Denison Mines Corp., Warrants (November 2009) 97,600 32,084*Mines Management, Inc., Warrants (April 2012) 691,300 207,390*Silver Wheaton Corp., Warrants (December 2010) 2,809,520 8,312,189*Silver Wheaton Corp., Warrants (September 2013) 429,695 687,554*Thompson Creek Metals Co. Inc., Warrants (October 2011) 274,900 248,512*
9,572,190
Oil & Gas Exploration & Production 0.07%Pacific Rubiales Energy Corp., Warrants (July 2012) 973,275 263,955*
Platinum Group Metals 0.00%Eastern Platinum Ltd., Warrants (March 2009) 1,637,664 13,459*
Senior Gold Producers 14.30%Agnico-Eagle Mines Ltd., Warrants (December 2013) (RS) 110,000 448,800*@Goldcorp, Inc., Warrants (June 2011) 3,991,933 39,978,935*Kinross Gold Corp., Warrants (September 2011) 1,531,720 4,544,304*Kinross Gold Corp., Warrants (September 2013) 446,371 2,197,372*Yamana Gold, Inc., Warrants (February 2010) 3,782,263 4,165,214*
51,334,625
Total Warrants 63,999,097
(cost $89,388,301)
See notes to portfolios of investments and notes to financial statements.
�113

WORLD PRECIOUS MINERALS FUND
Portfolio of Investments December 31, 2008
SPECIAL WARRANTS 0.00% Shares Value
Gold/Mineral Exploration & Development 0.00%Western Exploration & Development Ltd., 144A, Special Warrants (RS) 600,000 $ 0*@
(cost $300,000)
RIGHTS 0.00%
Gold/Mineral Exploration & Development 0.00%Metorex Ltd. 157,230 3,847
(cost $0)
PURCHASED OPTIONS 0.60% Contracts
Exchange-Traded Fund 0.07%Market Vectors Gold Miners ETF, Strike Price 28, Put, Expiration
Jan. 2009 (premium $947,731) 6,950 243,250
Intermediate & Junior Gold Producers 0.11%Hecla Mining Co., Strike Price 10, Call, Expiration Jan. 2010
(premium $889,136) 1,600 32,000Randgold Resources Ltd., Strike Price 50, Call, Expiration Jan. 2010
(premium $377,409) 350 357,000
389,000
Senior Gold Producers 0.42%Goldcorp, Inc., Strike Price 15, Put, Expiration Apr. 2009
(premium $1,138,196) 4,697 183,183Harmony Gold Mining Co., Ltd., Strike Price 12.50, Call, Expiration
Jan. 2009 (premium $331,129) 1,875 56,250Harmony Gold Mining Co., Ltd., Strike Price 12.50, Expiration
Jan. 2010 (premium $379,451) 1,300 357,500Newmont Mining Corp., Strike Price 45, Call, Expiration Jan. 2010
(premium $904,200) 1,100 913,000
1,509,933
Total Purchased Options 2,142,183
(cost $4,967,252)
See notes to portfolios of investments and notes to financial statements.
�114

WORLD PRECIOUS MINERALS FUND
Portfolio of Investments December 31, 2008
PrincipalNOTES 1.02% Amount Value
Intermediate & Junior Gold Producers 1.02%GBS Gold International, Inc., 12.00%, maturity 5/27/11 (RS) $ 3,600,000 $ 2,071,006*@New Gold, Inc., 10.00%, maturity 6/28/17 3,000,000 1,590,237*
Total Notes 3,661,243
(cost $6,387,277)
Total Securities 345,985,231
(cost $589,358,438)
REPURCHASE AGREEMENT 3.80%
Joint Tri-Party Repurchase Agreement, Morgan Stanley, 12/31/08,0.01%, due 01/02/09, repurchase price $13,631,487, collateralizedby U.S. Treasury securities held in a joint tri-party account(cost $13,631,479) 13,631,479 13,631,479
Total Investments 100.14% 359,616,710
(cost $602,989,917)Other assets and liabilities, net (0.14)% (496,926)
NET ASSETS 100% $359,119,784
Shares SubjectCALL OPTIONS WRITTEN To Call Value
Barrick Gold Corp., Strike Price 35, Call, Expiration Jan. 2009 150 $ 45,000Harmony Gold Mining Co., Ltd., Strike Price 10, Call, Expiration
Jan. 2009 265 37,100Kinross Gold Corp., Strike Price 20, Call, Expiration Jan. 2009 2,142 107,100
Total Call Options Written $ 189,200
(premiums received $180,422) (Note 1 E)
See notes to portfolios of investments and notes to financial statements.
�115

GOLD & PRECIOUS METALS FUND
Portfolio of Investments December 31, 2008
COMMON STOCKS 70.68% Shares Value
Diamond Mining & Exploration 0.00%Diamond Fields International Ltd. 21,600 $ 621*
Financial Services 0.20%GMP Capital Trust 92,900 387,084
Gold Mining 63.71%Agnico-Eagle Mines Ltd. 105,980 5,454,849Agnico-Eagle Mines Ltd. (RS) 140,000 7,186,200@AngloGold Ashanti Ltd., Sponsored ADR 233,237 6,462,997Aurizon Mines Ltd. 123,365 399,703Barrick Gold Corp. 276,647 10,172,310^Centerra Gold, Inc. 341,000 1,244,280*Century Mining Corp. 509,512 10,468*Compania de Minas Buenaventura S.A., ADR 160,770 3,202,538Crystallex International Corp. 120,000 18,738*DRDGOLD Ltd., Sponsored ADR 60,000 334,200*Dundee Precious Metals, Inc. 2,005,000 2,455,169*Eldorado Gold Corp. 552,859 4,394,455*Gold Fields Ltd. 651,357 6,461,105Goldcorp, Inc. 6,023 189,905*Golden Star Resources Ltd. 1,445,364 1,445,364*Harmony Gold Mining Co., Ltd., Sponsored ADR 527,566 5,787,399*^IAMGOLD Corp. 906,722 5,586,274Jaguar Mining, Inc. 976,059 5,005,430*Kingsgate Consolidated Ltd. 199,625 520,198*Kinross Gold Corp. 602,749 11,102,637^Lihir Gold Ltd., Sponsored ADR 170,488 3,738,802*New Gold, Inc. 1,043,237 1,517,411*Newcrest Mining Ltd. 45,400 1,098,609Newmont Mining Corp. 204,281 8,314,237OceanaGold Corp. 130,000 16,026*Polyus Gold Co., Sponsored ADR 127,900 1,524,568Randgold Resources Ltd., ADR 300,000 13,176,000Red Back Mining, Inc. 525,750 3,711,532*Red Back Mining, Inc., 144A 245,000 1,729,578*Rusoro Mining Ltd. 1,579,200 843,590*SEMAFO, Inc. 816,300 805,030*Sino Gold Mining Ltd. 400,000 1,430,088*St Barbara Ltd. 1,234,467 279,085*Troy Resources NL 411,300 296,486Western Goldfields, Inc. 1,055,000 1,699,375*Yamana Gold, Inc. 169,785 1,318,597Zhaojin Mining Industry Co., Ltd., H shares 4,387,550 3,420,324Zijin Mining Group Co., Ltd., H shares 154,600 94,792
122,448,349
See notes to portfolios of investments and notes to financial statements.
�116

GOLD & PRECIOUS METALS FUND
Portfolio of Investments December 31, 2008
COMMON STOCKS Shares Value
Gold Royalty Companies 4.62%Aberdeen International, Inc. 52,250 $ 4,509*Gold Wheaton Gold Corp. 3,750,000 611,234*Royal Gold, Inc. 167,971 8,265,853
8,881,596
Metal & Mineral Mining 0.46%Independence Group NL 155,000 240,230Ivanhoe Mines Ltd. 109,400 293,999*Lundin Mining Corp. 356,330 348,482*
882,711
Platinum Group Metals 0.72%Eastern Platinum Ltd. 5,059,450 1,392,929*
Silver Mining 0.97%Coeur d’Alene Mines Corp. 400,549 361,559*Silvercorp Metals, Inc. 698,000 1,497,189
1,858,748
Total Common Stocks 135,852,038
(cost $151,534,620)
EXCHANGE-TRADED FUNDS (ETF) 5.75%
ETFS Physical Platinum 16,275 1,478,313*iShares Silver Trust 160,000 1,800,000*SPDR Gold Trust 89,700 7,763,535*
Total Exchange-Traded Funds 11,041,848
(cost $10,855,686)
CLOSED-END FUND 2.65%
ASA Ltd. 100,000 5,100,000(cost $4,399,606)
See notes to portfolios of investments and notes to financial statements.
�117

GOLD & PRECIOUS METALS FUND
Portfolio of Investments December 31, 2008
WARRANTS 10.25% Shares Value
Gold Mining 9.35%Agnico-Eagle Mines Ltd., Warrants (December 2013) (RS) 70,000 $ 285,600*@Crystallex International Corp., Warrants (August 2009) 62,500 0*@Dundee Precious Metals, Inc., Warrants (November 2015) 770,500 379,931*GBS Gold International, Inc., Warrants (May 2010) 175,000 0*@Goldcorp, Inc., Warrants (June 2011) 1,080,574 10,834,158*Kinross Gold Corp., Warrants (September 2011) 831,080 2,465,647*Kinross Gold Corp., Warrants (September 2013) 489,534 2,409,853*New Gold, Inc., Warrants (April 2012) 3,775,400 62,054*New Gold, Inc., Warrants (November 2012) 1,222,000 100,427*New Gold, Inc., Warrants (June 2017) 231,800 57,150*Rusoro Mining Ltd., Warrants (November 2012) 1,439,250 136,023*Yamana Gold, Inc., Warrants (February 2010) 1,118,831 1,232,112*
17,962,955
Gold Royalty Company 0.07%Franco-Nevada Corp., Warrants (March 2012) 43,600 140,639*
Platinum Group Metals 0.00%Eastern Platinum Ltd., Warrants (March 2009) 440,235 3,618*
Silver Mining 0.83%Silver Wheaton Corp., Warrants (December 2010) 437,640 1,294,793*Silver Wheaton Corp., Warrants (September 2013) 188,106 300,988*
1,595,781
Total Warrants 19,702,993
(cost $20,434,759)
PURCHASED OPTIONS 2.28% Contracts
Exchange-Traded Fund 0.07%Market Vectors Gold Miners ETF, Strike Price 28, Put, Expiration
Jan. 2009 (premium $518,182) 3,800 133,000
Gold Mining 2.21%AngloGold Ashanti Ltd., Strike Price 50, Call, Expiration Jan. 2010
(premium $175,980) 200 40,500Gold Fields Ltd., Strike Price 15, Call, Expiration Jan. 2010
(premium $2,059,040) 9,780 1,760,400Goldcorp, Inc., Strike Price 15, Put, Expiration Apr. 2009
(premium $310,226) 1,278 49,842
See notes to portfolios of investments and notes to financial statements.
�118

GOLD & PRECIOUS METALS FUND
Portfolio of Investments December 31, 2008
PURCHASED OPTIONS Contracts Value
Gold Mining (Cont’d)Harmony Gold Mining Co., Ltd., Strike Price 12.50, Call, Expiration
Jan. 2009 (premium $110,376) 625 $ 18,750Harmony Gold Mining Co., Ltd., Strike Price 12.50, Expiration Jan. 2010
(premium $554,579) 1,900 522,500Hecla Mining Co., Strike Price 10, Call, Expiration Jan. 2010
(premium $227,124) 420 8,400Newmont Mining Corp., Strike Price 45, Call, Expiration Jan. 2010
(premium $904,200) 1,100 913,000Randgold Resources Ltd., Strike Price 50, Call, Expiration Jan. 2010
(premium $925,204) 910 928,200
4,241,592
Total Purchased Options 4,374,592
(cost $5,784,911)
PrincipalNOTE 0.30% Amount
Gold Mining 0.30%GBS Gold International, Inc., 12.00%, maturity 5/27/11 (RS) $ 1,000,000 575,279@
(cost $995,718)
Total Securities 176,646,750
(cost $194,005,300)
REPURCHASE AGREEMENTS 10.06%
Joint Tri-Party Repurchase Agreement, Credit Suisse First Boston,12/31/08, 0.03%, due 01/02/09, repurchase price $4,500,008,collateralized by U.S. Treasury securities held in a joint tri-partyaccount (cost $4,500,000) 4,500,000 4,500,000
Joint Tri-Party Repurchase Agreement, Morgan Stanley, 12/31/08,0.01%, due 01/02/09, repurchase price $10,000,006, collateralizedby U.S. Treasury securities held in a joint tri-party account(cost $10,000,000) 10,000,000 10,000,000
See notes to portfolios of investments and notes to financial statements.
�119

GOLD & PRECIOUS METALS FUND
Portfolio of Investments December 31, 2008
PrincipalREPURCHASE AGREEMENTS Amount Value
Joint Tri-Party Repurchase Agreement, UBS Financial Services, Inc.,12/31/08, 0.02%, due 01/02/09, repurchase price $4,844,311,collateralized by U.S. Treasury securities held in a joint tri-partyaccount (cost $4,844,306) $ 4,844,306 $ 4,844,306
Total Repurchase Agreements 19,344,306
(cost $19,344,306)
Total Investments 101.97% 195,991,056
(cost $213,349,606)Other assets and liabilities, net (1.97)% (3,785,492)
NET ASSETS 100% $192,205,564
Shares SubjectCALL OPTIONS WRITTEN To Call Value
Barrick Gold Corp., Strike Price 35, Call, Expiration Jan. 2009 250 $ 75,000Harmony Gold Mining Co., Ltd., Strike Price 10, Call, Expiration
Jan. 2009 235 32,900Kinross Gold Corp., Strike Price 20, Call, Expiration Jan. 2009 1,708 85,400
Total Call Options Written $ 193,300
(premiums received $163,402) (Note 1E)
See notes to portfolios of investments and notes to financial statements.
�120

EASTERN EUROPEAN FUND
Portfolio of Investments December 31, 2008
COMMON STOCKS 92.90% Shares Value
Broadcasting & Cable TV 5.08%Cyfrowy Polsat S.A. 1,518,595 $ 6,915,643TVN S.A. 2,023,135 9,201,567
16,117,210
Commodity Chemicals 1.89%Uralkali, Sponsored 671,015 6,010,365
Communications 8.43%Mobile TeleSystems 888,391 3,446,798Telefonica O2 Czech Republic a.s. 379,953 8,434,952Vimpel-Communications, Sponsored ADR 2,078,157 14,879,604
26,761,354
Diversified Banks 25.79%Erste Group Bank AG 251,508 5,925,022Komercni Banka a.s. 20,000 3,124,087OTP Bank Nyrt. 633,934 9,689,065*OTP Bank Nyrt., GDR 646,903 4,891,234@Powszechna Kasa Oszczednosci Bank Polski S.A. 190,491 2,276,929Raiffeisen International Bank Holding AG 162,747 4,577,143Sberbank RF 29,127,095 21,928,391Turkiye Garanti Bankasi a.s. 11,200,082 19,161,403Turkiye Halk Bankasi a.s. 2,599,036 7,818,560VTB Bank OJSC, Sponsored GDR,144A 1,120,780 2,454,672
81,846,506
Diversified Metals & Mining 0.86%Belon OJSC 7,004,000 2,167,038@Orsu Metals Corp. 6,947,400 570,957*
2,737,995
Electric Utility 6.68%CEZ a.s. 516,471 21,204,063
Financial Services 1.21%Finans Finansal Kiralama a.s. 4,692,448 3,840,256
Gold Mining 1.26%Dundee Precious Metals, Inc. 1,000,000 1,224,523*KazakhGold Group Ltd., GDR 700,174 2,769,346*
3,993,869
See notes to portfolios of investments and notes to financial statements.
�121

EASTERN EUROPEAN FUND
Portfolio of Investments December 31, 2008
COMMON STOCKS Shares Value
Insurance 2.71%Aksigorta a.s. 4,595,732 $ 8,590,716
Oil & Gas - Integrated 21.66%Gazprom OAO, Sponsored ADR 2,032,777 28,967,071LUKOIL, Sponsored ADR 752,810 24,127,560Rosneft Oil Co. OJSC, GDR 4,117,309 15,643,917
68,738,548
Oil & Gas Exploration & Production 10.84%KazMunaiGas Exploration Production, GDR 1,414,544 17,970,456NovaTek OAO, Sponsored GDR 381,477 7,378,644@Surgutneftegaz 15,599,642 9,044,033
34,393,133
Real Estate Investment Trusts 0.00%MirLand Development Corp. plc 12,790 6,579*
Real Estate Management & Development 0.70%Plaza Centers N.V. 1,881,175 1,551,850RGI International Ltd. 1,357,449 664,728*
2,216,578
Steel - Producers 1.56%Evraz Group S.A., GDR 190,000 1,634,000Novolipetsk Steel, GDR 320,000 3,308,606
4,942,606
Wireless Telecommunication Services 4.23%Turkcell Iletisim Hizmetleri a.s. 2,324,975 13,408,361
Total Common Stocks 294,808,139(cost $669,297,007)
PREFERRED STOCKS 1.16%
Oil & Gas Exploration & Production 1.16%Surgutneftegaz, Preferred Stock 13,529,631 2,693,750@Surgutneftegaz, Preferred Stock, Sponsored ADR 490,333 976,253@
Total Preferred Stocks 3,670,003(cost $14,159,388)
See notes to portfolios of investments and notes to financial statements.
�122

EASTERN EUROPEAN FUND
Portfolio of Investments December 31, 2008
WARRANTS 0.08% Shares Value
Gold Mining 0.08%Dundee Precious Metals, Inc., Warrants (November 2015) 500,000 $ 246,548*
(cost $0)
Total Securities 298,724,690
(cost $683,456,395)
PrincipalREPURCHASE AGREEMENT 4.33% Amount
Joint Tri-Party Repurchase Agreement, Morgan Stanley, 12/31/08,0.01%, due 01/02/09, repurchase price $13,724,247,collateralized by U.S. Treasury securities held in a joint tri-partyaccount (cost $13,724,239) 13,724,239 13,724,239
Total Investments 98.46% 312,448,929
(cost $697,180,634)Other assets and liabilities, net 1.54% 4,871,226
NET ASSETS 100% $317,320,155
See notes to portfolios of investments and notes to financial statements.
�123

GLOBAL EMERGING MARKETS
Portfolio of Investments December 31, 2008
COMMON STOCKS 83.04% Shares Value
Air Freight & Logistics 1.53%Shenzhen International Holdings Ltd. 3,392,000 $ 148,081
Alternative Carriers 1.58%GVT Holding SA 13,700 152,766*
Aluminum 0.07%Vimetco NV, GDR 41,428 7,075*
Apparel 1.04%China Dongxiang Group Co. 412,000 100,620
Beverages 2.06%Fomento Economico Mexicano, S.A.B. de C.V., Sponsored ADR 6,600 198,858
Commodity Chemicals 1.27%Israel Chemicals Ltd. 13,346 93,234Uralkali, Sponsored GDR 3,328 29,809
123,043
Communications 14.24%America Movil SAB de C.V., ADR, Series L 11,600 359,484China Mobile Ltd. 48,000 486,654China Mobile Ltd., Sponsored ADR 3,223 163,890Chunghwa Telecom Co., Ltd. 78,650 125,661Empresa Nacional de Telecomunicaciones S.A. 6,050 66,013Telecom Egypt 44,072 128,713Vimpel-Communications, Sponsored ADR 6,333 45,344
1,375,759
Computer Hardware 1.62%Wistron Corp. 203,378 156,542
Construction & Engineering 0.52%Era Infra Engineering Ltd. 34,152 50,301
Department Stores 1.16%Lojas Renner S.A. 16,269 111,752
Diversified Banks 15.59%China Construction Bank, Class H 258,000 142,771Commercial Bank of Qatar, GDR 40,249 191,183*
See notes to portfolios of investments and notes to financial statements.
�124

GLOBAL EMERGING MARKETS
Portfolio of Investments December 31, 2008
COMMON STOCKS Shares Value
Diversified Banks (Cont’d)Industrial and Commercial Bank of China Ltd., H shares 787,000 $ 418,258KB Financial Group, Inc., ADR 11,331 296,872OTP Bank Nyrt. 6,068 92,743*Sberbank RF 196,497 147,933Turkiye Garanti Bankasi a.s. 80,969 138,524Turkiye Vakiflar Bankasi T.A.O., Class D 101,100 77,676
1,505,960
Diversified Metals & Mining 1.51%Belon OJSC 206,900 64,015*@Orsu Metals Corp. 430,836 35,407*Raspadskaya 46,785 46,551
145,973
Electric Generation 1.36%Huaneng Power International, Inc., Sponsored ADR 4,500 131,310
Electronics & Components 1.26%China High Speed Transmission Equipment Group Co., Ltd. 100,000 122,035
Forest Products 1.45%China Grand Forestry Green Resources Group Ltd. 3,314,000 140,094*
Gold Mining 3.00%AngloGold Ashanti Ltd. 6,978 190,584KazakhGold Group Ltd., GDR 25,082 99,205*
289,789
Healthcare Equipment & Services 1.36%Opto Circuits India Ltd. 71,048 131,215
Insurance 1.88%China Life Insurance Co., Ltd., H shares 59,000 181,810
Machinery 0.53%Lonking Holdings Ltd. 100,000 51,590
Metal & Mineral Mining 2.85%Compania Vale do Rio Doce, Sponsored ADR 16,000 193,760Eastern Platinum Ltd. 295,021 81,223*
274,983
See notes to portfolios of investments and notes to financial statements.
�125

GLOBAL EMERGING MARKETS
Portfolio of Investments December 31, 2008
COMMON STOCKS Shares Value
Oil & Gas - Integrated 7.60%Gazprom OAO, Sponsored ADR 16,124 $ 229,767LUKOIL, Sponsored ADR 5,000 160,250PetroChina Co., Ltd., H shares 66,000 58,479Sasol Ltd. 9,528 286,247
734,743
Oil & Gas Exploration & Production 1.40%KazMunaiGas Exploration Production, GDR 10,682 135,705
Real Estate Companies 2.90%Shimao Property Holdings Ltd. 400,000 280,277
Real Estate Management & Development 0.25%RGI International Ltd. 48,574 23,786*
Retail 1.17%Wal-Mart de Mexico SAB de CV, Series V 41,900 112,954
Semiconductors 8.20%Samsung Electronics Co., Ltd. 1,158 419,343Samsung Electronics Co., Ltd., GDR, 144A 687 120,225Siliconware Precision Industries Co. 252,686 221,124Taiwan Semiconductor Manufacturing Co., Ltd., Sponsored ADR 23,115 31,680
792,372
Steel - Producers 1.93%Evraz Group S.A., GDR 3,000 25,800Gerdau S.A., Sponsored ADR 15,000 99,000Novolipetsk Steel, GDR 6,000 62,036
186,836
Tobacco 1.55%KT&G Corp. 2,400 149,659
Wireless Telecommunication Services 2.16%MTN Group Ltd. 17,954 208,926
Total Common Stocks 8,024,814
(cost $15,381,899)
See notes to portfolios of investments and notes to financial statements.
�126

GLOBAL EMERGING MARKETS
Portfolio of Investments December 31, 2008
EXCHANGE-TRADED FUND (ETF) 1.34% Shares Value
SPDR Gold Trust 1,500 $ 129,825*(cost $123,628)
CLOSED-END FUND 3.67%
Metage Special Emerging Markets Fund Ltd. 7,191 354,229*@(cost $918,299)
EQUITY-LINKED SECURITIES 4.38%
Applications Software 1.18%Tanla Solutions Ltd. (January 2010) 80,110 113,676@
Construction & Engineering 1.04%Arabtec Holding Co. (March 2017) 81,827 100,729@
IT Consulting & Other Services 2.16%Mastek Ltd., 144A (October 2009) 34,445 114,358*@Satyam Computer Services Ltd. (January 2017) 26,966 94,381@
208,739
Total Equity-Linked Securities 423,144
(cost $1,177,703)
WARRANTS 0.01%
Diversified Metals & Mining 0.01%Orsu Metals Corp., Warrants (March 2011) 25,813 742*
(cost $0)
UNITS 2.01% Units
Diversified Banks 2.01%Unibanco, Units 30,100 194,346
(cost $391,895)
Total Securities 9,127,100
(cost $17,993,424)
See notes to portfolios of investments and notes to financial statements.
�127

GLOBAL EMERGING MARKETS
Portfolio of Investments December 31, 2008
PrincipalREPURCHASE AGREEMENT 0.58% Amount Value
Joint Tri-Party Repurchase Agreement, Morgan Stanley, 12/31/08,0.01%, due 01/02/09, repurchase price $55,641, collateralized byU.S. Treasury securities held in a joint tri-party account (cost $55,641) $ 55,641 $ 55,641
Total Investments 95.03% 9,182,741
(cost $18,049,065)Other assets and liabilities, net 4.97% 480,014
NET ASSETS 100% $9,662,755
See notes to portfolios of investments and notes to financial statements.
�128

CHINA REGION FUND
Portfolio of Investments December 31, 2008
COMMON STOCKS 90.94% Shares Value
Agriculture 1.31%China Agri-Industries Holdings Ltd. 1,000,000 $ 500,576*
Auto Manufacturers 1.77%Sinotruk Hong Kong Ltd. 1,000,000 678,852
Banks 6.88%Bank of Communications Co., Ltd., H shares 1,800,000 1,311,048Industrial & Commercial Bank of China Ltd., H shares 2,500,000 1,328,645
2,639,693
Cellular Telecommunications 5.30%China Mobile Ltd. 150,000 1,520,791China Mobile Ltd., Sponsored ADR 10,000 508,500
2,029,291
Chemicals - Agricultural 0.00%Danhua Chemical Technology Co., Ltd., B shares 1 1*
Coal 1.05%China Coal Energy Co., H shares 500,000 404,045
Construction 14.73%Cheung Kong Infrastructure Holdings Ltd. 500,000 1,886,520China Communications Construction Co., Ltd., H shares 1,400,000 1,749,754China Railway Construction Corp., H shares 500,000 750,353*China Railway Group Ltd., H shares 1,800,000 1,263,231*
5,649,858
Diversified Minerals 0.04%Erdene Resource Development Corp. 100,000 15,615*
Education 0.53%CIBT Education Group, Inc. 533,632 202,831*
Electric Generation 4.31%China Resources Power Holdings Co., Ltd. 400,000 777,403Huaneng Power International, Inc., Sponsored ADR 30,000 875,400
1,652,803
See notes to portfolios of investments and notes to financial statements.
�129

CHINA REGION FUND
Portfolio of Investments December 31, 2008
COMMON STOCKS Shares Value
Electronics & Components 0.95%China High Speed Transmission Equipment Group Co., Ltd. 300,000 $ 366,106Yageo Corp., Sponsored GDR 1 1*@
366,107
Food & Beverages 4.97%China Green (Holdings) Ltd. 602,000 481,189China Yurun Food Group Ltd. 500,000 591,553Want Want China Holdings Ltd. 2,000,000 833,337
1,906,079
Gold Mining 5.08%Kingsgate Consolidated Ltd. 2,599 6,773*Lihir Gold Ltd., Sponsored ADR 20,000 438,600*Olympus Pacific Minerals, Inc. 340,500 20,987*Silk Road Resources Ltd. 210,000 12,081*Sino Gold Mining Ltd. 67,721 242,117*Zijin Mining Group Co., Ltd., H shares 2,000,000 1,226,281
1,946,839
Health & Personal Care 4.20%Hengan International Group Co., Ltd. 500,000 1,612,149
Insurance 6.10%China Life Insurance Co., Ltd., H shares 600,000 1,848,914Ping An Insurance Group Co. of China Ltd., H shares 100,000 488,675
2,337,589
Internet 4.24%Asia Broadband, Inc. 500,000 0*@Tencent Holdings Ltd. 250,000 1,627,528
1,627,528
Machinery 1.61%Lonking Holdings Ltd. 1,200,000 619,074
Metal - Copper 2.37%Continental Minerals Corp. 56,920 15,237*Jiangxi Copper Co. Ltd., H shares 1,200,000 892,077
907,314
See notes to portfolios of investments and notes to financial statements.
�130

CHINA REGION FUND
Portfolio of Investments December 31, 2008
COMMON STOCKS Shares Value
Non-Ferrous Metals 0.03%Sterling Group Ventures, Inc. 510,000 $ 10,200*
Oil & Gas - Integrated 2.32%PetroChina Co. Ltd., ADR 10,000 889,800
Oil & Gas Exploration & Production 1.94%CNOOC Ltd. 5,000 476,200Green Dragon Gas Ltd. 62,949 267,533*
743,733
Precious Metals 0.03%TVI Pacific, Inc. 1,000,000 12,327*
Publishing 0.06%Lingo Media Corp. 22,642 22,143*
Real Estate Companies 12.17%China Overseas Land & Investment Ltd. 1,200,000 1,686,890China Resources Land Ltd. 1,500,000 1,857,059Shimao Property Holdings Ltd. 1,600,000 1,121,108
4,665,057
Retail 1.27%China Dongxiang Group Co. 2,000,000 488,447China First Pencil Co., Ltd., B shares 1 0
488,447
Silver Mining 0.50%Silvercorp Metals, Inc. 90,000 193,047
Steel 4.02%Angang Steel Co. Ltd., H shares 400,000 452,640Maanshan Iron and Steel Co., Ltd., H shares 3,000,000 1,087,179
1,539,819
Telecommunications 0.43%Chunghwa Telecom Co., Ltd., ADR 10,480 163,488
Tobacco 1.63%KT&G Corp. 10,000 623,579
See notes to portfolios of investments and notes to financial statements.
�131

CHINA REGION FUND
Portfolio of Investments December 31, 2008
COMMON STOCKS Shares Value
Transportation 1.10%China COSCO Holdings Co. Ltd., H shares 600,000 $ 422,783
Total Common Stocks 34,870,667
(cost $36,320,967)
EXCHANGE-TRADED FUND (ETF) 0.33%
SPDR Gold Trust(cost $95,749) 1,500 128,117*
WARRANTS 0.00%
Construction 0.00%China State Construction International Holdings Ltd., Warrants
(February 2009) (cost $0) 85,714 111*
RIGHTS 0.04%
Real Estate Companies 0.04%China Overseas Land & Investment Ltd.
(cost $0) 48,000 17,217*@
Total Securities 35,016,112
(cost $36,416,716)
PrincipalREPURCHASE AGREEMENT 2.55% Amount
Joint Tri-Party Repurchase Agreement, Morgan Stanley, 12/31/08,0.01%, due 01/02/09, repurchase price $977,464, collateralized byU.S. Treasury securities held in a joint tri-party account(cost $977,463) $ 977,463 977,463
Total Investments 93.86% 35,993,575
(cost $37,394,179)Other assets and liabilities, net 6.14% 2,354,295
NET ASSETS 100% $38,347,870
See notes to portfolios of investments and notes to financial statements.
�132

Notes to Portfolios of Investments December 31, 2008
Legend
* Non-income producing security GO General Obligation Bond+ Affiliated company (see following) RS Restricted Security (see following)ADR American Depositary Receipt ZCB Zero Coupon BondGDR Global Depositary Receipt ^ Security or portion of security segregated as
collateral for written options@ Security was fair valued at December 31, 2008, by the Adviser in accordance with valuation procedures
approved by the Board of Trustees. Fair valued securities as a percentage of net assets at December 31,2008, were 1.12% of Global MegaTrends, 2.42% of Global Resources, 4.66% of World Precious Minerals,4.19% of Gold and Precious Metals, 5.71% of Eastern European, 8.71% of Global Emerging Markets and0.04% of China Region. See also Note 1B in the Notes to Financial Statements and the Fair Valuation ofSecurities section of these Notes to Portfolios of Investments for further discussion of fair valued securities.See further information and detail on restricted securities in the Restricted Securities section of these Notesto Portfolios of Investments.
General
The yields reflect the effective yield from the date of purchase.
Variable Rate Notes have periodic reset features, which effectively shorten the maturity dates and reset theinterest rates as tied to various interest-bearing instruments. Rates shown are current rates at December 31,2008.
Securities with a 144A designation are exempt from registration under Rule 144A of the Securities Act of 1933.
Joint Tri-Party Repurchase Agreements
The terms of the joint tri-party repurchase agreements and the securities held as collateral at December 31, 2008were:
Credit Suisse First Boston repurchase agreement, 12/31/08, 0.03%, due 01/02/09:Total principal amount: $35,000,000; Total repurchase price: $35,000,058Collateral:$25,805,000 U.S. Treasury Bond, 4.375%, 02/15/38
(total collateral market value, including accrued interest, of $35,703,699)
Morgan Stanley repurchase agreement, 12/31/08, 0.01%, due 01/02/09:Total principal amount: $48,437,396; Total repurchase price: $48,437,423Collateral:$33,368,000 U.S. Treasury Bond, 6.000%, 02/15/26$600,000 U.S. Treasury Bond, 6.875%, 08/15/25
(total collateral market value, including accrued interest, of $49,406,273)
UBS Financial Services, Inc. repurchase agreement, 12/31/08, 0.02%, due 01/02/09:Total principal amount: $49,862,174; Total repurchase price: $49,862,229Collateral:$26,120,000 U.S. Treasury Note, 2.000%, 11/30/13$23,396,000 U.S. Treasury Note, 4.500%, 04/30/09
(total collateral market value, including accrued interest, of $50,863,312)
Other mutual funds managed by U.S. Global Investors, Inc. participate in the joint tri-party repurchase agree-ments. Each owns an undivided interest in the accounts.
�133

Notes to Portfolios of Investments December 31, 2008
Fair Valuation of Securities
For the Funds’ policies regarding the valuation of investments and other significant accounting policies, pleaserefer to the Notes to Financial Statements.
The Funds adopted Statement of Financial Accounting Standards No. 157, Fair Value Measurements (SFAS 157 orthe Statement), effective July 1, 2008. SFAS 157 governs the application of generally accepted accountingprinciples that require fair value measurements of a Fund’s assets and liabilities. Fair value is the price that wouldbe received to sell an asset or paid to transfer a liability in an orderly transaction between market participants atthe measurement date. SFAS 157 established a three-tier hierarchy to maximize the use of observable marketdata and minimize the use of unobservable inputs and to establish classification of fair value measurements fordisclosure purposes. Inputs refer broadly to the assumptions that market participants would use in pricing theasset or liability, including assumptions about risk, for example, the risk inherent in a particular valuationtechnique used to measure fair value including such a pricing model and/or the risk inherent in the inputs to thevaluation technique. Inputs may be observable or unobservable. Observable inputs are inputs that reflect theassumptions market participants would use in pricing the asset or liability developed based on market dataobtained from sources independent of the reporting entity. Unobservable inputs are inputs that reflect thereporting entity’s own assumptions about the assumptions market participants would use in pricing the asset orliability developed based on the best information available in the circumstances. The three levels defined by theSFAS 157 hierarchy are as follows:
Level 1 – quoted prices in active markets for identical securities.
Level 2 – significant observable inputs (including quoted prices for similar securities, interest rates, prepaymentspeeds, credit risk, etc.)
Level 3 – significant unobservable inputs (including the Fund’s own assumptions in determining the fair value ofinvestments).
In some instances, the inputs used to measure fair value might fall in different levels of the fair value hierarchy.The level in the fair value hierarchy within which the fair value measurement in its entirety falls is determinedbased on the lowest input level that is significant to the fair value measurement in its entirety. Because of theinherent uncertainties of valuation, the values reflected in the financial statements may materially differ from thevalue received upon actual sale of those investments.
�134

Notes to Portfolios of Investments December 31, 2008
The following table summarizes the valuation of each fund’s securities using the fair value hierarchy:
At December 31, 2008 Total Level 1 Level 2 Level 3
U.S. Treasury Securities Cash FundInvestments in Securities $121,721,773 $ 56,876,124 $ 64,845,649 $ 0
U.S. Government Securities SavingsFundInvestments in Securities $357,973,782 $ 0 $357,973,782 $ 0
Near-Term Tax Free FundInvestments in Securities $ 13,863,871 $ 1,170,075 $ 12,693,796 $ 0
Tax Free FundInvestments in Securities $ 16,744,933 $ 348,497 $ 16,396,436 $ 0
All American Equity FundInvestments in Securities $ 15,541,349 $ 15,541,349 $ 0 $ 0
Holmes Growth FundInvestments in Securities $ 30,712,128 $ 30,712,128 $ 0 $ 0
Global MegaTrends FundInvestments in Securities $ 22,025,720 $ 18,227,053 $ 3,798,667 $ 0
Global Resources FundInvestments in Securities $444,568,317 $393,366,244 $ 43,690,465 $7,511,608
World Precious Minerals FundInvestments in Securities $359,616,710 $317,291,039 $ 38,488,254 $3,837,417Other Financial Instruments* $ (8,778) $ (8,778) $ 0 $ 0
Gold and Precious Metals FundInvestments in Securities $195,991,056 $178,149,372 $ 17,266,405 $ 575,279Other Financial Instruments* $ (29,898) $ (29,898) $ 0 $ 0
Eastern European FundInvestments in Securities $312,448,929 $ 85,374,504 $227,074,425 $ 0Other Financial Instruments* $ 6 $ 6
Global Emerging Markets FundInvestments in Securities $ 9,182,741 $ 2,327,398 $ 6,855,343 $ 0
China Region FundInvestments in Securities $ 35,993,575 $ 4,834,031 $ 31,159,543 $ 1
*Other financial instruments include currency contracts and written options. Currency contracts and writtenoptions are reported at their unrealized appreciation/depreciation at measurement date, which represents thechange in the contract’s value from trade date.
�135

Notes to Portfolios of Investments December 31, 2008
The following is a reconciliation of assets for which significant unobservable inputs (Level 3) were used indetermining fair value during the period July 1, 2008, through December 31, 2008:
Investments in SecuritiesGlobal Resources FundBalance as of June 30, 2008 $ 28,337,151
Total realized gain (loss) —Change in unrealized appreciation (depreciation) (13,769,058)Net purchases (sales) —Transfers in and/or out of Level 3 (7,056,485)
Balance as of December 31, 2008 $ 7,511,608
Investments in SecuritiesWorld Precious Minerals FundBalance as of June 30, 2008 $ 9,532,126
Total realized gain (loss) —Change in unrealized appreciation (depreciation) (4,263,067)Net purchases (sales) —Transfers in and/or out of Level 3 (1,431,642)
Balance as of December 31, 2008 $ 3,837,417
Investments in SecuritiesGold and Precious Metals FundBalance as of June 30, 2008 $ 980,729
Total realized gain (loss) —Change in unrealized appreciation (depreciation) (405,450)Net purchases (sales) —Transfers in and/or out of Level 3 —
Balance as of December 31, 2008 $ 575,279
Investments in SecuritiesChina Region FundBalance as of June 30, 2008 $ —
Total realized gain (loss) —Change in unrealized appreciation (depreciation) —Net purchases (sales) —Transfers in and/or out of Level 3 1
Balance as of December 31, 2008 $ 1
�136

Notes to Portfolios of Investments December 31, 2008
Affiliated Companies - Indicated in Portfolio of Investments as ‘‘+’’
The Investment Company Act of 1940 defines affiliates as companies in which the Fund owns at least 5% of theoutstanding voting securities. The following is a summary of transactions with each affiliated company during theperiod ended December 31, 2008.
Shares of Affiliated CompaniesJune 30, 2008 Additions Reductions December 31, 2008
Global Resources FundBioenergy Africa, Ltd.
(formerly Southern African Energy) — 8,750,000 — 8,750,000Bounty Mining Ltd. 22,000,000 — — 22,000,000Cano Petroleum, Inc. 2,570,000 514,100 (359,100) 2,725,000Ivory Energy, Inc. 4,603,166 — (465,000) 4,138,166Natasa Mining Ltd. 1,099,160 — — 1,099,160New Gold, Inc. 1,853,421 1 (576,900) 1,276,522(a)North Peace Energy Corp. — 3,233,400 — 3,233,400Red Dragon Resources Corp. 3,720,000 — — 3,720,000Revett Minerals, Inc. 5,048,000 — — 5,048,000Royalite Petroleum Co., Inc. 2,266,333 — — 2,266,333(a)Vantage Drilling Co. 2,405,000 358,400 (89,400) 2,674,000(a)
At December 31, 2008, the value of investments in affiliated companies was $5,122,157, representing 1.10% ofnet assets, and the total cost was $38,130,261. Net realized losses on transactions were $2,542,726 and therewas no income earned for the period.
Shares of Affiliated CompaniesJune 30, 2008 Additions Reductions December 31, 2008
World Precious Minerals FundAtikwa Minerals Corp. 3,062,333 — — 3,062,333Avion Resources Corp. — 3,900,000 — 3,900,000Bioenergy Africa, Ltd.
(formerly Southern African Energy) — 5,750,000 — 5,750,000Carnavale Resources Ltd. 3,348,857 — — 3,348,857Chesapeake Gold Corp. 1,897,639 76,580 — 1,974,219Golden Odyssey Mining plc 2,070,500 — (424,000) 1,646,500(a)Moss Lake Gold Mines Ltd. 3,162,000 — — 3,162,000Romarco Minerals, Inc. 17,081,706 5,286,000 (66,000) 22,301,706Terrane Metals Corp. 4,223,000 4,787,400 — 9,010,400VG Gold Corp. 5,856,510 80,000 — 5,936,510
At December 31, 2008, the value of investments in affiliated companies was $11,223,806, representing 3.13% ofnet assets, and the total cost was $23,687,473. Net realized losses on transactions were $63,975, and there wasno income earned for the period.
(a) At December 31, 2008, the company is no longer defined as an affiliate, although it was an affiliatedcompany during the period.
�137

Notes to Portfolios of Investments December 31, 2008
Restricted Securities - Indicated in Portfolio of Investments as‘‘RS’’
The following securities are subject to contractual and regulatory restrictions on resale or transfer. Theseinvestments may involve a high degree of business and financial risk. Because of the thinly traded markets forthese investments, a Fund may be unable to liquidate its securities in a timely manner, especially if there isnegative news regarding the specific securities or the markets overall. These securities could decline significantlyin value before the Fund could liquidate these securities. The issuer bears the cost of registration, if any, involvedin the disposition of these securities.
Acquisition Cost perDate Share/Unit
Global MegaTrends FundPolaris Minerals Corp., Units 12/22/08 $1.31
As of December 31, 2008, the total cost of restricted securities was $262,543, and the total value was $246,549,representing 1.12% of net assets.
Acquisition Cost perDate Share/Unit
Global Resources FundBioenergy Africa Ltd. (formerly Southern African Energy) 02/04/08 $0.25Govi Uranium, Inc. (formerly Govi HighPower Exploration) 10/04/07 $1.96GoviEx IP Holdings, Inc. 10/04/07 $0.04Ivanhoe Nickel and Platinum Ltd. 07/09/03 $5.00Legacy Energy LLC, 144A 02/27/06 $1.90Osmium Holdings S.A. 10/22/96-01/29/98 $987.07Trident Resources Corp., Series B, Preferred Stock 06/08/06 $62.50Trident Resources Corp., Warrants (March 2013) 06/08/06 $0.00Value Creation, Inc. 08/11/06 $12.66
At December 31, 2008, the total cost of restricted securities was $17,408,065, and the total value was$8,376,392, representing 1.80% of net assets.
�138

Notes to Portfolios of Investments December 31, 2008
Acquisition Cost perDate Share/Unit
World Precious Minerals FundAgnico-Eagle Mines Ltd. 11/24/08 $31.50Agnico-Eagle Mines Ltd., Warrants (December 2013) 11/24/08 $0.00Bioenergy Africa Ltd. 02/04/08 $0.25Fortress Minerals Corp. 11/25/08 $0.16Fortress Minerals Corp., Warrants (December 2010) 11/25/08 $0.00GBS Gold International, Inc., 12% Note, maturity 5/27/11 05/12/08 $995.72Hainan Mining Corp. 08/31/06-05/16/07 $0.85Hainan Mining Corp., Warrants (May 2009) 05/16/07 $0.00Hainan Mining Corp., Warrants (August 2011) 08/31/06 $0.00Ivanhoe Nickel and Platinum Ltd. 07/09/03 $5.00Osmium Holdings S.A. 10/22/96-01/29/98 $1,280.75Platte River Gold U.S., Inc. 03/01/04-01/25/08 $1.70Platte River Gold U.S., Inc., Warrants (March 2009) 03/01/04 $0.00Platte River Gold U.S., Inc., Warrants (February 2010) 01/25/08 $0.00Q2 Gold Resources, Inc. 06/18/07 $0.00Western Exploration & Development Ltd., 144A, Special Warrants 08/14/97 $0.50
At December 31, 2008, the total cost of restricted securities was $17,863,918 and the total value was$16,331,277, representing 4.55% of net assets.
Acquisition Cost perDate Share/Unit
Gold and Precious Metals FundAgnico-Eagle Mines Ltd. 11/24/08 $31.50Agnico-Eagle Mines Ltd., Warrants (December 2013) 11/24/08 $0.00GBS Gold International, Inc., 12% Note, maturity 5/27/11 05/12/08 $995.72
At December 31, 2008, the total cost of restricted securities was $5,405,718 and the total value was $8,047,079,representing 4.19% of net assets.
�139

Statements of Assets and Liabilities
U.S. TreasurySecuritiesCash Fund
Investments, at identified cost $ 121,721,773
ASSETSInvestments, at value:
Securities $ 64,845,649Repurchase agreements 56,876,124
Cash —Receivables:
Interest 38Capital shares sold 1,337,930From adviser 13,556
Other assets 24,528Total Assets 123,097,825
LIABILITIESPayables:
Investments purchased —Capital shares redeemed 1,629,851Adviser and affiliates —Dividends and distributions —Accounts payable and accrued expenses 57,837
Total Liabilities 1,687,688
Net Assets $121,410,137
NET ASSETS CONSIST OF:Paid-in capital $ 121,410,422Accumulated undistributed net investment income —Accumulated net realized loss on investments (285)Net unrealized appreciation (depreciation) of investments —
Net assets applicable to capital shares outstanding $ 121,410,137
Capital shares outstanding, an unlimited number of no par shares authorized 121,486,219
Net Asset Value, Public Offering Price, Redemption Price,per share $ 1.00
See accompanying notes to financial statements.
�140

December 31, 2008
U.S. GovernmentSecurities Near-Term Tax Free
Savings Fund Tax Free Fund Fund
$ 357,973,782 $ 13,706,867 $ 16,965,131
$ 357,973,782 $ 12,693,796 $ 16,396,436— 1,170,075 348,497
241 — —
898,986 152,632 236,586793,827 61 2,596
— 8,389 5,08258,888 3,320 4,879
359,725,724 14,028,273 16,994,076
— — —1,637,798 48 1,496
92,708 — —— 8,451 13,261
85,195 30,636 33,2871,815,701 39,135 48,044
$357,910,023 $13,989,138 $16,946,032
$ 357,448,714 $ 14,098,891 $ 17,654,206461,309 21,225 34,524
— (287,983) (522,500)— 157,005 (220,198)
$ 357,910,023 $ 13,989,138 $ 16,946,032
358,077,690 6,486,313 1,446,152
$ 1.00 $ 2.16 $ 11.72
�141

Statements of Assets and Liabilities
All American Holmes GrowthEquity Fund Fund
Investments, at identified cost $ 16,117,020 $ 37,149,800
ASSETSInvestments, at value:
Securities of unaffiliated issuers $ 14,968,822 $ 29,364,936Securities of affiliated issuers — —Repurchase agreements 572,527 1,347,192
Cash 2 —Foreign currencies (Cost $0, $0, $261,930, $112,329
and $0) — —Receivables:
Investments sold 1,030,400 1,818,818Dividends 58,280 64,754Interest — —Capital shares sold 8,360 2,825
Other assets 17,405 20,708Total Assets 16,655,796 32,619,233
LIABILITIESPayables:
Investments purchased 358,778 —Capital shares redeemed 19,443 55,773Adviser and affiliates 5,856 23,088Accounts payable and accrued expenses 37,373 52,688Written options at value (Premiums $0, $0, $0, $0
and $180,422) — —Total Liabilities 421,450 131,549
Net Assets $16,234,346 $32,487,684
NET ASSETS CONSIST OF:Paid-in capital $ 21,977,926 $ 45,277,468Accumulated undistributed net investment income
(distributions in excess of net investment income) 29,875 —Accumulated net realized loss on investments and
foreign currencies (5,197,784) (6,352,112)Net unrealized depreciation of investments and other
assets and liabilities denominated in foreigncurrencies (575,671) (6,437,672)
Net assets applicable to capital shares outstanding $ 16,234,346 $ 32,487,684
Capital shares outstanding, an unlimited number ofno par shares authorized 936,998 2,540,793
Net Asset Value, Public OfferingPrice, Redemption Price, pershare $ 17.33 $ 12.79
See accompanying notes to financial statements.
�142
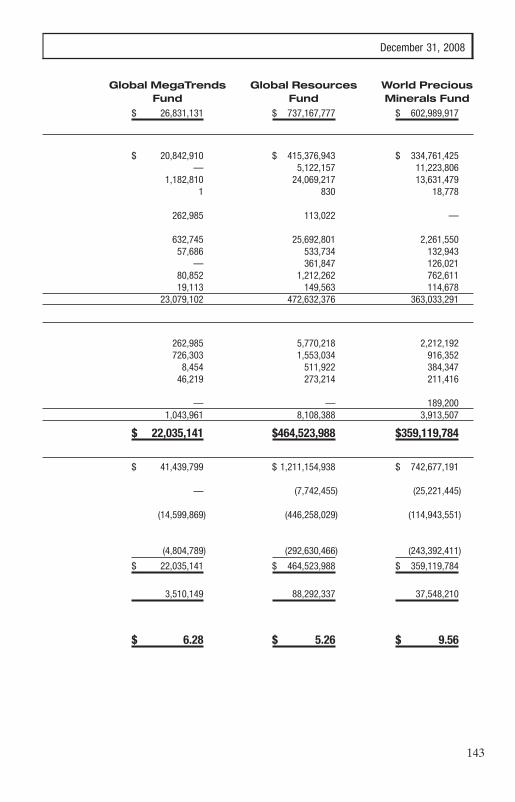
December 31, 2008
Global MegaTrends Global Resources World PreciousFund Fund Minerals Fund
$ 26,831,131 $ 737,167,777 $ 602,989,917
$ 20,842,910 $ 415,376,943 $ 334,761,425— 5,122,157 11,223,806
1,182,810 24,069,217 13,631,4791 830 18,778
262,985 113,022 —
632,745 25,692,801 2,261,55057,686 533,734 132,943
— 361,847 126,02180,852 1,212,262 762,61119,113 149,563 114,678
23,079,102 472,632,376 363,033,291
262,985 5,770,218 2,212,192726,303 1,553,034 916,352
8,454 511,922 384,34746,219 273,214 211,416
— — 189,2001,043,961 8,108,388 3,913,507
$ 22,035,141 $464,523,988 $359,119,784
$ 41,439,799 $ 1,211,154,938 $ 742,677,191
— (7,742,455) (25,221,445)
(14,599,869) (446,258,029) (114,943,551)
(4,804,789) (292,630,466) (243,392,411)
$ 22,035,141 $ 464,523,988 $ 359,119,784
3,510,149 88,292,337 37,548,210
$ 6.28 $ 5.26 $ 9.56
�143

Statements of Assets and Liabilities
Gold and PreciousMetals Fund
Investments, at identified cost $ 213,349,606
ASSETSInvestments, at value:
Securities of unaffiliated issuers $ 176,646,750Repurchase agreements 19,344,306
Cash 6,520Foreign currencies (Cost $54,361, $89, $0 and $1,452,136) 54,580Receivables:
Investments sold 3,192,501Dividends 72,685Interest 68Capital shares sold 370,621Unrealized appreciation on foreign currency exchange contracts - Note 1 G —From adviser —
Other assets 66,912Total Assets 199,754,943
LIABILITIESPayables:
Investments purchased 6,831,508Capital shares redeemed 252,580Adviser and affiliates 159,449Accounts payable and accrued expenses 112,542Written options at value (Premiums $163,402, $0, $0 and $0) 193,300
Total Liabilities 7,549,379
Net Assets $192,205,564
NET ASSETS CONSIST OF:Paid-in capital $ 256,963,799Distributions in excess of net investment income (1,197,725)Accumulated net realized loss on investments and foreign currencies (46,148,163)Net unrealized depreciation of investments and other assets and liabilities
denominated in foreign currencies (17,412,347)
Net assets applicable to capital shares outstanding $ 192,205,564
Capital shares outstanding, an unlimited number of no par shares authorized 17,754,288
Net Asset Value, Public Offering Price, RedemptionPrice, per share $ 10.83
See accompanying notes to financial statements.
�144

December 31, 2008
Eastern Global Emerging ChinaEuropean Fund Markets Fund Region Fund
$ 697,180,634 $ 18,049,065 $ 37,394,179
$ 298,724,690 $ 9,127,100 $ 35,016,11213,724,239 55,641 977,463
1,593,760 — —98 — 1,345,784
5,003,643 503,196 1,101,1041,775,723 28,063 20,580
4 — —142,220 14,250 99,710
6 — —— 18,113 —
107,066 26,898 32,123321,071,449 9,773,261 38,592,876
1,593,795 — —1,272,477 34,076 129,172
483,744 — 48,853401,278 76,430 66,981
— — —3,751,294 110,506 245,006
$317,320,155 $ 9,662,755 $38,347,870
$ 828,764,184 $ 26,836,498 $ 73,004,500(6) — (722,297)
(126,719,834) (8,307,140) (32,427,380)
(384,724,189) (8,866,603) (1,506,953)
$ 317,320,155 $ 9,662,755 $ 38,347,870
62,036,159 1,825,734 6,859,152
$ 5.12 $ 5.29 $ 5.59
�145

Statements of Operations
U.S. TreasurySecurities Cash Fund
For the For thePeriod Ended Year EndedDecember 31, June 30,
2008(a) 2008
NET INVESTMENT INCOME
Income:Interest and other $ 692,041 $ 4,097,237
Expenses:Management fee 297,009 598,885Administrative services fee 24,867 —Transfer agent fees and expenses 176,258 414,961Accounting service fees and expenses 12,930 25,828Professional fees 30,682 53,494Custodian fees 36,681 50,278Shareholder reporting expenses 23,896 74,585Registration fees 24,361 29,696Trustee fees and expenses 8,478 28,546Miscellaneous expenses 22,460 24,241
Total expenses before reductions 657,622 1,300,514Expenses offset - Note 1 J (93) (566)Expenses reimbursed - Note 2 (225,023) (109,402)
Net Expenses 432,506 1,190,546
Net Investment Income 259,535 2,906,691
NET REALIZED AND UNREALIZED GAINON INVESTMENTS
Realized gain from securities — —Net change in unrealized appreciation of investments — —
Net Realized and Unrealized Gain on Investments — —
Net Increase In Net AssetsResulting From Operations $ 259,535 $2,906,691
(a) for the six-month fiscal period ended December 31, 2008
See accompanying notes to financial statements.
�146

U.S. GovernmentSecurities Savings Near-Term
Fund Tax Free FundFor the For the For the For the
Period Ended Year Ended Period Ended Year EndedDecember 31, June 30, December 31, June 30,
2008(a) 2008 2008(a) 2008
$ 3,773,680 $ 18,091,509 $ 255,441 $ 523,496
935,315 2,066,736 35,621 67,94177,022 — 2,829 —
239,126 525,735 20,586 40,63534,670 78,666 18,026 36,27645,202 82,074 26,759 50,71637,414 69,077 6,575 13,39349,728 113,956 1,655 2,55518,636 39,464 5,456 13,408
8,478 28,546 8,978 28,04667,305 48,773 2,625 6,627
1,512,896 3,053,027 129,110 259,597— — (105) (391)
(541,087) (951,257) (97,071) (198,121)
971,809 2,101,770 31,934 61,085
2,801,871 15,989,739 223,507 462,411
3,459 64,190 — 277— — 84,257 110,288
3,459 64,190 84,257 110,565
$2,805,330 $16,053,929 $ 307,764 $ 572,976
�147

Statements of Operations
Tax Free FundFor the For the
Period Ended Year EndedDecember 31, 2008(a) June 30, 2008
NET INVESTMENT INCOME
Income:Dividends $ — $ —Foreign tax withheld on dividends — —
Net dividends — —Interest and other 418,482 790,951
Total Income 418,482 790,951
Expenses:Management fee 68,256 128,802Administrative services fee 3,414 —Transfer agent fees and expenses 24,649 45,051Accounting service fees and expenses 19,673 37,189Professional fees 27,020 49,633Distribution plan expenses — —Custodian fees 7,025 13,592Shareholder reporting expenses 2,259 4,452Registration fees 8,830 17,447Trustee fees and expenses 8,477 28,546Miscellaneous expenses 3,362 7,656
Total expenses before reductions 172,965 332,368Expenses offset - Note 1J (7) (62)Expenses reimbursed - Note 2 (109,507) (212,246)
Net Expenses 63,451 120,060
Net Investment Income (Loss) 355,031 670,891
NET REALIZED AND UNREALIZEDGAIN (LOSS) ON INVESTMENTS
Realized gain (loss) from:Securities 33,947 (42,271)Written options — —Foreign currency transactions — —
Net realized gain (loss) 33,947 (42,271)
Net change in unrealized appreciation (depreciation) of:Investments (457,262) (74,214)Other assets and liabilities denominated in foreign currencies — —
Net unrealized appreciation (depreciation) (457,262) (74,214)
Net Realized and Unrealized Gain(Loss) on Investments (423,315) (116,485)
Net Increase (Decrease) In Net AssetsResulting From Operations $ (68,284) $ 554,406
(a) for the six-month fiscal period ended December 31, 2008
(b) for the two-month fiscal period ended December 31, 2008
See accompanying notes to financial statements.
�148

All American Equity Fund Holmes Growth FundFor the For the For the For the
Period Ended Year Ended Period Ended Year EndedDecember 31, 2008(a) June 30, 2008 December 31, 2008(b) October 31, 2008
$ 197,961 $ 230,648 $ 79,085 $ 488,034(670) (4,440) (1,238) (36,828)
197,291 226,208 77,847 451,20620,378 84,755 2,433 176,489
217,669 310,963 80,280 627,695
80,068 195,312 54,369 572,8153,408 — 4,350 2,558
55,746 114,632 19,828 127,67214,077 31,004 5,108 46,91528,988 56,687 22,555 58,26810,650 — 13,592 51,80813,205 24,493 4,778 57,8847,856 22,477 4,628 18,890
10,583 18,457 1,180 18,9228,478 28,546 3,995 19,868
12,207 22,668 2,086 26,628
245,266 514,276 136,469 1,002,228(199) (726) (38) (1,085)
(63,867) (58,304) (41,285) —
181,200 455,246 95,146 1,001,143
36,469 (144,283) (14,866) (373,448)
(4,477,749) 403,484 (2,833,261) (2,549,531)(28,488) — (10,331) 74,386
— (373) (875) (10,384)
(4,506,237) 403,111 (2,844,467) (2,485,529)
(5,129,815) 1,022,225 (650,462) (25,643,178)— — (41) (63)
(5,129,815) 1,022,225 (650,503) (25,643,241)
(9,636,052) 1,425,336 (3,494,970) (28,128,770)
$(9,599,583) $ 1,281,053 $(3,509,836) $(28,502,218)
�149

Statements of Operations
Global MegaTrends FundFor the
For the Year Ended
Period Ended October 31,
December 31, 2008(b) 2008NET INVESTMENT INCOMEIncome:
Dividends from unaffiliated issuers $ 64,496 $ 490,421Foreign tax withheld on dividends (2,439) (25,558)
Net dividends 62,057 464,863Interest and other 1,652 138,782
Total Income 63,709 603,645
Expenses:Management fee 38,532 310,564Administration services expenses 3,083 1,879Transfer agent fees and expenses 20,403 100,003Accounting service fees and expenses 5,873 40,103Professional fees 20,337 47,972Distribution plan expenses 9,633 77,844Custodian fees 6,209 36,847Shareholder reporting expenses 2,402 11,271Registration fees 1,913 25,397Trustee fees and expenses 4,303 19,868Miscellaneous expenses 1,594 16,279
Total expenses before reductions 114,282 688,027Expenses offset - Note 1J (36) (443)Expenses reimbursed - Note 2 (42,962) (66,157)
Net Expenses 71,284 621,427
Net Investment Income (Loss) (7,575) (17,782)NET REALIZED AND UNREALIZED
GAIN (LOSS) ON INVESTMENTSRealized gain (loss) from:
Securities from unaffiliated issuers (5,664,448) (8,932,568)Securities from affiliated issuers — —Written options (49,647) 41,101Foreign currency transactions 167 2,551
Net realized gain (loss) (5,713,928) (8,888,916)
Net change in unrealized appreciation (depreciation) of:Investments 4,516,372 (13,841,299)Written options (37,330) 37,330Other assets and liabilities denominated in foreign currencies 621 3,030
Net unrealized appreciation (depreciation) 4,479,663 (13,800,939)
Net Realized and Unrealized Gain (Loss)on Investments (1,234,265) (22,689,855)
Net Increase (Decrease) In Net AssetsResulting From Operations $(1,241,840) $(22,707,637)
(a) for the six-month fiscal period ended December 31, 2008(b) for the two-month fiscal period ended December 31, 2008See accompanying notes to financial statements.
�150

World Precious MineralsGlobal Resources Fund Fund
For the For the For the For the
Period Ended Year Ended Period Ended Year Ended
December 31, 2008(a) June 30, 2008 December 31, 2008(a) June 30, 2008
$ 2,631,342 $ 14,738,471 $ 830,781 $ 2,538,158(63,671) (968,416) (94,952) (247,097)
2,567,671 13,770,055 735,829 2,291,0611,102,163 4,675,306 431,022 3,033,521
3,669,834 18,445,361 1,166,851 5,324,582
3,443,348 9,303,615 1,998,128 6,254,087112,737 — 62,904 —
1,322,017 2,687,220 662,987 1,612,020232,518 696,173 143,959 501,33076,369 198,035 69,388 160,412
352,303 — 196,575 —157,566 582,845 170,435 708,402170,897 353,827 99,923 214,78238,652 83,842 18,978 61,1068,478 28,546 8,477 28,546
79,108 148,265 65,172 129,969
5,993,993 14,082,368 3,496,926 9,670,654(8,308) (91,173) (1,290) (20,741)
(599,300) — (278,182) —
5,386,385 13,991,195 3,217,454 9,649,913
(1,716,551) 4,454,166 (2,050,603) (4,325,331)
(437,572,205) 277,972,030 (106,846,593) 173,859,833(2,542,726) (728,926) (63,975) 147,227
10,574,475 679,136 1,693,380 4,168,881(541,384) (573,378) (533,573) 13,589
(430,081,840) 277,348,862 (105,750,761) 178,189,530
(823,886,071) 231,527,557 (373,223,392) (57,059,936)— (8,349) 4,510,024 (5,145,161)
(11,455) 51,294 (5,770) 2,891
(823,897,526) 231,570,502 (368,719,138) (62,202,206)
(1,253,979,366) 508,919,364 (474,469,899) 115,987,324
$(1,255,695,917) $513,373,530 $(476,520,502) $111,661,993
�151

Statements of Operations
Gold and PreciousMetals Fund
For the For thePeriod Ended Year Ended
December 31, 2008(a) June 30, 2008
NET INVESTMENT INCOMEIncome:
Dividends (dividend adjustments) $ 430,909 $ 608,620Foreign taxes withheld on dividends (35,238) (35,534)
Net dividends 395,671 573,086Interest and other 284,052 1,310,565
Total Income 679,723 1,883,651
Expenses:Management fee 755,361 1,629,448Administrative services fee 30,259 —Transfer agent fees and expenses 227,436 455,397Accounting service fees and expenses 74,215 164,466Professional fees 39,841 74,268Distribution plan expenses 94,560 —Custodian fees 101,140 232,807Shareholder reporting expenses 46,054 96,239Registration fees 17,021 29,954Trustee fees and expenses 8,576 28,546Miscellaneous expenses 34,694 70,107
Total expenses before reductions 1,429,157 2,781,232Expenses offset - Note 1J (2,320) (4,634)Expenses reimbursed - Note 2 (135,057) —
Net Expenses 1,291,780 2,776,598
Net Investment Loss (612,057) (892,947)NET REALIZED AND UNREALIZED
GAIN (LOSS) ON INVESTMENTSRealized gain (loss) from:
Securities (47,202,746) 43,522,592Written options 1,776,178 2,062,044Foreign currency transactions (231,516) (28,528)
Net realized gain (loss) (45,658,084) 45,556,108
Net change in unrealized appreciation (depreciation) of:Investments (38,919,535) 4,493,644Written options 1,282,148 (1,512,042)Other assets and liabilities denominated in foreign currencies 5,914 (4,751)
Net unrealized appreciation (depreciation) (37,631,473) 2,976,851
Net Realized and Unrealized Gain(Loss) on Investments (83,289,557) 48,532,959
Net Increase (Decrease) In Net AssetsResulting From Operations $(83,901,614) $47,640,012
(a) for the six-month fiscal period ended December 31, 2008
(b) for the two-month fiscal period ended December 31, 2008
See accompanying notes to financial statements.
�152

Eastern European FundFor the For the
Period Ended Year EndedDecember 31, 2008(b) October 31, 2008
$ (579,958) $ 25,189,19334,427 (3,975,271)
(545,531) 21,213,9229,019 1,228,721
(536,512) 22,442,643
727,005 15,406,04646,528 31,241
165,304 2,057,71240,056 563,82832,497 130,738
145,401 2,689,610111,066 3,088,719
91,595 259,3664,991 47,8863,995 19,868
12,332 139,673
1,380,770 24,434,687(287) (77,398)
(160,802) (56,835)
1,219,681 24,300,454
(1,756,193) (1,857,811)
(81,979,492) 12,228,474— —
(79,634) (1,348,009)
(82,059,126) 10,880,465
(2,609,582) (828,006,568)— —
542,912 (845,940)
(2,066,670) (828,852,508)
(84,125,796) (817,972,043)
$(85,881,989) $(819,829,854)
�153

Statements of Operations
Global Emerging MarketsFund
For theFor the Year Ended
Period Ended October 31,December 31, 2008(b) 2008
NET INVESTMENT INCOMEIncome:
Dividends $ 26,792 $ 643,235Foreign taxes withheld on dividends (4,452) (76,699)
Net dividends 22,340 566,536Interest and other 391 24,481
Total Income 22,731 591,017
Expenses:Management fee 23,297 539,299Administrative services fee 1,355 925Transfer agent fees and expenses 14,572 125,581Accounting service fees and expenses 5,499 56,802Professional fees 26,828 62,876Distribution plan expenses 4,236 99,017Custodian fees 15,106 156,646Shareholder reporting expenses 4,369 19,154Registration fees 15,598 19,740Trustee fees and expenses 3,995 19,868Miscellaneous expenses 860 10,416
Total expenses before reductions 115,715 1,110,324Expenses offset - Note 1J (12) (871)Expenses reimbursed - Note 2 (73,347) (119,279)
Net Expenses 42,356 990,174
Net Investment Loss (19,625) (399,157)NET REALIZED AND UNREALIZED
GAIN (LOSS) ON INVESTMENTSRealized gain (loss) from:
Securities (2,930,885) (4,842,013)Foreign currency transactions (3,053) (114,101)
Net realized gain (loss) (2,933,938) (4,956,114)
Net change in unrealized appreciation (depreciation) of:Investments 1,795,083 (27,074,905)Other assets and liabilities denominated in foreign currencies 14,469 21,041
Net unrealized appreciation (depreciation) 1,809,552 (27,053,864)
Net Realized and Unrealized Losson Investments (1,124,386) (32,009,978)
Net Decrease In Net AssetsResulting From Operations $(1,144,011) $(32,409,135)
(a) for the six-month fiscal period ended December 31, 2008
(b) for the two-month fiscal period ended December 31, 2008
See accompanying notes to financial statements.
�154

China Region Fund
For the For thePeriod Ended Year Ended
December 31, 2008(a) June 30, 2008
$ 470,067 $ 1,745,454(38,428) (106,449)
431,639 1,639,005 37,635 288,073
469,274 1,927,078
342,311 1,431,338 8,111 —
117,339 302,494 32,190 109,404 32,885 74,911 25,348 — 50,947 181,505 15,754 43,189 13,967 21,812
8,477 28,54623,535 36,752
670,864 2,229,951(245) (1,046)
(73,208) —
597,411 2,228,905
(128,137) (301,827)
(25,255,671) 8,268,856(34,497) (571)
(25,290,168) 8,268,285
(3,013,550) (21,301,271)(128,218) 20,733
(3,141,768) (21,280,538)
(28,431,936) (13,012,253)
$(28,560,073) $(13,314,080)
�155

Statements of Changes in Net Assets
U.S. Treasury SecuritiesCash Fund
Period Ended Year Ended Year EndedDecember 31, June 30, June 30,
2008(a) 2008 2007
INCREASE (DECREASE)IN NET ASSETS
From operations:Net investment income $ 259,535 $ 2,906,691 $ 5,084,492Net realized gain (loss) — — —Net unrealized appreciation — — —
Net increase in net assets fromoperations 259,535 2,906,691 5,084,492
Distributions to shareholders:From net investment income (259,483) (2,910,606) (5,084,891)
Total distributions toshareholders (259,483) (2,910,606) (5,084,891)
From capital share transactions:Proceeds from shares sold 130,413,946 255,882,468 383,660,609Distributions reinvested 251,689 2,823,671 4,907,563
130,665,635 258,706,139 388,568,172Cost of shares redeemed (121,210,250) (262,759,089) (391,584,524)
Net increase (decrease) in netassets from capital sharetransactions 9,455,385 (4,052,950) (3,016,352)
NET INCREASE (DECREASE) IN NETASSETS 9,455,437 (4,056,865) (3,016,751)
NET ASSETSBeginning of year 111,954,700 116,011,565 119,028,316
End of year $121,410,137 $111,954,700 $116,011,565Accumulated undistributed net investment income,
(distributions in excess of net income), end of year $ — $ (682) $ 1,043
Capital Share ActivityShares sold 130,413,946 255,882,468 383,660,609Shares reinvested 251,689 2,823,671 4,907,563Shares redeemed (121,210,250) (262,759,089) (391,584,524)
Net share activity 9,455,385 (4,052,950) (3,016,352)
(a) for the six-month fiscal period ended December 31, 2008
See accompanying notes to financial statements.
�156

U.S. Government SecuritiesSavings Fund Near-Term Tax Free Fund
Period Ended Year Ended Year Ended Period Ended Year Ended Year EndedDecember 31, June 30, June 30, December 31, June 30, June 30,
2008(a) 2008 2007 2008(a) 2008 2007
$ 2,801,871 $ 15,989,739 $ 21,124,115 $ 223,507 $ 462,411 $ 501,5663,459 64,190 2,458 — 277 (9,533)
— — — 84,257 110,288 67,546
2,805,330 16,053,929 21,126,573 307,764 572,976 559,579
(2,801,889) (15,993,388) (21,124,058) (223,006) (459,010) (501,654)
(2,801,889) (15,993,388) (21,124,058) (223,006) (459,010) (501,654)
134,091,962 369,995,971 368,491,428 1,808,188 3,217,467 2,312,7222,737,639 15,556,039 20,689,962 175,005 356,102 384,910
136,829,601 385,552,010 389,181,390 1,983,193 3,573,569 2,697,632(225,130,630) (408,499,445) (355,506,639) (1,681,960) (3,467,805) (5,202,546)
(88,301,029) (22,947,435) 33,674,751 301,233 105,764 (2,504,914)
(88,297,588) (22,886,894) 33,677,266 385,991 219,730 (2,446,989)
446,207,611 469,094,505 435,417,239 13,603,147 13,383,417 15,830,406
$357,910,023 $446,207,611 $469,094,505 $13,989,138 $13,603,147 $13,383,417
$ 461,309 $ 403,299 $ 406,948 $ 21,225 $ 20,724 $ 17,323
134,091,962 369,995,971 368,491,428 841,748 1,487,510 1,078,4412,737,639 15,556,039 20,689,962 81,677 165,330 179,915
(225,130,630) (408,499,445) (355,506,639) (787,328) (1,603,148) (2,428,359)
(88,301,029) (22,947,435) 33,674,751 136,097 49,692 (1,170,003)
�157

Statements of Changes in Net Assets
Tax Free FundPeriod Ended Year Ended Year EndedDecember 31, June 30, June 30,
2008(a) 2008 2007
INCREASE (DECREASE)IN NET ASSETS
From operations:Net investment income (loss) $ 355,031 $ 670,891 $ 619,096Net realized gain (loss) 33,947 (42,271) 15,231Net unrealized appreciation (depreciation) (457,262) (74,214) (41,981)
Net increase (decrease) in netassets from operations (68,284) 554,406 592,346
Distributions to shareholders:From net investment income (355,381) (668,191) (615,389)From net capital gains — — —Tax return of capital — — —
Total distributions to shareholders (355,381) (668,191) (615,389)
From capital share transactions:Proceeds from shares sold 2,556,729 6,825,328 4,168,323Distributions reinvested 287,716 544,322 509,442Proceeds from short-term trading fees — — —
2,844,445 7,369,650 4,677,765Cost of shares redeemed (3,854,351) (4,816,254) (3,706,262)
Net increase (decrease) in netassets from capital sharetransactions (1,009,906) 2,553,396 971,503
NET INCREASE (DECREASE) IN NET ASSETS (1,433,571) 2,439,611 948,460
NET ASSETSBeginning of period 18,379,603 15,939,992 14,991,532
End of period $16,946,032 $18,379,603 $15,939,992Accumulated undistributed net investment income,
(distributions in excess of net income), end of period $ 34,524 $ 34,874 $ 32,174
Capital Share ActivityShares sold 215,622 563,924 341,911Shares reinvested 24,537 45,182 41,891Shares redeemed (334,996) (398,760) (304,399)
Net share activity (94,837) 210,346 79,403
(a) for the six-month fiscal period ended December 31, 2008
(b) for the two-month fiscal period ended December 31, 2008
See accompanying notes to financial statements.
�158

All American Equity Fund Holmes Growth FundPeriod Ended Year Ended Year Ended Period Ended Year Ended Year EndedDecember 31, June 30, June 30, December 31, October 31, October 31,
2008(a) 2008 2007 2008(b) 2008 2007
$ 36,469 $ (144,283) $ (62,274) $ (14,866) $ (373,448) $ (389,550)(4,506,237) 403,111 2,102,393 (2,844,467) (2,485,529) 5,122,087(5,129,815) 1,022,225 1,982,026 (650,503) (25,643,241) 14,431,854
(9,599,583) 1,281,053 4,022,145 (3,509,836) (28,502,218) 19,164,391
(6,594) — — — — —— (2,702,440) (2,948,106) — — —— (110,537) — — — —
(6,594) (2,812,977) (2,948,106) — — —
2,272,974 11,702,468 3,497,874 481,499 4,868,436 5,258,7546,496 2,717,435 2,897,452 — — —
285 755 603 52 517 250
2,279,755 14,420,658 6,395,929 481,551 4,868,953 5,259,004(2,952,671) (9,854,499) (5,538,258) (714,741) (9,017,148) (17,352,136)
(672,916) 4,566,159 857,671 (233,190) (4,148,195) (12,093,132)
(10,279,093) 3,034,235 1,931,710 (3,743,026) (32,650,413) 7,071,259
26,513,439 23,479,204 21,547,494 36,230,710 68,881,123 61,809,864
$16,234,346 $26,513,439 $23,479,204 $32,487,684 $36,230,710 $68,881,123
$ 29,875 $ — $ — $ — $ — $ (40,296)
103,969 422,589 128,990 35,294 228,630 261,279391 96,056 115,759 — — —
(139,580) (367,851) (204,356) (57,386) (445,988) (851,885)
(35,220) 150,794 40,393 (22,092) (217,358) (590,606)
�159
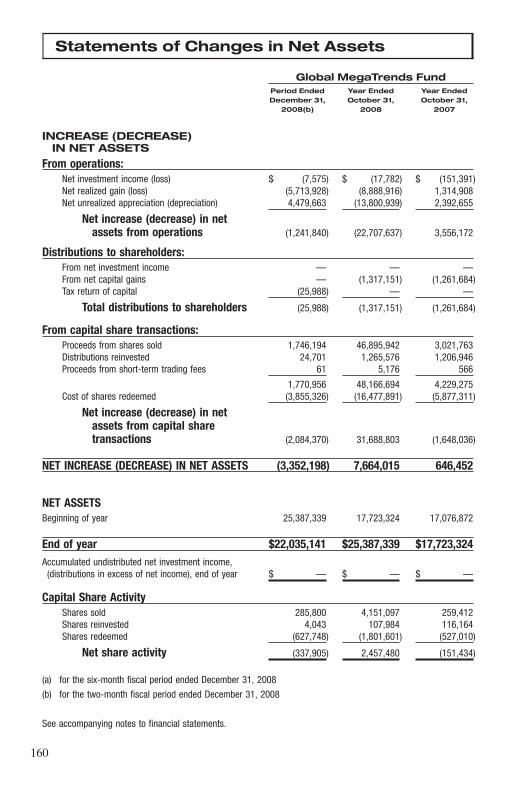
Statements of Changes in Net Assets
Global MegaTrends FundPeriod Ended Year Ended Year EndedDecember 31, October 31, October 31,
2008(b) 2008 2007
INCREASE (DECREASE)IN NET ASSETS
From operations:Net investment income (loss) $ (7,575) $ (17,782) $ (151,391)Net realized gain (loss) (5,713,928) (8,888,916) 1,314,908Net unrealized appreciation (depreciation) 4,479,663 (13,800,939) 2,392,655
Net increase (decrease) in netassets from operations (1,241,840) (22,707,637) 3,556,172
Distributions to shareholders:From net investment income — — —From net capital gains — (1,317,151) (1,261,684)Tax return of capital (25,988) — —
Total distributions to shareholders (25,988) (1,317,151) (1,261,684)
From capital share transactions:Proceeds from shares sold 1,746,194 46,895,942 3,021,763Distributions reinvested 24,701 1,265,576 1,206,946Proceeds from short-term trading fees 61 5,176 566
1,770,956 48,166,694 4,229,275Cost of shares redeemed (3,855,326) (16,477,891) (5,877,311)
Net increase (decrease) in netassets from capital sharetransactions (2,084,370) 31,688,803 (1,648,036)
NET INCREASE (DECREASE) IN NET ASSETS (3,352,198) 7,664,015 646,452
NET ASSETSBeginning of year 25,387,339 17,723,324 17,076,872
End of year $22,035,141 $25,387,339 $17,723,324Accumulated undistributed net investment income,
(distributions in excess of net income), end of year $ — $ — $ —
Capital Share ActivityShares sold 285,800 4,151,097 259,412Shares reinvested 4,043 107,984 116,164Shares redeemed (627,748) (1,801,601) (527,010)
Net share activity (337,905) 2,457,480 (151,434)
(a) for the six-month fiscal period ended December 31, 2008
(b) for the two-month fiscal period ended December 31, 2008
See accompanying notes to financial statements.
�160

Global Resources Fund World Precious Minerals FundPeriod Ended Year Ended Year Ended Period Ended Year Ended Year EndedDecember 31, June 30, June 30, December 31, June 30, June 30,
2008(a) 2008 2007 2008(a) 2008 2007
$ (1,716,551) $ 4,454,166 $ 9,042,961 $ (2,050,603) $ (4,325,331) $ 564,918(430,081,840) 277,348,862 92,470,318 (105,750,761) 178,189,530 106,003,267(823,897,526) 231,570,502 109,964,218 (368,719,138) (62,202,206) (11,580,180)
(1,255,695,917) 513,373,530 211,477,497 (476,520,502) 111,661,993 94,988,005
— (78,221,305) (61,878,978) — (99,747,352) (51,570,418)(96,308,578) (176,347,594) (120,720,087) (61,845,712) (103,097,880) (69,178,178)
— — — — — —
(96,308,578) (254,568,899) (182,599,065) (61,845,712) (202,845,232) (120,748,596)
178,643,865 817,774,032 645,950,934 82,524,302 418,681,230 697,217,10193,000,270 246,775,705 175,690,973 59,587,050 192,776,672 114,711,593
47,596 91,286 65,595 48,834 206,975 815,105
271,691,731 1,064,641,023 821,707,502 142,160,186 611,664,877 812,743,799(465,744,284) (696,115,025) (749,000,008) (193,687,785) (495,247,072) (783,452,968)
(194,052,553) 368,525,998 72,707,494 (51,527,599) 116,417,805 29,290,831
(1,546,057,048) 627,330,629 101,585,926 (589,893,813) 25,234,566 3,530,240
2,010,581,036 1,383,250,407 1,281,664,481 949,013,597 923,779,031 920,248,791
$ 464,523,988 $2,010,581,036 $1,383,250,407 $359,119,784 $949,013,597 $923,779,031
$ (7,742,455) $ (47,434,621) $ (12,989,617) $ (25,221,445) $ (64,048,128) $ (15,710,691)
15,106,616 44,109,226 39,780,025 5,873,543 14,550,574 24,505,326 18,379,336 14,892,921 12,000,749 8,473,439 8,106,672 4,350,079(43,177,704) (39,167,676) (48,049,221) (14,285,921) (17,762,117) (28,153,172)
(9,691,752) 19,834,471 3,731,553 61,061 4,895,129 702,233
�161

Statements of Changes in Net Assets
Gold and Precious Metals FundPeriod Ended Year Ended Year EndedDecember 31, June 30, June 30,
2008(a) 2008 2007
INCREASE (DECREASE)IN NET ASSETS
From operations:Net investment income (loss) $ (612,057) $ (892,947) $ 689,923Net realized gain (loss) (45,658,084) 45,556,108 27,431,014Net unrealized appreciation (depreciation) (37,631,473) 2,976,851 (36,875,467)
Net increase (decrease) in netassets resulting from operations (83,901,614) 47,640,012 (8,754,530)
Distributions to shareholders:From net investment income — — —From net capital gains (11,619,090) (25,521,881) —Tax return of capital — — —
Total distributions to shareholders (11,619,090) (25,521,881) —
From capital share transactions:Proceeds from shares sold 83,548,879 182,890,757 187,856,134Distributions reinvested 10,904,039 24,120,907 —Proceeds from short-term trading fees 65,548 127,619 278,592
94,518,466 207,139,283 188,134,726Cost of shares redeemed (65,814,015) (148,997,522) (208,645,621)
Net increase (decrease) in netassets from capital sharetransactions 28,704,451 58,141,761 (20,510,895)
NET INCREASE (DECREASE) IN NET ASSETS (66,816,253) 80,259,892 (29,265,425)
NET ASSETSBeginning of period 259,021,817 178,761,925 208,027,350
End of period $192,205,564 $259,021,817 $178,761,925Accumulated undistributed net investment income,
(distributions in excess of net income), end of period $ (1,197,725) $ (796,871) $ 926,160
Capital Share ActivityShares sold 7,260,223 10,241,147 12,003,311Shares reinvested 1,295,781 1,635,316 —Shares redeemed (5,876,426) (8,730,139) (13,510,813)
Net share activity 2,679,578 3,146,324 (1,507,502)
(a) for the six-month fiscal period ended December 31, 2008
(b) for the two-month fiscal period ended December 31, 2008
See accompanying notes to financial statements.
�162

Eastern European Fund Global Emerging Markets FundPeriod Ended Year Ended Year Ended Period Ended Year Ended Year EndedDecember 31, October 31, October 31, December 31, October 31, October 31,
2008(b) 2008 2007 2008(b) 2008 2007
$ (1,756,193) $ (1,857,811) $ (8,564,082) $ (19,625) $ (399,157) $ (364,142)(82,059,126) 10,880,465 282,693,981 (2,933,938) (4,956,114) 8,311,640(2,066,670) (828,852,508) 285,436,753 1,809,552 (27,053,864) 13,963,701
(85,881,989) (819,829,854) 559,566,652 (1,144,011) (32,409,135) 21,911,199
— — (25,188,053) — (1,235,838) —— (273,627,367) (170,169,454) — (8,418,305) (2,463,937)— — — (147,530) — —
— (273,627,367) (195,357,507) (147,530) (9,654,143) (2,463,937)
24,488,731 269,122,580 330,290,055 176,198 11,160,939 27,400,995— 266,926,394 190,987,756 137,693 9,156,240 2,307,884
108,582 1,599,093 1,180,568 1,230 116,466 62,030
24,597,313 537,648,067 522,458,379 315,121 20,433,645 29,770,909(36,889,330) (611,403,256) (651,110,037) (1,068,774) (26,283,342) (18,626,085)
(12,292,017) (73,755,189) (128,651,658) (753,653) (5,849,697) 11,144,824
(98,174,006) (1,167,212,410) 235,557,487 (2,045,194) (47,912,975) 30,592,086
415,494,161 1,582,706,571 1,347,149,084 11,707,949 59,620,924 29,028,838
$317,320,155 $ 415,494,161 $1,582,706,571 $ 9,662,755 $11,707,949 $59,620,924
$ (6) $ (1,796) $ (186,878) $ — $ (300) $ (314,610)
3,727,676 17,749,450 20,278,182 32,218 739,179 1,643,572— 16,352,444 12,852,474 26,789 570,838 161,843
(7,172,967) (48,093,690) (40,900,278) (203,613) (2,064,625) (1,165,080)
(3,445,291) (13,991,796) (7,769,622) (144,606) (754,608) 640,335
�163

Statements of Changes in Net Assets
China Region FundPeriod Ended Year Ended Year EndedDecember 31, June 30, June 30,
2008(a) 2008 2007
INCREASE (DECREASE)IN NET ASSETS
From operations:Net investment income (loss) $ (128,137) $ (301,827) $ 14,318Net realized gain (loss) (25,290,168) 8,268,285 13,318,745Net unrealized appreciation (depreciation) (3,141,768) (21,280,538) 17,987,184
Net increase (decrease) in netassets from operations (28,560,073) (13,314,080) 31,320,247
Distributions to shareholders:From net investment income — (862,509) (1,333,614)From net capital gains — (24,776,876) —Tax return of capital — (1,395,287) —
Total distributions to shareholders — (27,034,672) (1,333,614)
From capital share transactions:Proceeds from shares sold 6,720,245 87,256,997 41,842,142Distributions reinvested — 26,049,930 1,288,571Proceeds from short-term trading fees 59,386 363,983 153,356
6,779,631 113,670,910 43,284,069Cost of shares redeemed (20,981,063) (86,017,501) (47,227,127)
Net increase (decrease) in netassets from capital sharetransactions (14,201,432) 27,653,409 (3,943,058)
NET INCREASE (DECREASE) IN NET ASSETS (42,761,505) (12,695,343) 26,043,575
NET ASSETSBeginning of year 81,109,375 93,804,718 67,761,143
End of year $38,347,870 $81,109,375 $93,804,718Distributions in excess of net investment income, end of
year $ (722,297) $ (1,910,999) $ (2,258,850)
Capital Share ActivityShares sold 979,972 6,246,450 4,193,823Shares reinvested — 2,136,992 128,472Shares redeemed (3,044,240) (6,934,355) (4,630,983)
Net share activity (2,064,268) 1,449,087 (308,688)
(a) for the six-month fiscal period ended December 31, 2008
See accompanying notes to financial statements.
�164

Notes to Financial Statements December 31, 2008
NOTE 1: SIGNIFICANT ACCOUNTING POLICIES
U.S. Global Investors Funds (Trust), consisting of thirteen separate funds (Funds),is organized as a Delaware statutory trust. Each Fund is an open-end managementinvestment company registered under the Investment Company Act of 1940, asamended. All funds are diversified with the exception of Global Resources, WorldPrecious Minerals, Gold and Precious Metals, Eastern European, Global Emerg-ing Markets and China Region. A nondiversified fund may invest a significantportion of its assets in a small number of companies.
Four of the Funds, Holmes Growth Fund, Global MegaTrends Fund, EasternEuropean Fund and Global Emerging Markets Fund, were formerly in the U.S.Global Accolade Funds Trust. Recent organizational and contractual changeshave occurred for the Trust and the Funds. See Note 2 for more information aboutthese changes.
Effective December 31, 2008, the fiscal year for all Funds in the Trust changed toDecember 31. The four Funds previously in the Accolade trust had a fiscal yearthat ended October 31. The fiscal period ended December 31, 2008, presented inthese financial statements is a two-month period for these funds. The nine fundsoriginally in the U.S. Global Investors Funds Trust (U.S. Treasury Securities Cash,U.S. Government Securities Savings, Near-Term Tax Free, Tax Free, All Ameri-can Equity, Global Resources, World Precious Minerals, Gold and PreciousMetals and China Region) had a fiscal year that ended June 30. The fiscal periodended December 31, 2008, presented is a six-month period for these funds.
Effective October 1, 2008, the name of the China Region Opportunity Fundchanged to China Region Fund.
The following is a summary of significant accounting policies consistently followedby the Funds in the preparation of their financial statements. The policies are inconformity with U.S. generally accepted accounting principles.
A. Security ValuationsThe Funds value investments traded on national or international securitiesexchanges or over-the-counter at the last sales price reported by the security’sprimary exchange of its market at the time of daily valuation. Securities for whichno sale was reported are valued at the mean between the last bid and askquotation. Short-term investments with effective maturities of sixty days or less atthe date of purchase may be valued at amortized cost, which approximates marketvalue. Investments of U.S. Treasury Securities Cash and U.S. Government Securi-ties Savings Funds are valued at amortized cost. An independent pricing servicevalues municipal securities, long-term U.S. Government obligations and corporatedebt securities using a system based on such factors as credit rating, maturity,coupon and type of security to determine fair value.
�165

Notes to Financial Statements December 31, 2008
B. Fair Valued SecuritiesSecurities for which market quotations are not readily available or which aresubject to legal restrictions are valued at their fair value as determined in goodfaith under consistently applied procedures under the general supervision of theBoard of Trustees. The following factors are generally considered in determiningfair value: nature and duration of any trading restrictions, trading volume, marketvalues of unrestricted shares of the same or similar class, investment manage-ment’s judgment regarding the market experience of the issuer, financial statusand other operational and market factors affecting the issuer, issuer’s manage-ment, quality of the underlying property based on review of independent geologi-cal studies, the extent of a Fund’s investment in the trading securities of the issuer;and other relevant matters. The fair values may differ from what would have beenused had a broader market for these securities existed.
For securities traded on international exchanges, if events which may materiallyaffect the value of a Fund’s securities occur after the close of the primary exchangeand before a Fund’s net asset value is next determined, then those securities willbe valued at their fair value as determined in good faith under the supervision ofthe Board of Trustees. The Funds may use a systematic fair value model providedby an independent third party to value international securities. At December 31,2008, this model was used to value certain foreign securities in Global Mega-Trends, Global Resources, World Precious Minerals, Gold and Precious Metals,Eastern European, Global Emerging Markets and China Region Funds.
C. Security Transactions and Investment IncomeSecurity transactions are accounted for on trade date. Realized gains and lossesfrom security transactions are determined on an identified-cost basis. Dividendincome is recorded on the ex-dividend date except that certain dividends fromforeign securities where the ex-dividend date may have passed are recorded assoon as a fund is informed of the ex-dividend data in the exercise of reasonablediligence. Interest income, which may include original issue discount, is recordedon an accrual basis. Discounts and premiums on securities purchased are accretedand amortized, respectively, on a yield-to-maturity basis as adjustments to interestincome. Investment income is recorded net of foreign taxes withheld whererecovery of such taxes is uncertain.
The Funds may purchase securities on a when-issued or delayed-delivery basis andsegregate the liquid assets on their books collateral with a value at least equal tothe amount of the commitment. Losses may arise due to the changes in the valueof the underlying securities or if the counterparty does not perform under thecontract.
The equity funds may invest in private placements and initial public offerings(IPOs), the volatility of which may significantly affect performance. There is no
�166

Notes to Financial Statements December 31, 2008
guarantee that these high-risk investments will affect a Fund’s performance in thesame way in the future.
D. Repurchase AgreementsThe Funds may enter into repurchase agreements with recognized financial insti-tutions or registered broker-dealers and, in all instances, hold as collateral, under-lying securities with a value exceeding the principal amount of the repurchaseobligation. The Funds use joint tri-party repurchase agreement accounts withother funds under common management where uninvested cash is collectivelyinvested in repurchase agreements, and each participating fund owns an undividedinterest in the account.
E. OptionsSome Funds may write or purchase options on securities to manage their exposureto stock or commodity markets as well as fluctuations in interest and currencyconversion rates. Written options include a risk of loss in excess of the optionpremium. The use of options carries the risks of a change in value of the underly-ing instruments, an illiquid secondary market, or failure of the counterparty toperform its obligations. The option premium is the basis for recognition ofunrealized or realized gain or loss on the option. The cost of securities acquired orthe proceeds from securities sold through the exercise of the option is adjusted bythe amount of the premium.
As of December 31, 2008, portfolio securities valued at $4,787,819 and $4,323,181were held in escrow by the custodian as cover for call options written for theWorld Precious Minerals Fund and Gold and Precious Metals Fund, respectively.
Transactions in written call options during the period ended December 31, 2008,were as follows:
All American GlobalEquity Fund Resources Fund
Number of Premiums Number of PremiumsContracts Received Contracts Received
Options outstanding at June 30, 2008 — $ — — $ —Options written 85 81,855 54,480 17,013,069Options closed (85) (81,855) (36,910) (13,026,533)Options expired — — (17,570) (3,986,536)Options exercised — — — —
Options outstanding at December 31, 2008 — $ — — $ —
�167

Notes to Financial Statements December 31, 2008
World Precious Gold and PreciousMinerals Fund Metals Fund
Number of Premiums Number of PremiumsContracts Received Contracts Received
Options outstanding at June 30, 2008 35,162 $ 7,537,863 11,303 $ 2,223,554Options written 19,277 3,027,125 18,720 2,317,356Options closed (44,784) (9,393,829) (17,584) (3,254,257)Options expired (2,967) (230,371) (2,023) (141,686)Options exercised (4,131) (760,366) (8,223) (981,565)
Options outstanding at December 31, 2008 2,557 $ 180,422 2,193 $ 163,402
Holmes GlobalGrowth Fund MegaTrends Fund
Number of Premiums Number of PremiumsContracts Received Contracts Received
Options outstanding at October 31, 2008 — $ — 220 $ 110,130Options written 185 175,304 165 157,485Options closed (185) (175,304) (345) (247,675)Options expired — — (40) (19,940)Options exercised — — — —
Options outstanding at December 31, 2008 — $ — — $ —
F. Foreign Currency TransactionsSome Funds may invest in securities of foreign issuers. The accounting records ofthese funds are maintained in U.S. dollars. At each net asset value determinationdate, the value of assets and liabilities denominated in foreign currencies aretranslated into U.S. dollars using the current prevailing exchange rate. Securitytransactions, income and expenses are converted at the prevailing rate ofexchange on the respective dates of the transactions. The effect of changes inforeign exchange rates on foreign denominated securities is included with the netrealized and unrealized gain or loss on securities. Other foreign currency gains orlosses are reported separately.
G. Forward Foreign Currency ContractsThe Funds may enter into forward foreign currency contracts to lock in the U.S.dollar cost of purchase and sale transactions or to defend the portfolio againstcurrency fluctuations. A forward foreign currency contract is a commitment topurchase or sell a foreign currency at a future date at a negotiated rate. Thesecontracts are valued daily, and the Fund’s net equity therein, representing unreal-ized gain or loss on the contracts as measured by the difference between theforward foreign exchange rates at the dates of entry into the contracts and theforward rates at the reporting, is included in the statement of assets and liabilities.Realized and unrealized gains and losses are included in the statement of opera-tions. Risks may arise upon entering into these contracts from the potentialinability of counterparties to meet the terms of the contract and from unantici-pated movements in the value of foreign currencies relative to the U.S. dollar.
�168

Notes to Financial Statements December 31, 2008
Open forward foreign currency contracts at December 31, 2008, were:
Foreign In Exchange Settlement Unrealized UnrealizedFund Contract Currency for USD Date Value Appreciation (Depreciation)
Eastern European FundSales:British Pounds 438 $644 01/02/09 $638 $6 $—
H. Federal Income TaxesThe Funds intend to continue to comply with the requirements of Subchapter M ofthe Internal Revenue Code applicable to regulated investment companies and todistribute substantially all of their taxable income to shareholders. Accordingly,no provision for federal income taxes is required. Each Fund may be subject toforeign taxes on income and gains on investments, which are accrued based on theFund’s understanding of the tax rules and regulations in the foreign markets.
I. Dividends and Distributions to ShareholdersThe Funds record dividends and distributions to shareholders on the ex-dividenddate. Distributions are determined in accordance with income tax regulations,which may differ from accounting principles generally accepted in the UnitedStates. Accordingly, periodic reclassifications related to permanent book and taxbasis differences are made within the funds’ capital accounts to reflect income andgains available for distribution under income tax regulations.
The Funds generally pay income dividends and distribute capital gains, if any,annually. The U.S. Treasury Securities Cash and U.S. Government SecuritiesSavings Funds accrue dividends on a daily basis with payment monthly. The TaxFree and Near-Term Tax Free Funds pay monthly dividends. Dividends anddistributions payable at period end are processed for reinvestment on the follow-ing business day. A Fund may elect to designate a portion of the earnings andprofits distributed to shareholders on the redemption of fund shares during theyear as distributions for federal income tax purposes.
J. ExpensesEach Fund bears expenses incurred specifically on its behalf plus an allocation ofits share of Trust level expenses. Expense offset arrangements have been madewith the Funds’ custodian so the custodian fees may be paid indirectly by creditsearned on the Funds’ cash balances. Such deposit arrangements are an alternativeto overnight investments.
K. Short-Term Trading (Redemption) FeesShares held in the All American Equity Fund 30 days or less are subject to a short-term trading fee equal to 0.10% of the proceeds of the redeemed shares. Sharesheld in the Holmes Growth, Global MegaTrends and Global Resources Funds 30days or less are subject to a short-term trading fee equal to 0.25% of the proceedsof the redeemed shares. Shares held in the World Precious Minerals and Gold and
�169

Notes to Financial Statements December 31, 2008
Precious Metals Funds 30 days or less are subject to a short-term trading fee equalto 0.50% of the proceeds of the redeemed shares. Shares held in the EasternEuropean and Global Emerging Markets Funds 180 days or less are subject to ashort-term trading fee equal to 2.00% of the proceeds of the redeemed shares.Shares held in the China Region Fund 180 days or less are subject to a short-termtrading fee equal to 1.00% of the proceeds of the redeemed shares. These fees,which are retained by the Funds, are accounted for as an addition to paid-incapital.
L. Use of Estimates in Financial Statement PreparationThe preparation of financial statements in conformity with accounting principlesgenerally accepted in the United States requires management to make estimatesand assumptions that affect the reported amounts of assets and liabilities anddisclosure of contingent assets and liabilities at the date of the financial statementsand the reported amounts of income and expenses during the reporting period.Actual results could differ from those estimates.
M. New Accounting PronouncementsIn June 2006, the Financial Accounting Standards Board (FASB) issued FASBInterpretation No. 48 (FIN 48), Accounting for Uncertainty in Income Taxes. Thisstandard defines the threshold for recognizing the benefits of tax-return positionsin the financial statements as ‘‘more-likely-than-not’’ to be sustained upon chal-lenge by the taxing authority and requires measurement of a tax position meetingthe more-likely-than-not criterion, based on the largest benefit that is more than50 percent likely to be realized. FIN 48 was effective for fiscal years beginningafter December 15, 2006, with early application permitted if no interim financialstatements had been issued. Acknowledging the unique issues that FIN 48presents for investment companies that calculate NAVs, the SEC indicated thatthey would not object if a fund implemented FIN 48 in its NAV calculation as lateas its last NAV calculation in the first required financial statement reporting periodfor its fiscal year beginning after December 15, 2006. At adoption, companies mustadjust their financial statements to reflect only those tax positions that are more-likely-than-not to be sustained. Management of the Funds has analyzed the taxpositions of the Funds. Upon adoption of FIN 48 on December 31, 2007 (or April30, 2008, for the four funds formerly in the Accolade trust), management identi-fied no uncertain tax positions that have not met the more-likely-than-not stan-dard. As of December 31, 2008, tax years 2004 through 2007 remain subject toexamination by the Funds’ major tax jurisdictions, which include the United Statesof America and the Commonwealth of Massachusetts.
In addition, in September 2006, Statement of Financial Accounting Standards No.157, Fair Value Measurements (SFAS 157), was issued and is effective for fiscalyears beginning after November 15, 2007. SFAS 157 defines fair value, establishesa framework for measuring fair value and expands disclosures about fair value
�170

Notes to Financial Statements December 31, 2008
measurements. SFAS 157 has been adopted and the related disclosures included inthe notes to portfolios.
In March 2008, Statement of Financial Accounting Standards No. 161, Disclosuresabout Derivative Instruments and Hedging Activities (SFAS 161), was issued.SFAS 161 requires enhanced disclosures about the use of and accounting forderivative instruments. SFAS 161 is effective for financial statements issued forfiscal years and interim periods beginning after November 15, 2008. Managementis in the process of evaluating the impact adoption of SFAS 161 will have on theFunds’ financial statement disclosures.
NOTE 2: RELATED PARTY TRANSACTIONS
U.S. Global Investors, Inc. (Adviser), under an investment advisory agreementwith the Trust in effect through September 30, 2009, furnishes management andinvestment advisory services and, subject to the supervision of the trustees, directsthe investments of each Fund according to its investment objectives, policies andlimitations. The Adviser also furnishes all necessary office facilities, businessequipment and personnel for administering the affairs of the Trust. Frank E.Holmes, a trustee of the Funds, is the controlling owner of the Adviser.
A special meeting of shareholders of U.S. Global Investor Funds and U.S. GlobalAccolade Funds was held on September 23, 2008, to consider several proposals.The new proposals were approved effective October 1, 2008, and included (i) areorganization of U.S. Global Investor Funds and U.S. Global Accolade Fundsfrom two separate Massachusetts business trusts into a single Delaware statutorytrust under the name U.S. Global Investors Funds, (ii) a new advisory agreement,(iii) a new administrative services agreement and (iv) a new distribution plan forthe equity funds under which a subsidiary of the Adviser will be paid a fee at anannual rate of 0.25 percent of the average daily net assets of each fund.
�171

Notes to Financial Statements December 31, 2008
For the services of the Adviser, each Fund pays a management fee based upon itsnet assets. Fees are accrued daily and paid monthly. The contractual managementfee for each fund, effective October 1, 2008, is:
Annual Percentage ofFund Average Daily Net Assets
U.S. Treasury Securities Cash and .50% of the first $250,000,000 andU.S. Government Securities Savings .375% of the excess
Near-Term Tax Free 0.50%
Tax Free .75% of the first $250,000,000 and.50% of the excess
All American Equity .80% of the first $500,000,000 and.75% of the excess
Holmes Growth and Global MegaTrends 1.00%
Global Resources .95% of the first $500,000,000;.90% of $500,000,001 to $1,000,000,000and .85% of the excess
World Precious Minerals 1.00% of the first $500,000,000;.95% of $500,000,001 to $1,000,000,000and .90% of the excess
Gold and Precious Metals .90% of the first $500,000,000and .85% of the excess
Eastern European 1.25%
Global Emerging Markets 1.375%
China Region 1.25%
�172

Notes to Financial Statements December 31, 2008
Prior to October 1, 2008, the management fees were the same as above except asfollows:
Annual Percentage ofAverage Daily Net Assets
Fund (Prior to October 1, 2008)
All American Equity .75% of the first $250,000,000 and.50% of the excess
Global Resources 1.00% of the first $250,000,000 and.50% of the excess
World Precious Minerals 1.00% of the first $250,000,000 and.50% of the excess
Gold and Precious Metals .75% of the first $250,000,000 and.50% of the excess
The new advisory agreement for the equity funds also provides for a base advisoryfee that will be adjusted upwards or downwards by 0.25 percent if there is aperformance difference of 5 percent or more between a fund’s performance andthat of its designated benchmark index over the prior rolling 12 months. Thisperformance fee will be effective October 1, 2009.
Effective October 1, 2008, administrative services that were part of the advisoryagreement were removed and became the subject of a separate agreement. Underthe new administrative services agreement, the Funds no longer reimburse theAdviser for certain legal and administrative services, but instead pay compensa-tion at an annual rate of 0.08 percent of the average daily net assets of each Fundfor administrative services provided.
Prior to October 1, 2008, Holmes Growth, Global MegaTrends, Eastern Europeanand Global Emerging Markets Funds had adopted a distribution plan pursuant toRule 12b-1 of the Investment Company Act of 1940 that allowed an annual fee ofup to 0.25% of its average net assets to be used for, or to reimburse the Adviserfor, expenditures in connection with sales and promotional services related to thedistribution of each Fund’s shares. A portion of this fee could be reallowed tosecurities dealers, banks and other financial institutions for the distribution ofshares and providing shareholder support services. Distribution expenses paid bythe Adviser or other third parties in prior periods that exceeded 0.25% of netassets could be paid by the Fund with distribution expenses accrued in current orfuture periods, so long as the 0.25% limitation was never exceeded. EffectiveOctober 1, 2008, all equity Funds in the Trust adopted a new distribution planwhich a subsidiary of the Adviser is paid a fee at an annual rate of 0.25% of theaverage daily net assets of each Fund.
The Adviser has agreed to reimburse specific funds so that their total operatingexpenses will not exceed certain annual percentages of average net assets. The
�173

Notes to Financial Statements December 31, 2008
expenses for the fiscal periods ended December 31, 2008, were limited as follows:U.S. Treasury Securities Cash Fund at 1.00%, U.S. Government Securities SavingsFund at 0.45%, Near-Term Tax Free Fund at 0.45%, Tax Free Fund at 0.70%, AllAmerican Equity Fund at 1.75%, Holmes Growth Fund at 1.75%, Global Mega-Trends Fund at 1.85% (effective May 12, 2008), Global Resources Fund, WorldPrecious Minerals Fund, and Gold and Precious Metals Funds at 1.50% (effectiveOctober 1, 2008), Eastern European Fund at 2.25% (effective October 1, 2008),Global Emerging Markets Fund at 2.50% (effective February 28, 2007) and ChinaRegion Fund at 2.00% (effective October 1, 2008). These contractual limitationscontinue through September 30, 2009; however, they may be revised at any timeby the Funds’ Board of Trustees.
As of March 19, 2008, the Adviser voluntarily agreed to waive fees and/orreimburse U.S. Treasury Securities Cash Fund and U.S. Government SecuritiesSavings Fund to the extent necessary to maintain the respective fund’s yield at acertain level as determined by the Adviser (Minimum Yield). The Adviser mayrecapture any fees waived and/or expenses reimbursed within three years after theend of the fiscal year of such waiver and/or reimbursement to the extent that suchrecapture would not cause the fund’s yield to fall below the Minimum Yield. Forthe period ended December 31, 2008, fees waived and/or expenses reimbursed as aresult of this agreement were $170,642 and $0 for the U.S. Treasury SecuritiesCash Fund and the U.S. Government Securities Savings Fund, respectively. Theseamounts are recoverable by the Adviser through December 31, 2011.
Prior to November 7, 2008, for the Eastern European Fund and Global EmergingMarkets Fund, the Adviser contracted with and compensated subadviserCharlemagne Capital (IOM) Limited to serve in the execution of the Adviser’sinvestment responsibilities. Effective November 7, 2008, the Adviser took overthe day-to-day management of both the Eastern European Fund and the GlobalEmerging Markets Fund. Charlemagne continues to provide non-discretionaryadvisory services to the Adviser, but is not responsible for the investment ormanagement of the funds’ assets.
Prior to October 1, 2007, Leeb Capital Management, Inc. provided subadvisoryservices to the MegaTrends Fund. On October 1, 2007, the Adviser assumedmanagement of the Fund, which was renamed Global MegaTrends Fund.
United Shareholder Services, Inc. (USSI), a wholly-owned subsidiary of theAdviser, is the transfer agent for the Funds. Each Fund pays an annual fee basedon the number of shareholder accounts, certain base fees and transaction- andactivity-based fees for transfer agency services. Certain account fees are paiddirectly by shareholders to the transfer agent, which, in turn, reduces its charge tothe Funds. The Adviser was reimbursed for in-house legal and internal administra-tion services pertaining to the Funds during the fiscal periods ended December 31,2008, in the amounts of $77,656 and $12,309, respectively. Effective October 1,
�174

Notes to Financial Statements December 31, 2008
2008, as noted above, the Funds no longer reimburse the Adviser for in-houselegal and administration services as those services are included in the administra-tive services agreement. The Adviser was reimbursed for services of the Funds’Chief Compliance Officer during the fiscal periods ended December 31, 2008, inthe amount of $54,995. The Funds will continue to reimburse the Adviser forcertain compliance services.
Brown Brothers Harriman & Co. (BBH) serves as the custodian, fund accountingand administration service agent with a fee structure based on average net assetsof the Funds, certain base fees and transaction-based fees.
The independent Trustees receive compensation for serving on the Board. Trust-ees serving as Chairman of the Board or a special committee or as a member of acommittee receive additional compensation. Trustees are also reimbursed for out-of-pocket expenses incurred while attending meetings. Frank E. Holmes receivesno compensation from the Funds for serving on the Board.
NOTE 3: INVESTMENTS
Cost of purchases and proceeds from sales of long-term securities for the periodended December 31, 2008, are summarized as follows:
Fund Purchases Sales
Near-Term Tax Free $ 1,067,784 $ 950,001Tax Free 1,041,616 1,855,517All American Equity 35,072,477 34,472,378Holmes Growth 11,827,893 5,059,203Global MegaTrends 8,785,865 5,343,676Global Resources 966,880,751 1,248,276,519World Precious Minerals 136,858,963 187,332,583Gold and Precious Metals 168,630,189 96,053,764Eastern European 42,122,201 36,873,446Global Emerging Markets 1,900,454 2,315,343China Region 56,916,726 68,668,800
U.S. Treasury Securities Cash and U.S. Government Securities Savings held onlyshort-term investments. The Funds neither purchased nor sold long-term U.S.government securities during the period.
Investments in foreign issuers as a percent of total investments at December 31,2008, were: 15.12% of All American Equity, 9.58% of Holmes Growth, 47.03% ofGlobal MegaTrends, 38.06% of Global Resources, 85.15% of World PreciousMinerals, 72.77% of Gold and Precious Metals, 95.61% of Eastern European,97.98% of Global Emerging Markets and 96.93% of China Region.
�175

Notes to Financial Statements December 31, 2008
NOTE 4: TAX INFORMATION
The following table presents the income tax basis of securities owned at December31, 2008, and the tax basis components of net unrealized appreciation(depreciation):
Gross Gross Net UnrealizedAggregate Unrealized Unrealized Appreciation/
Fund Tax Cost Appreciation Depreciation (Depreciation)
U.S. Treasury Securities Cash $121,721,773 $ — $ — $ —U.S. Government Securities Savings 357,973,782 — — —Near-Term Tax Free 13,706,867 319,733 (162,728) 157,005Tax Free 16,965,131 505,797 (725,995) (220,198)All American Equity 16,205,659 618,194 (1,282,504) (664,310)Holmes Growth 37,349,705 747,282 (7,384,859) (6,637,577)Global MegaTrends 26,831,131 831,438 (5,636,849) (4,805,411)Global Resources 764,233,452 21,030,929 (340,696,064) (319,665,135)World Precious Minerals 634,371,374 45,574,743 (320,329,407) (274,754,664)Gold and Precious Metals 219,949,871 23,907,049 (47,865,864) (23,958,815)Eastern European 740,294,896 4,193,053 (432,039,020) (427,845,967)Global Emerging Markets 19,127,378 160,704 (10,105,341) (9,944,637)China Region 39,056,399 2,663,855 (5,726,679) (3,062,824)
As of December 31, 2008, the components of distributable earnings on a tax basiswere as follows:
Undistributed Undistributed Undistributed Net UnrealizedTax-Exempt Ordinary Long-Term Appreciation
Fund Income Income Capital Gains (Depreciation)
U.S. Treasury Securities Cash $ — $ — $— $ —U.S. Government Securities Savings — 461,309 — —Near-Term Tax Free 11,456 9,769 — 157,005Tax Free 5,389 29,135 — (220,198)All American Equity — 97,543 — (664,310)Holmes Growth — — — (6,637,577)Global MegaTrends — — — (4,804,789)Global Resources — — — (319,696,142)World Precious Minerals — — — (274,773,868)Gold and Precious Metals — — — (24,012,612)Eastern European — — — (427,838,457)Global Emerging Markets — — — (9,944,916)China Region — — — (3,169,172)
The differences between book-basis and tax-basis unrealized appreciation (depre-ciation) for All American Equity, Holmes Growth, Global MegaTrends, GlobalResources, World Precious Minerals, Gold and Precious Metals, Eastern Euro-pean, Global Emerging Markets and China Region Funds are attributable primar-ily to the tax deferral of losses on wash sales, investment in passive foreigninvestment companies (PFIC), forwards marked to markets, unreversed return ofcapital in Canadian Trusts, adjustments for partnerships, tax straddle loss deferralson written options, and adjustments for grantor trusts.
�176

Notes to Financial Statements December 31, 2008
Reclassifications are made to the Funds’ capital accounts to reflect income andgains available for distribution (or available capital loss carryovers) under incometax regulations. For the period ended December 31, 2008, the Funds recorded thefollowing reclassifications to increase (decrease) the accounts listed below:
Accumulated Net Accumulated Net Paid-inFund Investment Income Realized Gain Capital
U.S. Treasury Securities Cash $ 630 $ — $ (630)U.S. Government Securities Savings 58,028 (58,028) —Near-Term Tax Free — 59,454 (59,454)Tax Free — 234,550 (234,550)All American Equity — — —Holmes Growth 14,866 24,293,638 (24,308,504)Global MegaTrends 33,563 (167) (33,396)Global Resources 41,408,717 (34,934,009) (6,474,708)World Precious Minerals 40,877,286 (20,021,016) (20,856,270)Gold and Precious Metals 211,203 (1,403,245) 1,192,042Eastern European 1,757,983 683,630 (2,441,613)Global Emerging Markets 167,455 306 (167,761)China Region 1,316,839 (560,383) (756,456)
The tax character of distributions paid during the fiscal period ended December31, 2008, were as follows:
Tax-Exempt Ordinary Long-Term Tax ReturnFund Income Income Capital Gains of Capital Total
U.S. Treasury Securities Cash $ — $ 259,483 $ — $ — $ 259,483U.S. Government Securities
Savings — 2,801,889 — — 2,801,889Near-Term Tax Free 183,663 39,343 — — 223,006Tax Free 324,296 31,085 — — 355,381All American Equity — 6,594 — — 6,594Holmes Growth — — — — —Global MegaTrends — — — 25,988 25,988Global Resources — 10,465,142 85,843,436 — 96,308,578World Precious Minerals — — 61,845,712 — 61,845,712Gold and Precious Metals — 5,098,335 6,520,755 — 11,619,090Eastern European — — — — —Global Emerging Markets — — — 147,530 147,530China Region — — — — —
�177
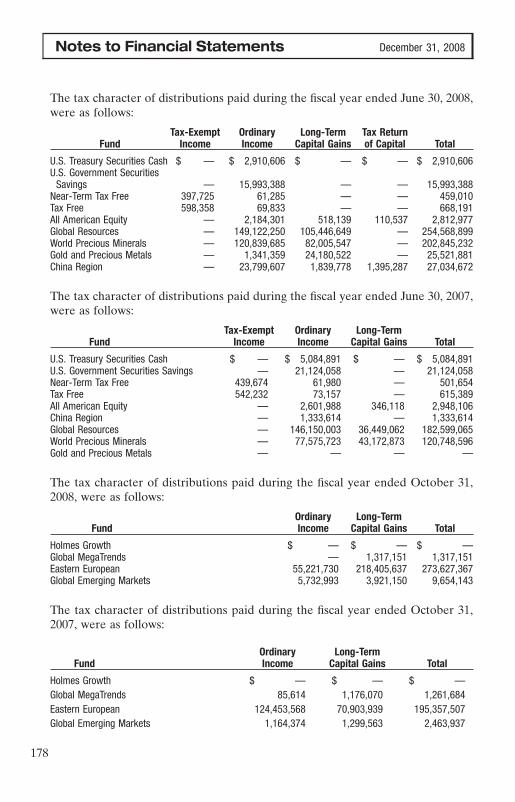
Notes to Financial Statements December 31, 2008
The tax character of distributions paid during the fiscal year ended June 30, 2008,were as follows:
Tax-Exempt Ordinary Long-Term Tax ReturnFund Income Income Capital Gains of Capital Total
U.S. Treasury Securities Cash $ — $ 2,910,606 $ — $ — $ 2,910,606U.S. Government Securities
Savings — 15,993,388 — — 15,993,388Near-Term Tax Free 397,725 61,285 — — 459,010Tax Free 598,358 69,833 — — 668,191All American Equity — 2,184,301 518,139 110,537 2,812,977Global Resources — 149,122,250 105,446,649 — 254,568,899World Precious Minerals — 120,839,685 82,005,547 — 202,845,232Gold and Precious Metals — 1,341,359 24,180,522 — 25,521,881China Region — 23,799,607 1,839,778 1,395,287 27,034,672
The tax character of distributions paid during the fiscal year ended June 30, 2007,were as follows:
Tax-Exempt Ordinary Long-TermFund Income Income Capital Gains Total
U.S. Treasury Securities Cash $ — $ 5,084,891 $ — $ 5,084,891U.S. Government Securities Savings — 21,124,058 — 21,124,058Near-Term Tax Free 439,674 61,980 — 501,654Tax Free 542,232 73,157 — 615,389All American Equity — 2,601,988 346,118 2,948,106China Region — 1,333,614 — 1,333,614Global Resources — 146,150,003 36,449,062 182,599,065World Precious Minerals — 77,575,723 43,172,873 120,748,596Gold and Precious Metals — — — —
The tax character of distributions paid during the fiscal year ended October 31,2008, were as follows:
Ordinary Long-TermFund Income Capital Gains Total
Holmes Growth $ — $ — $ —Global MegaTrends — 1,317,151 1,317,151Eastern European 55,221,730 218,405,637 273,627,367Global Emerging Markets 5,732,993 3,921,150 9,654,143
The tax character of distributions paid during the fiscal year ended October 31,2007, were as follows:
Ordinary Long-TermFund Income Capital Gains Total
Holmes Growth $ — $ — $ —Global MegaTrends 85,614 1,176,070 1,261,684Eastern European 124,453,568 70,903,939 195,357,507Global Emerging Markets 1,164,374 1,299,563 2,463,937
�178

Notes to Financial Statements December 31, 2008
Net realized capital loss carryforwards, for federal income tax purposes, may beused to offset current or future capital gains until expiration. The Funds’ tax-basiscapital gains and losses are determined only at the end of each fiscal year. The losscarryforwards and related expiration dates for each fund, as of December 31, 2008,are as follows:
Expiration DateFund 2009 2010 2011 2012
U.S. Treasury Securities Cash $ — $285 $ — $ —U.S. Government Securities Savings — — — —Near-Term Tax Free — — 46,218 33,686Tax Free — — 90,567 421,236All American Equity — — — —Holmes Growth 1,040,063 — — —Global MegaTrends — — — —Global Resources — — — —World Precious Minerals — — — —Gold and Precious Metals — — — —Eastern European — — — —Global Emerging Markets — — — —China Region — — — —
Expiration DateFund 2013 2014 2015 2016 Total
U.S. Treasury Securities Cash $ — $ — $ — $ — $ 285U.S. Government Securities Savings — — — — —Near-Term Tax Free 2,760 202,719 2,488 112 287,983Tax Free — — — 10,697 522,500All American Equity — — — 3,188,188 3,188,188Holmes Growth — — 2,281,824 2,830,320 6,152,207Global MegaTrends — — 8,605,703 5,994,166 14,599,869Global Resources — — — 174,188,308 174,188,308World Precious Minerals — — — 43,534,505 43,534,505Gold and Precious Metals — — — 18,951,332 18,951,332Eastern European — — — 83,605,572 83,605,572Global Emerging Markets — — 4,262,898 2,965,929 7,228,827China Region — — — 24,694,256 24,694,256
Post October 31, 2008 Post October 31, 2008Fund Capital Loss Deferral Currency Loss Deferral
All American Equity $ 1,988,625 $ —Global Resources 252,675,661 70,839World Precious Minerals 65,086,087 162,947Gold & Precious Metals 21,778,685 15,605China Region 6,793,201 —
The above amounts, in accordance with tax rules, are deemed to have occurred onJanuary 1, 2009.
�179

Notes to Financial Statements December 31, 2008
NOTE 5: RISKS OF CONCENTRATIONS
The investment policies of the World Precious Minerals and Gold and PreciousMetals Funds present unique risks to their respective portfolios’ values. The pricesof gold and other precious metals may be subject to fluctuations caused byinternational monetary and political developments including trade or currencyrestrictions, currency devaluation and revaluation, and social and political condi-tions within a country. Fluctuations in the prices of gold and other precious metalswill affect the market values of the securities held by these funds.
The Eastern European and Global Emerging Markets Funds may be exposed torisks not typically associated with investment in the United States due to theirconcentration of investments in emerging markets. These risks include possiblerevaluation of currencies, less public information about companies, disruptivepolitical or economic conditions and the possible imposition of adverse govern-mental laws or currency exchange restrictions. Moreover, securities of manyforeign issuers and their markets may be less liquid and their prices more volatilethan those securities of comparable U.S. issuers.
The China Region Fund may be exposed to risks not typically associated withinvestments in the United States, due to concentration of investments in foreignissuers in the region. These investments present risks resulting from disruptivepolitical or economic conditions and the potential imposition of adverse govern-mental laws or currency exchange restrictions affecting the area.
NOTE 6: CREDIT ARRANGEMENTS
Each of the Funds, along with other funds under common management, has arevolving credit facility with BBH. Borrowings of each Fund are collateralized byany or all of the securities held by BBH as the Fund’s custodian up to the amountof the borrowing. Interest on borrowings is charged at the current overnightFederal Funds Rate plus 2%. Each Fund has a maximum borrowing limit of 10%of qualified assets. The aggregate of borrowings by all Funds under the agreementcannot exceed $30,000,000 at any one time. There were no borrowings under therevolving credit facility during the period ended December 31, 2008. The U.S.Global Investors Funds paid BBH a total of $17,188 in commitment fees duringthe period ended December 31, 2008, under this arrangement.
NOTE 7: SHARES OF BENEFICIAL INTEREST
At December 31, 2008, individual shareholders holding more than 5% of out-standing shares comprised 6.85% and 16.47% of the Near-Term Tax Free Fundand Tax Free Fund, respectively. In addition, the Adviser held 10.59% and 9.33%of the Near-Term Tax Free Fund and Tax Free Fund, respectively. Control isdefined by the 1940 Act as the beneficial ownership, either directly or through oneor more controlled companies, of more than 25% of the voting securities of a
�180

Notes to Financial Statements December 31, 2008
company. Investment activities of these shareholders could have a material impacton the Funds.
NOTE 8: EASTERN EUROPEAN FUND STOCK SPLIT
Effective as of May 27, 2008, the Eastern European Fund instituted a 3-for-1 stocksplit. All capital share activity and per share data for Eastern European Fund forthe previous periods presented in these financial statements has been adjusted toreflect the stock split.
NOTE 9: PARTICIPATION IN FEDERAL MONEY MARKET FUNDPROGRAM
Effective October 8, 2008, the U.S. Treasury Securities Fund and U.S. Govern-ment Securities Savings Fund agreed to participate in the U.S. Treasury Guaran-tee Program for Money Market Funds (the Program). The Program is designed toguarantee to investors in participating money market funds that they receive $1.00for each money market fund share held as of the close of business on September19, 2008. The Program does not cover any increase in the number of fund sharesheld in an account or any new purchases of fund shares after the close of businesson September 19, 2008. The guarantee will be triggered if the fund’s net assetvalue per share falls below $0.995 – what is commonly referred to as ‘‘breaking thebuck’’ – and the fund liquidates. U.S. Treasury Securities Cash Fund and U.S.Government Securities Savings Fund paid $11,320 and $42,788, respectively, toparticipate in the Program. The cost for the Funds to participate is without regardto any expense limitations in effect. The initial term of the Program ended onDecember 18, 2008, and the Funds did not extend their participation.
�181

Financial Highlights
U.S. TREASURY SECURITIES CASH FUND
For a capital share outstanding during the
Six MonthsEnded
Year Ended June 30,December 31,2008 2008 2007 2006 2005 2004
Net asset value, beginning of period $1.00 $1.00 $1.00 $1.00 $1.00 $1.00
Investment ActivitiesNet investment income —(a) .02 .04 .03 .01 —(a)Net realized and unrealized gain — — — — — —
Total from investment activities —(a) .02 .04 .03 .01 —(a)
Distributions from net investment income —(a) (.02) (.04) (.03) (.01) —(a)
Net asset value, end of period $1.00 $1.00 $1.00 $1.00 $1.00 $1.00
Total Return (excluding account fees) (b) .23% 2.46% 4.36% 3.11% 1.12% .08%Ratios to Average Net Assets: (c)
Net investment income .44% 2.43% 4.27% 3.06% 1.11% .07%Total expenses 1.11% 1.09% .91% .92% .97% 1.00%Expenses reimbursed (d) (.38)% (.09)% (.02)% — — (.04)%Net recouped fees (e) — —(g) — .03% — —Net expenses (f) .73% 1.00% .89% .95% .97% .96%
Net assets, end of period (in thousands) $121,410 $111,955 $116,012 $119,028 $124,058 $112,575
(a) The per share amount does not round to a full penny.
(b) Total returns for periods less than one year are not annualized. Assumes investment at the net asset value at thebeginning of the period, reinvestment of all distributions and a complete redemption of the investment at the net assetvalue at the end of the period.
(c) Ratios are annualized for periods of less than one year.
(d) Expenses reimbursed reflect reductions to total expenses, as discussed in the notes to the financial statements. Theseamounts would decrease the net investment income ratio had such reductions not occurred.
(e) During the year ended June 30, 2004, the Adviser waived fees and/or reimbursed expenses as a result of a MinimumYield Agreement in the amount of $45,136. As allowed by the recapture provision of this agreement, the U.S. TreasurySecurities Cash Fund reimbursed the Adviser the previously waived amount of $45,136 during the year ended June30, 2006. During the year ended June 30, 2008, the Adviser waived fees and/or reimbursed expenses under theMinimum Yield Agreement in the amount of $4,259. The Fund reimbursed the Adviser the $4,259 during the yearended June 30, 2008. During the six months ended December 31, 2008, the Adviser waived fees and/or reimbursedexpenses under the Minimum Yield Agreement in the amount of $170,642.
(f) The net expense ratios shown above reflect expenses after reimbursements but exclude the effect of reductions tototal expenses for any expenses offset. Expense offset arrangements reduce total expenses, as discussed in thenotes to the financial statements. These amounts would decrease the net investment income ratio had suchreductions not occurred. The effect of expenses offset are as follows:
Six MonthsEnded
Year Ended June 30,December 31,2008 2008 2007 2006 2005 2004
Ratios to Average Net Assets (c):Expenses offset (g) — — — — — —
(g) Effect on the expense ratio was not greater than 0.005%.
See accompanying notes to financial statements.
�182

Financial Highlights
U.S. GOVERNMENT SECURITIES SAVINGS FUND
For a capital share outstanding during the
Six MonthsEnded
Year Ended June 30,December 31,2008 2008 2007 2006 2005 2004
Net asset value, beginning of period $1.00 $1.00 $1.00 $1.00 $1.00 $1.00
Investment ActivitiesNet investment income .01 .03 .05 .04 .02 .01Net realized and unrealized gain —(a) —(a) —(a) — — —
Total from investment activities .01 .03 .05 .04 .02 .01
Distributions from net investment income (.01) (.03) (.05) (.04) (.02) (.01)
Net asset value, end of period $1.00 $1.00 $1.00 $1.00 $1.00 $1.00
Total Return (excluding account fees) (b) .67% 3.47% 4.86% 3.69% 1.70% .63%Ratios to Average Net Assets: (c)
Net investment income 1.36% 3.42% 4.75% 3.64% 1.67% .61%Total expenses .73% .65% .62% .64% .65% .65%Expenses reimbursed (d) (.26)% (.20)% (.17)% (.19)% (.20)% (.20)%Net expenses (e) .47%(g) .45% .45% .45% .45% .45%
Net assets, end of period (in thousands) $357,910 $446,208 $469,095 $435,417 $411,979 $441,722
(a) The per share amount does not round to a full penny.
(b) Total returns for periods less than one year are not annualized. Assumes investment at the net asset value at thebeginning of the period, reinvestment of all distributions and a complete redemption of the investment at the net assetvalue at the end of the period.
(c) Ratios are annualized for periods of less than one year.
(d) Expenses reimbursed reflect reductions to total expenses, as discussed in the notes to the financial statements. Theseamounts would decrease the net investment income ratio had such reductions not occurred.
(e) The net expense ratios shown above reflect expenses after reimbursements but exclude the effect of reductions tototal expenses for any expenses offset. Expense offset arrangements reduce total expenses, as discussed in thenotes to the financial statements. These amounts would decrease the net investment income ratio had suchreductions not occurred. The effect of expenses offset are as follows:
Six MonthsEnded
Year Ended June 30,December 31,2008 2008 2007 2006 2005 2004
Ratios to Average Net Assets (c):Expenses offset (f) — — — — — —
(f) Effect on the expense ratio was not greater than 0.005%.
(g) The annualized net expense ratio for the six months ended December 31, 2008, exceeded the limitation for the perioddue to the cost of participating in the U.S. Treasury Guarantee Program for Money Market Funds (see Note 9 to thefinancial statements). The cost to participate was without regard to the expense limitation.
See accompanying notes to financial statements.
�183

Financial Highlights
NEAR-TERM TAX FREE FUND
For a capital share outstanding during the
Six MonthsEnded
Year Ended June 30,December 31,2008 2008 2007 2006 2005* 2004*
Net asset value, beginning of period $2.14 $2.12 $2.12 $2.17 $2.17 $2.23
Investment ActivitiesNet investment income .03 .07 .07 .07 .07 .06Net realized and unrealized gain (loss) .02 .02 —(a) (.05) (.01) (.06)
Total from investment activities .05 .09 .07 .02 .06 .00
Distributions from net investment income (.03) (.07) (.07) (.07) (.06) (.06)
Net asset value, end of period $2.16 $2.14 $2.12 $2.12 $2.17 $2.17
Total Return (excluding account fees) (b) 2.55% 4.42% 3.51% .75% 2.75% .20%Ratios to Average Net Assets: (c)
Net investment income 3.15% 3.41% 3.43% 3.08% 2.79% 2.73%Total expenses 1.82% 1.91% 1.63% 1.54% 1.49% 1.25%Expenses reimbursed (d) (1.37)% (1.46)% (1.18)% (1.09)% (1.04)% (.80)%Net expenses (e) .45% .45% .45% .45% .45% .45%
Portfolio turnover rate 8% 8% 22% 33% 5% 21%
Net assets, end of period (in thousands) $13,989 $13,603 $13,383 $15,830 $18,706 $18,673
* The values shown for Near-Term Tax Free Fund prior periods have been adjusted to reflect the 5-for-1 stock split,which was effective on January 3, 2005.
(a) The per share amount does not round to a full penny.
(b) Total returns for periods less than one year are not annualized. Assumes investment at the net asset value at thebeginning of the period, reinvestment of all distributions and a complete redemption of the investment at the net assetvalue at the end of the period.
(c) Ratios are annualized for periods of less than one year.
(d) Expenses reimbursed reflect reductions to total expenses, as discussed in the notes to the financial statements. Theseamounts would decrease the net investment income ratio had such reductions not occurred.
(e) The net expense ratios shown above reflect expenses after reimbursements but exclude the effect of reductions tototal expenses for any expenses offset. Expense offset arrangements reduce total expenses, as discussed in thenotes to the financial statements. These amounts would decrease the net investment income ratio had suchreductions not occurred. The effect of expenses offset are as follows:
Six MonthsEnded
Year Ended June 30,December 31,2008 2008 2007 2006 2005 2004
Ratios to Average Net Assets (c):Expenses offset (f) — — — — — —
(f) Effect on the expense ratio was not greater than 0.005%.
See accompanying notes to financial statements.
�184

Financial Highlights
TAX FREE FUND
For a capital share outstanding during the
Six MonthsEnded
Year Ended June 30,December 31,2008 2008 2007 2006 2005 2004
Net asset value, beginning of period $11.93 $11.98 $11.98 $12.33 $12.08 $12.65
Investment ActivitiesNet investment income .23 .47 .50 .52 .44 .43Net realized and unrealized gain (loss) (.21) (.05) —(a) (.36) .25 (.58)
Total from investment activities .02 .42 .50 .16 .69 (.15)
Distributions from net investment income (.23) (.47) (.50) (.51) (.44) (.42)
Net asset value, end of period $11.72 $11.93 $11.98 $11.98 $12.33 $12.08
Total Return (excluding account fees) (b) .22% 3.54% 4.15% 1.30% 5.78% (1.25)%Ratios to Average Net Assets: (c)
Net investment income 3.92% 3.91% 4.09% 4.01% 3.50% 3.22%Total expenses 1.91% 1.94% 1.86% 1.69% 1.47% 1.09%Expenses reimbursed (d) (1.21)% (1.24)% (1.16)% (.99)% (.77)% (.39)%Net expenses (e) .70% .70% .70% .70% .70% .70%
Portfolio turnover rate 6% 11% 6% 19% 40% 54%
Net assets, end of period (in thousands) $16,946 $18,380 $15,940 $14,992 $22,433 $28,167
(a) The per share amount does not round to a full penny.
(b) Total returns for periods less than one year are not annualized. Assumes investment at the net asset value at thebeginning of the period, reinvestment of all distributions and a complete redemption of the investment at the net assetvalue at the end of the period.
(c) Ratios are annualized for periods of less than one year.
(d) Expenses reimbursed reflect reductions to total expenses, as discussed in the notes to the financial statements. Theseamounts would decrease the net investment income ratio had such reductions not occurred.
(e) The net expense ratios shown above reflect expenses after reimbursements but exclude the effect of reductions tototal expenses for any expenses offset. Expense offset arrangements reduce total expenses, as discussed in thenotes to the financial statements. These amounts would decrease the net investment income ratio had suchreductions not occurred. The effect of expenses offset are as follows:
Six MonthsEnded
Year Ended June 30,December 31,2008 2008 2007 2006 2005 2004
Ratios to Average Net Assets (c):Expenses offset (f) — — — — — —
(f) Effect on the expense ratio was not greater than 0.005%.
See accompanying notes to financial statements.
�185

Financial Highlights
ALL AMERICAN EQUITY FUND
For a capital share outstanding during the
Six MonthsEnded
Year Ended June 30,December 31,2008 2008 2007 2006 2005 2004
Net asset value, beginning of period $27.27 $28.58 $27.59 $24.47 $22.53 $19.15
Investment ActivitiesNet investment gain (loss) .04 (.15) (.08) (.18) (.02) (.11)Net realized and unrealized gain (loss) (9.97) 1.98 4.94 3.89 1.96 3.49
Total from investment activities (9.93) 1.83 4.86 3.71 1.94 3.38
DistributionsFrom net realized gains (.01) (3.01) (3.87) (.59) — —From tax return of capital — (.13) — — — —
Total distributions (.01) (3.14) (3.87) (.59) — —
Short-Term Trading Fees * (a) — — — — — —
Net asset value, end of period $17.33 $27.27 $28.58 $27.59 $24.47 $22.53
Total Return (excluding account fees) (b) (36.42)% 5.99% 19.59% 15.25% 8.61% 17.65%Ratios to Average Net Assets: (c)
Net investment income (loss) .35% (.55)% (.28)% (.67)% (.09)% (.49)%Total expenses 2.37% 1.98% 2.01% 2.20% 2.44% 2.31%Expenses reimbursed (d) (.62)% (.23)% (.26)% (.44)% (.69)% (.56)%Net expenses (e) 1.75% 1.75% 1.75% 1.76% 1.75% 1.75%
Portfolio turnover rate 205% 225% 223% 369% 262% 96%
Net assets, end of period (in thousands) $16,234 $26,513 $23,479 $21,547 $19,253 $19,974
* Based on average monthly shares outstanding.
(a) The per share amount does not round to a full penny.
(b) Total returns for periods less than one year are not annualized. Assumes investment at the net asset value at thebeginning of the period, reinvestment of all distributions and a complete redemption of the investment at the net assetvalue at the end of the period.
(c) Ratios are annualized for periods of less than one year.
(d) Expenses reimbursed reflect reductions to total expenses, as discussed in the notes to the financial statements. Theseamounts would increase the net investment loss ratio or decrease the net investment income ratio, as applicable, hadsuch reductions not occurred.
(e) The net expense ratios shown above reflect expenses after reimbursements but exclude the effect of reductions tototal expenses for any expenses offset. Expense offset arrangements reduce total expenses, as discussed in thenotes to the financial statements. These amounts would increase the net investment loss ratio, or decrease the netinvestment income ratio, as applicable, had such reductions not occurred. The effect of expenses offset are asfollows:
Six MonthsEnded
Year Ended June 30,December 31,2008 2008 2007 2006 2005 2004
Ratios to Average Net Assets (c):Expenses offset —(f) —(f) —(f) (0.01)% —(f) —(f)
(f) Effect on the expense ratio was not greater than 0.005%.
See accompanying notes to financial statements.
�186

Financial Highlights
HOLMES GROWTH FUND
For a capital share outstanding during the
Two MonthsEnded
Year Ended October 31,December 31,2008 2008 2007 2006 2005 2004**
Net asset value, beginning of period $14.14 $24.78 $18.34 $16.56 $14.38 $13.55
Investment ActivitiesNet investment loss (.01) (.15) (.14) (.14) (.18) (.19)Net realized and unrealized gain (loss) (1.34) (10.49) 6.58 1.92 2.36 1.01
Total from investment activities (1.35) (10.64) 6.44 1.78 2.18 .82
Distributions — — — — — —
Short-Term Trading Fees * —(a) —(a) —(a) —(a) —(a) .01
Net asset value, end of period $12.79 $14.14 $24.78 $18.34 $16.56 $14.38
Total Return (excluding account fees) (b) (9.55)% (42.94)% 35.11% 10.75% 15.16% 6.13%Ratios to Average Net Assets: (c)
Net investment loss (.27)% (.65)% (.62)% (.69)% (.98)% (1.15)%Total expenses 2.51% 1.74% 1.72% 1.74% 1.83% 1.82%Expenses reimbursed (d) (.76)% — — — — —Net expenses (e) 1.75% 1.74% 1.72% 1.74% 1.83% 1.82%
Portfolio turnover rate 20% 140% 98% 290% 268% 192%
Net assets, end of period (in thousands) $32,488 $36,231 $68,881 $61,810 $65,065 $67,074
* Based on average monthly shares outstanding.
** Effective June 1, 2004, U.S. Global Investors, Inc. assumed management of Holmes Growth Fund from the formersubadviser.
(a) The per share amount does not round to a full penny.
(b) Total returns for periods less than one year are not annualized. Assumes investment at the net asset value at thebeginning of the period, reinvestment of all distributions and a complete redemption of the investment at the net assetvalue at the end of the period.
(c) Ratios are annualized for periods of less than one year.
(d) Expenses reimbursed reflect reductions to total expenses, as discussed in the notes to the financial statements. Theseamounts would increase the net investment loss ratio or decrease the net investment income ratio, as applicable, hadsuch reductions not occurred.
(e) The expense ratios shown above exclude the effect of reductions to total expenses for any expenses offset. Expenseoffset arrangements reduce total expenses, as discussed in the notes to financial statements. These amounts wouldincrease the net investment loss ratio, or decrease the net investment income ratio, as applicable, had such reductionsnot occurred. The effect of expenses offset are as follows:
Two MonthsEnded
Year Ended October 31,December 31,2008 2008 2007 2006 2005 2004
Ratios to Average Net Assets (c):Expenses offset —(f) —(f) —(f) (0.01)% —(f) —
(f) Effect on the expense ratio was not greater than 0.005%.
See accompanying notes to financial statements.
�187

Financial Highlights
GLOBAL MEGATRENDS FUND
For a capital share outstanding during the
Two MonthsEnded
Year Ended October 31,December 31,2008 2008 2007** 2006 2005 2004
Net asset value, beginning of period $6.60 $12.75 $11.07 $10.30 $9.20 $8.25
Investment ActivitiesNet investment loss —(a) —(a) (.11) (.10) (.14) (.17)Net realized and unrealized gain (loss) (.31) (5.30) 2.63 1.18 1.24 1.24
Total from investment activities (.31) (5.30) 2.52 1.08 1.10 1.07
DistributionsFrom net investment income — — — — — (.12)From net realized gains — (.85) (.84) (.31) — —From tax return of capital (.01) — — — — —
Total distributions (.01) (.85) (.84) (.31) — (.12)
Short-Term Trading Fees * (a) — — — — — —
Net asset value, end of period $6.28 $6.60 $12.75 $11.07 $10.30 $9.20
Total Return (excluding account fees) (b) (4.74)% (44.50)% 24.49% 10.53% 11.96% 13.01%Ratios to Average Net Assets: (c)
Net investment loss (.20)% (.06)% (.93)% (.89)% (1.37)% (1.77)%Total expenses 2.96% 2.21% 2.49% 2.55% 2.83% 2.83%Expenses reimbursed (d) (1.11)% (.21)% — — — —Net expenses (e) 1.85% 2.00% 2.49% 2.55% 2.83% 2.83%
Portfolio turnover rate 29% 92% 65% 75% 54% 64%
Net assets, end of period (in thousands) $22,035 $25,387 $17,723 $17,077 $14,276 $13,239
* Based on average monthly shares outstanding.
** Effective October 1, 2007, U.S. Global Investors, Inc. assumed management of Global MegaTrends Fund from theformer subadviser.
(a) The per share amount does not round to a full penny.
(b) Total returns for periods less than one year are not annualized. Assumes investment at the net asset value at thebeginning of the period, reinvestment of all distributions and a complete redemption of the investment at the net assetvalue at the end of the period.
(c) Ratios are annualized for periods of less than one year.
(d) Expenses reimbursed reflect reductions to total expenses, as discussed in the notes to the financial statements. Theseamounts would increase the net investment loss ratio or decrease the net investment income ratio, as applicable, hadsuch reductions not occurred.
(e) The expense ratios shown above exclude the effect of reductions to total expenses for any expenses offset. Expenseoffset arrangements reduce total expenses, as discussed in the notes to financial statements. These amounts wouldincrease the net investment loss ratio, or decrease the net investment income ratio, as applicable, had such reductionsnot occurred. The effect of expenses offset are as follows:
Two MonthsEnded
Year Ended October 31,December 31,2008 2008 2007 2006 2005 2004
Ratios to Average Net Assets (c):Expenses offset (f) — — — — — —
(f) Effect on the expense ratio was not greater than 0.005%.
See accompanying notes to financial statements.
�188

Financial Highlights
GLOBAL RESOURCES FUND
For a capital share outstanding during the
Six MonthsEnded
Year Ended June 30,December 31,2008 2008 2007 2006 2005 2004
Net asset value, beginning ofperiod $20.52 $17.70 $17.22 $12.67 $8.39 $5.14
Investment ActivitiesNet investment income (loss) (.02)* .05* .21 .29 .25 .12Net realized and unrealized
gain (loss) (13.92)* 5.86* 2.86 5.63 4.67 3.26
Total from investment activities (13.94) 5.91 3.07 5.92 4.92 3.38
DistributionsFrom net investment income — (.95) (.88) (.32) (.34) (.13)From net realized gains (1.32) (2.14) (1.71) (1.05) (.30) —
Total distributions (1.32) (3.09) (2.59) (1.37) (.64) (.13)
Short-Term Trading Fees * (a) — — — — — —
Net asset value, end of period $5.26 $20.52 $17.70 $17.22 $12.67 $8.39
Total Return (excluding accountfees) (b) (67.70)% 37.59% 20.94% 48.91% 60.21% 65.73%
Ratios to Average Net Assets: (c)Net investment income (loss) (.34)% .28% .74% 1.07% .91% .74%Total expenses 1.20% .88% .95% .96% 1.30% 1.54%Expenses reimbursed (d) (.12)% — — — — —Net expenses (e) 1.08% .88% .95% .96% 1.30% 1.54%
Portfolio turnover rate 100% 133% 122% 157% 116% 140%
Net assets, end of period(in thousands) $464,524 $2,010,581 $1,383,250 $1,281,664 $488,183 $135,574
* Based on average monthly shares outstanding.
(a) The per share amount does not round to a full penny.
(b) Total returns for periods less than one year are not annualized. Assumes investment at the net asset value at thebeginning of the period, reinvestment of all distributions and a complete redemption of the investment at the net assetvalue at the end of the period.
(c) Ratios are annualized for periods of less than one year.
(d) Expenses reimbursed reflect reductions to total expenses, as discussed in the notes to the financial statements. Theseamounts would increase the net investment loss ratio or decrease the net investment income ratio, as applicable, hadsuch reductions not occurred.
(e) The net expense ratios shown above reflect expenses after reimbursements but exclude the effect of reductions tototal expenses for any expenses offset. Expense offset arrangements reduce total expenses, as discussed in thenotes to the financial statements. These amounts would increase the net investment loss ratio, or decrease the netinvestment income ratio, as applicable, had such reductions not occurred. The effect of expenses offset are asfollows:
Six MonthsEnded
Year Ended June 30,December 31,2008 2008 2007 2006 2005 2004
Ratios to Average Net Assets (c):Expenses offset —(f) (0.01)% (0.01)% (0.01)% —(f) —(f)
(f) Effect on the expense ratio was not greater than 0.005%.
See accompanying notes to financial statements.
�189

Financial Highlights
WORLD PRECIOUS MINERALS FUND
For a capital share outstanding during the
Six MonthsEnded
Year Ended June 30,December 31,2008 2008 2007 2006 2005 2004
Net asset value, beginning of period $25.32 $28.34 $28.86 $15.50 $13.68 $9.75
Investment ActivitiesNet investment income (loss) (.06)* (.13)* —* .72 (.22) (.17)*Net realized and unrealized gain (loss) (13.65)* 3.70* 3.02 13.62 2.42 5.85
Total from investment activities (13.71) 3.57 3.02 14.34 2.20 5.68
DistributionsFrom net investment income — (3.25) (1.52) (.67) (.46) (1.86)From net realized gains (2.05) (3.35) (2.04) (.37) — —
Total distributions (2.05) (6.60) (3.56) (1.04) (.46) (1.86)
Short-Term Trading Fees * —(a) .01 .02 .06 .08 .11
Net asset value, end of period $9.56 $25.32 $28.34 $28.86 $15.50 $13.68
Total Return (excluding account fees) (b) (51.23)% 14.14% 11.48% 96.21% 16.50% 57.42%Ratios to Average Net Assets: (c)
Net investment income (loss) (.80)% (.43)% .06% .05% (1.01)% (1.15)%Total expenses 1.36% .97% .99% 1.13% 1.48% 1.47%Expenses reimbursed (d) (.11)% — — — — —Net expenses (e) 1.25% .97% .99% 1.13% 1.48% 1.47%
Portfolio turnover rate 27% 58% 54% 66% 55% 65%
Net assets, end of period (in thousands) $359,120 $949,014 $923,779 $920,249 $268,312 $246,852
* Based on average monthly shares outstanding.
(a) The per share amount does not round to a full penny.
(b) Total returns for periods less than one year are not annualized. Assumes investment at the net asset value at thebeginning of the period, reinvestment of all distributions and a complete redemption of the investment at the net assetvalue at the end of the period.
(c) Ratios are annualized for periods of less than one year.
(d) Expenses reimbursed reflect reductions to total expenses, as discussed in the notes to the financial statements. Theseamounts would increase the net investment loss ratio or decrease the net investment income ratio, as applicable, hadsuch reductions not occurred.
(e) The net expense ratios shown above reflect expenses after reimbursements but exclude the effect of reductions tototal expenses for any expenses offset. Expense offset arrangements reduce total expenses, as discussed in thenotes to the financial statements. These amounts would increase the net investment loss ratio, or decrease the netinvestment income ratio, as applicable, had such reductions not occurred. The effect of expenses offset are asfollows:
Six MonthsEnded
Year Ended June 30,December 31,2008 2008 2007 2006 2005 2004
Ratios to Average Net Assets (c):Expenses offset (f) — — — — — —
(f) Effect on the expense ratio was not greater than 0.005%.
See accompanying notes to financial statements.
�190

Financial Highlights
GOLD AND PRECIOUS METALS FUND
For a capital share outstanding during the
Six MonthsEnded
Year Ended June 30,December 31,2008 2008 2007 2006 2005 2004
Net asset value, beginning of period $17.18 $14.99 $15.48 $7.67 $7.00 $5.18
Investment ActivitiesNet investment income (loss) (.03) (.08)* .05 (.01)* (.11) (.10)Net realized and unrealized gain (loss) (5.59) 4.69 (.56) 7.88 .79 1.91
Total from investment activities (5.62) 4.61 (.51) 7.87 .68 1.81
Distributions from net realized gains (.73) (2.43) — (.12) (.05) (.03)Short-Term Trading Fees * —(a) .01 .02 .06 .04 .04
Net asset value, end of period $10.83 $17.18 $14.99 $15.48 $7.67 $7.00
Total Return (excluding account fees) (b) (31.51)% 33.49% (3.17)% 104.15% 10.19% 35.57%Ratios to Average Net Assets: (c)
Net investment income (loss) (.66)% (.41)% .31% (.06)% (1.13)% (1.45)%Total expenses 1.54% 1.27% 1.29% 1.47% 1.97% 1.93%Expenses reimbursed (d) (.15)% — — — — —Net expenses (e) 1.39% 1.27% 1.29% 1.47% 1.97% 1.93%
Portfolio turnover rate 61% 93% 72% 78% 66% 85%
Net assets, end of period (in thousands) $192,206 $259,022 $178,762 $208,027 $63,816 $66,732
* Based on average monthly shares outstanding.
(a) The per share amount does not round to a full penny.
(b) Total returns for periods less than one year are not annualized. Assumes investment at the net asset value at thebeginning of the period, reinvestment of all distributions and a complete redemption of the investment at the net assetvalue at the end of the period.
(c) Ratios are annualized for periods of less than one year.
(d) Expenses reimbursed reflect reductions to total expenses, as discussed in the notes to the financial statements. Theseamounts would increase the net investment loss ratio or decrease the net investment income ratio, as applicable, hadsuch reductions not occurred.
(e) The net expense ratios shown above reflect expenses after reimbursements but exclude the effect of reductions tototal expenses for any expenses offset. Expense offset arrangements reduce total expenses, as discussed in thenotes to the financial statements. These amounts would increase the net investment loss ratio, or decrease the netinvestment income ratio, as applicable, had such reductions not occurred. The effect of expenses offset are asfollows:
Six MonthsEnded
Year Ended June 30,December 31,2008 2008 2007 2006 2005 2004
Ratios to Average Net Assets (c):Expenses offset —(f) —(f) (0.01)% —(f) —(f) —(f)
(f) Effect on the expense ratio was not greater than 0.005%.
See accompanying notes to financial statements.
�191

Financial Highlights
EASTERN EUROPEAN FUND
For a capital share outstanding during the
Two MonthsEnded
Year Ended October 31,December 31,2008*** 2008* 2007* 2006* 2005* 2004*
Net asset value, beginning of period $6.35 $19.91 $15.44 $12.88 $9.47 $6.48
Investment ActivitiesNet investment income (loss) (.03) (.03) (.10) .13 (.03)** (.01)Net realized and unrealized gain (loss) (1.20) (10.10) 6.83 3.60 3.81** 3.31
Total from investment activities (1.23) (10.13) 6.73 3.73 3.78 3.30
DistributionsFrom net investment income — — (.29) — (.09) (.02)From net realized gains — (3.46) (1.98) (1.22) (.31) (.35)
Total distributions — (3.46) (2.27) (1.22) (.40) (.37)
Short-Term Trading Fees ** —(a) .03 .01 .05 .03 .06
Net asset value, end of period $5.12 $6.35 $19.91 $15.44 $12.88 $9.47
Total Return (excluding account fees) (b) (19.37)% (61.36)% 48.74% 31.03% 41.43% 54.12%Ratios to Average Net Assets: (c)
Net investment income (loss) (3.02)% (.15)% (.61)% .71% (.31)% (.23)%Total expenses 2.37% 1.96% 1.98% 1.95% 2.00% 2.08%Expenses reimbursed (d) (.27)% —(f) — — — —Net expenses (e) 2.10% 1.96% 1.98% 1.95% 2.00% 2.08%
Portfolio turnover rate 11% 82% 54% 68% 95% 89%
Net assets, end of period (in thousands) $317,320 $415,494 $1,582,707 $1,347,149 $903,855 $279,545
* The per share amounts shown for the current and prior periods have been adjusted to reflect the 3-for-1 stock splitwhich was effective on May 27, 2008.
** Based on average monthly shares outstanding.
*** Effective November 7, 2008, U.S. Global Investors, Inc. assumed management of the fund from Charlemagne Capital(IOM) Limited.
(a) The per share amount does not round to a full penny.
(b) Total returns for periods less than one year are not annualized. Assumes investment at the net asset value at thebeginning of the period, reinvestment of all distributions and a complete redemption of the investment at the net assetvalue at the end of the period.
(c) Ratios are annualized for periods of less than one year.
(d) Expenses reimbursed reflect reductions to total expenses, as discussed in the notes to the financial statements. Theseamounts would increase the net investment loss ratio or decrease the net investment income ratio, as applicable, hadsuch reductions not occurred.
(e) The expense ratios shown above exclude the effect of reductions to total expenses for any expenses offset and forfees rebated from the subadviser. Expense offset arrangements reduce total expenses, as discussed in the notes tothe financial statements. Through June 2006, the subadviser of the above fund provided advisory services to twoclosed-end investment companies that the above fund had invested in. The subadviser rebated amounts to the abovefund representing the portion of management fees paid by the two investment companies to the subadviser based onthe above fund’s investment. Fees rebated by the subadviser also reduce total expenses. These amounts wouldincrease the net investment loss ratio, or decrease the net investment income ratio, as applicable, had such reductionsnot occurred. The effect of expenses offset and expenses rebated by the subadviser are as follows:
Two MonthsEnded
Year Ended October 31,December 31,2008 2008 2007 2006 2005 2004
Ratios to Average Net Assets (c):Expenses offset —(f) (0.01)% (0.01)% (0.01)% (0.01)% —(f)Expenses rebated by subadviser n/a n/a n/a (0.01)% (0.02)% (0.05)%
(f) Effect on the expense ratio was not greater than 0.005%.
See accompanying notes to financial statements.
�192

Financial Highlights
GLOBAL EMERGING MARKETS FUND
For a capital share outstanding during the
Two MonthsEnded Year Ended Year Ended Year Ended Period Ended
December 31, October 31, October 31, October 31, October 31,2008** 2008 2007 2006 2005 (a)
Net asset value, beginning of period $5.94 $21.88 $13.93 $10.65 $10.00
Investment ActivitiesNet investment income (loss) (.01) (.43) (.13) .02 .06Net realized and unrealized gain (loss) (.56) (11.98) 9.18 3.50 .56
Total from investment activities (.57) (12.41) 9.05 3.52 .62
DistributionsFrom net investment income — (.46) — (.05) —From net realized gains — (3.11) (1.13) (.26) —From tax return of capital (.08) — — — —
Total distributions (.08) (3.57) (1.13) (.31) —
Short-Term Trading Fees * —(b) .04 .03 .07 .03
Net asset value, end of period $5.29 $5.94 $21.88 $13.93 $10.65
Total Return (excluding account fees) (d) (9.59)% (66.81)% 69.52% 34.16% 6.50%Ratios to Average Net Assets (d):
Net investment income (loss) (1.16)% (1.01)% (.92)% .13% 1.08%Total expenses 6.83% 2.80% 2.75% 3.07% 4.16%Expenses reimbursed (e) (4.33)% (.30)% (.39)% (1.05)% (2.16)%Net expenses (f) 2.50% 2.50% 2.36% 2.02% 2.00%
Portfolio Turnover Rate 21% 83% 125% 136% 93%
Net assets, end of period (in thousands) $9,663 $11,708 $59,621 $29,029 $16,157
* Based on average monthly shares outstanding.
** Effective November 7, 2008, U.S. Global Investors, Inc. assumed management of the fund from Charlemagne Capital(IOM) Limited.
(a) From February 24, 2005, commencement of operations.
(b) The per share amount does not round to a full penny.
(c) Total returns for periods less than one year are not annualized. Assumes investment at the net asset value at thebeginning of the period, reinvestment of all distributions and a complete redemption of the investment at the net assetvalue at the end of the period.
(d) Ratios are annualized for periods of less than one year.
(e) Expenses reimbursed reflect reductions to total expenses, as discussed in the notes to the financial statements. Theseamounts would increase the net investment loss ratio or decrease the net investment income ratio, as applicable, hadsuch reductions not occurred.
(f) The expense ratios shown above exclude the effect of reductions to total expenses for any expenses offset and forfees rebated from the subadviser. Expense offset arrangements reduce total expenses, as discussed in the notes tothe financial statements. Through June 2006, the subadviser of the above fund provided advisory services to a closed-end investment company that the above fund had invested in. The subadviser rebated amounts to the above fundrepresenting the portion of management fees paid by the investment company to the subadviser based on the abovefund’s investment. Fees rebated by the subadviser also reduce total expenses. These amounts would increase the netinvestment loss ratio, or decrease the net investment income ratio, as applicable, had such reductions not occurred.The effect of expenses offset and expenses rebated by the subadviser are as follows:
Two MonthsEnded Year Ended Year Ended Year Ended Period Ended
December 31, October 31, October 31, October 31, October 31,2008 2008 2007 2006 2005 (a)
Ratios to Average Net Assets (d):Expenses offset —(g) —(g) n/a n/a n/aExpenses rebated by subadviser n/a n/a n/a (0.02)% —(g)
(g) Effect on the expense ratio was not greater than 0.005%.
See accompanying notes to financial statements.
�193

Financial Highlights
CHINA REGION FUND
For a capital share outstanding during the
Six MonthsEnded
Year Ended June 30,December 31,2008 2008 2007 2006 2005 2004
Net asset value, beginning of period $9.09 $12.55 $8.71 $6.87 $5.86 $4.17
Investment ActivitiesNet investment income (loss) (.02)* (.03)* —* (.01)* (.06) —*Net realized and unrealized gain (loss) (3.49)* (.27)* 3.98* 2.02 1.22 1.69
Total from investment activities (3.51) (.30) 3.98 2.01 1.16 1.69
DistributionsFrom net investment income — (.10) (.16) (.19) (.16) (.05)From net realized gains — (2.93) — — — —From tax return of capital — (.17) — — — —
Total distributions — (3.20) (.16) (.19) (.16) (.05)
Short-Term Trading Fees * .01 .04 .02 .02 .01 .05
Net asset value, end of period $5.59 $9.09 $12.55 $8.71 $6.87 $5.86
Total Return (excluding account fees) (a) (38.50)% (8.58)% 46.34% 30.03% 19.98% 41.63%Ratios to Average Net Assets: (b)
Net investment income (loss) (.47)% (.26)% .02% (.08)% (.54)% .05%Total expenses 2.46% 1.95% 2.02% 2.31% 2.56% 2.25%Expenses reimbursed (c) (.27)% — — — — —Net expenses (d) 2.19% 1.95% 2.02% 2.31% 2.56% 2.25%
Portfolio turnover rate 117% 208% 208% 292% 136% 126%
Net assets, end of period (in thousands) $38,348 $81,109 $93,805 $67,761 $30,511 $35,090
* Based on average monthly shares outstanding.
(a) Total returns for periods less than one year are not annualized. Assumes investment at the net asset value at thebeginning of the period, reinvestment of all distributions and a complete redemption of the investment at the net assetvalue at the end of the period.
(b) Ratios are annualized for periods of less than one year.
(c) Expenses reimbursed reflect reductions to total expenses, as discussed in the notes to the financial statements. Theseamounts would increase the net investment loss ratio or decrease the net investment income ratio, as applicable, hadsuch reductions not occurred.
(d) The net expense ratios shown above reflect expenses after reimbursements but exclude the effect of reductions tototal expenses for any expenses offset. Expense offset arrangements reduce total expenses, as discussed in thenotes to the financial statements. These amounts would increase the net investment loss ratio, or decrease the netinvestment income ratio, as applicable, had such reductions not occurred. The effect of expenses offset are asfollows:
Six MonthsEnded
Year Ended June 30,December 31,2008 2008 2007 2006 2005 2004
Ratios to Average Net Assets (c):Expenses offset —(e) —(e) —(e) (0.01)% —(e) —(e)
(e) Effect on the expense ratio was not greater than 0.005%.
See accompanying notes to financial statements.
�194

Report of Independent Registered Public Accounting Firm
The Board of Trustees and Shareholdersof the U.S. Global Investors Funds Trust:
We have audited the accompanying statements of assets and liabilities, including theschedules of investments, of the Holmes Growth Fund, Global MegaTrends Fund,Eastern European Fund and Global Emerging Markets Fund, each a portfoliowithin the U.S. Global Investors Funds Trust as of December 31, 2008, and therelated statements of operations for the two-month period then ended and the yearended October 31, 2008, the statements of changes in net assets for the two-monthperiod then ended and the two-year period ended October 31, 2008 and financialhighlights for the two-month period then ended and each of the years in the five-year period ended October 31, 2008. We have audited the accompanying statementsof assets and liabilities, including the schedules of investments, of the U.S. TreasurySecurities Cash Fund, U.S. Government Securities Savings Fund, Near-Term TaxFree Fund, Tax Free Fund, All American Equity Fund, Global Resources Fund,World Precious Minerals Fund, Gold and Precious Metals Fund and China RegionFund, each a portfolio within the U.S. Global Investors Funds Trust as of December31, 2008, and the related statements of operations for the six-month period thenended and the year ended June 30, 2008, the statements of changes in net assets forthe six-month period then ended and the two-year period ended June 30, 2008 andfinancial highlights for the six-month period then ended and each of the years in thefive-year period ended June 30, 2008. These financial statements and financialhighlights are the responsibility of the Trust’s management. Our responsibility is toexpress an opinion on these financial statements and financial highlights based onour audits.
We conducted our audits in accordance with the standards of the Public CompanyAccounting Oversight Board (United States). Those standards require that we planand perform the audit to obtain reasonable assurance about whether the financialstatements and financial highlights are free of material misstatement. An auditincludes examining, on a test basis, evidence supporting the amounts and disclo-sures in the financial statements. Our procedures included confirmation of securitiesowned as of December 31, 2008, by correspondence with the custodian and brokersor by other appropriate auditing procedures where replies from brokers were notreceived. An audit also includes assessing the accounting principles used andsignificant estimates made by management, as well as evaluating the overall finan-cial statement presentation. We believe that our audits provide a reasonable basisfor our opinion.
In our opinion, the financial statements and financial highlights referred to abovepresent fairly, in all material respects, the financial position of each of the respectivefunds within the U.S. Global Investors Funds Trust, as of December 31, 2008, andthe results of their operations, the changes in their net assets and financial highlightsfor the periods described above, in conformity with U.S. generally acceptedaccounting principles.
Boston, MassachusettsFebruary 23, 2009
�195

Trustees and Officers (unaudited) December 31, 2008
The following table presents information about the Trustees as of December 31,2008, together with a brief description of their principal occupations during the lastfive years. The Agreement and Declaration of Trust provides that each trustee shallserve as a trustee of the Trust during the lifetime of this Trust and until itstermination except as such trustee sooner dies, resigns or is removed. In addition,each trustee who is not an ‘‘interested person’’ of the Trust shall be required toretire in accordance with the terms of any retirement policy then in effect that hasbeen approved by a majority vote of all independent trustees. The current retire-ment policy provides that the retirement age for non-interested trustees is 72 yearsof age. If you would like more information about the Trustees, you may call 1-800-US-FUNDS (1-800-873-8637) to request a free copy of the Statement of AdditionalInformation.
Non-Interested Trustees
Name (Age)AddressPositions Held with TrustLength of Time Served*Number of Portfolios in Fund Principal Occupation(s) and Previous PositionsComplex Overseen by Trustee During Past 5 Years and Other Directorships Held
Mr. J. Michael Belz (55) Principal Occupation: President and Chief Executive7900 Callaghan Road Officer of Catholic Life Insurance since 1984.San Antonio, TX 78229 Other Directorships Held: Director, BroadwayTrustee National Bank from October 2003 to present.November 1998 to presentThirteen portfoliosJames F. Gaertner (65) Principal Occupation: President of Sam Houston7900 Callaghan Road State University from August 2001 to present.San Antonio, TX 78229 Other Directorships Held: Chairman of the AuditTrustee Committee, Tandy Brands Accessories, Inc. fromNovember 2002 to present October 1997 to present.Thirteen portfoliosClark R. Mandigo (65) Principal Occupation: Restaurant operator, business7900 Callaghan Road consultant since 1991.San Antonio, TX 78229TrusteeMay 1993 to presentThirteen portfoliosJoe C. McKinney (62) Principal Occupation: Vice Chairman, Broadway7900 Callaghan Road National Bank from October 2002 to present.San Antonio, TX 78229 Other Directorships Held: Director, BroadwayTrustee National Bank from October 2002 to present;October 2008 to present Director, USAA Real Estate Company fromThirteen portfolios September 2004 to present; Director, Luby’s, Inc.
from January 2003 to present.
*These dates include service for a predecessor trust.
�196

Trustees and Officers (unaudited) December 31, 2008
Interested Trustee
Name (Age)AddressPositions Held with TrustLength of Time Served*Number of Portfolios in Fund Principal Occupation(s) and Previous PositionsComplex Overseen by Trustee During Past 5 Years and Other Directorships Held
Frank Holmes ** (53) Principal Occupation: Director, Chief Executive7900 Callaghan Road Officer, and Chief Investment Officer of theSan Antonio, TX 78229 Adviser. Since October 1989, Mr. Holmes hasTrustee, Chief Executive served and continues to serve in various positionsOfficer, Chief Investment with the Adviser, its subsidiaries, and the investmentOfficer, President January 1990 companies it sponsors.to present Other Directorships Held: Director of 71316Thirteen portfolios Ontario, Inc. since April 1987 and of F. E. Holmes
Organization, Inc. since July 1978.
*These dates include service for a predecessor trust.**Mr. Holmes is an ‘‘interested person’’ of the Trust by virtue of his positions with U.S. Global
Investors, Inc.
The following table presents information about each Officer of the Trust as ofDecember 31, 2008, together with a brief description of their principal occupationsduring the last five years. Each holds office until his or her successor is duly electedand qualified.
Officers
Name (Age)AddressPositions Held with TrustLength of Time Served* Principal Occupation(s) During Past 5 Years
Frank Holmes (53) Director, Chief Executive Officer, and Chief7900 Callaghan Road Investment Officer of the Adviser. Since OctoberSan Antonio, TX 78229 1989, Mr. Holmes has served and continues to serveTrustee, Chief Executive in various positions with the Adviser, itsOfficer, Chief Investment subsidiaries, and the investment companies itOfficer, President sponsors.January 1990 to presentSusan McGee (49) President and General Counsel of the Adviser.7900 Callaghan Road Since September 1992, Ms. McGee has served andSan Antonio, TX 78229 continues to serve in various positions with theExecutive Vice President, Adviser, its subsidiaries, and the investmentSecretary, General Counsel companies it sponsors.March 1997 to presentCatherine Rademacher (48) Chief Financial Officer of the Adviser. Since April7900 Callaghan Road 2004, Ms. Rademacher has served and continues toSan Antonio, TX 78229 serve in various positions with the Adviser, itsTreasurer subsidiaries, and the investment companies itJuly 2004 to present sponsors. Associate with Resources Connection
from July 2003 to February 2004.
�197

Trustees and Officers (unaudited) December 31, 2008
Name (Age)AddressPositions Held with TrustLength of Time Served* Principal Occupation(s) During Past 5 Years
James L. Love (40) Chief Compliance Officer of the Adviser since7900 Callaghan Road September 2007. Executive Director ExecutiveSan Antonio, TX 78229 Attorney from January 2003 to September 2007,Chief Compliance Officer Senior Counsel May 2002 to January 2003 withSeptember 2007 to present USAA.Mark Carter (41) Vice President, Shareholder Services of the Adviser7900 Callaghan Road since April 2008. Operations Manager of theSan Antonio, TX 78229 Adviser from April 2007 through March 2008;Vice President, Shareholder Transfer Agent Operations Manager, Invesco AIMServices from 2004 to April 2007.April 2008 to presentT. Kelly Niland (46) Vice President of Investment Operations of the7900 Callaghan Road Adviser since January 2006. Fund AccountingSan Antonio, TX 78229 Manager with AIM Investments from June 1992 toVice President, Investment January 2006.OperationsDecember 2008 to present;Assistant Treasurer from May2006 to December 2008.Susan K. Filyk (39) Director of Marketing of the Adviser since August7900 Callaghan Road 2008. Ms. Filyk has served and continues to serve inSan Antonio, TX 78229 various positions with the Adviser, its subsidiaries,Vice President, Marketing and the investment companies it sponsors. Sr. VPDecember 2008 to present Marketing with Frost National Bank from May 1998
to August 2007.
*These dates include service for a predecessor trust.
�198

Additional Information (unaudited)
Additional Federal Tax Information
The percentage of tax-exempt dividends paid by the Funds for the six months ended December31, 2008, was:
Near-Term Tax Free 82.35%Tax Free 94.87%
The percentage of ordinary income dividends paid by the Funds during the calendar year endedDecember 31, 2008, which qualify for the Dividends Received Deduction available to corporateshareholders was:
Global Resources 4.55%Gold and Precious Metals 1.70%
The Funds hereby designate the following approximate amounts as capital gain dividends for thepurpose of the dividends paid deduction:
Global Resources $85,843,436World Precious Minerals 61,845,712Gold and Precious Metals 6,520,755
The amounts which represent foreign source income and foreign taxes paid during the six monthsended December 31, 2008, are as follows:
Foreign Source Foreign TaxIncome Credit
Gold and Precious Metals $430,909 $34,458
In early 2009, the Funds reported on Form 1099-DIV the tax status of all distributions made duringthe calendar year 2008. The funds intend to distribute the maximum amount of qualified dividendincome allowable. The amount of qualified dividend income distributed by each fund will bereported to shareholders on their Form 1099-DIV. Shareholders should use the information onForm 1099-DIV for their income tax returns.
Proxy Voting
A description of the policies and procedures that the Funds use to determine how to vote proxiesrelating to portfolio securities is available without charge, upon request, by calling 1-800-US-FUNDS (1-800-873-8637). It also appears in the Funds’ statement of additional information (Form485B), which can be found on the SEC’s website at www.sec.gov.
Information regarding how the Funds voted proxies relating to portfolio securities during the mostrecent 12-month period ended June 30 is available without charge, upon request, by calling1-800-US-FUNDS (1-800-873-8637) or accessing the Funds’ Form N-PX on the SEC’s website atwww.sec.gov.
�199

Additional Information (unaudited)
Availability of Quarterly Portfolio Schedules
The Funds provide complete lists of holdings four times in each fiscal year, at the quarter-ends.For the second and fourth quarters, the lists appear in the Funds’ semi-annual and annual reportsto shareholders. For the first and third quarters, the Funds file the lists with the SEC on Form N-Q.Shareholders can look up the Funds’ Forms N-Q on the SEC’s website at www.sec.gov. You mayalso visit or call the SEC’s Public Room in Washington, D.C. (1-202-942-8090) or send a requestplus a duplicating fee to the SEC, Public Reference Section, Washington, DC 20549-0102 or byelectronic request at the following e-mail address: [email protected].
Approval of the Advisory Agreement for Each Fund
On July 31, 2008, the Board of Trustees (the ‘‘Board’’) of U.S. Global Investors Funds, the Delawarestatutory trust into which the U.S. Global Investors Funds and U.S. Global Accolade Funds werereorganized, including all of the trustees who are not ‘‘interested persons’’ of the Trust (the‘‘Independent Trustees’’), approved a new advisory agreement with the Adviser for each fund for aone-year term, effective October 1, 2008. The Independent Trustees considered the materialsprovided by the Adviser in support of the new form of advisory agreement, along with theapplicable rules and regulations related to the proposal. The Board also considered the Adviser’srepresentation that the Board may rely on and take into account the information provided inconnection with the prior advisory agreement for each fund.
With respect to the new form of advisory agreement, the Board considered the following factors,among others:
• Pro forma advisory fee and expense ratio analyses prepared by a third party and bymanagement, giving effect to the advisory fees under the advisory agreement, the administra-tion expenses under the administrative services agreement and the distribution plan (asapplicable).
• Current and pro forma expense data for each fund;
• Information on the selection of the proposed benchmarks, on a fund-by-fund basis (asapplicable), for the proposed performance fee adjustments;
• Information comparing the historical performance of each fund with a proposed performancefee adjustment to its proposed benchmark;
• The pro forma profitability impact to the Adviser from the advisory agreement and administra-tive services agreement;
• Historical and pro forma historical performance data for each fund, giving effect to the advisoryagreement, administrative services agreement and the distribution plan (as applicable), alongwith the fund’s historical and pro forma peer group rank; and
• The Adviser’s agreement to cap the expenses for each fund for the one-year period of theadvisory agreement.
�200

Additional Information (unaudited)
The Board took note of the following factors, among others: (1) the nature, extent and quality ofservices provided by the Adviser, (2) the advisory fees and expense ratio, (3) the profits realized bythe Adviser and its affiliates from their relationship with the funds, (4) whether the funds benefitfrom any economies of scale, and (5) the benefits realized by the Adviser and its affiliates fromtheir relationship with the funds. The board reached the following conclusions in approving theAdvisory Agreement for each applicable fund: (1) the nature and extent of the services historicallyprovided by the Adviser were appropriate and the quality of services was good, (2) the advisoryfees, coupled with the Adviser’s commitment to cap expenses, were reasonable and appropriate inamount given the quality of services provided, (3) the profits to be realized by the Adviser from theadvisory agreement and administrative services agreement were reasonable in comparison withthe costs of providing investment advisory services to the Funds, (4) with respect to economies ofscale, profitability to the Adviser and its affiliates is not excessive, and (5) the direct and indirectbenefits accruing to the Adviser were reasonable in comparison with the costs of providingadvisory services, the advisory fees charged, the Adviser’s commitment to cap expenses (asapplicable) and the benefits to the funds.
Based on all the information considered and the conclusions reached, the Board determined thatthe terms of the new advisory agreement, effective October 1, 2008, is fair and reasonable andthat the approval of the new agreement is in the best interests of each applicable fund.
Shareholder Votes
On September 23, 2008, a special meeting of the shareholders of U.S. Global Accolade Funds andU.S. Global Investors Funds was held. The following proposals were presented to and approved bythe shareholders:
1. To approve the reorganization of each fund from the two separate Massachusetts businesstrusts into a corresponding new fund organized under a single Delaware statutory trust.
2. All American Equity Fund, Holmes Growth Fund, Global MegaTrends Fund, GlobalResources Fund, Gold & Precious Metals Fund, World Precious Minerals Fund, EasternEuropean Fund, Global Emerging Markets Fund, and China Region Fund. To approve a newDistribution Plan.
3. To approve a new Advisory Agreement for each fund.
4. Eastern European Fund, Global Emerging Markets Fund. To approve a new SubadvisoryAgreement.
5. Eastern European Fund. To approve a change in the Fund’s concentration policy to permit theFund to invest more than 25% of its assets in securities of companies involved in oil, gas, orbanking.
�201

Additional Information (unaudited)
The results of the votes were as follows:BrokerNon-
Proposal For Against Abstain Withheld VotesProposal 1:U.S. Treasury Securities Cash Fund 55,216,304 2,728,590 3,535,825 NA NAU.S. Government Securities Savings Fund 247,423,461 9,112,193 10,141,436 NA NANear-Term Tax Free Fund 3,959,724 47,425 427,075 NA NATax Free Fund 1,038,632 17,687 53,001 NA NAAll American Equity Fund 462,840 11,525 50,729 NA NAHolmes Growth Fund 1,352,751 38,960 114,213 NA NAGlobal MegaTrends Fund 2,308,744 52,916 89,602 NA NAGlobal Resources Fund 44,083,176 2,328,033 3,082,753 NA NAGold & Precious Metals Fund 7,807,537 377,192 325,799 NA NAWorld Precious Minerals Fund 17,633,167 825,498 1,070,354 NA NAEastern European Fund 37,406,107 1,934,682 2,432,523 NA NAGlobal Emerging Markets Fund 1,422,684 55,770 69,801 NA NAChina Region Fund 4,244,330 231,111 270,278 NA NAProposal 2:All American Equity Fund 442,029 26,812 56,252 NA NAHolmes Growth Fund 1,284,882 92,103 128,940 NA NAGlobal MegaTrends Fund 2,151,788 195,073 104,399 NA NAGlobal Resources Fund 41,622,516 4,444,484 3,426,957 NA NAGold & Precious Metals Fund 7,373,781 773,883 362,863 NA NAWorld Precious Minerals Fund 16,531,112 1,851,973 1,145,931 NA NAEastern European Fund 35,506,284 3,494,987 2,772,040 NA NAGlobal Emerging Markets Fund 1,352,678 123,011 72,564 NA NAChina Region Fund 4,060,459 412,430 272,829 NA NAProposal 3:U.S. Treasury Securities Cash Fund 51,915,852 5,688,665 3,876,201 NA NAU.S. Government Securities Savings Fund 236,420,495 19,175,557 11,081,038 NA NANear-Term Tax Free Fund 3,900,978 92,413 440,834 NA NATax Free Fund 987,418 51,837 70,065 NA NAAll American Equity Fund 452,327 21,048 51,717 NA NAHolmes Growth Fund 1,302,024 79,067 124,833 NA NAGlobal MegaTrends Fund 2,249,976 100,701 100,583 NA NAGlobal Resources Fund 41,756,633 4,316,812 3,420,517 NA NAGold & Precious Metals Fund 7,354,354 776,488 379,683 NA NAWorld Precious Minerals Fund 16,662,369 1,687,958 1,178,691 NA NAEastern European Fund 36,042,372 3,029,644 2,701,294 NA NAGlobal Emerging Markets Fund 1,369,090 103,485 75,680 NA NAChina Region Fund 4,071,097 331,781 342,841 NA NAProposal 4:Eastern European Fund 35,783,985 3,188,394 2,800,931 NA NAGlobal Emerging Markets Fund 1,377,198 93,740 77,316 NA NAProposal 5:Eastern European Fund 35,934,299 3,438,622 2,400,392 NA NA
�202


U.S
. G
lob
al
Inve
sto
rs
P.O. B
ox 78
1234
San
Anto
nio,
Texa
s78
278-
1234
U.S. Global Investors Funds Annual Report
December 31, 2008
09-058_InvestorsAnnualCover.indd 109-058_InvestorsAnnualCover.indd 1 2/13/09 12:03:35 PM2/13/09 12:03:35 PM