u.s. imports, exports and tariff data, 1989-2001 · u.s. imports, exports and tariff data,...
TRANSCRIPT

U.S. Imports, Exports and Tariff Data,
1989-2001
Robert C. Feenstra Department of Economics,
Univ. of California, Davis and NBER [email protected]
John Romalis
Graduate School of Business, University of Chicago
Peter K. Schott
School of Management Yale University & NBER
November 2002

U.S. Imports, Exports and Tariff Data,
1989-2001
Abstract
This paper describes the updating of the NBER trade dataset, which now provides U.S.
import and export values to the year 2001, disaggregated by Harmonized System (HS), Standard
International Trade Classification (SITC), and the U.S. Standard Industrial Classification (SIC)
categories. In addition, U.S. tariff data at the HS level have been added for the years 1989-2001.
Earlier CD-ROMs distributed by the NBER described data on U.S. imports and exports from
1972-1994, and these values have been slightly modified for 1989-1994 and then updated to
2001. Together with the earlier data, there are now 30 years of disaggregate U.S. trade data
available to researchers. These data, along with the tariff information for 1989-2001, are all
available over the internet at www.nber.org/data/.
Keywords: Imports; Exports; Harmonized System; Standard Industrial Classification
JEL Classification: F1

1
1. Introduction
This paper describes the updating of the NBER trade dataset, which now provides U.S.
import and export values to the year 2001, disaggregated by Harmonized System (HS), Standard
International Trade Classification (SITC), and the U.S. Standard Industrial Classification (SIC)
categories. In addition, U.S. tariff data at the HS level have been added for the years 1989-2001.
Earlier CD-ROMs distributed by the NBER (see Feenstra, 1996, 1997) described data on U.S.
imports and exports from 1972-1994, and these values have been slightly modified for 1989-
1994 and then updated to 2001. Together with the earlier data, there are now 30 years of
disaggregate U.S. trade data available to researchers. These data, along with the tariff
information for 1989-2001, are all available over the internet at www.nber.org/data/.
This paper has five parts. First, we describe the updating of the U.S. HS imports and
exports. The import data for 1989-2001 is now reported as both “general imports” and “imports
for consumption,” and the distinction between these is discussed in section 2. In section 3, we
describe how the HS trade data has been aggregated to the 1987 version 4-digit SIC industries.
This aggregation was performed by Peter Schott, using (unpublished) concordances.1 However,
there are 73 (out of 459) 4-digit SIC industries for which we are not able to compute imports or
exports at the present time. This will be corrected when updated U.S. production data becomes
available.2 The U.S. tariff data at the HS level for 1989-2001 is described in section 4, and these
data have been collected and made available by John Romalis.3 Finally, in section 5 and the
Appendices we provide documentation for all the data.
1 We thank Jack Barna and J. Bradford Jensen at the U.S. Census Bureau for their help in securing the concordances used to aggregate from the HS to the U.S. SIC categories. The 1987-based SIC trade data computed by Peter Schott is available at www.som.yale.edu/faculty/pks4/sub_international.htm. 2 The revised 1987-based SIC trade data, that imputes trade within the “missing” SIC categories, will be made available at a future date at Robert Feenstra’s website, www.internationaldata.org . 3 The tariff data is available at gsbwww.uchicago.edu/fac/john.romalis/research/ .

2
2. U.S. Imports and Exports
U.S. merchandise imports are collected under two methods. “General imports” are
imports as they come off the dock. They reflect the total arrival of merchandise from foreign
countries that immediately enter consumption channels, bonded warehouses, or foreign trade
zones. In contrast, “imports for consumption” are a combination of entries for immediate
consumption, including those coming from U.S. foreign trade zones and withdrawals from
warehouses for consumption. Since April 1995, the National Trade Databank CD-ROMs that
are distributed by the U.S. Department of Commerce have reported “general imports” rather than
“imports for consumption.” Likewise, recent issues of the Economic Report of the President
report U.S. “general imports” at the aggregate level.
The earlier U.S. import data distributed by Feenstra (1996) for 1972-1994 was for
“imports for consumption,” but the updated data for 1989-2001 described herein also includes
“general imports.” As noted, these data will differ for goods used in foreign trade zones or
entering into bonded warehouses. Examples include automobiles and their parts, where in 1993
the volume of automobile trade entering U.S. foreign trade zones was over $12 billion (Swenson,
1997, p. 37). It is expected that the use of “general imports” rather than “imports for
consumption” will give a more accurate picture of the import of these goods in the U.S. prior to
their further manufacture in the foreign trade zones.
For this update to the U.S. import and export dataset described in Feenstra (1996, 1997),
we have recomputed U.S. imports and exports at the HS level for the six years 1989-1994 (which
overlap with the earlier 1972-1994 dataset) and then provide new data for six additional years,
1995-2001. Researchers interested in the full 30 years of data will therefore be using the 1972-
1988 files from the earlier dataset, and the 1989-2001 files from this updated dataset. As noted

3
in the introduction, all data are available over the internet at www.nber.org/data/, and also
www.internationaldata.org at the University of California, Davis.
In Tables 1 and 2, we report the total values of merchandise imports and exports for the
updated years, 1989-2001, and for comparison, we also report the values from the Economic
Report of the President (ERP). For imports, “general imports” from the database and the ERP
are quite close in all years (Table 1). For exports, the database includes only “domestic exports,”
but excludes re-exports of foreign goods passing through the United States. In 2000, for
example, domestic exports were $712,287 million, and the disaggregate HS, SITC and SIC data
on these exports are reported in the database. Re-exports in 2000 were $68,131 million, or
nearly 10% of domestic exports. These sum to $780,419 million, which is close to the value of
total exports reported in the ERP (Table 2).
The disaggregate HS data for both imports and exports include the corresponding SITC
code (5-digit, revision 2 and 3), SIC code (4-digit, 1987 version), and the new North American
Classification System (NAICS) code (6-digit, 1997 version). The NAICS codes are now being
used to classify domestic industry data in the U.S.4 However, for most statistical work, the U.S.
SIC classification will continue to be used rather than the new NAICS classification.
Accordingly, in this database we provide the U.S. imports and exports according to the 4-digit
SIC classification (1987 basis). In Table 1 and 2 we also report total values of manufactured
imports and exports (SIC codes starting with 2 or 3) for the updated years, 1989-2001, and for
comparison, the values for 1989-1994 from Feenstra (1996, 1997).5 In these overlapping years,
the total value of manufactured imports and exports are quite close in the two datasets.
4 Information on the NAICS codes are available at http://www.census.gov/epcd/www/naics.html. 5 Feenstra (1996, 1997) reported 1972-revision SIC imports and exports up to 1992, and these were later extended to 1994 and made available on the website www.internationaldata.org.

4
Table 1: U.S. Merchandise Imports ($ million)
From Database: ERPa Manufactured Imports:
Year
(1) General Imports
(2) Imports for
Consumption
(1) – (2) Difference
General Imports
From Databaseb
Feenstra (1996)c
1989 473,397 468,012 5,384 473,200 396,108 395,949
1990 495,260 490,553 4,707 495,300 406,068 405,912 1991 487,129 482,083 5,046 488,500 404,828 405,279 1992 532,352 525,091 7,261 532,700 443,951 443,555 1993 580,469 574,863 5,606 580,700 490,289 488,714 1994 663,830 657,885 5,945 663,300 567,052 565,204 1995 743,505 739,660 3,845 743,500 639,728 na 1996 791,315 790,470 845 795,300 679,712 na 1997 869,874 862,426 7,448 869,700 749,333 na 1998 913,885 907,647 6,238 911,900 802,594 na 1999 1,024,766 1,017,435 7,331 1,024,600 894,684 na 2000 1,216,888 1,205,339 11,549 1,218,000 1,040,464 na 2001 1,141,959 1,132,635 9,324 na 972,822 na
Table 2: U.S. Merchandise Exports ($ million)
(1) (2) (1)+(2) ERPa Manufactured Exports:
Year Database Exports
Census Re-exports
Total Exports
Total Exports
From Databaseb
Feenstra (1997)c
1989 349,421 14,333 363,754 363,800 279,381 280,820
1990 374,537 18,439 392,976 393,600 320,236 321,717 1991 400,842 21,011 421,854 421,700 348,759 350,444 1992 424,971 22,500 447,471 448,200 371,785 373,877 1993 439,295 25,563 464,858 465,100 388,987 390,566 1994 481,887 30,528 512,416 512,600 428,388 430,071 1995 546,465 36,566 583,031 584,700 481,435 na 1996 582,137 40,690 622,827 625,100 512,975 na 1997 643,222 44,376 687,598 689,200 576,000 na 1998 634,705 45,769 680,474 682,100 573,528 na 1999 642,189 50,632 692,821 695,800 582,698 na 2000 712,287 68,131 780,419 781,900 646,637 na 2001 666,021 65,005 731,026 na 599,140 na
Notes: a. From Economic Report of the President, 2002, Table B-106, Census values. b. Imports for consumption or exports computed from database with MSIC and XSIC codes starting with 2 or 3, excluding 3XXX. b. Computed from SIC import and export data at www.internationaldata.org. These values differ slightly from those in Feenstra (1996, Table 1) and (1997, Table 3).

5
At the disaggregate level, making the transition from the 10-digit HS codes to the 4-digit
SIC system is difficult, for the following reasons. The SIC codes commonly reported in the U.S.
import and export data do not correspond to the true domestic-based SIC codes. Rather, they are
so-called import-based SIC (MSIC) and export-based SIC (XSIC) codes. This distinction is
needed because the domestic-based SIC codes often depend on the method of processing for a
good, and this information is not available for imports and exports. For example, SIC industry
2011, meat packing plants, and industry 2013, sausages and other prepared meats, produce many
of the same products. What distinguishes them is that industry 2011 slaughters while industry
2013 uses purchased carcasses. There is no way to determine the source of materials for
imported meat products, and this is also not known for exports, so both imports and exports are
classified into the single MSIC and XSIC code 2011, with no trade at all in code 2013.6
The fact that there is no trade reported in industry 2013 is an artifact of the classification
system, of course: there is positive domestic production in that industry, and it faces import
competition and also exports some of its output. So in order to measure the import competition
and export opportunities, it is necessary to make the transition from the MSIC, XSIC codes to the
domestic SIC codes. Feenstra (1996, 1997) made this transition for the trade data in 1972-1992
(later updated to 1994), so as to report U.S. imports and export according to the 4-digit SIC
(1972 version). Under the new database described in this paper, we shall report U.S. imports and
export according to the 4-digit SIC (1987 version), for 1989-2001. These were computed using a
new concordance that mapped directly from the HS categories to the 4-digit domestic SIC codes,
as described in the next section.
6 The MSIC and XSIC code 2013 was not used at all between 1989 and 2001, though it was used for a small amount of trade in earlier years. Feenstra (1996, 1997) uses this example to describe the trade flows in 1978, when there was a very small amount of trade in MSIC and XSIC 2013.

6
3. Concording HS Products to SIC Industries
The US began recording international trade transactions using the ten digit Harmonized
System (HS10) in 1989. More recently, both the Census Bureau, which administers the export
codes, and the US International Trade Commission (USITC), which manages the import codes,
have posted concordances between the HS10 and 1987 version 4-digit SIC (SIC4) industries on
their websites. 7,8 Neither agency, however, makes available a comprehensive concordance that
includes all product codes which have been used since 1989.9
By piecing together data from a variety of sources, Peter Schott created a master HS10 to
SIC4 concordance for product trade between 1989 and 2001. This master list is imperfect in two
ways. First, it does not cover all HS10 products. Second, all SIC4 industries are not included in
the concordance. We outline how each of these problems are dealt with in turn.
3.1 Not All Products Are Assigned an SIC4 Code by Census
Of the 26,277 HS10 product codes used to track US imports and exports between 1989 and
2001, we cannot find an SIC4 code for 1,222.10 Of these 1,222 product codes, 898 can be
assigned to an SIC4 via the HS10 to 1987 Import SIC4 (MSIC4) concordance provided by
Feenstra (1996). Though in principle MSIC4 codes differ from SIC4 codes, a number of MSIC
7 See Feenstra (1996) for an algorithm for concording seven digit Tariff System of the US (TSUSA) product codes to US industries for 1972 through 1988. Feenstra (1996) also contains an alternate aggregation scheme for HS to SIC for 1989 to 1994. The results of that procedure are compared to the results from this paper's procedure in Section 2.3 below. 8 Technically, import codes use the Harmonized System while export codes use a system referred to as Schedule B. Schedule B codes are based upon the HS, but are typically less detailed than import codes. Though this can complicate a matching of imports and exports at the product level, it does not prevent such a matching at the industry level. 9 Import and export concordances are available for 1992 at http://www.census.gov/epcd/www/intronet.html . A search engine for looking up a given current product's SIC4 industry is available at http://dataweb.usitc.gov/ . Finally, a subset of past import concordances is available at http://www.eiit.org/ . 10 The primary reason for this, we believe, is that we have been unable to obtain Census' HS10 to SIC4 concordance for years 1989 to 1991. It is possible that the missing HS10 codes are located in these files.
7
codes map directly into regular SIC4 codes. This direct mapping can be used to assign SIC4
industries to 898 products.
We assign the remaining 324 products to industries via the following algorithm. First, if
other HS10 products within the target’s HS8 code are assigned an industry, use that industry for
the target. If there are no such neighbors, or the neighbors have not been assigned a code, keep
going up levels of aggregation (e.g. HS7, HS6, etc.) until a match can be made.
Of the 1,222 products classified via MSIC4 industries or via the SIC4’s of their neighbors,
1,087 are in manufacturing. Schott’s version of the master HS10 to SIC4 concordance is
contained in HS10_SIC4_8901.ASC.
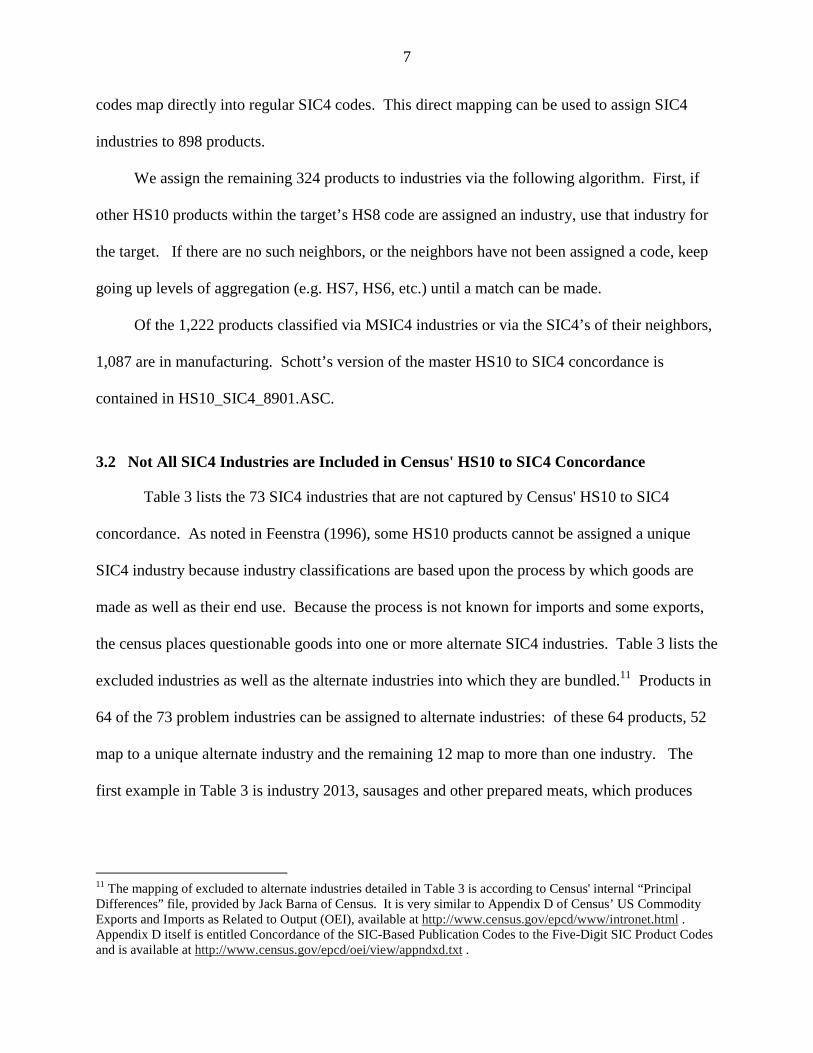
3.2 Not All SIC4 Industries are Included in Census' HS10 to SIC4 Concordance
Table 3 lists the 73 SIC4 industries that are not captured by Census' HS10 to SIC4
concordance. As noted in Feenstra (1996), some HS10 products cannot be assigned a unique
SIC4 industry because industry classifications are based upon the process by which goods are
made as well as their end use. Because the process is not known for imports and some exports,
the census places questionable goods into one or more alternate SIC4 industries. Table 3 lists the
excluded industries as well as the alternate industries into which they are bundled.11 Products in
64 of the 73 problem industries can be assigned to alternate industries: of these 64 products, 52
map to a unique alternate industry and the remaining 12 map to more than one industry. The
first example in Table 3 is industry 2013, sausages and other prepared meats, which produces
11 The mapping of excluded to alternate industries detailed in Table 3 is according to Census' internal “Principal Differences” file, provided by Jack Barna of Census. It is very similar to Appendix D of Census’ US Commodity Exports and Imports as Related to Output (OEI), available at http://www.census.gov/epcd/www/intronet.html . Appendix D itself is entitled Concordance of the SIC-Based Publication Codes to the Five-Digit SIC Product Codes and is available at http://www.census.gov/epcd/oei/view/appndxd.txt .

8
Table 3: SIC4 Industries Not Captured by the Census’ HS10 to SIC4 Concordance
Excluded Industry Description
Excluded Industry Description
2013 Sausages and other prepared meats 2011 3084 Plastics pipe 30842038 Frozen specialties, nec 2099 3086 Plastics foam products 30892052 Cookies and crackers 2051 3087 Custom compound purchased resins 30892053 Frozen bakery products, except bread 2051 3263 Semivitreous table + kitchenware 32692061 Raw cane sugar 2062 3316 Cold finishing of steel shapes 33122063 Beet sugar 2062 3317 Steel pipe and tubes 33122092 Fresh or frozen prepared fish 912 913 3322 Malleable iron foundries 33212141 Tobacco stemming and redrying 3324 Steel investment foundries 33212251 Women's hosiery, except socks 2252 3325 Steel foundries, nec 33212253 Knit outerwear mills 2321 2329 2331 2369 3355 Aluminum rolling and drawing, nec 3334 3354 33572254 Knit underwear mills 2322 2341 3363 Aluminum die-castings 34992259 Knitting mills, nec 2399 3364 Nonferrous die-casting exc. aluminum 34992261 Finishing plants, cotton 2211 3366 Copper foundries 34992262 Finishing plants, manmade 2221 3369 Nonferrous foundries, nec 34992269 Finishing plants, nec 3398 Metal heat treating2282 Throwing and winding mills 2824 3451 Screw machine products 34992326 Men's and boys' work clothing 2321 2325 3462 Iron and steel forgings 34992361 Girls' + children's dresses, blouses 2331 2335 3463 Nonferrous forgings 34992387 Apparel belts 2387 2389 3471 Plating and polishing2397 Schiffli machine embroideries 2395 3479 Metal coating and allied services2441 Nailed wood boxes and shook 2449 3483 Ammunition, exc. for small arms, nec 34822511 Wood household furniture 2599 3491 Industrial valves 34912512 Upholstered household furniture 2512 3495 Wire springs 3493 35692519 Household furniture, nec 2599 3498 Fabricated pipe and fittings2521 Wood office furniture 2599 3549 Metalworking machinery, nec 35422531 Public building + related furniture 2599 3575 Computer terminals 35772541 Wood partitions and fixtures 2599 3582 Commercial laundry equipment 36332671 Paper coated + laminated, packaging 2621 2671 3592 Carburetors, pistons, rings, valves 37142732 Book printing 2731 3645 Residential lighting fixtures 36452754 Commercial printing, gravure 2721 2741 2752 3646 Commercial lighting fixtures 36482759 Commercial printing, nec 2721 2741 2752 3716 Motor homes 37162789 Bookbinding and related work 3731 Ship building and repairing2791 Typesetting 2796 3769 Space vehicle equipment, nec 37692875 Fertilizers, mixing only 2874 3821 Laboratory apparatus and furniture 3829 34992992 Lubricating oils and greases 2911 3953 Marking devices3061 Mechanical rubber goods 3069 3995 Burial caskets 24993083 Laminated plastics plate + sheet 2671
Destination of Products in Excluded Industries
Notes: The Census' HS10 to SIC4 concordance excludes 73 SIC4 industries for reasons noted in the text. Products in these excluded industries are allocated to one of the noted industries according to the Census Bureaus' internal "Principal Differences" file. Source: Jack Barna, US Census Bureau.
Destination of Products in Excluded Industries
Figure 1: US Manufacturing Imports and Exports, 1989 to 2001
200
300
400
500
600
700
800
900
1000
1100
1989 1991 1993 1995 1997 1999 2001
$ B
illi
on Im ports
Exports

9
many of the same products as industry 2011, meat packing plants, and industry. As noted above,
what distinguishes these industries is that 2011 slaughters while 2013 uses purchased carcasses.
There is no way to determine the source of materials for imported meat products, and this is also
not known for exports, so both imports and exports are classified into the single SIC and SIC
code 2011, with no trade at all in code 2013.
Feenstra (1996, 1997) solved this problem of “missing” trade in SIC industries by taking
the combined industry (e.g. 2011), computing the ratio of imports or exports to U.S. domestic
production in this combined industry, and then using this ratio to impute trade in the “missing”
industries (i.e. as equal to U.S. production in that industry times the import or export ratio for the
combined industry). In other words, imports or exports in any combined industry is allocated its
separate industries using the same proportions as U.S. domestic production. We have not yet
been able to make this calculation for the 1987-based SIC import and export data, however,
because the domestic U.S. production is not known for years after 1996. So the 1987-based SIC
trade data included in the database has missing values for 73 (out of 459) SIC industries. This
will be corrected when the updated U.S. production data becomes available.12
Despite these “missing” trade values, it is possible to compare the trade values with other
industry data by suming up the industry-level to match “super SIC4” trade categories (i.e. those
for which trade values are available), with the help of Table 3. Bernard et al (2002a and 2002b),
for example, aggregate plant-level US manufacturing data in excluded industries to match the
“super SIC4” trade data created by the HS10 to SIC4 concordance detailed above.
12 The 1987-based SIC trade data computed by Peter Schott, with the “missing” values, is available at www.som.yale.edu/faculty/pks4/sub_international.htm . The revised 1987-based SIC trade data, that imputes trade within the “missing” SIC categories, will be made available at a future date at Robert Feenstra’s website, www.internationaldata.org .

10
3.3 U.S. Manufacturing Trade, 1989 to 2001
Figure 1 summarizes total US manufacturing imports (general value) and exports for 1989
to 2001. Imports grow from $401 billion to $961 billion in this period, while exports grow from
$291 to $619 billion.13 Schott’s estimates of manufacturing trade via the SIC87 concordance
described here are quite similar to those derived by Feenstra (1996, 1997).14 Tables 4 and 5
provide a reconciliation of the two methods for both imports and exports. The second column of
each table reports the sum of manufacturing value in the database across products whose MSIC
or XSIC is between 2000 and 3999. The values in this column exclude products falling into the
category 3XXX, for which an exact match to a more disaggregate industry was unknown. The
value of these 3XXX products are reported in the third column of the table. The fourth and fifth
columns report the value of products classified by only one of the two systems, e.g. the value of
products classified as manufacturing via MSIC/XSIC but not the new SIC87 concordance
discussed above. The sixth column reconciles the MSIC/XSIC system with Schott’s: it is the
sum of columns 2 through 4, less the values in column 5. Feenstra’s (1996, 1997) estimates are
provided for comparison in the final column.
4. U.S. Tariffs, 1989-2001
The U.S. Tariff database is based on the Harmonized Tariff Schedule of the United States
(HTS) for the years 1989 to 2001. It includes ad valorem, specific and estimated ad valorem
equivalent (AVE) tariffs based on the most favored nation (MFN) rate of the HTS. The file also
indicates products that are eligible for tariff preferences under free trade agreements such as with
13 Note that manufacturing exports, like all other merchandise exports in the database, do not include re-exports from the United States. 14 Feenstra (1996) describes this aggregation in great detail. For imports, it boils down to the following chain of concordances: HS10 to 1987 MSIC4 to 1972 MSIC4 to 1972 SIC4.

11
Table 4: U.S. Manufacturing General Imports ($ million)
(1) (2) (3) (4) (1)+(2)+(3)-(4)
Year Databasea
(Using MSIC) MSIC = 3XXXb
SIC87 but not MSICc
MSIC but not SIC87d
Databasee (Using SIC87)
Feenstra (1996)f
1989 400,695 2,761 0 2,854 400,601 395,949
1990 409,953 3,442 0 3,442 409,953 405,912 1991 409,350 3,424 0 3,424 409,350 405,279 1992 450,852 3,947 0 3,947 450,852 443,555 1993 495,636 4,250 0 4,250 495,636 488,714 1994 572,610 4,568 0 4,568 572,610 565,204 1995 642,869 5,157 1 5,157 642,870 na 1996 676,405 5,453 934 5,490 677,303 na 1997 743,903 5,968 918 6,013 744,776 na 1998 799,075 8,526 841 8,579 799,863 na 1999 886,224 11,788 1,024 11,843 887,193 na 2000 1,024,557 13,818 1,021 13,872 1,025,524 na 2001 960,716 13,237 821 13,283 961,492 na
Table 5: U.S. Manufacturing Exports ($ million)
(1) (2) (3) (4) (1)+(2)+(3)-(4)
Year Databasea
(Using XSIC) XSIC = 3XXXb
SIC87 but not MSICc
MSIC but not SIC87d
Databasee (Using SIC87)
Feenstra (1997)f
1989 279,381 11,443 41 11 290,854 280,820
1990 320,236 10,608 59 16 330,887 321,717 1991 348,759 11,543 42 19 360,326 350,444 1992 371,785 11,717 33 24 383,512 373,877 1993 388,987 11,748 32 25 400,742 390,566 1994 428,388 12,927 26 29 441,311 430,071 1995 481,435 14,048 36 26 495,493 na 1996 512,975 15,256 319 47 528,504 na 1997 576,000 16,164 120 48 592,236 na 1998 573,528 16,710 145 30 590,353 na 1999 582,698 17,102 139 30 599,910 na 2000 646,637 19,004 157 29 665,768 na 2001 599,140 19,338 113 27 618,563 na
Notes: a. General imports and exports computed from the database with MSIC and XSIC codes starting with 2 or 3, excluding 3XXX. b. Sum of products in database with MSIC or XSIC equal to 3XXX. c. Sum of products that are manufacturing according SIC87 but not MSIC or XSIC. d. Sum of products that are manufacturing according to MSIC or XSIC but not SIC87. e. Computed from Database using new HS to SIC87 concordance. f. Computed from SIC import and export data at www.internationaldata.org. These values differ slightly
from those in Feenstra (1996, Table 1) and (1997, Table 3).

12
Canada, Mexico and Israel, and indicates products eligible for any preferential programs such as
the Generalized System of Preferences (GSP), the Caribbean Basin Initiative (CBI) and the
African Growth and Opportunity Act (AGOA). The database provides details of the applicable
tariffs under all of these agreements and programs. Tariffs can of course be inferred using data
on actual tariffs paid and the value of trade. The main information contained in the tariff
schedule that is not available elsewhere is information on applicable tariffs where no trade is
observed. While the MFN tariff can almost always be observed in this way the same is not true
for many preferential tariffs, because in many cases trade in the product between with the
relevant country simply does not take place. The other potential advantage is that the tariff
database provides information separately on specific versus ad valorem tariffs.
There are a number of limitations of the tariff database (Romalis, 2002). One big limitation
is that it does not include information on quotas, such as quotas under the Multi-Fibre Agreement
or special quotas under NAFTA. The database does not include anti-dumping duties or special
duties such as those imposed on certain European Union goods. Information on rules of origin
which impact on eligibility for tariff programs is also absent. The chief difficulty is in mapping all
this additional information on quotas and rules of origin into the HTS. The database also excludes
information on almost all “production sharing” arrangements under which tariffs are only levied
on foreign value added. The data is also based on the first edition of the US tariff schedule for
each year, and any changes within the year will not be captured until the following year. For all
these reasons the tariffs in this database often do not coincide with actual tariffs paid.
The database has been organized in two different ways. The format of one set of files
(USHTSxx.TXT) is kept as closely as possible to the format now used by the US International
Trade Commission (USITC) for summarizing tariff schedules. This allows users to easily update

13
the database as new information is posted by the USITC.15 These files are organized by tariff
program such as MFN, free trade agreements, GSP, or CBI. Another set of files (USTARxx.ASC)
has been created in a format more easily merged with the US trade data described in this paper.
These files list the lowest potential applicable AVE tariff for each 8-digit HTS product and each
country of origin. For example, the estimated AVE tariff for a product from a country that is
potentially eligible for the GSP will be 0 even though not all exports of this product from that
country may meet the requirements of the GSP program.
5. Documentation
Links to all the data are available at www.nber.org/data/. In addition, the data are available
at three sites: www.internationaldata.org (for the HS and SITC import and export data),
www.som.yale.edu/faculty/pks4/sub_international.htm (for the 1987-based SIC trade data) and
gsbwww.uchicago.edu/fac/john.romalis/research/ (for the U.S. tariff data choose Tariff.ZIP).
Documentation for the files available at each of these sites is provided in the following pages.
5.1 Harmonized System Imports
In 1989 and later years, the Harmonized System of commodity classification has been
used to measure disaggregate U.S. imports and exports. The particular application of the
Harmonized System to U.S. imports is called the Harmonized Tariff Schedule (HTS). These
datafiles contains the U.S. import data according to HTS number, distinguished by source
country, and including both quantitative information about imports and descriptive information
about each commodity.
The files IMPYR_1.ASC, IMPYR_2.ASC AND IMPYR_3.ASC contain U.S. import
data for 1989-2001, sorted by HTS numbers, with YR = {a two digit number in the range 89-
01}. The first of these files, IMPYR_1.ASC, includes commodities with a HTS number
beginning with the digits 0-4; the second, IMPYR_2.ASC, contains those includes commodities
with an HTS number beginning with 5-7; and the third, IMPYR_3.ASC, includes those
commodities with a HTS number beginning with 8 or 9.
15 Updates, including the 2002 HTS, are available at http://reportweb.usitc.gov/tariff/tariff_form.jsp .

14
Record Layout: The variables included in IMP*.ASC are: columns 1-10 - Harmonized Tariff System (HTS) number columns 12-17 - Source country code United Nations country codes are used (See COUNTRY.TXT) columns 19-26 - Country name column 28 - Country Sub-Code 0 = Country of Origin 1 = Country of Shipment 4 = Generalized System of Preferences (GSP) Item 9 = Caribbean Basin Initiative (CBI) Item B = Automotive Products Trade Act (APTA) C = Agreement on Trade in Civil Aircraft D = Africa Growth and Opportunity Act (from 2001) I = US-Israel Free Trade Agreement J = Andean Trade Preference Act (ATPA) (from 1992) K = Agreement on Trade in Pharmaceutical Products (from 1995) L = Uruguay Round Concessions on Chemicals for Dyes (from 1995) N = Israeli-Jordanian Qualifying Industrial Zones (from 1999) R = US-Caribbean Basin Trade Partnership Act (from 2000) W = CBI Item (occurs very rarely, may be a misclassification) X = Canada-US Free Trade Agreement (1989-1993) Y = North America Free Trade Agreement (from 1994) Z = Compact of Free Association Act columns 30-33 - 1987 version import-based SIC number (4-digit) columns 35-39 - Revision 2 SITC number (5 digit) columns 41-45 - Revision 3 SITC number (5 digit) columns 47-52 - North American Classification System (NAICS) code (6-digit) columns 54-56 - Units of quantity (see UNIT8901.TXT) columns 58-69 - Quantity, Imports for Consumption columns 71-82 - Quantity, General Imports columns 84-95 - Customs Value, Imports for Consumption (dollars) (Customs value and Imports for Consumption are defined below) columns 97-108 - Customs Value, General Imports (dollars) (Customs value and General Imports are defined below) columns 110-121 - Dutiable Value (dollars) columns 123-133 - Calculated Duties (dollars) (The dutiable value and calculated duties are defined below) columns 135-145 - Import Charges, Imports for Consumption (dollars) (Import charges equal freight plus insurance, as defined below) columns 147-196 - Commodity description (50 character short description from CONIMP89_01.ASC) columns 198-200 - Year (89 – 101)

15
Missing Values:
Missing values for any alphabetic variable are indicated by a blank field, as occurs
especially for the Units of quantity, indicating that either the units could not be measured, or
were simply missing. When the units could not be measured, there will be a zero value for
Quantity, but positive entries for consumption or general value. In other cases, a zero value for
Quantity and also for the consumption and general values indicates that the commodity was not
imported from that country in that year.
The variable dutiable value is missing for 1989, which is indicated by a period.
Variable Definitions:
1. Customs Import Value. The Customs value reflects the value of imports as appraised by the
U.S. Customs Service. This value is generally defined as the price actually paid or payable for
merchandise when sold for exportation to the United States, excluding U.S. import duties,
freight, insurance and other charges incurred in bringing the merchandise to the United States.
2. Imports for Consumption. Imports for Consumption measure the total of merchandise that
has physically cleared through Customs either entering consumption channels immediately or
entering after withdrawal for consumption from bonded warehouses under Customs custody or
from Foreign Trade Zones. Many countries use the term “special imports” to designate statistics
compiled on this basis.
3. General Imports. General Imports measure the total physical arrivals of merchandise from
foreign countries, whether such merchandise enters consumption channels immediately or is
entered into bonded warehouses or Foreign Trade Zones under Customs custody.
4. Dutiable Value of Imports and Calculated Duty. The dutiable value represents in general, the
Customs value of foreign merchandise imported into the United States which is subject to duty.
The calculated duty represents the estimated duty collected. Estimated data are calculated by the
Census based on the applicable rate(s) of duty as shown in the HTS.
5. Import Charges. The import charges represent the aggregate cost of all freight, insurance and
other charges (excluding import duties) incurred in bringing the merchandise from alongside the
carrier at the port of exportation and placing it alongside the carrier at the first port of entry in the
United States. The sum of the Customs value and the charges is the c.i.f. (cost, insurance and
freight) value.

16
6. The import-based SIC (MSIC) codes reported in these files differ from the true domestic
based SIC numbers, as discussed in the main text of the documentation.
7. The NAICS codes were reported by the U.S. Census beginning in 2000. For earlier years,
these codes have been imputed based on the commodities with similar descriptions, or SIC,
SITC, or End use classifications.
Related Files:
1. A complete list of the commodities, including the HTS number for each, 1987 import-based
SIC numbers (4-digit), Rev. 3 SITC number (5-digit), ENDUSE classification, NAICS
classification, units of quantity, and the first and last years that the HTS number is used for that
commodity, is contained in the concordance CONIMP89_01.ASC, which is described in
CONIMP89_01.TXT.
2. The source country for each imported commodity is identified by a name and United Nations
(UN) code. The complete list of names and UN codes, along with a correspondence to the
country codes used by the U.S. Census, is provided in COUNTRY.TXT.
3. There is a cross-reference between the Harmonized Tariff System (HTS) numbers that are
used in the 1989-1994 import files, and the Tariff Schedule of the United States Annotated
(TSUSA) codes that are used in the 1972-1988 import files. This cross-reference is contained in
HS_TSUSA.ASC and described in HS_TSUSA.TXT.
Size: Each file IMP*.ASC is between 11 and 20 megabytes. Sources: The data for 1989 was obtained from:
National Archives and Record Administration, Annual Import Databank, IA245, Record group 29, Washington, D.C. [magnetic tape], 1989.
U.S. Exports History and U.S. Imports History, Historical Summary 1989-1992, on CD-ROM [machine-readable data file], prepared by the Bureau of the Census. Washington: The Bureau [producer and distributor], 1993.
Data for 1990 and later years were obtained from:
U.S. Exports and Imports of Merchandise on CD-ROM [machine-readable data file], prepared by the Bureau of the Census. Washington: The Bureau [producer and distributor], 1990-2001.

17
The same data in printed form are reported in:
U.S. Imports for Consumption, HTSUSA Commodity by Country of Origin, FT247, Bureau of the Census, Washington, D.C., 1989-2001.
Additional information on the variables listed above can be obtained from:
Guide to Foreign Trade Statistics, Bureau of the Census, Department of Commerce, Washington, D.C., 1991.
Web: http://www.census.gov/foreign-trade/www/index.html http://www.census.gov/foreign-trade/www/schedules.html#C http://www.census.gov/foreign-trade/guide/index.html
5.2 Harmonized System Import Concordance
In 1989 and later years, the Harmonized System (HS) of commodity classification has
been used to measure disaggregate U.S. imports and exports. The HS contains approximately
5000 headings and subheadings covering all articles in trade. The particular application of the
Harmonized System to U.S. imports is called the Harmonized Tariff Schedule (HTS).
The file CONIMP89_01.ASC is a concordance that contains a complete list of the HTS
numbers used identify U.S. imports over 1989-2001, along with various information about each
of these commodities.
Record Layout: columns 1-10 - Harmonized Tariff System (HTS) number columns 12-15 - 1987 version import-based SIC code (4-digits) columns 17-21 - Revision 2 SITC code (5-digits) columns 23-27 - Revision 3 SITC code (5-digits) columns 29-33 - End-Use Classification columns 35-40 - North American Classification System (NAICS) code (1997 version, 6-digit) columns 42-44 - First year that this HTS number was used (89 – 101) columns 46-48 - Last year that this HTS number was used (89 – 101) columns 50-52 - Units of quantity (see UNIT8901.ASC) columns 54-103 - Short HTS commodity description columns 105-254 - Long HTS commodity description column 256 - End of record indicator (the number 1) Missing Values: Some units of quantity are missing, which are indicated by a blank.

18
Special Considerations: 1. The HTS number can be repeated due to differing commodity descriptions in various years, or changing units of quantity. For example, the file CONIMP89_01.ASC contains the two lines: 0301920000 0273 03411 01000 112511 1989 1992 EELS (ANGUILLA SPP.), LIVE 0301920000 0273 03411 01000 112511 1993 2001 KG EELS (ANGUILLA SPP.), LIVE This is an example of a repeated HTS number due to a changing unit of quantity. Note,
however, that the range of years over which each HTS number/description/units of quantity
applies is non-overlapping (so that the HTS number and first year used is a unique identifier).
2. The “first year” is computed as the first year that an HTS number is actually used for imports,
while the “last year” is computed as the last year that this HTS number appears in a concordance
from the source below. There are a small number of commodities that are never actually
imported over 1989 - 2001, their HTS numbers do not appear in this concordance.
3. The import-based SIC (MSIC) codes reported in these files differ from the true domestic-
based SIC numbers, as discussed in the main text of the documentation.
4. In the files IMP*.ASC for 1989-2001 and the concordance CON89_01.ASC, the SITC Rev. 3
category 95000 has been introduced for “Gold coin and other coin.” These are distinguished
separately from “Gold numismatic (collector’s) coins,” which has the SITC Rev. 3 number
89650, and the SITC Rev. 2 number 89605. Accordingly, the SITC Rev. 3 number 95000 has
been introduced, with the corresponding SITC Rev. 2 number of 89605.
5. The NAICS codes were reported by the U.S. Census beginning in 2000. For earlier years,
these codes have been imputed based on the commodities with similar descriptions, or SIC,
SITC, or End use classifications.
Related Files: 1. The HTS description, SIC, SITC, NAICS numbers, and units of quantity in this concordance
are identical to those used in the files IMPYR_1.ASC, IMPYR_2.ASC, and IMPYR_3.ASC, for
the years YR=89,90,...,00,01.
2. For years before 1989, imported commodities are identified by the Tariff Schedule of the
United States Annotated (TSUSA) numbers. A concordance of these numbers is contained in

19
CONIMP72_88.ASC, as described in CONIMP72_88.TXT. A cross-reference between the
TSUSA and HTS numbers is contained in HS_TSUSA.ASC, as described in HS_TSUSA.TXT.
3. The units of quantity are described in UNIT8901.ASC.
Size: CONIMP89_94.ASC contains 23,234 records. Sources: Constructed from concordances for 1989-2001 found in: U.S. Exports History and U.S. Imports History, Historical Summary 1989-1992, on CD-ROM
[machine-readable data file], prepared by the Bureau of the Census. Washington: The Bureau [producer and distributor], 1993.
U.S. Exports and Imports of Merchandise on CD-ROM [machine-readable data file], prepared by
the Bureau of the Census. Washington: The Bureau [producer and distributor], 1990-2000.
The most recent concordance is also available at: http://www.census.gov/foreign-trade/www/schedules.html#C
5.3 Harmonized System Exports
For 1989-2001, exports to the United States at a disaggregate level were measured
according to the Harmonized System (HS) classification. These datafiles contain U.S. export
data according to their HS number, distinguished by destination country, and including both
quantitative information about exports and descriptive information about each commodity.
The files EXPYR_1.ASC, EXPYR_2.ASC, and EXPYR_3.ASC contain U.S. export data
for 1989-2001, sorted by HS number, with YR = {a two digit number in the range 89-01}. The
first of these files, EXPYR_1.ASC, includes commodities with a HS number beginning with 0-3;
the second, EXPYR_2.ASC, contains those commodities with a HS number beginning with 4-7;
and the third, EXPYR_3.ASC, contains those commodities with a HS number beginning with 8
or 9.
Record Layout:
The variables included in EXP*.ASC are:

20
columns 1-10 - Harmonized System (HS) number columns 12-17 - Country code United Nations codes are used (see COUNTRY.TXT) columns 19-26 - Country name columns 28-31 - 1987 version export-based SIC number (4-digit) columns 33-37 - Revision 2 SITC number (5 digit) columns 39-43 - Revision 3 SITC number (5 digit) columns 45-50 - North American Classification System (NAICS) code (6-digit) columns 52-54 - Units of quantity (see UNIT8901.TXT) columns 56-67 - Quantity columns 69-80 - Value of exports (dollars) (The value does not include re-exports, as discussed below) columns 82-131 - Description of HS commodity (50 character short description from CONEXP89_01.ASC) columns 133-135 - Year (89 – 101) Missing Values:
Missing values for any alphabetic variable are indicated by a blank field, as occurs especially for
the Units of quantity, indicating that either the units could not be measured, or were simply
missing. When the units could not be measured, there will be a zero value for Quantity, but
positive entries for Value.
Variable Definitions:
1. Export statistics are compiled by the Census according to two types: D (Domestic) or F
(Foreign). Domestic exports are defined as merchandise grown, produced, or manufactured
(including imported merchandise which has been enhanced in value) in the United States
Foreign exports are defined as merchandise that has entered the United States and is being re-
exported in the same condition as when imported. Only the Domestic exports are included in
this data; foreign exports, i.e. re-exports, are not included.
2. The export value is the selling price or cost if not sold, including inland freight, insurance,
and other charges to the U.S. port of export, but excluding unconditional discounts and
commissions. This value is called the F.a.s. (free alongside ship) value.
3. The 1987 export-based SIC numbers are not the same as the SIC numbers used to identify
U.S. industries. This is because industries in the United States are sometimes defined in terms of
the processing that occurs in them, whereas the method of processing may not be known to the
exporter. As a result, a condensed set of SIC numbers called export based SIC are used, as
discussed further in the main documentation.

21
4. It should be noted that the HS commodity numbers for any commodity change over time, so
the only sure way to keep track of a given commodity is by its full alphabetic description.
Related Files:
1. A complete list of the commodities, including the HS number for each, 1987 export-based
SIC numbers (4-digit), Rev. 3 SITC number (5-digit), ENDUSE classification, NAICS
classification, units of quantity, and the first and last years that the HS number is used for that
commodity, is contained in the concordance CONEXP89_01.ASC, which is described in
CONEXP89_01.TXT.
2. The source country for each exported commodity is identified by the name and United
Nations (UN) code. The complete list of names and UN codes, along with a correspondence to
the country codes used by the U.S. Census, is provided in COUNTRY.TXT.
3. For years before 1989, exported commodities are identified by the Schedule B numbers. A
concordance of these numbers is contained in CONEXP78_88.ASC, as described in
CONEXP78_88.TXT. A cross-reference between the Schedule B and HS numbers is contained
in HS_SCH_B.ASC, as described in HS_SCH_B.TXT.
Size: Each file EXP*.ASC is between 9 and 20 megabytes. Sources:
The data for 1989 was obtained from: National Archives and Record Administration, Annual Import Databank, IA245, Record group
29, Washington, D.C. [magnetic tape], 1989. U.S. Exports History and U.S. Imports History, Historical Summary 1989-1992, on CD-ROM
[machine-readable data file], prepared by the Bureau of the Census. Washington: The Bureau [producer and distributor], 1993.
Data for 1990 and later years were obtained from: U.S. Exports and Imports of Merchandise on CD-ROM [machine-readable data file], prepared by
the Bureau of the Census. Washington: The Bureau [producer and distributor], 1990-2001.
The same data in printed form are reported in: U.S. Exports, Harmonized System, Commodity by Country, FT447, Bureau of the Census,
Washington, D.C., 1989-2001.

22
Additional information on the variables listed above can be obtained from: Guide to Foreign Trade Statistics, Bureau of the Census, Department of Commerce,
Washington, D.C., 1991. Web: http://www.census.gov/foreign-trade/www/index.html http://www.census.gov/foreign-trade/www/schedules.html#C http://www.census.gov/foreign-trade/guide/index.html
5.4 Harmonized System Export Concordance
In 1989 and later years, the Harmonized System (HS) of commodity classification has
been used to measure disaggregate U.S. imports and exports. The HS contains approximately
5000 headings and subheadings covering all articles in trade. It replaces the Schedule B system
used in earlier years for exports.
The file CONEXP89_01.ASC is a concordance that contains a complete list of the HS
numbers used identify U.S. exports over 1989-2001, along with various information about each
of these commodities.
Record Layout:
columns 1-10 - Harmonized System (HS) number columns 12-15 - 1987 version export-based SIC code (4-digits) columns 17-21 - Revision 2 SITC code (5-digits) columns 23-27 - Revision 3 SITC code (5-digits) columns 29-33 - End-Use Classification columns 35-40 - North American Classification System (NAICS) code (1997 version, 6-digit) columns 42-44 - First year that this HS number was used (89 – 101) columns 46-48 - Last year that this HS number was used (89 – 101) columns 50-52 - Units of quantity (see UNIT8901.ASC) columns 54-103 - Short HS commodity description columns 105-254 - Long HS commodity description column 256 - End of record indicator (the number 1) Missing Values:
Some units of quantity are missing, which are indicated by a blank. Special Considerations: 1. The HS number can be repeated due to differing commodity descriptions in various years, or
changing units of quantity. For example, the file CONEXP89_01.ASC contains the two lines:

23
0301920000 0273 03410 03411 01000 112511 1989 1992 EELS (ANGUILLA SPP.), LIVE 0301920000 0273 03410 03411 01000 112511 1993 2001 KG EELS (ANGUILLA SPP.), LIVE This is an example of a repeated HS number due to a changing unit of quantity. Note, however,
that the range of years over which each HS number/description/units of quantity applies is non-
overlapping (so that the HS number and first year used is a unique identifier).
2. The first year is computed as the first year that an HS number is actually used for exports,
while the last year is computed as the last year that this HS number appears in a concordance
from the source below. There are a small number of commodities that are never actually
exported over 1989 - 2001, their HS numbers do not appear in this concordance. An important
example is fertilizer, where the concordance includes the line:
3100000000 2874 56200 56200 12510 325312 1989 2001 FERTILIZERS A FERT MATERIALS However, the concordance does NOT include the following lines, which are particular types of
fertilizers, but these HS codes are never used 1989-2001:
3101000000 1989 2001 TON ANIMAL/VEG FERTILIZER, MIXED/NT/CHEMICALLY TREATED 3102100000 1989 2001 TON UREA, WHETHER OR NOT IN AQUEOUS SOLUTION 3102210000 1989 2001 TON AMMONIUM SULFATE 3102290000 1989 2001 TON DOUBLE SALTS & MIXTURES OF AMMONIUM SULFATE, NESOI 3102300000 1989 2001 TON AMMONIUM NITRATE, WHETHER/NOT IN AQUEOUS SOLUTION 3102400000 1989 2001 TON MIXTURES OF AMMONIUM NITRATE W/ CALCIUM CARBONATE 3102500000 1989 2001 TON SODIUM NITRATE 3102600000 1989 2001 TON DOUBLE SALTS & MIXTURES CALCIUM & AMMONIUM NITRATE 3102700000 1989 2001 TON CALCIUM CYANAMIDE 3102800000 1989 2001 TON MIXTURES OF UREA AND AMMONIUM NITRATE IN SOLUTION 3102900000 1989 2001 TON MINERAL/CHEMICAL FERTILIZERS, NITROGENOUS, NESOI 3103100010 1989 2001 TON ENRICH SUPERPHOSPHATES, < 40% PHOSPHORUS PENTOXIDE 3103100020 1989 2001 TON SUPERPHOSPHATES, >=40% PHOSPHORUS PENTOXIDE 3103200000 1989 2001 TON BASIC SLAG 3103900000 1989 2001 TON MINERAL OR CHEMICAL FERTILIZERS, PHOSPHATIC, NESOI 3104100000 1989 2001 TON CARNALLITE & OTHER CRUDE NATURAL POTASSIUM SALTS 3104200000 1989 2001 TON POTASSIUM CHLORIDE 3104300000 1989 2001 TON POTASSIUM SULFATE 3104900000 1989 2001 TON MINERAL OR CHEMICAL FERTILIZER, POTASSIC, NESOI 3105100000 1989 2001 TON PRODUCT OF CHPT 31 IN TABLET/IN PACKAGES <=10 KG 3105200000 1989 2001 TON FERTILERS CONTAIN NITROGEN, PHOSPHORUS & POTASSIUM 3105300000 1989 2001 TON DIAMMONIUM HYDROGENORTHOPHOSPHATE (DAP) 3105400000 1989 2001 TON AMMONIUM DIHYDROGENORTHOPHOSPHATE 3105510000 1989 2001 TON FERTILIZERS CONTAIN NITRATES AND PHOSPHATES 3105590000 1989 2001 TON FERTILIZERS CONTAIN NITROGEN AND PHOSPHORUS, NESOI 3105600000 1989 2001 TON FERTILIZERS CONTAIN PHOSPHORUS & POTASSIUM, NESOI 3105900000 1989 2001 TON FERTILIZERS, NESOI

24
The above HS codes are included in the concordances from Census, but since they have no
exports, they are not included in CONEXP89_01.ASC.
3. The export-based SIC (XSIC) codes reported in these files differ from the true domestic
based SIC numbers, as discussed in the main text of the documentation.
4. The NAICS codes were reported by the U.S. Census beginning in 2000. For earlier years,
these codes have been imputed based on the commodities with similar descriptions, or SIC,
SITC, or End use classifications.
Related Files:
1. The HS description, SIC, SITC, NAICS numbers, and units of quantity in this concordance
are identical to those used in the files EXPYR_1.ASC, EXPYR_2.ASC, and EXPYR_3.ASC, for
the years YR=89,90,...,00,01.
2. For years before 1989, exported commodities are identified by the Schedule B classification.
A concordance of these numbers is contained in CONEXP78_88.ASC, as described in
CONEXP78_88.TXT. A cross-reference between the Schedule B and HS numbers is contained
in HS_SCH_B.ASC, as described in HS_SCH_B.TXT.
3. The units of quantity are described in UNIT8901.ASC.
Size: CONEXP89_00.ASC contains 10,740 records. Sources: Constructed from concordances for 1989-2001 found in: U.S. Exports History and U.S. Imports History, Historical Summary 1989-1992, on CD-ROM
[machine-readable data file], prepared by the Bureau of the Census. Washington: The Bureau [producer and distributor], 1993.
U.S. Exports and Imports of Merchandise on CD-ROM [machine-readable data file], prepared by
the Bureau of the Census. Washington: The Bureau [producer and distributor], 1990-2000.
The most recent concordance is also available at: http://www.census.gov/foreign-trade/www/schedules.html#C

25
5.5 SITC Import and Export Data
Using the files IMP*.ASC and EXP*.ASC for 1972-2001, the import and export data are
summed according to the 5-digit Standard International Trade Classification (SITC) codes. The
results are stored in IMP_SITC72.ASC,....,IMP_SITC01.ASC and EXP_SITC72.ASC,....,
EXP_SITC01.ASC. Here we describe the features of the 1989-2001 data.
Record Layout for 1989 – 2001 import data, IMP_SITC??.ASC:
columns 1-5 - SITC Rev. 2 number (5-digit) columns 7-11 - SITC Rev. 3 number A 5-digit Revision 3 number for 1989-2001 columns 13-18 - Country code (UN codes are used, as listed in COUNTRY.TXT) columns 20-27 - Source country name columns 29-40 - Customs value, Imports for Consumption (dollars) columns 42-53 - Customs value, General Imports (dollars) columns 55-66 - CIF value (dollars) columns 68-79 - Duties paid (dollars) columns 81-83 - Year Record Layout for 1989 – 2001 export data, EXP_SITC??.ASC:
columns 1-5 - SITC Rev. 2 number (5-digit) columns 7-11 - SITC Rev. 3 number A 5-digit Revision 3 number for 1989-2001 columns 13-18 - Country code (UN codes are used, as listed in COUNTRY.TXT) columns 20-27 - Source country name columns 29-40 - Value (dollars) columns 42-44 - Year Special Considerations:
1. See the file IMP89_01.TXT and EXP89_01.TXT for a detailed definition of all variables. CIF
import value is computed as the sum of Customs Value, Imports for Consumption, and Import
Charges (import charges equal freight plus insurance).
2. For 1989-2001, the data are initially organized on a 5-digit SITC Rev. 3 basis. In this case the
concordance SITCR3_2.ASC gives a unique 5-digit SITC Rev. 2 code for each of the Rev. 3
codes. So these Rev. 2 codes were added into the file for each year, and then the records were
re-sorted according to the Rev. 2 codes. As is apparent by inspection, each 5-digit Rev. 2 code
can appear more than once. Thus, to compute the value of imports by 5-digit Rev. 2 code, it
would be necessary to sum over all records for each such code.

26
3. Also included in these files are the variables listed above summed over all source countries, in
which case the Country name is listed as WORLD, and the Country code is 100000.
Size: Each file IMP_SITC*.ASC and EXP_SITC*.ASC is between 2 and 10 megabytes. Related Files:
1. The commodity names corresponding to each SITC code, for each revision of the SITC, are
found in SITCREV1.ASC, SITCREV2.ASC, and SITCREV3.ASC.
2. Concordances between the various revisions of the SITC are found in SITCR2_1.ASC,
SITCR2_3.ASC and SITCR3_2.ASC.
5.6 1987-based SIC Import and Export Data
Using the files IMP*.ASC and EXP*.ASC for 1972-2001, the import and export data are
summed according to the 4-digit Standard Industrial Classification (SIC) codes.
For the years 1972-1994, the bilateral data have been summed according to the 1972
version of the SIC by Robert Feenstra, at www.internationaldata.org . For the years 1989-2001,
the bilateral data have been summed according to the 1987 version of the SIC by Peter Schott, as
documented below and available at at www.som.yale.edu/faculty/pks4/sub_international.htm.
Schott’s master HS10 to SIC4 concordance is contained in HS10_SIC4_8901.ASC.
(1) Record Layout for HS10_SIC4_8901:
The variables included in HS10_SIC4_8901.ASC are listed below, by column. This file is a
space-delimited ASCII file. A STATA version is named HS10_SIC4_8901.DTA.
column 1 - 10 digit Harmonized Tariff System (HTS) number, leading zeros suppressed column 2 - 4 digit SIC code (1987 revision), leading zeros suppressed
(2) Record Layout for MULTILATERAL_8901:
The variables included in MULTILATERAL_8901.ASC are listed below, by column. This file
is a space-delimited ASCII file. A STATA version is named MULTILATERAL _8901.DTA.
column 1 - Year column 2 - 4 digit SIC code (1987 revision), leading zeros suppressed column 3 - Value of exports (dollars) (The value does not include re-exports, as discussed below)

27
column 4 - Customs Value, Imports for Consumption (dollars) (Customs value and Imports for Consumption are defined below) column 5 - Customs Value, General Imports (dollars) (Customs value and General Imports are defined below) column 6 - Dutiable Value (dollars) column 7 - Calculated Duties (dollars) (The dutiable value and calculated duties are defined below) column 8 - Import Charges (dollars) (Import charges equal freight plus insurance, as defined below) Variable Definitions:
1. The export value is the selling price or cost if not sold, including inland freight, insurance,
and other charges to the U.S. port of export, but excluding unconditional discounts and
commissions. This value is called the F.a.s. (free alongside ship) value.
2. Customs Import Value. The Customs value reflects the value of imports as appraised by the
U.S. Customs Service. This value is generally defined as the price actually paid or payable for
merchandise when sold for exportation to the United States, excluding U.S. import duties,
freight, insurance and other charges incurred in bringing the merchandise to the United States.
3. Imports for Consumption. Imports for Consumption measure the total of merchandise that
has physically cleared through Customs either entering consumption channels immediately or
entering after withdrawal for consumption from bonded warehouses under Customs custody or
from Foreign Trade Zones. Many countries use the term “special imports” to designate statistics
compiled on this basis.
4. General Imports. General Imports measure the total physical arrivals of merchandise from
foreign countries, whether such merchandise enters consumption channels immediately or is
entered into bonded warehouses or Foreign Trade Zones under Customs custody.
5. Dutiable Value of Imports and Calculated Duty. The dutiable value represents in general, the
Customs value of foreign merchandise imported into the United States which is subject to duty.
The calculated duty represents the estimated duty collected. Estimated data are calculated by the
Census based on the applicable rate(s) of duty as shown in the HTS.
6. Import Charges. The import charges represent the aggregate cost of all freight, insurance and
other charges (excluding import duties) incurred in bringing the merchandise from alongside the
carrier at the port of exportation and placing it alongside the carrier at the first port of entry in the
United States. The sum of the Customs value and the charges is the c.i.f. (cost, insurance and
freight) value.

28
(3) Record Layout for BILATERAL_8901_????: The variables included in BILATERAL_8901_????.ASC are listed below, by column. This file
is a space-delimited ascii file containing the bilateral data for year ????. A STATA version of
this file is named BILATERAL _8901_????.DTA.
column 1 - UN Country Code (see COUNTRY.TXT) column 2 - Year column 3 - 4 digit SIC code (1987 revision), leading zeros suppressed column 4 - Value of exports (dollars) (The value does not include re-exports, as discussed below) column 5 - Customs Value, Imports for Consumption (dollars) (Customs value and Imports for Consumption are defined below) column 6 - Customs Value, General Imports (dollars) (Customs value and General Imports are defined below) column 7 - Dutiable Value (dollars) column 8 - Calculated Duties (dollars) (The dutiable value and calculated duties are defined below) column 9 - Import Charges (dollars) (Import charges equal freight plus insurance, as defined below) Variable Definitions:
Same as for MULTILATERAL_8901, as described above.
5.7 U.S. Tariff Database
The tab-delimited text files USHTS89.TXT to USHTS01.TXT contain the items listed in
the record layout. Not all items are present in every year. For example, the special rates of duty
for Mexico under NAFTA will of course not appear before 1994. The “MFN_OTHER_RATE”
and “COL2_OTHER_RATE” are missing for Chapter 91 of the HTS (watches and clocks) due to
the complexity of the tariff lines for most of these items. These two rates are missing for all other
products prior to 1997 due to the difficulty of extracting the data from the original tariff files. A
small number of additional products are affected in these years; only a dozen such tariffs apply in
the year 2001.
Record Layout for USHTS??.TXT:
Variable Description
HTS8 8-digit HTS number (the legal tariff line)

29
YEAR Year BRIEF_DESCRIPTION Abbreviated product description QUANTITY_1_CODE Abbreviation of first unit of quantity. Units of Quantity are
described in Appendix B. QUANTITY_2_CODE Abbreviation of second unit of quantity WTO_BINDING_CODE B=Bound U=Unbound MFN_RATE_TYPE_CODE Code for tariff calculation. See Equations below. MFN_AVE Estimated ad valorem equivalent of complete MFN rate MFN_AD_VAL_RATE Ad valorem portion of the MFN duty rate (.05 = 5%) MFN_SPECIFIC_RATE Specific portion of the MFN duty rate (.05 = $.05 per unit of
quantity) MFN_OTHER_RATE Additional portion of the MFN duty rate (.05 =$.05 per unit of
quantity) GSP_INDICATOR A= regular GSP, A*= certain countries excluded from GSP,
A+=GSP for imports from least-developed beneficiary countries (duty-free). A list of GSP eligible countries is contained in the file GSP.TXT. A list of least-developed beneficiary countries is contained in GSP_LDBC.TXT
GSP_CTRY_EXCLUDED Code for country excluded from GSP for that item. See GSPEXCLU.TXT for an explanation of codes
GSP_AVE Estimated ad valorem equivalent of tariffs for countries eligible for GSP treatment
APTA_INDICATOR B= eligible for Automotive Products Trade Act (APTA) tariff preferences (duty-free)
CIVIL_AIR_INDICATOR C= eligible for tariff preferences under the Agreement on Trade in Civil Aircraft (duty-free)
NAFTA_CANADA_IND CA=eligible for NAFTA_CANADA tariff preferences (duty-free)
CANADA_RATE_TYPE_CODE Code for tariff calculation-- see beneath for equations CANADA_AVE Estimated ad valorem equivalent of complete Canada rate CANADA_AD_VAL_RATE Ad valorem portion of the NAFTA-Canada duty rate (.05 =
5%) CANADA_SPECIFIC_RATE Specific portion of the NAFTA-Canada duty rate (.05 = $.05
per unit of quantity) NAFTA_MEXICO_IND MX= eligible for NAFTA_MEXICO tariff preferences MEXICO_RATE_TYPE_CODE Code for tariff calculation-- see beneath for equations MEXICO_AVE Estimated ad valorem equivalent of complete Mexico rate MEXICO_AD_VAL_RATE Ad valorem portion of the NAFTA-Mexico duty rate (.05 =
5%) MEXICO_SPECIFIC_RATE Specific portion of the NAFTA-Mexico duty rate (.05 = $.05
per unit of quantity) CBI_INDICATOR E= eligible for Caribbean Basin Initiative (CBI) tariff
preferences, E*= certain products OR certain countries excluded from CBI on this item. Countries eligible for CBI preferences are listed in the file CBI.TXT. Some CBI

30
countries also eligible for enhanced CBTPA preferences (below).
CBI_AVE Estimated ad valorem equivalent of complete CBI rate CBI_AD_VAL_RATE Ad valorem portion of the CBI duty rate (.05 = 5%) CBI_SPECIFIC_RATE Specific portion of the CBI duty rate (.05 = $.05 per unit of
quantity) AGOA_INDICATOR D= eligible for African Growth and Opportunity Act (AGOA)
tariff preferences (duty-free). Countries eligible for AGOA preferences are listed in the file AGOA.TXT.
CBTPA_INDICATOR R= eligible for Caribbean Basin Trade Partnership Act (CBTPA) tariff preferences. Current beneficiary countries: Belize, Costa Rica, Dominican Republic, El Salvador, Guatemala, Guyana, Haiti, Honduras, Jamaica, Nicaragua, Panama
CBTPA_AD_VAL_RATE Ad valorem portion of the CBTPA duty rate (.05 = 5%) CBTPA_SPECIFIC_RATE Specific portion of the CBTPA duty rate (.05 = $.05 per unit
of quantity) ISRAEL_FTA_INDICATOR IL=eligible for Israel-United States Free Trade Agreement
tariff preference ISRAEL_AVE Estimated ad valorem equivalent of complete Israel rate ISRAEL_AD_VAL_RATE Ad valorem portion of the Israel duty rate (.05 = 5%) ISRAEL_SPECIFIC_RATE Specific portion of the Israel duty rate (.05 = $.05 per unit of
quantity) ATPA_INDICATOR J=eligible for Andean Trade Preference Act (ATPA) tariff
preference, J*= certain products excluded. Applies to products originating in Bolivia, Colombia, Ecuador and Peru
ATPA_AVE Estimated ad valorem equivalent of complete ATPA rate ATPA_AD_VAL_RATE Ad valorem portion of the ATPA duty rate (.05 = 5%) ATPA_SPECIFIC_RATE Specific portion of the ATPA duty rate (.05 = $.05 per unit of
quantity) PHARMACEUTICAL_IND K=eligible for tariff preferences under the Agreement on
Trade in Pharmaceutical Products (duty-free) DYES_INDICATOR L=eligible for tariff preferences under the Uruguay Round
concessions on Intermediate Chemicals for Dyes (duty-free) COL2_RATE_TYPE_CODE Code for Column 2 tariff calculation-- see beneath for
equations COL2_AVE Estimated ad valorem equivalent of complete Column 2 rate.
Countries subjected to Column 2 tariffs are listed in the file Column2TXT
COL2_AD_VAL_RATE Ad valorem portion of the Column 2 duty rate (.05 = 5%) COL2_SPECIFIC_RATE Specific portion of the Column 2 duty rate (.05 = $.05 per unit
of quantity) COL2_OTHER_RATE Additional portion of the Column 2 duty rate (.05 = $.05 per
unit of quantity) BEGIN_EFFECT_DATE Beginning effective date for every element shown for this
item

31
END_EFFECTIVE_DATE Ending effective date for at least one element for this item. There is a new “beginning effective date” whenever a data element for an HTS tariff item is changed. Ending effective dates of 12/31/2100 are tariff items that as of 2001 are not expected to change in the foreseeable future.
UNITVALUE Customs value of imports divided the number of Quantity_1 units imported into the country
Size: Each file is approximately 3 MB.
Tariff Computation Codes:
In each of the following formulas, “Q1” indicates quantity of 1st unit of measure and “Q2”
indicates quantity of 2nd unit of measure
Duty Code Duty Equation 0 0.00 1 Specific rate*Q1 2 Specific rate*Q2 3 (Specific rate*Q1) + (“Other” rate*Q2) 4 (Specific rate*Q1) + (Ad Valorem rate*Value) 5 (Specific rate*Q2) + (Ad Valorem rate*Value) 6 (Specific rate*Q1) + (“Other” rate*Q2) + (Ad Valorem rate*Value) 7 Ad Valorem rate*Value 9 Ad Valorem rate*Derived Duty. Refer to HTS for duty computation. Record Layout USTAR??.ASC:
The ASCII files USTAR89.ASC to USTAR01.ASC include the following variables: columns 1-10 - 8-digit Harmonized System (HS) number columns 11-20 - Country code United Nations codes are used (see COUNTRY.ASC) columns 21-31 - Country name columns 32-41 - Estimated Ad Valorem Equivalent tariff
Size: Each file is between 57MB and 116MB.
Sources:
Files from 1997 onwards have been sourced directly from the USITC at www.usitc.gov. The
main modification has been the calculation of Ad Valorem Equivalent (AVE) tariffs under a
number of import programs using observed unit import values also sourced from the USITC.
32
Files prior to 1997 have been extracted from WordPerfect files of the HTS that were at one time,
but are no longer, posted on the USITC’s website. The major additional change that had to be
made to these was for the 1994 file, which did not include tariff preferences for Mexican goods
under NAFTA because NAFTA had not been approved when the first edition of the1994 HTS
was written. This information was inferred from the NAFTA staging categories kindly provided
by Antoni Estevadeordal of the Inter-American Development Bank.
Missing Values
Missing values occur where there is a specific tariff, but no observable unit price in that year to
enable estimation of the AVE tariff. Missing Values are coded “.”.
Related Files GSP.TXT List of countries eligible for regular GSP benefits
GSP_LDBC.TXT List of least-developed beneficiary countries
GSPEXCLU.TXT Country codes for GSP Exclusions
CBI.TXT List of countries eligible for CBI benefits
AGOA.TXT List of countries eligible for AGOA benefits
COLUMN2.TXT List of countries subjected to Column2 tariff rates
TAR_PROG.TXT Summary of applicable tariff program for each country

33
References
Bernard, Andrew B., J. Bradford Jensen and Peter K. Schott, 2002a, “Survival of the Best-Fit: Competition from Low Wage Countries and the (Uneven) Growth of US Manufacturing Plants,” NBER Working Paper 9170.
Bernard, Andrew B., J. Bradford Jensen and Peter K. Schott, 2002b, “Falling Trade Costs,
Heterogeneous Firms, and Industry Dynamics,” Yale School of Management, mimeo. Feenstra, Robert C., 1996, “U.S. Imports, 1972-1994: Data and Concordances,” NBER
Working Paper 5515. Feenstra, Robert C., 1997, “U.S. Exports, 1972-1994: With State Exports and Other U.S. Data,”
NBER Working Paper 5990. Romalis, John, 2002, “NAFTA’s and CUSFTA’s Impact on North American Trade,” University
of Chicago Graduate School of Business, mimeo. Swenson, Deborah, 1997, “Explaining Domestic Content: Evidence from Japanese and U.S.
Automobile Production in the United States,” in Robert C. Feenstra, ed. The Effects of U.S. Trade Protection and Promotion Policies. Chicago: University of Chicago and NBER, 33-53.
Census Publications U.S. Exports and Imports of Merchandise on CD-ROM [machine-readable data file] / prepared
by the Bureau of the Census. -Washington: The Bureau [producer and distributor], various years.

34
Appendix A: Country Codes and Names (United Nations Basis)
The U.S. import data collected by the Bureau of the Census keeps track of the source
country by certain Census codes. For the import database, the United Nations (UN) country
codes and names are used instead. The file COUNTRY.ASC gives a complete list of the UN
codes, UN country abbreviations, the corresponding Census codes, and the full name of the
Census country. This file is printed on the following two pages.
Record Layout:
columns 1-6 - United Nations (UN) code columns 8-15 - Abbreviated UN country name columns 17-20 - U.S. Census country code columns 22-50 - Full Census country name The records are sorted by the six-digit UN codes. The first two-digits of that code are a regional
identifier, the next three-digits are a specific country code, and the last digit is a special modifier
than equals zero in nearly all cases.
Special considerations: There are more Census country codes than UN codes. This means that
a given UN code may appear on several subsequent records, followed by the same abbreviated
UN country name; on each of these records, a different Census country code and Census county
name will appear. For example, South Africa is treated as one country in the UN codes, but is
broken down into several smaller regions in the Census codes and names.
Related Files: The UN codes and abbreviated country names included in COUNTRY.ASC are
identical to those used in the files IMP*.ASC for 1972-2001.
Size: COUNTRY.ASC has 250 records (including its header). Sources: The UN codes are the six digit Standard Classification of Customs Areas and
Territories, and are the same as that used by Statistics Canada in their World Trade Database.
The Census codes and country names are taken from the file COUNTRY.DBF contained on:
U.S. Exports and Imports of Merchandise on CD-ROM [machine-readable data file] / prepared
by the Bureau of the Census. -Washington: The Bureau [producer and distributor], various years.

35
UN Country US Description code code 117100 S_AFRICA 7910 REPUBLIC OF SOUTH
AFRICA 117100 S_AFRICA 7920 NAMIBIA 117100 S_AFRICA 7930 BOTSWANA 117100 S_AFRICA 7950 SWAZILAND 117100 S_AFRICA 7990 LESOTHO 130120 ALGERIA 7210 ALGERIA 134340 LIBYA 7250 LIBYA 135040 MOROCCO 7140 MOROCCO 135040 MOROCCO 7370 WESTERN SAHARA 137360 SUDAN 7320 SUDAN 137880 TUNISIA 7230 TUNISIA 138180 EGYPT 7290 EGYPT 141200 CAMEROON 7420 CAMEROON 141400 C_AFRICA 7540 CENTRAL AFRICAN
REPUBLIC 141480 CHAD 7560 CHAD 141780 CONGO 7630 CONGO 142660 GABON 7550 GABON 160240 ANGOLA 7620 ANGOLA 161080 BURUNDI 7670 BURUNDI 161800 ZAIRE 7660 ZAIRE 162040 BENIN 7610 BENIN 162260 EQ_GNEA 7380 EQUATORIAL GUINEA 162300 ETHIOPIA 7740 ETHIOPIA 162300 ETHIOPIA 7741 ERITREA 162300 ETHIOPIA 7749 ETHIOPIA 162620 DJIBOUTI 7770 DJIBOUTI 162700 GAMBIA 7500 THE GAMBIA 162880 GHANA 7490 GHANA 163240 GUINEA 7460 GUINEA 163840 IVY_CST 7480 IVORY COAST 164040 KENYA 7790 KENYA 164300 LIBERIA 7650 LIBERIA 164500 MADAGAS 7880 MADAGASCAR 164500 MADAGAS 7881 MAYOTTE 164540 MALAWI 7970 MALAWI 164660 MALI 7450 MALI 164780 MAURITN 7410 MAURITANIA 164800 MRITIUS 7850 MAURITIUS 165080 MOZAMBQ 7870 MOZAMBIQUE 165620 NIGER 7510 NIGER 165660 NIGERIA 7530 NIGERIA 166240 G_BISAU 7642 GUINEA-BISSAU 166240 G_BISAU 7643 CAPE VERDE 166240 G_BISAU 7644 SAO TOME AND
PRINCIPE 166380 FR_IND_O 7890 COMOROS 166380 FR_IND_O 7904 REUNION 166380 FR_IND_O 7905 FR SOUTHERN-
ANTARTIC LANDS 166460 RWANDA 7690 RWANDA 166540 S_HELNA 7580 ST. HELENA 166860 SENEGAL 7440 SENEGAL 166900 SEYCHEL 7800 SEYCHELLES 166900 SEYCHEL 7810 BRITISH INDIAN
OCEAN TERR. 166940 SIER_LN 7470 SIERRA LEONE 167060 SOMALIA 7700 SOMALIA 167160 ZIMBABWE 7960 ZIMBABWE 167680 TOGO 7520 TOGO 168000 UGANDA 7780 UGANDA 168340 TANZANIA 7830 TANZANIA 168540 BURKINA 7600 BURKINA 168940 ZAMBIA 7940 ZAMBIA 211240 CANADA 1220 CANADA 220600 BERMUDA 2320 BERMUDA 223040 GREENLD 1010 GREENLAND 226660 SP_MQEL 1610 ST. PIERRE AND
MIQUELON
330320 ARGENT 3570 ARGENTINA 330680 BOLIVIA 3350 BOLIVIA 330760 BRAZIL 3510 BRAZIL 331520 CHILE 3370 CHILE 331700 COLOMBIA 3010 COLOMBIA 332180 ECUADOR 3310 ECUADOR 334840 MEXICO 2010 MEXICO 336000 PARAGUA 3530 PARAGUAY 336040 PERU 3330 PERU 338580 URUGUAY 3550 URUGUAY 338620 VENEZ 3070 VENEZUELA 341880 COS_RICA 2230 COSTA RICA 342220 SALVADR 2110 EL SALVADOR 343200 GUATMALA 2050 GUATEMALA 343400 HONDURA 2150 HONDURAS 345580 NICARAGA 2190 NICARAGUA 350440 BAHAMAS 2360 BAHAMAS 350520 BARBADO 2720 BARBADOS 351920 CUBA 2390 CUBA 352140 DOM_REP 2470 DOMINICAN REPUBLIC 353120 GUADLPE 2831 GUADELOUPE 353120 GUADLPE 2839 MARTINIQUE 353320 HAITI 2450 HAITI 353880 JAMAICA 2410 JAMAICA 353880 JAMAICA 2430 TURKS AND CAICOS
ISLANDS 353880 JAMAICA 2440 CAYMAN ISLANDS 355320 N_ANTIL 2771 NETHERLANDS
ANTILLES 355320 N_ANTIL 2779 ARUBA 356580 ST_K_NEV 2481 ANGUILLA 356580 ST_K_NEV 2482 BRITISH VIRGIN
ISLANDS 356580 ST_K_NEV 2483 ST. KITTS-NEVIS 356580 ST_K_NEV 2484 ANTIGUA 356580 ST_K_NEV 2485 MONTSERRAT 356580 ST_K_NEV 2486 DOMINICA 356580 ST_K_NEV 2487 ST. LUCIA 356580 ST_K_NEV 2488 ST. VINCENT 356580 ST_K_NEV 2489 GRENADA 357800 TRINIDAD 2740 TRINIDAD AND
TOBAGO 360840 BELIZE 2080 BELIZE 362380 FALK_IS 3720 FALKLAND ISLANDS 362540 FR_GUIAN 3170 FRENCH GUIANA 363280 GUYANA 3120 GUYANA 365900 PANAMA 2250 PANAMA 367400 SURINAM 3150 SURINAME 368960 US_NES 6810 MARSHALL ISLANDS 368960 US_NES 6820 FEDRATED STATES OF
MICRONESIA 368960 US_NES 6830 PALAU 368960 US_NES 9350 GUAM 368960 US_NES 9800 US OUTLYING ISLDS 368961 PRT_RICO 9000 PUERTO RICO 368961 PRT_RICO 9030 PUERTO RICO 368962 VGN_ISL 9110 VIRGIN ISLANDS 413760 ISRAEL 5080 ISRAEL 413760 ISRAEL 5081 ISRAEL 413760 ISRAEL 5082 GAZA STRIP ADMNSTD
BY ISRAEL 413760 ISRAEL 5083 WEST BANK ADMNSTD
BY ISRAEL 413920 JAPAN 5880 JAPAN 440480 BAHRAIN 5250 BAHRAIN 441960 CYPRUS 4910 CYPRUS 443640 IRAN 5070 IRAN 443680 IRAQ 5050 IRAQ 444000 JORDON 5110 JORDAN 444140 KUWAIT 5130 KUWAIT 444220 LEBANON 5040 LEBANON 445120 OMAN 5230 OMAN

36
446340 QATAR 5180 QATAR 446820 SD_ARAB 5160 IRAQ-SAUDI AR. NZ 446820 SD_ARAB 5170 SAUDI ARABIA 447200 YEMEN_S 5220 SOUTH YEMEN 447600 SYRIA 5020 SYRIAN ARAB
REPUBLIC 447840 ARAB_EM 5200 UNITED ARAB
EMIRATES 447920 TURKEY 4890 TURKEY 448860 YEMEN_N 5210 YEMEN ARAB
REPUBLIC 450000 ASIA_NES 5610 BRUNEI 450000 ASIA_NES 5682 BHUTAN 450040 AFGHAN 5310 AFGANISTAN 450500 BNGLDSH 5380 BANGLADESH 451040 BURMA 5460 BURMA 451160 CAMBOD 5550 CAMBODIA 451440 SRI_LKA 5420 SRI LANKA 453440 HONGKONG 5820 HONG KONG 453560 INDIA 5330 INDIA 453600 INDONES 5600 INDONESIA 453600 INDONES 5601 EAST TIMOR
(from 2001) 453600 INDONES 5683 MALDIVE ISLANDS 454100 KOREA_S 5800 KOREA, REPUBLIC OF 454180 LAO 5530 LAOS 454460 MACAU 5660 MACAO 454580 MALAYSIA 5570 MALAYSIA 455240 NEPAL 5360 NEPAL 455860 PAKISTAN 5350 PAKISTAN 456080 PHIL 5650 PHILIPPINES 457020 SINGAPR 5590 SINGAPORE 457640 THAILAND 5490 THAILAND 458960 TAIWAN 5830 CHINA (TAIWAN) 460310 AZERBAIJ 4632 AZERBAIJAN 460510 ARMENIA 4631 ARMENIA 462680 GEORGIA 4633 GEORGIA 463980 KAZAKHST 4634 KAZAKHSTAN 464170 KYRGYZST 4635 KYRGYZSTAN 467620 TAJIKIST 4642 TAJIKISTAN 467950 TURKMENI 4643 TURKMENISTAN 468600 UZBEKIST 4644 UZBEKISTAN 481560 CHINA 5700 CHINA (MAINLAND) 484080 KOREA_N 5790 NORTH KOREA 484960 MONGOLA 5740 MONGOLIA 487040 VIETNAM 5520 VIETNAM 530560 BEL_LUX 4231 BELGIUM 530560 BEL_LUX 4239 LUXEMBOURG 532080 DENMARK 4091 FAROE ISLAND 532080 DENMARK 4099 DENMARK 532500 FRANCE 4271 ANDORRA 532500 FRANCE 4272 MONACO 532500 FRANCE 4279 FRANCE 532800 GERMAN 4280 FEDERAL REPUBLIC
OF GERMANY 533000 GREECE 4840 GREECE 533720 IRELAND 4190 IRELAND 533800 ITALY 4751 SAN MARINO 533800 ITALY 4752 VATICAN CITY 533800 ITALY 4759 ITALY 535280 NETHLDS 4210 NETHERLANDS 536200 PORTUGAL 4710 PORTUGAL 537240 SPAIN 4700 SPAIN 538260 UKINGDOM 4120 UNITED KINGDOM 550400 AUSTRIA 4330 AUSTRIA 552460 FINLAND 4050 FINLAND 553520 ICELAND 4000 ICELAND 555780 NORWAY 4031 SVALBARD, JAN
MAYEN IS 555780 NORWAY 4039 NORWAY 557520 SWEDEN 4010 SWEDEN 557560 SWITZLD 4411 LIECHTENSTEIN
557560 SWITZLD 4419 SWITZERLAND 572920 GILBRALT 4720 GIBRALTAR 574700 MALTA 4730 MALTA AND GOZO 580080 ALBANIA 4810 ALBANIA 581000 BULGARIA 4870 BULGARIA 581120 BELARUS 4622 BELARUS 582000 CZECHO 4350 FM CZECHOSLOVAKIA 582030 CZECHREP 4351 CZECH REPUBLIC 582330 ESTONIA 4470 ESTONIA 582780 GERMAN_E 4290 FM EAST GERMANY 583480 HUNGARY 4370 HUNGARY 584280 LATVIA 4490 LATVIA 584400 LITHUANI 4510 LITHUANIA 584980 MOLDOVA 4641 REP MOLDOVA 586160 POLAND 4550 POLAND 586420 ROMANIA 4850 ROMANIA 586430 RUSSIA 4621 RUSSIA 587030 SLOVAKIA 4359 SLOVAKIA 588040 UKRAINE 4623 UKRAINE 590700 BOSNIA-H 4793 BOSNIA-HERZEGOVINA 591910 CROATIA 4791 CROATIA 597050 SLOVENIA 4792 SLOVENIA 598070 MACEDONI 4794 MACEDONIA 598900 YUGOSLAV 4790 FORMER YUGOSLAVIA 598910 YUGOSLAV 4799 YUGOSLAVIA 688100 USSR 4610 FORMER USSR 710360 AUSTRAL 6021 AUSTRALIA 710360 AUSTRAL 6022 NORFOLK ISLAND 710360 AUSTRAL 6023 COCOS ISLANDS 710360 AUSTRAL 6024 CHRISTMAS ISLAND 710360 AUSTRAL 6029 HEARD AND MCDONALD
ISLANDS 715540 NEW_ZEAL 6141 NEW ZEALAND 715540 NEW_ZEAL 6142 COOK ISLANDS 715540 NEW_ZEAL 6143 TOKELAU ISLANDS 715540 NEW_ZEAL 6144 NIUE 722420 FIJI 6862 NAURU 722420 FIJI 6863 FIJI 722420 FIJI 6864 TONGA 722960 KIRIBATI 6223 SOLOMON ISLANDS 722960 KIRIBATI 6224 VANUATU 722960 KIRIBATI 6225 PITCAIRN ISLAND 722960 KIRIBATI 6226 KIRIBATI 722960 KIRIBATI 6227 TUVALU ISLANDS 725400 NEW_CALE 6412 NEW CALEDONIA 725400 NEW_CALE 6413 WALLIS AND FUTUNA 725400 NEW_CALE 6414 FRENCH POLYNESIA 725980 NEW_GUIN 6040 PAPUA NEW GUINEA 728882 SAMOA 6150 WESTERN SAMOA 728882 SAMOA 9510 AMERICAN SAMOA 999999 UNKNOWN 8220 UNIDENTIFIED 999999 UNKNOWN 8500 UNIDENTIFIED 999999 UNKNOWN 9610 NORTHERN MARIANA
ISLANDS 999999 UNKNOWN 9980 UNIDENTIFIED

37
Appendix B: Units for Quantity The following units for quantity are used in EXP*.ASC and IMP*.ASC for 1989-2001: BBL Barrel CAR Carat CBM Cubic Meters CKG Content Kilogram CTN Content Metric Ton CUR Curie CYK Clean Yield Kilogram DOZ Dozen DPC Dozen Pieces DPR Dozen Pair FBM Fiber Meter GCN Gross Containers GKG Kilogram (gross) GM Gram GRS Gross HUN Hundred KG Kilograms KGS Kilogram Total Sugars KWH Kilowatt-hours LTR Liters M2 Square Meters MC Milli-Curie MCU Micro-Curie MTR Meter NO Number ODE Ozone Depletion Equivalent PCS Pieces PFL Proof Liter PKS Packs PRS Pairs RBA Running Bales SCM Square Centimeters SET Sets SQ Square SQM Square meters TBE Thousand Standard Brick Equivalent TCM Thousand Cubic Meter THS Thousands TON Metric Ton (blank) Unknown (or mixed units)