u.s. international food assistance report 1997pdf.usaid.gov/pdf_docs/pnacc210.pdf · u.s....
TRANSCRIPT
U.S. INTERNATIONAL FOOD ASSISTANCE
REPORT 1997
United States Agency for International Development
Washington, D.C.
January 1998

U.S. INTERNATIONAL FOOD ASSISTANCE REPORT, 1997
This report may be ordered fromUSAID Development Experience Clearinghouse (DEC)
1611 North Kent StreetSuite 200
Arlington, VA 22209-2111Telephone: (703) 351-4006
Fax: (703) 351-4039E-mail: [email protected]

U.S. INTERNATIONAL FOOD ASSISTANCE REPORT, 1997
This report has been prepared by theU.S. Agency for International Development,
Bureau for Humanitarian Response,In cooperation with the U.S. Department of Agriculture,
Washington, D.C.

U.S. INTERNATIONAL FOOD ASSISTANCE REPORT, 1997
I
TABLE OF CONTENTS
LIST OF ACRONYMS IIILIST OF FY 1997 COOPERATING SPONSORS VPREFACE VII
EXECUTIVE SUMMARY 1INTRODUCTION 3
OVERVIEW OF THE U.S. FOOD AID PROGRAM 3THE FOOD SECURITY CONCEPT IN P. L. 480 4DEFINING FOOD SECURITY 4
I. THE CHALLENGE: GLOBAL HUNGER AND FOOD INSECURITY 5UNIVERSAL COMMITMENT TO FOOD SECURITY 5POVERTY AND OTHER CAUSES OF FOOD INSECURITY 6THE CONSTRAINTS FACING FOOD AID 6
GLOBAL FOOD SUPPLY AND DEMAND 6PROJECTIONS OF FOOD AID NEEDS 7REGIONAL FOOD INSECURITY: WHERE ARE THE MOST FOOD INSECURE POPULATIONS
CONCENTRATED? 8SUB-SAHARAN AFRICA
SOUTH AND EAST ASIA
CONSTRAINTS TO THE AVAILABILITY OF FOOD AID 9INCREASED EMERGENCY FOOD AID REQUIREMENTS
DECLINING AVAILABILITY OF FOOD AID
THE MISMATCH BETWEEN SUPPLY AND DEMAND: THE NEED TO BETTER TARGET FOOD AID
II. THE RESPONSE: FOCUSING THE U.S. P.L. 480 FOOD AID PROGRAM ON FOOD SECURITY 15U.S. FOOD AID POLICY AND STRATEGY 16
U.S. FOOD AID POLICY 16U.S. FOOD AID STRATEGY 17
A GLOBAL PARTNERSHIP TO ACHIEVE FOOD SECURITY 18U.S. PREPARATION AND RESPONSE TO THE WORLD FOOD SUMMIT 18
GLOBAL FOOD SECURITY PARTNERS 19UNITED STATES-EUROPEAN UNION (U.S.-EU) COOPERATION 19U.S. SUPPORT OF REGIONAL EFFORTS: GREATER HORN OF AFRICA 20
USAID-ADMINISTERED FOOD AID 21P.L. 480 TITLE II: EMERGENCY AND DEVELOPMENT ASSISTANCE PROGRAMS 21
STRATEGIC PLAN 1997-2001P.L. 480 TITLE III: FOOD FOR DEVELOPMENT 22THE FARMER-TO-FARMER PROGRAM 22
USDA-ADMINISTERED FOOD AID PROGRAMS 23P.L. 480 TITLE I: TRADE AND DEVELOPMENT ASSISTANCE 23FOOD FOR PROGRESS 23
III. HIGHLIGHTS: THE PROGRAM IN NUMBERS 24TITLE I 24TITLE II OVERVIEW 24
TITLE II DEVELOPMENT ACTIVITIES 24TITLE II EMERGENCY ACTIVITIES 29

U.S. INTERNATIONAL FOOD ASSISTANCE REPORT, 1997
II
TITLE III 30SECTION 202(E) AND INSTITUTIONAL SUPPORT GRANTS 31
IV. ACCOMPLISHMENTS 1997: IMPROVED MANAGEMENT OF THE U.S. P.L. 480 FOOD AID PROGRAM
FOR IMPACT ON FOOD INSECURITY 32CURRENT TITLE II EMERGENCY AND DEVELOPMENT OPERATING FRAMEWORK 331. LINKING RELIEF AND DEVELOPMENT 332. EMERGENCY AND RELIEF ACTIVITIES: BETTER TARGETING CRITICAL NEEDS OF
VULNERABLE GROUPS 34DOCUMENTING CHANGE IN NUTRITIONAL STATUS OF TARGET
GROUPS
IMPROVING TARGETING THROUGH CONTINUOUS NEEDS ASSESSMENTS
3. INTEGRATION OF TITLE II FOOD AID RESOURCES AS COMPONENTS OF MISSION
STRATEGIC PLANNING 37COUNTRY CASES – SUCCESSFUL TITLE II DEVELOPMENT
ACTIVITY INTEGRATION
4. IMPROVED TECHNICAL CAPACITY OF PVOS, FFP AND MISSIONS 42INSTITUTIONAL SUPPORT GRANTS AND SECTION 202(E) SUPPORT
FOR PVO/NGO/IO STRENGTHENING
5. COLLABORATION WITH OTHER DONORS 446. PERFORMANCE INDICATORS AND MEASUREMENT 457. PARTNER STRENGTHENING
TITLE III 49THE FARMER-TO-FARMER PROGRAM 51USDA-ADMINISTERED PROGRAMS 52LONG-TERM LESSONS OF FOOD AID 53
AFRICA: MOZAMBIQUE CASE REPORT 55LATIN AMERICA: PERU CASE REPORT 58ASIA & NEAR EAST: BANGLADESH CASE REPORT 60
ANNEXES 63
1. BASIC U.S. FOOD AID PROGRAMS: DESCRIPTIONS 642. LIST OF TITLE I, II & III COUNTRIES 653. SUMMARY BUDGET, COMMODITY AND TONNAGE TABLES FOR USDA TITLE I, TITLE I-
FUNDED FOOD FOR PROGRESS ACTIVITIES & USAID TITLE III PROGRAMS 664. SUMMARY BUDGET, COMMODITY AND TONNAGE TABLES FOR USDA CCC-FUNDED FOOD
FOR PROGRESS ACTIVITIES 675. SUMMARY BUDGET, COMMODITY, RECIPIENT AND TONNAGE TABLES FOR USAID TITLE II
DEVELOPMENT AND EMERGENCY ACTIVITIES 68-706. TITLE II STRATEGIC OBJECTIVES (SO1 AND SO2) AND INTERMEDIATE RESULTS (IRS)
FRAMEWORKS 71-727. TITLE II DEVELOPMENT ACTIVITIES & COMPONENTS TABLE 738. TITLE II EMERGENCY ACTIVITIES & COMPONENTS TABLE 74-759. TITLE II CONGRESSIONAL MANDATES 7610. SECTION 202(E) AND INSTITUTIONAL SUPPORT GRANT (ISG) FUNDING, 1997 7711. GENERIC INDICATORS DESCRIPTION AND TABLE 78-7912. FOOD AID SHIPMENTS (CEREALS) BY DONOR, 1971-1997 & OBLIGATIONS UNDER THE
FOOD AID CONVENTION (FAC), 1986-1996 80
U.S. INTERNATIONAL FOOD ASSISTANCE REPORT, 1997
III
LIST OF ACRONYMS
BHR Bureau for Humanitarian ResponseCCC Commodity Credit CorporationCDO Cooperative Development OrganizationCFW Cash-for-WorkCIDA Canadian International Development AgencyCMR Child Mortality RateCS Cooperating SponsorDA Development Assistance (funds)DAP Development Activity ProposalERS Economic Research Service (USDA)EU European UnionFAC Food Aid ConventionFAC Food Aid Coordinating Committee/Sierra LeoneFACG Food Aid Consultative GroupFAMP Food Aid Management PlanFAO Food and Agriculture Organization of the United NationsFFE Food-for-EducationFFP Office of Food for Peace (in USAID/BHR Bureau)FFP/DP Development Programs Division in FFPFFP/ER Emergency Response Division in FFPFFPO Food for Peace OfficerFFPr Food for Progress Program of P.L.480 Title IFFW Food-for-WorkFTE Full-time equivalent (direct-hire staff)GDP Gross domestic productGHAI Greater Horn of Africa InitiativeGNP Gross national productICRC International Committee of the Red CrossIFPRI International Food Policy Research InstituteIGAD Inter-Governmental Authority on DevelopmentIMR Infant mortality rateIO International organizationIR Intermediate ResultISG Institutional Support GrantLAC Latin America and Caribbean Bureau (USAID)LB Live BirthsLBW Low Birth WeightLDC Least developed countryLIFDC Low-Income Food-Deficit CountryMCH Maternal-child healthM&E Monitoring and evaluationMOU Memorandum of UnderstandingMT Metric ton(s)NIS Newly Independent States of the Former Soviet UnionNGO Non-Governmental OrganizationOCF Other child feeding
U.S. INTERNATIONAL FOOD ASSISTANCE REPORT, 1997
IV
OFDA Office of U.S. Foreign Disaster Assistance (USAID)OE Operating Expense (funds)OYB Operating Year BudgetPAA Previously Approved (Title II) ActivityP.L. 480 U.S. Public Law 480PVO Private voluntary organizationR4 USAID’s Results Report and Resources RequestREDSO Regional Economic Development Support Office/USAIDSection 202(e) Section of USAID’s P.L. 480 authorizing funds to support Title II
activitiesSD Standard DeviationSF School feedingSO Strategic ObjectiveSO1 BHR/FFP's Strategic Objective #1SO2 BHR/FFP's Strategic Objective #2SPO Special ObjectiveUNDP United Nations Development ProgramUNHCR United Nations Office of the High Commissioner for
RefugeesUNICEF United Nations Children’s FundUSAID United States Agency for International DevelopmentUSDA United States Department of AgricultureWFP United Nations World Food ProgramWFS World Food SummitWHO World Health Organization

U.S. INTERNATIONAL FOOD ASSISTANCE REPORT, 1997
V
LIST OF FY 1997 COOPERATING SPONSORS
ACDI/VOCA Agricultural Cooperative Development International/Volunteers in Overseas Cooperative Assistance
ADRA Adventist Development and Relief AgencyAFRICARE AfricareAG.FOUND Agricultural FoundationAGUDATH Agudath Israel of America, Inc.AIA American International Association of the Hematologists
of the World for Children, Inc.AKF Aga Khan FoundationARC American National Red CrossCARE Cooperative for Assistance and Relief Everywhere, Inc.CARITAS/Bolivia Caritas BoliviaCARITAS/Peru Caritas PeruCFI COUNTERPART FOUNDATION INC.CHAMAH ChamahCITIHOPE CitiHope InternationalCNFA Citizens Network for Foreign AffairsCRM Christian Rescue MissionCRS Catholic Relief Services – USCCDOULOS Doulos Community, Inc.DPPC Disaster Prevention and Preparedness
Commission/EthiopiaEOC Ethiopian Orthodox ChurchFAR Fund for Armenian ReliefFHI Food for the Hungry, Inc.FTC Feed the ChildrenGJARN Global Jewish Assistance Relief NetworkIOCC International Orthodox Christian CharitiesIPHD International Partnership for Human DevelopmentLEA Lishkas Ezras AchimMCI Mercy Corps InternationalNCBA/CLUSA National Cooperative Business AssociationNPA Norwegian Peoples’ AidOICI Opportunities Industrialization Centers International,
Inc.PCI Project Concern InternationalPRISMA Projects in Agriculture, Rural Industry, Science &
Medicine, Inc./PeruPROJECT AID Project AidREST Relief Society of TigrayRFCP/CBI Russian Farm Community Project, Inc./Cooperative
Business InternationalSALESIANS (SSI) Salesian MissionsSAWSO Salvation Army World Service OfficeSCF Save the Children Federation, Inc./USA

U.S. INTERNATIONAL FOOD ASSISTANCE REPORT, 1997
VI
SHARE World SHARETECHNOSERVE TechnoServeUMCOR United Methodist Committee on ReliefWFP World Food ProgramWINROCK/WI Winrock International Institute for Agricultural
DevelopmentWVRD World Vision Relief and Development, Inc.

U.S. INTERNATIONAL FOOD ASSISTANCE REPORT, 1997
VII
PREFACE
This report provides an overview of United States (U.S.) Government foodassistance activities through Public Law 480 (P.L. 480) and related statutesduring FY 1997. The United States Agency for International Development(USAID), which administers P.L. 480's Title II and Title III programs, isresponsible for the bulk of U.S. food aid assets. The U.S. Department ofAgriculture (USDA) administers Title I and Food for Progress (FFPr) projects.Despite budgetary constraints, the United States (U.S.) remains the world's majorprovider of food assistance. Moreover, given the legal framework of theGovernment Performance and Results Act, we are committed to continuallylooking at ways to improve food aid programs: planning strategically, relatingbudgets to a performance plan, evaluating and compiling accomplishments,evaluating them and reporting to the public.
Chapter I, "The Challenge: Global Hunger and Food Insecurity," focuses on themore than 800 million people today who are chronically undernourishedincluding over180 million underweight children. It analyzes the growing needfor food aid resources in the face of their declining global availability and therising requirements for emergency food aid. The growing mismatch betweenfood aid supply and demand emphasizes the need for more focussed geographicaltargeting of food assistance and directed use of food aid in projects which have astheir goals and objectives sustainable development leading to the alleviation offood insecurity.
Chapter II, "The Response: Focusing the U.S. P.L. 480 Food Aid Program onFood Security," reviews the policy framework through which the U.S.Government is improving its food aid programs to more efficiently respond toemergencies and help food insecure populations reach the point where they canfeed themselves.
Chapter III, “Highlights: The Program in Numbers,” provides an overview of theFY 1997 program in terms of resources allocated to each program component, asillustrated by graphs and figures.
Chapter IV, "Accomplishments 1997: Improved Management of the U.S.P.L.480 Food Aid Program for Impact on Food Security," reports on progressthrough systematic review of program performance indicators, documenting bothpeople-level impacts and improvements in food aid management and thetechnical capacity of USAID, its cooperating partners and sponsors. Continuousneeds assessments; integration of Food Aid resources with other assistanceresources (particularly USAID resources); reinforced donor coordination; andrefined performance indicators to better track results – provide a snapshot ofhow food aid is presently organized and used.
This report constitutes the Administration's Annual Report to Congress onprogress toward food security in countries receiving U.S. food assistance.
U.S. INTERNATIONAL FOOD ASSISTANCE REPORT, 1997
1
EXECUTIVE SUMMARY
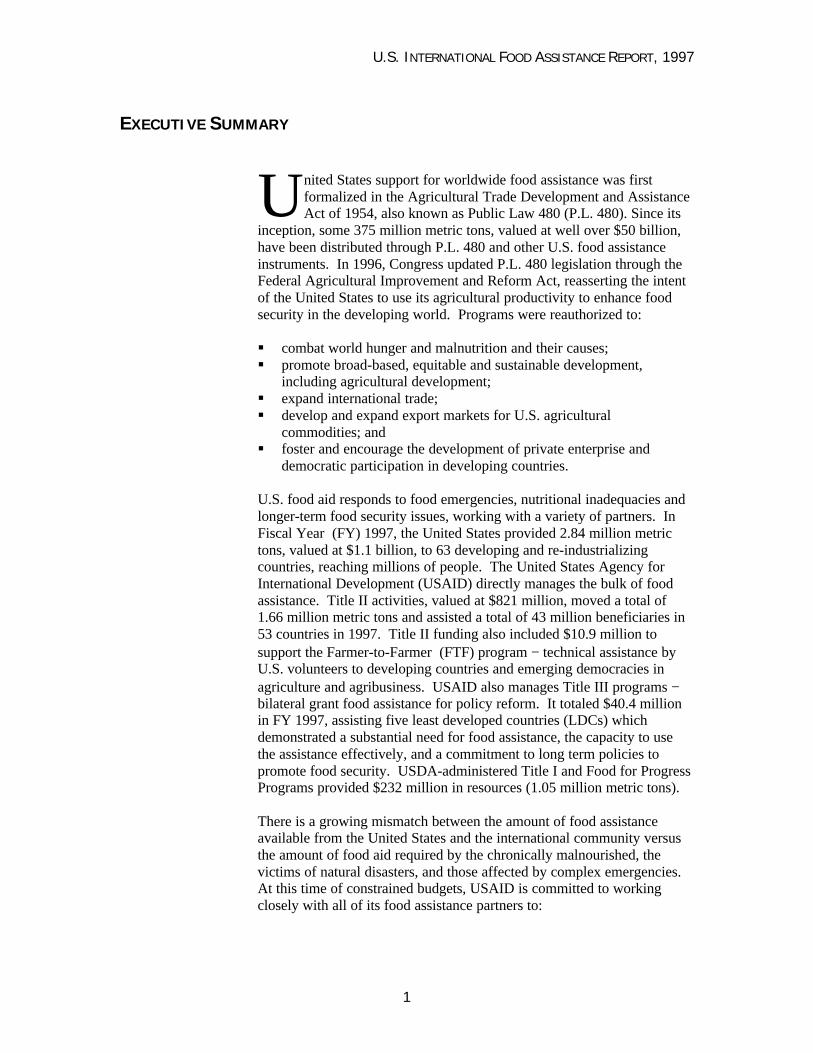
nited States support for worldwide food assistance was firstformalized in the Agricultural Trade Development and AssistanceAct of 1954, also known as Public Law 480 (P.L. 480). Since its
inception, some 375 million metric tons, valued at well over $50 billion,have been distributed through P.L. 480 and other U.S. food assistanceinstruments. In 1996, Congress updated P.L. 480 legislation through theFederal Agricultural Improvement and Reform Act, reasserting the intentof the United States to use its agricultural productivity to enhance foodsecurity in the developing world. Programs were reauthorized to:
§ combat world hunger and malnutrition and their causes;§ promote broad-based, equitable and sustainable development,
including agricultural development;§ expand international trade;§ develop and expand export markets for U.S. agricultural
commodities; and§ foster and encourage the development of private enterprise and
democratic participation in developing countries.
U.S. food aid responds to food emergencies, nutritional inadequacies andlonger-term food security issues, working with a variety of partners. InFiscal Year (FY) 1997, the United States provided 2.84 million metrictons, valued at $1.1 billion, to 63 developing and re-industrializingcountries, reaching millions of people. The United States Agency forInternational Development (USAID) directly manages the bulk of foodassistance. Title II activities, valued at $821 million, moved a total of1.66 million metric tons and assisted a total of 43 million beneficiaries in53 countries in 1997. Title II funding also included $10.9 million tosupport the Farmer-to-Farmer (FTF) program − technical assistance byU.S. volunteers to developing countries and emerging democracies inagriculture and agribusiness. USAID also manages Title III programs −bilateral grant food assistance for policy reform. It totaled $40.4 millionin FY 1997, assisting five least developed countries (LDCs) whichdemonstrated a substantial need for food assistance, the capacity to usethe assistance effectively, and a commitment to long term policies topromote food security. USDA-administered Title I and Food for ProgressPrograms provided $232 million in resources (1.05 million metric tons).
There is a growing mismatch between the amount of food assistanceavailable from the United States and the international community versusthe amount of food aid required by the chronically malnourished, thevictims of natural disasters, and those affected by complex emergencies.At this time of constrained budgets, USAID is committed to workingclosely with all of its food assistance partners to:
U

U.S. INTERNATIONAL FOOD ASSISTANCE REPORT, 1997
2
§ better target food aid activities so that assistance reaches the mostvulnerable groups without disrupting local production;
§ work closely with host country counterparts and non-governmentalorganizations to ensure sustainability through increased local capacityand program ownership;
§ continue efforts to better understand the people-level impact of foodaid programs;
§ continue forward momentum on common, generic food aidperformance indicators and mutually acceptable methodologies thatpartners and USAID can use in measuring the impact of food aid; and
§ improve sound monitoring and evaluation systems.
During FY 1997, Title II became a more tightly focussed program with acoherent set of development-oriented food security objectives,increasingly directed to the most food insecure and disadvantagedpopulation groups. USAID developed for the Title II Program twoStrategic Food Assistance Objectives. Progress was made on improvingtargeting through continuous needs assessments; documenting change innutritional status of target groups; integration of Title II food aidresources as components of USAID Mission strategic planning;collaboration with other donors; and progress on emplacement ofmeasurable performance indicators.
On the broader issue of food security, donor-supplied food aid, whilecritical for emergencies and other direct feeding programs, is but oneelement of response. In the long-term, each country must develop its ownpolicies to increase food and agricultural productivity and increase accessto food, particularly for the lowest income populations. Specifically, theWorld Food Summit (Rome, November 1996) encouraged donors tosharpen the focus of their food aid on the most chronically food insecurecountries and regions, provide an appropriate volume of food aid on thebasis of need, establish incentives to encourage the best use of food aid,and strive to ensure that food assistance reaches those who have the mostresponsibility for household food security, especially women. To betteraddress these challenges, the United States is in the process of revisitingthe objectives of P.L. 480, to improve both its effectiveness in helpingfood insecure populations reach the point where they can feed themselves,and its efficiency in responding to emergencies– all in an era of changingagricultural trade and production circumstances.
All of the options under discussion in the proposed U.S. Action Plan forFood Security call for a continuing U.S. leadership role. As USAIDAdministrator, J. Brian Atwood expressed in a recent address to theOverseas Development Council:
"Programs that save children, and educate them, giveeconomic opportunity and dignity to the poor andstrengthen civil society are not merely humanitarian, theycontribute to the productive capacity of society. Theycontribute to sustainable growth with equity."
“Compassion is not
weakness, and
concern for the
unfortunate is not
socialism.”
Hubert Humphrey
"(Individual)
governments have
the primary
responsibility for
creating an economic
and political
environment that
assures the food
security of their
citizens, involving for
this purpose all
elements of civil
society."
(World Food Summit's
Plan of Action)
U.S. INTERNATIONAL FOOD ASSISTANCE REPORT, 1997
3
INTRODUCTION
OVERVIEW OF THE U.S. FOOD AIDPROGRAM
ublic Law 480 (P.L. 480) was enacted in1954 as the United States primary foodassistance legislation. Since then, P.L. 480
has provided about 375 million metric tons (MT)of commodities valued at over $50 billion. Thelegislation and its three “Titles” define theprograms and objectives authorized.
United States policy has evolved to reflect theconcern of its citizens for the less fortunate,tempered by the realization that such concern canbe effectively expressed only by maintaining U.S.strength and global leadership, particularly in theagriculture sector. Food assistance isimplemented largely by Cooperating Sponsors(CS), mainly U.S. private voluntary organizations(PVOs), the World Food Program (WFP),cooperative development organizations (CDOs),and non-governmental organizations (NGOs).
P
§ Title I provides for the sale of agriculturalcommodities to developing countries and privateentities for long-term concessional dollars credit.$245 million is approved for FY 1998.
§ Title II provides emergency & developmentassistance in partnership with PVOs, NGOs andthe World Food Program (WFP). $837 million isapproved for FY 1998.
§ Title III provides government-to-governmentcommodity donations to developing countries,tied to policy reforms. $30 million is approvedfor FY 1998.
Three other U.S.Food Aid Authoritiesare available tosupport internationalfood assistance:
Food for Progress Actof 1985
Food SecurityCommodity ReserveAct of 1996 whichprovides up to 4million MT for urgenthumanitarianassistance.
Section 416 (b) ofthe Agricultural Actof 1949.
Public Law 480 (P.L. 480) was
enacted in 1954, and
amended by the Federal
Agriculture Improvement and
Reform Act of 1996 (FAIR),
commonly referred to as the
“1996 Farm Bill”. This food
aid legislation states:
“It is the policy of the United
States to use its abundant
agricultural productivity to
promote the foreign policy of
the United States by
enhancing the food security of
the developing world through
the use of agricultural
commodities and local
currencies accruing under this
Act to–
1. combat world hunger and
malnutrition and their causes;
2. promote broad-based,
equitable, and sustainable
development, including
agricultural development;
3. expand international
trade;
4. develop and expand
export markets for United
States agricultural
commodities; and
5. foster and encourage the
development of private
enterprise and democratic
participation in developing
countries.”

U.S. INTERNATIONAL FOOD ASSISTANCE REPORT, 1997
4
THE FOOD SECURITY CONCEPT IN P.L. 480
P.L. 480 has been modified over the years toreflect changes in U.S. foreign and domesticpolicy, the latest being in the Federal AgricultureImprovement and Reform (FAIR) Act of 1996.The FAIR Act re-asserted the U.S. policy ofusing its agricultural productivity to enhance foodsecurity in the developing world.
DEFINING FOOD SECURITY
“Food security,” as defined in the U.S. Position Paperfor the World Food Summit (November 1996), has beenaccepted by most nations. It encompasses the threedimensions of access, availability and utilization of foodfor all, that are necessary to achieve food security.There is a recognition that nations must provide thesocial and economic conditions to enable their citizens toproduce food and/or earn sufficient money to buy foodto meet their needs, and the Declaration from the WorldFood Summit includes seven agreed upon commitments“to reinforce national actions to implement sustainablefood security policies.”
Linking food aid to food security and nutrition is critical.The “food security” concept now serves as a planningtool and framework for the conceptualization and designof food-aid programs and projects and for measuringtheir “people-level” impact. While there remains to beaccomplished a great deal in terms of wedding all food-aid practitioners to the overall goals, objectives, focus,and strategy of U.S. food aid to promote food security,enormous strides have been taken. Significant progresshas been made in the past several years to facilitate theuse of food security as a framework for food aidprogramming, monitoring, evaluation and impactmeasurement; and in enhancing the management andmonitoring capability of the cooperating sponsors andUSAID.
“Food security” has
gone through a number
of iterations.
In the 1990 Farm Bill, it
was defined simply as
“access by all people at
all times to sufficient
food and nutrition for a
healthy and productive
life.”
That definition was
expanded by USAID in
1992 in PD-19; in its
Food Aid and Food
Security Policy Paper,
1995; and further
refined in the U.S.
Position Paper for the
World Food Summit,
November 1996
“Food security exists
when all peoples at all
times have physical and
economic access to
sufficient food to meet
their dietary needs for a
productive and healthy
life. Food security has
three dimensions:
AVAILABILITY of
sufficient quantities of
food of appropriate
quality, supplied
through domestic
production or imports
ACCESS by households
and individuals to
adequate resources to
acquire appropriate
foods for a nutritious
diet
UTILIZATION of food
through adequate diet,
water, sanitation, and
health care.”
(Source: The U.S. PositionPaper Prepared for theWorld Food Summit, July1996)
U.S. INTERNATIONAL FOOD ASSISTANCE REPORT, 1997
5
I. THE CHALLENGE: GLOBAL HUNGER AND FOOD INSECURITY
UNIVERSAL COMMITMENT TO FOODSECURITY
he World Food Summit (organized by the UN Food andAgricultural Organization [FAO] in Rome in November 1996)focused the world’s attention on the chronic problems of hunger
and malnutrition, and warned of potential for increasingly acute foodshortages in Africa and South Asia. While the Summit broadlyrecognized that food security incorporates not only the traditional idea ofinsuring adequate food availability, there is also the need to create thesocial and economic conditions which empower individuals to gain accessto food, either by producing food themselves or earning income to buy it.Long-term political commitment and leadership will be essential to reachand sustain these goals and food aid will continue to play a critical role inemergencies, safety nets and other direct feeding programs. The Summitnoted the increasing number of civil conflicts and the need to “meettransitory and emergency food requirements in ways that encouragerecovery, rehabilitation, development and a capacity to satisfy futureneeds.” Moreover, the World Food Summit affirmed that “the decisionon measures concerning the possible negative effects of the UruguayRound of trade talks reform program on least-developed and net food-importing developing countries, (Marrakech 1994), shall be fullyimplemented.” As an immediate follow-up, the Singapore World TradeOrganization Ministerial Meeting (December 1996) requested thatrecommendations be developed “with a view towards establishing a levelof food aid commitments, covering as wide a range of donors and donablefoodstuffs as possible, which is sufficient to meet the legitimate needs ofdeveloping countries during the reform program.”
The U.S. reaffirmed its commitment and involvement to improve its foodaid programs in terms of responding to emergencies and helping foodinsecure populations reach the point where they can feed themselves, allin an era of changing agricultural trade and production circumstances.
Addressing global food security is essential to U.S. strategic interests as itpromotes political and economic stability beyond its humanitarian goals.Simply providing food to hungry people will not be sufficient to achieveglobal food security – a more comprehensive, developmental, andtargeted food safety-net strategy is called for.
TDeclaration of the WorldFood Summit (Rome1996):
Seven Commitments toFood Security
1. Create a peacefulenabling environmentwith full and equalparticipation of womenand men to ensure foodsecurity & povertyeradication
2. Reduce poverty &facilitate access to food
3. Adopt sustainablepolicies for agriculture,forestry & ruraldevelopment
4. Facilitate trade, a keyelement in food security
5. Improve forecastingand early response toprevent & resolve foodsecurity emergencies
6. Promote optimalallocation and use ofpublic & privateinvestment for humanresource development
7. Implement, monitor& follow up theSummit’sPlan of Actionat all levels.

U.S. INTERNATIONAL FOOD ASSISTANCE REPORT, 1997
6
POVERTY AND OTHER CAUSES OF FOOD INSECURITY
pproximately 840 million people in the world, including 650million children, are food insecure. Many live in Sub-SaharanAfrica and South Asia. Chronic poverty, i.e. the persistent lack of
economic opportunity either to produce adequate amounts of food or toexchange labor for income needed to purchase food in adequate amounts,is the chief cause of food insecurity. Among the factors that contribute topoverty in the developing world are low agricultural productivity, highrates of population growth, civil conflict, weak infrastructure,environmental degradation, inappropriate economic and environmentpolicies, limited availability of arable land, lack of credit, inadequatepersonal security, low levels of education, and poor health status. Chronicpoverty traps families in a cycle of food insecurity, vulnerability anddependency, which food aid alone cannot resolve.
THE CONSTRAINTS FACING FOOD AID
GLOBAL FOOD SUPPLY AND DEMAND
The demand for food is increasing on a global basis, along withpopulation, yet supply is not keeping pace everywhere. Global foodstocks are reduced and emergency food needs are likely to double in thenext ten years. This section summarizes several forecasts of the futureworld food situation. They use different methods and sometimes arrive atquite different conclusions, but agree that:
§ world population will grow as predicted, i.e., double over the next40 years, reaching approximately 7 billion persons by 2010 and 8.5billion by 2025;
§ global per capita income will continue to rise; and§ rural-to-urban migration and urbanization will continue at current
rates.
The combined effect of these trends will result in an almost doubling offood demand over the next 30 years. While there is general agreementconcerning projected demand for food, expert opinion differs concerningfuture international agricultural production and global food supply. TheWorld Bank and FAO agree that there will be gains in production and noglobal shortfall of food supply. Real prices will remain constant and foodimports by developing countries will increase.
Kane and Brown (1994, 1995) predict the opposite: increasingconstraints on world agricultural production, with considerable grainexports going to China, destabilizing international markets and causing adecline in the availability of food for poorer countries.
A
At current rates,
global demand for
food will almost
double in 30 years
U.S. INTERNATIONAL FOOD ASSISTANCE REPORT, 1997
7
PROJECTIONS OF FOOD AID NEEDS
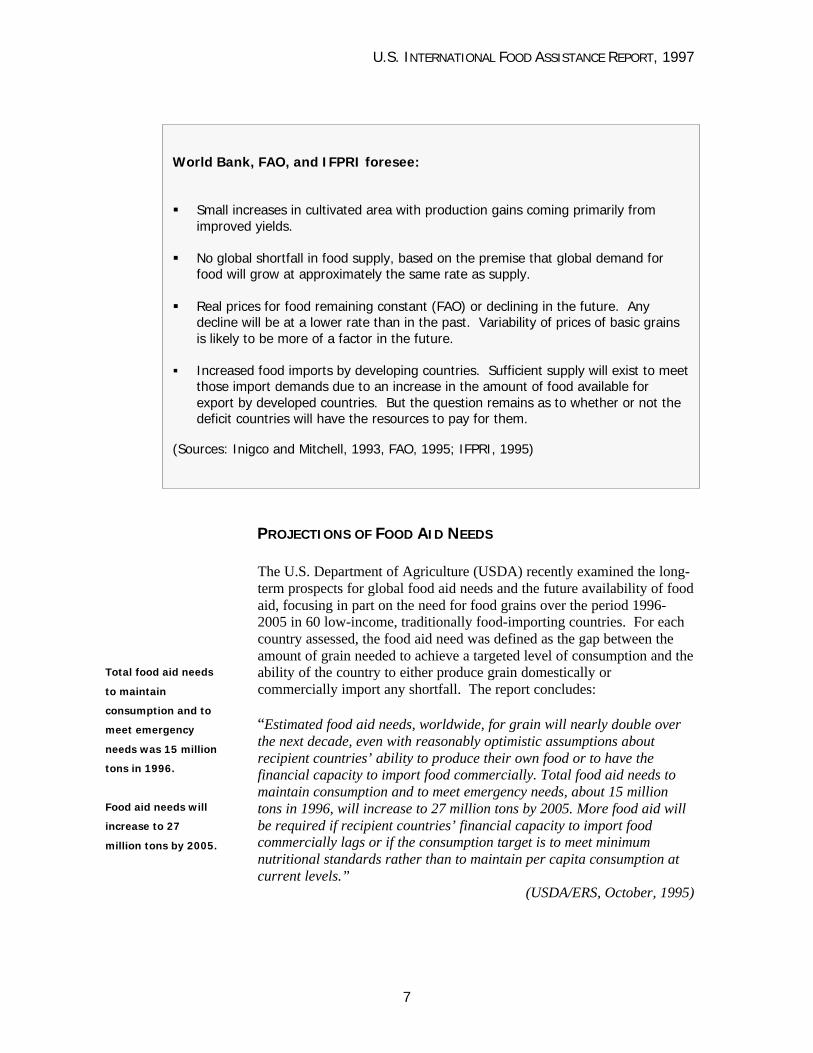
The U.S. Department of Agriculture (USDA) recently examined the long-term prospects for global food aid needs and the future availability of foodaid, focusing in part on the need for food grains over the period 1996-2005 in 60 low-income, traditionally food-importing countries. For eachcountry assessed, the food aid need was defined as the gap between theamount of grain needed to achieve a targeted level of consumption and theability of the country to either produce grain domestically orcommercially import any shortfall. The report concludes:
“Estimated food aid needs, worldwide, for grain will nearly double overthe next decade, even with reasonably optimistic assumptions aboutrecipient countries’ ability to produce their own food or to have thefinancial capacity to import food commercially. Total food aid needs tomaintain consumption and to meet emergency needs, about 15 milliontons in 1996, will increase to 27 million tons by 2005. More food aid willbe required if recipient countries’ financial capacity to import foodcommercially lags or if the consumption target is to meet minimumnutritional standards rather than to maintain per capita consumption atcurrent levels.”
(USDA/ERS, October, 1995)
World Bank, FAO, and IFPRI foresee:
§ Small increases in cultivated area with production gains coming primarily fromimproved yields.
§ No global shortfall in food supply, based on the premise that global demand forfood will grow at approximately the same rate as supply.
§ Real prices for food remaining constant (FAO) or declining in the future. Anydecline will be at a lower rate than in the past. Variability of prices of basic grainsis likely to be more of a factor in the future.
§ Increased food imports by developing countries. Sufficient supply will exist to meetthose import demands due to an increase in the amount of food available forexport by developed countries. But the question remains as to whether or not thedeficit countries will have the resources to pay for them.
(Sources: Inigco and Mitchell, 1993, FAO, 1995; IFPRI, 1995)
Total food aid needs
to maintain
consumption and to
meet emergency
needs was 15 million
tons in 1996.
Food aid needs will
increase to 27
million tons by 2005.

U.S. INTERNATIONAL FOOD ASSISTANCE REPORT, 1997
8
Sub-SaharanAfrica
REGIONAL FOOD INSECURITY: WHERE ARE
THE MOST FOOD INSECURE POPULATIONSCONCENTRATED?
While it appears that there is and will continue tobe enough food to feed the world’s population inthe near future, hunger and food insecurity willpersist without substantial targeting of food andother resources. Acute hunger affects 30-50million victims of disaster; 200-250 millionwomen and children are chronically under-nourished at critical times in their lives; and 840million are chronically undernourished in theworld. Indeed, while no region is immune tohunger and food insecurity, some are more pronethan others to be food insecure. They aregenerally among the group of 87 low-income,food-deficit countries (LIFDCs), as defined bythe Food and Agricultural Organization (FAO),into which are incorporated the 48 countries thatfall into the UN’s “least developed country”(LDC) category.
The two regions of Sub-Saharan Africa and SouthAsia are of particular concern, since foodproduction is not expected to keep pace withpopulation growth and, in all likelihood, therewill not exist the financial wherewithal to meetfood needs on a commercial import basis. Thirty-five percent of the African population andeighteen percent of the East and South Asianpopulations presently are hungry or chronicallyundernourished. These regions will, for theforeseeable future, remain food insecure and willrequire food aid resources, even in the absence offurther natural disasters and other complexemergencies to which they are prone.
Sub-Saharan Africa Sub-Saharan Africa isthe most vulnerable region. It is not self-sufficient in food production, and the continentrelies on imported foodstuffs to close the gap.Generally, economic growth has not kept pacewith population growth. Those countries withstagnant or slow growth in the past two decadesare struggling the most to pay for their foodimports.
There are 87 Low-Income Food-DeficitCountries (LIFDCs) inthe World:
South & East Asia 21
Latin America &The Caribbean 9
North Africa &Middle East 6
Sub-Saharan Africa 41
Europe & NIS 10
The United Nationsdefines LIFDCs as “allcountries which are netimporters of basic food-stuffs with per capitaGNP not exceeding thelevel set by the WorldBank to determineeligibility for soft loan(IDA- InternationalDevelopmentAssociation) assistance.
(Source: Food andAgricultureOrganization, 1997)
WORLD FOOD AIDLEVELS FOR 1996ALL SPONSORS(Cereals & Non-Cereals):
Sub-Saharan Africa:
2.5 million tons
South & East Asia:
2.0 million tons
North Africa &
Middle East:
0.7 million tons
Latin America &
The Caribbean:
0.8 million tons
Europe & NIS:
1.5 million tons
WORLD TOTAL:
7.5 million tons
(Source: World FoodProgram The Food AidMonitor, May 1997)
U.S. INTERNATIONAL FOOD ASSISTANCE REPORT, 1997
9
“From 1996 to 2005, to maintain consumption,[food] needs of the Sub-Saharan countries willincrease from 5 million tons to 12 million tons. In1996, eight percent of total food requirementshad to be supplemented by food aid to maintainper capita consumption, which already does notcover 100 percent of needs. This could increaseto as much as 15 percent by 2005. In Sub-Saharan Africa, 26 of 36 countries are in need offood aid during the entire projection period, evenunder favorable financial conditions. Only sevencountries in the region are projected to be able touse commercial imports to fill status quo foodneeds. Among the regions in Sub-Saharan Africa,East Africa, with 36 percent of the population,has the largest chronic food aid needs in 2005.Most of these countries are in the Greater Hornof Africa.”
(USDA/ERS 1995)
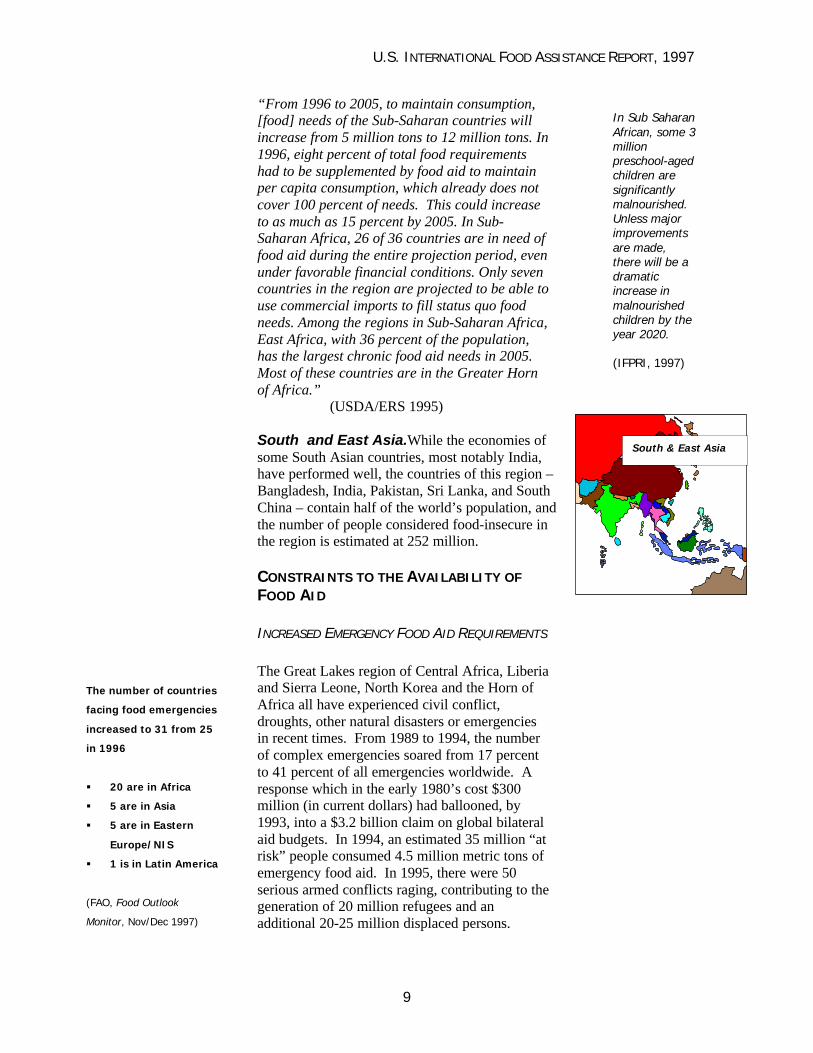
South and East Asia.While the economies ofsome South Asian countries, most notably India,have performed well, the countries of this region –Bangladesh, India, Pakistan, Sri Lanka, and SouthChina – contain half of the world’s population, andthe number of people considered food-insecure inthe region is estimated at 252 million.
CONSTRAINTS TO THE AVAILABILITY OFFOOD AID
INCREASED EMERGENCY FOOD AID REQUIREMENTS
The Great Lakes region of Central Africa, Liberiaand Sierra Leone, North Korea and the Horn ofAfrica all have experienced civil conflict,droughts, other natural disasters or emergenciesin recent times. From 1989 to 1994, the numberof complex emergencies soared from 17 percentto 41 percent of all emergencies worldwide. Aresponse which in the early 1980’s cost $300million (in current dollars) had ballooned, by1993, into a $3.2 billion claim on global bilateralaid budgets. In 1994, an estimated 35 million “atrisk” people consumed 4.5 million metric tons ofemergency food aid. In 1995, there were 50serious armed conflicts raging, contributing to thegeneration of 20 million refugees and anadditional 20-25 million displaced persons.
The number of countries
facing food emergencies
increased to 31 from 25
in 1996
§ 20 are in Africa
§ 5 are in Asia
§ 5 are in Eastern
Europe/NIS
§ 1 is in Latin America
(FAO, Food Outlook
Monitor, Nov/Dec 1997)
In Sub SaharanAfrican, some 3millionpreschool-agedchildren aresignificantlymalnourished.Unless majorimprovementsare made,there will be adramaticincrease inmalnourishedchildren by theyear 2020.
(IFPRI, 1997)
South & East Asia

U.S. INTERNATIONAL FOOD ASSISTANCE REPORT, 1997
10
During 1997, emergencies continued to place astrain on already-diminished global food aidresources, consuming 2.1 million metric tonsvalued at over $1 billion, according to the WorldFood Program. Despite lower global food aidresource availability, USDA estimated thatemergency food aid needs will increase from 4.8million metric tons in 1996 to between 5.7-6.2million metric tons by 2005 (USDA/ERS, 1995).
While representing only approximately 10percent of total food aid in the 1970’s, emergencyfood aid now approximates 35 percent of totalfood aid. Title II emergency assistance in FY1997 ($404 million) was almost half the totalTitle II budget.
Food Aid Shipments (Cereals) Trends by Donor 1971/72-1996/97(Sources: FAO Agrostat & FAO Food Outlook Aug-Sep 1995; Food Aid Convention 1995 & Food Aid Committee Estimated
Shipments 1993/94)
0
2
4
6
8
10
12
14
16
1972
1974
1976
1978
1980
1982
1984
1986
1988
1990
1992
1994
1996
MIllion Metric Tons
All Donors
U.S.A.
EU
Canada
Japan
Australia
Other Donors
Top Ten Contributors to theWorld Food Program, 1997:
USA $363 million
EU $165 million
Canada $87 million
Germany $63 million
Australia $55 million
Netherlands $43 million
Denmark $38 million
Norway $38 million
Sweden $33 million
UK $31 million
(Source: WFP YellowPages, October 1997)
U.S. INTERNATIONAL FOOD ASSISTANCE REPORT, 1997
11
A dispassionate assessment of the current worldsituation in terms of the numbers and location ofdisplaced persons and the convergence of highbirth rates, severe environmental degradation, andchronic poverty suggests that humanitarian crisescan be expected to continue. The incidence ofcomplex disasters, particularly man-made, willpersist until the root causes of chronic poverty arealleviated. As we write, the animosities behindthe genocide in Rwanda and Burundi continuewhile serious flooding has hit much of EastAfrica. Data being collected by the NationalOceanographic & Atmospheric Administration(NOAA) and other national and internationalscientific bodies predict that the weather patternknown as “El NiZo” may be of an intensitysurpassing that which caused billions of dollarsworth of damage when the last such eventoccurred.
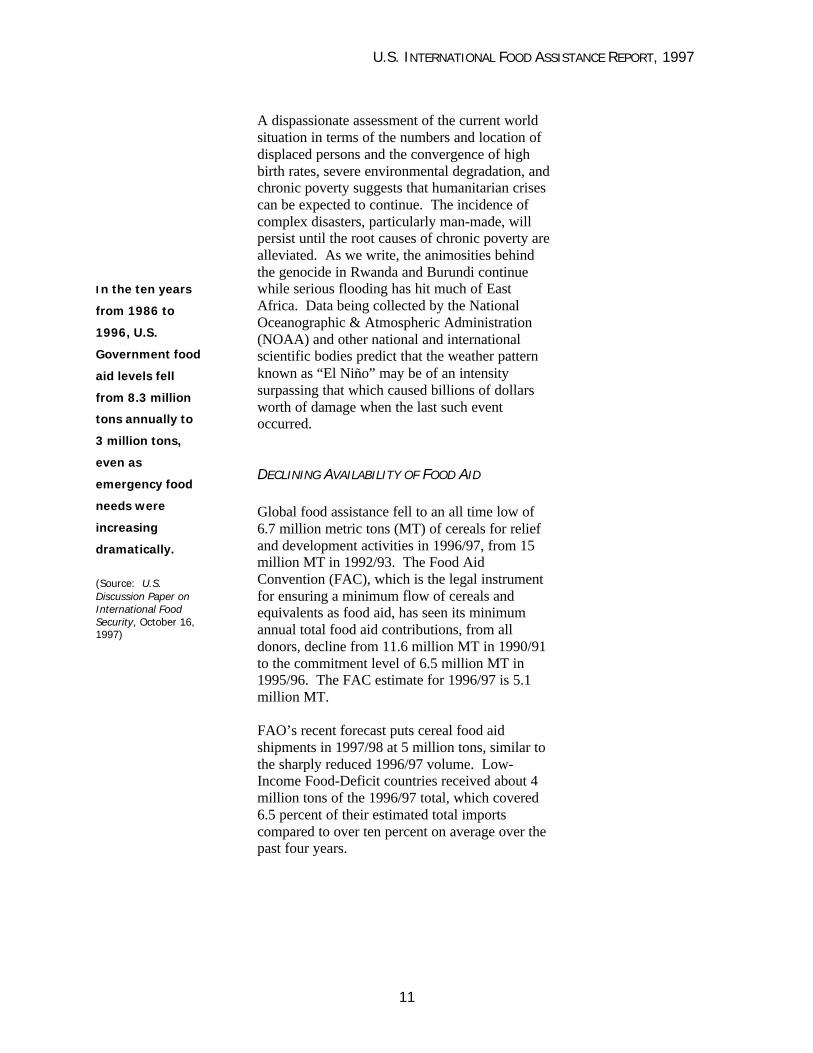
DECLINING AVAILABILITY OF FOOD AID
Global food assistance fell to an all time low of6.7 million metric tons (MT) of cereals for reliefand development activities in 1996/97, from 15million MT in 1992/93. The Food AidConvention (FAC), which is the legal instrumentfor ensuring a minimum flow of cereals andequivalents as food aid, has seen its minimumannual total food aid contributions, from alldonors, decline from 11.6 million MT in 1990/91to the commitment level of 6.5 million MT in1995/96. The FAC estimate for 1996/97 is 5.1million MT.
FAO’s recent forecast puts cereal food aidshipments in 1997/98 at 5 million tons, similar tothe sharply reduced 1996/97 volume. Low-Income Food-Deficit countries received about 4million tons of the 1996/97 total, which covered6.5 percent of their estimated total importscompared to over ten percent on average over thepast four years.
In the ten years
from 1986 to
1996, U.S.
Government food
aid levels fell
from 8.3 million
tons annually to
3 million tons,
even as
emergency food
needs were
increasing
dramatically.
(Source: U.S.Discussion Paper onInternational FoodSecurity, October 16,1997)

U.S. INTERNATIONAL FOOD ASSISTANCE REPORT, 1997
12
As part of across-the-board reductions in U.S.foreign assistance, the appropriation for U.S. foodaid has been substantially cut. While Title II ofP.L. 480 has been maintained at close to previouslevels, Title I and Title III have been drasticallyreduced during the past few years. Title IIIassistance levels were cut from $300 million to$40 million over a four year period.
Of related food aid programs, Food for Progressand Section 416(b), both of which areadministered by USDA, only Food for Progress isoperational, since commodities were notavailable under Section 416(b) during FY 1996and FY 1997, and only miniscule amounts areexpected to be available for FY 1998. In sum,the amount of food aid made available by theU.S. has dropped from 8.3 million metric tons inFY 1986 to 3 million metric tons in FY 1996.The total amount of U.S. food assistance was2.84 million metric tons in FY 1997.
Minimum Annual Food Aid Convention (FAC) Contributions by the Major Food Assistance Donors 1986-1995
0
1
2
3
4
5
6
7
8
FAC 86 FAC 95:
Year
Million MTs
All Donors
USA
EU
Canada
Japan

U.S. INTERNATIONAL FOOD ASSISTANCE REPORT, 1997
13
USAID P.L. 480 TITLE III PROGRAM TREND ANALYSIS
FY 1993 - 1997
0.0
50.0
100.0
150.0
200.0
250.0
300.0
1993 1994 1995 1996 1997
Millions ofDollars
Africa
Asia
Latin America
Worldwide
Year
USAID P.L. 480 TITLE II PROGRAM TREND ANALYSISFY 1993-1997
0
150
300
450
600
750
900
FY1993
FY1994
FY1995
FY1996
FY1997
Year
MillionsofDollars
Title II DevelopmentActivities
Title II EmergencyActivities
Total P.L. 480 Title IIProgram

U.S. INTERNATIONAL FOOD ASSISTANCE REPORT, 1997
14
THE MISMATCH BETWEEN SUPPLY AND DEMAND:THE NEED TO BETTER TARGET FOOD AID
It is obvious that there exists a severe andwidening mismatch between the amount of foodaid available and that required by the chronicallypoor, the victims of natural disasters, and thoseaffected by complex emergencies. This haspartially given rise to a gradually developinginternational consensus that, given the shortfall infood aid levels, its high cost, and itsprogramming complexities, available food aidwould be better used by more focusedgeographically targeted projects promotingsustainable development.
We pledge our political will and our common and
national commitment to achieving food security for
all and to an ongoing effort to eradicate hunger in
all countries, with an immediate view to reducing
the number of malnourished people to half their
present level no later than 2015.
(World Food Summit, Rome, 1996)
U.S. INTERNATIONAL FOOD ASSISTANCE REPORT, 1997
15
II. THE RESPONSE: FOCUSING THE U.S. P.L. 480 FOOD AIDPROGRAM ON FOOD SECURITY
“Food insecurity is not going to go away withoutAmerican leadership... Now is the time to stay thecourse that has served us so well – constructiveengagement to make the world more prosperousand food secure.”
– J. Brian Atwood, USAID Administrator 1997
iven the problems the U.S. faces at home,some may question the desirability of acontinued U.S. commitment to
international food assistance. To them, we citethe 1961 Inaugural Address of President John F.Kennedy. As to why the U.S. should assist theneedy overseas, President Kennedy responded:
“…Because it is right. If a free society cannothelp the many who are poor, it cannot save thefew who are rich.”
There are pragmatic reasons for addressing foodinsecurity abroad. The cost of responding todisasters and emergencies is much greater thanthe cost of their prevention. Healthy, food-secure, and productive societies are stable andtend to be democratic. And, in a number of caseslike Korea, India, Pakistan and Egypt, therecipients of U.S. food aid and related technicalassistance go on to become commercial importersof U.S. agricultural commodities, other goods,and services. Egypt and Korea received food aidin the past and have become significantagricultural trade partners with the U.S. In 1995,Egypt bought $1.4 billion worth of agriculturalproducts, and Korea $3.6 billion. Providing foodaid in the short term makes good business sensein the long term.
GNine of the TopTen AgriculturalImporters of U.S.Products Are PriorFood AidRecipients
Mexico
Korea
Philippines
Thailand
Turkey
Colombia
Pakistan
Dominican Republic
Peru
(USDA/FAS 1996)
“Democracy is the
biggest guarantee
against famine. Indeed,
in the long history of
famines in the world,
there has never been a
famine in an
independent democratic
country…
Democratic political
processes are very
important in putting
pressure on the
government to do
things quickly; both
ensuring rapid
transmittal of
information and making
it imperative for the
government to
undertake quick and
effective action.”
(Source: A. Sen,EntitlementPerspectives of HungerWFP/UN UniversitySeminar 5/31/97)

U.S. INTERNATIONAL FOOD ASSISTANCE REPORT, 1997
16
U.S. FOOD AID POLICY ANDSTRATEGY
U.S. FOOD AID POLICY
he sustained improvement in food securitythrough the effective and efficient use offood aid resources is the policy of the
United States (1996, 1997). Achievement of thatgoal implies a thorough understanding of the foodsecurity and nutrition situation of the populationtargeted by a food aid project, prior toundertaking that project.
The management of food aid resources has beenradically transformed in recent years. Theconcept of “food security” provides a frameworkwithin which to more effectively target food aid,optimize its impact, measure its results, andreport on its achievements. All Title II projectsdesigned after 1996 must obtain baselineinformation by which to gauge success onmidterm and final impact evaluations. USAIDand the Cooperating Sponsors are beginning tosystematically conduct joint assessments of thefood security and nutrition situation facing thetargeted population prior to projectimplementation. USAID is not alone inpromoting the baseline framework. WFP,UNICEF, and UNHCR follow a similarassessment procedure (codified in variousmemoranda of understanding) when theyprogram jointly.
For victims of disasters and emergencies, the goalof U.S. food aid programs is more immediate − tosave lives and minimize suffering. Even foremergency response, USAID is attempting a newstrategy: one that takes a farther-reaching view ofeach emergency and encompasses interventionsdesigned to lead to recovery and, later on, to thelong-term development of the affectedpopulation.
This strategy, “linking relief and development,”entails providing humanitarian assistance whichreinforces longer-term development goals, anddeploying development assistance in such a
TFood Aid supportsthe U.S. Economy:
§ 80-90 percent of
program funds
used to procure
and ship U.S.
food commodities
§ Overall
Agricultural
exports, some
$51 billion in
1995, are critical
to U.S. farm
income
§ In the U.S., for
every $1 billion in
additional farm
exports, an
estimated 25,000
to 30,000 jobs
are created.
Food Aid:
§ Helps avoid
starvation
(Rwanda, Haiti)
§ Buys time to
create food
reserves
(Ethiopia)
§ Introduces new
crops & expands
agricultural
production
(Bolivia,
Guatemala,
Peru)
§ Improves
nutrition in food
deficit countries
(Bangladesh,
Ethiopia,
Nicaragua &
Peru)
§ Supports U.S.
PVOs (CARE,
CRS) in
strengthening
maternal & child
health programs
(India, etc.)
U.S. INTERNATIONAL FOOD ASSISTANCE REPORT, 1997
17
manner as to prevent or reduce potential crisesand the attendant need for humanitarianassistance. It also aims to ensure that transitionsare better understood and more effectivelysupported.
U.S. FOOD AID STRATEGY
“The only lasting solution to hunger issustainable food security based on investments ofa developmental nature.”
– Tackling Hunger in a World Full of Food:Tasks Ahead for Food Aid, WFP, January 1996
An international consensus is emerging on theneed to use food aid to attack the causes ofhunger and food insecurity. Accordingly,USAID gives priority to allocating food aidresources to projects that:
§ Operate in the most food insecure countries.§ Are primarily rural based.§ Seek to improve household food security for
poor families.§ Address issues related to agricultural
productivity, particularly by subsistencefarmers.
§ Combine food aid with other resources anddevelopment instruments.
In particular, the Food for Peace Office ofUSAID’s Bureau for Humanitarian Assistance(USAID/BHR/FFP), has developed a stream-lined strategy to guide USAID’s Title II programfor 1997-2001.
Food Aid Programs are implemented through apartnership between USAID and its CooperatingSponsors, who administer food aid at the countrylevel on a day-to-day basis. This implies the fullcommitment of those Cooperating Sponsors to afood security policy and strategy. Hence,BHR/FFP’s two strategic objectives focus onstrengthening the Cooperating Sponsors’ andUSAID’s capability to program, manage, andevaluate food aid projects to obtain results ofimproved household, regional, or national foodsecurity.
2.84 million metric tons ofcommodities were procuredthrough USDA for Food AidPrograms in FY 1997:
Thousand Metric TonsBEANS 26
BULGUR 68
CORN 269
CORN SOY MASA FLOUR 1
CORN SOYA BLEND 211
CORNMEAL 24
COTTON 6
LENTILS 20
PEAS 30
RICE 218
NONFAT DRY MILK 1
SORGHUM 44
SOYBEAN MEAL 108
SOYABEANS 10
Soya-Fortified BULGHUR 60
Soya-Fortified CORNMEAL 43
Soya-Fortified SORGHUM
GRITS 14
TALLOW 2
VEGETABLE OIL 184
WHEAT 1,329
WHEAT FLOUR 161
WHEAT SOY BLEND 9
WHOLE DRY MILK 3
TOTAL: 2,841
(Source: USDA/FAS/11-18-97)
Linking Relief &
Development:
U.S. Principles &
Operating Guidelines
1. Countries have
primary
responsibility for
their transition
from relief to
development
2. International
partners are
responsible for
assuring the
positive impact of
their programs
through effective
strategic
coordination
upholding the
Principles
3. Relief programs
shall reinforce
development
objectives
4. Programs shall be
designed to help
prevent or
mitigate disasters
U.S. INTERNATIONAL FOOD ASSISTANCE REPORT, 1997
18
Finally, the strategy will bear fruit only where there exists the will and asincere effort on the part of host governments to work toward the creationof a policy and physical environment conducive to the improvement ofthe household food security of their most food insecure populations.Countries such as Ethiopia, Mozambique, and Peru that have or aredeveloping sound national food security policies and strategies, providethe appropriate frameworks and partnerships within which U.S. foodassistance can be more effectively programmed.
A GLOBAL PARTNERSHIP TO ACHIEVE FOOD SECURITY
herever feasible, the U.S. Government seeks to work in closepartnership with other bilateral, international, regional and sub-regional organization on food assistance-related issues. Such
cooperation is essential to the support of national food security efforts.The next section describes some of these partnerships.
U.S. PREPARATION & RESPONSE TO THEWORLD FOOD SUMMIT
FY 1997 saw FAO convening the World Food Summit in Rome, Italy(November 1996). This Summit provided a global framework forinternational discussion of country food-security policies and programs.In preparation for the Summit, the U.S. established a high-levelinteragency working group to oversee and guide the process for U.S.participation, prepared a U.S. Government position paper, prepared aU.S.-Canada position paper, and invited PVOs and the general public toprovide input to the process. Early on, the U.S. Government designatedUSDA as the lead agency and established a “core group” comprised ofrepresentatives from USDA, State Department, USAID, and Departmentof Commerce to ensure the preparation of necessary documents.
After a series of discussion meetings and public hearings, the U.S. issuedThe U.S. Contribution to World Food Security: The U.S. Position PaperPrepared for the World Food Summit (July 1996). It confirmed theintent of the U.S. to continue to play a major role in promoting globalfood security here and abroad. The U.S. is committed to:
§ Share its expertise with selected countries wishing to review andchange their national policies to improve food security.
§ Enhance U.S. government support for research and technologydevelopment in agriculture and related sectors, both at home andabroad.
§ Continue support for food security through the use of agriculturalprograms, development assistance, and food aid. Employ anintegrated approach to sustainable development, with a strongemphasis on those countries that show a good-faith willingness toadopt necessary policy reforms.
§ Work with countries to achieve freer trade and to assure that thebenefits are equitably realized.
WU.S.-EU FoodSecurityCooperationfocuses on 7countries topromote theformulation ofnational foodsecuritystrategies:
Angola
Bangladesh
Bolivia
Eritrea
Ethiopia
Haiti
Malawi
U.S. INTERNATIONAL FOOD ASSISTANCE REPORT, 1997
19
§ Continue support for international efforts to respond to and preventhumanitarian crises that create emergency food aid needs.
§ Continue efforts to encourage and facilitate implementation of foodsecurity-related actions adopted at recent international conferences orestablished in recently agreed conventions.
§ Work within the multilateral system to improve global approaches tofood security.
§ Continue to work toward food security for all Americans.
A U.S. Plan of Action on Food Security, describing how the U.S.intends to fulfill these commitments, is to be issued in the Spring of1998.
GLOBAL FOOD SECURITY PARTNERS
UNITED STATES-EUROPEAN UNION (U.S.—EU) COOPERATION
s the two largest food aid donors, the United States and theEuropean Union (EU) have developed a Food SecurityCoordination Program for 1995-1997. This program is grounded
in agreement concerning the developmental use of food aid to address theroot causes of food insecurity. It seeks to mutually reinforce food securitypolicy and increase coordination between the agencies charged withimplementing food aid programs within the two entities.
A joint plan for coordination has been developed, consisting of thefollowing points:
§ Promote the formulation of National Food Security Strategies andAction Plans in Angola, Bolivia, Eritrea, Ethiopia, and Malawi. InOctober 1997, Haiti and Bangladesh were added to the list.
§ Donor forum: the periodic convening of food aid donor forumsinvolving the major food aid donors.
§ Information exchange: review with an aim to facilitate the exchangeand access to documentation between and by the institutions.
§ Strategy in relation to WFP: periodically review WFP’s developmentproject portfolio with an aim of strengthening its food securityobjectives; hold preparatory meetings prior to WFP Executive Boardsessions.
§ Crop assessment: develop strategy to increase involvement by thetwo entities in national crop assessment missions.
A
U.S. INTERNATIONAL FOOD ASSISTANCE REPORT, 1997
20
U.S. SUPPORT OF REGIONAL EFFORTS: GREATERHORN OF AFRICA
The U.S. supports the Inter-Governmental Authority on Development(IGAD), a sub-regional organization covering seven drought prone Hornof Africa countries, which was revitalized in 1996. Its priorities are:
1. Food security and environmental protection.2. Conflict prevention, management and resolution and humanitarian
affairs.3. Infrastructure development.
The IGAD has under discussion a Code of Conduct for Food Aid withinthe context of food security for the IGAD subregion. The Coderecognizes, among other principles: the importance of food aid as oneresource to address hunger and disease due to food shortages; long-termfood security efforts and their role in mitigating emergencies; food aid asa flexible resource which must be programmed carefully so as not tointerfere with long term food self-reliance; full integration of food aidwith complementary investments, regional trade policies and marketfluctuations and other resources. Periodic joint assessments by donorgovernments, multilaterals and national governments of the IGAD sub-region will help ensure the establishment of prevention and preparednessstrategies in a timely fashion.
For too long, emergency relief has competed with funding fordevelopment programs and depleted food aid resources. In an attempt tobreak that cycle and begin a process linking relief and development, thePresident launched the Greater Horn of Africa Initiative (GHAI) in1994.
Founded on the assumption that while drought and other natural disastersmay be beyond our control, famine is not. The Initiative has two strategicobjectives (SO) and a third “Special Objective”:
§ Strengthened African capacity to enhance regional food security.
§ Strengthened African capacity to prevent, mitigate and respond tocrisis.
§ Increased access to regional analytical information.
Ten governments in the Greater Horn of Africa region, representing 22million people, are working in partnership with development agenciesthrough the Initiative. They are refining and establishing early warningsystems to more quickly identify potential food crisis areas; pre-positioning food stocks to minimize the social disruptions caused byfamine, particularly movements of refugees; and supporting regionalapproaches to crisis management.
IGAD covers
Seven Horn of
Africa
countries:
Djibouti
Eritrea
Ethiopia
Kenya
Somalia
Sudan
Uganda
U.S. INTERNATIONAL FOOD ASSISTANCE REPORT, 1997
21
USAID-ADMINISTERED FOOD AID
SAID administers Title II and Title III activities including theFarmer to Farmer Program.
P.L. 480 TITLE II: EMERGENCY AND DEVELOPMENTASSISTANCE PROGRAMS
Title II, the flagship of the U.S. food aid program, is implemented througha partnership between USAID and U.S. 501(c)(3) private voluntaryhumanitarian relief and development organizations (PVOs), a number ofNGOs (international and local private voluntary relief and developmentorganizations), and IOs (international organizations), the most importantof which, in terms of the amount of food aid delivered, is the World FoodProgram. As discussed earlier, the World Food Program is USAID’smajor implementing partner for delivering emergency food assistance.Over the past five years, Title II assistance through WFP has averagedover $400 million per year. Worldwide, it is noted that approximately 70percent of all WFP food assistance is emergency-related.
STRATEGIC PLAN 1997-2001
The development of a USAID Strategic Plan for P.L. 480 Title II began in1994 with the USAID “Food for Peace Transformation Program.” Itsgoals were to strengthen the capabilities of food aid managers andmanaging organizations.
In order to achieve the goals and objectives of the TransformationProgram, the following comprehensive actions were undertaken andaccomplished by USAID:
§ redefined and more precisely focused food security strategicobjectives;
§ issued a food aid and food security policy;§ created new, streamlined food aid proposal design and review
processes;§ increased the efficiency and effectiveness of the management of
food aid;§ developed new food aid monitoring and evaluation systems;§ developed a core set of food aid performance indicators to better
assess the impact of food aid on food insecurity; and§ pursued the establishment of a professional development program
and career path for food aid managers within USAID.
Based on achievement of the objectives listed above and in conformitywith reengineering directives, USAID/FFP subsequently developed astrategic plan specifically for the Agency’s Title II program. It definesStrategic Objectives (SOs) and Intermediate Results (IRs) which provide
U
U.S. INTERNATIONAL FOOD ASSISTANCE REPORT, 1997
22
a framework within which to measure progress and impact. Results for1996/1997 will be discussed in Section III.
P.L. 480 TITLE III: FOOD FOR DEVELOPMENT
In FY 1997, the Title III program provided 151,000 metric tons ofcommodities, having a commercial value of $40.4 million, which wereused to support policy reform programs in Eritrea, Ethiopia, Haiti,Mozambique and Nicaragua. Funding for Title III has been severelyreduced in recent years. Wheat and/or wheat flour was provided for salein local markets to generate local proceeds which are used for economicdevelopment activities.
THE FARMER-TO-FARMER PROGRAM
The Worldwide Farmer-to-Farmer (WW-FTF) Program is financedthrough P.L. 480 and has the overarching goal of improving theproduction, marketing, and distribution of agricultural commodities bydeveloping nations. Strictly speaking, not a “food aid” but a “technicalassistance” program, the WW-FTF is administered by theUSAID/Bureau for Humanitarian Response/Office of Private andVoluntary Cooperation (USAID/BHR/PVC). Initiated in 1985, WW-FTFhas completed over 1,200 assignments in 77 countries with U.S.volunteers from 49 states during the FY 1991- FY 1996 cycle.
The WW-FTF program is designed to provide expertise of U.S. farmerson a volunteer basis to farmers in food-assistance countries.
In recent years, there has been a shift in emphasis from assistance toindividual farmers, government organizations and agricultural educationinstitutions to support more farmers’ cooperatives and associations,agribusinesses and agricultural credit and financial institutions. NIS-FTFvolunteers have helped form private farmer cooperatives, opensupermarkets, improve food processing, start radio programs for farmers,develop commodity exchanges, and build farmers’ associations.Moreover, FTF has helped strengthen private banking, establishland appraisal and mortgage systems, identify project financing, advise onland reform and create extension services.
WorldwideFarmer-to-FarmerProgramPartners (1997-2002):
ACDI/VOCA
Citizens
Network
Land O’Lakes
Partners of the
Americas
Winrock
International
Peace Corps

U.S. INTERNATIONAL FOOD ASSISTANCE REPORT, 1997
23
USDA-ADMINISTERED FOOD AID PROGRAMS
USDA administers the Title I and Food for Progress (FFPr) Programs.
P.L. 480 TITLE I: TRADE AND DEVELOPMENT ASSISTANCE
he Title I program provides for the sale of agricultural commoditiesto developing countries and private entities on concessional creditterms. The U.S. government negotiates an agreement with the
recipient government for payment in dollars. Repayment terms varydepending on the financial position of the recipient country, but mayprovide credit terms up to 30 years, with a grace period of up to five yearsand interest rates ranging from about 2 to 4 percent. Commodities arepurchased in the U.S. market and sold by the recipient government in itslocal markets. The sale proceeds are used to support the agricultural andfood security development objectives in the agreement. As will bediscussed in the section dealing with the Food for Progress program, aportion of Title I funds may be shifted to the Food for Progress grantprogram. In fiscal year 1997, 12 countries received Title I assistance.The commodities included in this program are primarily bulk, mainlywheat, soybeans and rice (see Annex).
FOOD FOR PROGRESS
Food for Progress assists developing countries, and particularly emergingdemocracies “that have made commitments to introduce or expand freeenterprise elements in their agricultural economics through changes incommodity pricing, marketing, input availability, distribution, and privatesector involvement.” Food for Progress can be implemented throughagreements with governments (including those of the Newly IndependentStates of the former Soviet Union) or with private voluntaryorganizations, non-profit agriculture organizations, cooperatives,intergovernmental organizations, or other private entities. Food forProgress is funded through two mechanisms, via transfer of Title I fundsor via Commodity Credit Corporation (CCC) funds. The program isauthorized through FY 2002 at an annual level of 500,000 metric tons offood commodities and up to $30 million in CCC-funds for non-commodity costs.
T

U.S. INTERNATIONAL FOOD ASSISTANCE REPORT, 1997
24
III. HIGHLIGHTS: THE PROGRAM IN NUMBERS
n 1997, the U.S. P.L.480 Program and CCC-funded Food forProgress cost $1.1 billion and moved about 2.84 million metric tons(MT) of commodities. A detailed breakdown of the dollar and
tonnage amounts for the 112 country activities is provided in the Annex.
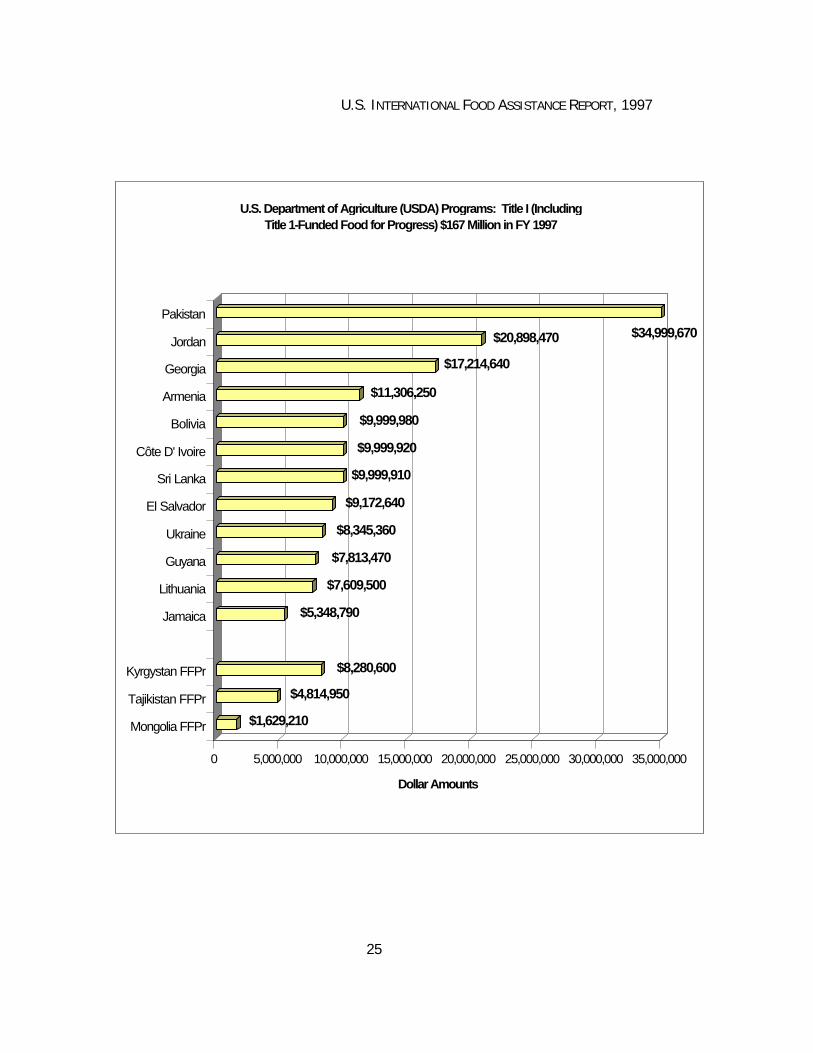
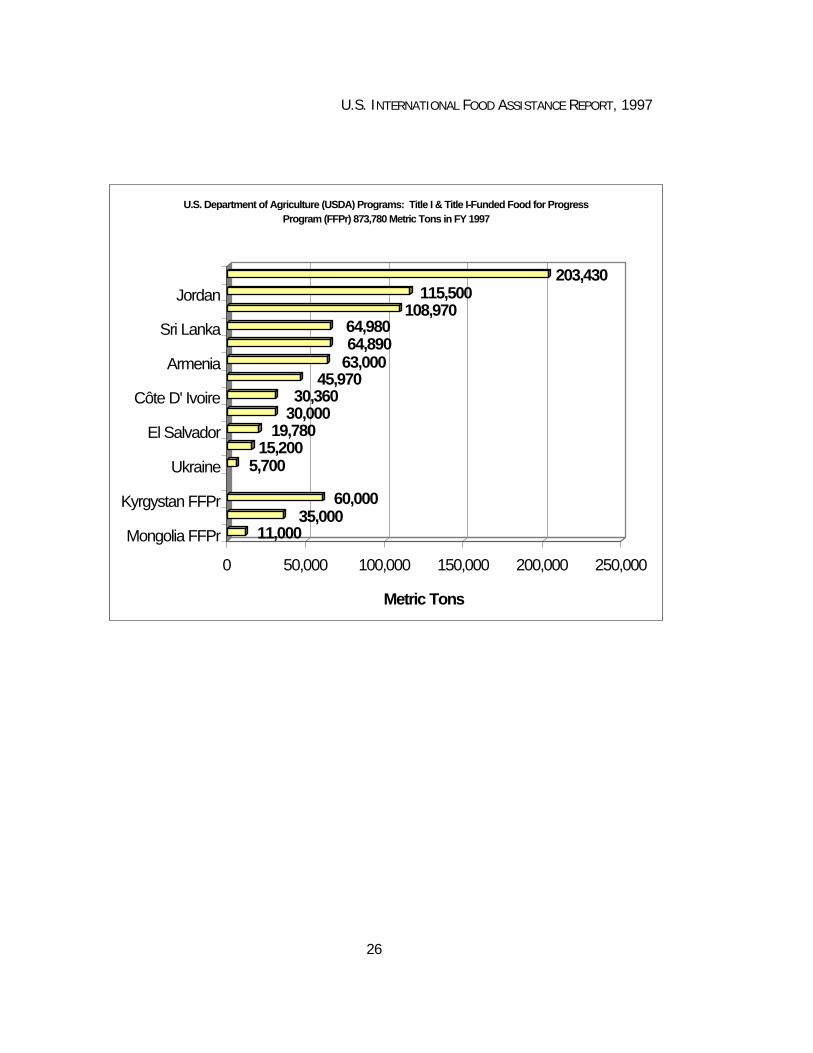
TITLE I
Title I accounted for $167 million worth of commodities: 873,780 metrictons for 15 countries, including 3 NIS countries through Title I-fundedFood for Progress. Additionally, USDA’s Food for Progress activitieswith commodities obtained directly from the Commodity CreditCorporation (CCC) funded $64.3 million (179,140 metric tons) in 14countries.
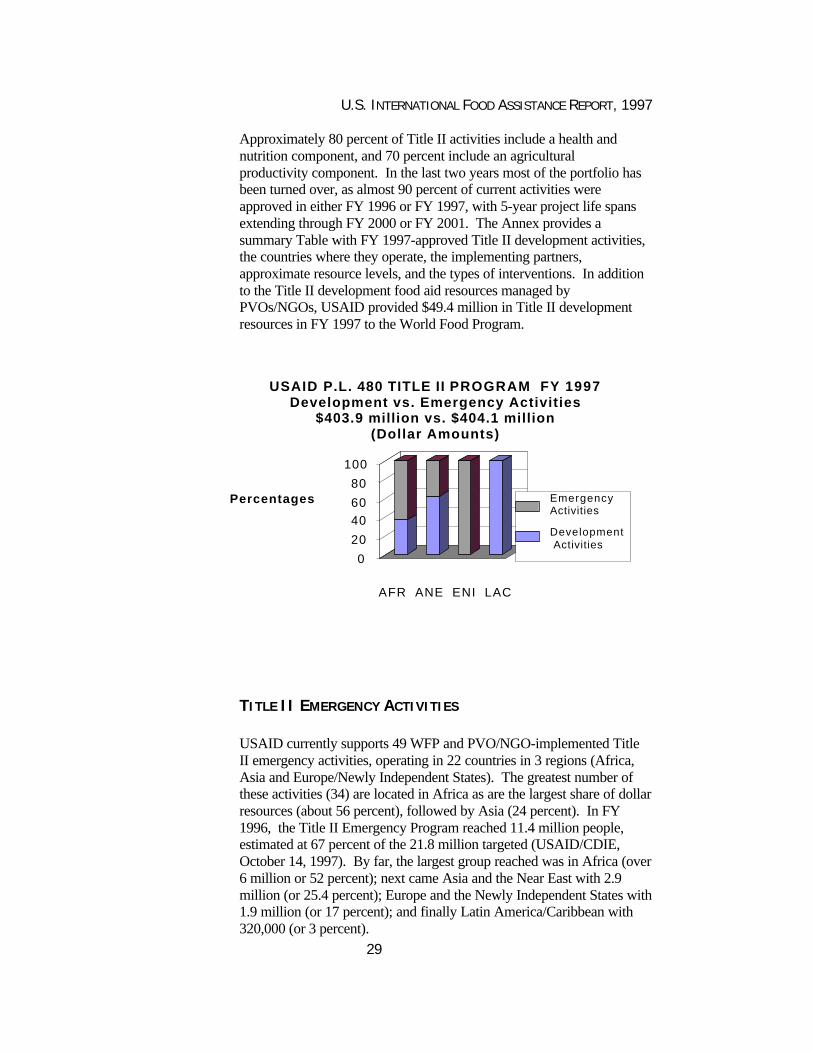
TITLE II - OVERVIEW
The $821 million Title II program was divided almost equally intoDevelopment and Emergency activities ($403.9 million vs. $404.1million) which translated into 93,000 more metric tons for the former(884,000 metric tons vs. 781,000 metric tons). Typically, emergenciesare less predictable and hence commodities are purchased as needed,rather than on a predetermined schedule.
TITLE II DEVELOPMENT ACTIVITIES
FFP currently supports 53 Title II development activities, operating in24 countries in 3 regions (Africa, Asia and Latin America/Caribbean).The greatest number of these activities (31) are located in Africa, thoughthe largest share of resources (about 40 percent) is allocated to activitiesin Asia, due primarily to the large size of the India and Bangladeshprograms.
Title II development activities support several components related tofood security and disaster prevention/mitigation. Most activities aremulti-dimensional, integrating a number of the following types ofcomponents: (1) health and nutrition; (2) water and sanitation; (3)agricultural productivity; (4) natural resource management; (5)education; (6) humanitarian assistance; (7) roads and infrastructure; and(8) microenterprise development. Nonetheless, health/nutrition andagricultural productivity are the two primary focal areas of Title II.
I
U.S. INTERNATIONAL FOOD ASSISTANCE REPORT, 1997
25
$1,629,210
$4,814,950
$8,280,600
$5,348,790
$7,609,500
$7,813,470
$8,345,360
$9,172,640
$9,999,910
$9,999,920
$9,999,980
$11,306,250
$17,214,640
$20,898,470 $34,999,670
0 5,000,000 10,000,000 15,000,000 20,000,000 25,000,000 30,000,000 35,000,000
Dollar Amounts
Mongolia FFPr
Tajikistan FFPr
Kyrgystan FFPr
Jamaica
Lithuania
Guyana
Ukraine
El Salvador
Sri Lanka
Côte D' Ivoire
Bolivia
Armenia
Georgia
Jordan
Pakistan
U.S. Department of Agriculture (USDA) Programs: Title I (Including Title 1-Funded Food for Progress) $167 Million in FY 1997
U.S. INTERNATIONAL FOOD ASSISTANCE REPORT, 1997
26
11,00035,000
60,000
5,70015,200
19,78030,00030,360
45,97063,00064,89064,980
108,970115,500
203,430
0 50,000 100,000 150,000 200,000 250,000
Metric Tons
Mongolia FFPr
Kyrgystan FFPr
Ukraine
El Salvador
Côte D' Ivoire
Armenia
Sri Lanka
Jordan
U.S. Department of Agriculture (USDA) Programs: Title I & Title I-Funded Food for Progress Program (FFPr) 873,780 Metric Tons in FY 1997

U.S. INTERNATIONAL FOOD ASSISTANCE REPORT, 1997
27
$ 4 7 6
$ 1 ,2 8 4
$ 1 ,9 3 5
$ 2 ,1 8 8
$ 2 ,3 2 5
$ 2 ,4 4 3
$ 2 ,7 0 2
$ 3 ,4 2 2
$ 5 ,5 6 9$ 6 ,0 7 7
$ 8 ,5 5 1
$ 8 ,6 8 1
$ 9 ,2 7 4
$ 9 ,4 1 2
$ 0 $ 1 , 0 0 0 $ 2 , 0 0 0 $ 3 , 0 0 0 $ 4 , 0 0 0 $ 5 , 0 0 0 $ 6 , 0 0 0 $ 7 , 0 0 0 $ 8 , 0 0 0 $ 9 , 0 0 0 $ 1 0 , 0 0 0
D o l l a r A m o u n t s ( 0 0 0 )
E q u a t o r i a l G u i n e a
E l S a lva d o r
H a i t i
N i c a r a g u a
B e n i n
M o ld o va
A ze r b a i j a n
B o s n i a H e r c e g o v e n a
K yrg y z s t a n
A rm e n i a
G e o rg i a
U k r a i n e
R u s s i a
T a jk i s t a n
U . S . D e p a r t m e n t o f A g r ic u ltu r e ( U S D A ) P r o g r a m s : C o m m o d i t y C r e d it C o r p o r a t i o n ( C C C ) - F u n d e d F o o d f o r P r o g r e s s P r o g r a m
( F F P r ) $ 6 4 . 3 M illio n in F Y 1 9 9 7
0.64
3.63
4.00
5.00
6.38
6.93
7.00
12.00
13.77
15.00
16.91
18.40
19.48
50.00
0.00 5.00 10.00 15.00 20.00 25.00 30.00 35.00 40.00 45.00 50.00
Tonnage (000) Metric Tons
Equatorial Guinea
Moldova
El Salvador
Bosnia Herzegovina
Azerbaijan
Haiti
Nicaragua
Armenia
Kyrgyzstan
Benin
Ukraine
Tajkistan
Georgia
Russia
U.S. Department of Agriculture (USDA) Programs: Commodity Credit Corporation (CCC)-Funded Food for Progress Program (FFPr)
179,140 Metric Tons in FY 1997

U.S. INTERNATIONAL FOOD ASSISTANCE REPORT, 1997
28
USAID P.L. 480 TITLE II PROGRAM FY 1997
Regional Breakdown
Total Program Level $821 Million
44%
33%
8%
15%
AFRICA
ASIA/NEAR EAST
EUROPE/NEWLYINDEPENDENT STATES
LATIN AMERICA &CARIBBEAN
USAID P.L. 480 TITLE II PROGRAM FY 1997
Regional Breakdown
1.66 Million Metric Tons
38%
41%
8%
13% AFRICA
ANE: ASIA/NEAR EAST
EUROPE/NEWLYINDEPENDENT STATES
LATIN AMERICA &CARIBBEAN
U.S. INTERNATIONAL FOOD ASSISTANCE REPORT, 1997
29
Approximately 80 percent of Title II activities include a health andnutrition component, and 70 percent include an agriculturalproductivity component. In the last two years most of the portfolio hasbeen turned over, as almost 90 percent of current activities wereapproved in either FY 1996 or FY 1997, with 5-year project life spansextending through FY 2000 or FY 2001. The Annex provides asummary Table with FY 1997-approved Title II development activities,the countries where they operate, the implementing partners,approximate resource levels, and the types of interventions. In additionto the Title II development food aid resources managed byPVOs/NGOs, USAID provided $49.4 million in Title II developmentresources in FY 1997 to the World Food Program.
TITLE II EMERGENCY ACTIVITIES
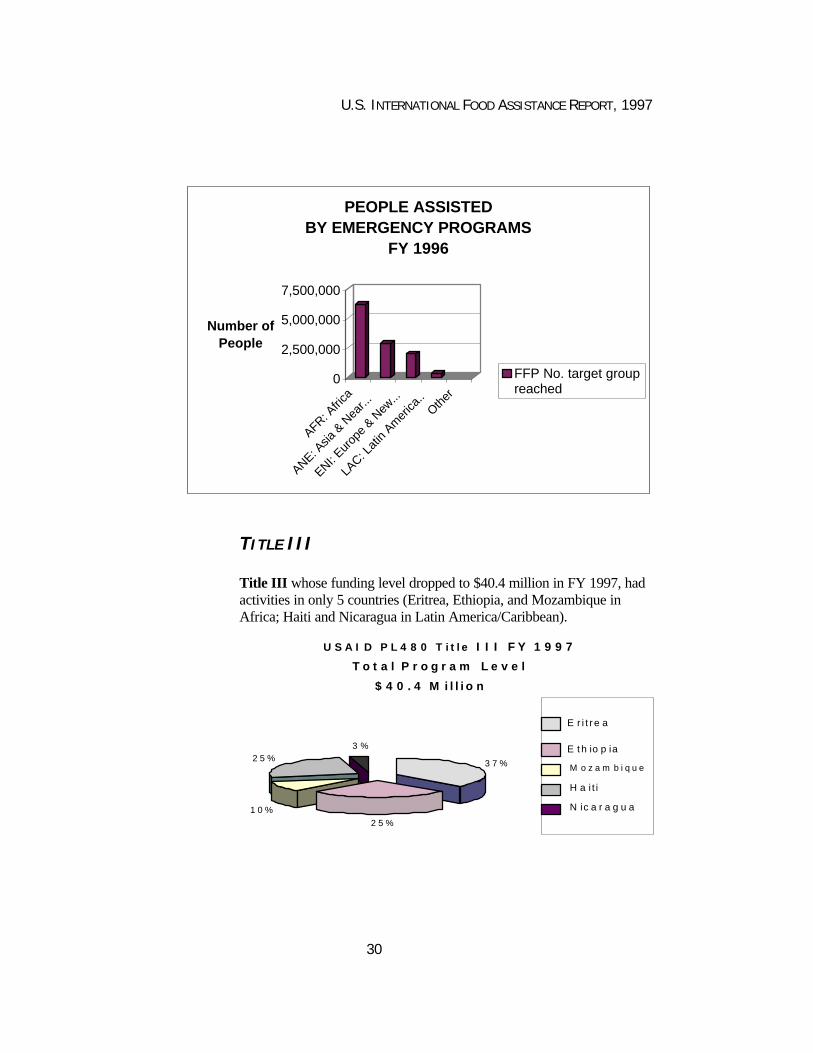
USAID currently supports 49 WFP and PVO/NGO-implemented TitleII emergency activities, operating in 22 countries in 3 regions (Africa,Asia and Europe/Newly Independent States). The greatest number ofthese activities (34) are located in Africa as are the largest share of dollarresources (about 56 percent), followed by Asia (24 percent). In FY1996, the Title II Emergency Program reached 11.4 million people,estimated at 67 percent of the 21.8 million targeted (USAID/CDIE,October 14, 1997). By far, the largest group reached was in Africa (over6 million or 52 percent); next came Asia and the Near East with 2.9million (or 25.4 percent); Europe and the Newly Independent States with1.9 million (or 17 percent); and finally Latin America/Caribbean with320,000 (or 3 percent).
0
20
4060
80
100
Percentages
USAID P.L. 480 TITLE II PROGRAM FY 1997Development vs. Emergency Activities
$403.9 million vs. $404.1 million(Dollar Amounts)
EmergencyActivities
Development Activities
AFR ANE ENI LAC
U.S. INTERNATIONAL FOOD ASSISTANCE REPORT, 1997
30
TITLE III
Title III whose funding level dropped to $40.4 million in FY 1997, hadactivities in only 5 countries (Eritrea, Ethiopia, and Mozambique inAfrica; Haiti and Nicaragua in Latin America/Caribbean).
0
2,500,000
5,000,000
7,500,000
Number of People
AFR: Afri
ca
ANE: Asia
& N
ear..
.
ENI: Eur
ope
& New
...
LAC: L
atin
Amer
ica..
Other
PEOPLE ASSISTEDBY EMERGENCY PROGRAMS
FY 1996
FFP No. target groupreached
U S A I D P L 4 8 0 T i t l e I I I F Y 1 9 9 7
T o t a l P r o g r a m L e v e l
$ 4 0 . 4 M i l l i o n
3 7 %
2 5 %
1 0 %
2 5 %3 %
E r i t r e a
E t h io p ia
M o z a m b i q u e
H a i t i
N ic a r a g u a

U.S. INTERNATIONAL FOOD ASSISTANCE REPORT, 1997
31
SECTION 202(E) AND INSTITUTIONAL SUPPORTGRANTS
USAID is committed to increasing the capacity of its Missions andcooperating sponsors to manage food aid programs, through itsSection 202(e) and Institutional Support Grant (ISG) Programs.Section 202(e) funding has almost tripled from $10 million in FY1993 to $28 million in FY 1997. ISG funding, in FY 1997, totaled$4.8 million (see Table in Annex).
$0
$5,000,000
$10,000,000
$15,000,000
$20,000,000
$25,000,000
$30,000,000
FY1993
FY1994
FY1995
FY1996
FY1997
USAID/BHR/FFP Section 202(e) & Institutional Support Grant (ISG) Funds Allocation FY 1993-1997 (Development &
Emergency Activities)
Section 202(e) Levels
ISG Levels

U.S. INTERNATIONAL FOOD ASSISTANCE REPORT, 1997
32
IV. ACCOMPLISHMENTS 1997: IMPROVED MANAGEMENT OF THE U.S.P.L.480 FOOD AID PROGRAM FOR IMPACT ON FOOD INSECURITY
SAID, along with other Government agencies, has undergone aserious process of self-examination and re-engineering during thepast few years. The food assistance program has been almost
entirely transformed as a result. In that metamorphosis, P.L.480 Title IIhas become a more-tightly focused program, with a coherent set ofdevelopment-oriented food security objectives, increasingly directed tothe most food insecure and disadvantaged population groups. The impactof the transformation of the Title II portfolio on food security andnutrition will become more easily measurable in future years. For now,program achievements are being assessed annually, through focus on theintermediate indicators of improvements in food aid management and thetechnical capacity of USAID, its cooperating sponsors and partners. Forits Title II activities, USAID has two Strategic Food AssistanceObjectives (SOs) (see Annex for description):
SO1: Emergency Food Aid Strategic Objective.
Meeting critical food needs of targeted groups.
SO2: Development Food Aid Strategic Objective.
Increasing the effectiveness of USAID’s partners in carrying out Title IIdevelopment activities with measurable results related to food securitywith a primary focus on household nutrition and agricultural productivity.
In FY 1996, USAID initiated major changes to improve the way itsupports Title II emergency and development activities, yielding a revisedStrategic Plan in FY 1997. A key change is that FFP's performanceindicators are defined by the degree to which its Mission and PVOpartners are able to achieve the people-level targets they set. The revisedstrategic plan has made strides in bringing Title II emergency anddevelopment activities in line with USAID’s re-engineering and results-based management principles. The first set of results is now available onbaseline surveys and targets established for emergency and developmentTitle II activities that began in FY 1996. A summary of the SO1 andSO2, Strategic Objectives and Intermediate Results (IRs) indicators, isprovided in the Annex.
U

U.S. INTERNATIONAL FOOD ASSISTANCE REPORT, 1997
33
The information and case examples presented here illustrate progressachieved to date with respect to these indicators in key areas. They arebased on the systematic review of available information on individualTitle II development and emergency activities during the FY 1996 cycle,compiled in the Results Reports prepared during FY 1997 (Ralte, 1997;Impact, 1997) and completed with additional information from interviewsand other sources. We have attempted to highlight “best practices,”successful or innovative approaches and lessons learned in 1997 fromUSAID’s long experience administering food assistance worldwide.
CURRENT TITLE II EMERGENCY AND DEVELOPMENTOPERATING FRAMEWORK
actors affecting USAID’s ability to meet its emergency anddevelopment performance targets include:
1. linking emergency to development to assist countries as they moveout of emergency modes;
2. the need for close collaboration between the USAID and its partners,including integration of food aid resources in Mission strategicobjectives and further consensus on which indicators need to bereported and targeted;
3. the critical need for increased workforce, Operating Expense (OE)and Development Assistance (DA) resources available for managingTitle II development activities. Note: these are discussed in detail inthe FY 1997 Results Reports and Resource Request R4 documents;and
4. the need to consolidate and report on the overall effect of food aid inaddressing food security. Note: while a set of generic Title IIdevelopment performance indicators has been developedcollaboratively by USAID and Title II partners (see Annex), and thepartners are being encouraged to use them, further consensus is stillneeded on their application, as some partners prefer to develop theirown indicators and are reluctant to change indicators previouslyadopted for long-standing projects.
1. LINKING RELIEF AND DEVELOPMENT
Title II activities increasingly are directed to help countries transitionfrom relief to development. USAID is encouraging effective "relief exit"strategies for its emergency activities and providing support to Title IIpartners and Missions in the design of new activities in countries that areready to move into a development phase. Title II programs inMozambique are now firmly oriented towards development while countryprograms in Angola and Rwanda should follow in the near future.
F
U.S. INTERNATIONAL FOOD ASSISTANCE REPORT, 1997
34
2. EMERGENCY AND RELIEF ACTIVITIES: BETTERTARGETING CRITICAL NEEDS OF VULNERABLE GROUPS
USAID has made a commitment to manage food aid emergencies forresults. A system for reporting and measuring results is now in place.Because of the complex nature and unpredictability of emergencysituations, the difficulties of collecting data in dangerous or politicallysensitive areas, the often sudden and massive movements of beneficiaries,and the short time frame (one year or less) for implementation, it isdifficult to measure impact and results accurately. For these reasons,resource allocation for emergency activities is not tied, in the firstinstance, to results reporting, but is based on criteria of need and urgency.Despite the evident constraints, this section details achievements inmeeting emergency program objectives and relies on specific descriptions
WFP WORKERS RISK LIFE AND LIMB IN RESETTLEMENT AND FEEDING EFFORTS INANGOLA
Emergency activities are often quite dangerous and sometimes fatal. Landmine accidents, attacksagainst villages, ambushes, restrictions and harassment of UN and humanitarian organizationscontinue to rise. In Angola, six people were killed when unidentified gunmen ambushed a UNObserver Mission for Angola (MONUA) and a vehicle of the German demining non-governmentalorganization, the Saint Barbara Foundation (SBF). As they approached a road block near Bolonguerain Benguela province on 23 October, two international staff members of SBF, two national policeofficers, an official of the Bolonguera administration and one Angolan paramedic, were killed. Theteam was assessing the security situation for SBF to resume demining in the area. SBF and WorldFood Program (WFP) had stopped demining activities earlier along this road, when SBF deminerswere threatened by armed men only 17 km from Bolonguera village. The WFP-contracted NGO isclearing the 50-km road from Chongoroi town to Bolonguera village, facilitating resettlement of18,200 displaced persons in Lobito and Benguela towns to Chongoroi municipality. Deminingactivities by SBF are currently suspended. This led to the death of a WFP driver on 30 October 1997when a truck in a convoy of 50 WFP transport vehicles, struck a newly planted anti-tank mine, whichwas positioned under a paved road. The driver was killed instantly. The roads and fields, whichwere previously cleared, appear to have been remined, setting back years of work to open roads toallow free movement of goods, ruining the fields which people had begun to plant.
WFP has been supporting demining in Angola, since 1994, to open up roads into the interior, ascorridors for humanitarian relief. WFP is also demining roads in high priority areas of resettlement,in support of the peace process. Mines continue to maim and kill innocent civilians, mostly womenand children. Since the beginning of the year, WFP has funded demining of secondary roads inBenguela and Bengo provinces and has supported demining brigades in several other provincesthrough food-for-work. In Bengo province, WFP funded the demining of feeder roads to facilitatethe resettlement of 40,000 internally displaced persons (IDPs), from Boa Esperanca and Acucareiracamps in Caxito to their areas of origin in Nambuangongo municipality. This important agriculturalarea in the past once supplied markets in Luanda. Caxito has begun the organized resettlement ofdisplaced persons, from the Caxito camps to demined areas and to others as they soon as they arecleared. 10,000 IDPs have already resettled spontaneously in the cleared areas. In Bie andHuambo provinces, cleared areas have also allowed a safer fuel wood collection and access to newwater sources.
(Sources: WFP Emergency Report No. 44 of 1997 - Oct 31, 1997 & USAID Cable November 4, 1997)

U.S. INTERNATIONAL FOOD ASSISTANCE REPORT, 1997
35
of country cases for illustration, since the results and reporting frameworkis new.
During 1996 and 1997, Emergency programs targeted multiple vulnerablegroups in the following order: (a) children, orphans, preschoolers andschool-age children and unaccompanied minors; (b) women, includingpregnant, lactating and war widows; (c) malnourished, including childrenunder five years old; (d) handicapped, disadvantaged, and socially-destitute; (e) internally-displaced persons and refugees; (f) elderly; (g)hospitalized people; (h) demobilized soldiers; and (I) flood-affectedfarmers.
In 1997, USAID made progress towards meeting its Strategic Objective(SO1) for the Title II Emergency activity portfolio, which targets meetingthe critical needs of target groups. Performance on this objective is metthrough: (1) the percentage of targeted populations reached by theprogram as well as (2) the impact on nutritional status of beneficiaries.The Intermediate Results (IRs), supporting the achievement of thisstrategic objective, are:
1. improved food aid targeting to the most vulnerable populations;2. food aid delivered to target groups on schedule;3. improved planning to link relief activities to development; and4. strengthened capabilities of cooperating sponsors and host country
entities to manage emergency food aid.
Sierra Leone. In 1996, 840,000 internally displaced persons (IDPs),almost half of the 1.8 million total population, needed emergency foodaid. USAID provided food to an estimated 239,000, playing a major rolein establishing the Food Aid Coordinating Committee (FACC), whichincluded the Government of Sierra Leone, World Food Program (WFP),United Nations Office of the High Commissioner for Refugees (UNHCR),PVOs and other donors. The Committee developed a strategy wherebymass distribution could be replaced by targeted feeding in previouslyinaccessible areas. Guidelines have been developed for standard rationsize and distribution frequency, as well as criteria for categorizingbeneficiaries. This strategy allowed for resettlement of the IDPs andrehabilitation of their villages and local infrastructure. Complementaryresources, such as food-for-work programs, are also contributing todevelopment in Sierra Leone.
DOCUMENTING CHANGE IN NUTRITIONAL STATUS OF TARGET GROUPS
Emergency programs have begun systematically to document programimpact on beneficiaries. During FY 1996, 37 percent of emergencyprograms reported contributing to change in or maintenance of nutritionalstatus.
U.S. INTERNATIONAL FOOD ASSISTANCE REPORT, 1997
36
In Angola, USAID programs kept thousands of Angolans alive duringand after the war. Malnutrition rates decreased to 8.7 percent at the end of1996, from 15.2 percent in 1994, with the most severe cases going from4.4 percent to 2.3 percent. Throughout 1996, nutritional status improvedrapidly in areas that had been previously cut off from humanitarianassistance for security reasons. The program is effectively linking reliefto development with the simultaneous rehabilitation of infrastructure,which is likely to accelerate in the next year. The provision of basichealth services, through complementary USAID health inputs along withemergency relief activities, provided the necessary synergy for a dramaticdecline in severe malnutrition. In Ndalatanando, malnutrition ratesdropped to 3.9 percent, from 12 percent of children under five years ofage.
IMPROVING TARGETING THROUGH CONTINUOUS NEEDS ASSESSMENTS
USAID has instituted a more effective and continuous targeting process inseveral countries. PVO Guidelines for Title II Emergency FoodProposals and Reporting was issued in 1997, to assist PVOs inconducting needs assessments and installing systems to recalibrate targetgroups on a periodic basis. In 1996, 53 percent of programs reportedhaving instituted some form of periodic needs assessment or consultationwith other agencies in order to fine-tune its beneficiary numbers.
In Bosnia-Hercegovena, through a joint needs assessment with WFP,UNHCR, FAO and the European Commission Humanitarian Office(ECHO), USAID discovered that a significant amount of food assistancewas necessary to maintain social stability, improve household purchasingpower and assist with overall rehabilitation. Most importantly, thisassessment led to USAID’s reorienting its approach from globaldistribution to targeted feeding relying on better identification ofvulnerable groups. Similar efforts are underway in Somalia, whereUSAID is collaborating with the Food Security Task Force, to developearly warning indicators and identify groups vulnerable to drought andflood, for inclusion in the program.
In Afghanistan, assessment of coping mechanisms and vulnerabilitiesidentified gender and ethnic issues as key factors to move from relief todevelopment. USAID reached an estimated 1.6 million beneficiariesthrough WFP, providing assistance to refugees, IDPs, returnees andvictims of natural disasters. Specifically, 750,000 internally-displaced,urban poor and widows were targeted through a bakery program. Itprovided flour and small grants to women to produce bread, which thenwas distributed to urban poor and other vulnerable groups. Fifty percentof the 140,000 beneficiaries in Kabul were women and half of those werewidows.
U.S. INTERNATIONAL FOOD ASSISTANCE REPORT, 1997
37
In Rwanda, USAID assisted over two million victims of the Rwanda-Burundi ethnic strife, through WFP. Beneficiaries included those locatedin refugee camps in Zaire, Uganda and Tanzania, as well as first-stagereturnees in Rwanda and Burundi.
North Korea. The case of North Korea illustrates how scores of donorsare joining forces to mitigate the food shortage while working towardsmore effective coordination and monitoring.
3. INTEGRATION OF TITLE II FOOD AID RESOURCES AS
COMPONENTS OF USAID MISSION STRATEGICPLANNING
There is substantial evidence that food aid, programmed by itself, doesnot achieve the maximum impact possible. It is more effective when usedin conjunction with other resources in order to promote agriculturalproductivity and improve household nutrition. This includescomplementary dollar-funded technical assistance, training and otherresources that food aid alone cannot provide. Food aid activities shouldalso be coordinated with host country policy reforms to maximize theirimpact on food security. USAID’s Food Aid and Food Security PolicyPaper (1995) emphasizes that food aid "should be integrated to a greaterextent with other USAID assistance resources."
Improved coordination, among USAID Missions and Title II partners, hasbeen achieved on country food security assessments, program design,program monitoring and evaluation. Examples include development ofjoint strategies and memoranda of understanding (MOUs) by USAID,PVOs/NGOs and the World Food Program (WFP) and donors, such as theEuropean Union (EU). Title II partners are working with, and
North Korea (DPRK)
Some 35 donors (including 19 countries plus NGOs, private enterprises and individuals) havepledged resources to the WFP emergency operation in DPR Korea since November 1995. From thebeginning of the operation, a total of about 638,000 metric tons have been distributed, includingsome 150,000 metric tons from the EU and U.S., supplied on a bilateral basis, and implemented byWFP. Of the total, 237,000 metric tons were delivered between May and September 1997. InOctober, some 163,000 metric tons were scheduled to arrive at DPRK ports, and 90,000 metric tonsin November. From December 1997 to February 1998, taking into consideration already confirmedcontributions, 86,000 Metric tons will arrive. In addition to the above WFP emergency operationfigures, some 376,000 metric tons have been supplied to DPRK on a purely bilateral basis, with noWFP involvement. This amount reflects those deliveries known to WFP. The ongoing FAO/WFP Cropand Food Supply Assessment mission has been able to move throughout the country according tothe planned itinerary. WFP has, so far, monitored activities in 109 counties, covering all provincesexcept Ryanggang and part of Chagang. With the additional international project staff, and theintroduction of a detailed consignment notes system to follow each consignment from the port tothe ultimate distribution point, closer monitoring of the donated food will become possible.
(Source: WFP Emergency Report No. 44 of 1997 - October 31, 1997)
U.S. INTERNATIONAL FOOD ASSISTANCE REPORT, 1997
38
strengthening host country institutions, government and non-governmentorganizations, as well as private sector entities. Such linkages aresupported by a combination of food and non-food resources with dollar orlocal currency resources, available through USAID Missions, PVOs (fromnon-AID sources), monetized food aid, and Section 202(e) and ISGgrants. However, the level of these integration efforts in some instanceshas been constrained by a lack of cash resources.
USAID has made strides in the area of integrating Title II-supportedactivities with other in-country development interventions, Missionobjectives and other donor strategies. The following section documentsprogress on four intermediate results (IR) indicators:
1. integration of Title II with other host country development activities(IR2.1a),
2. monitoring and evaluation of Title II in coordination with otherMission-supported activities (IR2.1b);
3. integration of Title II with other Mission strategic objectives(IR2.2a); and
4. inclusion of Title II in Mission results reporting (R2) procedures(IR2.2b).
All USAID Missions running Title II programs have been requested toassess their level of integration in the context of the four IR indicators. Asurvey indicated that Title II integration has succeeded where strongtechnical assistance has been provided by the Missions, Title IIcooperating sponsors (CS), BHR/FFP and its technical consultants.
Integration of Title II: Questionnaire Responses
IR2.1a Integration with other host country development activities: 11 of the 12 PreviouslyApproved Activities (PAAs) scored by Missions as being implemented in coordination with hostgovernment activities to a great extent or better (i.e., score of 3 or 4 out of a possible 5).
IR2.1b Numbers of countries with jointly coordinated Monitoring and Evaluation (M&E) systems:Title II cooperating sponsors in five of the 24 countries implementing Title II developmentactivities (i.e., Bangladesh, Bolivia, Ethiopia, Honduras, and Mozambique) have set up jointprogram monitoring and evaluation. Countries with more than one Title II program are in varyingstages regarding joint evaluations, ranging from thinking about setting one up, to actually doingso. This group includes Ghana, Guatemala, India, Haiti, Kenya, Madagascar, Nicaragua and Peru.
IRs 2.2a and 2.2b Integration with Mission objectives & results reporting: Six of the 12 PAAswere well-integrated (CARE/India and ADRA/Haiti programs scored 4 out of 5 and 5 out of 5). Forthe other six countries, either the Mission did not have a food security-related objective or it didnot perceive the Title II activity as relevant to its country strategy focus.
IRs 2.3a and 2.3b Measure the level of Title II country programs' integration with joint U.S.-EUand U.S.-WFP strategies. The U.S. and EU have been promoting the formulation of national foodsecurity strategies in Angola, Bolivia, Eritrea, Ethiopia, and Malawi. In FY 1998, this IR will beexpanded to include Bangladesh and Haiti.

U.S. INTERNATIONAL FOOD ASSISTANCE REPORT, 1997
39
While integration of Title II resources with other USAID, donor, and hostcountry development efforts should be encouraged and rewarded, muchremains to be done by way of ensuring an adequate level of technicalassistance to both enhance Title II integration and improve data gathering.
COUNTRY CASES – SUCCESSFUL TITLE II DEVELOPMENT ACTIVITYINTEGRATION
The following synopsis illustrates where Title II activities are movingtowards, or have already achieved levels of integration with Mission, hostcountry and other donor development interventions.
Bangladesh. Although the Agency's strategic planning and resultsreporting/resource request processes were instituted after CARE's five-year Food for Development (FFD) Activity was approved, its Title IIprogram (FY 1997 level of 132,850 metric tons, valued at $34 million),has been integrated into the Mission's country development strategy.CARE received Mission DA funds to support FFD and itscomplementarity with other donor programs such as the CanadianInternational Development Agency’s (CIDA) Rural Roads MaintenanceProgram. CARE’s FFD objectives: 1) protecting livelihoods ofvulnerable rural households by providing income to over 100,000participants; 2) promoting self-employment through savings and skillstraining; and 3) mitigating the effects of floods on livelihoods ofvulnerable households – are clearly linked with USAID/Bangladesh'sobjective of improving food security for the country's poorest.
Bolivia. Despite continued improvements arising from far-reachingeconomic and social reforms, Bolivia remains one of the poorest nationsin the Western Hemisphere. One of every three Bolivians live in extremepoverty without sufficient income to assure a minimally adequate diet.Food insecurity, along with inadequate housing, poor health andinsufficient education, is one of the primary manifestations of poverty inBolivia. Fighting poverty means attacking the root causes of foodinsecurity. USAID/Bolivia is well positioned to support the government'spoverty alleviation agenda. With Title II resources constituting 27percent of the Mission's OYB resources, Title II has become a keyelement of USAID programming. In the new 1998-2002 Strategic Plan,Mission Title II activities and results are fully integrated into both itsEconomic Opportunities and Health Strategic Objectives. Title IICooperating Sponsors are using the same indicators and have the sameexpected development results as grantees and contractors funded fromDevelopment Assistance resources. For example, Title II CooperatingSponsors are working to increase household incomes in food-insecure,rural areas through improved access to markets, technology andproductive infrastructure. At the same time, and in these samecommunities, the Mission is programming DA resources to supplementTitle II activities. Yet the Mission also recognizes the uniquecharacteristics of food aid, and that coordinating Title II activities across
U.S. INTERNATIONAL FOOD ASSISTANCE REPORT, 1997
40
two or more Strategic Objectives can be problematic. As a result, theMission has created a Food Security Coordinating Unit that is answerableto two Strategic Objective Teams and charged with achieving the Title IIprogram results in the context of these two Strategic Objectives.
Ghana. In FY 1997, 48,880 metric tons valued at $14.5 million wereprogrammed for Title II. Two of USAID/Ghana's three Title II partners,CRS and TechnoServe, ran activities that were well integrated with theMission's Strategic Objectives. CRS modified its food for education(formerly school feeding) activity to complement the Mission's SO ofincreasing the effectiveness of the primary education system.TechnoServe's Title II monetization activity provided credit for small-scale cereal storage and marketing, which is also closely linked with theMission's objective aimed at increasing revenues from selected goods andservices. TechnoServe also actively participated in USAID/Ghana'sTrade and Investment Program. Although the Mission does not have anagriculturally-related objective to which ADRA's work in enhancingagricultural production could be linked, this project does indirectlysupport agricultural enterprise development.
India. The majority of Title II resources available through CARE andCRS (214,900 metric tons valued at $95.8 million for FY 1997) supportedmaternal child health activities. These were linked to the Mission's ChildSurvival objective and to its Special Objective (SPO) of expanding therole and participation of women in decision making. CRS' Title IIprogram was also closely linked through its child survival grant-fundedintervention in Bihar, one of the country's most nutritionally vulnerablestates. CARE and WFP supported India's Integrated Child DevelopmentServices (ICDS) Scheme, which, for well over a decade, has been thelargest child survival activity in the world. CRS' own child survivalactivities, through indigenous non-governmental organizations, alsocomplemented ICDS objectives. CRS' Human Capacity DevelopmentProgram, under which its Food for Education activity is beingrestructured, indirectly supports the Mission's objective of fertilityreduction, by increasing enrollment and retention of girls in school. It isnoted that while CRS' rural assets improvement (formerly Food-for-Work) and general relief activities do not fit within the Mission's strategicplan, they were strongly supported by both USAID/India and USAID’sAsia/Near East (ANE) Bureau, since they were viewed as contributing tothe reduction of food insecurity among the most vulnerable of India's poormajority.
Kenya. The FY 1997 Title II level was 27,400 metric tons, valued at$11.8 million. USAID/Kenya and its six active and prospective Title IIpartners made significant strides in linking all food aid activities to itssub-goal of increasing food security. This supports a strategic objectiveof encouraging Kenya's transition from relief to development by raisingmarginal communities' participation in child survival and small producerhousehold income-generating schemes. On-going Title II-supported PVOactivities included CRS' Food-Assisted Child Survival Activity, and

U.S. INTERNATIONAL FOOD ASSISTANCE REPORT, 1997
41
WVRD's Morulem Irrigation Scheme. Four FY 1998 off-cycleDevelopment Activity Proposals (DAPs), all supporting the Mission'srelief to development objective, are currently being examined inUSAID/Washington Team-coordinated reviews. These are: ADRA'sAgricultural and Natural Resource Management Practices Program;CARE's Improved Farm Management and Agroforestry Activity; Food forthe Hungry's Marsabit Food Security Program and TechnoServe's DairyDevelopment Project.
Peru. The FY 1997 Title II level of 93,900 metric tons was valued at$55.2 million. Title II activities were designed to effectively reach andimprove the capacity of the very poor and food insecure populations inPeru. The focus was on investments in basic infrastructure; appropriatetechnological improvements; growth of small-scale income generationactivities; skills enhancement; and training for mothers, other communitymembers, and Ministry of Health personnel on health and nutritionpractices and nutritional rehabilitation.
USAID/Peru's Title II partners, ADRA, CARE, Caritas/Peru andPRISMA (the latter two are indigenous cooperating sponsors),implemented activities which were fully integrated with the Mission'sobjective of increasing the incomes of the poor and its intermediate resultaimed at improving the food security enhancing capacity of the extremelypoor. The Mission's Food for Development and Health, Population andNutrition Offices participated on each other's strategic objective teamsleading to standardization of Mission-supported health and nutritioninvestments, through Title II and DA-supported activities. Both teamswere closely involved in the design and technical supervision of eachother's results packages and took advantage of the extensive geographiccoverage of Peru's Title II cooperating sponsors to strengthen the impactof USAID's nutrition and other food security-related activities servingacutely malnourished children.
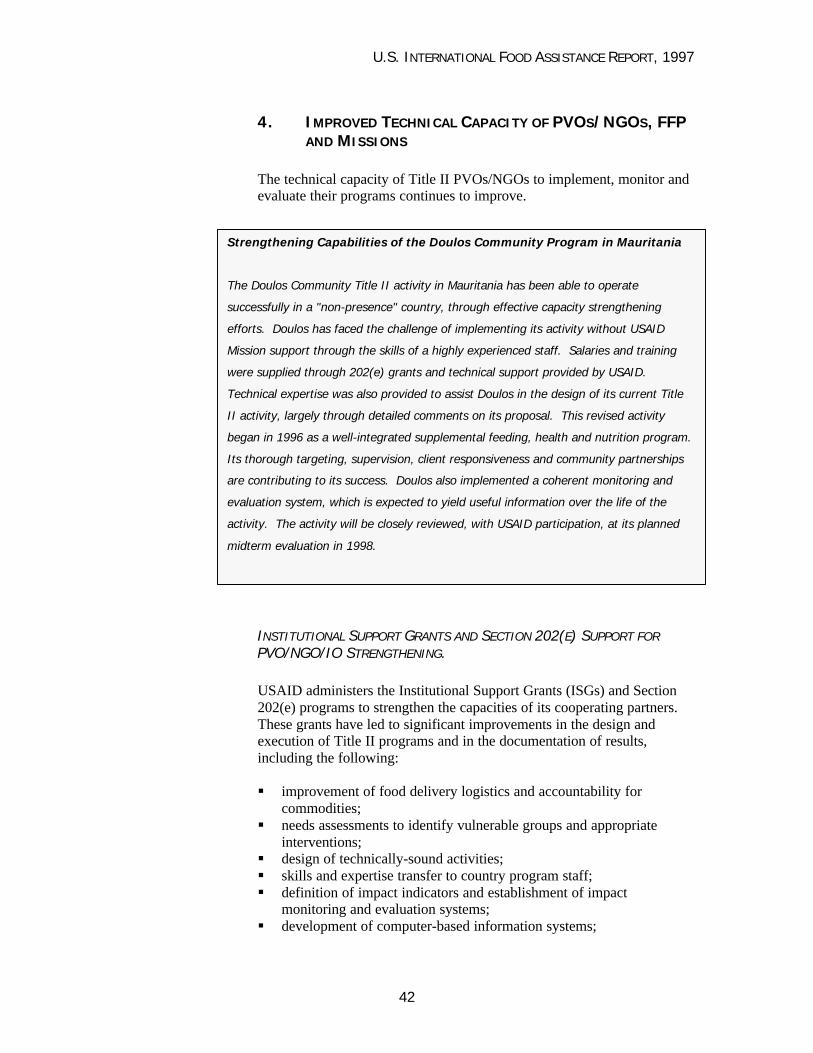
U.S. INTERNATIONAL FOOD ASSISTANCE REPORT, 1997
42
4. IMPROVED TECHNICAL CAPACITY OF PVOS/NGOS, FFPAND MISSIONS
The technical capacity of Title II PVOs/NGOs to implement, monitor andevaluate their programs continues to improve.
INSTITUTIONAL SUPPORT GRANTS AND SECTION 202(E) SUPPORT FORPVO/NGO/IO STRENGTHENING.
USAID administers the Institutional Support Grants (ISGs) and Section202(e) programs to strengthen the capacities of its cooperating partners.These grants have led to significant improvements in the design andexecution of Title II programs and in the documentation of results,including the following:
§ improvement of food delivery logistics and accountability forcommodities;
§ needs assessments to identify vulnerable groups and appropriateinterventions;
§ design of technically-sound activities;§ skills and expertise transfer to country program staff;§ definition of impact indicators and establishment of impact
monitoring and evaluation systems;§ development of computer-based information systems;
Strengthening Capabilities of the Doulos Community Program in Mauritania
The Doulos Community Title II activity in Mauritania has been able to operate
successfully in a "non-presence" country, through effective capacity strengthening
efforts. Doulos has faced the challenge of implementing its activity without USAID
Mission support through the skills of a highly experienced staff. Salaries and training
were supplied through 202(e) grants and technical support provided by USAID.
Technical expertise was also provided to assist Doulos in the design of its current Title
II activity, largely through detailed comments on its proposal. This revised activity
began in 1996 as a well-integrated supplemental feeding, health and nutrition program.
Its thorough targeting, supervision, client responsiveness and community partnerships
are contributing to its success. Doulos also implemented a coherent monitoring and
evaluation system, which is expected to yield useful information over the life of the
activity. The activity will be closely reviewed, with USAID participation, at its planned
midterm evaluation in 1998.

U.S. INTERNATIONAL FOOD ASSISTANCE REPORT, 1997
43
§ improvement of programming efficiency and consistency amongpartners;
§ participation in strategic planning efforts with FFP, Missions andother donors; and
§ development of conceptual models for guiding food aid activities,(such as CARE's food and livelihood security model, which hasbecome the central strategy for all CARE programming).
USAID Missions have also made strides to improve food aid managementcapability. Consistent with the decentralization element of its re-
engineering strategy, USAID is delegating decision-making and Title IIdevelopment resources allocation to selected USAID Missions.
Better coordination among partners has been an area of USAID focus in1997. Mozambique provides a good example of how joint M&E activities(e.g., joint baseline data collection, joint mid-term evaluations) can
Redelegation of Authority Is Underway in Bangladesh,Ethiopia and Peru
Memoranda of Understanding (MOUs) are currently being developedbetween FFP and Missions in Bangladesh, Ethiopia and Peru, toredelegate management authority for Title II development activities.These countries were selected because they have Title IIdevelopment programs that are well-integrated with Missionobjectives, demonstrate sound management of Title II programs andhave qualified food aid management staff to support the activities.Initially, the MOUs will only delegate approval authority for ongoingactivities (PAAs).
Eventually, approval authority for new activities is expected to beextended as well. The MOUs will establish standards for USAIDMission capabilities and will document the degree of Title IIintegration with Mission Strategic Plans. They will require Missions toensure the continuing provision of adequate staff and resources foreffective oversight of Title II food aid activities.
Joint Monitoring & Evaluation (M&E) System Developed by Six PVOs in
Mozambique
USAID has approved activities in Mozambique for six different Title II partners,
which involve a joint process of planning and evaluation. Title II partners in
Mozambique have conducted a joint baseline, using standardized M&E
indicators and methods. These joint activities will continue through FY 2001.
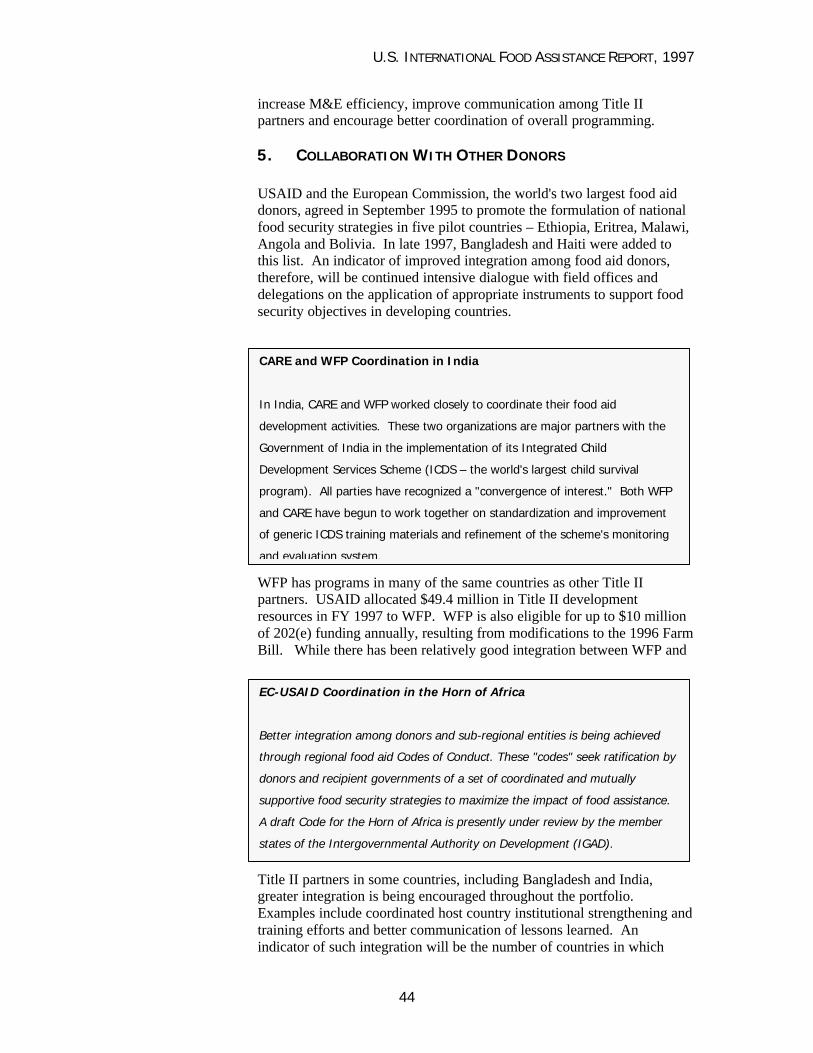
U.S. INTERNATIONAL FOOD ASSISTANCE REPORT, 1997
44
increase M&E efficiency, improve communication among Title IIpartners and encourage better coordination of overall programming.
5. COLLABORATION WITH OTHER DONORS
USAID and the European Commission, the world's two largest food aiddonors, agreed in September 1995 to promote the formulation of nationalfood security strategies in five pilot countries – Ethiopia, Eritrea, Malawi,Angola and Bolivia. In late 1997, Bangladesh and Haiti were added tothis list. An indicator of improved integration among food aid donors,therefore, will be continued intensive dialogue with field offices anddelegations on the application of appropriate instruments to support foodsecurity objectives in developing countries.
WFP has programs in many of the same countries as other Title IIpartners. USAID allocated $49.4 million in Title II developmentresources in FY 1997 to WFP. WFP is also eligible for up to $10 millionof 202(e) funding annually, resulting from modifications to the 1996 FarmBill. While there has been relatively good integration between WFP and
Title II partners in some countries, including Bangladesh and India,greater integration is being encouraged throughout the portfolio.Examples include coordinated host country institutional strengthening andtraining efforts and better communication of lessons learned. Anindicator of such integration will be the number of countries in which
CARE and WFP Coordination in India
In India, CARE and WFP worked closely to coordinate their food aid
development activities. These two organizations are major partners with the
Government of India in the implementation of its Integrated Child
Development Services Scheme (ICDS – the world's largest child survival
program). All parties have recognized a "convergence of interest." Both WFP
and CARE have begun to work together on standardization and improvement
of generic ICDS training materials and refinement of the scheme's monitoring
and evaluation system.
EC-USAID Coordination in the Horn of Africa
Better integration among donors and sub-regional entities is being achieved
through regional food aid Codes of Conduct. These "codes" seek ratification by
donors and recipient governments of a set of coordinated and mutually
supportive food security strategies to maximize the impact of food assistance.
A draft Code for the Horn of Africa is presently under review by the member
states of the Intergovernmental Authority on Development (IGAD).

U.S. INTERNATIONAL FOOD ASSISTANCE REPORT, 1997
45
USAID’s PVO partners develop formal joint food-security strategies withWFP. It should be noted here that, in response to FAO/WHO initiativesresulting from the International Conference on Nutrition (1992), WFP isin the process of working with governments worldwide to developnational plans of action for health and nutrition. USAID partners arestrongly encouraged to meld their efforts into these plans, whereverappropriate.
6. PERFORMANCE INDICATORS AND MEASUREMENT
How effectively Title II programs can demonstrate measurable impactsdepends foremost on whether appropriate measurable indicators areidentified in the activity design. Baseline data, in addition to providing astandard against which to measure impact, allows for more reasonableidentification of performance targets.
Title II partners, in the past, have often lacked the resources to conductfull baseline studies prior to their project approval. Beginning in 1997,they are expected to complete baseline data collection and setperformance targets during the initial year of implementation. A reviewof this year's PVO Results Reports and PAAs for FY 1996-2000 activitiesindicated that 39 percent of the activities had completed collection ofbaseline data and established targets consistent with this data. This lowpercentage is due to the newness of the managing-for-results system, theconstrained technical and financial capacity of some partners, and the
Baseline Study and Target Setting by Honduras/CARE
The multisectoral Title II activity initiated by the Cooperative for
Assistance and Relief Everywhere (CARE) in Honduras during FY 1996
is the type of baseline study being promoted in all Title II activities.
An integrated team of professionals with expertise in health, nutrition,
economics, agroforestry and social work reviewed the project’s logical
framework and determined the types and sources of information
needed for each activity and the methodology to be implemented.
The baseline included data on targeted households, as well as a non-
targeted household control group. It defined both impact and annual
monitoring indicators. Emphasis on quality in the baseline study
design and data collection, clear identification of performance targets
and a detailed description of its data collection methods, will allow
data from midterm and final evaluations to be compared to the
baseline.

U.S. INTERNATIONAL FOOD ASSISTANCE REPORT, 1997
46
limited USAID staff capacity to support partner monitoring andevaluation efforts.
7. PARTNER STRENGTHENING
Performance is assessed in terms of how effectively USAID’s partnersachieve the specific targets they set. USAID and its partners are still inthe early stages of creation of a comprehensive baseline. However, anumber of partners have already developed objectively verifiableindicators, completed comprehensive surveys and are demonstratingresults. A system for consolidating the results data, from the ResultsReports into a database, is being developed during 1997. A key to thesuccess of this data consolidation effort, however, will be the degree towhich Title II partners agree and adhere to the use of generic performanceindicators for development activities (see Annex for description and list).
Training and guidance has been provided to strengthen monitoring andevaluation, use of indicators (including DAP and PAA/R2 reviews) forthe 1997/8-2001/2 cycle and preparation of Guides for Measurement ofP.L. 480 Title II Core Impact and Monitoring Indicators.
Improved Performance Indicators for Cape Verde/ACDI
The transition to a managing-for-results system began in FY 1996, with thecollaborative development of generic Title II development performance indicators.In addition, a more rigorous review of indicators and monitoring and evaluation(M&E) plans in the FY 1997-2001 development activity proposals (DAPs), wasinstituted. This has led many Title II partners to refine their performanceindicators and measurement plans. While the overall quality of the Cape Verde/Agricultural Cooperative Department International (ACDI) DAP was assessedfavorably by reviewers, the monitoring and evaluation system requiredstrengthening. Subsequently, ACDI made a major and highly successful effort toredesign the M&E plan.
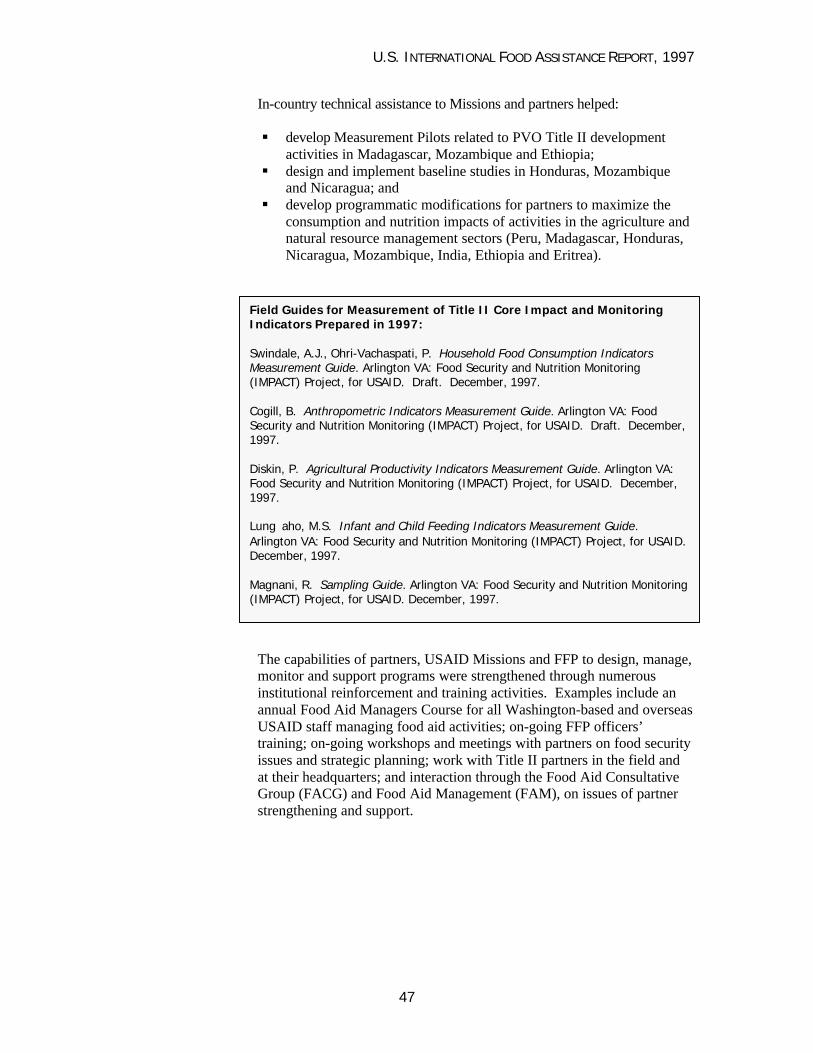
U.S. INTERNATIONAL FOOD ASSISTANCE REPORT, 1997
47
In-country technical assistance to Missions and partners helped:
§ develop Measurement Pilots related to PVO Title II developmentactivities in Madagascar, Mozambique and Ethiopia;
§ design and implement baseline studies in Honduras, Mozambiqueand Nicaragua; and
§ develop programmatic modifications for partners to maximize theconsumption and nutrition impacts of activities in the agriculture andnatural resource management sectors (Peru, Madagascar, Honduras,Nicaragua, Mozambique, India, Ethiopia and Eritrea).
The capabilities of partners, USAID Missions and FFP to design, manage,monitor and support programs were strengthened through numerousinstitutional reinforcement and training activities. Examples include anannual Food Aid Managers Course for all Washington-based and overseasUSAID staff managing food aid activities; on-going FFP officers’training; on-going workshops and meetings with partners on food securityissues and strategic planning; work with Title II partners in the field andat their headquarters; and interaction through the Food Aid ConsultativeGroup (FACG) and Food Aid Management (FAM), on issues of partnerstrengthening and support.
Field Guides for Measurement of Title II Core Impact and MonitoringIndicators Prepared in 1997:
Swindale, A.J., Ohri-Vachaspati, P. Household Food Consumption IndicatorsMeasurement Guide. Arlington VA: Food Security and Nutrition Monitoring(IMPACT) Project, for USAID. Draft. December, 1997.
Cogill, B. Anthropometric Indicators Measurement Guide. Arlington VA: FoodSecurity and Nutrition Monitoring (IMPACT) Project, for USAID. Draft. December,1997.
Diskin, P. Agricultural Productivity Indicators Measurement Guide. Arlington VA:Food Security and Nutrition Monitoring (IMPACT) Project, for USAID. December,1997.
Lung�aho, M.S. Infant and Child Feeding Indicators Measurement Guide.Arlington VA: Food Security and Nutrition Monitoring (IMPACT) Project, for USAID.December, 1997.
Magnani, R. Sampling Guide. Arlington VA: Food Security and Nutrition Monitoring(IMPACT) Project, for USAID. December, 1997.

U.S. INTERNATIONAL FOOD ASSISTANCE REPORT, 1997
48
IMPROVED RESULTS IN TITLE II PROGRAMS
Achievement of Targets by Peru/PRISMA
PRISMA is currently implementing a Title II activity in Peru which includes health andnutrition interventions, microenterprise development and agricultural productivity. Thisactivity was initiated in FY 1996 and continues through FY 2000. In its FY 1996 ResultsReport, PRISMA carefully documented its achievements with respect to the targets(both input-oriented and results-oriented) it had set the previous year. PRISMAdemonstrated that it fully achieved 55 percent of them. In addition, 82 percent werealmost entirely achieved including:§ more than 55 percent of families in the MCH program within six months meeting
graduation criteria of: (a) no child suffering from acute malnutrition during theprevious three months, (b) all children having complete vaccination schedules, (c)pregnant women receiving regular ante-natal care, and (d) all mothers receivingfamily planning counseling;
§ 95 percent repayment rate for microenterprise development loans; and§ agricultural production increased by more than 1000 metric tons.
Results of Infrastructure Projects Demonstrated by Bangladesh/CARE.
The CARE activity in Bangladesh, which was initiated in FY 1994 and continues throughFY 1999, has also measured and documented the degree to which it has met its targets.CARE initiated and has successfully established a monitoring and evaluation system formeasuring and reporting on performance. In the rural infrastructure component of itsactivities, CARE reported that in FY 1996 it exceeded its targets for infrastructuredevelopment for businesses and irrigation, and achieved over 90 percent of its targetlevels for making roads more passable. Furthermore, CARE reported that the increasedroad passability, resulting from their road improvement activities, had led to an increasein vehicular traffic of 22 percent over baseline levels.
Results Demonstrated by Multiple Title II Partners in Ethiopia
A number of Title II partners have been implementing and demonstrating results ofTitle II development activities in Ethiopia. In particular, FY 1996 Results Reportssubmitted by CARE, CRS and WVRD indicated the degree of achievement of bothoutput-oriented and impact targets. CARE, for instance, reported that the introductionof improved agronomic packages resulted in yields 2 to 3 times higher for participatingfarmers. As another example, CRS was able to report an increase of 10 to 20 percent inincome as a direct result of their credit and savings project. WVRD also provided atable in its Results Report which clearly linked its targets, accomplishments and thedegree to which it reached its targets.
Achievement of Results Targets by Peru/CARE
CARE's Title II activity in Peru demonstrated achievement of targeted results. Examplesin FY 1996 included: (1) 75 percent of targeted children rehabilitated from acutemalnutrition; (2) 80 percent of targeted children immunized by 12 months of age; and(3) over 7,000 hectares under improved natural resource management practices.

U.S. INTERNATIONAL FOOD ASSISTANCE REPORT, 1997
49
TITLE III
itle III, USAID’s government-to-government food assistanceprogram, has accomplished much to improve food security. Eventhough the program has been drastically cut over the past few years
and only provided new resources to five countries (Eritrea, Ethiopia,Haiti, Mozambique and Nicaragua) in 1997, it continues to recordprogram impact. The achievements cited in this section include those incountries like Bangladesh, Honduras and Bolivia, which did not receiveTitle III resources in FY 1997, but which had ongoing carryover activitiesduring the year.
USAID’s Title III food policy focus has the following priorities:
§ Countries most in need of food, which can demonstrate that theprogram will be part of a strategy to establish/enhance long-term foodsecurity.
§ Programs with direct links to increased agricultural production andlocal consumption.
Title III is USAID’s major food assistance instrument for policy dialogue.Examples of policy focus included: changing agricultural price policieswhich are unfavorable to producers or discourage productivity; enhancingtechnologies; ending export and import policies that hinder investment inagricultural enterprises and generating investments in rural infrastructure,which support economic growth. Local currency generated from Title IIIprograms is also used to advance food security objectives.
In FY 1998, $30 million in Title III resources (25 percent less than in FY1997) will be allocated to continue to support policy reform anddemocratization (in Haiti), and to strengthen food security in other LDCs.It will also complement USAID's pilot food security project in Africaentitled "Promoting Food Security: Africa and Beyond" (in Mozambiqueand Ethiopia), assisting with agricultural production, technology and ruralinfrastructure construction.
T
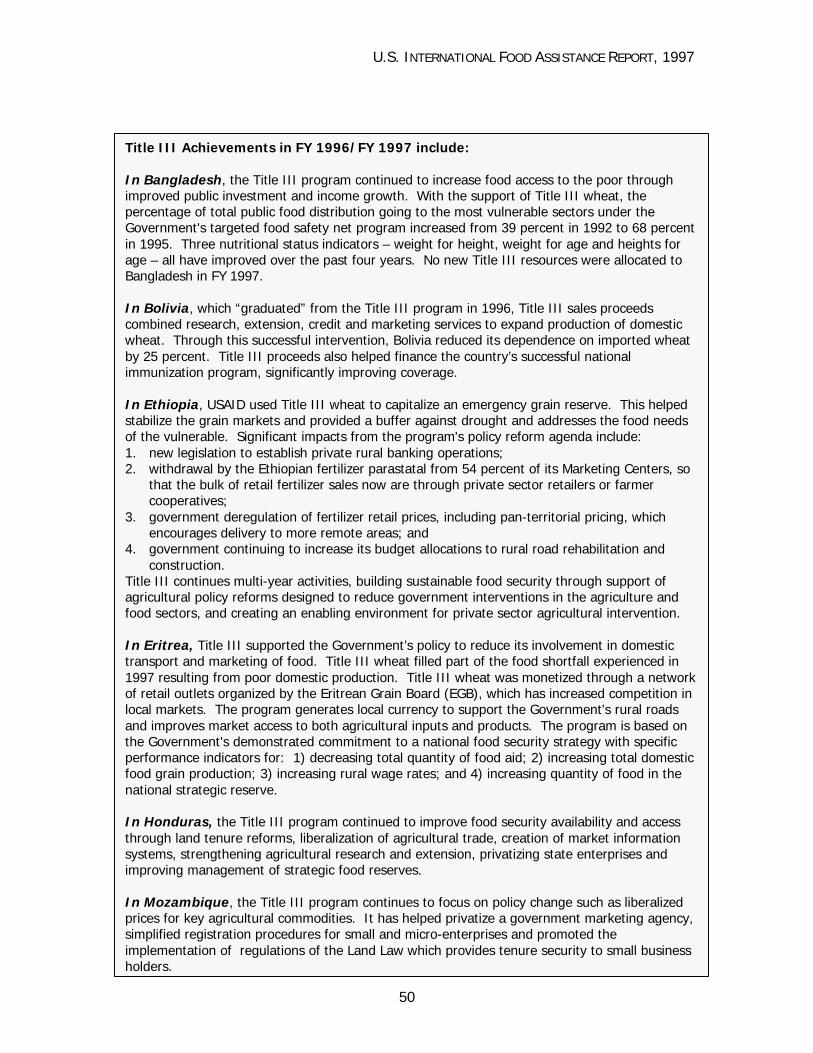
U.S. INTERNATIONAL FOOD ASSISTANCE REPORT, 1997
50
Title III Achievements in FY 1996/FY 1997 include:
In Bangladesh, the Title III program continued to increase food access to the poor throughimproved public investment and income growth. With the support of Title III wheat, thepercentage of total public food distribution going to the most vulnerable sectors under theGovernment's targeted food safety net program increased from 39 percent in 1992 to 68 percentin 1995. Three nutritional status indicators – weight for height, weight for age and heights forage – all have improved over the past four years. No new Title III resources were allocated toBangladesh in FY 1997.
In Bolivia, which “graduated” from the Title III program in 1996, Title III sales proceedscombined research, extension, credit and marketing services to expand production of domesticwheat. Through this successful intervention, Bolivia reduced its dependence on imported wheatby 25 percent. Title III proceeds also helped finance the country’s successful nationalimmunization program, significantly improving coverage.
In Ethiopia, USAID used Title III wheat to capitalize an emergency grain reserve. This helpedstabilize the grain markets and provided a buffer against drought and addresses the food needsof the vulnerable. Significant impacts from the program's policy reform agenda include:1. new legislation to establish private rural banking operations;2. withdrawal by the Ethiopian fertilizer parastatal from 54 percent of its Marketing Centers, so
that the bulk of retail fertilizer sales now are through private sector retailers or farmercooperatives;
3. government deregulation of fertilizer retail prices, including pan-territorial pricing, whichencourages delivery to more remote areas; and
4. government continuing to increase its budget allocations to rural road rehabilitation andconstruction.
Title III continues multi-year activities, building sustainable food security through support ofagricultural policy reforms designed to reduce government interventions in the agriculture andfood sectors, and creating an enabling environment for private sector agricultural intervention.
In Eritrea, Title III supported the Government’s policy to reduce its involvement in domestictransport and marketing of food. Title III wheat filled part of the food shortfall experienced in1997 resulting from poor domestic production. Title III wheat was monetized through a networkof retail outlets organized by the Eritrean Grain Board (EGB), which has increased competition inlocal markets. The program generates local currency to support the Government's rural roadsand improves market access to both agricultural inputs and products. The program is based onthe Government's demonstrated commitment to a national food security strategy with specificperformance indicators for: 1) decreasing total quantity of food aid; 2) increasing total domesticfood grain production; 3) increasing rural wage rates; and 4) increasing quantity of food in thenational strategic reserve.
In Honduras, the Title III program continued to improve food security availability and accessthrough land tenure reforms, liberalization of agricultural trade, creation of market informationsystems, strengthening agricultural research and extension, privatizing state enterprises andimproving management of strategic food reserves.
In Mozambique, the Title III program continues to focus on policy change such as liberalizedprices for key agricultural commodities. It has helped privatize a government marketing agency,simplified registration procedures for small and micro-enterprises and promoted theimplementation of regulations of the Land Law which provides tenure security to small businessholders.
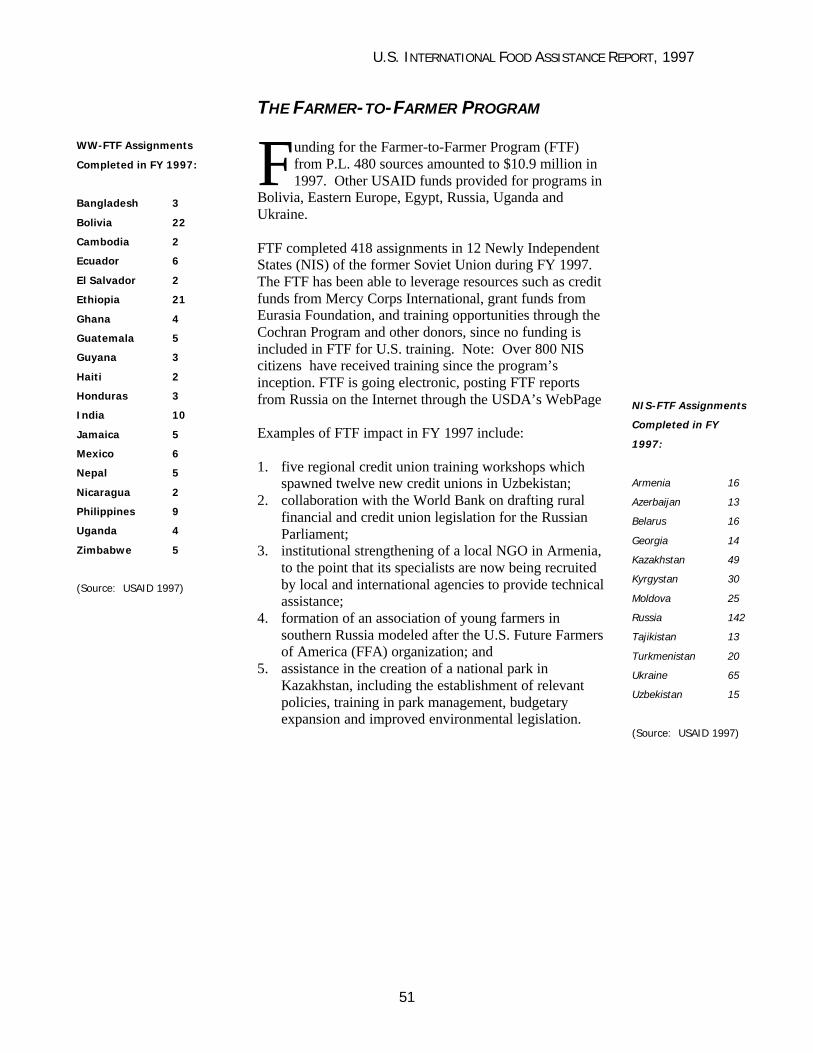
U.S. INTERNATIONAL FOOD ASSISTANCE REPORT, 1997
51
THE FARMER-TO-FARMER PROGRAM
unding for the Farmer-to-Farmer Program (FTF)from P.L. 480 sources amounted to $10.9 million in1997. Other USAID funds provided for programs in
Bolivia, Eastern Europe, Egypt, Russia, Uganda andUkraine.
FTF completed 418 assignments in 12 Newly IndependentStates (NIS) of the former Soviet Union during FY 1997.The FTF has been able to leverage resources such as creditfunds from Mercy Corps International, grant funds fromEurasia Foundation, and training opportunities through theCochran Program and other donors, since no funding isincluded in FTF for U.S. training. Note: Over 800 NIScitizens have received training since the program’sinception. FTF is going electronic, posting FTF reportsfrom Russia on the Internet through the USDA’s WebPage
Examples of FTF impact in FY 1997 include:
1. five regional credit union training workshops whichspawned twelve new credit unions in Uzbekistan;
2. collaboration with the World Bank on drafting ruralfinancial and credit union legislation for the RussianParliament;
3. institutional strengthening of a local NGO in Armenia,to the point that its specialists are now being recruitedby local and international agencies to provide technicalassistance;
4. formation of an association of young farmers insouthern Russia modeled after the U.S. Future Farmersof America (FFA) organization; and
5. assistance in the creation of a national park inKazakhstan, including the establishment of relevantpolicies, training in park management, budgetaryexpansion and improved environmental legislation.
FWW-FTF Assignments
Completed in FY 1997:
Bangladesh 3
Bolivia 22
Cambodia 2
Ecuador 6
El Salvador 2
Ethiopia 21
Ghana 4
Guatemala 5
Guyana 3
Haiti 2
Honduras 3
India 10
Jamaica 5
Mexico 6
Nepal 5
Nicaragua 2
Philippines 9
Uganda 4
Zimbabwe 5
(Source: USAID 1997)
NIS-FTF Assignments
Completed in FY
1997:
Armenia 16
Azerbaijan 13
Belarus 16
Georgia 14
Kazakhstan 49
Kyrgystan 30
Moldova 25
Russia 142
Tajikistan 13
Turkmenistan 20
Ukraine 65
Uzbekistan 15
(Source: USAID 1997)
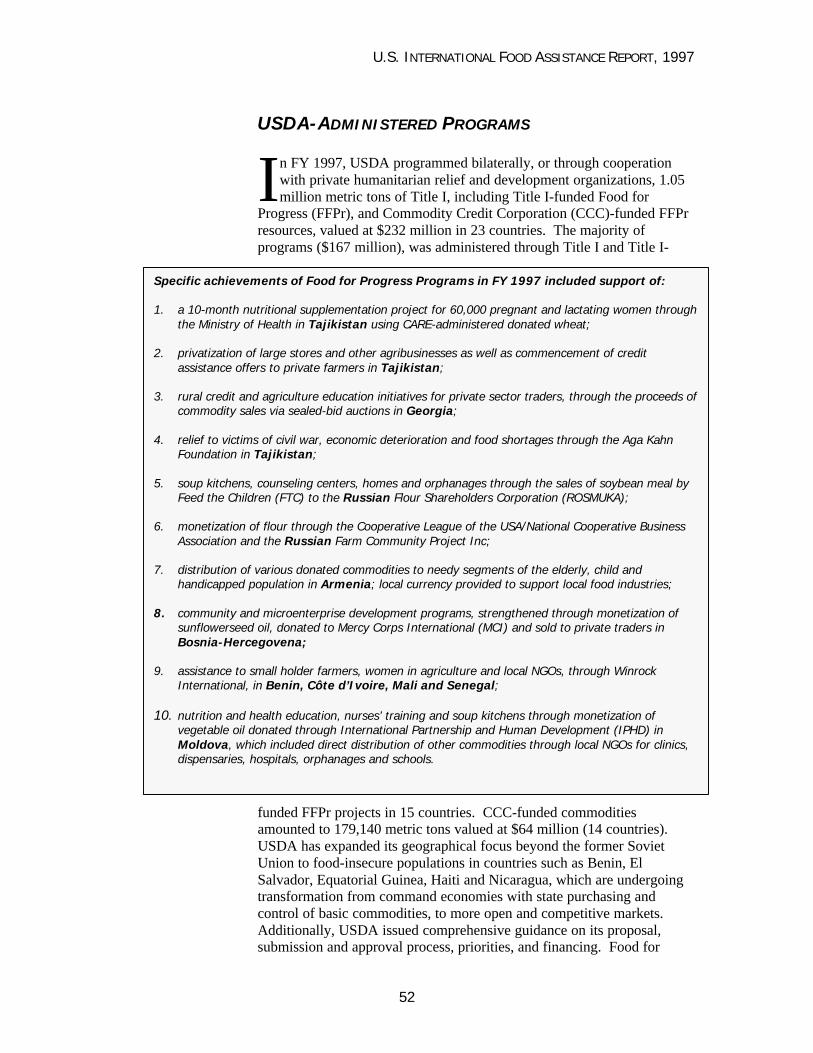
U.S. INTERNATIONAL FOOD ASSISTANCE REPORT, 1997
52
USDA-ADMINISTERED PROGRAMS
n FY 1997, USDA programmed bilaterally, or through cooperationwith private humanitarian relief and development organizations, 1.05million metric tons of Title I, including Title I-funded Food for
Progress (FFPr), and Commodity Credit Corporation (CCC)-funded FFPrresources, valued at $232 million in 23 countries. The majority ofprograms ($167 million), was administered through Title I and Title I-
funded FFPr projects in 15 countries. CCC-funded commoditiesamounted to 179,140 metric tons valued at $64 million (14 countries).USDA has expanded its geographical focus beyond the former SovietUnion to food-insecure populations in countries such as Benin, ElSalvador, Equatorial Guinea, Haiti and Nicaragua, which are undergoingtransformation from command economies with state purchasing andcontrol of basic commodities, to more open and competitive markets.Additionally, USDA issued comprehensive guidance on its proposal,submission and approval process, priorities, and financing. Food for
ISpecific achievements of Food for Progress Programs in FY 1997 included support of:
1. a 10-month nutritional supplementation project for 60,000 pregnant and lactating women throughthe Ministry of Health in Tajikistan using CARE-administered donated wheat;
2. privatization of large stores and other agribusinesses as well as commencement of creditassistance offers to private farmers in Tajikistan;
3. rural credit and agriculture education initiatives for private sector traders, through the proceeds ofcommodity sales via sealed-bid auctions in Georgia;
4. relief to victims of civil war, economic deterioration and food shortages through the Aga KahnFoundation in Tajikistan;
5. soup kitchens, counseling centers, homes and orphanages through the sales of soybean meal byFeed the Children (FTC) to the Russian Flour Shareholders Corporation (ROSMUKA);
6. monetization of flour through the Cooperative League of the USA/National Cooperative BusinessAssociation and the Russian Farm Community Project Inc;
7. distribution of various donated commodities to needy segments of the elderly, child andhandicapped population in Armenia; local currency provided to support local food industries;
8. community and microenterprise development programs, strengthened through monetization ofsunflowerseed oil, donated to Mercy Corps International (MCI) and sold to private traders inBosnia-Hercegovena;
9. assistance to small holder farmers, women in agriculture and local NGOs, through WinrockInternational, in Benin, Côte d’Ivoire, Mali and Senegal;
10. nutrition and health education, nurses’ training and soup kitchens through monetization ofvegetable oil donated through International Partnership and Human Development (IPHD) inMoldova, which included direct distribution of other commodities through local NGOs for clinics,dispensaries, hospitals, orphanages and schools.
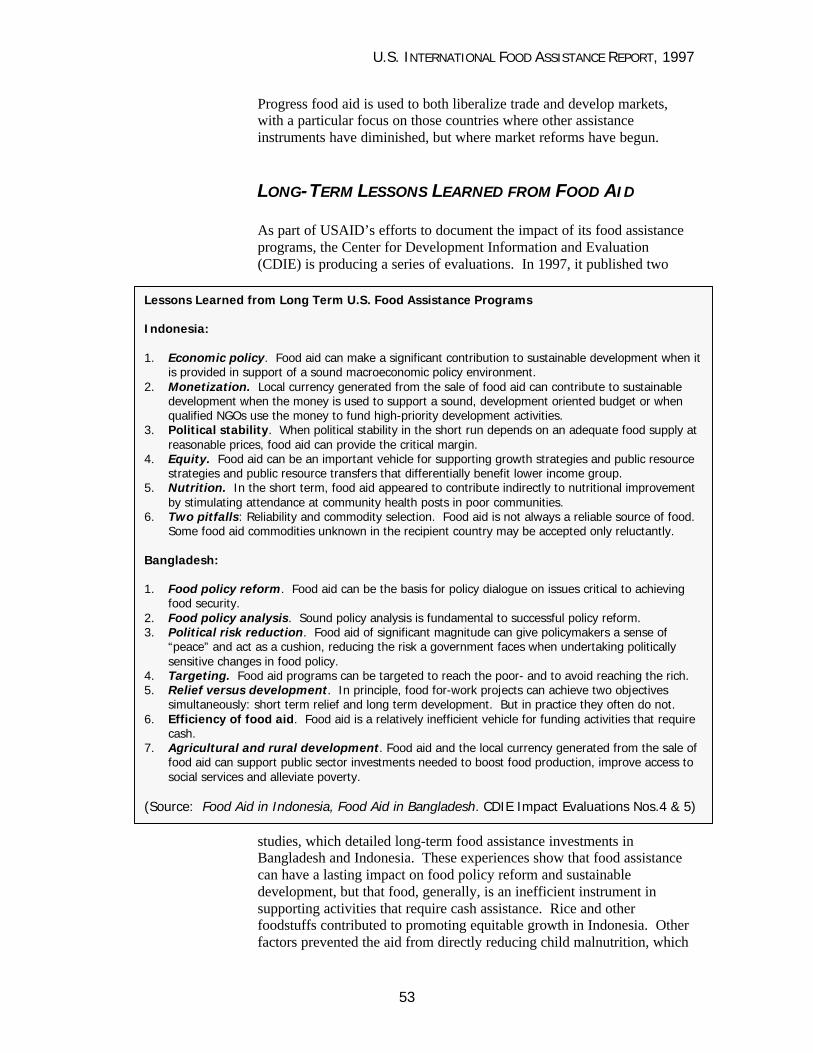
U.S. INTERNATIONAL FOOD ASSISTANCE REPORT, 1997
53
Progress food aid is used to both liberalize trade and develop markets,with a particular focus on those countries where other assistanceinstruments have diminished, but where market reforms have begun.
LONG-TERM LESSONS LEARNED FROM FOOD AID
As part of USAID’s efforts to document the impact of its food assistanceprograms, the Center for Development Information and Evaluation(CDIE) is producing a series of evaluations. In 1997, it published two
studies, which detailed long-term food assistance investments inBangladesh and Indonesia. These experiences show that food assistancecan have a lasting impact on food policy reform and sustainabledevelopment, but that food, generally, is an inefficient instrument insupporting activities that require cash assistance. Rice and otherfoodstuffs contributed to promoting equitable growth in Indonesia. Otherfactors prevented the aid from directly reducing child malnutrition, which
Lessons Learned from Long Term U.S. Food Assistance Programs
Indonesia:
1. Economic policy. Food aid can make a significant contribution to sustainable development when itis provided in support of a sound macroeconomic policy environment.
2. Monetization. Local currency generated from the sale of food aid can contribute to sustainabledevelopment when the money is used to support a sound, development oriented budget or whenqualified NGOs use the money to fund high-priority development activities.
3. Political stability. When political stability in the short run depends on an adequate food supply atreasonable prices, food aid can provide the critical margin.
4. Equity. Food aid can be an important vehicle for supporting growth strategies and public resourcestrategies and public resource transfers that differentially benefit lower income group.
5. Nutrition. In the short term, food aid appeared to contribute indirectly to nutritional improvementby stimulating attendance at community health posts in poor communities.
6. Two pitfalls: Reliability and commodity selection. Food aid is not always a reliable source of food.Some food aid commodities unknown in the recipient country may be accepted only reluctantly.
Bangladesh:
1. Food policy reform. Food aid can be the basis for policy dialogue on issues critical to achievingfood security.
2. Food policy analysis. Sound policy analysis is fundamental to successful policy reform.3. Political risk reduction. Food aid of significant magnitude can give policymakers a sense of
“peace” and act as a cushion, reducing the risk a government faces when undertaking politicallysensitive changes in food policy.
4. Targeting. Food aid programs can be targeted to reach the poor- and to avoid reaching the rich.5. Relief versus development. In principle, food for-work projects can achieve two objectives
simultaneously: short term relief and long term development. But in practice they often do not.6. Efficiency of food aid. Food aid is a relatively inefficient vehicle for funding activities that require
cash.7. Agricultural and rural development. Food aid and the local currency generated from the sale of
food aid can support public sector investments needed to boost food production, improve access tosocial services and alleviate poverty.
(Source: Food Aid in Indonesia, Food Aid in Bangladesh. CDIE Impact Evaluations Nos.4 & 5)
U.S. INTERNATIONAL FOOD ASSISTANCE REPORT, 1997
54
still affects large numbers of the population. In Bangladesh, historicallyUSAID’s second largest food aid program, food assistance helped reducepoverty and improve productivity through policy dialogue. Structuralfactors and the propensity for natural disasters in the country, impedereaching the goal of long-term food security.
The studies demonstrate that food aid is but one component in nationaland global food security strategies. Emphasis on rigorous programplanning, implementation, monitoring and evaluation, as well asinnovative approaches are necessary to maximize the impact of food aid.

U.S. INTERNATIONAL FOOD ASSISTANCE REPORT, 1997
55
AFRICA: MOZAMBIQUE CASE REPORT
COUNTRY SITUATION
ozambique, a former Portuguese colony,recently emerged from a decade and a half ofcivil war and a stretch of periodic droughts.
The country is one of the poorest in the world, with aGDP of less than $100 per capita income and over65% of the budget dependent on foreign sources offunding.
Mozambique has high mortality rates, with diarrhea,malaria, malnutrition and respiratory infections beingthe major contributors to infant and child mortality.Chronic malnutrition (-2SD height for age) andunderweight (-2SD weight for age) were found to be50% and 25-30% respectively in Zambezia andNampula provinces, according to the MozambicanMinistry of Health and UNICEF. Low-birth-weight(LBW) newborns represent 20% of all births. Barely 65-75 percent of caloric requirements(2,000 Kcal/day, per WHO/FAO) is being met on average. Visible hunger and malnutritionare compounded by micronutrient deficiencies. In Zambezia province, approximately50% of reproductive-age women and 57% of school children were anemic (hemoglobinlevel <11 g/dl), which contribute to the high maternal mortality rate of 600-1,100/100,000live births (LB).
FOOD SECURITY IN MOZAMBIQUE
Mozambique is on the verge of completing its transition from war to peace. Basic foodsecurity for the majority of the population is now a reachable national goal. Many formerUSAID activities were focused on emergency food aid because of the civil strife-inducedinternally displaced and refugee populations. A 1996 food security assessment foundseveral types of food insecure populations in Mozambique, most of whom live in ruralareas. Also, in 1996, the World Food Program (WFP) estimated that emergency foodassistance reached on average 650,000 per month with up to 1.4 million displaced peopleand refugees suffering from transitory food insecurity due to flooding and crop loss. Lackof inputs and inadequate physical security contribute to ineffective land use, even amongpopulations with sufficient access to land. Chronic food insecurity affects both rural andurban households. In 1993, over 50 percent of the 3 million urban dwellers did not haveenough income to cover their minimum daily requirements and 30 percent could not meettwo-thirds of this requirement. Over 70 percent of the urban population is women, childrenor elderly, with approximately a quarter of households designated as female-headed.
MVital Statistics:
Population:
16.5 Million
Income:
<$100/capita (1995)
Poverty Level: 95%
Rural Sector:
Constitutes 80% of
total employment;
80 percent of
population lives in
rural areas;
70 percent of rural
population live in
absolute poverty
(World Bank);
only 30 percent have
access to clean water
Health:
IMR: 162/1000 Live
Births (LB)
CMR: 277/1000 LB
Maternal Mortality
Rate: 600-
1,100/100,000 LB
(Sources: World Bank:
World Development
Report 1997; UNICEF
State of the World’s
Children 1996; MACRO:
Demographic & Health
Surveys 1991, 1996)
Mozambique
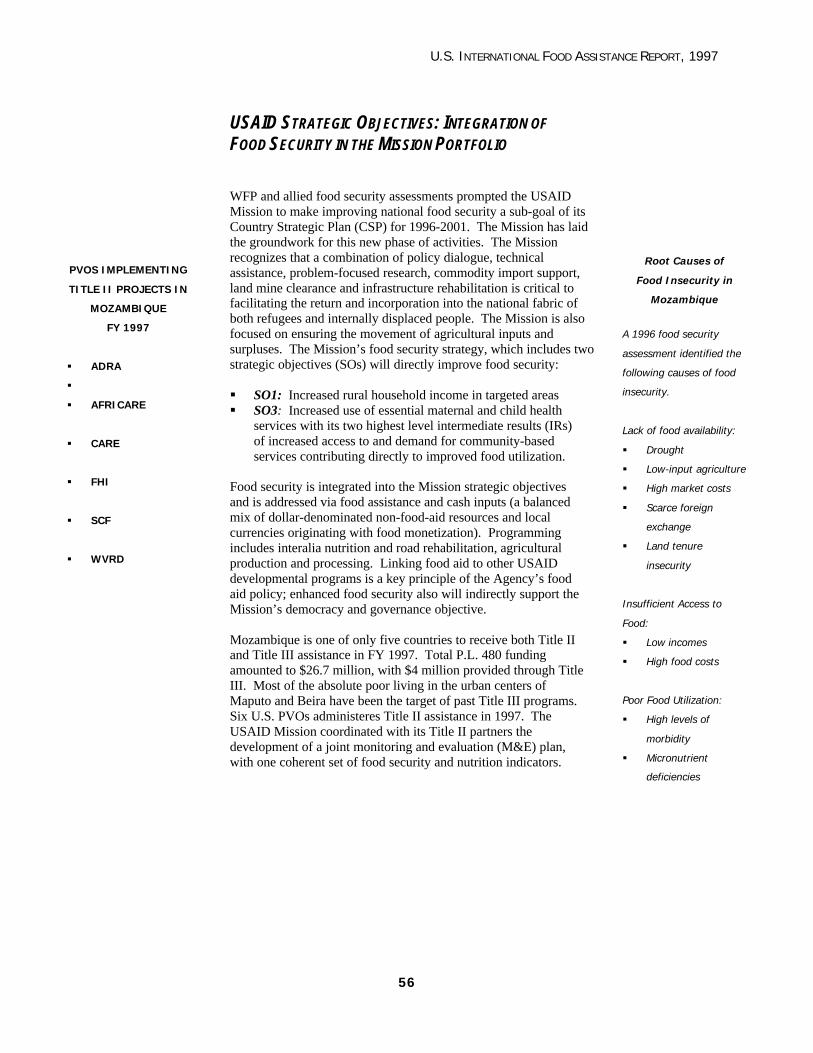
U.S. INTERNATIONAL FOOD ASSISTANCE REPORT, 1997
56
USAID STRATEGIC OBJECTIVES: INTEGRATION OF
FOOD SECURITY IN THE MISSION PORTFOLIO
WFP and allied food security assessments prompted the USAIDMission to make improving national food security a sub-goal of itsCountry Strategic Plan (CSP) for 1996-2001. The Mission has laidthe groundwork for this new phase of activities. The Missionrecognizes that a combination of policy dialogue, technicalassistance, problem-focused research, commodity import support,land mine clearance and infrastructure rehabilitation is critical tofacilitating the return and incorporation into the national fabric ofboth refugees and internally displaced people. The Mission is alsofocused on ensuring the movement of agricultural inputs andsurpluses. The Mission’s food security strategy, which includes twostrategic objectives (SOs) will directly improve food security:
§ SO1: Increased rural household income in targeted areas§ SO3: Increased use of essential maternal and child health
services with its two highest level intermediate results (IRs)of increased access to and demand for community-basedservices contributing directly to improved food utilization.
Food security is integrated into the Mission strategic objectivesand is addressed via food assistance and cash inputs (a balancedmix of dollar-denominated non-food-aid resources and localcurrencies originating with food monetization). Programmingincludes interalia nutrition and road rehabilitation, agriculturalproduction and processing. Linking food aid to other USAIDdevelopmental programs is a key principle of the Agency’s foodaid policy; enhanced food security also will indirectly support theMission’s democracy and governance objective.
Mozambique is one of only five countries to receive both Title IIand Title III assistance in FY 1997. Total P.L. 480 fundingamounted to $26.7 million, with $4 million provided through TitleIII. Most of the absolute poor living in the urban centers ofMaputo and Beira have been the target of past Title III programs.Six U.S. PVOs administeres Title II assistance in 1997. TheUSAID Mission coordinated with its Title II partners thedevelopment of a joint monitoring and evaluation (M&E) plan,with one coherent set of food security and nutrition indicators.
Root Causes of
Food Insecurity in
Mozambique
A 1996 food security
assessment identified the
following causes of food
insecurity.
Lack of food availability:
§ Drought
§ Low-input agriculture
§ High market costs
§ Scarce foreign
exchange
§ Land tenure
insecurity
Insufficient Access to
Food:
§ Low incomes
§ High food costs
Poor Food Utilization:
§ High levels of
morbidity
§ Micronutrient
deficiencies
PVOS IMPLEMENTING
TITLE II PROJECTS IN
MOZAMBIQUE
FY 1997
§ ADRA
§
§ AFRICARE
§ CARE
§ FHI
§ SCF
§ WVRD

U.S. INTERNATIONAL FOOD ASSISTANCE REPORT, 1997
57
INTEGRATING AND FOCUSING PVO ACTIVITIES
Because of Mozambique’slarge geographic size andlogistical challenges, USAID isfocusing all of its interventionsin specific geographic areaspopulated by poor, butpotentially very productivefarmers. While these parts ofthe country are not the mostchronically food insecure, theyhave the largest concentrationsof people living in poverty andhold the most promise forenhancing national foodsecurity. The USAID area ofintervention (Northern Manica,and Sofala, Zambezia andNampula) has some surplus production of cereals and other crops in all years, since it is inthe zone of reliable rainfall. This zone is at the crossroads of north-south and east-westtransport, but is poorly served with transportation networks and poorly linked with the restof the country. The Mission now has the opportunity to meld enhanced production andredistribution from surplus areas with market integration and infrastructure development.All six PVOs are concentrating their efforts in Zambezia and Nampula and in districts withacute food insecurity along the coast.
PVOS COMBINE P.L. 480 FOOD AND FUNDS WITH OTHER RESOURCES
All PVOs rely on a mix of Development Assistance (DA) dollars and local currencyfunding from monetized P.L. 480 Title II food. Mission DA resources are available fromthe PVO Support II and Rural Access projects. Section 202(e) Grants are being sought byall PVOs beginning in FY 1997 for institutional strengthening. WVRD has the largestTitle II project ($13.7 Million) and serves as the umbrella agency for all the PVOmonetization activities. CARE, Africare and WVRD plan to use monetized food tostrengthen the country’s edible oil sector. Food for the Hungry International (FHI) isalready operating an edible oil processing activity, but not with P.L. 480 resources.WVRD conducts limited institutional feeding to discrete food insecure populations and isexploring, along with SCF, food-for-work (FFW) opportunities to rehabilitate roads. Aprime consideration will be whether to use FFW or cash-for-work (CFW), which appears tobe preferred.
SPECIAL ROLE FOR TITLE III RESOURCES
Title III wheat and vegetable oil resources (1997-1999) promote long-term policy changes,including the simplification of licensing and registration, privatization, elimination of pricecontrols and the emergence of a private sector. Policy measures supported under Title IIIto improve the health sector relate to health care financing, cost recovery at major healthcare facilities, liberalization of the import and distribution of pharmaceuticals and makingmore local resources available for primary health care.
Title II Development & Title III Projects Mozambique FY 1997 Total: $26.7 Million
(in $ Millions)
1.2 1.82
1.7
2.2
13.7
4
AFRICARE
CARE
FHI
SCF
ADRA
WVRD
Title III
WHERE IS USAID
TARGETING?
In the maize-
cropping system
areas from the
Beira Corridor,
Zambezia and
Nampula
provinces and the
cashew tree
cropping systems
of the coastal
regions of the
latter provinces.
Key marketing
corridors may be
expanded to the
northeastern
corner of Tete
province

U.S. INTERNATIONAL FOOD ASSISTANCE REPORT, 1997
58
LATIN AMERICA: PERU CASE REPORT
COUNTRY SITUATION
eru continues to make progress in building economic andpolitical stability and in alleviating poverty. Itsconstitutionally elected government has worked to bring
inflation, narco-trafficking and terrorism under control. TheGovernment of Peru (GOP) has accelerated opening the economyand expanding citizen participation. However, there remains asignificant income inequality and many social indicators remainstagnant.
Peru continues to transform into a market economy with keysectoral reforms: nearly $6 billion in state enterprises have beenprivatized since 1990 and non-tariff trade barriers removed.Simultaneously, Peru created one of the most open foreigninvestment climates in the world, leading the country to havefewer market distortions than other members of the Andean Pact.
Peru’s economy grew nearly 9 percent per year during the period1993-1995, with inflation at 10 percent. A more sustainable ratefor GDP was set for 1997 and 1998. Continued support to thehealth and education sectors is underscored by almost 10,000schools and 1,100 health centers built or rehabilitated between1991 and 1996, mainly in rural and smaller urban areas, in aneffort to address extreme poverty.
FOOD SECURITY IN PERU
On average, from 1988 to 1990, the population consumed 87percent of daily caloric requirements. About 18 percent of thecountry’s population is too poor to afford a basic food basket thatwould meet the international energy and protein requirementstandard. This estimate includes about 806,000 children underfive years of age living in extreme poverty. However, due toemphasis on the health sector and general improvement ineconomic conditions, chronic malnutrition rates droppeddramatically among under five-year olds, from 34 percent to 27percent between 1991 and 1996.
USAID STRATEGIC OBJECTIVES: INTEGRATION OF
FOOD SECURITY IN THE MISSION PORTFOLIO
USAID/Peru received approval for its new five-year strategy (FY1997-FY 2001) which has the following Strategic Objectives andone Special Objective (SPO):
SO1: Broader citizen participation in the democratic process.SO2: Increased incomes of the poor.SO3: Improved health, including family planning of high risk populations.
PVital Statistics:
Population: 24 Million
(1994)
Income:
<$2,000/capita (1995)
Poverty Level:
20 percent have incomes
<$200/capita
Health:
<5 yr old malnutrition
rate: 27 percent (1996)
IMR: 43/1000 Live
Births (LB)
CMR: 59/1000 LB
Maternal Mortality Rate:
200/100,000 LB
(1980-1992)
Fertility Rate dropped
from 3.5 to 3.1 births
(1996)
(Sources: World Bank:World Development Report1997; UNICEF State of theWorld’s Children 1996;MACRO: Demographic &Health Surveys 1991, 1996)
Peru
PVOS/NGOSIMPLEMENTING
TITLE II PROJECTSIN PERU FY 1997
§ ADRA
§ CARE
§ Caritas Peru
§ PRISMA
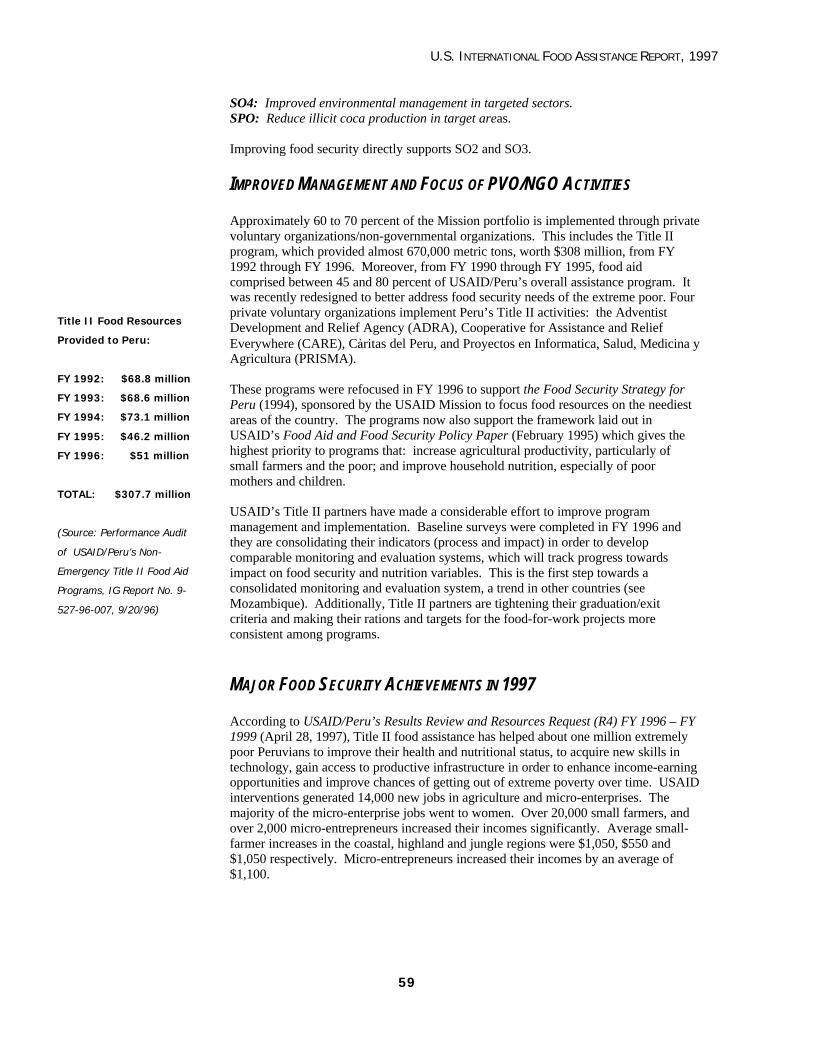
U.S. INTERNATIONAL FOOD ASSISTANCE REPORT, 1997
59
SO4: Improved environmental management in targeted sectors.SPO: Reduce illicit coca production in target areas.
Improving food security directly supports SO2 and SO3.
IMPROVED MANAGEMENT AND FOCUS OF PVO/NGO ACTIVITIES
Approximately 60 to 70 percent of the Mission portfolio is implemented through privatevoluntary organizations/non-governmental organizations. This includes the Title IIprogram, which provided almost 670,000 metric tons, worth $308 million, from FY1992 through FY 1996. Moreover, from FY 1990 through FY 1995, food aidcomprised between 45 and 80 percent of USAID/Peru’s overall assistance program. Itwas recently redesigned to better address food security needs of the extreme poor. Fourprivate voluntary organizations implement Peru’s Title II activities: the AdventistDevelopment and Relief Agency (ADRA), Cooperative for Assistance and ReliefEverywhere (CARE), CBritas del Peru, and Proyectos en Informatica, Salud, Medicina yAgricultura (PRISMA).
These programs were refocused in FY 1996 to support the Food Security Strategy forPeru (1994), sponsored by the USAID Mission to focus food resources on the neediestareas of the country. The programs now also support the framework laid out inUSAID’s Food Aid and Food Security Policy Paper (February 1995) which gives thehighest priority to programs that: increase agricultural productivity, particularly ofsmall farmers and the poor; and improve household nutrition, especially of poormothers and children.
USAID’s Title II partners have made a considerable effort to improve programmanagement and implementation. Baseline surveys were completed in FY 1996 andthey are consolidating their indicators (process and impact) in order to developcomparable monitoring and evaluation systems, which will track progress towardsimpact on food security and nutrition variables. This is the first step towards aconsolidated monitoring and evaluation system, a trend in other countries (seeMozambique). Additionally, Title II partners are tightening their graduation/exitcriteria and making their rations and targets for the food-for-work projects moreconsistent among programs.
MAJOR FOOD SECURITY ACHIEVEMENTS IN 1997
According to USAID/Peru’s Results Review and Resources Request (R4) FY 1996 – FY1999 (April 28, 1997), Title II food assistance has helped about one million extremelypoor Peruvians to improve their health and nutritional status, to acquire new skills intechnology, gain access to productive infrastructure in order to enhance income-earningopportunities and improve chances of getting out of extreme poverty over time. USAIDinterventions generated 14,000 new jobs in agriculture and micro-enterprises. Themajority of the micro-enterprise jobs went to women. Over 20,000 small farmers, andover 2,000 micro-entrepreneurs increased their incomes significantly. Average small-farmer increases in the coastal, highland and jungle regions were $1,050, $550 and$1,050 respectively. Micro-entrepreneurs increased their incomes by an average of$1,100.
Title II Food Resources
Provided to Peru:
FY 1992: $68.8 million
FY 1993: $68.6 million
FY 1994: $73.1 million
FY 1995: $46.2 million
FY 1996: $51 million
TOTAL: $307.7 million
(Source: Performance Audit
of USAID/Peru’s Non-
Emergency Title II Food Aid
Programs, IG Report No. 9-
527-96-007, 9/20/96)
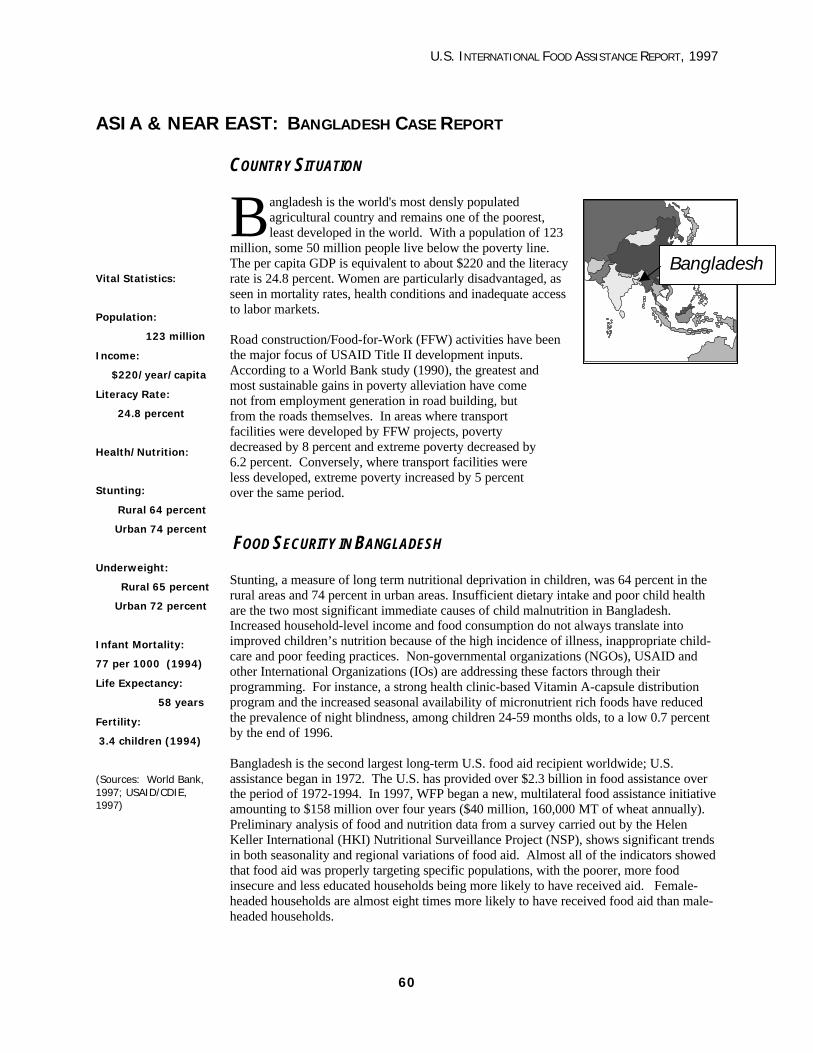
U.S. INTERNATIONAL FOOD ASSISTANCE REPORT, 1997
60
ASIA & NEAR EAST: BANGLADESH CASE REPORT
COUNTRY SITUATION
angladesh is the world's most densly populatedagricultural country and remains one of the poorest,least developed in the world. With a population of 123
million, some 50 million people live below the poverty line.The per capita GDP is equivalent to about $220 and the literacyrate is 24.8 percent. Women are particularly disadvantaged, asseen in mortality rates, health conditions and inadequate accessto labor markets.
Road construction/Food-for-Work (FFW) activities have beenthe major focus of USAID Title II development inputs.According to a World Bank study (1990), the greatest andmost sustainable gains in poverty alleviation have comenot from employment generation in road building, butfrom the roads themselves. In areas where transportfacilities were developed by FFW projects, povertydecreased by 8 percent and extreme poverty decreased by6.2 percent. Conversely, where transport facilities wereless developed, extreme poverty increased by 5 percentover the same period.
FOOD SECURITY IN BANGLADESH
Stunting, a measure of long term nutritional deprivation in children, was 64 percent in therural areas and 74 percent in urban areas. Insufficient dietary intake and poor child healthare the two most significant immediate causes of child malnutrition in Bangladesh.Increased household-level income and food consumption do not always translate intoimproved children’s nutrition because of the high incidence of illness, inappropriate child-care and poor feeding practices. Non-governmental organizations (NGOs), USAID andother International Organizations (IOs) are addressing these factors through theirprogramming. For instance, a strong health clinic-based Vitamin A-capsule distributionprogram and the increased seasonal availability of micronutrient rich foods have reducedthe prevalence of night blindness, among children 24-59 months olds, to a low 0.7 percentby the end of 1996.
Bangladesh is the second largest long-term U.S. food aid recipient worldwide; U.S.assistance began in 1972. The U.S. has provided over $2.3 billion in food assistance overthe period of 1972-1994. In 1997, WFP began a new, multilateral food assistance initiativeamounting to $158 million over four years ($40 million, 160,000 MT of wheat annually).Preliminary analysis of food and nutrition data from a survey carried out by the HelenKeller International (HKI) Nutritional Surveillance Project (NSP), shows significant trendsin both seasonality and regional variations of food aid. Almost all of the indicators showedthat food aid was properly targeting specific populations, with the poorer, more foodinsecure and less educated households being more likely to have received aid. Female-headed households are almost eight times more likely to have received food aid than male-headed households.
BBangladesh
Vital Statistics:
Population:
123 million
Income:
$220/year/capita
Literacy Rate:
24.8 percent
Health/Nutrition:
Stunting:
Rural 64 percent
Urban 74 percent
Underweight:
Rural 65 percent
Urban 72 percent
Infant Mortality:
77 per 1000 (1994)
Life Expectancy:
58 years
Fertility:
3.4 children (1994)
(Sources: World Bank,1997; USAID/CDIE,1997)

U.S. INTERNATIONAL FOOD ASSISTANCE REPORT, 1997
61
The Bangladesh experience with long-term food assistance offers several importantlessons, according to the1997 USAID/Center for Development Information andEvaluation’s (CDIE) Bangladesh Impact Evaluation. Historically, food aid provided thebasis for policy dialog on issues critical to achieving food security by reducing the risk ofundertaking politically sensitive changes in food policy. The evaluation confirmed thatsound policy analysis is fundamental to successful policy reform, and illustrated how foodaid can be successfully targeted to effectively reach the extreme poor.
The evaluation concluded that local currency, generated from the sale of food aid(monetization), was effectively used to support public sector activities needed to boost foodproduction, improve access to social services and reduce poverty.
USAID STRATEGIC OBJECTIVES: INTEGRATION OF FOOD SECURITY IN THE
MISSION PORTFOLIO
“Improved Food Security for the Poor” is one USAID Mission Strategic Objective. In1997, the Mission began monitoring Intermediate Results (IRs), which included:“Nutritionally Enhanced Diets of the Poor,” “Increased Agricultural Productivity” and“Increased Real Household Incomes.” More work with NGO partners is also beingplanned to achieve the objectives.
In the past 5 years a continual (average 2 percent per year) reduction in stunting has beenmeasured in children 6-59 months old. USAID-supported activities have contributed toenhancing the diets of the poor through increases in the production of fish and vegetables.In 1996, increased production of these foods contributed to a 5 percent increase in nationalaverage consumption. USAID plans to expand the existing fisheries activities throughsustainable harvests in open-capture fisheries.
Since the late 1970’s, USAID has been contributing to the improvement of marketefficiency and the promotion of entrepreneurship, via Fertilizer Distribution Improvement(FDI) projects, with the Government of Bangladesh (GOB). Rice is a major staple, whichrepresented 40 percent of Bangladesh’s food in 1995. Farm households, using fertilizer togrow high-yielding rice in the aman season, earned 40 percent more per hectare thanhouseholds growing traditional varieties without fertilizer. In general, the FDI programshowed that improving the policy and regulatory environment, privatizing parastatals,disengaging government from direct participation in agribusiness activities and developinginfrastructure, help expand agribusiness more than direct assistance to firms.
Multiyear food aid agreements allowed USAID to progressively address economic policieswhich have adversely affected the food sector and to introduce new policies to enhancefood security. The reforms included gradual elimination of much of the urban-biased foodsubsidy system, introduction of a buffer stock plan to stabilize rice prices, encouragementof private traders to market food grains and of NGOs to carry out agricultural extension,and the strengthening of government food policy analysis. These reforms affected theentire grain sector in Bangladesh, even though U.S. food aid was less than 4 percent of thefood grain supply in all but two years – a clear demonstration of food aid’s use as anefficient development tool.

U.S. INTERNATIONAL FOOD ASSISTANCE REPORT, 1997
62
INTEGRATING AND FOCUSING PVO ACTIVITIES
CARE is the only Title II U.S. PVO currently working in Bangladesh, but otherPVOs/NGOs are working in the country to meet food security objectives. CARE ismonetizing approximately 85 percent of the Title II food in order to finance construction ofbridges and culverts for existing roads, as well as to meet operational expenses.
All food aid partners now are being required by the GOB to intensify their focus ondevelopment objectives. The emphasis of Title II has shifted from short-term relief tolong-term development. In 1991, CARE managed a cyclone response effort, which wasone of its largest response programs ever. Out of that experience, CARE created theDisaster Management Unit (DMU) in 1993, with the financial support of USAID. TheDMU is working to improve the disaster management capabilities of CARE/Bangladesh,expand the role of its partner NGOs and reduce the vulnerability of the rural poor to rapid-onset natural disasters. National and local NGOs are pre-qualified in disaster managementand registered as official CARE partners in order to expedite the transfer of funds to thegrassroots level. The pre-qualified NGOs are also eligible to receive Disaster AssistanceFunds from USAID’s Office of Foreign Disaster Assistance (OFDA) through CARE.
SPECIAL ROLE FOR TITLE III RESOURCES
Although Bangladesh did not receive Title III assistance in 1997, the legacy of past TitleIII-funded activities continues to be felt. Title III served to improve market-oriented foodpolicies, increase food security and reduce Bangladesh’s vulnerability to disasters. Theefforts of Title III, combined with inputs from the Bangladesh Food Policy Project, led tothe introduction of the Food-for-Education (FFE) program in 1989. FFE has proven itseffectiveness in promoting primary education among poor households (school enrollmentrose by 27 percent overall and 31 percent for females; overall dropout rates decreased from18 percent to 11 percent, and from 19 percent to 10 percent among females).
The combined effort of the Title III program and the food policy project brought about thefollowing results:
§ 40 percent increase in foodgrain production since the early 1980s.
§ Targeted distribution up from 30 percent of the total Public Food Distribution System(PFDS) in the 1980s to nearly 70 percent at present.
§ Annual food subsidy down from approximately $150–200 million to $50 million overthe corresponding period.
§ Nearly half of the total food grain now imported through the private sector.
In short, the Title III program has leveraged increased investments in poor people. Itcontributed to eliminating subsidized sales channels for the middle class (since 1990), andhas increased targeted programs to reach the poor. Title III also contributed to improvingnutrition of very poor families through the Food-for-Education program. It is noted thatU.S. commercial wheat exports to Bangladesh have also increased.

U.S. INTERNATIONAL FOOD ASSISTANCE REPORT, 1997
63
ANNEXES
1. Basic U.S. Food Aid Programs: Descriptions2. List of Title I, II & III Countries3. Summary Budget, Commodity and Tonnage Tables for USDA Title I, Title I-Funded
Food for Progress Activities & USAID Title III Programs4. Summary Budget, Commodity and Tonnage Tables for USDA CCC-Funded Food for
Progress Activities5. Summary Budget, Commodity, Recipient and Tonnage Tables for USAID Title II
Development and Emergency Activities6. Title II Strategic Objectives (SO1 and SO2) and Intermediate Results (IRs)
Frameworks7. Title II Development Activities & Components Table8. Title II Emergency Activities & Components Table9. Title II Congressional Mandates10. Section 202(e) and Institutional Support Grant (ISG) Funding 199711. Generic Indicators Table and Description12. Food Aid Shipments (Cereals) by Donor, 1971-1997 & Obligations under the Food
Aid Convention (FAC), 1986-1996
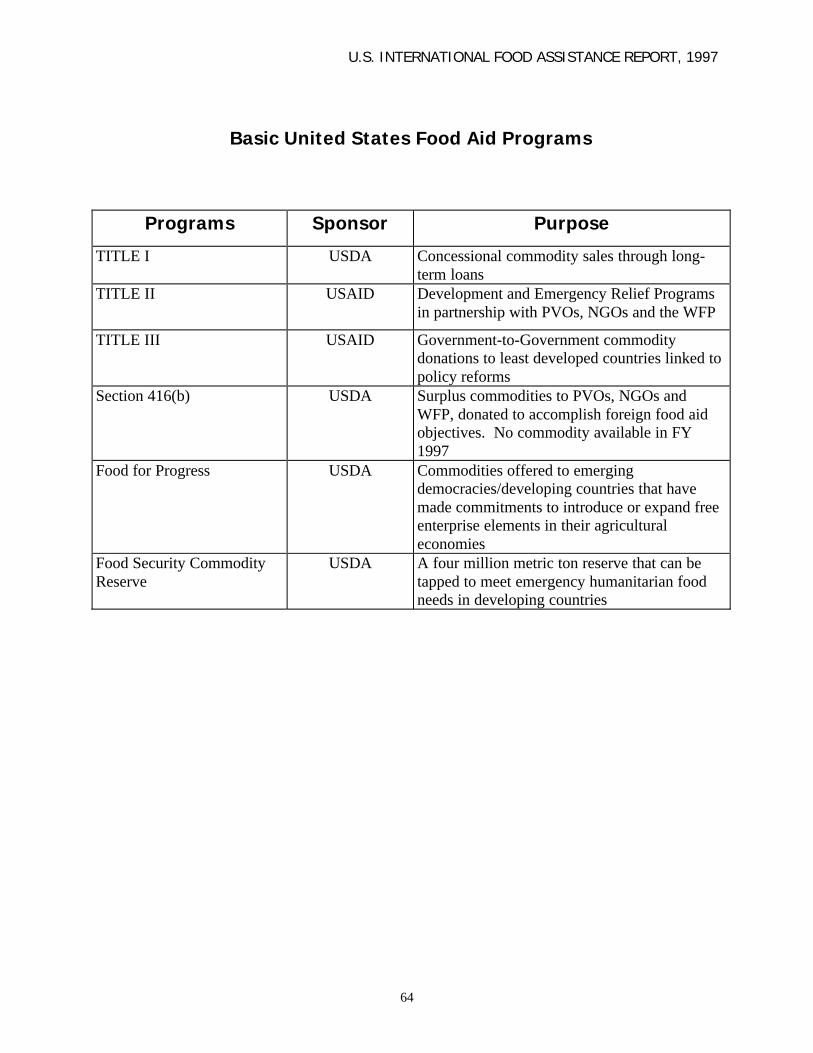
U.S. INTERNATIONAL FOOD ASSISTANCE REPORT, 1997
64
Basic United States Food Aid Programs
Programs Sponsor Purpose
TITLE I USDA Concessional commodity sales through long-term loans
TITLE II USAID Development and Emergency Relief Programsin partnership with PVOs, NGOs and the WFP
TITLE III USAID Government-to-Government commoditydonations to least developed countries linked topolicy reforms
Section 416(b) USDA Surplus commodities to PVOs, NGOs andWFP, donated to accomplish foreign food aidobjectives. No commodity available in FY1997
Food for Progress USDA Commodities offered to emergingdemocracies/developing countries that havemade commitments to introduce or expand freeenterprise elements in their agriculturaleconomies
Food Security CommodityReserve
USDA A four million metric ton reserve that can betapped to meet emergency humanitarian foodneeds in developing countries
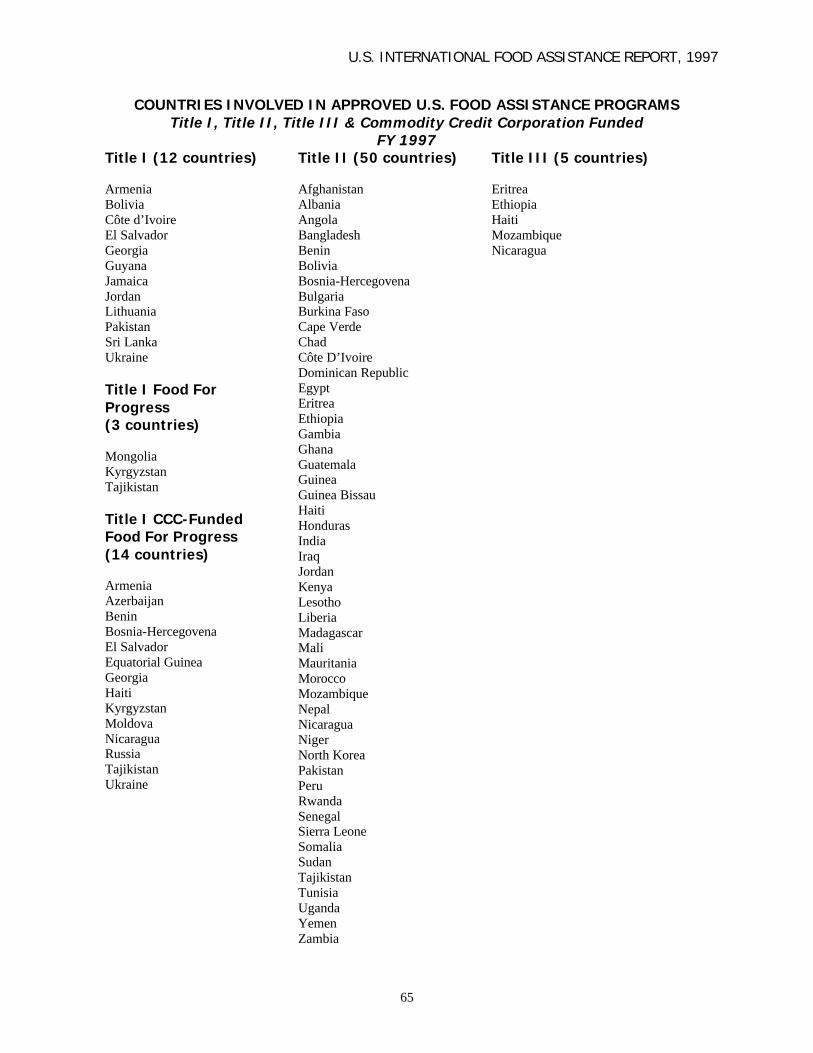
U.S. INTERNATIONAL FOOD ASSISTANCE REPORT, 1997
65
COUNTRIES INVOLVED IN APPROVED U.S. FOOD ASSISTANCE PROGRAMSTitle I, Title II, Title III & Commodity Credit Corporation Funded
FY 1997Title I (12 countries)
ArmeniaBoliviaCôte d’IvoireEl SalvadorGeorgiaGuyanaJamaicaJordanLithuaniaPakistanSri LankaUkraine
Title I Food ForProgress(3 countries)
MongoliaKyrgyzstanTajikistan
Title I CCC-FundedFood For Progress(14 countries)
ArmeniaAzerbaijanBeninBosnia-HercegovenaEl SalvadorEquatorial GuineaGeorgiaHaitiKyrgyzstanMoldovaNicaraguaRussiaTajikistanUkraine
Title II (50 countries)
AfghanistanAlbaniaAngolaBangladeshBeninBoliviaBosnia-HercegovenaBulgariaBurkina FasoCape VerdeChadCôte D’IvoireDominican RepublicEgyptEritreaEthiopiaGambiaGhanaGuatemalaGuineaGuinea BissauHaitiHondurasIndiaIraqJordanKenyaLesothoLiberiaMadagascarMaliMauritaniaMoroccoMozambiqueNepalNicaraguaNigerNorth KoreaPakistanPeruRwandaSenegalSierra LeoneSomaliaSudanTajikistanTunisiaUgandaYemenZambia
Title III (5 countries)
EritreaEthiopiaHaitiMozambiqueNicaragua

U.S. INTERNATIONAL FOOD ASSISTANCE REPORT, 1997
Country Commodity Metric Tons ValueArmenia Wheat 63,000 11,306,250Bolivia Wheat 64,890 9,999,980Côte D' Ivoire Rice 30,360 9,999,920El Salvador Soy Bean Meal, Tallow, Veg. 19,780 9,172,640Georgia Wheat 108,970 17,214,640Guyana Wheat 45,970 7,813,470Jamaica Rice 15,200 5,348,790Jordan Rice 115,500 20,898,470Lithuania Soy Bean Meal 30,000 7,609,500Pakistan Soy Bean Meal, Wheat 203,430 34,999,670Sri Lanka Wheat 64,980 9,999,910Ukraine Cotton 5,700 8,345,360
767,780 $152,708,600
Country Commodity Metric Tons ValueMongolia Wheat Flour 11,000 1,629,210Kyrgystan Wheat 60,000 8,280,600Tajikistan Wheat 35,000 4,814,950
106,000 $14,724,760
Country Commodity Metric Tons ValueEritrea Wheat 59,540 15,000,000Ethiopia Wheat 42,000 10,000,000Haiti Wheat Flour 26,000 10,000,000Mozambique Wheat 16,500 4,000,000Nicaragua Wheat 7,000 1,400,000
151,040 $40,400,000
*Source: USDA/ERS/12/31/97
**Source: USAID/BHR/FFPIS/12/31/97
Total Title III
Total Title I
Total Title I: Food for Progress
Public Law 480 Title I and Title III Programs, FY 1997
Title III Programs**
Title I Programs*
Title I Programs: Food for Progress*
66
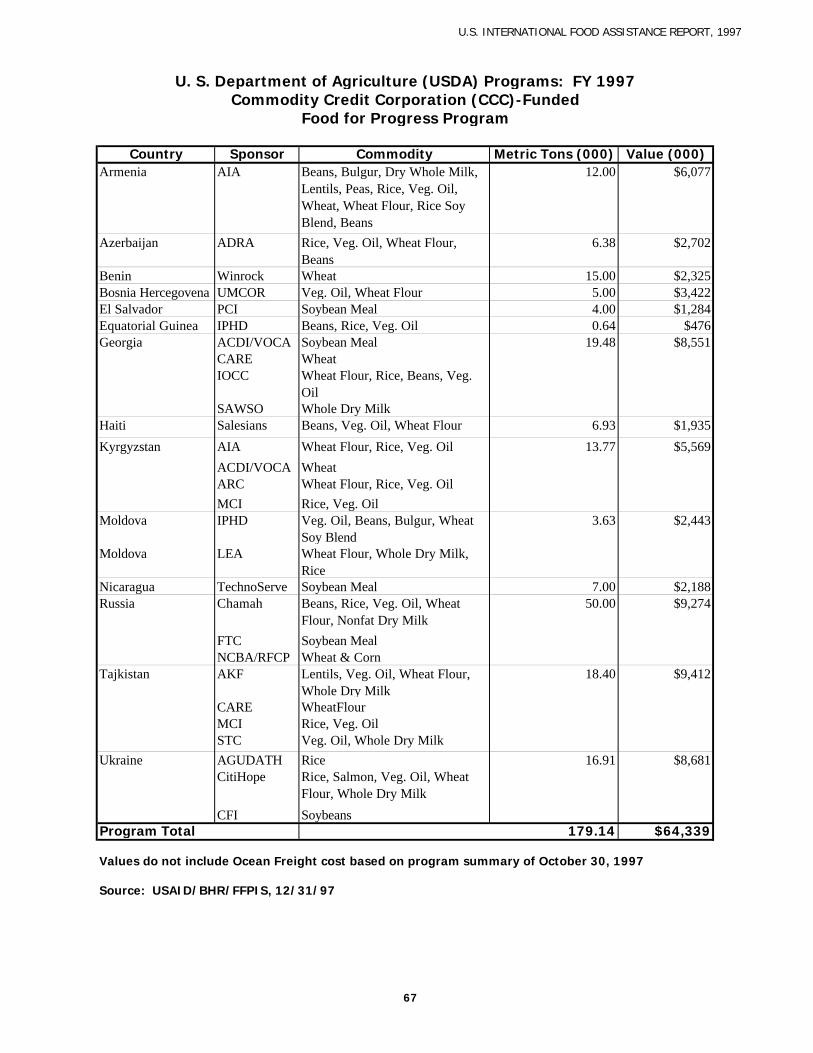
U.S. INTERNATIONAL FOOD ASSISTANCE REPORT, 1997
Country Sponsor Commodity Metric Tons (000) Value (000)Armenia AIA Beans, Bulgur, Dry Whole Milk,
Lentils, Peas, Rice, Veg. Oil, Wheat, Wheat Flour, Rice Soy Blend, Beans
12.00 $6,077
Azerbaijan ADRA Rice, Veg. Oil, Wheat Flour, Beans
6.38 $2,702
Benin Winrock Wheat 15.00 $2,325Bosnia Hercegovena UMCOR Veg. Oil, Wheat Flour 5.00 $3,422El Salvador PCI Soybean Meal 4.00 $1,284Equatorial Guinea IPHD Beans, Rice, Veg. Oil 0.64 $476Georgia ACDI/VOCA Soybean Meal 19.48 $8,551
CARE WheatIOCC Wheat Flour, Rice, Beans, Veg.
OilSAWSO Whole Dry Milk
Haiti Salesians Beans, Veg. Oil, Wheat Flour 6.93 $1,935
Kyrgyzstan AIA Wheat Flour, Rice, Veg. Oil 13.77 $5,569
ACDI/VOCA WheatARC Wheat Flour, Rice, Veg. Oil
MCI Rice, Veg. OilMoldova IPHD Veg. Oil, Beans, Bulgur, Wheat
Soy Blend3.63 $2,443
Moldova LEA Wheat Flour, Whole Dry Milk, Rice
Nicaragua TechnoServe Soybean Meal 7.00 $2,188Russia Chamah Beans, Rice, Veg. Oil, Wheat
Flour, Nonfat Dry Milk50.00 $9,274
FTC Soybean MealNCBA/RFCP Wheat & Corn
Tajkistan AKF Lentils, Veg. Oil, Wheat Flour, Whole Dry Milk
18.40 $9,412
CARE WheatFlourMCI Rice, Veg. OilSTC Veg. Oil, Whole Dry Milk
Ukraine AGUDATH Rice 16.91 $8,681CitiHope Rice, Salmon, Veg. Oil, Wheat
Flour, Whole Dry Milk
CFI SoybeansProgram Total 179.14 $64,339
Values do not include Ocean Freight cost based on program summary of October 30, 1997
Source: USAID/BHR/FFPIS, 12/31/97
Food for Progress Program
U. S. Department of Agriculture (USDA) Programs: FY 1997Commodity Credit Corporation (CCC)-Funded
67

U.S. INTERNATIONAL FOOD ASSISTANCE REPORT, 1997
RECIPIENTS TONNAGE VALUECOUNTRY SPONSOR COMMODITY (000) (MT) ($000)
Bangladesh CARE Wheat 651 120000 $28,800.00WFP Wheat, Veg. Oil 1869.7 12850 $5,219.30
Benin CRS Bulgur, Veg. Oil, Wheat Soy Blend, Cornmeal, Soy-Fort. Cornmeal
54.6 4680 $1,911.90
WFP Veg. Oil 57 200 $183.80Bolivia ADRA Lentils, Peas, Soy-fortified (SF) Bulgur, Wheat flour,
Corn Soya blend (CSB)73.8 13480 $6,193.90
CARITAS Wheat Flour, CSB, SF Bulgur, SF Cornmeal, Peas 115 17960 $8,522.20FHI Wheat Flour, CSB, SF Bulgur, SF Cornmeal, Peas,
Wheat Soy Blend31.4 7500 $3,417.20
PCI Wheat Flour, CSB, SF Bulgur, SF Cornmeal, Lentils, Peas
34.2 5050 $2,394.30
Burkina Faso CRS Beans, SF Bulgur, Veg. Oil 370.2 19780 $11,417.20WFP Veg. Oil 185 140 $142.70
Cape Verde ACDI Corn, Rice 7710 $3,197.60WFP Veg. Oil 70 200 $183.80
Chad AFRICARE Wheat Flour 3600 $1,342.80WFP Veg. Oil 152.6 300 $275.70
Cote D'Ivoire WFP Rice 210 4200 $2,293.20Dominican Republic WFP Wheat 100 1350 $391.50Egypt WFP Wheat Flour, Veg. Oil, Beans 14.4 6250 $2,649.80Eritrea AFRICARE Veg. Oil 800 $735.20Ethiopia CARE Veg. Oil, Wheat 50.2 7630 $4,423.10
CRS Veg. Oil, CSB, Wheat, Bulgur, Rice, Wheat Flour 143.3 19060 $10,577.50
FHI Veg. Oil, Wheat 9.7 3910 $2,292.30REST Veg. Oil, Wheat 45.8 8090 $3,796.70SCF Veg. Oil 370 $377.00WFP Veg. Oil, Wheat 930 2440 $965.40WVRD Veg. Oil, Wheat 196.2 5260 $2,472.80
Gambia CRS CSB, Veg. Oil 25.9 3710 $1,863.60Ghana ADRA Wheat, Rice, SF Bulgur, Wheat Soy Blend 35.3 16360 $4,168.50
CRS SF Sorghum Grits, Veg. Oil, CSB 221.4 15480 $5,036.10TECHSRV Wheat 16000 $3,840.00WFP Beans, Veg. Oil 113.3 1040 $798.60
Guatemala CARE Rice, Veg. Oil,CSB,Veg. Oil,Soybean Meal 162.5 11470 $5,177.90CRS Beans, Rice, Veg. Oil, Corn Soya Blend, Soybean
Meal18.2 5480 $2,492.50
FTC Beans, CSB, Rice, Veg. Oil, Soybean Meal 12 930 $475.90SHARE Beans, Rice, Veg. Oil, CSB, Soybean Meal 85 4840 $2,333.00WFP Veg. Oil, Corn w/bnt 75 5140 $1,388.00
Guinea AFRICARE Veg. Oil 640 $588.20OICI Veg. Oil 610 $566.80
Guinea Bissau AFRICARE Veg. Oil, Wheat Flour 1280 $770.60WFP Rice 36.1 2080 $1,135.70
Haiti ADRA Wheat Flour, SF Bulgur, Veg. Oil, Peas,Wheat Soy Blend
190.6 9790 $4,110.80
CARE Peas, SF Bulgur, Veg. Oil, Wheat Flour 416.5 9740 $3,959.90CRS Wheat Flour, Peas, SF Bulgur, Veg. Oil, Wheat Soy
Blend158.5 8580 $3,627.50
WFP Bulgur, Wheat, Beans, Veg. Oil 155.8 2510 $891.40Honduras CARE Benas, Corn Soya Blend, Rice, Veg. Oil, Wheat 90.4 7340 $1,918.50
WFP Corn, Wheat 17 7400 $1,803.10India CARE CSB, Veg. Oil 6605 153050 $69,524.30
CRS Bulgur, Veg. Oil, CSB 648.6 47770 $18,789.70WFP CSB, Veg. Oil 2230 14080 $5,397.20
Jordan WFP Wheat 12.5 10950 $2,628.00
TITLE II DEVELOPMENT PROGRAMS IN FY 1997
68
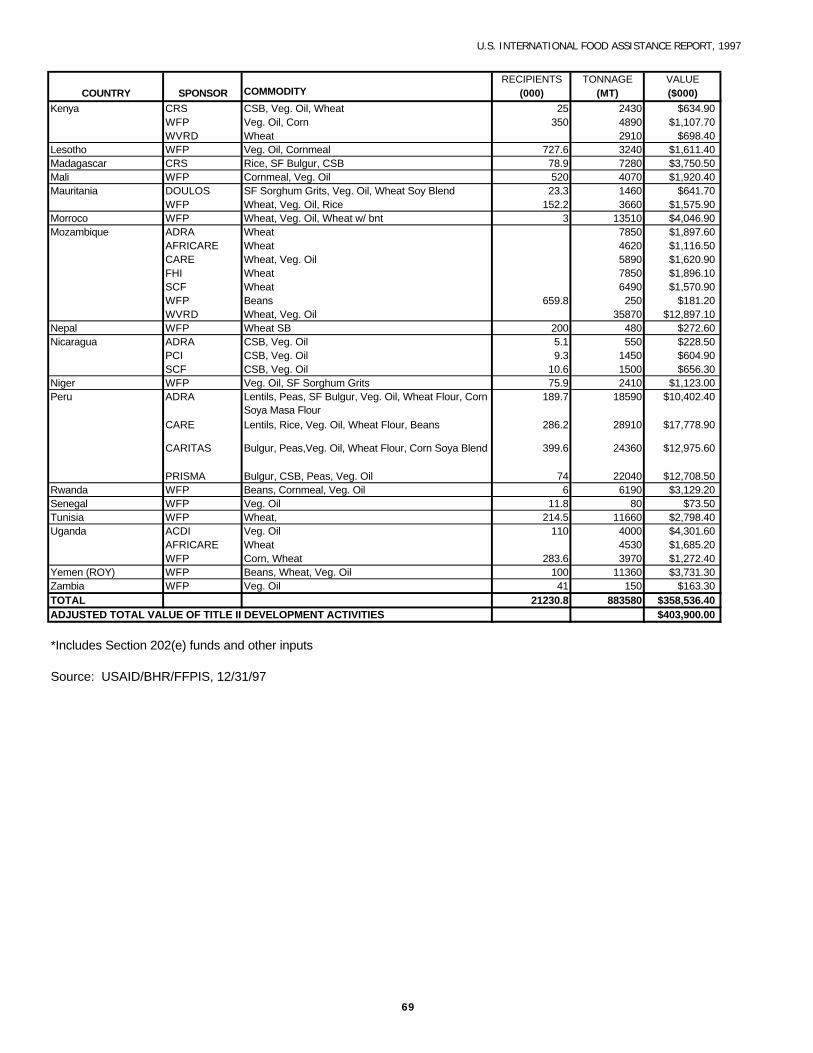
U.S. INTERNATIONAL FOOD ASSISTANCE REPORT, 1997
RECIPIENTS TONNAGE VALUECOUNTRY SPONSOR COMMODITY (000) (MT) ($000)
Kenya CRS CSB, Veg. Oil, Wheat 25 2430 $634.90WFP Veg. Oil, Corn 350 4890 $1,107.70WVRD Wheat 2910 $698.40
Lesotho WFP Veg. Oil, Cornmeal 727.6 3240 $1,611.40Madagascar CRS Rice, SF Bulgur, CSB 78.9 7280 $3,750.50Mali WFP Cornmeal, Veg. Oil 520 4070 $1,920.40Mauritania DOULOS SF Sorghum Grits, Veg. Oil, Wheat Soy Blend 23.3 1460 $641.70
WFP Wheat, Veg. Oil, Rice 152.2 3660 $1,575.90Morroco WFP Wheat, Veg. Oil, Wheat w/ bnt 3 13510 $4,046.90Mozambique ADRA Wheat 7850 $1,897.60
AFRICARE Wheat 4620 $1,116.50CARE Wheat, Veg. Oil 5890 $1,620.90FHI Wheat 7850 $1,896.10SCF Wheat 6490 $1,570.90WFP Beans 659.8 250 $181.20WVRD Wheat, Veg. Oil 35870 $12,897.10
Nepal WFP Wheat SB 200 480 $272.60Nicaragua ADRA CSB, Veg. Oil 5.1 550 $228.50
PCI CSB, Veg. Oil 9.3 1450 $604.90SCF CSB, Veg. Oil 10.6 1500 $656.30
Niger WFP Veg. Oil, SF Sorghum Grits 75.9 2410 $1,123.00Peru ADRA Lentils, Peas, SF Bulgur, Veg. Oil, Wheat Flour, Corn
Soya Masa Flour189.7 18590 $10,402.40
CARE Lentils, Rice, Veg. Oil, Wheat Flour, Beans 286.2 28910 $17,778.90
CARITAS Bulgur, Peas,Veg. Oil, Wheat Flour, Corn Soya Blend 399.6 24360 $12,975.60
PRISMA Bulgur, CSB, Peas, Veg. Oil 74 22040 $12,708.50Rwanda WFP Beans, Cornmeal, Veg. Oil 6 6190 $3,129.20Senegal WFP Veg. Oil 11.8 80 $73.50Tunisia WFP Wheat, 214.5 11660 $2,798.40Uganda ACDI Veg. Oil 110 4000 $4,301.60
AFRICARE Wheat 4530 $1,685.20WFP Corn, Wheat 283.6 3970 $1,272.40
Yemen (ROY) WFP Beans, Wheat, Veg. Oil 100 11360 $3,731.30Zambia WFP Veg. Oil 41 150 $163.30TOTAL 21230.8 883580 $358,536.40ADJUSTED TOTAL VALUE OF TITLE II DEVELOPMENT ACTIVITIES $403,900.00
*Includes Section 202(e) funds and other inputs
Source: USAID/BHR/FFPIS, 12/31/97
69
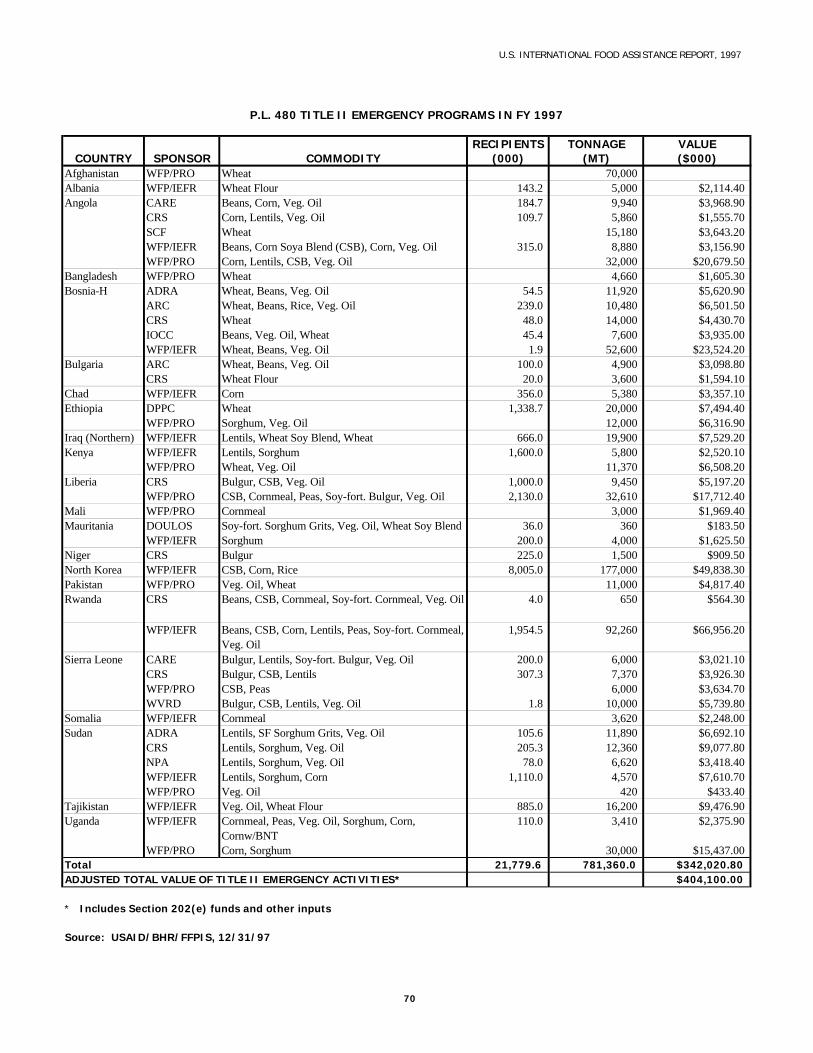
U.S. INTERNATIONAL FOOD ASSISTANCE REPORT, 1997
RECIPIENTS TONNAGE VALUECOUNTRY SPONSOR COMMODITY (000) (MT) ($000)
Afghanistan WFP/PRO Wheat 70,000Albania WFP/IEFR Wheat Flour 143.2 5,000 $2,114.40Angola CARE Beans, Corn, Veg. Oil 184.7 9,940 $3,968.90
CRS Corn, Lentils, Veg. Oil 109.7 5,860 $1,555.70SCF Wheat 15,180 $3,643.20WFP/IEFR Beans, Corn Soya Blend (CSB), Corn, Veg. Oil 315.0 8,880 $3,156.90WFP/PRO Corn, Lentils, CSB, Veg. Oil 32,000 $20,679.50
Bangladesh WFP/PRO Wheat 4,660 $1,605.30Bosnia-H ADRA Wheat, Beans, Veg. Oil 54.5 11,920 $5,620.90
ARC Wheat, Beans, Rice, Veg. Oil 239.0 10,480 $6,501.50CRS Wheat 48.0 14,000 $4,430.70IOCC Beans, Veg. Oil, Wheat 45.4 7,600 $3,935.00WFP/IEFR Wheat, Beans, Veg. Oil 1.9 52,600 $23,524.20
Bulgaria ARC Wheat, Beans, Veg. Oil 100.0 4,900 $3,098.80CRS Wheat Flour 20.0 3,600 $1,594.10
Chad WFP/IEFR Corn 356.0 5,380 $3,357.10Ethiopia DPPC Wheat 1,338.7 20,000 $7,494.40
WFP/PRO Sorghum, Veg. Oil 12,000 $6,316.90Iraq (Northern) WFP/IEFR Lentils, Wheat Soy Blend, Wheat 666.0 19,900 $7,529.20Kenya WFP/IEFR Lentils, Sorghum 1,600.0 5,800 $2,520.10
WFP/PRO Wheat, Veg. Oil 11,370 $6,508.20Liberia CRS Bulgur, CSB, Veg. Oil 1,000.0 9,450 $5,197.20
WFP/PRO CSB, Cornmeal, Peas, Soy-fort. Bulgur, Veg. Oil 2,130.0 32,610 $17,712.40Mali WFP/PRO Cornmeal 3,000 $1,969.40Mauritania DOULOS Soy-fort. Sorghum Grits, Veg. Oil, Wheat Soy Blend 36.0 360 $183.50
WFP/IEFR Sorghum 200.0 4,000 $1,625.50Niger CRS Bulgur 225.0 1,500 $909.50North Korea WFP/IEFR CSB, Corn, Rice 8,005.0 177,000 $49,838.30Pakistan WFP/PRO Veg. Oil, Wheat 11,000 $4,817.40Rwanda CRS Beans, CSB, Cornmeal, Soy-fort. Cornmeal, Veg. Oil 4.0 650 $564.30
WFP/IEFR Beans, CSB, Corn, Lentils, Peas, Soy-fort. Cornmeal, Veg. Oil
1,954.5 92,260 $66,956.20
Sierra Leone CARE Bulgur, Lentils, Soy-fort. Bulgur, Veg. Oil 200.0 6,000 $3,021.10CRS Bulgur, CSB, Lentils 307.3 7,370 $3,926.30WFP/PRO CSB, Peas 6,000 $3,634.70WVRD Bulgur, CSB, Lentils, Veg. Oil 1.8 10,000 $5,739.80
Somalia WFP/IEFR Cornmeal 3,620 $2,248.00Sudan ADRA Lentils, SF Sorghum Grits, Veg. Oil 105.6 11,890 $6,692.10
CRS Lentils, Sorghum, Veg. Oil 205.3 12,360 $9,077.80NPA Lentils, Sorghum, Veg. Oil 78.0 6,620 $3,418.40WFP/IEFR Lentils, Sorghum, Corn 1,110.0 4,570 $7,610.70WFP/PRO Veg. Oil 420 $433.40
Tajikistan WFP/IEFR Veg. Oil, Wheat Flour 885.0 16,200 $9,476.90Uganda WFP/IEFR Cornmeal, Peas, Veg. Oil, Sorghum, Corn,
Cornw/BNT110.0 3,410 $2,375.90
WFP/PRO Corn, Sorghum 30,000 $15,437.00Total 21,779.6 781,360.0 $342,020.80
$404,100.00
* Includes Section 202(e) funds and other inputs
Source: USAID/BHR/FFPIS, 12/31/97
P.L. 480 TITLE II EMERGENCY PROGRAMS IN FY 1997
ADJUSTED TOTAL VALUE OF TITLE II EMERGENCY ACTIVITIES*
70

P.L. 480 Title IIFY 1997 Congressional Mandates
U.S. INTERNATIONAL FOOD ASSISTANCE REPORT, 1997
Subminimum Minimum Monetization Value-added Bagged in US
FY 1997 1,550,000 2,025,000 15.0% 75.0% 50.0%Target
Final Status 1,039,846 1,947,137 39.6% 73.3% 48.0%Sept. 1997
Subminimum: Metric tons programmed for non-emergency program through PVOs/CDOs and the WFP.Metric Ton Grain Equivalent (MTGE) used to report against target.
Minimum: Total metric tons programmed under Title II. MTGE used to report against target.
Monetization: Percentage of non-emergency programs that are PVO Monetization programs.
Value-added: Percentage of non-emergency program food commodities that are processed, fortified, or bagged.
Bagged in U.S.: Percentage of bagged commodities that are whole grain to be bagged in the United States.
Source: USAID/BHR/FFP 10/15/97, updated 12/03/97
76

U.S. INTERNATIONAL FOOD ASSISTANCE REPORT, 1997
FY 1993 FY 1994 FY 1995 FY 1996 FY 1997Section 202(e) Levels $10,000,000 $13,458,009 $13,500,000 $25,000,000 $28,000,000 (a)Section 202 (e) Funds for ISGs $0 $2,750,000 $1,362,095 $1,934,829 $3,158,874 (b)DA Funds Used for ISGs $5,242,000 $2,250,000 $3,400,000 $2,747,154 $2,776,762ISG Levels $5,242,000 $5,000,000 $4,762,095 $4,681,983 $5,935,636 (c)FFP DA Levels $5,486,000 $3,325,000 $5,507,000 $4,157,000 $4,840,000
(DA funds support not only ISGs, but alsothe Institutional Support Contract, IMPACT, etc.)
a - The 1996 amended Farm Bill increased the Section 202(e) level from $13.5 million to $28 million.
b - $1,418,657 was obligated for new ISG requests, while $1,740,217 was obligated for on-going ISG mortgages.
c - New ISGs - $1,418,657. On-going ISG mortgages - $4,516,979.
Source: USAID/BHR/FFP 10/29/97; revised 12/12/97
USAID BUREAU FOR HUMANITARIAN RESPONSE/FOOD FOR PEACE OFFICESection 202(e) & ISG Funds Allocation
FY 1993 - 1997 (Development & Emergency Activities)
77

U.S. INTERNATIONAL FOOD ASSISTANCE REPORT, 1997
78
Title II Generic Performance Indicators for Development Activities
Having Title II partners and Missions measure and report on standardized indicators is critical forsuccessfully implementing the SO2 Strategic Plan. Therefore, partners using Title II food aid fordevelopment activities will be expected to carefully measure and report impacts, using, as far as possible,appropriate indicators from the list of Title II Generic Indicators. The use of these indicators will allowUSAID and its partners to measure the impact of similar interventions in a standardized way and to betterjudge which interventions are more effective in improving household food security. Use of these indicatorswill also enable USAID and the cooperating sponsors to consolidate data, and thus more effectively meetAgency and Congressional requirements to demonstrate the impacts of Title II activities on food securityobjectives.
The core generic indicators are focused on the major categories of Title II activities and are divided into twotypes: (1) impact indicators, which will be carefully measured at the midpoint and at the end of activities;and (2) annual monitoring indicators, which will be measured using routine records or with brief surveys. Allwill be measured against data collected in baseline surveys that will be carried out at the start of all Title IIactivities.
(1) Impact Indicators – The measurement of impact indicators will require cooperating sponsors tocarry out high quality baseline, midterm (where possible), and end-of-activity surveys. This willrequire use of appropriate sampling techniques and, where possible, include measurement of controlgroups in non-intervention areas. Due to the relatively high cost of their measurement, USAID willnot require that these indicators be measured every year. However, USAID will support selectedOperations Research Cases designed to better answer some generic impact questions. In these cases,partners may be asked to carry out more extensive measurements at the midpoint of a five-yearactivity. In addition, USAID Missions and relevant offices in USAID’s Global Bureau will beencouraged to invest resources to demonstrate the impact of food aid-supported interventions.
(2) Annual Monitoring Indicators – In years in which impact data are not collected, annual resultsreporting will consist of monitoring intermediate results and selected impact measures that can beroutinely collected. In addition, qualitative methods such as focus group discussions and keyinformant interviews may be used to capture process and contextual data. This annual data mayindicate trends, constraints, and external factors influencing activity performance. For example, inthe case of agricultural activities, annual yield data needs to be collected over the life of the activityto help distinguish effects of climatic variability from effects of the food-supported interventions.
The following table provides a summary of the Title II generic indicators. As much as possible, partners willbe encouraged to choose indicators from this list which are relevant to their programs.
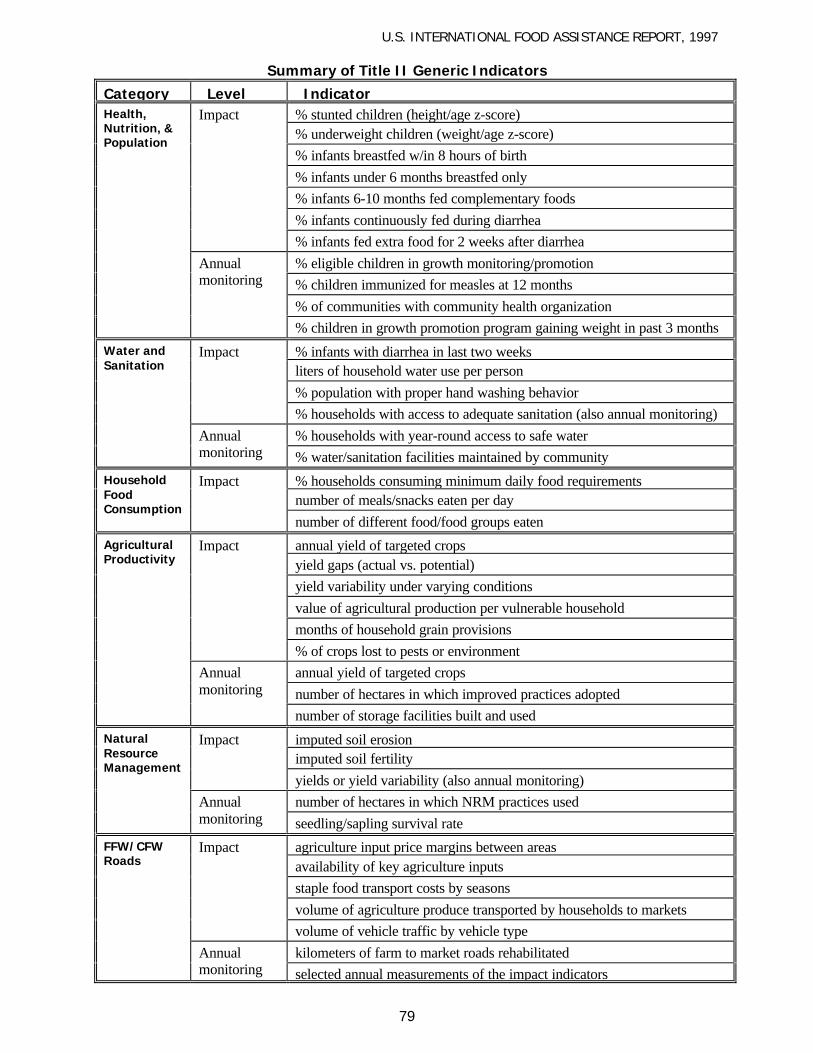
U.S. INTERNATIONAL FOOD ASSISTANCE REPORT, 1997
79
Summary of Title II Generic Indicators
Category Level Indicator% stunted children (height/age z-score)% underweight children (weight/age z-score)
% infants breastfed w/in 8 hours of birth
% infants under 6 months breastfed only
% infants 6-10 months fed complementary foods
% infants continuously fed during diarrhea
Impact
% infants fed extra food for 2 weeks after diarrhea
% eligible children in growth monitoring/promotion
% children immunized for measles at 12 months
% of communities with community health organization
Health,Nutrition, &Population
Annualmonitoring
% children in growth promotion program gaining weight in past 3 months(gender% infants with diarrhea in last two weeksliters of household water use per person
% population with proper hand washing behavior
Impact
% households with access to adequate sanitation (also annual monitoring)
% households with year-round access to safe water
Water andSanitation
Annualmonitoring % water/sanitation facilities maintained by community
% households consuming minimum daily food requirementsnumber of meals/snacks eaten per day
HouseholdFoodConsumption
Impact
number of different food/food groups eaten
Impact annual yield of targeted cropsyield gaps (actual vs. potential)
yield variability under varying conditions
value of agricultural production per vulnerable household
months of household grain provisions
% of crops lost to pests or environment
annual yield of targeted crops
number of hectares in which improved practices adopted
AgriculturalProductivity
Annualmonitoring
number of storage facilities built and used
imputed soil erosionimputed soil fertility
Impact
yields or yield variability (also annual monitoring)
number of hectares in which NRM practices used
NaturalResourceManagement
Annualmonitoring seedling/sapling survival rate
Impact agriculture input price margins between areasavailability of key agriculture inputs
staple food transport costs by seasons
volume of agriculture produce transported by households to markets
volume of vehicle traffic by vehicle type
kilometers of farm to market roads rehabilitated
FFW/CFWRoads
Annualmonitoring selected annual measurements of the impact indicators
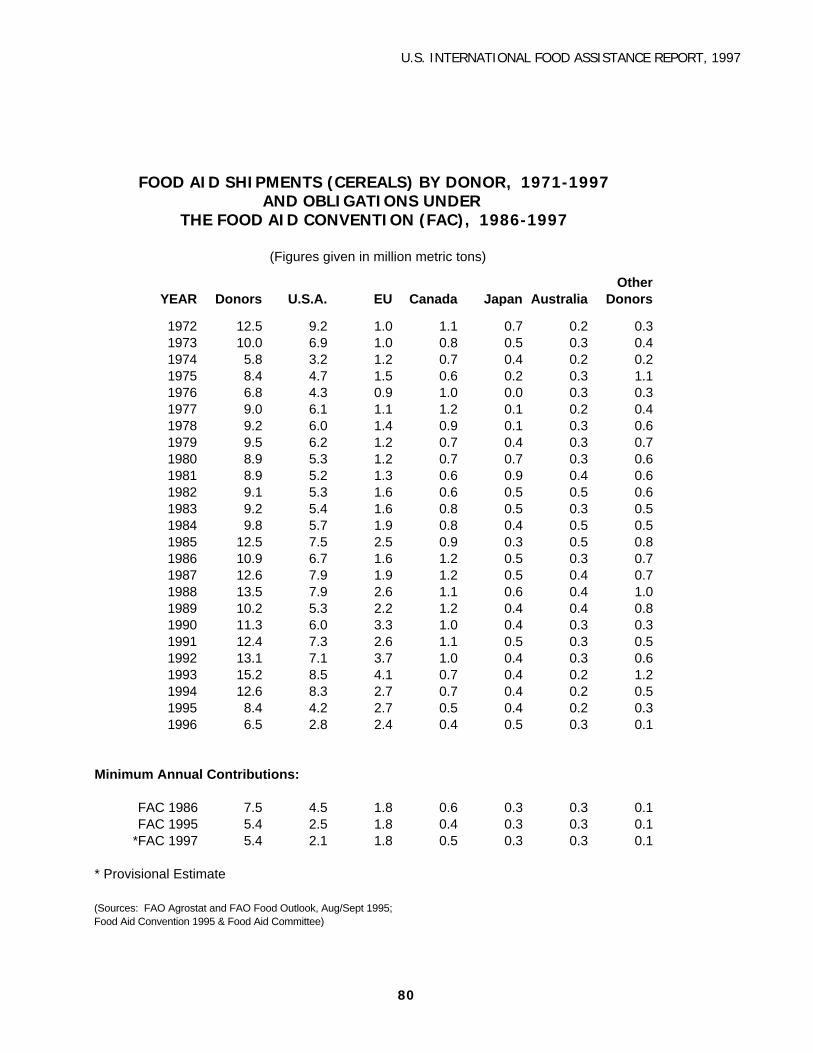
U.S. INTERNATIONAL FOOD ASSISTANCE REPORT, 1997
OtherYEAR Donors U.S.A. EU Canada Japan Australia Donors
1972 12.5 9.2 1.0 1.1 0.7 0.2 0.31973 10.0 6.9 1.0 0.8 0.5 0.3 0.41974 5.8 3.2 1.2 0.7 0.4 0.2 0.21975 8.4 4.7 1.5 0.6 0.2 0.3 1.11976 6.8 4.3 0.9 1.0 0.0 0.3 0.31977 9.0 6.1 1.1 1.2 0.1 0.2 0.41978 9.2 6.0 1.4 0.9 0.1 0.3 0.61979 9.5 6.2 1.2 0.7 0.4 0.3 0.71980 8.9 5.3 1.2 0.7 0.7 0.3 0.61981 8.9 5.2 1.3 0.6 0.9 0.4 0.61982 9.1 5.3 1.6 0.6 0.5 0.5 0.61983 9.2 5.4 1.6 0.8 0.5 0.3 0.51984 9.8 5.7 1.9 0.8 0.4 0.5 0.51985 12.5 7.5 2.5 0.9 0.3 0.5 0.81986 10.9 6.7 1.6 1.2 0.5 0.3 0.71987 12.6 7.9 1.9 1.2 0.5 0.4 0.71988 13.5 7.9 2.6 1.1 0.6 0.4 1.01989 10.2 5.3 2.2 1.2 0.4 0.4 0.81990 11.3 6.0 3.3 1.0 0.4 0.3 0.31991 12.4 7.3 2.6 1.1 0.5 0.3 0.51992 13.1 7.1 3.7 1.0 0.4 0.3 0.61993 15.2 8.5 4.1 0.7 0.4 0.2 1.21994 12.6 8.3 2.7 0.7 0.4 0.2 0.51995 8.4 4.2 2.7 0.5 0.4 0.2 0.31996 6.5 2.8 2.4 0.4 0.5 0.3 0.1
Minimum Annual Contributions:
FAC 1986 7.5 4.5 1.8 0.6 0.3 0.3 0.1FAC 1995 5.4 2.5 1.8 0.4 0.3 0.3 0.1
*FAC 1997 5.4 2.1 1.8 0.5 0.3 0.3 0.1
* Provisional Estimate
(Sources: FAO Agrostat and FAO Food Outlook, Aug/Sept 1995; Food Aid Convention 1995 & Food Aid Committee)
AND OBLIGATIONS UNDER FOOD AID SHIPMENTS (CEREALS) BY DONOR, 1971-1997
THE FOOD AID CONVENTION (FAC), 1986-1997
(Figures given in million metric tons)
80