us investment in africa emphasis on sub-saharan africa anthonie lombard phd mba
TRANSCRIPT

US Investment in AfricaEmphasis on Sub-Saharan Africa
Anthonie Lombard PhD MBA

All of us share a common vision for the future of Africa. We look to the day when prosperity for Africa is built through trade and markets.
— President George W. Bush to delegates at the African Growth and Opportunity Forum in Mauritius, January 15, 2003

Advantages
•Manufacturing in Africa becomes more attractive due to duty benefits;• Sourcing finished products also attractive• Selling to firms producing for the US• More U.S. government support available for investment or exports.
Product Category Examples
•Footwear •Machinery• Apparel• Vehicles• Fruits and nuts• Prepared vegetables• Leather products• Cut flowers• Prepared seafood• etc.
The African Growth Opportunities ACT (AGOA)
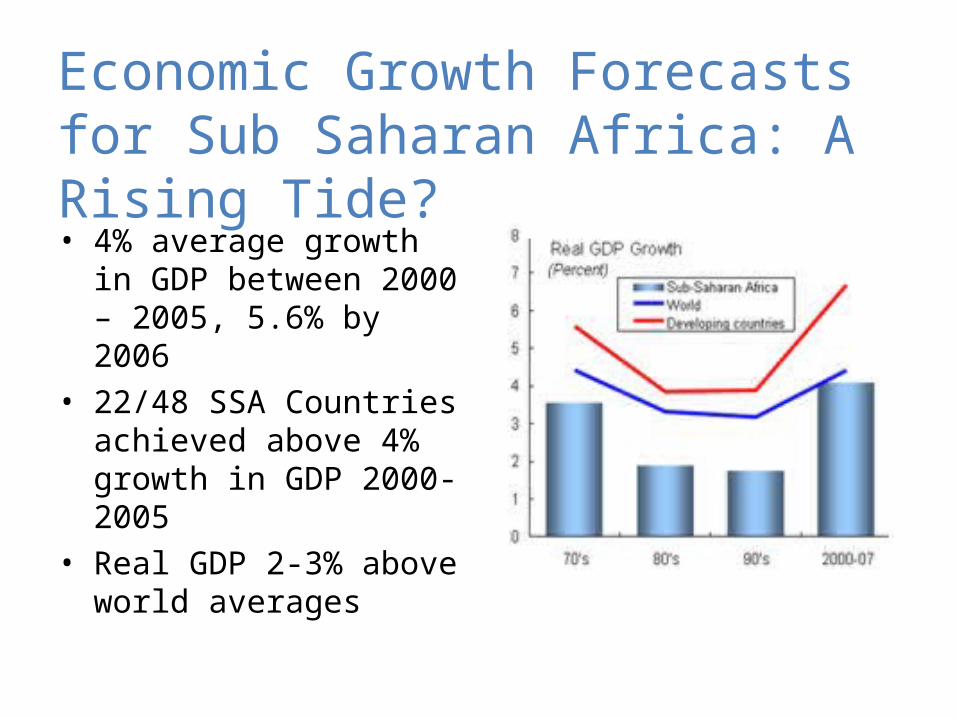
Economic Growth Forecasts for Sub Saharan Africa: A Rising Tide?• 4% average growth in GDP
between 2000 – 2005, 5.6% by 2006
• 22/48 SSA Countries achieved above 4% growth in GDP 2000-2005
• Real GDP 2-3% above world averages

Economic Growth Forecasts for Sub Saharan Africa: A Base for
Growth?• Requires 25% of GDP in Investment vs actuals
of 19%• Foreign Direct Investment at 25% in 1970 vs
5% in 2004• Per capita GDP
– $575 2005– $590 1980

US Trade with Sub Saharan Africa (SSA)


U.S. Investment in Sub-Saharan Africa
•At year-end 2006, the stock of U.S. direct investment in sub-Saharan Africa was $14 billion, or less than 1% of the $2,380 billion in total U.S. direct investment abroad.
• U.S. capital outflows to Africa (including North Africa) doubled from 2005 to 2006, from about $1 billion to $2 billion, though they are still below the 2003 peak of $2.7 billion.
• U.S. investment in Africa is heavily toward natural resources: 47% of total U.S. investment in Africa is in the mining sector (including petroleum)

US Trade and Investment in AfricaA New Dawn?
• What should the focus areas be?• What is the role of technology transfer?• What should the role of South Africa be?

ENERGY FACTS• World population without electricity: 1.7 billion • Africa's proportion: one-third • Per capita electricity consumption Africa (2004): 494.9 kWh • Per capita Canada (2004): 15,744 kWh

Global Macro Trend Positioning
Impact Lifecycle
Rate
of C
hang
e
ClimateChange
India
Energy Supply /Demand China Food Safety
Water
Sustainability
InformationTechnology
Energy $ Volatility

Water Shortage Worldwide Water Stress Indicator
Already about one-third of the world's population lives in countries suffering from moderate-to-high water stress
Source: WaterGap 2.0 – December 1999.


15
Delivering on the Value Promise Through Innovation – A Generic Model
Fuzzy
Fron
t End
Fuzzy
Fron
t End
Technology Requisition
ExistingApplication1
ExistingApplication2
NewApplication 1
Value Creation
Business Units
Value Delivery

The Role of South Africa

AGOA and Trade reference
http://fpc.state.gov/documents/organization/112461.pdf
Thank you!