us lodging industry overview - hotelnewsnow.com review ... data is for upper tier hotels only (lux...
TRANSCRIPT

1
US Lodging Industry Overview
Jan D. Freitag
Senior Vice President

2
www.hotelnewsnow.com Click on “Hotel Data Presentations”

3
Agenda • Total US Review
• Chain Scale Review
• Segmentation Review – Group & Transient
• 2012 / 2013 Forecast
• Channel Study Highlights

4
Total US Review

5
Supply / Demand Imbalance Drove Last 12 Months
% Change
• Room Supply* 1.8 bn 0.4% • Room Demand* 1.06 bn 4.4% • Occupancy 60.5% 4.0% • A.D.R. $102 3.9% • RevPAR $62 8.0% • Room Revenue* $109 bn 8.4%
12 Months Ending March 2012, Total US Results * All Time High

6
Q1 2012: Highest Demand - EVER
(245 Million Rooms Sold)

7
-8
-4
0
4
8
1990 2000 2010
Supply Demand
Demand Growth Expected To Revert To Mean. Supply Not An Issue
-6.9%
-0.9%
- 4.7%
*Total US, Supply & Demand % Change, 12 MMA 1/90 – 3/12
8.0%
4.4%
8
-10
-5
0
5
1990 2000 2010
Demand ADR
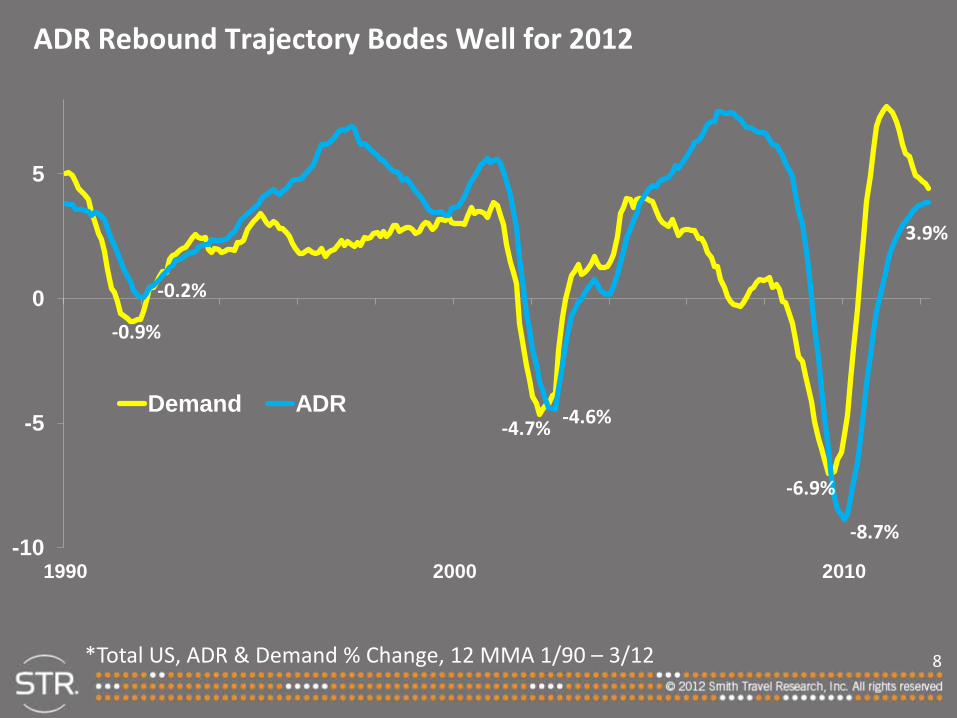
ADR Rebound Trajectory Bodes Well for 2012
-6.9%
-4.7%
-0.9%
-4.6%
-0.2%
-8.7%
3.9%
*Total US, ADR & Demand % Change, 12 MMA 1/90 – 3/12

9
ADR Discounting at Twice The Speed of ADR Increases
95
100
105
110
2008 2009 2010 2011
*Total US, ADR $, 12 MMA 2007 - 2011
Apr ‘10 $97
Sept ‘08 $108
Dec ‘11 $102
+4.6%
-10%
19 Months
19 Months

10
3.1
2.6
3.9
2.9
4.1
3.7 4.0
3.5
4.1 4.0 4.4
3.5 3.9 4.0 3.9
Jan-11 Jul-11 Jan-12
* Total US, ADR $ % Change, by Month, 1/11 – 3/12
ADRs Are Growing (But Comps Get More Difficult)
11
Do You Really Know Your Competitors?
National Nameback %: ??%
* % of hotels that use hotels in their compset which have named them Source: STR Analytics

12
Do You Really Know Your Competitors?
National Nameback %: 45%
* % of hotels that use hotels in their compset which have named them Source: STR Analytics

13
Chain Scale Review

14
Q1: Strong Demand Growth, Supply Not An Issue
-0.9
0.2
1.5
3.2 3.7
4.9
Luxury Upper Upscale Upscale
Supply
Demand
*Supply / Demand % Change, by Scale, Q1 ‘12
15
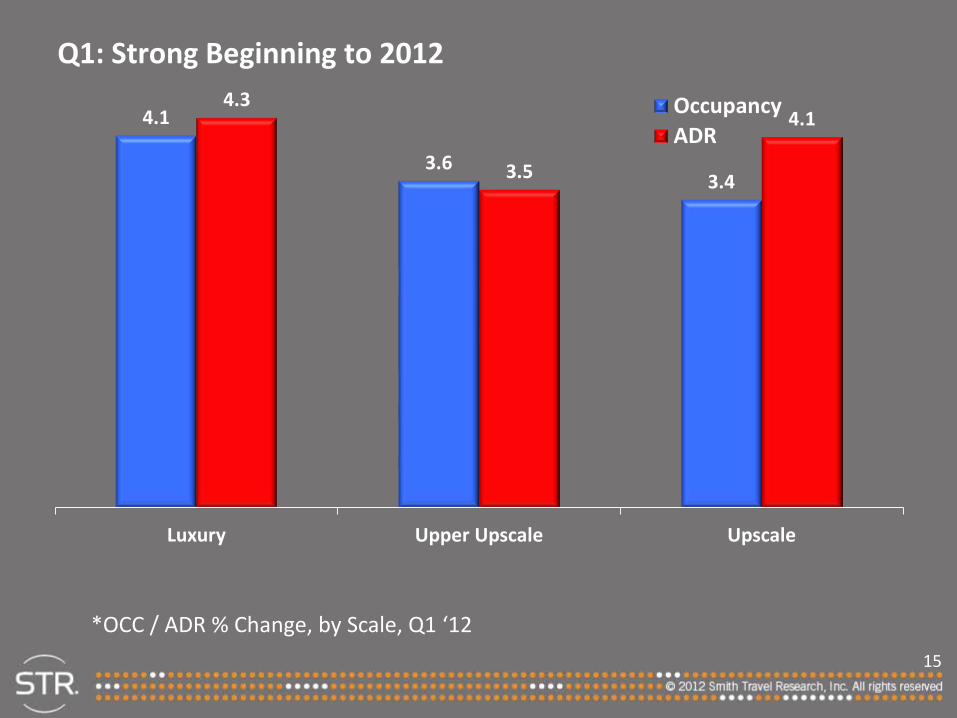
Q1: Strong Beginning to 2012
4.1
3.6 3.4
4.3
3.5
4.1
Luxury Upper Upscale Upscale
Occupancy ADR
*OCC / ADR % Change, by Scale, Q1 ‘12

16
Upper End Sells 7 out of 10 Rooms Every Night
72.5
70.5 69.6
71.7 69.9 70.1
Luxury Upper Upscale Upscale
2007 12 Months end 3/12
*Absolute OCC %, by Scale, 2007 & 12 Months ending 3/12

17
ADR Growth Is Strong – But Not Strong Enough (...yet)
$293
$159
$121
$264
$149
$113
Luxury Upper Upscale Upscale
2007 12 Months end 3/12
*Absolute ADR $, by Scale, 2007 & 12 Months ending 3/12

18
Segmentation Review

19
Transient Demand Breaks Records, But....
10
12.5
15
17.5
20
Jan Feb Mar Apr May Jun Jul Aug Sep Oct Nov Dec
2007 2011 2012
*Transient Demand in Millions of Rooms; 2007, 2011, 2012 Data is for upper tier hotels only (LUX & UU chains, & Upper Tier independents)
Mill
ions

20
… Transient ADR Still Lags 2007 Results
$140
$150
$160
$170
$180
$190
Jan Feb Mar Apr May Jun Jul Aug Sep Oct Nov Dec
2007 2011 2012
*Transient ADR $, 2007, 2011, 2012 Data is for upper tier hotels only (LUX & UU chains, & Upper Tier independents)

21
5.3
4.6
6.4
5.4 5.9
5.1 5.0
3.7
4.7 4.3
4.6
3.7 3.8 3.4
4.0
Jan-11 Apr-11 Jul-11 Oct-11 Jan-12
*Transient ADR % by Month, 1/11 – 3/12 Data is for upper tier hotels only (LUX & UU chains, & Upper Tier independents)
We Expect Transient ADR Growth To Continue

22
Group Demand Has Not Changed Over Time, But…
4
6
8
10
12
Jan Feb Mar Apr May Jun Jul Aug Sep Oct Nov Dec
Mill
ions
2007 2011 2012
*Group Demand in Millions of Rooms, 2007, 2011, 2012 Data is for upper tier hotels only (LUX & UU chains, & Upper Tier independents)

23
… Group ADRs Still Depressed (& Could Dampen Future Absolute ADRs)
$130
$140
$150
$160
$170
Jan Feb Mar Apr May Jun Jul Aug Sep Oct Nov Dec
2008 2011 2012
*Group ADR $, 2008, 2011, 2012 Data is for upper tier hotels only (LUX & UU chains, & Upper Tier independents)
24
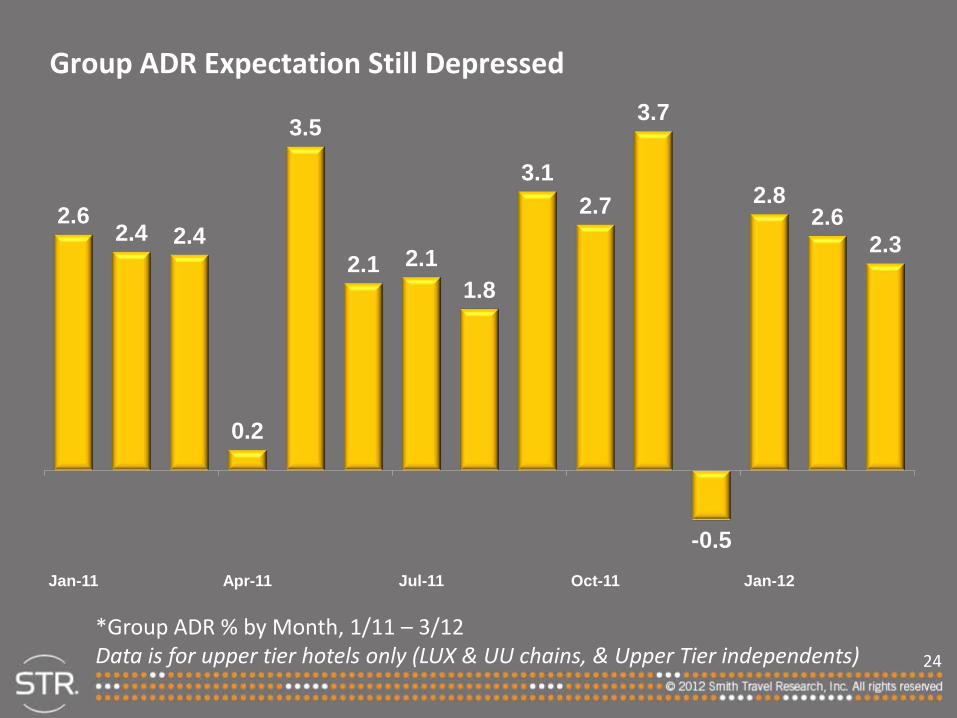
2.6 2.4 2.4
0.2
3.5
2.1 2.1 1.8
3.1 2.7
3.7
-0.5
2.8 2.6
2.3
Jan-11 Apr-11 Jul-11 Oct-11 Jan-12
*Group ADR % by Month, 1/11 – 3/12 Data is for upper tier hotels only (LUX & UU chains, & Upper Tier independents)
Group ADR Expectation Still Depressed

25
2012 / 2013 Forecast

26
Rooms Pipeline Still Not An Issue in 2012
Phase March 2012 March 2011 Dec 2007
In Construction 60 50 211 “Planned Pipeline” 233 274 204
Active Pipeline 293 324 415
*Total US Pipeline, in ‘000s of rooms, by Phase by Year Planned Pipeline includes projects in Final Planning and Planning phases Source: STR / McGraw-Hill Construction Dodge

27
U/C Pipeline By Selected Markets
Market Projects Rooms
Chicago 6 1,300
Miami 9 1,200
Nashville 4 1,400
NYC 50 7,600
Orlando 15 3,700
Washington, DC 12 2,700

28
Total United States Forecast 2012 / 2013 Key Performance Indicator % Change 2012
Forecast 2013
Forecast
Supply 0.5% 1.1%
Demand 2.0% 1.8%
Occupancy 1.5% 0.7%
ADR 4.0% 4.6%
RevPAR 5.5% 5.4%

29
Total United States Chain Scale Key Performance Indicator Outlook 2012F by Chain Scale
Chain Scale Occupancy
(% chg) ADR
(% chg) RevPAR (%chg)
Luxury +2.6% +5.1% +7.9%
Upper Upscale +1.5% +4.2% +5.7%
Upscale +2.3% +4.6% +7.1%
Total United States 1.5% 4.0% 5.5%

30
Channel Study Highlights

31
OTA Revenue: 8% Of Revenue, 88% Of Our Conversation
3.2
7.9 8.0 4.7
21.7
45.5
3.6
8.7 8.0 5.2
22.2
47.7
4.2
10.1 9.0 6.2
22.6
52.1
OTA Brand.com CRS/Voice GDS Prop Direct/Other Total US
2009 2010 2011
*Total rooms revenue in billions $, by channel, June YTD 2009 - 2011

32
Wide ADR Variance Between OTA and GDS Channel
75
109
128 127
89
99
73
110
127 126
87
97
74
115
127 128
89
101
OTA Brand.com CRS/Voice GDS Prop Direct/Other Total US
2009 2010 2011
*ADR $, by channel, June YTD 2009 - 2011

33
Wide ADR Variance By OTA Business Model
97
78
55
90
70
54
97
75
56
Retail Merchant Opaque
2009 2010 2011
*ADR $, by OTA channel, June YTD 2009 - 2011

34