u.s. management of first relapse follicular lymphoma · post-treatment pet predicts pfs score ≥4...
TRANSCRIPT

U.S.ManagementofFirstRelapseFollicularLymphoma
BruceD.Cheson,M.D.GeorgetownUniversityHospital
LombardiComprehensiveCancerCenterWashington,D.C.,USA

FLASHAnalysisDataset
• Thecurrentanalysesincluded13studies:– Totalof26arms,4,177paNents– Totalof3,830paNentswithnon-missing30mCRstatus
– 9studies(N=2,845)withatleastonearmwithRituximaband4studies(N=985)withnoRituximab
– 8inducNontrials(N=2,206)and5maintenancetrials(N=1,624)
2Shi et al, JCO e-pub on line 2017

CorrelaNonBetweenCR30andPFS
Shi et al, JCO e-pub on line 2017

OS from a risk-defining event after diagnosis in FL patients who received R-CHOP
chemotherapy in the National LymphoCare Study group.
Carla Casulo et al. JCO 2015;33:2516-2522

Progression of disease within 24 months (POD24) is an accurate predictor of poor overall survival (OS).
Vindi Jurinovic et al. Blood 2016;128:1112-1120

EFS12inFL
Maureretal,AmJHematol91:1096,2016

NoEFS12inFL
Maureretal,AmJHematol91:1096,2016

Post-treatment PET predicts PFS Score ≥4
HR 3.9 (95% CI 2.5-5.9, p<.0001) Median PFS: 16.9 (10.8-31.4) vs. 74.0 mo (54.7-NR)
63%
23%
Trotman et al, Lancet Haematol, 2014
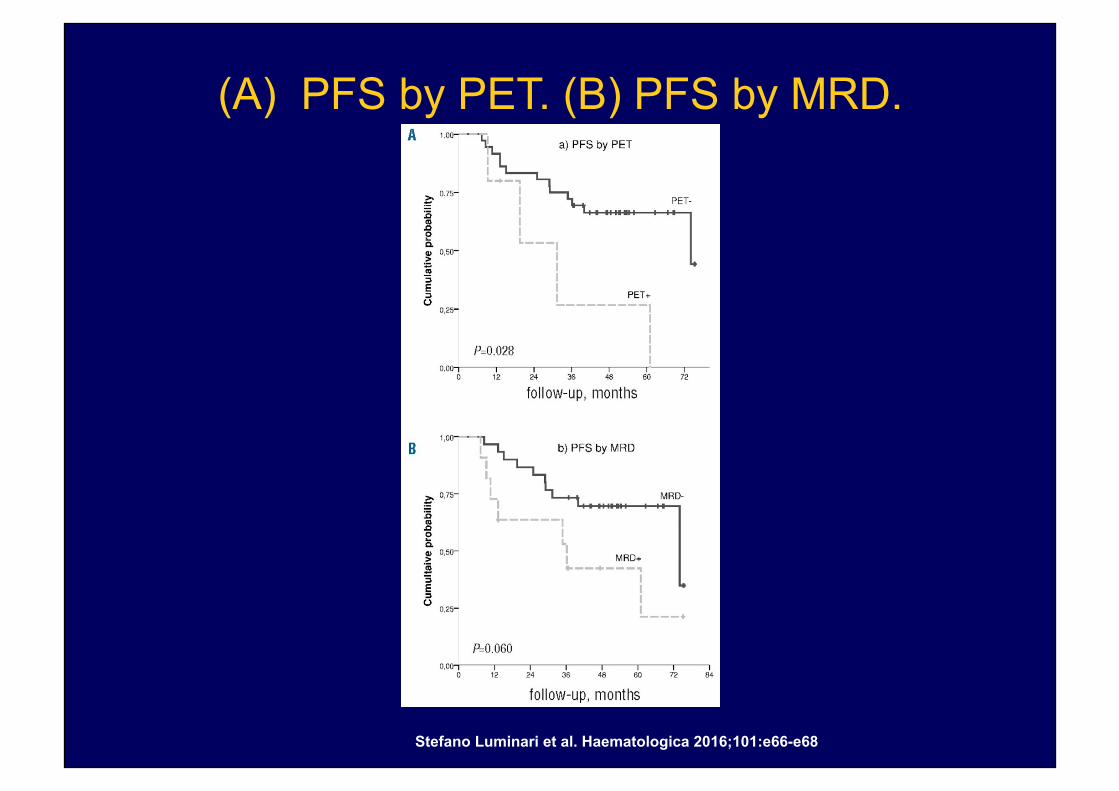
(A) PFS by PET. (B) PFS by MRD.
Stefano Luminari et al. Haematologica 2016;101:e66-e68
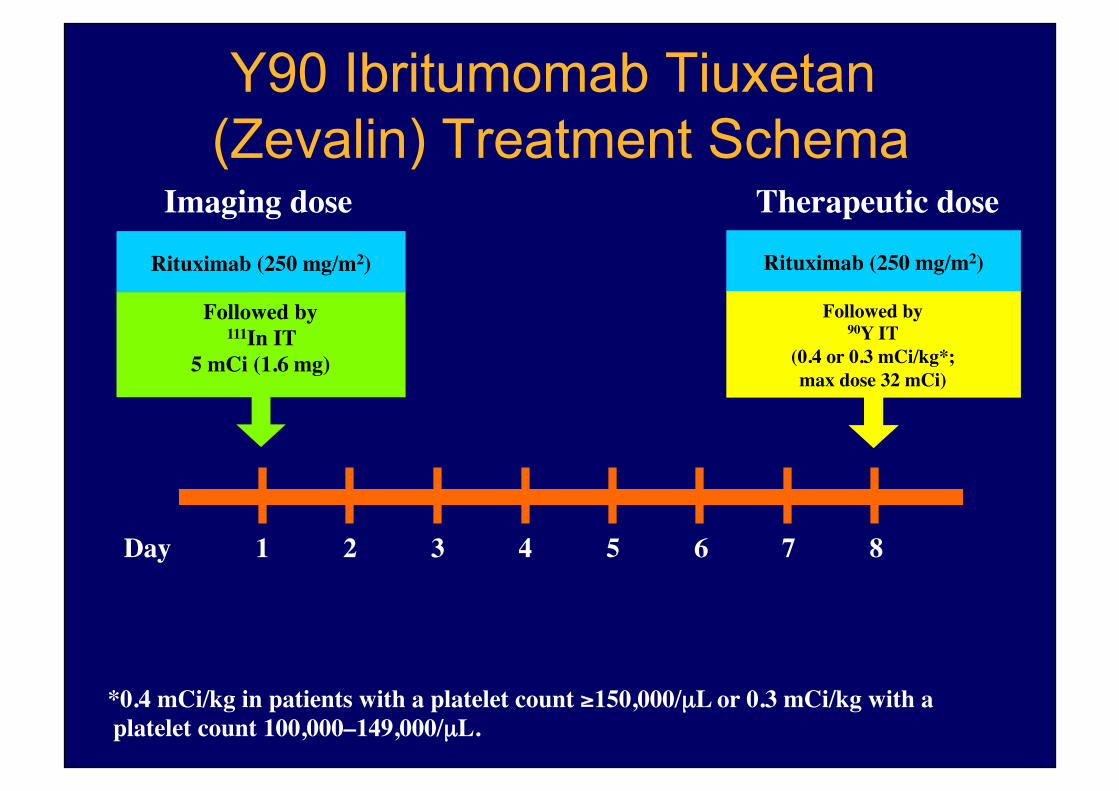
Y90 Ibritumomab Tiuxetan (Zevalin) Treatment Schema
Rituximab (250 mg/m2)
Followed by111In IT
5 mCi (1.6 mg)
Rituximab (250 mg/m2)
Followed by90Y IT
(0.4 or 0.3 mCi/kg*;�max dose 32 mCi)
Imaging dose Therapeutic dose
1 2 3 4 5 6 7Day 8
*0.4 mCi/kg in patients with a platelet count ≥150,000/µL or 0.3 mCi/kg with a platelet count 100,000–149,000/µL.
Patients (%)
0
20
40
60
80
100
Phase 1-2trial
Rituxan-refractory
trial
Phase II trial Phase IIIcomparative
trial
PR rate CR/CRu rate
73 74 83 80
22
51
59
15
36
47
46
34
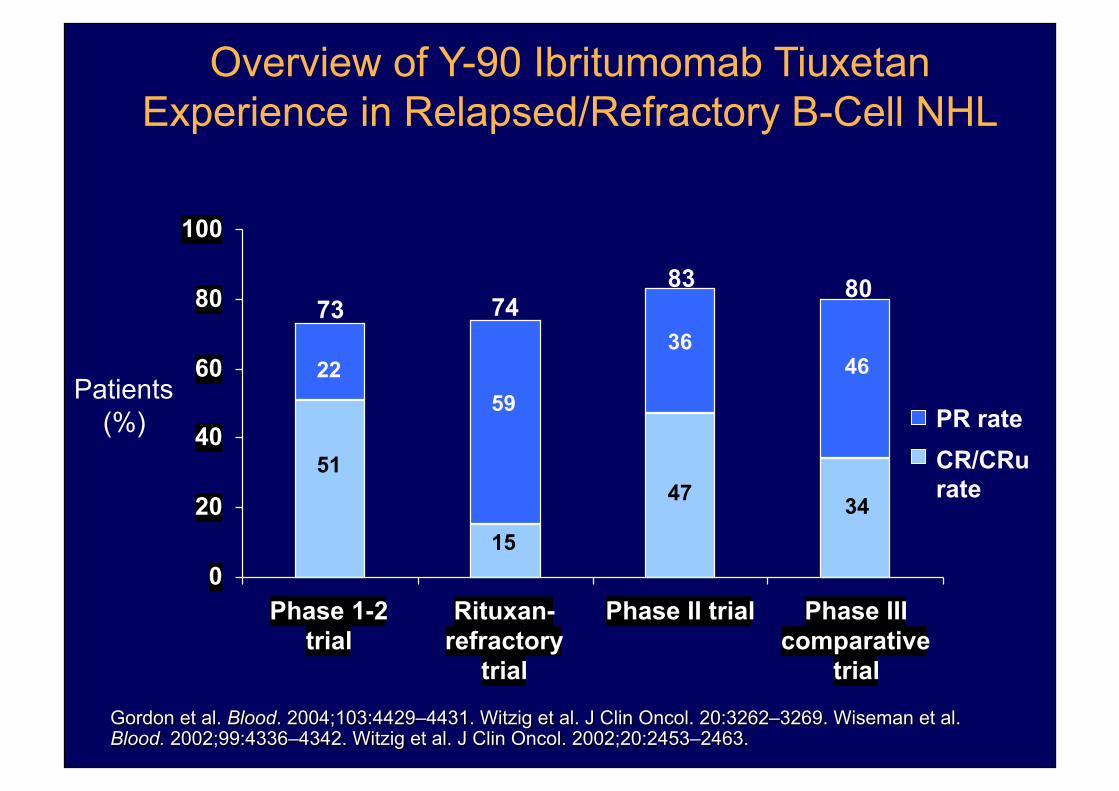
Gordon et al. Blood. 2004;103:4429–4431. Witzig et al. J Clin Oncol. 20:3262–3269. Wiseman et al. Blood. 2002;99:4336–4342. Witzig et al. J Clin Oncol. 2002;20:2453–2463.
Overview of Y-90 Ibritumomab Tiuxetan Experience in Relapsed/Refractory B-Cell NHL

Long-termresponsesinpaNentswithrecurringorrefractoryB-cellNHLtreatedwithy\rium90
ibritumomabNuxetan
Witzigetal,Cancer109,I1804-,2007

Phase II Study 101-09: Idelalisib Monotherapy in Refractory iNHL
§ Key eligibility criteria: – Previously treated iNHL
(FL, MZL, SLL, WM)
§ Refractory to BOTH rituximab and an alkylating agent
– Defined as less than PR or progressive disease (PD) within 6 months
– Documented radiologically
§ Primary endpoint: – ORR
§ Secondary endpoints: – DOR
– PFS
– OS
– Time to response
– Safety
– Quality of life
Idelalisib 150 mg BID
Therapy maintained until
progression, toxicity, or death
Enrolled April 2011 to October 2012
Long
-term
follo
w-u
p
Gopal A, et al. N Engl J Med. 2014;370:1008-1018.
Single-arm study (N = 125)

Idelalisib Monotherapy in Refractory iNHL (Phase II): Responses
Characteristic Patients, n (%) (N = 125)
ORR, n (%) CR PR Minor response* SD PD Not evaluated
71 (57) 7 (6)
63 (50) 1 (1)
42 (34) 10 (8) 2 (2)
Time to response, mos (n = 71) Median (interquartile range)
1.9 (1.8-3.7)
Gopal A, et al. N Engl J Med. 2014;370:1008-1018.
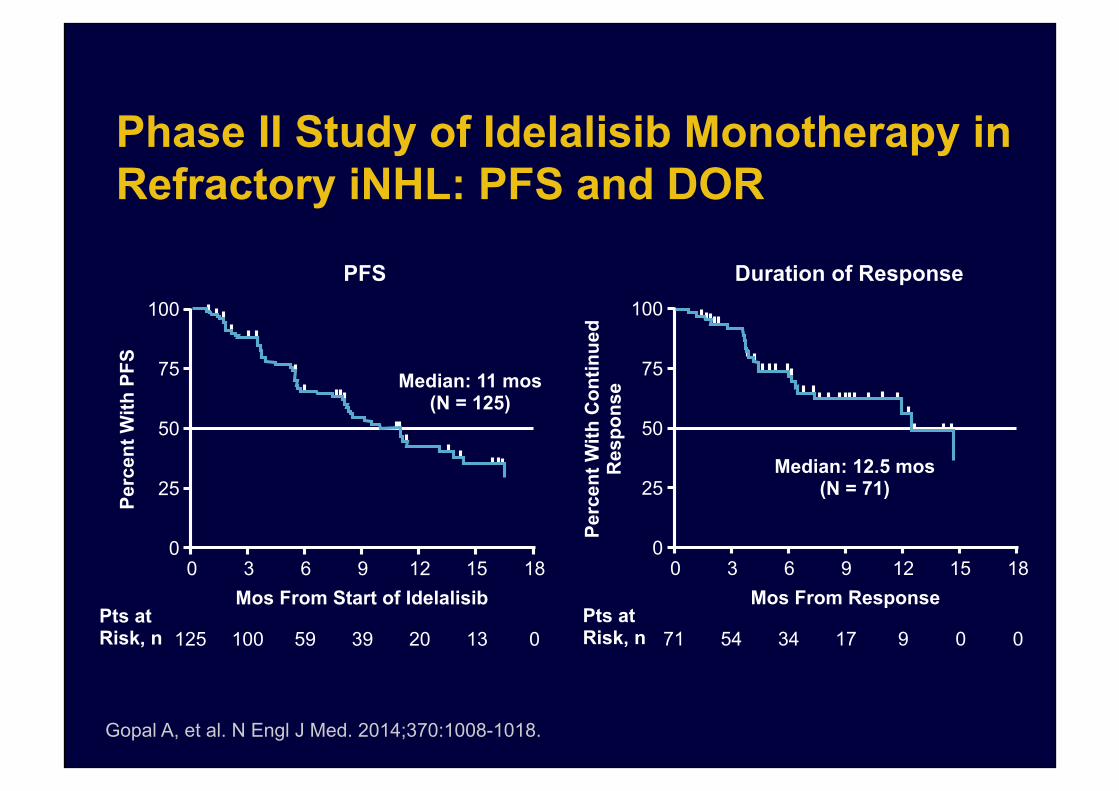
Phase II Study of Idelalisib Monotherapy in Refractory iNHL: PFS and DOR
PFS Duration of Response
Gopal A, et al. N Engl J Med. 2014;370:1008-1018.
100
75
50
25
0
Perc
ent W
ith P
FS
Median: 11 mos (N = 125)
Mos From Start of Idelalisib 18 0 3 6 9 12 15
Pts at Risk, n 125 100 59 39 20 13 0
100
75
50
25
0
Perc
ent W
ith C
ontin
ued
Res
pons
e
Median: 12.5 mos (N = 71)
Mos From Response 18 0 3 6 9 12 15
Pts at Risk, n 71 54 34 17 9 0 0

AE, n (%) Any Grade Grade ≥3
Diarrhea 54 (43) 16 (13) Fatigue 37 (30) 2 (2) Nausea 37 (30) 2 (2)
Transaminases, n (%) Any Grade Grade 3/4
ALT elevated 59 (47%) 16 (13%)
AST elevated 44 (35%) 10 (8%)
Idelalisib Monotherapy in Refractory iNHL (Phase II): Adverse Events
Gopal A, et al. N Engl J Med. 2014;370:1008-1018.
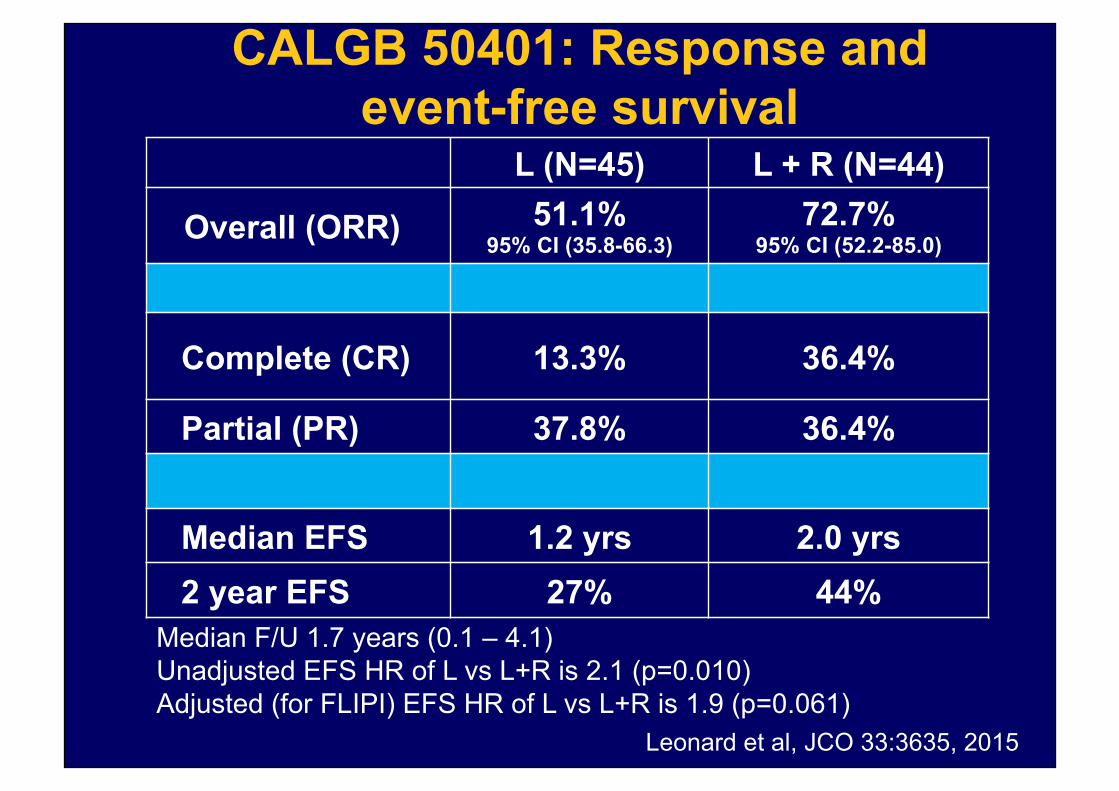
L (N=45) L + R (N=44)
Overall (ORR) 51.1% 95% CI (35.8-66.3)
72.7% 95% CI (52.2-85.0)
Complete (CR) 13.3% 36.4%
Partial (PR) 37.8% 36.4%
Median EFS 1.2 yrs 2.0 yrs 2 year EFS 27% 44%
CALGB 50401: Response and event-free survival
Median F/U 1.7 years (0.1 – 4.1) Unadjusted EFS HR of L vs L+R is 2.1 (p=0.010) Adjusted (for FLIPI) EFS HR of L vs L+R is 1.9 (p=0.061)
Leonard et al, JCO 33:3635, 2015

Obinutuzumab plus bendamustine followed by obinutuzumab maintenance prolongs overall survival compared with bendamustine alone in patients with
rituximab-refractory indolent non-Hodgkin lymphoma: updated results of the GADOLIN study
Bruce D Cheson,1 Marek Trněný,2 Kamal Bouabdallah,3 Greg Dueck,4 John Gribben,5 Pieternella J Lugtenburg,6 Oliver Press,7 Gilles Salles,8 Günter Fingerle-Rowson,9
Federico Mattiello,9 Elisabeth Wassner-Fritsch,9 Laurie H Sehn10
1Georgetown University Hospital, Washington, DC, USA; 2Charles University, Prague, Czech Republic; 3University Hospital of Bordeaux, CHU Haut-Leveque, Bordeaux, France; 4British Columbia Cancer Agency, Kelowna, BC, Canada; 5Queen Mary University of London, London, United Kingdom; 6Erasmus MC Cancer Institute, Rotterdam, The Netherlands; 7Fred Hutchinson Cancer Research Center, Seattle, WA, USA; 8Hospices Civils de Lyon, Université Claude Bernard Lyon-1, Lyon, France; 9F. Hoffmann-La Roche Ltd, Basel, Switzerland; 10British Columbia
Cancer Agency and the University of British Columbia, Vancouver, BC, Canada
ASH 2016, abstr 615

20
Study design
*Patients in the G-B arm without evidence of progression following induction received G maintenance
• Rituximab-refractory definition: Failure to respond to, or progression during any prior rituximab-containing regimen (monotherapy or combined with chemotherapy), or progression within 6 months of the last rituximab dose, in the induction or maintenance settings
• Endpoints considered in current analysis: PFS (INV), OS, TTNT, safety
Open-label, multicenter, randomized, Phase III study in rituximab-refractory iNHL patients
CD20-positive rituximab-refractory iNHL Patients were aged ≥18 yrs with documented rituximab-
refractory iNHL and an ECOG performance status of 0–2
Target enrolment: 410
G G 1000mg IV every 2 months
for 2 years
G-B B 90mg/m2 IV (D1, D2, C1–C6) and G 1000mg IV (D1, D8, D15,
C1; D1, C2–6), q28 days
B B 120mg/m2 IV (D1, D2, C1–C6),
q28 days
Induction
Maintenance*
Data cut-off: 1 April 2016
Randomized 1:1
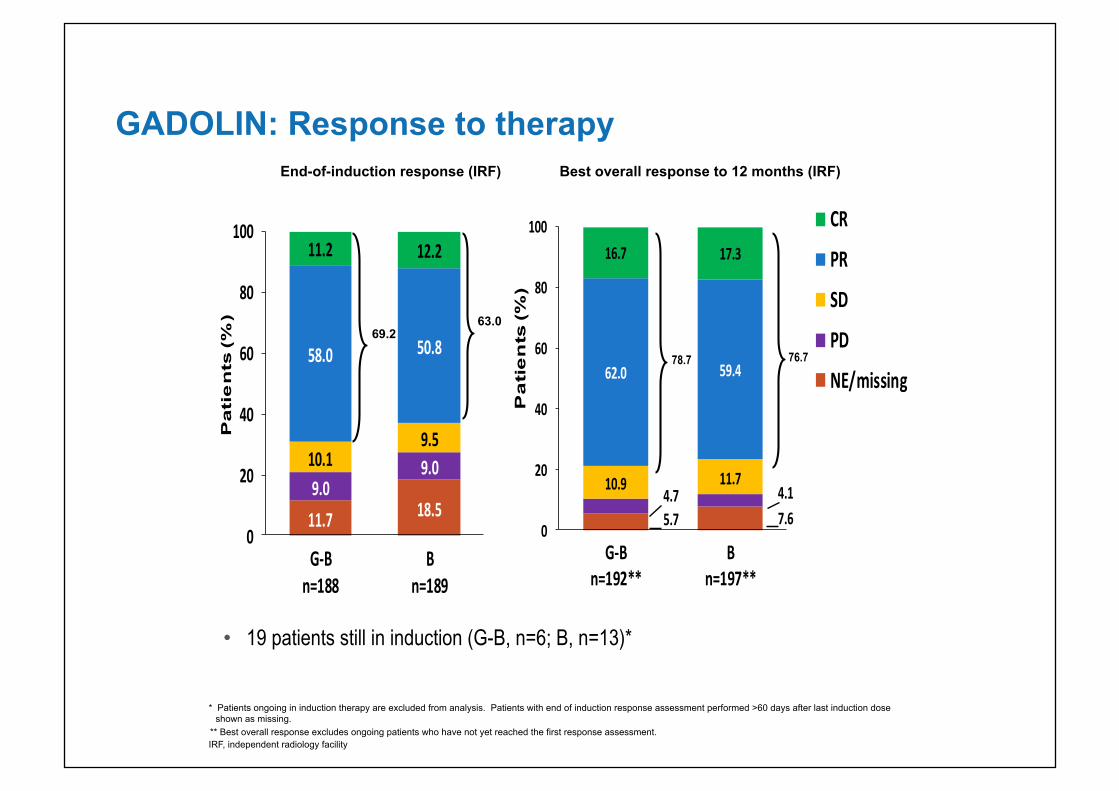
11.7 18.59.0
9.010.19.5
58.0 50.8
11.2 12.2
0
20
40
60
80
100
G-Bn=188
Bn=189
Pati
en
ts (%
)
GADOLIN: Response to therapy
69.2 63.0
* Patients ongoing in induction therapy are excluded from analysis. Patients with end of induction response assessment performed >60 days after last induction dose shown as missing.
** Best overall response excludes ongoing patients who have not yet reached the first response assessment. IRF, independent radiology facility
End-of-induction response (IRF)
5.7 7.64.7 4.110.9 11.7
62.0 59.4
16.7 17.3
0
20
40
60
80
100
G-Bn=192**
Bn=197**
Pa
tie
nts
(%)
CR
PR
SD
PD
NE/missing78.7 76.7
Best overall response to 12 months (IRF)
• 19 patients still in induction (G-B, n=6; B, n=13)*
22
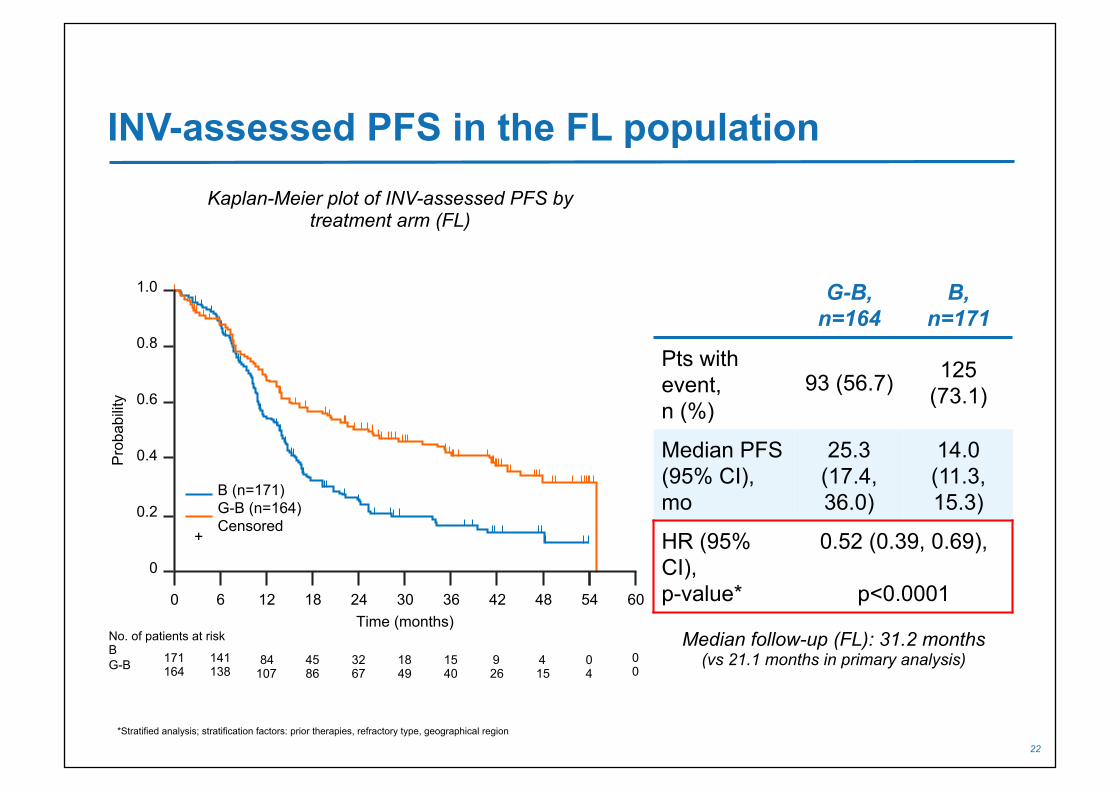
INV-assessed PFS in the FL population
*Stratified analysis; stratification factors: prior therapies, refractory type, geographical region
G-B, n=164
B, n=171
Pts with event, n (%)
93 (56.7) 125 (73.1)
Median PFS (95% CI), mo
25.3 (17.4, 36.0)
14.0 (11.3, 15.3)
HR (95% CI), p-value*
0.52 (0.39, 0.69),
p<0.0001
Median follow-up (FL): 31.2 months (vs 21.1 months in primary analysis)
Kaplan-Meier plot of INV-assessed PFS by treatment arm (FL)
No. of patients at risk B G-B
0.8
0.6
0.4
0.2
0
1.0
Pro
babi
lity
84 107
45 86
32 67
18 49
15 40
9 26
141 138
171 164
Time (months) 12 18 24 30 36 42 48 60 6 0
B (n=171) G-B (n=164) Censored
+
54
4 15
0 4
0 0

23
OS in the FL population
NR, not reached *Stratified analysis; stratification factors: prior therapies, refractory type, geographical region
G-B, n=164
B, n=171
Pts with event, n (%)
39 (23.8) 64 (37.4)
Median OS (95% CI), mo
NR (NR, NR)
53.9 (40.9, NR)
HR (95% CI), p-value*
0.58 (0.39, 0.86), p=0.0061
Kaplan-Meier plot of OS by treatment arm (FL)
Median follow-up (FL): 31.2 months (vs 21.1 months in primary analysis)
No. of patients at risk B G-B
0.8
0.6
0.4
0.2
0
1.0
Pro
babi
lity
137 141
122 129
103 111
84 90
65 71
49 56
159 147
171 164
Time (months) 12 18 24 30 36 42 48 66 6 0
B (n=171) G-B (n=164) Censored
+
54
32 38
7 12
60
13 20
0 0

24
MRD-negative response in the FL population1
*MRD was analyzed by t(14;18) and/or Ig variable domain allele-specific RQ-PCR in patients with a clonal marker detectable at screening in PB or BM by consensus PCR and defined as negative if RQ-PCR and subsequent nested PCR produced a negative result; †p<0.0029 vs B arm; ‡p=0.0001 vs B arm
1. Pott C, et al. Blood 2015;126:3978
77†
(30/39)
82‡ (42/51)
40 (10/25)
43 (18/42)
0
20
40
60
100
B G-B B
80
Pat
ient
s (%
)
G-B
Mid-induction 6 mo after EOI
FL patients (%) achieving MRD-negative status in PB at mid-induction (Cycle 5 Day 1) and 6 months after EOI by treatment arm*1

25
MRD status at EOI and association with PFS in the FL population1
1. Pott C, et al. Blood 2015;126:3978
Kaplan-Meier plot of PFS by MRD status at EOI and by treatment arm in the FL population
0 12 24 48
Time from EOI sample (mo)
0
0.2
0.4
0.6
0.8
1.0
PFS
pro
babi
lity
36
B: Negative at EOI (n=16) G-B: Positive at EOI (n=5) B: Positive at EOI (n=19)
G-B: Negative at EOI (n=37)

26
MRD Status During Induction and Maintenance
Pott et al, Submitted for publication

USIntergroupStudyStrategy
• RandomizedphaseII– LackofaphaseIIIquesNon– Lackofastandardcomparator
• FocusonhighriskpopulaNon• SinglenaNonalstudy• Novelnon-cytotoxiccombinaNonvs“standard”–rapidlyrotaNng
• QOLasanendpoint
Maddocks, Barr, Cheson, et al JNCI 109:e-pub, 2017
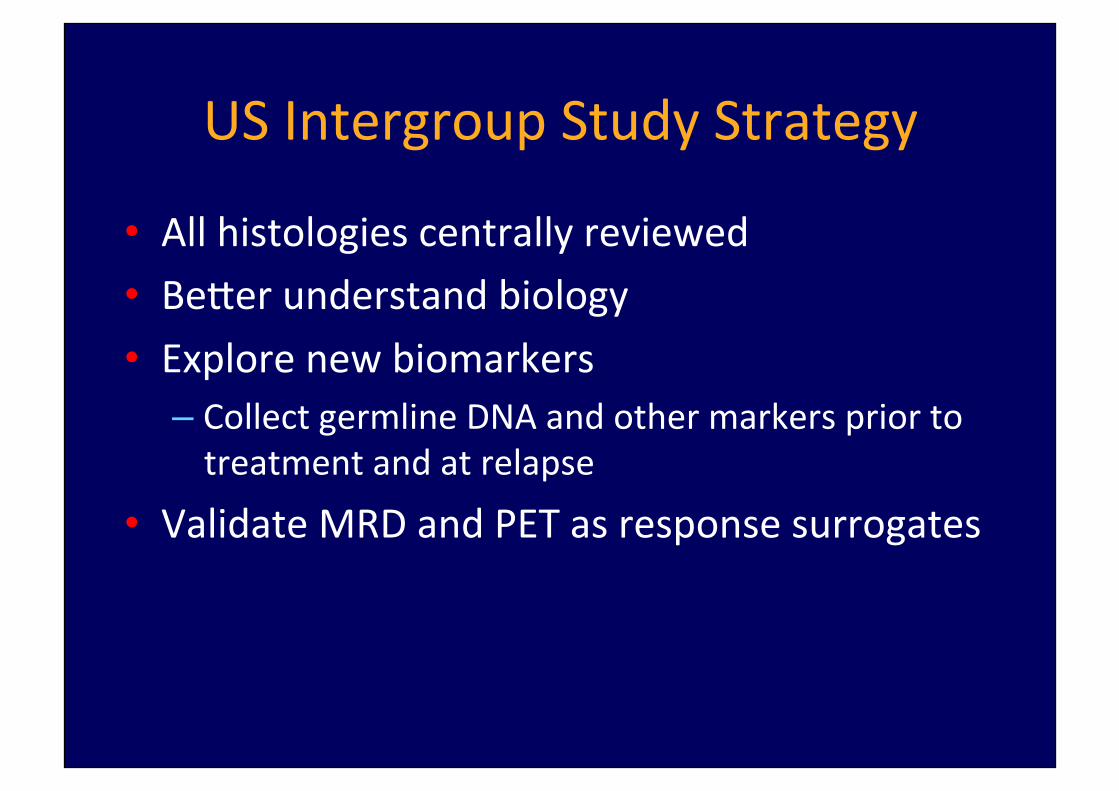
USIntergroupStudyStrategy
• Allhistologiescentrallyreviewed• Be\erunderstandbiology• Explorenewbiomarkers
– CollectgermlineDNAandothermarkerspriortotreatmentandatrelapse
• ValidateMRDandPETasresponsesurrogates

S1608:Schema
FLgrade1-3aFailtoachieveCRorEFS24ager
BendamusNne+anN-CD20anNbody
lenalidomide+obinutuzumab
TGR-1202+obinutuzumab
CHOP+obinutuzumab
• Obinux12• CHOPx6
• Obinu1000mg/m2q28x12• TGR800mgdaily28dx12
• Obinu1000mg/m2q28x12• Len20mgdaily21/28dx12
• Restagingwillberepeatedfollowing6cyclesoftherapy,at1year,at30monthswithPET.PrimaryendpointCR.SecondaryisCR30
• BonemarrowbiopsyifiniNallyinvolvedwithlymphomauponachievingCR.
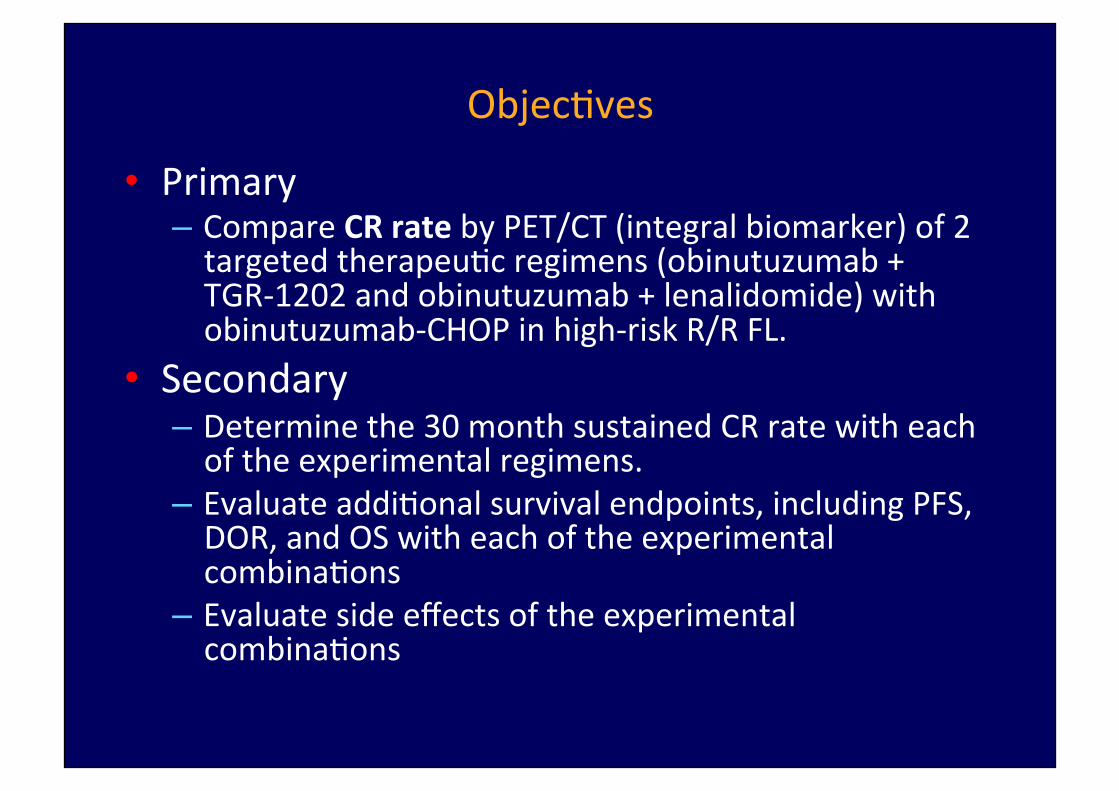
ObjecNves
• Primary– CompareCRratebyPET/CT(integralbiomarker)of2targetedtherapeuNcregimens(obinutuzumab+TGR-1202andobinutuzumab+lenalidomide)withobinutuzumab-CHOPinhigh-riskR/RFL.
• Secondary– Determinethe30monthsustainedCRratewitheachoftheexperimentalregimens.
– EvaluateaddiNonalsurvivalendpoints,includingPFS,DOR,andOSwitheachoftheexperimentalcombinaNons
– EvaluatesideeffectsoftheexperimentalcombinaNons

StaNsNcsandSupport• Primaryendpoint:compareCRratesof2experimentalregimenstoO-CHOP
• Randomizedphase2design– ComparingeachexperimentalregimentoO-CHOP(assumedcompleteresponserateof20%)
– InterestifCRrateis>45%– Significancelevelof10%(probabilityoffalselyconcludingaregimenisbe\erthanO-CHOPunderthenull)
– Powerof85%(probabilityofcorrectlyconcludingaregimenimprovestheresponserate,assumingthespecifieddifference)
• 150paNents(45ineacharm)– EsNmated10%ineligibility

New Targeted Agents Agent Target Obinutuzumab/Ublituximab CD20 Polatuzumab vedotin Blinatumomab
CD79b CD3/CD19
Ibrutinib Btk Acalabrutinib (ACP-196) Btk Entospletinib (GS-9973) Syk Idelalisib PI3-K TGR-1202, Copanlisib PI3-K Venetoclax (ABT-199) Tazemetostat
Bcl-2 EZH2
Selinexor XP01 (Nuclear transport) Lenalidomide Multiple Nivolumab/Pembrolizumab PD-1 Atezolizumab PDL-1

Ongoing “Non-chemo” Combination Trials in FL Drugs Sponsor Obinutuzumab-B/CHOP+Atezolizumab Genentech Obinutuzumab+Polatuzumab Genentech Obinutuzumab+Atezolizumab+lenalidomide Genentech Obinutuzumab+Polatuzumab+lenalidomide Genentech Obinutuzumab+Polatuzumab+venetoclax Genentech GO29687 (Thiomab)+rituximab Genentech Acalabrutinib (ACP-196)+pembrolizumab Acerta Acalabrutinib+ACP-319 Acerta Acalabrutinib+rituximab Acerta Ono/GS-4059+idelalisib Gilead Ibrutinib+Venetoclax Georgetown Ublituximab+ibrutinib TG Therapeutics Ublituximab+TGR-1202 TG Therapeutics Ublituxumab+TGR-1202+ibrutinib TG Therapeutics Rituximab +/- copanlisib Bayer
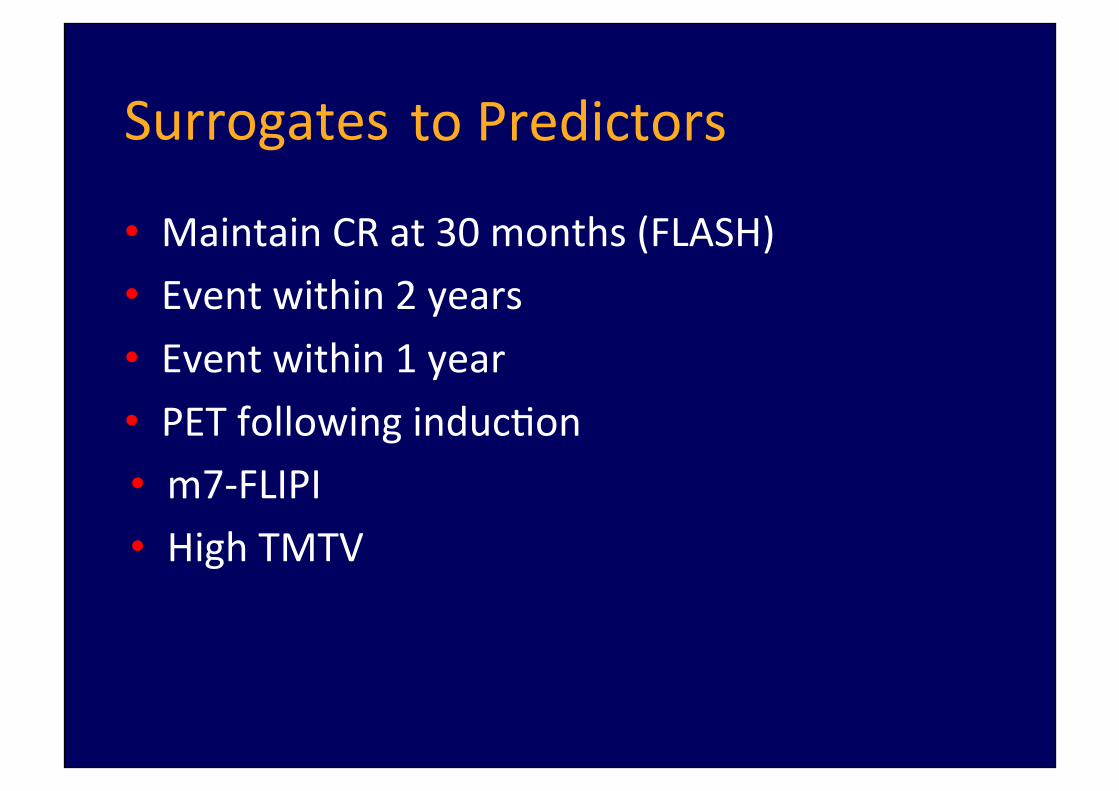
Surrogates
• MaintainCRat30months(FLASH)• Eventwithin2years• Eventwithin1year• PETfollowinginducNon
toPredictors
• m7-FLIPI• HighTMTV
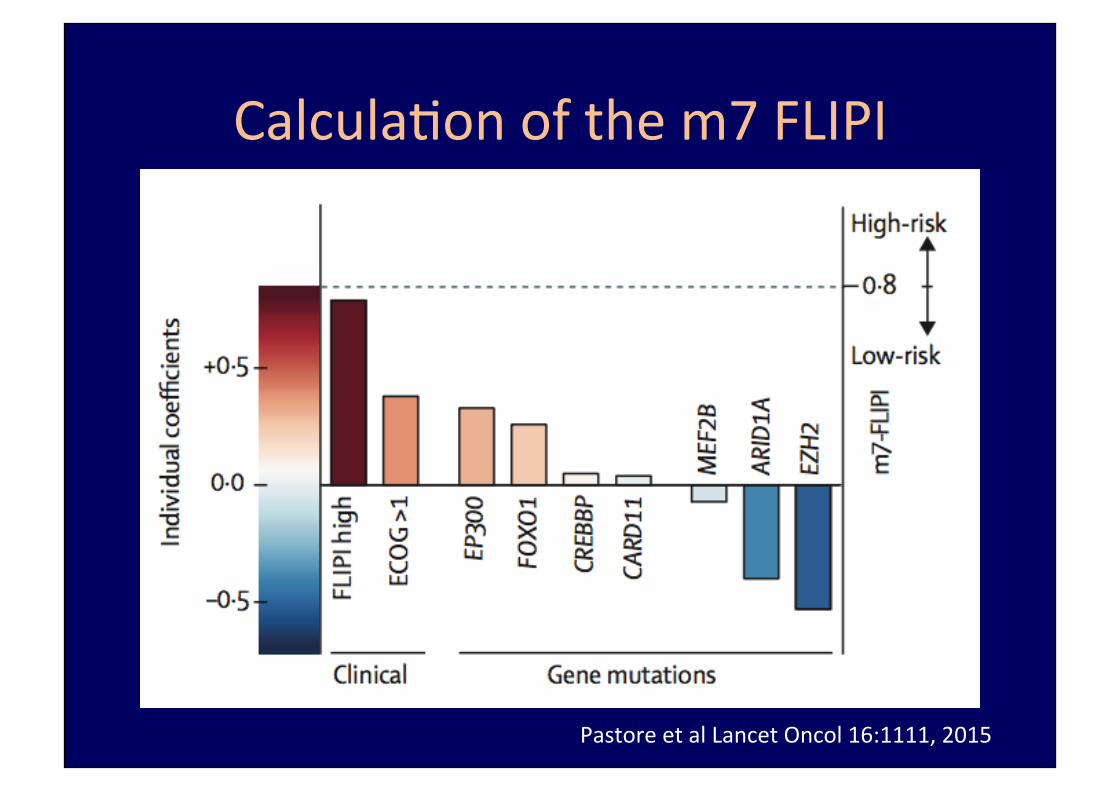
CalculaNonofthem7FLIPI
PastoreetalLancetOncol16:1111,2015
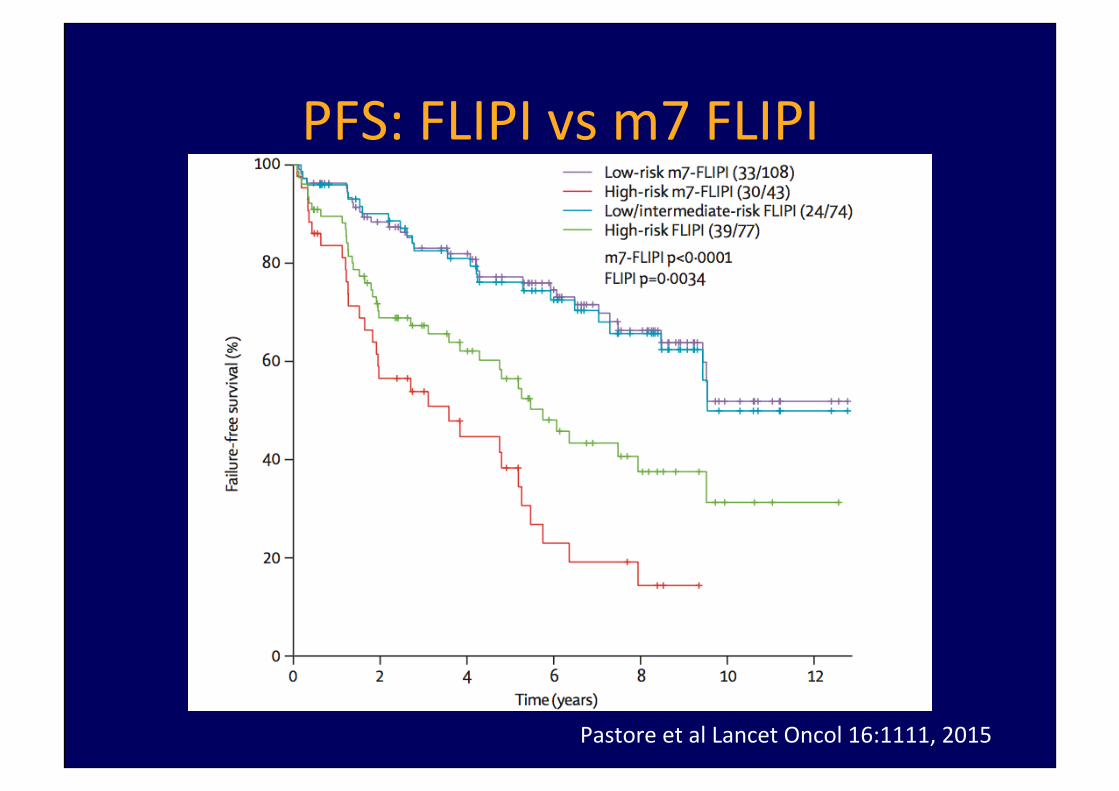
PFS:FLIPIvsm7FLIPI
PastoreetalLancetOncol16:1111,2015

Meignanetal,JCO,e-pub,2017
Pre-TreatmentTMTVinFL

PFS of FL according to the level of pre-tx circulating tumor DNA (Clonoseq)
Clémentine Sarkozy et al. Blood 2015;126:2675
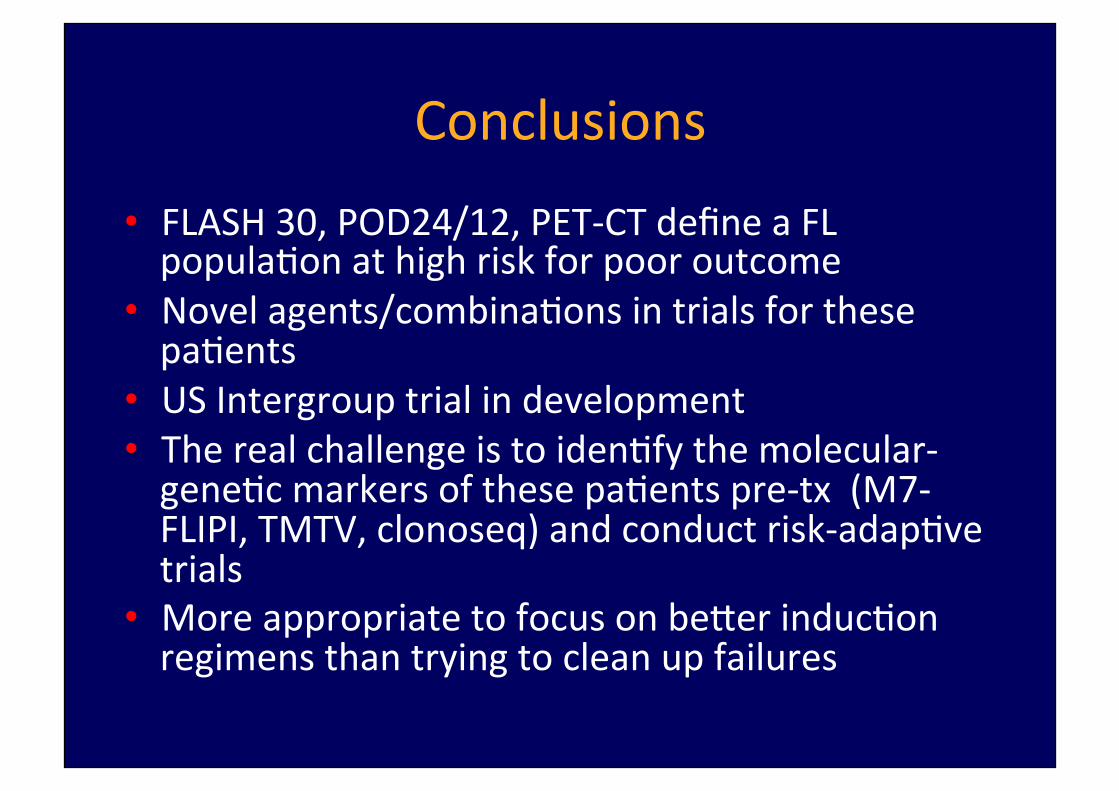
Conclusions• FLASH30,POD24/12,PET-CTdefineaFLpopulaNonathighriskforpooroutcome
• Novelagents/combinaNonsintrialsforthesepaNents
• USIntergrouptrialindevelopment• TherealchallengeistoidenNfythemolecular-geneNcmarkersofthesepaNentspre-tx(M7-FLIPI,TMTV,clonoseq)andconductrisk-adapNvetrials
• Moreappropriatetofocusonbe\erinducNonregimensthantryingtocleanupfailures