u.s. mutual fund retail investors in international equity markets… · u.s. mutual fund retail...
TRANSCRIPT
WP/05/162
U.S. Mutual Fund Retail Investors in International Equity Markets: Is the Tail Wagging the Dog?
Jorge A. Chan-Lau and Li Lian Ong
© 2005 International Monetary Fund WP/05/162
IMF Working Paper
International Capital Markets Department
U.S. Mutual Fund Retail Investors in International Equity Markets: Is the Tail Wagging the Dog?
Prepared by Jorge A. Chan-Lau and Li Lian Ong1
Authorized for distribution by David Ordoobadi and Jorge Roldos
August 2005
Abstract
This Working Paper should not be reported as representing the views of the IMF. The views expressed in this Working Paper are those of the author(s) and do not necessarily represent those of the IMF or IMF policy. Working Papers describe research in progress by the author(s) and are published to elicit comments and to further debate.
Do the dynamics of net flows to U.S. retail mutual funds affect equity returns in emerging markets? The question merits further examination since retail investors in mutual funds can exert a much greater degree of “control” over these funds via cash injections or redemptions at any time. A VAR analysis shows increased discrimination across emerging market regionsafter the Asian crisis as investors focused on individual regions rather than on emerging markets as a generic asset class. Crossover funds allocations also appear to affect emerging market returns. Furthermore, investment decisions by fund managers seem to be largely driven by retail investor allocations. JEL Classification Numbers: F21, G15 Keywords: mutual funds, retail investors, equity markets, dedicated funds, crossover funds Author(s) E-Mail Address: [email protected], [email protected]
1 We would like to thank David Ordoobadi and Jorge Roldos for their extensive comments. Any errors or omissions remain our sole responsibility.

- 2 -
Contents Page
I. Introduction....................................................................................................................3
II. Related Literature...........................................................................................................4
III. The Data.........................................................................................................................6
IV. Empirical Framework ..................................................................................................12
V. Results..........................................................................................................................13
VI. Conclusion ...................................................................................................................15
VII. References................................................................................................................... 20
Tables 1. Descriptive Statistics of Equity Returns and net Flow Changes....................................8 2. Emerging Markets: VAR and Variance Decomposition Estimates of Equity Return
Equations—Pre- and Post-Crisis Periods.....................................................................17 3. Asia-Pacific (ex-Japan): VAR and Variance Decomposition Estimates of Equity
Return Equations—Pre- and Post-Crisis Periods.........................................................18 4. Latin America: VAR and Variance Decomposition Estimates of Equity Return
Equations—Pre- and Post-Crisis Period ......................................................................19
Figures 1. U.S. Equity Mutual Funds: Net New Cash Flows (In billions of U.S. dollars).............6 2. Mutual Fund Flows, Weekly Changes (In percent) .......................................................9 3. Equity Returns in Emerging Markets (In percent).......................................................11 4. Equity Return Correlation: Asia-Pacific (ex-Japan) vs Japan .....................................14

- 3 -
I. INTRODUCTION
Since 1990, assets under management in the mutual fund industry have increased by more than six-fold to $14 trillion by end-2003. A rapidly growing middle class in both mature and emerging markets suggests that the growth of this industry should continue, going forward, helped by increased acceptance and adoption of defined-contribution pension plans based on individual retirement savings. Hence, the mutual fund industry is playing an increasingly important role in channeling household savings to different asset classes. In recent times, the positive diversification and yield-pick up effects of including emerging market securities into mature market investors’ portfolios have received a lot of coverage in the financial press. On the other hand, it has been argued that the increased volatility observed in emerging equity markets during the 1990s could be partly attributed to the proliferation of foreign dedicated emerging markets investment funds. Thus, one of the biggest concerns among emerging market policymakers is whether foreign mutual funds—among other institutional investors—could be a destabilizing force in local capital markets, with severe knock-on effects for the real economy. Specifically, do the dynamics of retail net flows to mutual funds in emerging markets affect equity returns in emerging markets? Although mutual funds are typically categorized as institutional investors—an investor class normally deemed fairly stable through boom and bust cycles, as observed during the U.S. equity market crash in 1987—mutual funds are inherently different from their counterparts in the hedge funds, pension and insurance industries. Notably, underlying investors (or shareholders) in mutual funds are able to exert a much greater degree of “control” over these funds via cash injections or redemptions at any time. In other words, trades by mutual funds may reflect either the result of independent institutional decision to buy or sell, or the institution’s reaction to its individual investors’ decision to buy or sell, or both. More importantly, retail investors are more likely to be less informed about a country’s or region’s economic fundamentals, and hence, more prone to herding behavior. This paper contributes to the academic literature by focusing specifically on the impact of retail investor decisions on the performance of emerging equity markets. Contrary to fund managers, retail investors are not constrained by specific mandates imposed on the former. Specifically, we contemplate the possible impact of investment decisions by United States-based (dedicated) mutual fund retail investors on the returns and volatility in emerging equity markets, using vector autoregression (VAR) analysis. In other words, our objective is to observe the extent to which asset reallocation decisions by retail investors drives the behavior of mutual fund managers, and their consequent impact on emerging equity markets. Within this framework, we also consider the effects of any reallocation decision by investors in crossover global and international equity funds, as well as in fixed income and money market funds. Our findings, based on weekly data from July 1991 to December 2003 and focused on the pre- and post-Asian crisis periods, could be summarized as follows. First, we find that allocations by U.S. retail investors to crossover funds appear to have a significant impact on

- 4 -
emerging market returns in both periods analyzed. Second, U.S. retail investors also appear to have become more discriminating across emerging market regions, by focusing on the individual regions rather than on emerging markets as a generic asset class. Finally, the results also suggest that investment decisions by portfolio managers are largely driven by retail investor allocations as there appears to be little lag between retail net flows and market movement. The paper is structured as follows. Section II discusses the related literature, while Section III details the data used in our analysis. The research method is presented in Section IV, followed by a discussion of the empirical results in Section V. Section VI concludes.
II. RELATED LITERATURE
The existing empirical evidence suggests that redemptions by retail investors appear to be the key factor underlying the herding behavior observed in mutual funds both in and outside the United States. For example, Kaminsky, Lyons and Schmukler (2000) found evidence of momentum trading by United States-based dedicated Latin American mutual funds during both crisis and non-crisis periods, when analyzing the funds’ investment strategies at the individual portfolio level to distinguish between the actions of fund managers versus underlying investors. They find that contemporaneous momentum trading appears stronger during crisis periods, and tend to be more pronounced for fund investors than for fund managers. On the other hand, lagged momentum trading appears stronger for fund managers during non-crisis periods.2 Also, fund investors appear largely responsible for contagion trading, whereby they systematically sell off assets from one country when asset prices fall in another. Separately, Kim and Wei (2002) find strong evidence of herding behavior among non-resident individual investors relative to individual investors in Korea. Kaminsky, Lyons and Schmukler (2001) find that injections and redemptions by shareholders into and out of emerging market mutual funds during the 1990s crises periods have been large relative to total funds under management. Since the cash held by managers—which may be used to help buffer portfolios from redemptions—does not appear to fluctuate significantly during injections and redemptions, they attribute these observed flows to the shareholders’ investment decisions. Borensztein and Gelos (2003a, 2003b) test herding behavior amongst mutual funds, using implied flows from asset-position data covering 80 percent of dedicated emerging market equity funds worldwide. They find that herding behavior is stronger in open-end funds than in closed-end funds, since the latter are not subject to redemptions by individual investors. The finding suggests that withdrawal decisions by individuals, rather than fund managers, are responsible for the retrenchment of funds from emerging markets during crises. On the other 2 Contemporaneous momentum trading is the buying of current winners and selling of current losers, while lagged momentum trading is the buying of past winners and selling of past losers.

- 5 -
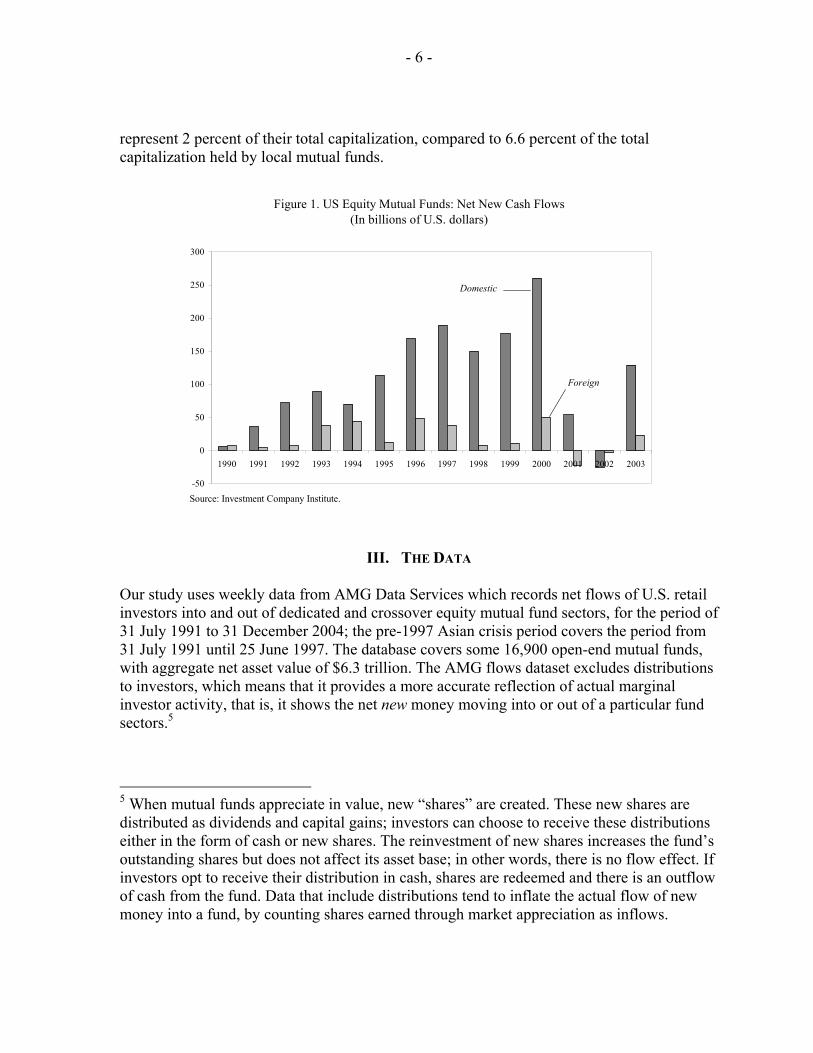
hand, herding behavior is moderate, and does not appear to be neither more prevalent nor stronger during crises periods to account for past high volatility episodes in international capital markets. In contrast, several studies on the investment pattern of United States-based mutual funds in emerging markets actually suggest that neither shareholders nor portfolio managers’ investment behavior exacerbates market volatility during emerging markets crises. Rea (1996), for instance, finds that shareholders in U.S. emerging market equity funds did not redeem shares in large volumes during the distress periods experienced from 1991 to 1996. His evidence also suggests that portfolio managers frequently play a stabilizing role by purchasing shares when prices are falling. Also, stock position liquidations are typically small relative to the outstanding holdings. Moreover, portfolio managers of these funds do not appear to reallocate investments between countries in a way that would have intensified price swings. Post and Millar (1998) find that portfolio managers of U.S. open-end emerging market equity funds reacted calmly to the Asian crisis, as did shareholders in their funds. They show that liquidations during that period were largely limited to Asia-only funds, and argue the liquidations likely took place in response to some shareholder redemptions. Rea and Marcis (1996) conclude that international equity fund investors in the U.S. are generally experienced investors with a basic understanding of investment risk and have long-term investment objectives and horizons.3 Their evidence indicates that shareholders in U.S. emerging market equity funds did not suddenly redeem shares in large volumes during periods of market weakness in the 1990s—any withdrawal tended to be made in modest amounts and over a period of time. It should be noted, though, that home-bias by foreign investors could dampen fund flows to dedicated emerging market mutual funds, limiting the funds’ impact on emerging market equity returns.4 For instance, investors in the United States continue to prefer domestic equity funds over foreign equity funds (see Figure 1). Of a total of $310 billion net cash inflows to equity funds in 2000, only $50 billion were allocated to dedicated foreign equity funds. As documented by Ong and Sy (2004), U.S. mutual fund allocations to emerging market equities represent only a very small share of emerging market capitalization. They estimate that the $63 billion invested by U.S. mutual funds in emerging market equities as of end-2003, only 3 A 1996 survey by the Investment Company Institute shows that shareholders of international and global mutual funds, which invest in markets outside the U.S., tend to be more willing to take above-average risk than those not owning such funds.
4 Lewis (1999) and Karolyi and Stulz (2002), among others, document home bias in the United States. Edison and Warnock (2003), however, find no home bias by U.S. investors towards emerging market equities that are cross-listed on U.S. exchanges, since cross-listings ameliorate the problems associated with asymmetric information.
- 6 -
represent 2 percent of their total capitalization, compared to 6.6 percent of the total capitalization held by local mutual funds.
Figure 1. US Equity Mutual Funds: Net New Cash Flows(In billions of U.S. dollars)
-50
0
50
100
150
200
250
300
1990 1991 1992 1993 1994 1995 1996 1997 1998 1999 2000 2001 2002 2003
Domestic
Foreign
Source: Investment Company Institute.
III. THE DATA Our study uses weekly data from AMG Data Services which records net flows of U.S. retail investors into and out of dedicated and crossover equity mutual fund sectors, for the period of 31 July 1991 to 31 December 2004; the pre-1997 Asian crisis period covers the period from 31 July 1991 until 25 June 1997. The database covers some 16,900 open-end mutual funds, with aggregate net asset value of $6.3 trillion. The AMG flows dataset excludes distributions to investors, which means that it provides a more accurate reflection of actual marginal investor activity, that is, it shows the net new money moving into or out of a particular fund sectors.5
5 When mutual funds appreciate in value, new “shares” are created. These new shares are distributed as dividends and capital gains; investors can choose to receive these distributions either in the form of cash or new shares. The reinvestment of new shares increases the fund’s outstanding shares but does not affect its asset base; in other words, there is no flow effect. If investors opt to receive their distribution in cash, shares are redeemed and there is an outflow of cash from the fund. Data that include distributions tend to inflate the actual flow of new money into a fund, by counting shares earned through market appreciation as inflows.
- 7 -
For the purpose of this study, we examine the relationship between changes in net cash flows and the performance of emerging market equities. Our sample includes the following types of funds:
• Dedicated emerging markets funds: Asia-Pacific (ex-Japan) Equities; Latin America Equities; Emerging Markets Equities;
• Dedicated mature markets funds: U.S. Equities; European Equities; Japan Equities;
• Crossover funds: Global Equities; International Equities.6 Flows to U.S. Treasury funds and money market funds are also included to determine the impact, if any, of reallocations across asset classes by retail investors. Weekly emerging markets equities returns of interest to this study are obtained from U.S. dollar-denominated Morgan Stanley Capital International (MSCI) indices, namely:
• the Emerging Markets Free Index;7 • the All Country Far East ex Japan Index;8 and • the Emerging Markets Latin America Index.9
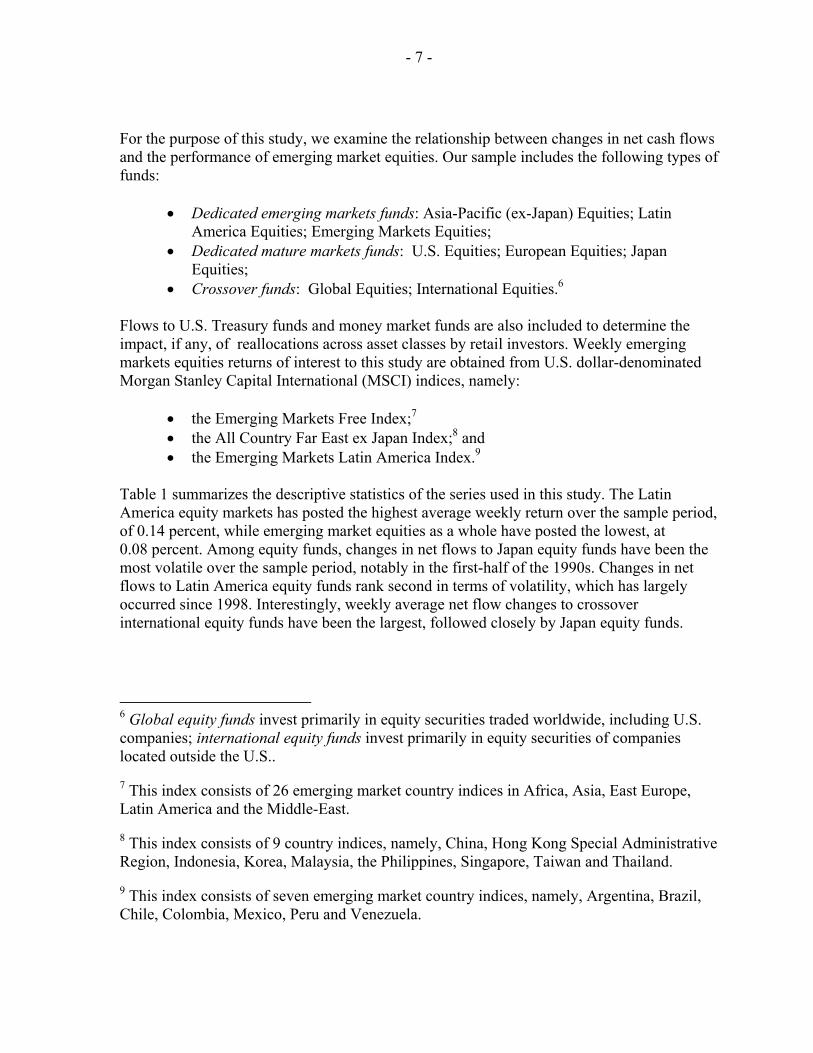
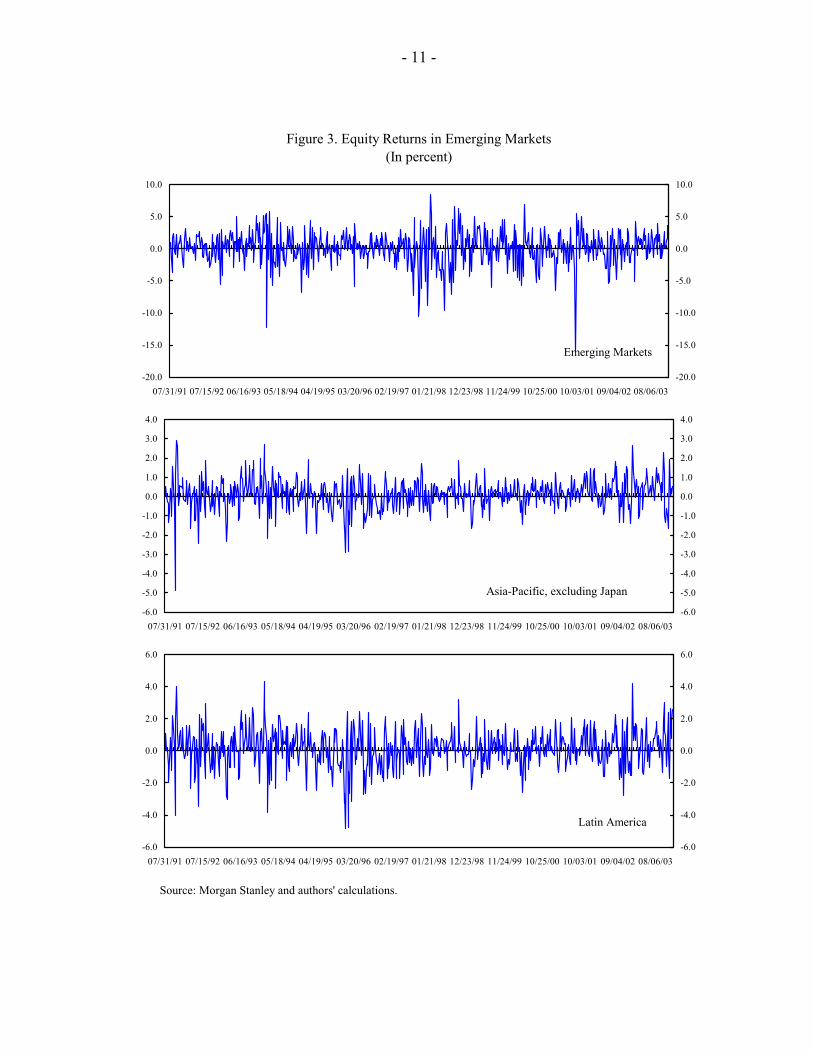
Table 1 summarizes the descriptive statistics of the series used in this study. The Latin America equity markets has posted the highest average weekly return over the sample period, of 0.14 percent, while emerging market equities as a whole have posted the lowest, at 0.08 percent. Among equity funds, changes in net flows to Japan equity funds have been the most volatile over the sample period, notably in the first-half of the 1990s. Changes in net flows to Latin America equity funds rank second in terms of volatility, which has largely occurred since 1998. Interestingly, weekly average net flow changes to crossover international equity funds have been the largest, followed closely by Japan equity funds.
6 Global equity funds invest primarily in equity securities traded worldwide, including U.S. companies; international equity funds invest primarily in equity securities of companies located outside the U.S..
7 This index consists of 26 emerging market country indices in Africa, Asia, East Europe, Latin America and the Middle-East.
8 This index consists of 9 country indices, namely, China, Hong Kong Special Administrative Region, Indonesia, Korea, Malaysia, the Philippines, Singapore, Taiwan and Thailand.
9 This index consists of seven emerging market country indices, namely, Argentina, Brazil, Chile, Colombia, Mexico, Peru and Venezuela.

- 8 -
Table 1. Descriptive Statistics of Equity Returns and Net Flow Changes (In percent)
Series Mean Maximum Minimum Standard SharpeDeviation Ratio
U.S. dollar weekly returns, in percentMSCI Emerging Markets Free Index 0.08 8.42 -15.85 2.57 0.03MSCI Asia-Pacific (ex-Japan) Index 0.11 2.91 -4.89 0.79 0.14MSCI Latin America Index 0.13 4.34 -4.85 1.20 0.11
Net flows weekly changes, in percentEmerging market equity funds 0.43 7.55 -2.97 1.34 ---Asia-Pacific, ex-Japan equity funds 0.28 7.39 -5.04 1.74 ---Latin America equity funds 0.17 7.27 -10.00 2.03 ---United States equity funds 0.20 5.44 -1.55 0.38 ---Europe equity funds 0.09 4.57 -3.53 1.03 ---Japan equity funds 0.34 21.60 -7.36 2.52 ---Global equity funds 0.25 4.27 -5.85 0.25 ---International equity funds 0.35 12.39 -3.62 1.38 ---U.S. Treasury funds 0.06 7.54 -12.78 1.17 ---United States money market funds 0.18 9.65 -4.84 1.11 ---
Source: Morgan Stanley, AMG, and authors' calculations. Table 1 also shows the risk-adjusted returns of the different markets included in the study. The highest Sharpe ratio corresponds to Asia-Pacific (ex-Japan), 0.14, followed by Latin American markets, 0.11. Emerging markets as a whole have a low Sharpe ratio of 0.03. Japanese equity funds show the largest weekly average changes in net flows and standard deviation of 0.34 percent and 2.52 percent, respectively. Net flow changes in global and U.S. equity funds have been the least volatile, with a weekly standard deviation of 0.25 and 0.38 percent, respectively, while Europe equity funds have shown the smallest weekly average change in net flows of 0.09 percent. Figure 2 shows changes in net cash flows to for individual emerging market funds, while Figure 3 illustrates returns for the three emerging market equity indices.

- 9 -
Figure 2. Mutual Fund Flows, Weekly Changes (continued)(In percent)
Source: AMG.
-4
-2
0
2
4
6
8
10
7/31/91 9/7/94 10/1/97 10/25/00 11/26/03-4
-2
0
2
4
6
8
10Emerging Markets
-6
-4
-2
0
2
4
6
8
10
7/31/91 9/7/94 10/1/97 10/25/00 11/26/03-6
-4
-2
0
2
4
6
8
10Asia-Pacific, excluding Japan
-12
-10
-8
-6
-4
-2
0
2
4
6
8
10
7/31/91 9/7/94 10/1/97 10/25/00 11/26/03-12
-10
-8
-6
-4
-2
0
2
4
6
8
10Latin America
-2
-1
0
1
2
3
4
5
6
7/31/91 9/7/94 10/1/97 10/25/00 11/26/03-2
-1
0
1
2
3
4
5
6
-4
-3
-2
-1
0
1
2
3
4
5
7/31/91 9/7/94 10/1/97 10/25/00 11/26/03-4
-3
-2
-1
0
1
2
3
4
5
-10
-5
0
5
10
15
20
25
7/31/91 9/7/94 10/1/97 10/25/00 11/26/03-10
-5
0
5
10
15
20
25Japan
United States
Europe

- 10 -
Figure 2. Mutual Funds, Weekly Flow Changes (concluded)(In percent)
-8
-6
-4
-2
0
2
4
6
7/31/91 9/7/94 10/1/97 10/25/00 11/26/03-8
-6
-4
-2
0
2
4
6Global International
-6
-4
-2
0
2
4
6
8
10
12
14
7/31/91 9/7/94 10/1/97 10/25/00 11/26/03-6
-4
-2
0
2
4
6
8
10
12
14
Money markets
-6
-4
-2
0
2
4
6
8
10
12
7/31/91 9/7/94 10/1/97 10/25/00 11/26/03-6
-4
-2
0
2
4
6
8
10
12Treasuries
-15
-12
-9
-6
-3
0
3
6
9
12
7/31/91 9/7/94 10/1/97 10/25/00 11/26/03-15
-12
-9
-6
-3
0
3
6
9
12
Source: AMG
-2
-1
0
1
2
3
4
5
6
33450 34115 34766 35417 36068 36719 37377
- 11 -
Figure 3. Equity Returns in Emerging Markets (In percent)
Source: Morgan Stanley and authors' calculations.
-20.0
-15.0
-10.0
-5.0
0.0
5.0
10.0
07/31/91 07/15/92 06/16/93 05/18/94 04/19/95 03/20/96 02/19/97 01/21/98 12/23/98 11/24/99 10/25/00 10/03/01 09/04/02 08/06/03-20.0
-15.0
-10.0
-5.0
0.0
5.0
10.0
Emerging Markets
-6.0
-5.0
-4.0
-3.0
-2.0
-1.0
0.0
1.0
2.0
3.0
4.0
07/31/91 07/15/92 06/16/93 05/18/94 04/19/95 03/20/96 02/19/97 01/21/98 12/23/98 11/24/99 10/25/00 10/03/01 09/04/02 08/06/03-6.0
-5.0
-4.0
-3.0
-2.0
-1.0
0.0
1.0
2.0
3.0
4.0
Asia-Pacific, excluding Japan
-6.0
-4.0
-2.0
0.0
2.0
4.0
6.0
07/31/91 07/15/92 06/16/93 05/18/94 04/19/95 03/20/96 02/19/97 01/21/98 12/23/98 11/24/99 10/25/00 10/03/01 09/04/02 08/06/03-6.0
-4.0
-2.0
0.0
2.0
4.0
6.0
Latin America

- 12 -
IV. EMPIRICAL FRAMEWORK
Assessing the impact of net order flows to equity funds on emerging market equity returns can be done using the vector autoregression (VAR) approach, as first suggested by Hasbrouck (1991a, b). This approach allows us to determine the significance of the relationship between the variables, as well as measure the extent to which the variability in equity returns is affected by the variability in changes in investor flows. The VAR method is briefly explained here. Given the vector of n endogenous variables, Yt=(y1t, y2t,..., ynt)', the corresponding unrestricted VAR system of order p is given by: (1) 1 1 ,t t p t p tY c Y Y ε− −= +Φ + +Φ +K where c is a n-vector of constant terms, Φi, i=1,...,p are n-by-n coefficient matrices, and εt is a vector of uncorrelated, independent, and identically distributed error terms. The error terms are also serially uncorrelated. Under certain technical conditions, described in detail in econometrics texts like Hamilton (1994), the vector autoregression system in equation (1) admits the following vector moving average representation (VMA):
(2)
1 11 1 1 1
1
1
( ) ( ) ( )
( ) ( ) ( ) ,
( ) ( ) ( )
t i n t
it i ii in it
nt n ni nn nt
y L L L
y L L L
y L L L
ψ ψ ψ ε
ψ ψ ψ ε
ψ ψ ψ ε
⎡ ⎤ ⎡ ⎤ ⎡ ⎤⎢ ⎥ ⎢ ⎥ ⎢ ⎥⎢ ⎥ ⎢ ⎥ ⎢ ⎥⎢ ⎥ ⎢ ⎥ ⎢ ⎥=⎢ ⎥ ⎢ ⎥ ⎢ ⎥⎢ ⎥ ⎢ ⎥ ⎢ ⎥⎢ ⎥ ⎢ ⎥ ⎢ ⎥⎣ ⎦ ⎣ ⎦ ⎣ ⎦
K K
M M M M M
K K
M M M M M
K K
where 1
k kij ij
kLψ ψ
∞
=
=∑ , i,j=1,...,n are lag operators.
The coefficient k
ijψ measures the effect k periods ahead of a unit shock or innovation to variable yj on variable yi. Therefore, the long-term cumulative impact of variable yj on variable yi can be measured by adding up the coefficients associated to the lag operator ( )ij Lψ :
(3) 0
information content of on .kij j i
ky yψ
∞
=
=∑
Equation (3) suggests that variance decomposition can be used to quantify the overall importance of innovations to variable yj for explaining subsequent realizations of variable yi vis-à-vis the other endogenous variables. Specifically, the overall importance of variable yj is captured by the relative share of the variance of variable yi it explains:

- 13 -
(4)
22
02
2
1 0
j
m
kij
k
nkim
m k
ε
ε
ψ σ
ψ σ
∞
=
∞
= =
⎛ ⎞⎜ ⎟⎝ ⎠⎛ ⎞⎜ ⎟⎝ ⎠
∑
∑ ∑,
where 2
jεσ is the variance of the innovation to variable yj. In this manner, we are able to
determine the impact of net retail flows of U.S.-based equity mutual funds on emerging markets equity returns. Note that our VAR framework does not choose a particular ordering of the variables entering equation (1), and hence it is a statistical description of the dynamic interrelations between the variables analyzed. While a structural VAR may offer some advantages for interpreting the data since it forces error terms to be orthogonal, it requires specifying a priori a casual ordering of the variables, which we do not deem appropriate for this study.
V. RESULTS
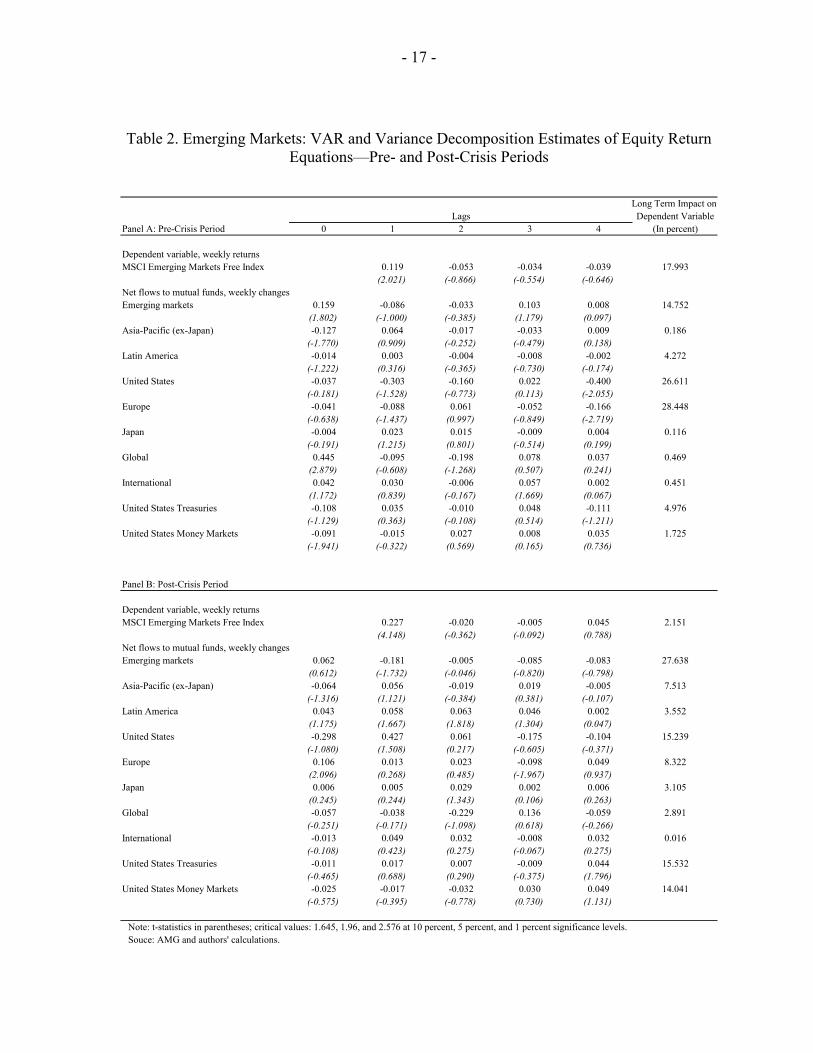
This section analyzes the empirical evidence from applying the above model to the retail investor flows data. We divide the sample into pre- and post-emerging markets crises sub-periods, defined as July 1991 to June 1997 and July 1997 to 31 December 2003, respectively. This enables to test whether the inter-related dynamics between flows and equity returns are robust over different time periods and market conditions. We consider both the contemporaneous and lagged effects of changes to the fund flows of several funds on emerging markets, as represented by the returns on the Emerging Market, Asia-Pacific (ex-Japan) and Latin America equity indices. Equations (1), (2), and (4) are estimated separately for these three return series, including as additional endogenous variables the following net flow series: dedicated emerging market equity funds, dedicated mature market equity funds (Europe, Japan and the United States), crossover equity funds (global and international), U.S. treasury funds and U.S. money market funds. Tables 2 to 4 report the respective pre- and post-crisis results of the estimated VAR(4) systems from equation (1) and the long-term impact of each variable on subsequent realizations of the other endogenous variables from equation (4).10 We find notable similarities in the results across both periods. Generally, the VAR results In Table 2 suggest that innovations in net flow changes to emerging markets, Europe and U.S. equity funds are key common factors affecting returns volatility in emerging equity markets. In Table 3, the variance decomposition suggests that net flow changes to emerging market equity funds explain the biggest proportion of innovations in equity returns of the Asia-
10 Lag selection was determined using log likelihood ratios with four lags. In our view, this number of lags is sufficient to determine the short-term interaction between the variables.
- 14 -
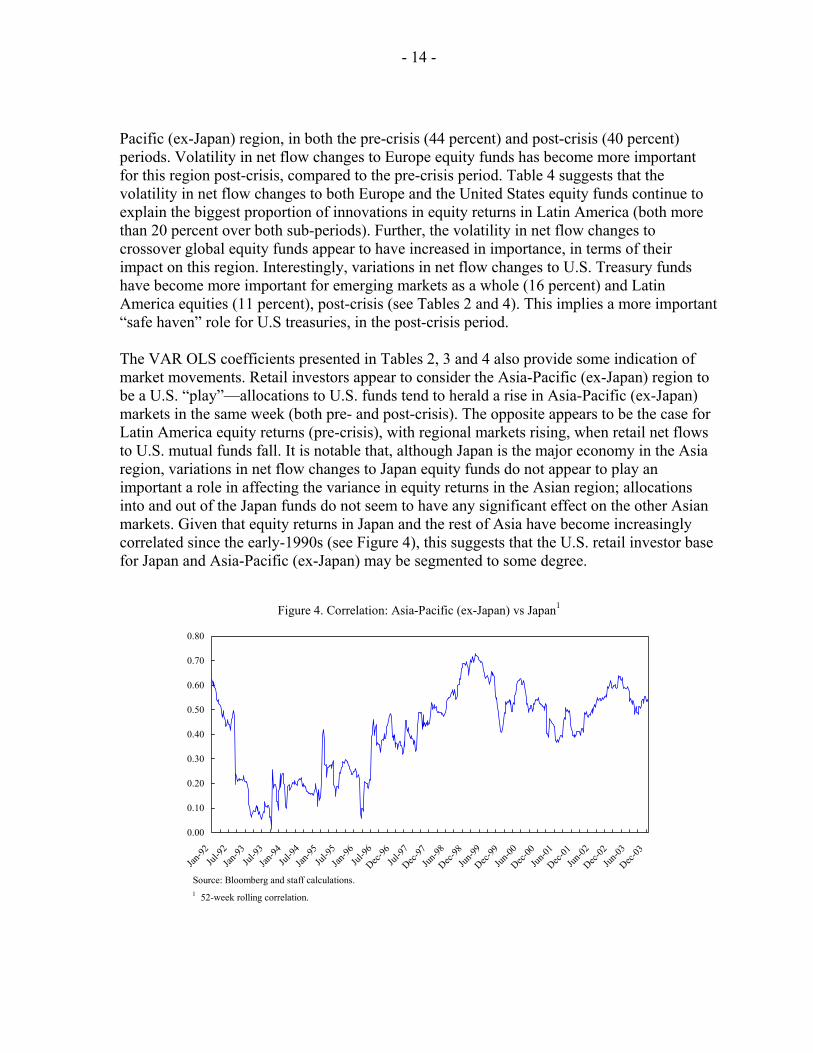
Pacific (ex-Japan) region, in both the pre-crisis (44 percent) and post-crisis (40 percent) periods. Volatility in net flow changes to Europe equity funds has become more important for this region post-crisis, compared to the pre-crisis period. Table 4 suggests that the volatility in net flow changes to both Europe and the United States equity funds continue to explain the biggest proportion of innovations in equity returns in Latin America (both more than 20 percent over both sub-periods). Further, the volatility in net flow changes to crossover global equity funds appear to have increased in importance, in terms of their impact on this region. Interestingly, variations in net flow changes to U.S. Treasury funds have become more important for emerging markets as a whole (16 percent) and Latin America equities (11 percent), post-crisis (see Tables 2 and 4). This implies a more important “safe haven” role for U.S treasuries, in the post-crisis period. The VAR OLS coefficients presented in Tables 2, 3 and 4 also provide some indication of market movements. Retail investors appear to consider the Asia-Pacific (ex-Japan) region to be a U.S. “play”—allocations to U.S. funds tend to herald a rise in Asia-Pacific (ex-Japan) markets in the same week (both pre- and post-crisis). The opposite appears to be the case for Latin America equity returns (pre-crisis), with regional markets rising, when retail net flows to U.S. mutual funds fall. It is notable that, although Japan is the major economy in the Asia region, variations in net flow changes to Japan equity funds do not appear to play an important a role in affecting the variance in equity returns in the Asian region; allocations into and out of the Japan funds do not seem to have any significant effect on the other Asian markets. Given that equity returns in Japan and the rest of Asia have become increasingly correlated since the early-1990s (see Figure 4), this suggests that the U.S. retail investor base for Japan and Asia-Pacific (ex-Japan) may be segmented to some degree.
Figure 4. Correlation: Asia-Pacific (ex-Japan) vs Japan1
0.00
0.10
0.20
0.30
0.40
0.50
0.60
0.70
0.80
Jan-92
Jul-92
Jan-93
Jul-93
Jan-94
Jul-94
Jan-95
Jul-95
Jan-96
Jul-96
Dec-96
Jul-97
Dec-97
Jun-98
Dec-98
Jun-99
Dec-99
Jun-00
Dec-00
Jun-01
Dec-01
Jun-02
Dec-02
Jun-03
Dec-03
1 52-week rolling correlation.
Source: Bloomberg and staff calculations.
- 15 -
It appears that investors tend to reallocate within the individual regional funds and the emerging markets funds group during both periods, as evidenced by the opposite signs of the respective coefficients in each table. Interestingly, retail investor allocation behavior appears to have changed somewhat between the pre- and post-crisis periods. Notably, these investors appear to have become more discriminating in assessing the individual regions separately following the crisis, instead of just viewing emerging markets as a single asset class. For instance, there appears to have been, in aggregate, a reallocation from emerging market funds to individual regional funds, post-crisis. Moreover, changes in net flows to individual regional funds seem to have had a greater positive impact on their corresponding equity markets post-crisis, compared to the pre-crisis period. Allocations by U.S. retail investors to crossover equity funds also appear to have a significant impact on emerging market returns, across both sub-periods. Our findings also suggest that portfolio managers’ decisions are largely driven by retail investor decisions. The relatively short lags (within 2 weeks) between the changes in net fund flows and their apparent effect—direct or otherwise—on emerging equity markets provide evidence that portfolio managers react quite rapidly to allocation decisions by retail investors.
VI. CONCLUSION
Among institutional investors, a defining feature of the mutual fund is that underlying investors exert a much greater degree of control in the institution’s investment decisions in the short-term, via injections or redemptions. Meanwhile, one of the main concerns for emerging markets is that foreign institutional investors—such as mutual funds—may have the ability to cause significant volatility in local capital markets as a result of their asset reallocation decisions. In this paper, we examine the impact of allocation decisions by U.S. retail investors of mutual funds, in emerging equity markets. Using a VAR model, we find that allocation decisions by retail investors involving Emerging Markets, Europe and U.S. equity funds tend to affect the volatility of returns in emerging equity markets. Notably, innovations in net flow changes to mature Europe equity funds are more important for the volatility in both the Asia-Pacific (ex-Japan) and Latin America markets compared to the variability in the dedicated (emerging market) regional funds. This suggests that variability in reallocations into and out of these mature market funds provide a better indication of the volatility in emerging markets, than any activity in the specific-region funds. The trend in U.S. retail investor allocations between the pre- and post-crisis periods seems to suggest that investors have become more discriminating in assessing the individual emerging market regions. The performance in the emerging equity market asset class appears to be increasingly driven by flows to individual regions, rather than to emerging markets as a whole. We also find the suggestion of investor segmentation between Japan and other Asia equity markets. Furthermore, allocations by U.S. retail investors to crossover funds appear to

- 16 -
have a significant impact on emerging market returns. Finally, our findings also confirm that fund managers’ actions are driven by retail investor allocations, and usually within a two-week period, as evident in the impact of retail flow changes on emerging equity market returns.
- 17 -
Table 2. Emerging Markets: VAR and Variance Decomposition Estimates of Equity Return Equations—Pre- and Post-Crisis Periods
Long Term Impact on Dependent Variable
Panel A: Pre-Crisis Period 0 1 2 3 4 (In percent)
Dependent variable, weekly returnsMSCI Emerging Markets Free Index 0.119 -0.053 -0.034 -0.039 17.993
(2.021) (-0.866) (-0.554) (-0.646)Net flows to mutual funds, weekly changesEmerging markets 0.159 -0.086 -0.033 0.103 0.008 14.752
(1.802) (-1.000) (-0.385) (1.179) (0.097)Asia-Pacific (ex-Japan) -0.127 0.064 -0.017 -0.033 0.009 0.186
(-1.770) (0.909) (-0.252) (-0.479) (0.138)Latin America -0.014 0.003 -0.004 -0.008 -0.002 4.272
(-1.222) (0.316) (-0.365) (-0.730) (-0.174)United States -0.037 -0.303 -0.160 0.022 -0.400 26.611
(-0.181) (-1.528) (-0.773) (0.113) (-2.055)Europe -0.041 -0.088 0.061 -0.052 -0.166 28.448
(-0.638) (-1.437) (0.997) (-0.849) (-2.719)Japan -0.004 0.023 0.015 -0.009 0.004 0.116
(-0.191) (1.215) (0.801) (-0.514) (0.199)Global 0.445 -0.095 -0.198 0.078 0.037 0.469
(2.879) (-0.608) (-1.268) (0.507) (0.241)International 0.042 0.030 -0.006 0.057 0.002 0.451
(1.172) (0.839) (-0.167) (1.669) (0.067)United States Treasuries -0.108 0.035 -0.010 0.048 -0.111 4.976
(-1.129) (0.363) (-0.108) (0.514) (-1.211)United States Money Markets -0.091 -0.015 0.027 0.008 0.035 1.725
(-1.941) (-0.322) (0.569) (0.165) (0.736)
Panel B: Post-Crisis Period
Dependent variable, weekly returnsMSCI Emerging Markets Free Index 0.227 -0.020 -0.005 0.045 2.151
(4.148) (-0.362) (-0.092) (0.788)Net flows to mutual funds, weekly changesEmerging markets 0.062 -0.181 -0.005 -0.085 -0.083 27.638
(0.612) (-1.732) (-0.046) (-0.820) (-0.798)Asia-Pacific (ex-Japan) -0.064 0.056 -0.019 0.019 -0.005 7.513
(-1.316) (1.121) (-0.384) (0.381) (-0.107)Latin America 0.043 0.058 0.063 0.046 0.002 3.552
(1.175) (1.667) (1.818) (1.304) (0.047)United States -0.298 0.427 0.061 -0.175 -0.104 15.239
(-1.080) (1.508) (0.217) (-0.605) (-0.371)Europe 0.106 0.013 0.023 -0.098 0.049 8.322
(2.096) (0.268) (0.485) (-1.967) (0.937)Japan 0.006 0.005 0.029 0.002 0.006 3.105
(0.245) (0.244) (1.343) (0.106) (0.263)Global -0.057 -0.038 -0.229 0.136 -0.059 2.891
(-0.251) (-0.171) (-1.098) (0.618) (-0.266)International -0.013 0.049 0.032 -0.008 0.032 0.016
(-0.108) (0.423) (0.275) (-0.067) (0.275)United States Treasuries -0.011 0.017 0.007 -0.009 0.044 15.532
(-0.465) (0.688) (0.290) (-0.375) (1.796)United States Money Markets -0.025 -0.017 -0.032 0.030 0.049 14.041
(-0.575) (-0.395) (-0.778) (0.730) (1.131)
Note: t-statistics in parentheses; critical values: 1.645, 1.96, and 2.576 at 10 percent, 5 percent, and 1 percent significance levels.Souce: AMG and authors' calculations.
Lags

- 18 -
Table 3. Asia-Pacific (ex-Japan): VAR and Variance Decomposition Estimates of Equity Return Equations—Pre- and Post-Crisis Periods
Long Term Impact on Dependent Variable
Panel A: Pre-Crisis Period 0 1 2 3 4 (In percent)
Dependent variable, weekly returnsMSCI Asia-Pacific (ex-Japan) Index -0.152 0.007 -0.059 -0.061 0.450
(-2.501) (0.113) (-0.968) (-1.009)Net flows to mutual funds, weekly changesEmerging markets 0.219 -0.214 0.390 0.102 -0.031 44.407
(1.124) (-1.138) (2.127) (0.536) (-0.163)Asia-Pacific (ex-Japan) 0.225 0.211 -0.304 -0.041 0.150 6.900
(1.441) (1.364) (-2.036) (-0.269) (0.990)Latin America -0.086 0.059 -0.011 0.016 0.035 2.177
(-3.387) (2.405) (-0.448) (0.653) (1.372)United States 1.183 -0.373 0.052 -0.446 0.502 16.911
(2.675) (-0.850) (0.114) (-1.029) (1.163)Europe 0.142 -0.137 0.200 0.172 -0.093 0.753
(1.030) (-1.043) (1.486) (1.287) (-0.696)Japan 0.000 0.056 -0.059 0.001 0.055 7.710
(0.010) (1.394) (-1.469) (0.027) (1.382)Global -0.358 0.250 0.032 -0.184 -0.233 11.430
(-1.078) (0.751) (0.096) (-0.553) (-0.711)International -0.321 -0.180 -0.008 0.016 -0.164 2.796
(-4.110) (-2.314) (-0.105) (0.203) (-2.147)United States Treasuries 0.237 -0.050 -0.253 0.136 -0.010 2.063
(1.124) (-0.237) (-1.220) (0.655) (-0.050)United States Money Markets 0.201 0.052 0.047 -0.019 -0.120 4.405
(1.968) (0.510) (0.470) (-0.181) (-1.159)
Panel B: Post-Crisis Period
Dependent variable, weekly returnsMSCI Asia-Pacific (ex-Japan) Index 0.083 0.000 0.144 -0.129 0.046
(1.465) (0.003) (2.559) (-2.379)Net flows to mutual funds, weekly changesEmerging markets 0.321 -1.293 -0.475 0.262 0.409 39.516
(0.788) (-3.099) (-1.127) (0.619) (0.971)Asia-Pacific (ex-Japan) 0.308 0.932 0.433 -0.202 -0.158 6.875
(1.587) (4.674) (2.132) (-0.979) (-0.782)Latin America -0.228 0.386 -0.209 0.005 -0.044 0.049
(-1.589) (2.789) (-1.495) (0.033) (-0.306)United States 2.986 -0.903 1.222 0.378 -0.132 7.346
(2.766) (-0.809) (1.105) (0.327) (-0.117)Europe -0.361 0.087 -0.217 0.237 -0.207 39.055
(-1.818) (0.445) (-1.148) (1.217) (-1.022)Japan 0.137 0.008 0.108 -0.019 0.106 4.413
(1.516) (0.092) (1.273) (-0.227) (1.189)Global 0.005 0.164 -0.862 -0.725 0.251 0.003
(0.005) (0.187) (-1.048) (-0.834) (0.287)International -0.307 -1.086 -0.057 -0.627 0.240 0.700
(-0.665) (-2.417) (-0.123) (-1.390) (0.516)United States Treasuries -0.019 -0.161 -0.205 -0.057 0.005 1.011
(-0.196) (-1.652) (-2.098) (-0.580) (0.046)United States Money Markets 0.272 -0.204 0.162 -0.065 0.040 0.987
(1.621) (-1.239) (0.989) (-0.396) (0.234)
Note: t-statistics in parentheses; critical values: 1.645, 1.96, and 2.576 at 10 percent, 5 percent, and 1 percent significance levels.Souce: AMG and authors' calculations.
Lags

- 19 -
Table 4. Latin America: VAR and Variance Decomposition Estimates of Equity Return Equations—Pre- and Post-Crisis Periods
Long Term Impact on Dependent Variable
Panel A: Pre-Crisis Period 0 1 2 3 4 (In percent)
Dependent variable, weekly returnsMSCI Latin America Index 0.126 0.000 0.012 -0.083 13.415
(2.120) (0.006) (0.192) (-1.362)Net flows to mutual funds, weekly changesEmerging markets 0.188 -0.070 -0.168 0.113 0.110 22.676
(1.315) (-0.509) (-1.233) (0.806) (0.800)Asia-Pacific (ex-Japan) -0.158 0.096 0.002 -0.029 -0.038 0.056
(-1.351) (0.836) (0.014) (-0.257) (-0.341)Latin America -0.018 0.006 -0.003 -0.012 -0.004 4.958
(-0.965) (0.309) (-0.167) (-0.686) (-0.202)United States -0.114 -0.561 -0.384 0.053 -0.460 21.383
(-0.346) (-1.740) (-1.146) (0.165) (-1.456)Europe -0.090 -0.140 0.101 -0.112 -0.261 28.829
(-0.864) (-1.409) (1.005) (-1.136) (-2.631)Japan -0.016 0.022 0.029 -0.005 0.005 0.144
(-0.503) (0.729) (0.958) (-0.178) (0.172)Global 0.731 -0.230 -0.323 0.175 0.085 0.064
(2.900) (-0.898) (-1.274) (0.695) (0.346)International 0.091 0.076 -0.033 0.072 -0.035 0.058
(1.572) (1.320) (-0.565) (1.282) (-0.644)United States Treasuries -0.095 0.128 0.008 0.121 -0.259 7.715
(-0.610) (0.825) (0.055) (0.788) (-1.735)United States Money Markets -0.119 -0.002 0.057 -0.014 0.017 0.702
(-1.566) (-0.031) (0.746) (-0.178) (0.216)
Panel B: Post-Crisis Period
Dependent variable, weekly returnsMSCI Latin America Index 0.098 -0.018 -0.039 0.056 0.015
(1.771) (-0.331) (-0.700) (1.026)Net flows to mutual funds, weekly changesEmerging markets 0.043 -0.419 0.176 -0.033 -0.200 12.337
(0.280) (-2.629) (1.100) (-0.205) (-1.256)Asia-Pacific (ex-Japan) -0.050 0.120 0.008 0.050 0.014 1.313
(-0.671) (1.585) (0.112) (0.665) (0.182)Latin America 0.096 0.043 0.078 0.028 0.032 4.478
(1.743) (0.807) (1.484) (0.528) (0.592)United States -0.257 0.260 -0.032 -0.054 0.082 26.837
(-0.608) (0.607) (-0.074) (-0.122) (0.192)Europe -0.011 -0.017 0.041 0.021 0.179 23.255
(-0.136) (-0.219) (0.556) (0.277) (2.285)Japan -0.007 0.050 0.029 0.009 0.007 3.382
(-0.207) (1.527) (0.895) (0.272) (0.205)Global 0.187 0.431 -0.740 -0.362 -0.129 14.457
(0.546) (1.287) (-2.334) (-1.071) (-0.382)International 0.127 -0.334 0.331 0.225 0.028 0.503
(0.705) (-1.925) (1.867) (1.290) (0.157)United States Treasuries -0.039 0.038 0.015 -0.050 0.055 11.285
(-1.046) (1.000) (0.392) (-1.300) (1.489)United States Money Markets -0.062 0.055 -0.073 0.136 0.073 2.136
(-0.949) (0.861) (-1.142) (2.149) (1.110)
Note: t-statistics in parentheses; critical values: 1.645, 1.96, and 2.576 at 10 percent, 5 percent, and 1 percent significance levels.Souce: AMG and authors' calculations.
Lags
- 20 -
References
Borensztein, Eduardo, and Gaston Gelos, 2003a, “A Panic-Prone Pack? The Behavior of
Emerging Market Mutual Funds,” IMF Staff Papers, Vol. 50, pp. 43–63. Borensztein, Eduardo, and Gaston Gelos, 2003b, “Leaders and Followers: Emerging Market
Fund Behavior during Tranquil and Turbulent Times,” Emerging Markets Review, Vol. 4. pp. 25–38.
Edison, Hali, and Francis Warnock, 2003, “U.S. Investors’ Emerging Market Equity
Portfolios: A Security-Level Analysis,” IMF Working Paper No. 03/238 (Washington: International Monetary Fund).
Hasbrouck, Joel, 1991a, “Measuring the Information Content of Stock Trades,” Journal of
Finance, Vol. 46, pp. 179–207. _____, 1991b, “The Summary Informativeness of Stock Trades: An Econometric Analysis,”
Review of Financial Studies, Vol. 4, pp. 571–95. Hamilton, James D., 1994, Time Series Analysis (Princeton: Princeton University Press). Kaminsky, Graciela, Richard K. Lyons and Sergio Schmukler, 2000, “Managers, Investors
and Crises: Mutual Fund Strategies in Emerging Markets,” NBER Working Paper No. 7855 (Cambridge, Massachusetts: National Bureau of Economic Research).
Kaminsky, Graciela, Richard Lyons, and Sergio Schmukler, 2001, “Mutual Fund Investment
in Emerging Markets: An Overview,” The World Bank Economic Review, Vol. 15, pp. 315–40.
Karolyi, Andrew, and Rene Stulz, 2002, “Are Financial Assets Priced Locally or Globally?”
NBER Working Paper No. 8994 (Cambridge, Massachusetts: National Bureau of Economic Research).
Kim, Woochan, and Shang-Jin Wei, 2002, “Foreign Portfolio Investors Before and During a
Crisis,” Journal of International Economics, Vol. 56, pp. 75–96. Lewis, Karen, 1999, “Trying to Explain the Home Bias in Equities and Consumption,”
Journal of Economic Literature, Vol. 37, pp. 571–608. Ong, Li Lian and Amadou Sy, 2004, “The Role of Mature Market Mutual Funds in Emerging
Markets: Myth or Mayhem?” IMF Working Paper No. 04/133 (Washington: International Monetary Fund).
- 21 -
Post, Mitchell, and Kimberlee Millar, 1998, “U.S. Emerging Market Equity Funds and the 1997 Crisis in Asian Financial Markets,” Perspective, Vol. 4, pp. 1–11 (Washington: Investment Company Institute).
Rea, John, “U.S. Emerging Market Funds: Hog Money or Stable Source of Investment
Capital?” Perspective, Vol. 2, pp. 1–14 (Washington: Investment Company Institute). Rea, John, and Richard Marcis, 1996, “Mutual Fund Shareholder Activity during U.S. Stock
Market Cycles,” Perspective, 2, pp. 1–16 (Washington: Investment Company Institute).