u.s. solar energy industry: national dynamics & state
TRANSCRIPT
December 14, 2017
www.seia.org
U.S. SOLAR ENERGY INDUSTRY: NATIONAL
DYNAMICS &STATE-LEVEL IMPACTS
Rick UmoffRegulatory Counsel and Director
State Affairs, SEIA

U.S. SOLAR INDUSTRY: SETTING THE STAGE
December 14, 2017 www.seia.org 2

The Grid Has Never Been More Diverse
December 14, 2017 www.seia.org 3
0%
10%
20%
30%
40%
50%
60%
70%
80%
90%
100%
1950 1953 1956 1959 1962 1965 1968 1971 1974 1977 1980 1983 1986 1989 1992 1995 1998 2001 2004 2007 2010 2013 2016
U.S. Electricity Generation, 1950 - 2016
Coal Oil Natural Gas Nuclear Hydro Solar Wind OtherSource: EIA

Grid Already Accommodates Large Penetration of Renewables
December 14, 2017 www.seia.org 4
•15 U.S. States already see solar & wind penetrations of 10% or above, with no reduction in reliability.
•Nationally, Solar & Wind represented 7% of total generation in 2016
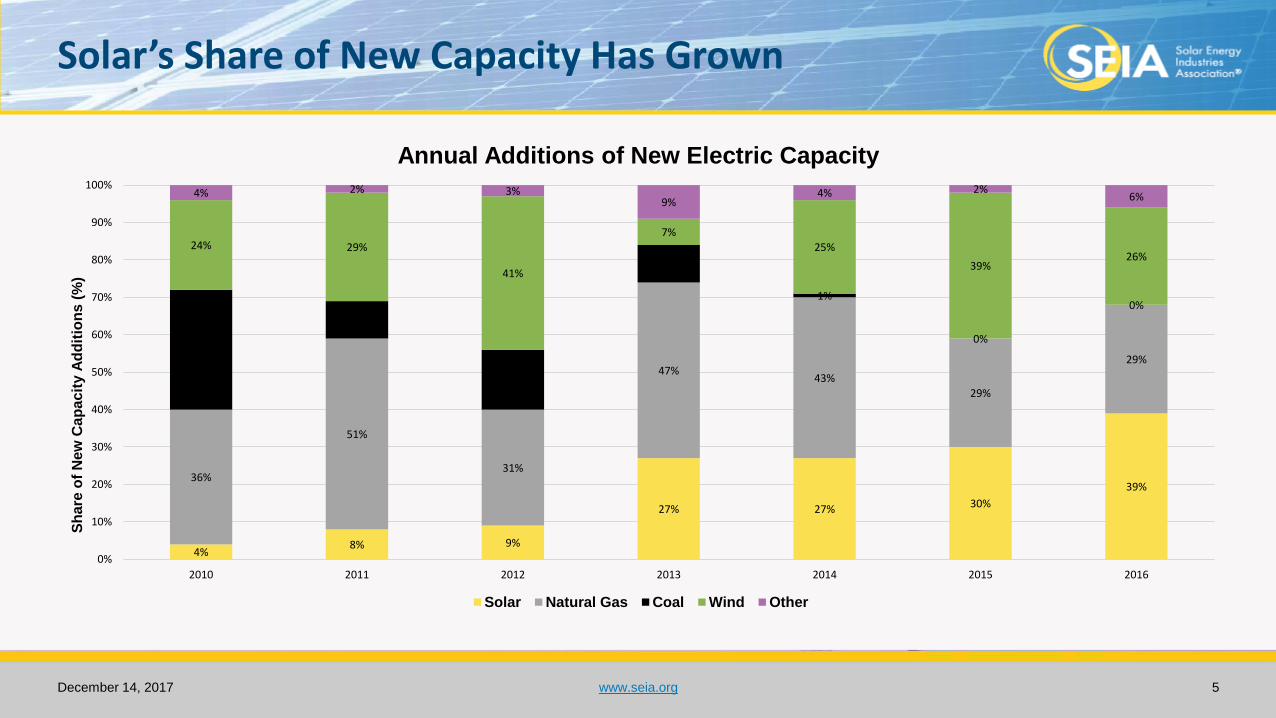
Solar’s Share of New Capacity Has Grown
December 14, 2017 www.seia.org 5
4%8% 9%
27% 27% 30%
39%36%
51%
31%
47%43%
29%
29%32%
10%
16%
10%
1%
0%
0%
24% 29%
41%
7%25%
39%26%
4% 2% 3%9%
4% 2%6%
0%
10%
20%
30%
40%
50%
60%
70%
80%
90%
100%
2010 2011 2012 2013 2014 2015 2016
Sh
are
of
Ne
w C
ap
acit
y A
dd
itio
ns
(%
)
Annual Additions of New Electric Capacity
Solar Natural Gas Coal Wind Other

The Solar Industry Today
December 14, 2017 www.seia.org 6
49.3 GW of solar installed through Q3 2017
9.5 millionEnough to power American homes
68% 10-year average annual growth rate
260,000Workers employed in the solar industry:
1.6 million individual installations nationwide

Deployment Forecast
December 14, 2017 www.seia.org 7
0
2,000
4,000
6,000
8,000
10,000
12,000
14,000
16,000
2010 2011 2012 2013 2014 2015 2016 2017E 2018E 2019E 2020E 2021E 2022E
Yearl
y I
nsta
lled
So
lar
Cap
acit
y (
MW
dc
)
U.S. Solar PV Deployment Forecast
Residential (PV) Non-residential (PV) Utility (PV)
• Total solar deployment will more than double over the next 5 years, reaching 100 GW by 2021

Prices have fallen by 10 – 18% over last 12 months
December 14, 2017 www.seia.org 8
$0.00
$0.50
$1.00
$1.50
$2.00
$2.50
$3.00
$3.50
$4.00
Q2 2014 Q3 2014 Q4 2014 Q1 2015 Q2 2015 Q3 2015 Q4 2015 Q1 2016 Q2 2016 Q3 2016 Q4 2016 Q1 2017 Q2 2017
$/w
att-
dc
Installed Solar PV Prices
Residential Non-Residential Utility-Scale (Fixed Tilt) Utility-Scale (Tracker)

Continuing to Create Jobs
December 14, 2017 www.seia.org 9

Solar Growth Coast to Coast
TOP 10 STATES (MW)
1. California – 20,163
2. North Carolina – 3,785
3. Arizona – 3,336
4. Nevada – 2,585
5. New Jersey – 2,234
6. Massachusetts – 1,898
7. Texas – 1,847
8. Utah – 1,566
9. Georgia – 1,505
10. New York – 1,176
December 14, 2017 www.seia.org 10
Source: SEIA/GTM Research

OPPORTUNITIES FOR STATES
December 14, 2017 www.seia.org 11

Solar and Wind are Price Competitive With All Other Energy Technologies
December 14, 2017 www.seia.org 12
•Map shows the cheapest electricity technology for each county in the United states.
•Utility-scale solar (purple) is the cheapest source of electricity in large portions of the Southwest, West Coast and Southeast
•Wind (light green) is cheapest throughout Midwest, Great Plains, Northeast

Helping Schools Save Money
• 5,500 K-12 schools have gone solar, more than twice as many as there were three years ago
December 14, 2017 www.seia.org 13
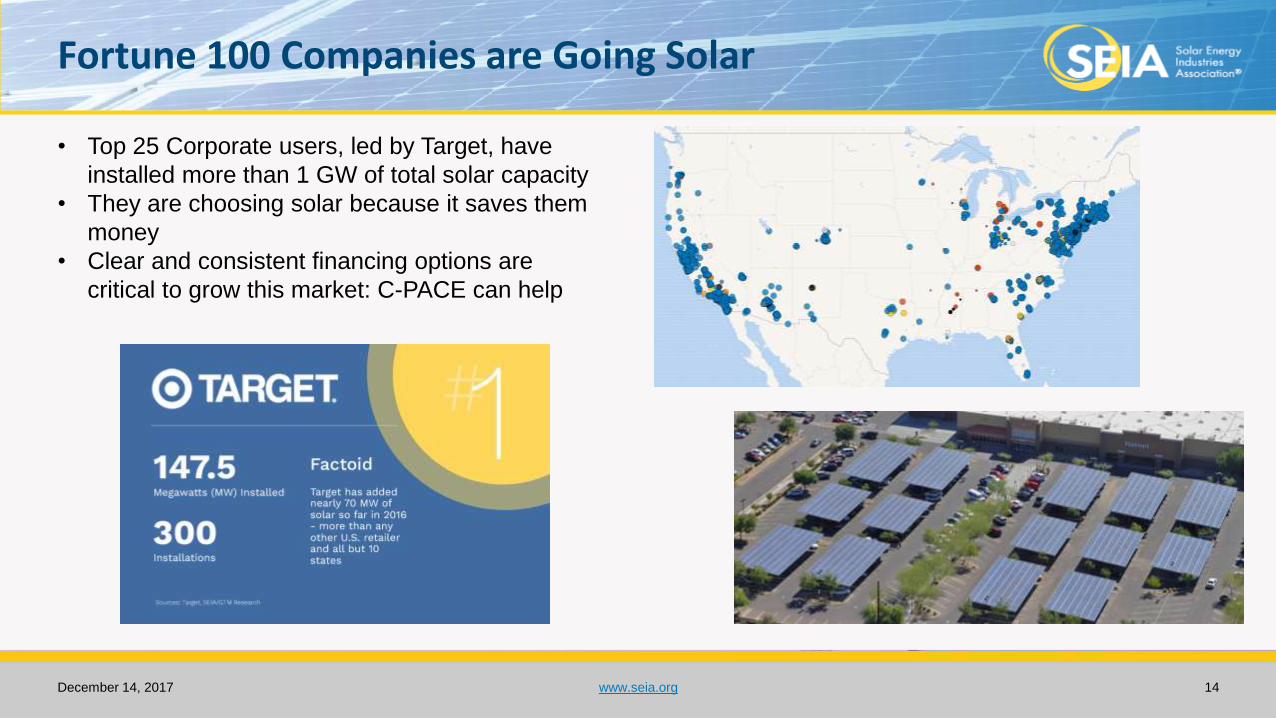
Fortune 100 Companies are Going Solar
December 14, 2017 www.seia.org 14
• Top 25 Corporate users, led by Target, have
installed more than 1 GW of total solar capacity
• They are choosing solar because it saves them
money
• Clear and consistent financing options are
critical to grow this market: C-PACE can help

RISKS & THREATS TO SOLAR GROWTH
December 14, 2017 www.seia.org 15

Net Metering
December 14, 2017 www.seia.org 16
• At the end of 2017, 36 states will be at grid parity for rooftop solar. If Net Metering export rate compensation is cut in half, only a handful will remain at grid parity
• We are committed to working with utilities to develop the next generation of net metering and rate design; consumers’ freedom to choose their energy is paramount

Reforming State Electricity Markets
December 14, 2017 www.seia.org 17
CA: Working toward sensible next-
generation solar policies in the
nation’s leading solar market.
FL: Looking ahead to 2018 now
that legislation has opened up
the market
NC: Second largest solar
state is jeopardized by harmful
PURPA proposals, rooftop
solar will continue to face
strong headwinds
MA: Fighting to get the
NEM caps raised once
again in the
Commonwealth to align
with the new incentive
program.
NV: Enacted new NEM policies
that will reopen the state’s
residential market. But,
challenges remain: Gov.
Sandoval vetoed important
community solar and RPS bills
NY: Continuing to engage with REV
process to maintain solar support and
develop successor tariffs for net
metering
TX: Advocate against demand
charges and interconnection
fees in the El Paso Electric rate
case, and efforts at the PUCT
and ERCOT to maintain fair
treatment of USP.
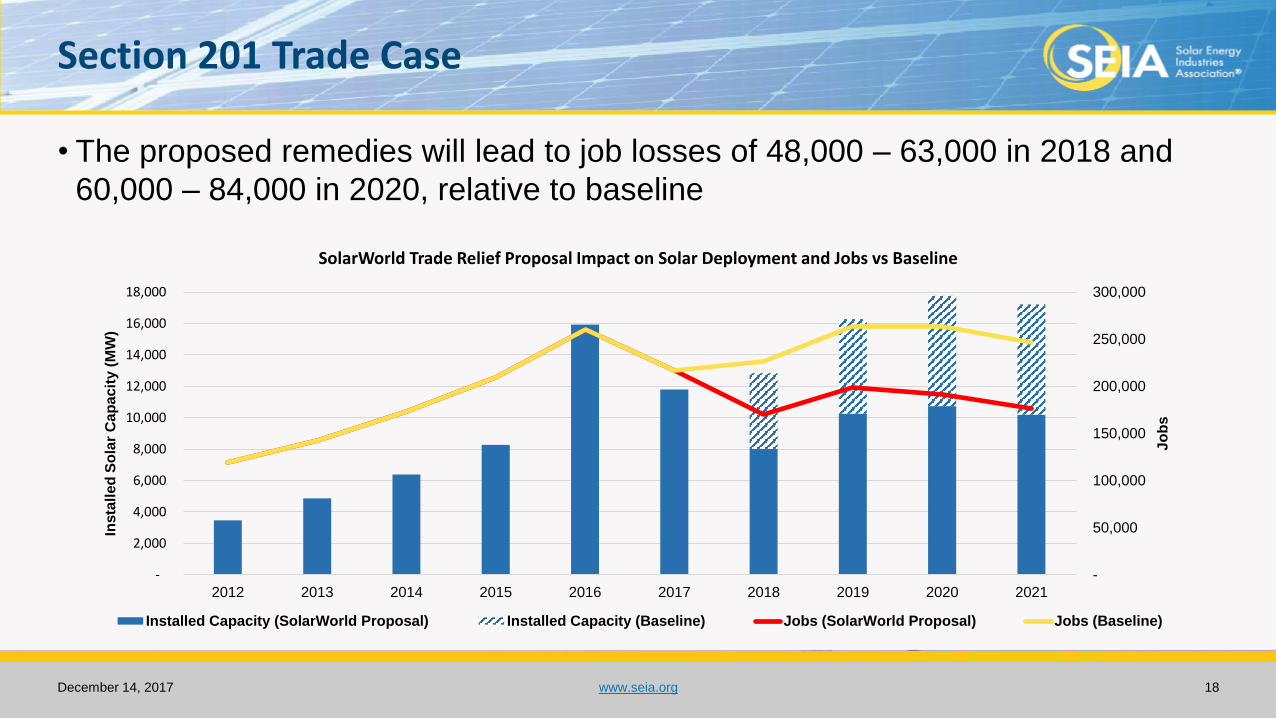
Section 201 Trade Case
December 14, 2017 www.seia.org 18
-
50,000
100,000
150,000
200,000
250,000
300,000
-
2,000
4,000
6,000
8,000
10,000
12,000
14,000
16,000
18,000
2012 2013 2014 2015 2016 2017 2018 2019 2020 2021
Jo
bs
Insta
lle
d S
ola
r C
ap
acit
y (
MW
)
SolarWorld Trade Relief Proposal Impact on Solar Deployment and Jobs vs Baseline
Installed Capacity (SolarWorld Proposal) Installed Capacity (Baseline) Jobs (SolarWorld Proposal) Jobs (Baseline)
• The proposed remedies will lead to job losses of 48,000 – 63,000 in 2018 and
60,000 – 84,000 in 2020, relative to baseline

Federal Tax Reform
• Preserving the solar Investment Tax Credit (ITC) is critical
• Also working to fight poison pill ‘BEAT’ tax provision, which would severely limit the viability of tax equity financing
December 14, 2017 www.seia.org 19

Federal Electricity Market Manipulation
• Federal Energy Regulatory Commission working to respond to DOE proposal regarding pricing for “grid resiliency”, which would essentially subsidize coal and nuclear power generation.
• This would stifle healthy competition in the energy industry
December 14, 2017 www.seia.org 20
THANK YOU
December 14, 2017 www.seia.org 21