u.s. solar ma rket insight executive summary · market from nearly 200 utilities, state agencies,...
TRANSCRIPT

Q2 2017
U.S. SOLAR MA RKET I NSIGHT
Executive SummaryQ2 2017

Contents
U.S. Solar Market Insight Q2 2017 │ 2
CONTENTS1. Introduction ..............................................................................................................................6
2. Photovoltaics...........................................................................................................................10
2.1. Market Segment Trends 122.1.1. Residential PV 12
2.1.2. Non-Residential PV 12
2.1.3. Utility PV 13
2.2. National Solar PV System Pricing 132.3. Component Pricing 172.4. Market Outlook 18

About the Report
U.S. Solar Market Insight Q2 2017 │ 3
ABOUT THE REPORTU.S. Solar Market Insight® is a quarterly publication of Wood Mackenzie, Limited, and the SolarEnergy Industries Association (SEIA)®. Each quarter, we collect granular data on the U.S. solarmarket from nearly 200 utilities, state agencies, installers and manufacturers. This data providesthe backbone of this U.S. Solar Market Insight® report, in which we identify and analyze trends inU.S. solar demand, manufacturing and pricing by state and market segment. We also use thisanalysis to look forward and forecast demand over the next five years. All forecasts are from WoodMackenzie, Limited; SEIA does not predict future pricing, bid terms, costs, deployment or supply.
References, data, charts and analysis from this executive summary should be attributed to“Wood Mackenzie, Limited/SEIA U.S. Solar Market Insight®.”
Media inquiries should be directed to Mike Munsell ([email protected]) at GTMResearch and Alex Hobson ([email protected]) at SEIA.
All figures are sourced from Wood Mackenzie, Limited. For more detail on methodology andsources, visit www.gtmresearch.com/solarinsight.
GTM Research partners with Clean Power Research to acquire project-level datasets fromparticipating utilities that utilize the PowerClerk product platform. For more information onClean Power Research’s product offerings, visit https://www.cleanpower.com/
Our coverage in the U.S. Solar Market Insight reports includes 40 individual states and Washington,D.C. However, the national totals reported include all 50 states, Washington, D.C., and Puerto Rico.
Detailed data and forecasts for 40 states and Washington, D.C. are contained within the full versionof this report, available at www.greentechmedia.com/research/ussmi.
Author’s Note: Revision to U.S. Solar Market Insight report title
GTM Research and SEIA have changed the naming convention for the U.S. Solar Market Insightreport series. Starting with the report released in June 2016 onward, the report title willreference the quarter in which the report is released, as opposed to the most recent quarter inwhich installation figures are tracked. The exception will be our “Year in Review” publication,which covers the preceding year’s installation volumes despite being released during the firstquarter of the current year.

About the Authors
U.S. Solar Market Insight Q2 2017 │ 4
ABOUT THE AUTHORSGTM Research | U.S. Research TeamAustin Perea, Solar Analyst (lead author)Cory Honeyman, Associate Director of U.S. SolarShayle Kann, Senior Vice PresidentAllison Mond, Solar AnalystMJ Shiao, Director of Solar ResearchJade Jones, Senior Solar AnalystScott Moskowitz, Senior Solar AnalystColin Smith, Solar AnalystBenjamin Gallagher, Solar Analyst
Solar Energy Industries Association | SEIAShawn Rumery, Director of ResearchAaron Holm, Data EngineerKatie O’Brien, Research AssociateJustin Baca, Vice President of Markets & Research

Key Figures
U.S. Solar Market Insight Q2 2017 │ 5
KEY FIGURES In Q1 2017, the U.S. market installed 2,044 MWdc of solar PV, a 2% decline year-over-year.
In Q1, solar ranked as the No. 2 source of new electric generating capacity additions broughton-line, totaling 30%.
Despite accounting for its lowest share of the residential market at 35%, California is still thelargest state market for residential PV, though contraction in the state was the primary driverbehind the national residential market falling 17% over Q1 2016.
Community solar continues to be a bright spot for non-residential PV with deployments inMinnesota, helping the segment grow nearly 30% over Q1 2016.
Installed system prices continue to drop across all market segments, with fixed-tilt utility-scalesystems dipping under the $1/watt barrier for the first time.
GTM Research forecasts that 12.6 GWdc of new PV installations will come on-line in 2017, down16% from a record-breaking 2016.
Total installed U.S. solar PV capacity is expected to nearly triple over the next five years. By 2022,over 17 GW of solar PV capacity will be installed annually.
Suniva’s filing of a Section 201 petition to impose trade remedies on foreign-manufactured cellsand modules threatens to significantly reduce PV installations across all segments if accepted inits current form. The nuances of this case are detailed in the Introduction below and will befurther outlined in a forthcoming research note from GTM Research.

Introduction
U.S. Solar Market Insight Q2 2017 │ 6
1. INTRODUCTIONIn Q1 2017, the U.S. solar market installed 2,044 megawatts direct current (MWdc), following anunprecedented year of more than 15 GWdc installed in 2016. As was the case in 2016, Q1 2017 sawmore than half of capacity additions come from the utility PV segment, which added more than 1GWdc for the sixth consecutive quarter.
Figure 1.1 U.S. Quarterly PV Installations Q1 2012-Q1 2017
Source: SEIA/GTM Research
When accounting for all projects (both distributed and centralized), solar continues to drive agrowing portion of new electric generating capacity additions. Last year, solar ranked as the No. 1source of new capacity additions, largely due to the double-digit-gigawatt wave of utility PVinstallations that came on-line amidst prior uncertainty over the extension of the 30% federalInvestment Tax Credit. Building off that momentum, solar accounted for 30% of all new electricgenerating capacity installed in the U.S. in Q1 2017, ranking as the second-largest driver of capacityadditions across all fuel types.
0
1,000
2,000
3,000
4,000
5,000
6,000
7,000
Inst
alla
tions
(MW
dc)
Residential Non-Residential Utility

Introduction
U.S. Solar Market Insight Q2 2017 │ 7
Figure 1.2 New U.S. Electricity Generating Capacity Additions, 2010-Q1 2017
Source: GTM Research (solar) FERC (all other technologies)
In 2017, distributed solar is on track for a slowdown in growth across both residential and non-residential PV. In the residential PV segment, national residential solar companies continue to slowoperations and pursue profitable sales channels at the expense of growth. Equally important,segment-wide customer acquisition challenges are constraining growth in major state markets,with California expected to fall year-over-year for the first time this decade.
Meanwhile, factors including revisions to community solar programs rules, virtual net energymetering, and solar-friendly rate structures spurred a flurry of project development for non-residential PV in the second half of 2016. As we move further into 2017, a waning pipeline ofprojects still being grandfathered in under these programs, rates and incentives is expected tosupport incremental growth in 2017 for the non-residential PV segment.
Finally, the majority of utility solar installations slated for 2017 remain driven by projects thatpushed out their completion dates from 2016 as a result of the federal ITC extension. Utility solaris on the cusp of another boom in procurement, with the majority of utility solicitations focused onmaximizing the number of projects that can come on-line with a 30% federal ITC in 2019 or laterby leveraging commence-construction rules.
4% 8% 9%
27% 27% 30%39%
30%
36%
51%
31%
47% 43%29%
29%41%
32%
10%
16%
10%
1% 0%
24% 29%
41%
7%25%
39%26%
27%
4% 3% 4% 9% 5% 3% 6% 2%
0%
10%
20%
30%
40%
50%
60%
70%
80%
90%
100%
2010 2011 2012 2013 2014 2015 2016 Q1 2017
Shar
e of
New
Cap
acity
Add
ition
s (%
)
Solar Natural Gas Coal Wind Other

Introduction
U.S. Solar Market Insight Q2 2017 │ 8
But heading into 2018, uncertainty looms over the long-term outlook for U.S. solar, due to a newtrade dispute initiated by the domestic module and cell manufacturer Suniva. On May 23, 2017,the International Trade Commission announced that it would consider Suniva’s, petition underSection 201 of the Trade Act of 1974. This petition could result in “remedies to safeguard againstforeign-manufactured crystalline silicon photovoltaic products”, including import tariffs, volumelimitations, or other measures.
The ITC will make a determination of injury by Sept. 22, 2017, and if it finds injury (or threat ofinjury), it will recommend remedies by Nov. 13, 2017. President Trump could then accept, modifyor choose not to implement ITC’s recommended relief measures.
In its petition, Suniva is requesting relief against imports from all geographic sources. Suniva’s requestsinclude, but are not limited to, a minimum price on crystalline silicon PV modules (initially $0.78/W) anda tariff on cells (initially $0.40/W). These requirements would step down annually for three additionalyears. The tariff on imported cells would step down to $0.37/W, $0.34/W and then $0.33/W, while theminimum module price would step down to $0.72/W, $0.69/W and then $0.68/W.
Figure 1.3 Annual Base Case U.S. PV Installation Forecast, 2010-2022E
Source: GTM Research/SEIA
0
2,000
4,000
6,000
8,000
10,000
12,000
14,000
16,000
18,000
2010 2011 2012 2013 2014 2015 2016 2017E 2018E 2019E 2020E 2021E 2022E
Inst
alle
d Ca
paci
ty (M
Wdc
)
Residential PV Non-Residential PV Utility PV
Introduction
U.S. Solar Market Insight Q2 2017 │ 9
For reference, a $0.78/W price on modules would match 2012 levels for imported Chinese modulesand put average system costs at 2015 levels. In turn, while GTM Research expects 36 states to beat grid parity for rooftop solar at the end of 2017 under current conditions, 11 would fall out ofgrid parity if Suniva’s proposal were approved in H2 2017 and took effect next year.
Meanwhile, more than two-thirds of the current utility PV pipeline stems from projects that utilitiesprocured outside an RPS mandate, based on its cost-competitiveness with natural-gas alternatives.On top of that, more than 60% of the current pipeline comes from projects that signed PPAs in2016 onward. Those 11 GWdc that support the near-term outlook are also at risk of projectcancellation if module prices end up higher than developers’ assumptions when they initiallyoriginated contracts with utilities.
With the above in mind, it remains to be seen how the International Trade Commission will ultimatelyrule on the Section 201 filing – an additional layer of uncertainty lies in how President Trump will respondto the ITC’s recommendations. But if Suniva’s proposed minimum import price on modules and tariff onimported cells are approved, PV installations would significantly drop across all three market segments(further outlined in a forthcoming research note from GTM Research).
Photovoltaics
U.S. Solar Market Insight Q2 2017 │ 10
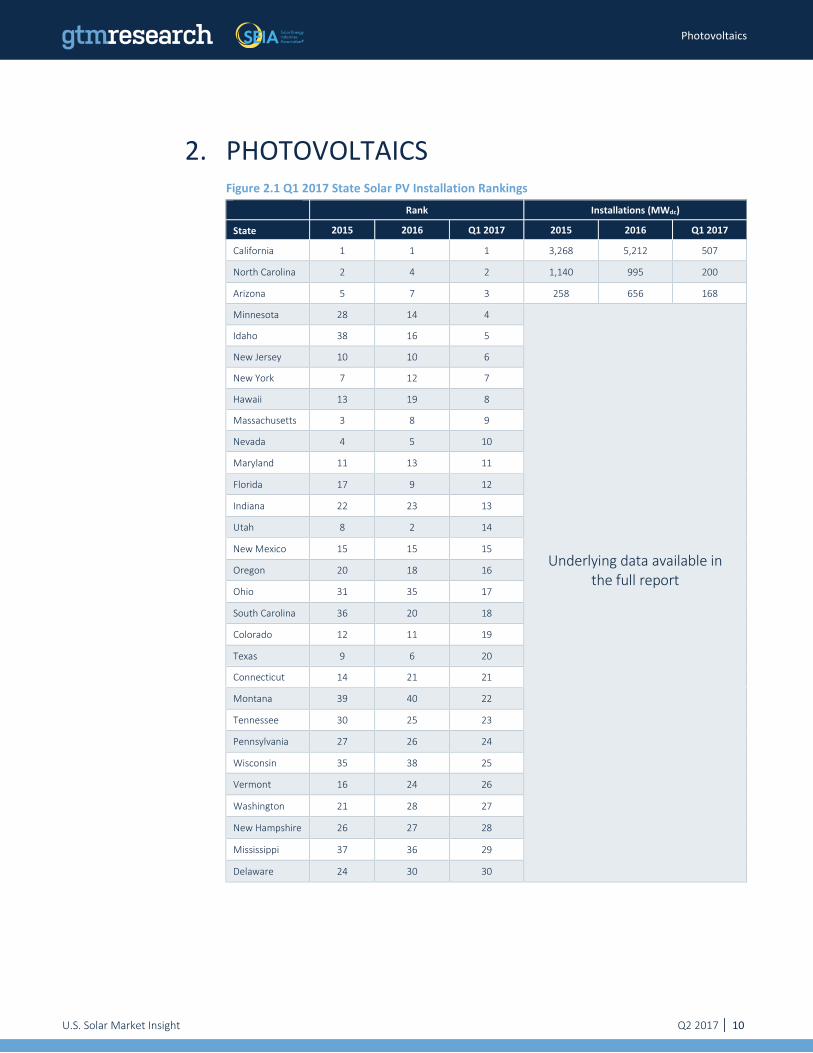
2. PHOTOVOLTAICSFigure 2.1 Q1 2017 State Solar PV Installation Rankings
Rank Installations (MWdc)
State 2015 2016 Q1 2017 2015 2016 Q1 2017
California 1 1 1 3,268 5,212 507
North Carolina 2 4 2 1,140 995 200
Arizona 5 7 3 258 656 168
Minnesota 28 14 4
Underlying data available inthe full report
Idaho 38 16 5
New Jersey 10 10 6
New York 7 12 7
Hawaii 13 19 8
Massachusetts 3 8 9
Nevada 4 5 10
Maryland 11 13 11
Florida 17 9 12
Indiana 22 23 13
Utah 8 2 14
New Mexico 15 15 15
Oregon 20 18 16
Ohio 31 35 17
South Carolina 36 20 18
Colorado 12 11 19
Texas 9 6 20
Connecticut 14 21 21
Montana 39 40 22
Tennessee 30 25 23
Pennsylvania 27 26 24
Wisconsin 35 38 25
Vermont 16 24 26
Washington 21 28 27
New Hampshire 26 27 28
Mississippi 37 36 29
Delaware 24 30 30

Photovoltaics
U.S. Solar Market Insight Q2 2017 │ 11
Rank Installations (MWdc)
State 2015 2016 Q1 2017 2015 2016 Q1 2017
Illinois 29 37 31
Underlying data available inthe full report
Iowa 33 34 32
Virginia 18 17 33
Washington,D.C.
32 31 34
Rhode Island 40 39 35
Louisiana 19 33 36
Missouri 23 29 37
Michigan 34 32 38
Georgia 6 3 39
Alabama 41 22 40
Arkansas 25 41 41

Photovoltaics
U.S. Solar Market Insight Q2 2017 │ 12
2.1. Market Segment Trends
2.1.1. Residential PV
Key Figures
563 MWdc installed in Q1 2017
Down 11% from Q4 2016
Down 17% from Q1 2016
For the first time since GTM Research has tracked the market, national installations fell on both aquarter-over-quarter and year-over-year basis. Much of this fall stems from California’s performance.California’s share of the market dropped to 35% in Q1 – its lowest quarterly share since GTM hascollected this data. Though California’s reduced quarterly installation volume is in part due to anunseasonably rainy winter, the reduced presence of top national installers in unprofitable geographiesis also partly to blame for this contraction. Additionally, an increasingly challenging customer acquisitionlandscape has played a part in California’s reduced installation volumes.
Other major market geographies also continue to struggle with many of the aforementioned issuesat a less severe scale. The Massachusetts, New York and Maryland markets all fell quarter-over-quarter, though New Jersey has shown resiliency among the major Northeast markets. Conversely,emerging state markets such as Utah, Texas and South Carolina continue to scale as nationalinstallers capture expiring incentives and tap into early-adopter customers. That said, continuedemerging market growth was not enough to offset weakness across major state markets.
2.1.2. Non-Residential PV 399 MWdc installed in Q1 2017
Down 34% from Q4 2016
Up 29% from Q1 2016
Coming off the largest quarter for non-residential PV on record, the segment fell on a quarter-over-quarter basis despite posting over 30% growth year-over-year. While Q4 2016 regulatory demandpull-in led to record-breaking installation volume and growth in the nation’s two largest non-residential markets – California and Massachusetts – both markets fell quarter-over-quarter inQ1, though New York still managed to post a record-breaking quarter. That said, the once-dormant community solar pipeline continues to materialize, as Minnesota nearly doubled itscumulative community solar deployment in Q1 2017.
Photovoltaics
U.S. Solar Market Insight Q2 2017 │ 13
2.1.3. Utility PV 1,082 MWdc installed in Q1 2017
6th consecutive quarter in which utility PV added over 1 GWdc
Contracted utility PV pipeline currently totals 21.7 GWdc
Utility PV continues to be the primary driver of installation growth in the U.S. solar market. A totalof 1.1 GWdc of utility PV projects came on-line in Q1 2017, accounting for 53% of PV capacityinstalled. A total of 4.7 GWdc of projects are in construction, and Q2 is expected to see over 2.0GWdc of projects come on-line. Consequently, 2017 will see an increase of 40% to 45% of annualinstalls in H1 in contrast to previous years in which H1 installations accounted for 30% to 35% oftotal annual installs.
In the near term, GTM Research’s 2017 utility PV deployment outlook has declined. A total of 199MWdc of projects that were thought to have spilled over into 2017 were later found to have comeon-line in Q4 2016. Additionally, several hundred megawatts of PURPA projects in the Carolinasand Oregon have faced interconnection delays and are now expected to spill over into 2018. Whileour 2018 forecast increased only slightly, GTM Research’s 2019 forecast has risen by over 11% to7.9 GWdc. This is due to several utilities announcing that they will procure additional projects for2019, as well as developers looking to safe-harbor projects in 2019 to capture the full 30% ITC andoffer the lowest possible PPA prices.
PURPA continues to be the largest driver of utility PV, accounting for 43% of new projects in 2017.With several utilities petitioning state utility commissions to change the implementation of PURPA,GTM Research believes PURPA development will begin to wane in early 2018. Voluntaryprocurement will overtake PURPA as the largest driver, as utilities, particularly in the Southeast,continue to procure solar as a hedge against natural-gas prices. Underlying these geographicdemand and procurement trends is the low-price environment for utility PV. Recent PPAs havebeen signed at prices between $35/MWh and $50/MWh.

Photovoltaics
U.S. Solar Market Insight Q2 2017 │ 14
Figure 2.2 U.S. Utility PV Pipeline
Source: GTM Research, U.S. Utility PV Market Tracker
25,840
17,087
36,3764,690
21,776
0
5,000
10,000
15,000
20,000
25,000
30,000
35,000
40,000
Operating Contracted (PPA Signed) Announced (Pre-Contract)
U.S
. Util
ity C
apac
ity (M
Wdc
)
In Construction

Photovoltaics
U.S. Solar Market Insight Q2 2017 │ 15
2.2. National Solar PV System PricingWe utilize a bottom-up modeling methodology to track and report national average PV system pricingfor the major market segments. Our bottom-up methodology is based on tracked wholesale pricingof major solar components and data collected from interviews with major installers.
Figure 2.3 Modeled U.S. National Average System Costs by Market Segment, Q1 2016 & Q1 2017
Note: Detailed information about national system prices by market segment and component is available in the full report
In Q1 2017, depending on the market segment, overall PV system pricing fell by as much as 6.2%.The segment with the largest price decline was the utility fixed-tilt sector. Total system pricingcontinues to trend downward across all market segments, much in the same manner it has sinceQ3 2015. Price declines of 6.2%, 5.9%, 4.0% and 1.7% occurred in the fixed-tilt utility, single-axistracking, non-residential and residential sectors, respectively.
This quarter continues a trend from Q2 2016 onward of a U.S. solar market impacted bytremendous change in system and component pricing. Again, primarily driven by the global moduledemand and supply imbalance, hardware markets produced aggressive component price declinesin Q1 2017. Hardware costs fell by 6%, 7%, 10% and 9% in the residential, non-residential, fixed-tiltand single-axis tracker market segments, respectively.
$0.00
$0.50
$1.00
$1.50
$2.00
$2.50
$3.00
$3.50
Resi Q12016
Resi Q12017
Non-ResiQ1 2016
Non-ResiQ1 2017
UtilityFixed-TiltQ1 2016
UtilityFixed TiltQ1 2017
UtilityTrackingQ1 2016
UtilityTrackingQ1 2017
Turn
key
Inst
alle
d Co
st ($
/Wdc
)
PV Module PV InverterElectrical BOS Structural BOSDirect Labor Design, Engineering, PermittingSupply Chain, Overhead, Margin
Photovoltaics
U.S. Solar Market Insight Q2 2017 │ 16
In Q1 2017, average pricing for residential rooftop systems landed at $2.84/Wdc – a 1.7% drop fromQ4 2016’s $2.89/Wdc. This occurred even while national and regional installers continue to reportlittle substantial success in cutting costs in the domains of operations and customer acquisition. Infact, customer acquisition costs have not changed in the past three quarters. As a result, soft costsstayed the same from Q4 2016 to Q1 2017.
The non-residential sector saw a 4.0% fall in pricing this past quarter. In Q1 2017, flat-roof non-residential system pricing landed at $1.56/Wdc from Q4 2016’s $1.62/Wdc. Like the rest of the market,aggressive module, inverter and racking prices constituted almost all of this system pricing drop.
Utility fixed-tilt and single-axis tracking projects in Q1 2017 saw average pricing of $0.99/Wdc
and $1.08/Wdc, respectively. That represents a respective 6.2% and 5.9% price reduction fromlast quarter. The utility fixed-tilt 6.2% quarter-over-quarter drop was the largest of all othermarket segments in Q1.

Photovoltaics
U.S. Solar Market Insight Q2 2017 │ 17
2.3. Component PricingPrice trends varied by component in Q1 2017, evidencing differences driven by component-leveldemand and inventory levels.
For polysilicon, the quarterly average price increased 12% quarter-over-quarter to $16.78/kgin Q1 2017. Strong price growth was driven by healthy demand, low inventory levels, andsuppliers’ push for higher prices.
Wafer prices stayed flat quarter-over-quarter, remaining at $0.15/W. Soft demand and pricepressure from buyers (cell and module producers) drove wafer price levels in Q1.
Cell prices fell 7% quarter-over-quarter to $0.20/W in Q1 2017. The drivers affecting waferprices also impacted cell prices. In addition, the ramp of new cell capacity put additionaldownward pressure on cell prices.
In the past few years, U.S. module price trends have largely been driven by antidumping andcountervailing duties on Chinese suppliers. But recently the main driver has shifted; currentmodule price trends are largely a result of supply-demand imbalance, with prices continuingto slump. During Q1, the quarterly average delivered price for Chinese producers rangedfrom $0.35/W for order volumes greater than 10 MW to $0.40/W for order volumes of lessthan 1 MW on the high side.
2.4 U.S. Polysilicon, Wafer, Cell, and Module Prices, Q1 2016-Q1 2017
Q1 2016 Q2 2016 Q3 2016 Q4 2016 Q1 2017Polysilicon($/kg) $14.17 $16.44 $15.29 $14.98 $16.78
Wafer ($/W) $0.21 $0.20 $0.15 $0.15 $0.15
Cell ($/W) $0.32 $0.30 $0.23 $0.21 $0.20
Module ($/W) $0.63 $0.59 $0.49 $0.39 $0.40
Source: GTM Research

Photovoltaics
U.S. Solar Market Insight Q2 2017 │ 18
2.4. Market OutlookAfter a record-breaking 2016, the near term will see relatively constrained growth compared towhat we’ve seen previously in both the utility and distributed generation sectors. DG continues toface an everchanging policy and customer acquisition landscape, while the utility sector will seekto reset as it builds out the ITC pipeline and restarts the origination process.
Altogether, the overall U.S. solar market is expected to drop 16% on an annual basis as utility PVprojects decline relative to the massive utility PV pipeline build-out witnessed in 2016. In 2017, theresidential and non-residential PV markets are both expected to experience year-over-year growth,though not without their own respective challenges. The near-term national outlook for residentialPV is marked by a competitive landscape that is increasingly feeling the effects of national installerstrimming back operations to focus on profitability, while non-residential PV contends with achallenging regulatory landscape. Despite build-out falling on an annual basis, the utility PVsegment is still expected to see over 8 GWdc in 2017 – nearly double what was installed in 2015 –as ITC spillover drives significant utility PV deployment.
In 2018, residential PV continues to grow at a limited pace as major market installers seek to find moreefficient means of customer acquisition and large national players reorient sales strategies, while emergingstate markets begin to contribute a growing share of the residential market. However, 2018 marks the yearin which the non-residential market will begin to feel the effects of regulatory and policy constraints thatwill lead to an annual decline in non-residential deployment. Though 2018 will stand as a relatively lowinstallation year for utility PV, project origination will benefit the post-2019 outlook as procurementmechanisms outside of renewable portfolio standards drive an increasing majority of the market.
By 2019, U.S. solar is expected to resume year-over-year growth across all market segments. Andby 2022, 28 states in the U.S. will be 100+ MWdc annual solar markets, with 25 of those states beinghome to more than 1 GWdc of operating solar PV.
However, downside risk looms over the long-term outlook for U.S. solar, due to a new trade disputeinitiated by the domestic-based module and cell manufacturer Suniva. As mentioned, Suniva’srequests include, but are not limited to, a minimum price on crystalline silicon PV modules (initially$0.78/W) and a tariff on cells (initially $0.40/W).
While it remains unclear how the International Trade Commission will ultimately rule on thispetition by Suniva, the approval of the petition as initially filed would result in substantial downsiderevisions to our forecast across all three segments. A $0.78/W price on modules would match2012-levels for imported Chinese modules and put system costs at 2015 levels. With a decisionexpected as early as H2 2017, GTM Research will continue to monitor the outcome of this petitionand its ultimate impact on solar deployment by state and segment.
Forecast details by state (40 states plus Washington, D.C.) and market segment through 2022 areavailable in the full report.

Photovoltaics
U.S. Solar Market Insight Q2 2017 │ 19
Figure 2.5 U.S. PV Installation Forecast, 2010-2022E
Source: GTM Research
Figure 2.6 U.S. PV Installation Forecast by Segment, 2010-2022E
Source: GTM Research
0
2,000
4,000
6,000
8,000
10,000
12,000
14,000
16,000
18,000
2010 2011 2012 2013 2014 2015 2016 2017E2018E2019E2020E2021E2022E
Insta
lled
Capa
city (
MW
dc)
Residential PV Non-Residential PV Utility PV
0%
10%
20%
30%
40%
50%
60%
70%
80%
90%
100%
2010 2011 2012 2013 2014 2015 2016 2017E 2018E 2019E 2020E 2021E
Insta
lled
Capa
city (
MW
dc)
Residential PV Non-Residential PV Utility PV

› Installations by market segment for
the top 40 states and Washington DC
› Installed cost by market segment
for each state
› State-by-state market analysis
› Component pricing across the
value chain
› Manufacturing capacity & production
by component
› Demand projections out to 2022 by
market segment & state
› National aggregate capacity additions
› National aggregate number of
installations
› National weighted average
installed price
› National aggregate manufacturing
production
U.S. Solar Market Insight™
U.S. Solar Market Insight™ brings high-quality, solar-specific analysis
and forecasts to industry professionals in the form of quarterly and annual reports.
These reports present market conditions, opportunities and outlooks for the photovoltaics (PV) and concentrating solar power (CSP) markets in the U.S. Primary data for the reports is collected directly from installers, manufacturers, state agencies and utilities. That data is analyzed to provide comprehensive upstream and downstream analysis on installations, costs, manufacturing, and market projections.
U.S. Solar Market Insight™ is offered quarterly in two versions– Executive Summary and Full Report. The Executive Summary is free, and the Full Report is available individually each quarter or as part of an annual subscription.
SEIA® and GTM Research Deliver the Most Comprehensive
U.S. Solar Market Analysis and Industry Data Available Today.
*Please find a more detailed content and pricing matrix on the reverse side of this page.
For more information on U.S. Solar Market InsightTM and to download this quarter’s free Executive Summary, visit www.gtmresearch.com/solarinsight or www.seia.org/cs/research/solarinsight
Solar Research Subscription Service
FULL REPORT
EXECUTIVE SUMMARY - FREE
Justin Freedman
Director, Research [email protected] + 1 617 500 6243

Installations + Market Analysis
› Shipments vs. Installations
› By Market Segment
› By State
› Number of Installations
Installed Price Manufacturing
› Polysilicon
› Wafers
› Cells
› Modules
› Active U.S. Manufacturing Plants
› Inverters
Component Pricing
› Polysilicon, Wafers, Cells and Modules
› Inverters
› PV Mounting Structures
Demand Projections
› By Market Segment
› By State
Subscribers to U.S. Solar Market Insight include:Photovoltaics (PV)
TABLE OF CONTENTS
Technology Firms
Component Manufacturers
BOS Providers
System Integrators
Residential Third-Party Financiers
Project Developers
Utilities & IPPs
Investors
WHO BUYS US SOLAR MARKET INSIGHT?
Executive SummaryFull Report (Pdf Enterprise License)
Individual Quarterly Report Annual Subscription - 4 Reports
SEIA® Members Free $1,995 $5,995
Non-SEIA® Members Free $3,995 $9,995
Justin Freedman
Director, Research [email protected] + 1 617 500 6243
For more information on U.S. Solar Market InsightTM and to download this quarter’s free Executive Summary, visit www.gtmresearch.com/solarinsight or www.seia.org/cs/research/solarinsight
Solar Research Subscription Service