us unconventional gas plays: estimated ultimate recovery (eur) mean eur for us shale... ·...
TRANSCRIPT

1
US unconventional gas plays:Estimated Ultimate Recovery (EUR)
David SmytheAugust 2014
Aim: to get a global mean figure for the EUR of a shale oil well, which might be applicable to the UK.
Problems include:•Sourcing reliable figures•Matching USGS play definitions to more informal names.
For example, the ‘Marcellus’ shale gas play in an EIA report of 2011 includes the main Interior Marcellus and the minor Western Margin Marcellus, but not the Fold Belt Marcellus. These are the standard Assessment Unit names used by the USGS; shapefiles are available for plotting their locations. For the purpose of comparison I equated the EIA ‘Marcellus’ with just the main Interior Marcellus. Omitting the Western Margin play makes little difference to the comparison, as so few wells have been drilled there.
The five main plays analysed – Barnett, Haynesville, Woodford, Fayetteville and Marcellus – conform to the single main assessment unit in each basin.

2
This is a table published in the Oil & Gas Journal in December 2012 (ref. 1). To calculate a mean EUR for the five plays I weighted each play by the value for estimated recoverable gas (ERG). This gives a mean of 1.73 bcf/well. But in 2012 the USGS used a probably more sophisticated method to estimate EURs, uniformly applied over 26 assessment units (AU). The paper was not quoted by the Oil & Gas Journal.

3
The EIA published a review of shale gas and oil plays in July 2011 (ref. 2). Essentially it is a review for the EIA by INTEK dated December 2010.
I have inserted the ERG figures from the Oil & Gas Journal table (previous slide) for comparison (yellow column).
The five main plays withUSGS AU number, in order of decreasing play maturity:
Woodford 50580161Haynesville 50490161Barnett 50450161Fayetteville 50620362Marcellus 50670468
4
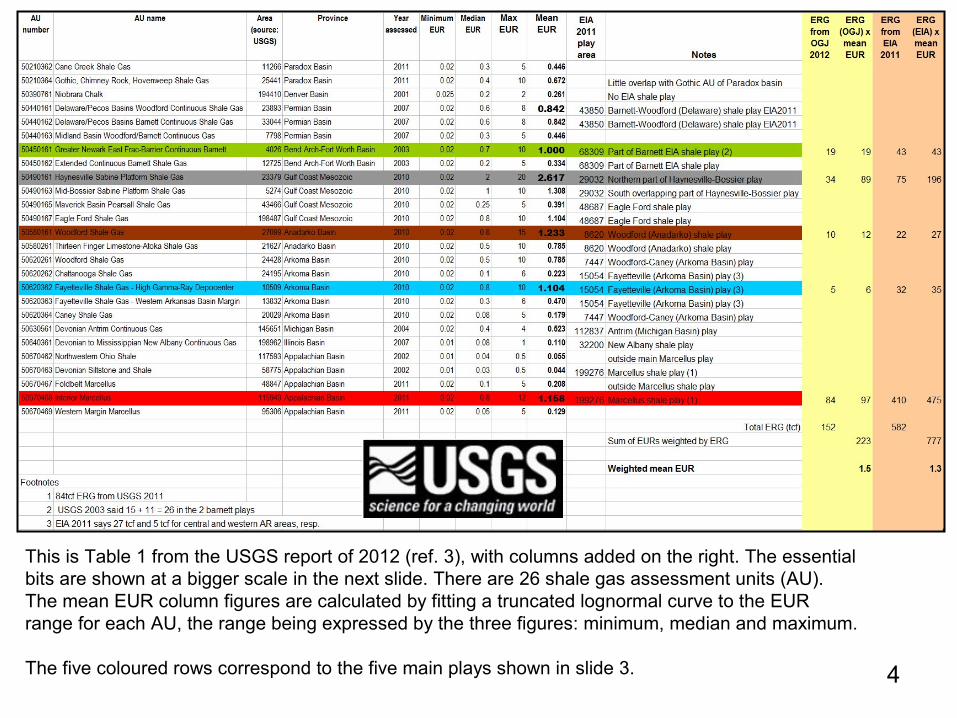
This is Table 1 from the USGS report of 2012 (ref. 3), with columns added on the right. The essential bits are shown at a bigger scale in the next slide. There are 26 shale gas assessment units (AU). The mean EUR column figures are calculated by fitting a truncated lognormal curve to the EUR range for each AU, the range being expressed by the three figures: minimum, median and maximum.
The five coloured rows correspond to the five main plays shown in slide 3.

5
Detail from previous table
The yellow pair of columns comprises the estimated recovery of gas from the Oil & Gas Journal table, multiplied by the USGS mean EUR. The flesh-coloured columns are the same but use the EIA/Intek ERGs from 2010-2011. The weighted mean EURs are 1.5 and 1.3, respectively.

6
The five main plays withUSGS AU number, in order of decreasing play maturity:
Woodford 50580161Haynesville 50490161Barnett 50450161Fayetteville 50620362Marcellus 50670468
The estimated ultimate recoveries (EUR) in tcf for a well in each play are much greater in the EIA dataset (left) than in the USGS dataset (below). The plays have been ordered by ascending EUR. The bars corresponding to the five main plays are coloured.

7
Discussion and conclusions
The EIA forecasts are more optimistic than those of the USGS, roughly by a factor of two.
Recent papers (ref. 4) by the industry-funded Bureau of Economic Geology of the University of Texas estimate more optimistic lifetime EURs (i.e. past and forecast) for the Barnett and Fayetteville plays. They also predict that the EUR of each will increase in the future, compared with the proven EUR of the past. By coincidence (or does it suggest a flaw in methodology?) both plays are currently at their peak production.
I suggest a ‘mean of means’ as a guide figure for guesstimating possible UK shale gas production, i.e. from the two figures 1.3 and 1.5 shown in slide 5 we arrive at:
EUR 1.4 bcf/well.
From the range of EURs shown for various US plays, it is possible that this figure could be out by a factor of two in either direction. On the other hand, the relative complexity of UK shale basin geology will tend to lower, rather than increase, this figure.

8
References
1. Sandrea, R. 2012. Evaluating production potential of mature US oil, gas plays. Oil & Gas Journal, 3 December 2012.
2. Energy Information Administration 2012. Review of emerging resources: U.S. shale gas and shale oil plays. July 2011.
3. USGS 2012. Variability of Distributions of Well-Scale Estimated Ultimate Recovery for
Continuous (Unconventional) Oil and Gas Resources in the United States. Open-File Report 2012–1118.
4. Bureau of Economic Geology studies:
Browning, J. et al. 2013a. Barnett shale model – 1. Study develops decline analysis, geologic parameters for reserves, production forecast. Oil & Gas Journal, 5 August, 2013, p. 62.
Browning , J. et al. 2013b. Barnett shale model - 2 (Conclusion) Barnett study determines full-field reserves, production forecast. Oil & Gas Journal, 2 September, 2013.
Browning , J. et al. 2014. Study develops Fayetteville shale reserves, production forecast. Oil & Gas Journal, 6 January 2014.