us - united states environmental protection agency · pdf file... compilation of air pollutant...
TRANSCRIPT

AP-42 Section Number: 12.10
Reference Number: 3
Title: Systems Analysis of Emissions and Emission Control in the Iron Foundry Industry, Volume 11:
APTD-0645
US EPA
February 1971
Exhibits
. .

SYSTEMS ANALYSIS OF EMISSIONS AND-EMISSIONS CONTROL IN THE IRON FOUNDRY INDUSTRY
VOLUME I1 EXHIBITS
FEBRUARY, 1971
FOR
Division of Process Control Engineering Air Pollution Control Office Environmental Protection Agency
Contract No. CPA 22-69-106
Prepared by A. T. Kearney & Company, Inc.
Chicago, Illinois
A . T. K E A R N E Y & C O M P A N Y . I N C .

I
Number
111-1
111-2
111-3
111-4
111-5
111-6
111-7
IV-1
IV-2
IV-3
IV-4
IV-5
IV-6
IV-7
IV-8
IV-9
IV- 10
VOLUME IT. - LIST OF EXHIBITS Title
Iron Foundry Production Trends
Population Trends in the Foundry Industry
Distribution of Iron Foundries, 1969
Geographical Distribution of Iron Foundries
Iron Foundry Cupola Trends
Iron Foundry Electric Furnace Trends
Characteristics and Sources of Emissions in Various Foundry Departments
Iron Foundry Process Flow
Process Flow Diagram - Gray, Ductile and Malleable Iron
Summary of Gray Iron Specifications
Summary of Ductile Iron Specifications
Summary of Malleable Iron Specifications
Iron Foundry Scrap Specifications
Pig Iron and Ferroalloy Specifications
Process Flow Diagram - Raw Material Storage and Charge Makeup
Process Flow Diagram - Melting Department Electric Arc Furnace - Heat and Material Balance
A. T. K E A R N E Y & C O M P A N Y . I N C .

Number
IV-11
IV-12
IV-13
IV-14
IV-15
IV-16
IV-17
IV-18
IV-19
IV-20
IV-21
IV-22
IV-23
IV-24
IV-25
IV-26
IV-27
Title
Coreless Induction Furnace - Heat and Material Balance
Process Flow Diagram - Molding, Pouring and Shakeout
Process Flow Diagram - Cleaning and Finishing
Process Flow Diagram - Sand Conditioning Process Flow Diagram - Coremaking Illustration of Conventional Lined Cupola
Illustration of Water-cooled Cupola
Illustration of Cupola Reaction Area
Illustration of Electric Arc Furnace
Illustration of Channel Induction Furnace
Illustration of Coreless Induction Furnace
Illustration of Reverberatory Furnace
Illustration of Magnesium Treatment Methods for Producing Ductile Iron
Illustration of Pouring Station with H%rizontal Draft, Cantilevered Hood
Illustration of Shakeout Station
Illustration of Sand Muller
Illustration of Blast Cleaning Unit
A. T. K E A R N E Y & C O M P A N Y , I N C .
Number
VI-1
VI-2
VI-3
VI-4
VI-5
VI-6
VI-7
VI-8
VI-9
VI-10
VI-11
VI-12
VI-13
VI-14
VI-15
VI-16
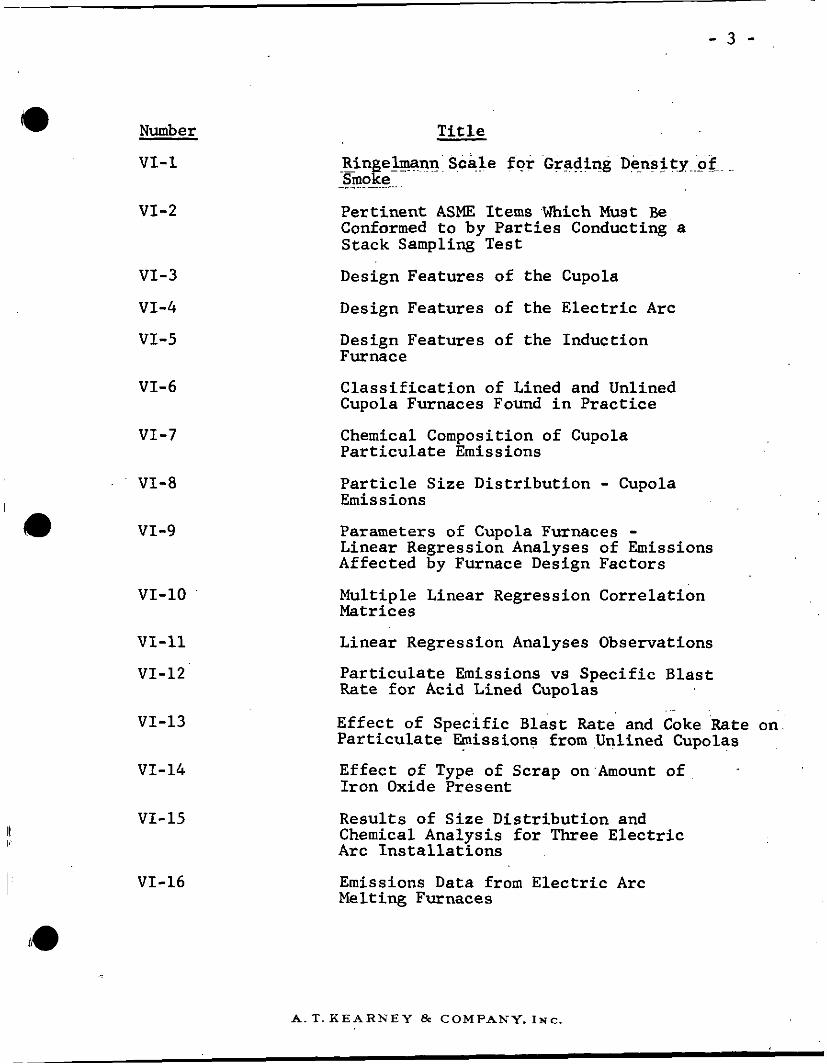
Title - .- RingeAenn: Scale f o r 'Grading Density.:of __ Smoke __. .
Pertinent ASME Items .Which Must Be Conformed to by Parties Conducting a Stack Sampling Test
Design Features of the Cupola
Design Features of the Electric Arc
Design Features of the Induction Furnace
Classification of Lined and Unlined Cupola Furnaces Found in Practice
Chemical Composition of Cupola Particulate Emissions
Particle Size Distribution - Cupola Emissions
Parameters of Cupola Furnaces - Linear Regression Analyses of Emissions Affected by Furnace Design Factors
Multiple Linear Regression Correlation Matrices
Linear Regression Analyses Observations
Particulate Emissions vs Specific Blast Rate for Acid Lined Cupolas
Effect of Specific Blast Rate and Coke Rate on Particulate Emissions from Unlined Cupolas
Effect of Type of Scrap on Amount of Iron Oxide Present
Results of Size Distribution and Chemical Analysis for Three Electric Arc Installations
Emissions Data from Electric Arc Melting Furnaces
A. T. K E A R N E Y & COMPANY. I N C .

~
- 4 -
Number
VI-17
VI-18
VI-19
VI-20
VI-21
VI-22
VI-23
VI-24
VII-1
VII-2
VII-3
VII-4
VII-5
VII-6
VII- 7
VII-8
VII-9
VII-10
Title
Relationship between Rate of Emissions and Heat Cycle for Electric Arc Melting
Treatment Agents for Producing Ductile Iron
Magnesium Treatment Systems Emissions Report for Ductile Iron Production and Gray Iron Desulfurization
Molding Sand Gas Analyses
Molding Sand Gas Evolution and Hot Permeability
Gas Volume Evolved as a Function of Volatiles Contained in Molding Sand
Effect of Baking Time on Gas Generated dur- ing Pouring for Various Baking Temperatures
Effect of Sand to Oil Ratio on Amount of Core Gas Generated during Pouring
Cyclone Collector
High Efficiency Centrifugal Collector
Dry Dynamic Precipitator Collector
Wet Cap Collector
Wet Dynamic Precipitator Collector
Vane-Type Centrifugal Wet Collector
Multiple Tube-Type Centrifugal Wet Collector
Orifice-Type Wet Collector
Centrifugal Spray Wet Collector
Marble Bed-Type Wet Collector
A. T. K E A R N E Y & C O M P A N Y . I N C .

Number
V I I - 1 1
VII -12
VII-13
VII-14
VII-15
VII-16
V I I - 1 7
VII-18
VII-19
VII-20
V I I - 2 1
V I I - 2 2
VII-23
V I I - 2 4
VII-25
VII-26
T i t l e
Impingement Baff le Grid-Type Wet Collector
Venturi Col lec tor
Wet Col lector P a r t i c l e Col lec t ion Limitations and Design Capacities
Cutaway View Showing Fabric F i l t e r , F l a t o r Screen-Type Bag
Cutaway View Showing Fabric F i l t e r Tubular-Type Bag
In te rmi t ten t Fabric F i l t e r Col lector
Continuous Automatic Fabric F i l t e r Col lector
Reverse Jet Continuous Fabric F i l t e r Col lector
Wet-Type E lec t ros t a t i c P rec ip i t a to r Eff luent Cleaning System
Dry-Type E l e c t r o s t a t i c Prec ip i ta tor Eff luent Cleaning System
Col lec t ion Eff ic iency of Emission Control Equipment Systems
Grading of T e s t Dust
Overall Col lect ion Eff ic iency on Test Dust
Chemical Composition of Cupola Dust by Weight
Grade Eff ic iency Curve, Dry Electro- s t a t i c P rec ip i t a to r , High Eff ic iency Cyclone
Calculat ion of Col lector Eff ic iency
A. T. K E A R N E Y & C O M P A N Y . INC.

Number
VI I -27
VII-28
V I I - 2 9
VII-30
V I I I - 1
V I I I - 2
VIII-3 'e
VIII-4
VIII-51
V I I I - 6
V I I I - 7
VIII-8
V I I I - 9
T i t l e
Grade Eff ic iency Curve f o r Fabric F i l t e r , Effect of Par t ic le Size and. Length of Bag i n Service on Fabric F i l t e r Eff ic iency
Relationship between Col lec t ion Eff ic iency, P a r t i c l e S ize and P r e s - sure Drop f o r Venturi Scrubbers
Cupola Afterburner, Cata ly t ic After- burner Applied t o Core Bake Oven Process
Application of Emission Control Equip- ment Systems t o Foundry Processes
Conditions Affecting I n s t a l l a t i o n Cost of Control Devices
Investment Cost Equations f o r Equipment Ins t a l l ed on Cupolas
Total Investment Cost vs Gas Volume f o r Wet Scrubber on Cupolas
Total Investment Cost vs Gas Volume f o r Fabric F i l t e r s on Cupolas
Total Investment Cost vs Gas Volume f o r Mechanical Col lectors on Cupolas
Approximate Melting Rates and Gas Volumes f o r Lined Cupolas
Approximate Melting Rates and Gas Volumes f o r Unlined Cupolas
Comparison of Gas Take-Off above Char e Door and-Below Char e Door.
High Energv Wet Scrubber Total Invest-
Line 3 - Cupola, Coke Ratio 8 7 1 ment Cost-& Melt Rate f o r Unlined Cupola 811 Coke Ratio . .
A. T. K E A R N E Y & C O M P A N Y , I N C .

i -. 7 -
Number
VIII-10
VIII-11
VIII-12
VIII-13
VIII-14
VIII-15
VIII-16
VIII-17
VIII-18
VIII-19
VIII-20
VIII-21
VIII-22
VIII-23
Title
High Energy Wet Scrubber Total Invest- ment Cost vs Melt Rate for Lined Cupola, 811 Coke Ratio
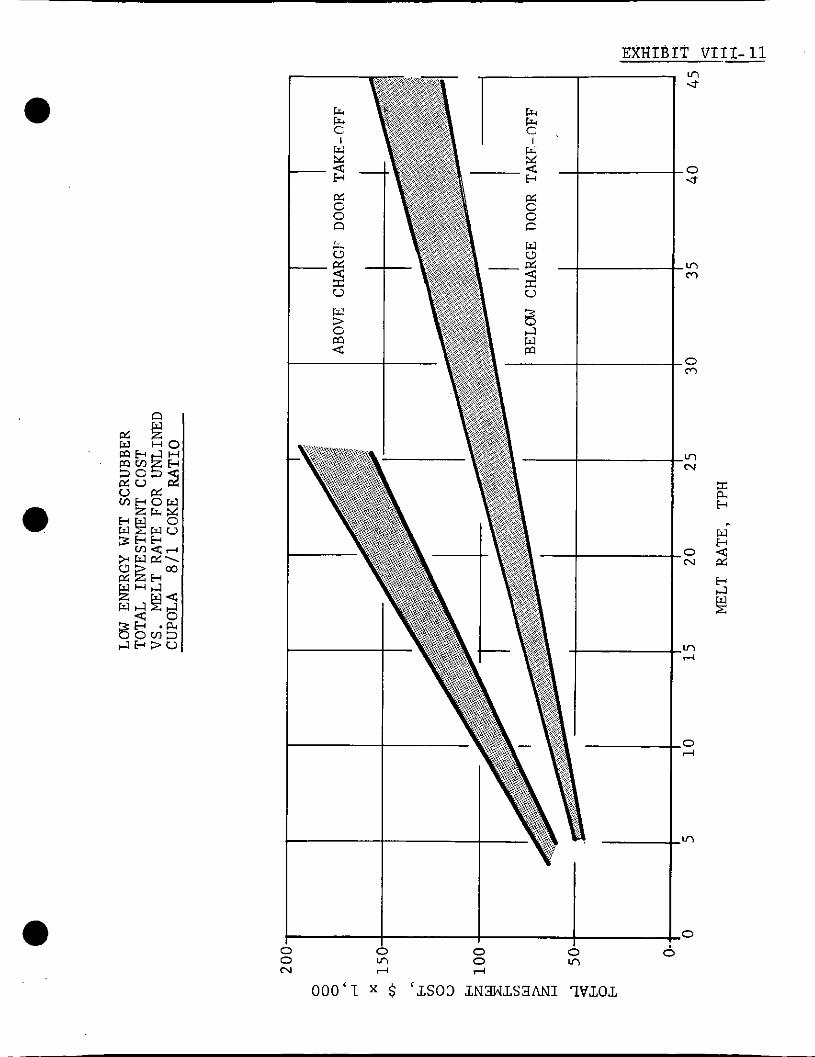
Low Energy Wet Scrubber Total Investment Cost vs Melt Rate for Unlined Cupola, 811 Coke Ratio
Low Energy Wet Scrubber Total Investment Cost vs Melt Rate for Lined Cupola, 811 Coke Ratio
Fabric Filter Total Investment Cost vs Melt Rate for Unlined Cupola, 811 Coke Ratio
Fabric Filter Total Investment Cost vs Melt Rate for Lined Cupola, 811 Coke Ratio
Total Investment Costs for Wet Caps
Calculation of Wet Scrubber Efficiency for Various Pressure Drops
Comparison of Cupola Outlet Dust Load- ing and Pressure Drop for Wet Scrubbers
Approximate Exhaust Volumes for Electric Arc
Installed Cost of Fabric Filter on Electric Arc
Total Annual Costs for High Energy Wet Scrubbers on Cupolas
Total Annual Costs for Low Energy Wet Scrubbers on Cupolas
Relative Changes in Total Annual Costs vs Pressure Drop for Wet Scrubbers
Total Annual Cost for Fabric Filters on Cupolas
A. T. K E A R N E Y & C O M P A N Y . I N C .

I - 8 - ’,
Number
VII I -24
VIII-25
VIII-26
VI I I -27
V I I I - 2 8
VIII-29
VIII-30
VIII-31
V I I I - 3 2
VIII-33
T i t l e
Total Annual Cost f o r Fabric F i l t e r s on E l e c t r i c Arc
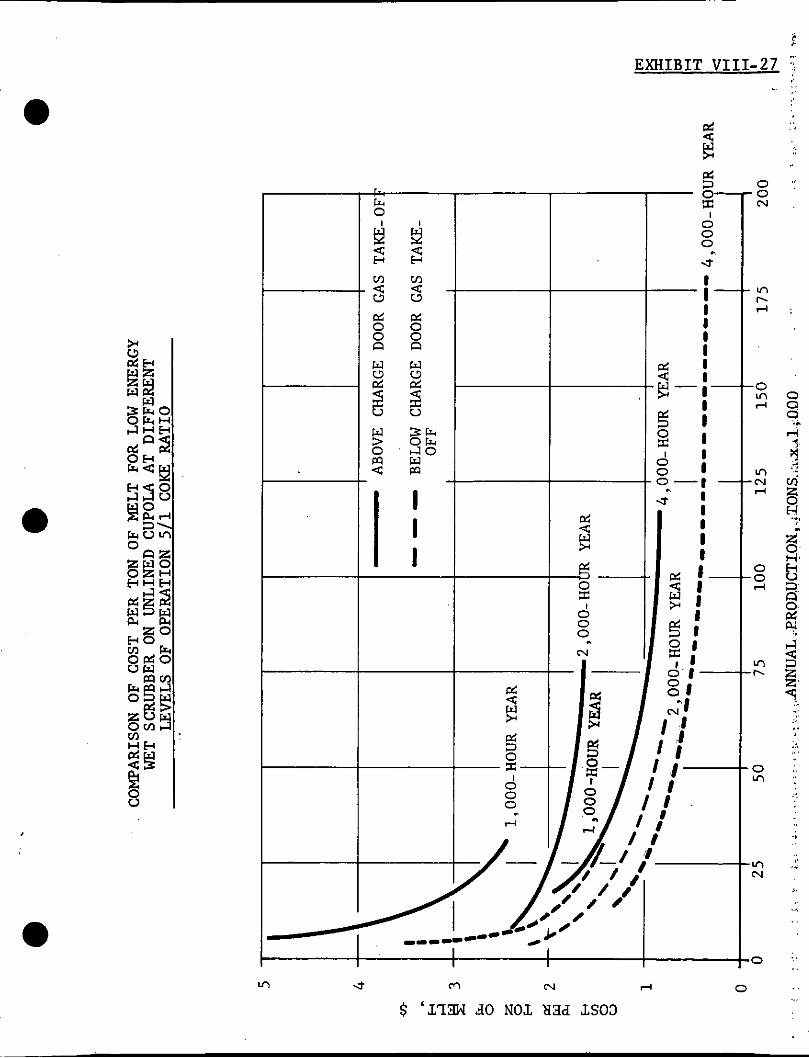
Comparison of Cost per Ton of Melt f o r High Energy Wet Scrubber on Unlined Cupola a t Di f fe ren t Levels of Operation, 511 Coke Rat io
Comparison of Cost per Ton of Melt f o r High Energy Wet Scrubber on Lined Cu o la a t Di f fe ren t Levels of Operation, 81f Coke Rat io
Comparison of Cost per Ton of Melt f o r Low Energy Wet Scrubber on Unlined Cupola a t Di f fe ren t Levels of Operation, 511 Coke Rat io
Comparison of Cost per Ton of Melt f o r Low Energy Wet Scrubber on Lined Cupola a t Di f fe ren t Levels of Operation, 811 Coke Ratio
Comparison of Cost per Ton of Melt f o r Fabric F i l t e r on Unlined Cupola a t D i f - f e r en t Levels of Operation, 511 Coke Ratio
Comparison of Cost per Ton of Melt f o r Fabric F i l t e r on Lined Cupola a t Di f fe ren t Levels of Operation, 811 Coke Ratio
Summary of Capi ta l Costs t o Produce I ron under Various Production and Operating Conditions
Summary of Operating Costs f o r Produc- ing I ron under Various Production and Operating Conditions
Capi ta l and Operating Costs per Ton versus Operating Hours per Year f o r Cold Blast Cupola with Fabric F i l t e r (Alternate No. 1)
A. T. K E A R N E Y & COMPANY. I N C .

Number
VIII-34
VIII-35
VIII-36
I X - 1
a X I - 1
X I - 2
XI-3
X I I - 1
T i t l e
C a p i t a l and Operating Costs per Ton v s Operating Hours per Year f o r Hot Blast Cupola w i t h Wet Scrubber (Alternate N 0 . 2 )
Capi ta l and Operating Costs p e r Ton vs Operating Hours per Year f o r E l e c t r i c Arc Furnace wi th Fabric F i l t e r (Alternate No. 3)
C a p i t a l and Operating Costs per Ton vs Operating Hours per Year f o r Coreless Induction Furnace wi th Afterburner on Preheater (Alternate No. 4)
Modifications t o Cupola Melting Prac- t i c e s t o Reduce Emissions
Inventory of I ron Foundry Emissions from Melting Operations, 1969
Inventory of I ron Foundry Emissions from Non-Melting Operations, 1969
P r i o r i t y Rating Chart
Proposed Research and Development Pro jec ts
A. T. K E A R N E Y & C O M P A N Y , I N C . 6

EXHIBIT IU-1
I , I ’
v) P z W a c z 0 c 0 3
0
- n a n a n >
z 3 0 LL
z 0 a -
:: m 2 f N
gOIX 60NllSV3 30 SNOL ‘WOIL3~WUd 1WlNW
m (0 v N 0
EOIX ‘AWNn03 M3d l S V 3 S N O l 3OVU3AV
I

a

EXHIBITIT-3 I I
DISTRIBUTION OF IRON FOUNDRIIES
SOURCE: PENTON PUBLISHING CO.


EXHIBIT m-.5

EXHIBIT m-6 I !
v) W
z 3 LL
2 a
e
e
800
100
600
500
400
300
200
IO0
0
I
IRON FOUNDRY ELECTRIC FURNACE ITRENDS
1957 59 61 63 65
S O U R C E : D A T A P R O V I D E D B Y F U R N A C E M A N U F A C T U R E R S
-I- t
I INDUCT ON
& + e--
67 69 71
YEAR
73
I
1-
L CTRlC + I
00' t 0'
4 0'
75 77 79 81

DEPARTMENT
Coarse
RAW MATERIAL STORAGE AND CHARGE MAKEUP
I i
MELTING
MOLDING, POURING AND SHAKEOUT
CHARACTERISTICS AND SOURCES OF EMISSIONS I N VARIOUS FOUNDRY DEPARTMENTS
OPZRATION
; t o r e metal sc rap , coke, l imestone, lolomite, f l u o r s p a r , s i l i c a sand
:entr i fuge o r h e a t metal borings ind turnings t o remove c u t t i n g o i l
leigh charge ma te r i a l s
:upola furnace melt ing
Zlec t r ic furnace melting
[nduction furnace melt ing
ieverberatory (Air) furnace
Furnace charge preheat ing o r drying
Holding furnaces
Duplexing furnaces
Inoculat ion
Yolding
I
.EMISSIONS
T;PE
just: Coke, limestone and sand.
3i ' : vapors Smol:e Jnburned hydrocarbons
Coke dus t L i m e s tone dus t
Fly ash , dus t Coke breeze Smoke Meta l l ic oxides
~~~
Sulfur compounds O i l vapors Carbon monoxide
Smoke MetaFlic oxides O i l vapors
O i l yapors, me ta l l i c oxides
Smoke O i l vapors Meta l l i c oxides F ly a s h , s u l f u r com-
Smoke, dus t O i l vapors Meta l l i c oxides Meta l l i c oxides
I ron oxide O i l vapor
O i l vapor Meta l l i c oxides
Meta l l ic oxides
pounds
Dust, m i s t Vapor
CONCENTRATION
3 t o 5g r . l cu . f t . qoderate
Light Light Light
3 t o 5g r . l cu . f t . Yoderate
.2 t o 5gr . lcu . f t . 5g r . I cu . f t . & up Heavy Moderate t o heavj Light Light Heavy
Heavy Moderate Heavy
Moderate Moderate Moderate .2 t o 5g r . l cu . f t
L ight t o heavy Light t o heavy 1.24#lton .4 I# I t on
Light Light
Light Light
Heavy
Light
Fine t o coarse 30 t o /1,000
.03 t? I 1
.01 t o .4 I
I .01 t o .4 .03 t b 1 75%-5 t o 60 bottom f i r e d 0 t o 0 top f i r e d 1 I Fine Fo I medium
.03 t o 1 I
EXHIBIT 111-7 Page 1 of 3
RELATIVE CONTROL- LABILITY
4odera te to ) i f f i c u l t
qodera te to Di f f i cu l t
Yodera te
Easy
Di f f i cu l t
Easy
Easy t o moderate
Easy
Moderate
Easy
RELATIVE COST
Medium
High
Medium t o high
L i t t l e o r none
High
LOW
LOW
None t o medium
Medium
L O W

CHARACTERISTICS AND SOURCES OF EMISSIONS I N VARIOUS FOUNDRY DEPARTMENTS
DEPAR'IMENT MOLDING, POURING AND SHAKEOUT (Cont'd)
CLEANING AND FINISHING
@ .; 'I
' , I
SAND CONDITIONING
OPERATION
Pouring Gray and d u c t i l e i r o n Malleable
Shakeout
Abrasive c leaning
Grinding
Annealing and h e a t t r e a t i n g
Pa in t ing Spray and d ip
New sand s to rage
Sand handling system
Screening
Mixing
Drying and reclamation
E M r s j T o N s
TYPE
Core gases Facing fumes Meta l l i c oxides F luor ide fumes Magnesium oxide fumes Syn the t i c binder
Dust Smoke Steam
Smoke and fumes
Dust
Metal dus t Sand dus t Abrasive dus t Wheel bond m a t e r i a V i t r i f i e d resins
O i l , vapors , gas productr
Solvent vapors P a i n t spray carry-over Water spray carry-over
Dust
Dust Steam
Dust
Dust F lour Bentoni tes S e a , c o a l Cel lu lose
of combustion
Dust Core gases
CONCENTRATION
Heavy Heavy Light Heavy Heavy Moderate t o
3 t o 5gr . lcu . f t . Heavy Heavy
. heavy
3gr. /cu.ft .& up
5 g r . l c u . f t . t ~ up 3 t o 5gr . lcu . f t . .5 t o 2gr . fcu.f t L ight Light
.5 t o 2gr . jcu.f t
3 t o 5gr . lcu . f t .
3 t o 5gr . Icu.f t .
3 t o 5gr . lcu.f t .
3 t o 5gr . lcu . f t . Moderate Moderate Moderate Moderate
.f2 t o 2gr . lcu.f t .
-- -
PARTICLE SIZE
-. (Microns)
Fine t o medium
.01 t o .4
50%-2 t o 15 .01 t o .4
50%-2 t o 15
Above 7 Fine t o medium 50%-2 t o 7 Fine 50%-2 t o 15
.03 t o 1
50%-2 t o 7
50%-2 t o 15
50%-2 t o 15
50%-2 t o 15
50%-2 t o 15 Fine t o medium Fine t o medium Fine t o medium Fine t o medium
50%-7 t o 15 .03 t o 1
EXHIBIT 111-7 .Page 2 of 3
-REmTmE CONTROL- LABILITY
Moderate
Moderate
Easy
Medium
Moderate
Easy
Moderate
Moderate
Easy
Easy
Easy
~
RELATIVE COST
Medium
Medium
LOW
L O W
L O W
LOW
High
Medium
L O W
Medium
Medium

CHARACTERISTICS AND SOURCES OF EMISSIONS I N VARIOUS FOUNDRY DEPARTMENTS
DEPARTMENT
COREMAKING
0 P E RA T I O N
sand storage
:oremaking
3aking
EMISSIONS
TYPE
Dust Flour Binders
Resin dust Sand ,dust
Vapors, gases Smoke
I
:ONCENTRATION
leavy I to 5gr.Icu.ft .
leavy ,ight
F 5
F F
-
a
_ - -
PARTICLE
Le L-7 to 15
to medium 4
Le to medium
EXHIBIT 111-7 Page 3. o f . 3
-lmmTm CONTROL- LAFlILD.
Moderate
Moderate
Easy
RELATIVE COST
High
Medium
!ledium

EXHIBIT I V - 1

EXHIBIT IV-2
mass STMIGHTeN
DUCTILE Am W U I l L E
PROCESS PLW O I A C M H
G U Y . DUCTILE AND MALLEABLE IRON
t HEAT T R U T
i -
I
~
+ - DUCTILE IRON ONLY
SURFACE COAT -
u NUTE: ALL OPEWIONS TO CMY. DUCTILE ANO MALLEABLE IRON M E S S D M E ~ I S E NOTED.

EXHIBIT IV-3
0
N
m 0 m N
0 rl
N rl
0 0 0 0 0 0 0 rl m m m r l d d
d r l r l r l N N N . . . D . . .
0 m
0 0
N
0 rl
rl
0 rl
rl N
0 r.
m
0 m m
0 * 0 m m
0 m m
0 * m
m -3 m
m P-
m I I I m
0 .j
m
0 N
m
0 * m
0 .j
m
0 0.0 0 0 0 0 m r l o o r l r l * m m m m m m m . * . . . . .
P- m rl
I
m N N
m N N
z H
0 P- rl
m P- rl
P- O N
I
h U a, .d 0 0 m
~ ~ 0 0 0 0 0 0 0 0 0 0 0 0 ~ 0 0 0 0 0 0
m m . j . j . j * . j
. , e ' . . . ; ; o - m 0 0 0
h h h h 0 4 2 5
U I r l r l r l d m r l r l w v
r l o o o o 0 0 0 0 0
0 0 0 0 N m m * u u u u
m v w m n
71 e m h m l4 U
.. w U l4
m


VI
rl
0 m
0 0
N
I
rl m
I
EXHIBIT I V - 5
hrl U a,. .rl rl 0 0 0 3 (II
.. a, U $4
(II

f
0
,
EXttI-BIT I V - 6
o o m m br-b w i
- 9
O o 0 * m m r D m .
0 0 0 * . . . b b b
I I I 1 0
u l m m m u?
d 1 1 1
m l n m 0
. . . 0 r-
I
0 m
0 m
I
ul W
0 m
I
m rl
i m 0
.coo $ ?? I 1
0 " C U .drl . .
m hl
I
m rl
i a0 0
. . . 0" I u
1 0 . . . o\ . I N h l m d r l 0 drlrl
0 0 3 . 0
I O I I 0 m m N moo 0 m
hlhlal \o hl . d
hl" cum N
m m o 0 v) m*m W m o o m m
W W * W
m m m w mmm m m 1 1 1 1 I l l I I
m m o m m m m 0 m mhlr l e m " r l h l
m m m h l mmm m m
1 1 1
. . . m m 2 -
. . .
. . .
e 0 LI H
m rl .rl U s L11

EXHIBIT IV-7
U c c oa l P O &I!-!
8 2 - a, m u a,c ca , roo M!-!
g 2 - m 7 U !-!c o m c u a!-! m a , O b
6
C 0 .A U ro C M .A ffl a, n
I I l l I m lrl U
rl W rl
0 I
N N m o x 0 L r l 0 ,,“:?Sa, lrl a, . .
r4 r4 I I I I I
0 0 0 m m e o a, P- 0 F- 0
rl W 4
W 0 -
m m m m m m m 0 0 0 0 0 0 0
I
.f 0
0 0 0 0 m m m m * F- 0
. F - rl a,
rl
I
0
m m m r l
I ; 0 4 I I 1
m m m o m r - F - r . . N m 0 . Ih - . r l r l r l rl rl rl a,
ffl 1 N 0 c a m 0 c a
6 .A c
h s4 -3 C 7 0 Fr
.I
I
c Fr
.)
m !-! a, a, C .A M C W rl a, a, U v)
-3 C ro C 0 & H - a, U
2 2 Fr U m ro 4 m
.. a, o !-! 7 0 Cn

PROCESS Fl.W DIAGRAH
RAW MATERIAL STORAGE AND FURNACE CKARGE W U P
EXHIBIT IV-8
DEGRUSE II
BRIWET
RECEIVE FRON FOUNDRY
FROM FOUNDRY
-
SHOT BLAST
PUTFORM T;i--1
rn FURNACE

a
n
n U J--#--, p ;1- *. I Y

a
- u w m
i EXHIBIT IV-io , I .

e
WMIBIT IV-11
.i
I I - . I... . . l~... . ,.
9 0 0 4
9 m v1
4 "7 4
4
m 3
m N " 4 m

n
1 U
E X H I B I T IV-I?
ri Y
e

EXHIBIT IV-13
PROCESS FLOW DIAGRAM
CLEANING 6 FINISHING
FROU SHAKEOUT
REU@VE GATES ANP
RISER-

EXHIBIT IV-14
a
n
e l
if 43
J

EXHIBIT IV-15
R E S I N
P R O C E S S FLOW DIAGRAM
CORE MAKING
r ~
CORE SAND C E R E A L B I N D E R CLAY OTHER A D D I T I V E S
2
- ~ WATER ACCELERATORS
KEROSENE ALCOHOL CORE O I L
I , I I I S H E L L OR CORE
HOT BOX MOLDING MACHINE MACHINE
CORE CORE EXTRUDING BENCH
MACHINE . ~
I I I
G A S S I N G CORE S T A T I O N OVEN
I I

EXHIBIT IV-16
e ILLUSTRATION OF CONVENTIONAL LINED CUPOLA
Source : Metals Handbook, 8th Forging and Cast ing, fo r Metals, 1970, p .
Edi t ion , Vol. 5 , American Society 337.

~ I B I T IV-17
ILLUSTRATION OF WATER-COOLED CUPOLA
Source: Metals Handbook, 8th Edition, Vol. 5 , Forging and Casting, American Society for Metals, 1970, p . 337.

EXHIBIT IV-18
ILLUSTRATION OF CUPOLA REACTION AREA
a
Fig. 3.3. Cross-section of cupoln showing reaction areas
A-On -t COz B - Area high in 0 2
D - High CO: CO? ratio E - High CO: COa ratio
c-co + co*
Source: The Cupola and Its Operation; published t y t he American Foundrymen s Socie ty , T h i r d Edi t ion , 1965, p. 26.

a
EXHIBIT I V -19
ILLUSTRATION OF ELECTRIC ARC FURNACE
\ TRANSFORMER
MAINTAIN - PROPER ARC
THROUGH THIS DOOR
CIRCUIT BREAKER
ELECTRODES
FLOOR CUT AWAY / TO SHOW TILTING MECHANISM
CONTROL / PANEL
TAPPING SPOUT
,SLAG
S o u r c e : The P i c t u r e S t o r y of S t e e l , p u b l i s h e d by the American Iron and S t e e l I n s t i t u t e , 1952, p . 18.

EXHIBIT IV-20
ILLUSTRATION OF CHANNEL INDUCTION FURNACE
Source: "Electric Melting for Mass Production in U . S . Iron Foundries " Modern Casting, July, 1968 , p. 47.

EXHIBIT IV-21
ILLUSTRATION OF CORELESS INDUCTION FURNACE
a
A HYDRAULIC nu CYLINDERS 8. SHUNlS C. STANCHION D. COVER E. COIL F. LIADS 0. WORKING REFRACTORY H. OPEIUTOR'S FiAlFoM
I. s m snEu J. nr RODS K. CLAMPING BOLTS L COIL SUPPORT M SWUl N. REFRACTORY BRICK
P. LID HOlSl MKHANISM 0. ACCESS mi
a Source: "Electric Melting for Mass Production
II in U.S. Iron Foundries, Modern Casting, July, 1968, p. 47.

BXHIBIT IV-22
ILLUSTRATION OF REVERBERATORY FURNACE
ECLIPSE CENTRIFUGAL BLOWER CHARGING HOPPER
\ \ RECUPERATORS
CAPACITY GAS
Source: The Wheelabrator C o r p o r a t i o n .

EXHIBIT IV-23
a
ILLUSTRATION OF MAGNESIUM TREATMENT METHODS FOR PRODUCING DUCTILE IRON
PRESSURE LADLE
n &AS
P
INJECTION
P \GAS I
PRESSURE CHAMBER
,. :...
. . . . .:. ’.
>A 5 ~~
TRICKLING-IN IGAZALI
DETACHABLE BOTTOM LADLE (MAG-COKE)
PLUNGING
0 POUR-OVER THROW-IN PLUNGING
Source: 1 1 Comparing Processes for Making Ductile I ron , ” E. Modl, FOUNDRY, July, 1970, pp. 44-46.

W I T IV-24
ILLUSTRATION OF POURING STATION W I T H HORIZONTAL DRAFT, CANTILEVERED HOOD
Source: Modern Casting, qublished by the American Foundrymen's Soclety, Inc., November, 1970, p . 83.

ILLUSTRATION OF SHAKEOUT STATION
EXHIBIT IV-25
, L
Source: Molding Methods and Materials; Published by the American Foundrymen's Society, 1962, p . 205.

E X H I B I T I V - 2 7
ABRASIVE ELEVATOR
ABRASIVE - HOPPER SCREEN
ILLUSTRATION OF BLAST CLEANING UNIT
Source: Eclipse Fuel Engineering Company.

ILLUSTRATION OF SAND MULLER
a
. .
a Source: Beardsley & Piper.

ABRASIVE ELEVATOR -
ABRASIVE HOPPER SCREEN
EXHIBIT IV-27
ILLUSTRATION OF BLAST CLEANING U N I T
I -
Source : E c l i p s e F u e l E n g i n e e r i n g Company.

E X H I B I T VI-1
RZNGELMANN SCALE FOR GRADING DENSITY OF SMOKE
u. EQUIVALENT TO 0% BL :K 2. EQUIVALENT TO 40% BLACK 1. EOUIVALENT TO 20% BLACK
3 . EQUIVALENT TO 60% BLACK 5 . EQUIVALENT TO 100% BLACK 4 . EQUIVALENT TO 80% BLACK
Source: C o n t r o l of E m i s s i o n s from Metal M e l t i n g O p e r a t i o n s , A m e r i c a n Foundrymen’s Socie ty .

PERTINENT ASME ITEMS WHICH MUST BE CONFORMED TO BY PARTIES CONDUCTING
A STACK SAMPLING TEST
The objec t o r ob jec ts of the test.
Time of making the test.
That the dus t separa tor i s in a s a t i s f a c t o r y condi t ion f o r t e s t i n g a t the time selected.
Whether the t e s t i s t o be made by Method A, Method B, o r Method C .
The number, type, and loca t ion of dust samplers and other in- struments t o be employed where a l t e r n a t i v e s a r e permitted.
Method of maintaining constancy of t es t conditions.
Gas flow r a t e s o r bo i l e r loads a t which runs a r e t o be made.
Method of determining gas flow through separa tor , i.e., by P i t o t tube.
Number and durat ion of runs.
Duration of operat ion a t each test load before sampling i s commenced.
Se lec t ion of laboratory f o r making equipment ca l ib ra t ions , weighing, s i z e ana lys i s and combustible content determinations of the d u s t samples i f equipment and t ra ined personnel f o r t h i s work a r e n o t ava i lab le a t the plant .
Tolerances o r margins, i f any, t o be applied.

EXHIBIT V -2 &
TEST METHODS
n
a
Method A. This method i s based on the determination of the average dus t concentra- t i on a t the i n l e t of the separator and a t the o u t l e t of the separator . From these da ta the ef f ic iency can be computed i n accordance wi th the equations given i n Section 5 of reference, which are based on the assumption t h a t no change i n the mass of gas flowing takes place between the two sampling locat ions. It i s n o t necessary t o how the gas flow rate o r t o t a l quant i ty passing through the separa tor f o r the duration of each run, nor i s i t necessary t o weigh o r sam- p l e the dust caught by the separator.
Method B. This method i s based on the quant i ty of dus t caught, the dust concentra- t i o n a t the o u t l e t of the separa tor , and the t o t a l quant i ty of gas passing through the separator . Obviously, t h i s method can be appl ied only t o those i n s t a l l a t i o n s where the dus t can be removed from the hopper i n the dry s t a t e f o r the period of each test run. i t i s necessary t o measure the t o t a l quant i ty of gas passing through the separa tor wi th reason- a b l e accuracy in order t o co r re l a t e the average o u t l e t dust concentrat ion with the t o t a l quan- t i t y of dust caught. For method of computation see Section 5 of reference.
Method C. This method i s based on the quant i ty of dus t caught, the dust concentra- t i on a t the i n l e t of the separator , and the t o t a l quant i ty of gas passing through the separator . The o ther fac tors r e l a t i v e to measurement by t h i s method apply a s i n Method B o 4
Also,

DESIGN FWNWS OF THE CUPOLA
LINING. B U S T & B U S T HEATING
U M l M D 0' I I I 1 I I 1 I
L I N I W
L-4 LINING I
1-1 CLOSED
NEUTlUL LINING

'0
GAS TAKE-OFF ABO!Z DPOR
e GAS TAKE-OFF
BE1.W D M R
WITH AFTERBURNER
EXHIBIT VI-3 Page 2 of 3
AFTERBURNER
- WITHOUT WITH
AFTERBURNER CDUBUSTION CHAMBER
1
C W R G E DOOR OPEN
I GAS OUT OPEN STACK
CHARGE CHARGE CHARGE CHARGE CHARGE CHARGE CHARGE CHARGE
CLOSED OPEN CLOSED OPEN CLOSED OPEN CLOSED D W R D W R DIlOR D W R DOOR DCOR
WITHOUT AFTERBURNER
DOOR ?D OPEN CLOSED
T Y P I C A L
WITHOUT ' I I T H CONTROL C O W R O L

1
BALANCED STANDARD TUYEKE BALANCED STANDARD TUYERE HLASI' D E S I G N B L A S T D E S I G N
. - -_--
D E S I G N FEATURE O F THE CUPOLA
F U E L I N J E C T T O N , OXYGEN ENRTCHMENT AND TUYERE D E S I G N
RALANCET, STANDARD TUYERE BLAST D E S I G N
---_ -- _-
CUPOLA B L A S T
I I
r 1
EALANCET, I3 L A S T
..._e-.--.-----II
OXYGEN ENRICHMENT
STANDARD TUYERE D E S I G N
I I.._-_--
I N J E C T I O N r l NO OXYGEN ENRICHMENT
NO F U E L I N J E C T I O N
OXYGEN ENRICHMENT
r
EXHIBIT V I - 3 Page 3 o f 3
1 NO OXYGEN ENRICHMENT r-

DESIGN FEATURES OF THE ELECTRIC ARC
CAS TAKE-OFF 1 NTO INTO INTO DIRECT Sl1EI.I.
EVACUATION
GAS TAKE-OFF GAS TAKE-OFF GAS TAKE-OFF GAS TAKE-OFF I m n
FLZL ROOF 'ICOD S I D E DRAFT tiom SNORKEL MELT I NG CANOPY iwno
TECTR IC ARC
FURNACE
NO GAS TAKE - OFF
DIRECT I A C I D LINED L,
t Pntw I NC
I EIUCUI.ATION NO INOCULATION
GAS TAKE-OF INTO
CANOPY HOC
-+I INDIRECT
I I
1 NI!CUWT 1 ON I
EXHIBIT VI-4
NO GAS TAKE-OFF

DESIGN FEATURES OF THE INDUCTION FURNACE
CHANNEL (CORE)
EXHIBIT V I - 5
CORELESS I I
I
I
I
I I -
WIN ACID COIL COIL LINED
SINGLE
I I I I
I CHARGE
I
1 1
BASIC LINSD
PREHEATER METAL DRYER
CLOSED OPEN C " E L
TYPICAL CLOSED b OPEN M
I I I
I I I I I
LINE MEDIUM HIGH LINE PIEDIUPI HIGH I
FREQUENCY I FREQUENCY I I m r E N C Y I I FREQUENCY FREQUENCY I 1 I I FREQUENCY 1 -- TYPICAL FOR CORELESS b CHAWEL
1
POU t. ING
VERTICAL STATIONARY T I L T DIluIl
I
I DRUM VERTICAL STATIONARY T I L T

EXHIBIT VI-6
CUPOLA FURNACES FOUND IN PRACTICE I
I
I I
I I
Y
$ 1 I
I

EXHIBIT V I - 7
I
H o m 0 0 . . o h m s N
C o o 0
4 0 0 m d N
H 0 0
d o 3 m
sc" VI 0 0
VI
0 VI
b 9 - 0 0 m o d
d
0
VI
- 0 0
w o w d m
sc" 0 0 4
0 U
a 1 -a a m
0 'cl
'cl m U Ll 0 a (u $4
m" (0 m .d

. "
EXHIBIT 'VI-8
a
PARTICLE SIZE DISTRIBUTION-CUPOLA EMISSIONS
Cumulative Percent by Weight D i a m e t e r i n Microns
Foundry -1 -2 -5 - - -50 -100 - 9
14 18 26 32
67 67
146 151
32
B2 A 4;
30% 50% 65% 8 2% 9 0% 99% 64 8 2 98 99
13 28 45 55 60 2 1 2 34 92 99 99%
54 86 98 99 99 99
14 15 15 2 1 99 19 25 99
99 99 0.6 2 3 8 99 99
4 5.5 7 13.7 75 80 11 13 32 53 75 94 8 1 2 1 7 28 69 89
18 25 38 62 17 26 36 53
24 28 23 42 26 30 32 44
0 T 25 32 34 4 1 56 61 0 7 24 41 47 32 69 81
Sources: 1. The Cupola and I t s Operation, Third Edi t ion , 1965 American Foundrymen s Society, P. 82.
2. A i r Po l lu t ion Engineering Manual, Publ ic Health Service Publ icat ion, N0.999-AP-40. 1967 Department of Heaith, Education, and Welfare.

EXHIBIT V I - Y
V
P O 03 u a O Y H O
g: .3N33N 34333 3 3 3 3 3 333.33 3 r l N r l N 4
m al V 0 0
Y al U a E Y
a a
m m
2 Y
W
a rl 0 a 5
' E W 0
4 u a .rl Y 0 m a V
W
N
U +I
5 s x w .. m x .d .II
a a 4 a a m
5
.. a u

EXHIBIT VI-10
a MULTIPLE LINEAR REGRESSION CORRELATION MATRICES
CORRELATION MATRIX FOR ACID LINED CUPOLAS
P a r t i c u l a t e S p e c i f i c S p e c i f i c Blast Emiss ions Melt Rate Blast Rate Metal t o Temperature
Lb. /Ton T/Hr. I S . F. SCFM/S. F. Coke Ratio OF
1 .000 -0.330 0.653 0.223 0.294
0.653 -0.561 1.000 0.026 0.268 0.223 -0.215 0.026 1.000 0.874
-0.330 1.000 -0 .561 -0.215 -0.473
0.294 -0.473 0.268 0.874 1.000
CORRELATION MATRIX FOR UNLINED CUPOLAS
P a r t i c u l a t e S p e c i f i c S p e c i f i c Blast Emissions M e l t Rate B l a s t Rate Metal t o Tempgrature
Lb./Ton T/Hr./S.F. SCFM/S.F. Coke Ratio F
1 .nnn 0.226 0.600 -0.703 -0.008 -.--- 0.226 1 : 000 0.448 0.022 0.130 0.600 0.448 1.000 -0.454 0.131
-0.703 0.022 -0.450 1.000 0 060 -0.008 0.130 0.131 0.060 1.000
a
A. T. K E A R N E Y & C O M P A N Y . lxc .

EXHIBIT V I - 1 1
LINEAR REGRESSION ANALYSIS OBSERVATIONS
Cupola Particulate Specific Specific Foundry Classifi- Emissions Melt Rate Blast Rate Metal to Temperature Number cation Lb./Ton T/Hr./S.F. SCFM/S.F. Coke Ratio OF
Acid Lined Cupolas 1 2 L I 5 14
37 14 26 14
7 18 150 24
9 23 9 14
9.5 11.4 17.4 18 .3 19 .9 22.9 36.0 37.0
Basic Lined Cupola 18 30 48.5
0.56 .73 .64 .63 .71 .78 .57 .57
0.48
269 364 317 274 1 9 4 231 462 462
1 1 . 5 8 6 8 9
10 .5 1 0 10
357 6
1,100 7 0 7 0 70
700 7 50 750
7 0
Unlined Cupolas 151 10 7.5 0.50 248 9 1,000 4 5 10 20.4 .52 238 9 1,400 35 4 40.4 .76 324 8 600
1 2 5 9 40.4 .55 244 10 1.000 -- - 160
8 4 74
2 4 0 ; 5 .36 317 8 1;000 9 45.7 .60 238 7 1,000 L% 46.6 - 3 1 252 6 750 . - ~ - <
67 9 66.3 .63 352 6 1,200 67 9 50.0 7 0 352 7 1 , 4 0 0

EXHIBIT V I - 1 2
0 0 0 rl 0 0
4- m N
LTDl NOL/'STI-SNOISSINZ X V T l 3 I L W d
0 0 rl
O H o w 4 - w h
E! 2 W m
.o 0 2 m v
10
I
i2 2 Fl
offl -0 4 N 4 m
u H
V W PI
o m -0 rl
::
-0

EXHIBIT V I - 1 3
e e m . U U
a c UII: U
VI E
I- + I
e
0 rl
m

E X H I B I T V I - 1 4
EFFECT OF TYPE OF SCRAP ON AMOUNT OF IRON OXIDE PRESENT
1,000,000 9
100,000 9 8 7 6
5
4
3
2
10,000
RAIL STEEL
P I G IRON
I 2 ' 3 4
1: 1 6
I
7 I
I
I RETURNS I
It 2
100 OXIDE ON SURFACE - POUNDS PER TON
1,000

a
EXHIBIT VL-15 Page 1 of 2
SIZE DISTRIBUTION FOR THREE ELECTRIC ARC INSTALLATIONS
Particle Size Distribution, Microns
Less than 1
Less than 2
Less than 5
Less than 10
Less than 15
Less than 20
Less than 50
Foundry A*
5%
15
28
41
55
68
98
Foundry B
8%
54
80
89
93
96
99
Foundry C
18%
61
84
9 1
9 4
96
99
Note: *Foundry A provided an agglomerated sample and is, therefore, less representative.
A. I. K E A R N E Y & C O M P A N Y . IN=.

a
e
CHEMICAL ANALYSIS OF ELECTRIC ARC EMISSIONS
Oxides
Iron Silicon Magnesium Manganese Lead
Aluminum Calcium Zinc Copper Lithium
Tin Nickel Chromium Barium
Loss on Ignition Ash
Foundry A
7 5 x 4 5% 10
2 2 1
0.5 0.3
~ .~
0.2 0.04 0.03
0.03 0.02 0.02 0.02
8.87 91.93
Foundry B
7573435% 10
0.8 2 2
1 0.2 2. 0.03 0-03
0.3 0.03 0.07 0.07
3.1 96.9
EXHIBIT VI-15 Page 2 of 2
Foundry C
7 5%-85% 10 1 2 0.5
0.5 0.8 0.3 ~.~
0.01 0.03
0.02 0.01 0.02 0.01
0 100
A. T. KEARNEY & C O M P A N Y . lac.

EXHIBIT VI-16
- !4 m n 5 z - 1 2 3 4 5
6 7 8 9 10
11 12 13 14 15
16 17 18 19
-
Furnace Shell Diameter Feet
11.0 12.0 8.0 12.0 7.0
12.0 8.0 7.0 7.0 7.0
7.0 9.0 9.0 11.0 9.0
9.0 8.0 11.0 12.0
EMISSIONS DATA FROM ELECTRIC ARC MELTING FURNACES
'urna c t :harge Tons
15 20 5 20 3
25 5 3 2 2
3 6 6 18 6
6 4 14 19
urnace Cycle Hours
1.15 1.5 1.0 2.5 1.75
4.0 1.0 1.75 2.0 1.3
2.0 2.3 2.0 3.0 1.2
1.75 2.0 1.75 1.7
Emissions Produced
LbfTon Charge
12.0 (Est .) 6.0 20.0 18.3 10.0
4.0 40.0 12.7 10.7 13.4
5.3 15.3 12.8 6-1 29.4
12,7 11.0 7.5 15.0
?.missions Control System Per Furnace Capacity-CFM
50,000 65,000 17,000 32,000 26,000
63,000 20,000 10,000 19,000
13,000
42,000 19,000
Sources: 1- 4 Foundry Visits 5- 9 10-19
AFS Fohndry Air Pollution Manual Los Angeles Air Pollution Manual
Gas Temp- OF
250 120 120 250 225
200 150 220
130 190 170

EXHIBIT VI-17
RELATIONSHIP BElWEEN RATE OF EMISSIONS AND HEAT CYCLE FOR ELECTRIC ARC MELTING
0 10 20 30 4 50 60 70 a0 90 1( HEAT TIME -PERCENT
Source: Coul te r , 1954, Los Angeles A i r Po l lu t ion Manual.

z 0
w
w V d
8
1r I I : g
EXHIBIT V I - 1 8

EXHIBIT V L - 1 9
MAGNESIUM TREATMENT SYSTEMS EMISSIONS REPORT FOR WCTILE IRON PRODUCTION AND GRAY IRON DESULFURIZATION
Iron Treated - 30 Tons per Hour Inoculant Added - 20-22 Pounds per Ton Iron Inoculants Used - MgFeSi-(lO% Mg)
‘7’5% Fe Emissions Produced - 100 Pounds per Hour
Soda Ash
3 . 3 Pounds Der Ton Iron Emissions Analysis - 32% MgO
18.7% Fe707 - - 9.5% c02 4.2% Si02 2.5% S 1.1% c 0.6% CaO Balance Na20
Source: Foundry Visitations, Foundry Number 0150.
A. 1. K E A R N E Y & C O M P A N Y . IN=.

EXHIBIT V I - 2 0
e
. . . . . . . . . . . LDP-ONO N ddr.
d P I N 4
o m m d P- P-P-m
. . . . . . . . . m \ ~ \ ~ m r l m o d m
m 4 - 4
NN u1 0 2 v .d U N u w C O N C w m om a v w u u
N & L l O l L l O N O N l U N m
+
VOUXF4 zF4 E:
N O e d m N m a m 4 m m e o o o - o m . . . . . . . . .
a d
. . . . . . . . . N r O W 4 0 P - m N 4
NN m m d m
m O m O I D N O N 0 . . . . . . . . . NmO\O*m m w m
m* rl m r l m

a
e
e
m m m
V c 11 m m
4 0
K
g Y
a 3 0 V
m
3 a V F m a U .rl 3 rl m V al .rl Ir P TI
m
5
5 g
m al
n r l m oao . . . uua
000 l n m 0 . . . N n m
000 ??? m o o
000 ???
n o
111 Ir a '13 c .r( m Ir 01
0 V c m al U 4
U
m
5
g 5 E
3" 5 L:
5
al U m
U
al &
m
.r(
3 P al V
m V c m v)
m U
.r( 3 .r( m
m o o o o m m hmmO0r.F.
3
. . . . . . . m P - m - P - n m
o o o o o m m m m m o o r - I . m - m - - n m rl
. . . . . . .
o m m m m m o ONr4N"O . . . . . . . m u r - m u N m
M U F c-4 I4 O L I a l u alu
& a l w
m m l n o m u u m o m "o o r 4 o m o ) N m . . . . . . . . . .
2 z2
V al V
2 R rl U
V
m
a
g
.Oh0 . . .
rl
g ??? v a m 0 m N P - m N" al m
al U
U c m m o al P - N m 0 . . . ~1 m m m al 3 3 N &
ln
5
m V c o o m
m m o g 90.9". m 3 0 .A rl rl m
o m m . . .
al m 3 3 m u m . . . . .
o m m m a m " " " "5 : a 9 F .r(
_. m
m m o m m " O b -
33"
. . . . . m n m r - m
v
m V al V
m >.I + 3 m
U
5
g
: 2 m > v c m v)
0 rl U al 5 m
EXHIBIT V I - 2 1
y?? 2:: m u 0
o n 0
u m z . . . m o m
oom
N 3 m r l 3
Y?".
ooln
N 3 m 33
"9".
000 ???
mrl 3

E X H I B I T V I - 2 2
GAS VOLUME EVOLVED A S A FUNCTION OF V O L A T I L E S
CONTAINED I N MOLDING SAND
0 1 2 3 4 5 6 7 8 9 10 11 12 13 ENDOTHERMIC V O L A T I L E S (MOISTURE, V O L A T I L E S I N BINDER & A D D I T I V E S )
L B . V O L A T I L E S /FT. 3 SAND
N o t e : A d a p t e d f r o m an a r t i c l e by F. H o f f m a n , "Proper ty C h a n g e s and C o n d i t i o n i n g o f R e p e a t e d l y C i r c u l a t i n g Foundry ; Sand S y s t e m s , Modern C a s t i n g , O c t o b e r , 1967.

E X H I B I T VI-23
EFFECT OF BAKING TIME ON GAS GENERATED DURING POURING
FOR VARIOUS BAKING TEMPERATURES
a
0 1 2 3 4 BAKING TIME I N HOURS
5
N o t e : A d a p t e d f r o m Foundry C o r e P r a c t i c e by H. D i e t e r t , 1966, p . 172.

E X H I B I T V I - 2 4
20 .
10 ' 3 u u
5 .
aa
7 EFFECT OF SAND m OIL
RATIO ON AMOUNT OF CORE GAS GENERATED
W R I N G POURING
I
72: 1 56: 1 40: 1 SAND R A T I O BY WEIGHT
Source: Foundry C o r e Practice, H. D i e t e r t , 1966.
24

EXHIBIT V I I - 1
CYCLONE COLLECTOR
CLEAN GAS OUTLET
-OF 'F
Source: Buel l Engineering Company.

E X H I B I T V I I - 2
e
HIGH E F F I C I E N C Y CENTRIFUGAL COLLECTOR
a
Source: American A i r Fi l t er .
e

E X H I B I T VII- 3
DRY DYNAMIC P R E C I P I T A T O R COLLECTOR
Source: American Air Filter.

~
EXHIBIT VII-4
WET CAP COLLECTOR
T
I:
ENTRAINED MOISIU3 ELIMINATOR 9
I . 'FZ"
- CO GXS VEN$
.i I b DRAIN
Source: Modern Equipment Company.

EXHIBIT VII-5
WET DYNAMIC PRECIPITATOR COLLECTOR
Source: American Air Filter.

EXHIBIT VII-6
VANE-TYPE CENTRIFUGAL WET COLLECTOR
. ' ._ . .
Source: Dust Collectors, American Foundrymen's Society.

EXHIBIT VII-7
MULTIPLE TUBE-TYPE CENTRIFUGAL WET COLLECTOR
NO MOVING PARTS
s b
Source: American A i r Flow Corporat ion.

EXHIBIT VII-8
ORIFICE-TYPE WET COLLECTOR
Source : The D e Vilbiss Company.
a

EXHIBIT VI I -9
sou
CENTRIFUGAL SPRAY WET COLLECTOR

e
0
0
3 I
EXHIBIT VII- 10
MARBLE BED-TYPE WET COLLECTOR
I .
Source: National Dust Collector Corporation.

EXHIBIT V I I - 11
IMPINGEMENT BAFFLE GRID-TYPE WET COLLECTOR
Source: Arc0 Ind.
,

EXHIBIT V I I - 1 2
VENTURI COLLECTOR
Source: Chemical Construction Co.

EXHIBIT VII- 13
0 WET COLLECTOR PARTICLE COLLECTION LIMITATIONS AND DESIGN CAPACITIES
Con t r ol Equipment
Type
Static Washer
Dynamic Precipitator
Centrifugal
Or if ice
Centrifugal Spray
Flooded Bed
Venturi
Range of Capacities Relative Comparison Available of Smallest Particle in Cubic FeetIMinute Collected (Microns) LOW High
1 0 500
2 to 3 1,000
2 to 5 575
2 400
2 300
2 1,000
0.5 5,000
Source: Dust Collectors, American Foundrymen's Society.
100,000
50,000
108,000
50,000
50,000
500,000
50,000
A. T. K E A R N E Y & C O M P A N Y . I N C

a
Source :
EXHIBIT V I I - 14
CUTAWAY VIEW SHOWING FABRIC FILTER. FLAT- OR
SCREEN-TYPE BAG
a

e
EXHIBIT V I I - 15
CUTAWAY VIEW SHOWING FABRIC FILTER TUBULAR-TYPE BAGS
Source: Pangborn Div i s ion , Carborundum Company.
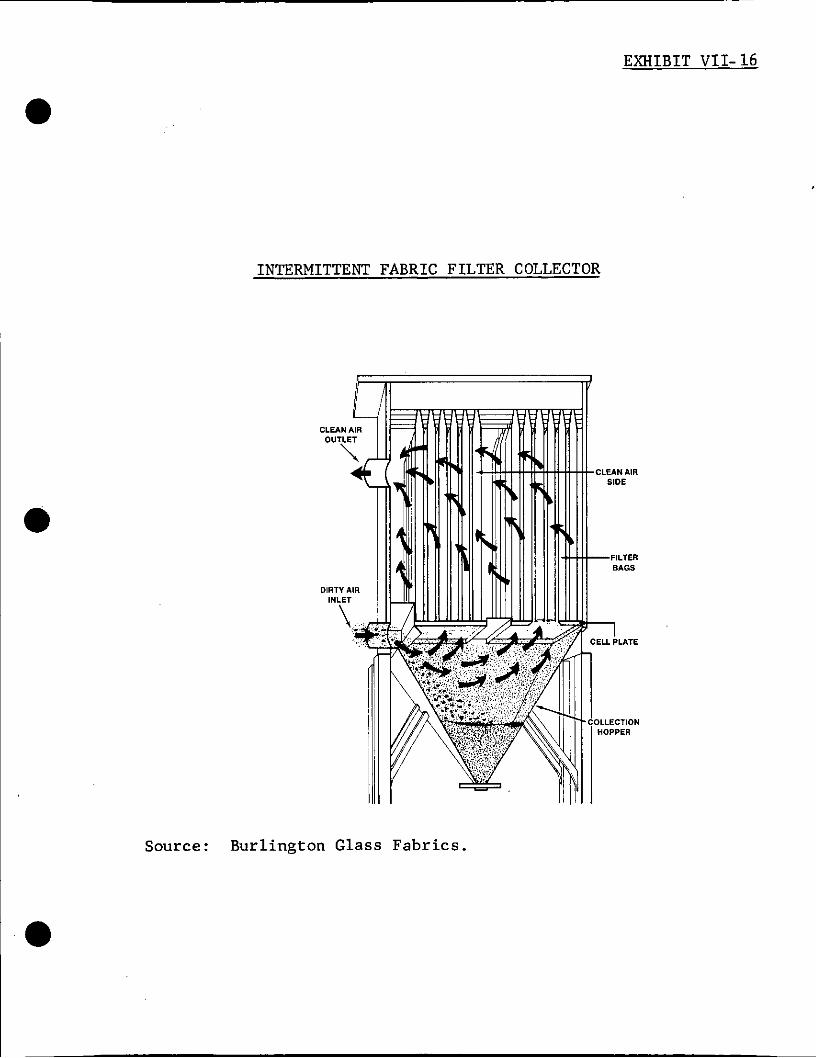
EXHIBIT V I I - 16
e
INTERMITTENT FABRIC FILTER COLLECTOR
a
e
DIRTY AIR
S o u r c e : B u r l i n g t o n Glass F a b r i c s .

E X H I B I T VII- 17.
a
CONTINUOUS AUTOMATIC F A B R I C F I L T E R COLLECTOR
a W
DUST-LADEN
Source : F u l l e r Company.

E X H I B I T V I I - 18
REVERSE J E T CONTINUOUS FABRIC FILTER COLLECTOR
PI
Reverse-Jet supply hlower
~ x t e r n a l blow-ring enrriage drive
Blow-ring carriage counterweights
Felt filter tubes
Heavy-duty, "on-lubricated drive chains
Blow-ring carriage
refabricatcd steel frame and panel housing
Welded steel dust hopper
Dust collected
in hopper
Clean air discharge
Source: B u f f a l o Forge C o m p a n y .
a

EXHIBIT V I I - 19
a WET-TYPE ELECTROSTATIC PRECIPITATOR
EFFLUENT CLEANING SYSTEM
., p T --
Source : Cupola Emiss ion C o n t r o l , Gray & Ductile I r o n S o c i e t y .

EXHIBIT VII-20
DRY-TYPE ELECTROSTATIC PRECIPITATOR EFFLUENT CLEANING SYSTEM
DRIVE FOR D l s C H A R G E F R A M E RAPPING
RAPPING DEVICE 1
OLLECTING CHARGE E L
.. SUPPORTING
GAS DISTRIBUTION
DRIVE FOR COLLECTING
C E L L WHEEL
Source: Cupola Emission Control, Gray & Ductile I ron Society.

3 0
0
0
0
1 3 m . 0 0
C 0
2r. i
a m c u 3 .i 0 3 k n *
u u
m i 0
3 0
C 0 0 Y 4 H Y
U
a
" G
EXHIBIT VII-21
G m 0
0 . x x x x x x X
X
X
X
e 3 3 0 0
dl dl 0
-J 3 m m m =%
m .rl L i r k
U 0 . x i
0 . x x x ..
m !+ m W 3
s" v) 0
0
0
0
" r !
v ) N 0 0
0 0 . .
a c m x x
m N 0 0 . .
C 0 .rl U
0 .rl 3
m U m r: U
U 0 w
m
a a
U 0 . x x x x x
0 N r n
8 , 3 N .
3
x x
3 M
o al.iu 4 3 v m 2rY 0 Y c rlu
m u c k
a e
0 3 N I ,
N N .. i d
0 m u
, I N O . 3 i
N 3 I ,
N N .. 3 3
3 : g 8 : 0 8 u
0 m u B Y m
0 .d u r 4 m c
m C .rl k
0 U
al C .i k
0 U
W 0 Y
0 U
m U . Y )
P
1 3 : E
m 3 o m 4 N u .rl *(I]
e, m 5 :
3 8 .rl U a m
.. m U 0 z

EXHIBIT VII-22
Size of Grade ,
Microns
104- 1 5 0 7 5 - 1 0 4 60 -75 4 0 - 6 0 30-40 20-30 15 -20 1 0 - 1 5 7%-10
24 -5 5-7%
Under 2%
GRADING OF TEST DUST
Percentage by Weight
i n Grade
3 % 7 10 1 5 10 10
7 8 4 6 8
1 2 - - 100% - Tota l
Percentage by Weight Smaller Than Top
S i z e of Grade
100 97 9 0 80
38 30 _.
2 6 20 1 2
Source: Design & Performance of Modern Gas Cleaning Equipment, J o u r n a l of t h e I n s t i t u t e of Fuel , February, 1 9 5 6 .
a
A. T. X E A R N E Y €i C O M P A N Y . I N C .

EXHIBIT VII-23
OVERALL COLLECTION EFFICIENCY ON TEST DUST
- Appara tus
Medium e f f i c i e n c v c y c l o n e
High e f f i c i e n c y c y c l o n e
F a b r i c f i l t e r Spray tower Wet impingement
s c r u b b e r S e l f - i n d u c e d
s p r a y d e d u s t e r V e n t u r i s c r u b b e r E l e c t r o s t a t i c p r e -
c i p i t a t o r
Overall E f f i c i e n c y
P e r c e n t
65.3%
8 4 . 2
99 .9 9 6 . 3 97 .9
9 3 . 5
99 .7 9 4 . 1
E f f i c i e n c y a t 5 Microns
P e r c e n t
27%
73
94 97
9 3
>99.9
99 .6 92
Eff ic iency a t 2 Microns
P e r c e n t
14%
46
99 .9 87 92
75
99 85
E f f i c i e n c y a t 1 Micron
P e r c e n t
8%
27
99 55 80
40
97 70
Source: Des ign & Performance o f Modern Gas C l e a n i n g Equipment, J o u r n a l of t h e I n s t i t u t e of Fue l . F e b r u a r y , 1956. a

EXHIBIT V I I - 24
e CHEMICAL COMPOSITION OF CUPOLA DUST BY WEIGHT
Si02
C a O
A1203
MgO
FeO (Fe203, Fe)
MnO
I g n i t i o n Loss (C, s, CO2)
Mean Range
20%- 40%
3-6
2-4
1-3
12-16
1 - 2
20-50
S c a t t e r Values
10%-45%
2-18
0.5-25
0.5-5
5-26
0.5-9
10-64
Source: Cupola Emission Con t ro l , Gray & D u c t i l e I r o n Founders ' S o c i e t y , Inc .
A. T. K E A R N E Y & C O M P A N Y . I N C .

a EXHIBIT VII-25 Page 1 of 2
GRADE EFFICIENCY CURVE
DRY ELECTROSTATIC PRECIPITATOR
100 .
80
60
40
20
0 0 5 1 15 20 25
PARTICLE SIZE, MICRONS
Source: Design and Performance of Modern Gas Cleaning Equipment, Journal of the Institute of Fuel, February, 1956.
e

EXHIBIT VII-25 Page 2 of 2
GRADE EFFICIENCY CURVE
HIGH EFFICIENCY
CYCLONE
0 20 40 - 1 80 100
PARTICLE SIZE, MICRONS
Source: Design and Performance of Modern Gas Cleaning Equipment, Journal of the Institute of Fuel, February, 1956.

c d o u d+ c m u p l L l o o (ua,Ll > d a, OdFk 0 U
s? I . . . . . . . . . .
b 9 N r . P - W V I O r n m 0 m m r . u c m r n m e o r . m m m m m m m c n m m r .
I . . . . . . . . .
w e m m a ? w b w a a m I . . . . . . . . . . . 0 0 N N m m r n m c o r . 0
drn
.. c
d 0 U d .d c L l o o . . . . . . . . . . .
d O d & 0 u
, b ' e w -u s? i m o (u c o l - ! m r n o m o m ~ r . m m Ig (u m o o m m r . w e w m u w u r n I N L I ~ o m c n m m m m c o w r . w m I U . d W a , d I r a W a I
.(3(u . . . . . . . . . . . .
EXHIBIT VII-26
4 0 a, U 1 U .A U 0 C w (u c U
w 0 d m c Ll
c, 2 a
U c PI
E 4 1 0. W M e
.A c ra aJ d u m 2 C u a, -0
rcI 0
.. a, 0 Ll
m

e 40 30 2: 20
10
EFFECT O F PARTICLE S I Z E AND LENGTH O F BAG I N SERVICE ON FABRIC F I L T E R EFFICIENCY
99.99 , I 1
--- Nm/
I
9 9 . 9 I f 1 9 9 . 8 9 9 . 5
99 98
95
9 0
q0
70 I I
10 SHAKE S
Source: T o r i t , Dust C o l l e c t o r s , January, 1966.
e

e
g 99.9 sr €-
V f f i W .A
m 99.5
E
EXHIBIT VII-28 .
RELATIONSHIP BETWEEN COLLECTION EFFICIENCY, PARTICLE SIZE AND PRESSURE DROP FOR VENTLTRI SCRUBBERS
I I I I I I T -
99
97 95
90
80
70 60 50
98
/ IA I I I I I I I I I I
0 . 1 0.2 0.3 0.4 0.6 0.8 1 2 3 4 5 6 8 LO PARTICLE SIZE - MICRONS
Source: Air Pollution Manual, American Industrial Hygiene Association.

EXHIBIT VII- 29 Page 2 o f 2
CATALYTIC AFTERBURNER APPLIED TO CORE BAKE OVEN PROCESS
I t ,
I Y,
Source: A i r P o l l u t i o n E n g i n e e r i n g Manual, U.S. Department o f H e a l t h , E d u c a t i o n and W e l f a r e , #999-AP-40.

CUPOLA AFTERBURNER
EXHIBIT VI I -29 Page 1 of 2
I I
I
Source : Foundry Air P o l l u t i o n C o n t r o l Manual, AFS.

EXHIBIT VII-29 Page 2 of 2
a
CATALYTIC AFTERBURNER APPLIED TO CORE BAKE OVEN PROCESS
Source: A i r P o l l u t i o n E n g i n e e r i n g Manual, U.S. Department of H e a l t h , E d u c a t i o n and W e l f a r e , #999-AP-40.
a

I
EXHIBIT VII-30
APPLICATION OF EMISSION CONTROL EOUIPMEt?t SYSTEMS TO FOUNDRY PROCESSES
Dry Mechanical Lar Pressure Medium
LO88 PreSSYre
1 Fabric Filter cotton or m i a n or
Electrostatic Precioitator
Dry wet
La, Pressure LOSS
(wet cap) Catalytic Combustion
NO
I Glass Dacron
NO
Rare usus1 NO
Rare
NO
NO N O
NO NO NO
NO NO NO NO
NO NO NO NO
NO NO NO
NO NO NO
NO
NO
NO NO
N w e X
NO
Foundrv Process LOSS
Rare N O NO
Rare Rare NO
NO
NO
NO NO
NO NO NO
NO NO NO NO
NO NO NO NO
N O RBW llaterisl Handling
and Preparation I
NO No I Melting Processes
Electric Arc Electric Induction
Cupola
Inoculation
Mold Pouring 6 Cooling
Shakeout
Enclosed Hood Side Hood
Ssnd Preparation & Handling
Frequently NO NO
NO
NO
Frequently NO NO
NO
NO
Frequently
::e 1 Rare 1
I NO
Frequently
NO
Rere
NO
Occasionally NO Rare NO
Occasionally
NO
Occasionally Rere NO
Rare
NO
NO NO NO
NO
NO
NO NO NO
Frlequently NO' NO1
I N O Nol
NO i NO
NO
Occasionally Rare
NO NO
Usual usus1
NO NO
Occasionally Oecasionallv
NO NO
NO NO
NO NO
Shakeout Molding Ssnd New Sand Core Sand
Occasionally Occasionally Occasionally
NO NO NO
Usual Usual U S U S 1
NO NO NO
Rere Occasionally OccasIanally
NO NO NO
NO NO NO
NO NO NO
Coremaking
Mechanical Material Handling Pneumatic Bake hien Grinding
casting Cleaning
Airless Abrasive Blesr Rooms Tumbling Mills Sprue
Grinding
Snagging Swing Frame Portable
Boiler Fly Ash
Chain Grate Spreader Stoker Pul"eriZer
Paint Ovens
Oil Burn-off Furnaces
Pattern Shoe
No I No i NO NO
NO NO NO NO
Frequently Rere NO Frequently
NO NO NO NO
Frequently USUS1 N O Frequently
NO NO NO NO
NO NO NO No
Rare N"
NO NO Frequently NO
~~~
NO Occaaionelly
NO NO NO NO
NO NO NO NO
Frequently UsVal USUS1 Usual
NO ? ?
NO NO NO NO
NO NO NO NO
NO' Nol N"' NO'
I
NO NO N" NO
NO NO NO NO
N$ Nd
'Oi NO NO NO'
I NO,
No,
Frequently Frequently Frequently
NO NO NO
Frequently Frequently Usual
NO NO NO
NO N O NO
Frequently Frequently USUBl
NO NO NO
NO NO NO
Nn NO NO
NO NO NO
NO NO NO
NO
NO
Occasionally usual Usual
NO
NO
NO NO NO
NO
NO
NO NO NO
NO
NO
NO NO NO
NO
NO
NO NO NO
NO
NO
NO NO wo
NO
NO
NO NO Freq"ent1y
NO
NO
NO NO NO
NO
NO
NO NO NO
Frequently
Frequently
Wood Metal
Usual Frequently
NO NO
N O NO
NO NO
occssiona11y Occasionally
NO NO
NO NO
NO NO
NO NO
Sources: Foundry Air Pollution Control Manual, American Foundrymen's Society, 1967. American Air Filter, Dust Colleccor Selection Guide, Bulletin 268-A, October, 1966. Personal notes of John Kane.
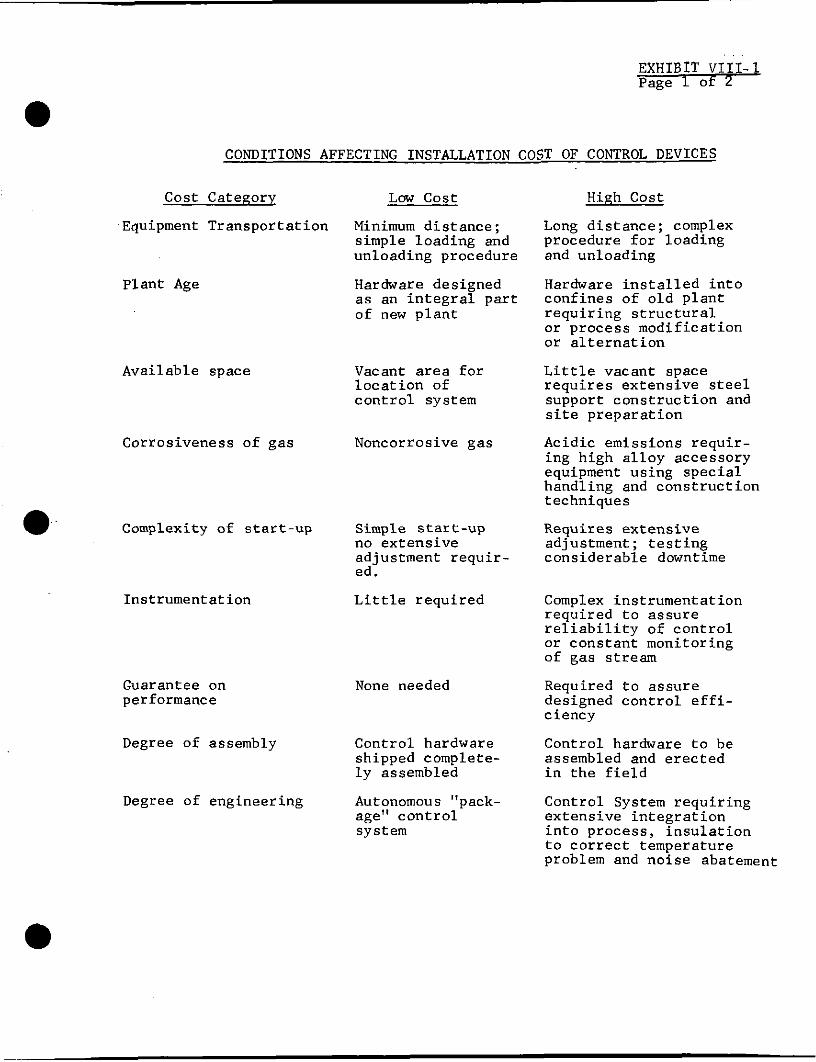
EXHIBIT VIII- 1 Page 1 of 2
CONDITIONS AFFECTING INSTALLATION COST OF CONTROL DEVICES
Cost Category
Equipment Transportation
Plant Age
Available space
Corrosiveness of gas
Complexity of start-up
Instrument at ion
Guarantee on performance
Degree of assembly
Degree of engineering
Low cost
Minimum distance ; simple loading and unloading procedure
Hardware designed as an integral part of new plant
Vacant area for location of control system
Noncorrosive gas
Simple start-up no extensive adjustment requir- ed.
Little required
None needed
Control hardware shipped complete- ly assembled
Autonomous "pack- age" cont r ol system
High Cost
Long distance; complex procedure for loading and unloading
Hardware installed into confines of old plant requiring structural or process modification or alternation
Little vacant space requires extensive steel support construction and site preparation
Acidic emissions requir- ing high alloy accessory equipment using special handling and construction techniques
Requires extensive ad j ustment ; testing cons ider ab1 e downtime
Complex instrumentation required to assure reliability of control or constant monitoring of gas stream
Required to assure designed control effi- ciency
Control hardware to be assembled and erected in the field
Control System requiring extensive integration into process, insulation to correct temperature problem and noise abatement

a u t
EXHIBIT-VIII- 1 :I_- ?age 2 of 2
CONDITIONS AFFECTING INSTALLATION COST OF CONTROL DEVICES
Cost Category Low Cost HiKh Cost
i t i e s Elec t r ic i ty , water Electr ical and van :e waste disposal treatment f a c i l i t i e s must f a c i l i t i e s readily be expanded, water supply available. must be developed or
expanded
Collected waste No special treatment Special treatment material handling f a c i l i t i e s or han- f a c i l i t i e s and/or
dling required handling required
Labor Low wages i n geo- graphical area wages i n geographical
Overtime and/or high
area
Source: U. S. Department of Health, Education, and Welfare, National A i r Pollution Control-Administration, Par t iculate A i r Pollutants, Washington, D. C., 196Y.
Control Techniques for
a

EXHIBIT VIII-2
~ :
I4 0
z 0 CI H U r a u W
H v1 0 u
m 3
OI ;f, 3 VI N
( 3 0 0 0 0 00 0 0 0
0
N m 0 am 3N N -3 h
0” 9 ‘3p.
VI 3 a 3
a m NO VI N
3 O
0 0 (5 0 0 0 0 00 0 0 0
0 U 00
’3N h 0 0 -’ m ro 3 3
0 I ”
/I V I VI V I VI . . 3 3 3 4
0 0 0 0 0 33 3 3 3 Y I Y I UI YI YI m m m tn m uu u u u
VI VI VI
0.
2:
-0 0 0 0 >c 0 0 0 :> 0 VI m
0 3
.a 2 U
l lV l
* ” .-. . .
43 3 3 3 D O 0 0 0 > > > 3 3
0
o m YI e m a u u 0 x x x X x
“-l VI h 0 0, 0
J h
N m U N m t + + + +
m : :
9”:
n m U 0 N 0 m 3 3
nVI
m VI 0 m VI N n-
2 0 3 .,- “ 7
II Y
II Y
,I I
I, II ..,Y

EXHIBIT VIII-3 rage 1 of 2
a
0 0 0
r(
X
'It
_.
e
600
50
500
50
400
50
300
50
200
50
100
50
0
- TOT/ \
FOR SCRI t !
0 10 20 30 GAS VOLUME, ACFM x 1 , O c
I 7 -
e

i EXHIBIT VIII-3 Page 2 of 2 .
t
0 0 0
a ; *
ut
5 0 U
50 m TOTAL INVESTMENT COST vs. GAS VOLUME 200 -
50
100
75
50
25 1 I I u t
0 I
10 I
20 I
30
I t
50 60 70 80
GAS VOLUME, ACFM x 1 , 0 0 0

E X H I B I T V I I I - 4 e
a
600
5a
500
50
405 0 0 0
d
x
"
50
5 0
100-
7 5.
5 0-
2 5-
0.
TOTAL INVESTMENT C O S T VS. GAS VOLUME FOR F A B R I C F I L T E R S ON CUPOLAS
il
' 0 10 20 30 40 50 t
GAS VOLUME, ACFM x 1 ,000 80

0 0
d 0,
X
u,
. ' . Y
50C
50
400
50
300
50
200
50
100
50
0
TOTAL INVESTMENT COST VS. GAS VOLUME FOR
ON CUPOLAS - MECHANICAL COLLECTORS
'
+ I
f 0 10 20 30 40 50 60 70 80 5
GAS VOLUME, ACFM x 1,000 1

APPROXI~ATE MELTING RATES AND GAS V O ~ J M E S . FOR LINED CUPOLAS
1
1-112
2-114
3-114
4-114
i 1
-
-
- 4
5 - 1
I
9-114 11-112
11-114 14
13-314 17
16-114 20-114
19 23-314
22-114 27-314 :I
- - -
-
- - -
10- 314
13-314
17
20-11;
24-11;
28-311
33-114
FCE Lined
. Dia.
18
23
27
32
37
42
45
48
54
60
66
7 2
78
84
5-112
6-114
7-114
FI - 6 1 1 -
314
1
1-314
2-112
3-114
4
4-112
5-112
7
8
9
7
9
10-
12-
15
17
5,800
7 , 1 0 0
8,500-
Yelt Rate TPH a1 to Coke R a t i o B l a s t
A i r (SCFM)
570
940
1,290
1 , 8 1 0
2 420
3 100
3 600
4,100
5,200
6 ,400
7,700
9,200
10,700
12,500
Av . Chg .' Door (Sq! F t . )
I I O I 10
I O I 11-
b6- 1 I 2
22
145
15 0
50
52
152 60
63
3,000
3,000
3,000
3,380
4 , 9 5 0
6 , 6 0 0
13 ,500
15 ,000
15 ,000
15 ,600
15 ,600
18 ,000
18,900
Adapted from Useful Information f o r Foundryrnen publ ished by Whiting Corporation.
As sump t ions : 1. No door c losu re 2 . No oxygen enrichment 3 . No f u e l i n j e c t i o n 4 . I n d r a f t a t 300 FPM
Above - Door To ta l
(SCW
3,940
4 , 2 9 0
4 , 8 1 0
5,800
8 ,050
10,200
17,600
20,200
21,400
23,300
24,800
28,700
31,400
EXHIBIT V I I I - 6
7
8
10
500
800
13 ,100
18,100
23,000
34,500
39,500
42,500
51,000
56,000
65,000
71,000
2,000
3 ,000
4,000
5,000
7 ,000
9,000
12 ,000
16 ,000
18,000
20,000
23,000
28,000
32,000
37,000

a
IO" F
8 / 1
5 - 1 / 2
7 - 1 / 4
9 - 3 / 4
1 2 - 1 / 4
1 5 - 1 / 4
18-114
22
2 5 - 1 / 2
2 9 - 1 / 4
34-114
39
44
49
FCE Dia .
36
4 2
48
54
60
66
7 2
78
84
90
96
102
108
H $ > t - Bla
9 / 1
5 - 3 / 4
7 - 3 / 4
10-112
1 3 - 1 / 4
16-114
1 9 - 3 / 4
2 3 - 1 / 4
27-114
32
36-114
41-112
47
52-112
[ e t a1 t
5 / 1
4 - 1 / 2
6 - 1 / 4
8
LO
12-112
15
L7-3/4
20-314
24-1/4
27-314
31-3 /4
36
i o
Coke
6/1
4-314
6 - 1 / 2
8-114
1 0 - 1 / 2
1 3
15-112
18-112
21-314
25-1 /4
29
33
37-1/4
41-112
l e l t Rs t i o (1
7 / 1
5
6-3/1
9
11-11:
1 3 - 1 / :
17
20
23-1/1
27-111
3 1 - 1 / :
34-1/ :
4 0 - 1 / :
45
I I
APPROXIMATE MELTING RATES AND GAS VOLUMES FOR U N L I N E D CUPOLAS
)
1011
6-114
8 -1 /4
11-114
1 4 - 1 / 4
17-114
20-314
25
29
34
39
44
50
56
B l a s t A i r
(SCFM) 1
2,300
3,100 8
4 , 1 0 0
5,200 , 6,400
7,700
9 ,200
10,700 .
12,500
14,300
16,300
18,400
20,600
I
Av. Chg. Door
(Sq . F t . )
1 2
1 6 - 1 / 2
4 5
50
50
52
60
6 0
6 3
95
110
. 120
128
Adapted from Useful Information f o r Foundrymen published by Whiting Corporation.
As y m p t i o y : No oor c losu re
2. No oxygen enrichment 3 . NO f u e i i n j e c t i o n 4 . I n d r a f t a t 300 FPM
Indr a f t CFM)
3,600
4 , 9 5 0
13,500
15,000
15,000
15,600
18,000
18 ,000
18 ,900
28,500
33,000
36,000
38,400
Above- Door To ta l
(SCFM)
5,900
8,050
17,600
20,200
21,400
23,300
27,200
28,700
31,400
42,800
49 ,300
54,400
59 ,000
- Below-
Ioor To t a l (SCFM)
2,600
3 ,500
4,600
5 ,800
7 , 1 0 0
8 , 5 0 0
10,500
12,000
14,000
16 ,000
18,000
21,000
23,000
Above Door
(ACFM)
13,300
18 ,100
34,500
39,500
41,500
51,000
59,200
65,000
71,000
93 ,000
105,000
115,000
128,000
Below loor @ 850° F
(ACFM)
7,000
9,000
16 ,000
18,000
20,000
23,000
28,000
32,000
37,000
42,000
48 ,000
. 56,000
62,000
-
EXHIBIT V ' l I I - 7

Y
EXHIBIT V I I I - 8
a 0 C 00 U
\
i
t \
0 rl
0

a
a
a 0 0 U
0 E,
W 2
0 0 W
0 0 N
0 0 i
0
0 0 0 ' 1 $ ' G O 3 LNWLSRANI TVL0.I
0
0 W
rl i
0 r(
rl
0

EXHIBIT VIII- 10
a
a -k
0 0 0 0 0 rl
0 0 0 0 0 In -3 m N
OOO'T X $ 'LSO3 LNilPiLS3ANI W L O L
0
'0 .;r
m m
0 'm
.In N
'0 N
In .d
0 d
'In
0
k r.u c.
1
EXHIBIT V I I I - .- 11
I I lo 0 0 6 0 rn 7 4
OOO‘T X $ ‘LSO3 LNB?LS3ANI TVLOL

EXHIBIT V I I I - 12
Lr, Lr, C
w sc 4:
-H
I
e: 0 0 c I
I --I- O m
rl
Lr, Lr, 0
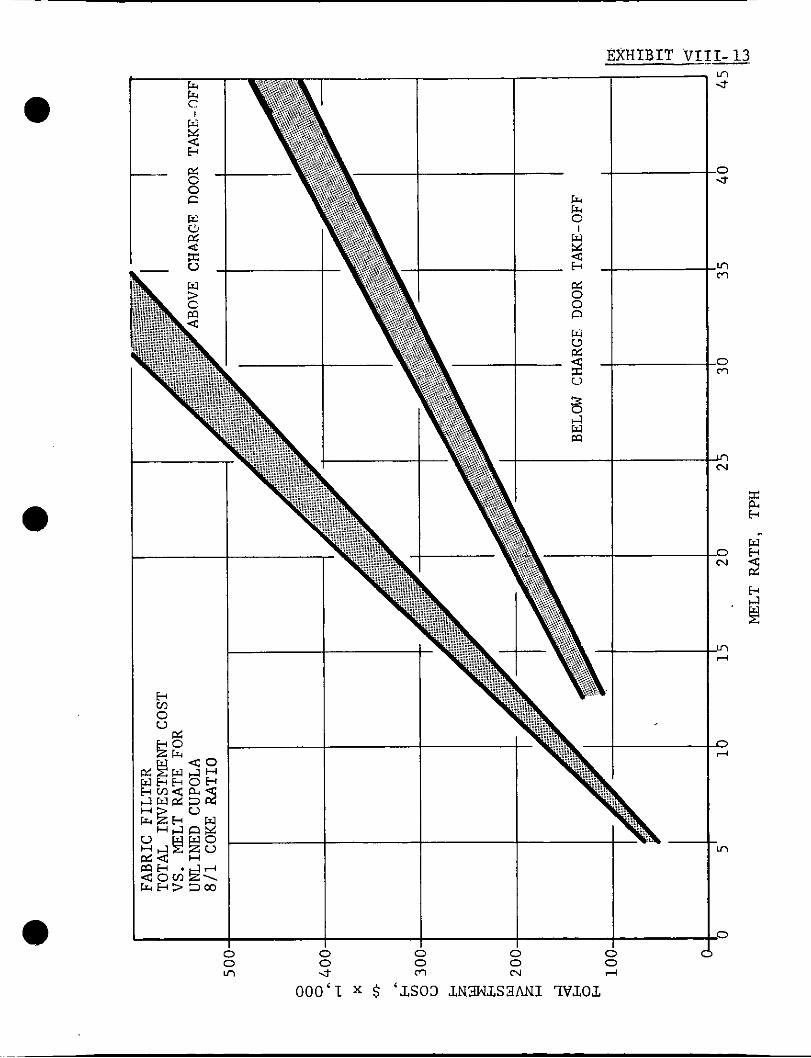
EXHIBIT V I z u
- p : C 0 c
0 0 m
I O
:!i ..... ..... ..... .ii!.,
..., .. . - :/. -
Ln 3
0 U
In m
0 m
In N
D N
m rl
0 rl
m
P
OOO‘T X $ ‘AS03 AN3hlLS3ANI ?VAOL

EXHIBIT V ;LLI- 14
I
4
e?; 0 0 I- 6
e?; C 0 P
0 -e
m .Fl
- 0 m
m 'hl
0 'hl
m ' d
0 d
' m
0
0 0 : 0 0 0 0 0 01 m e 0 0 0
' V l cu d
OOO'T x $ 'LSO3 J,Nrn.LS~ANI TVLOL
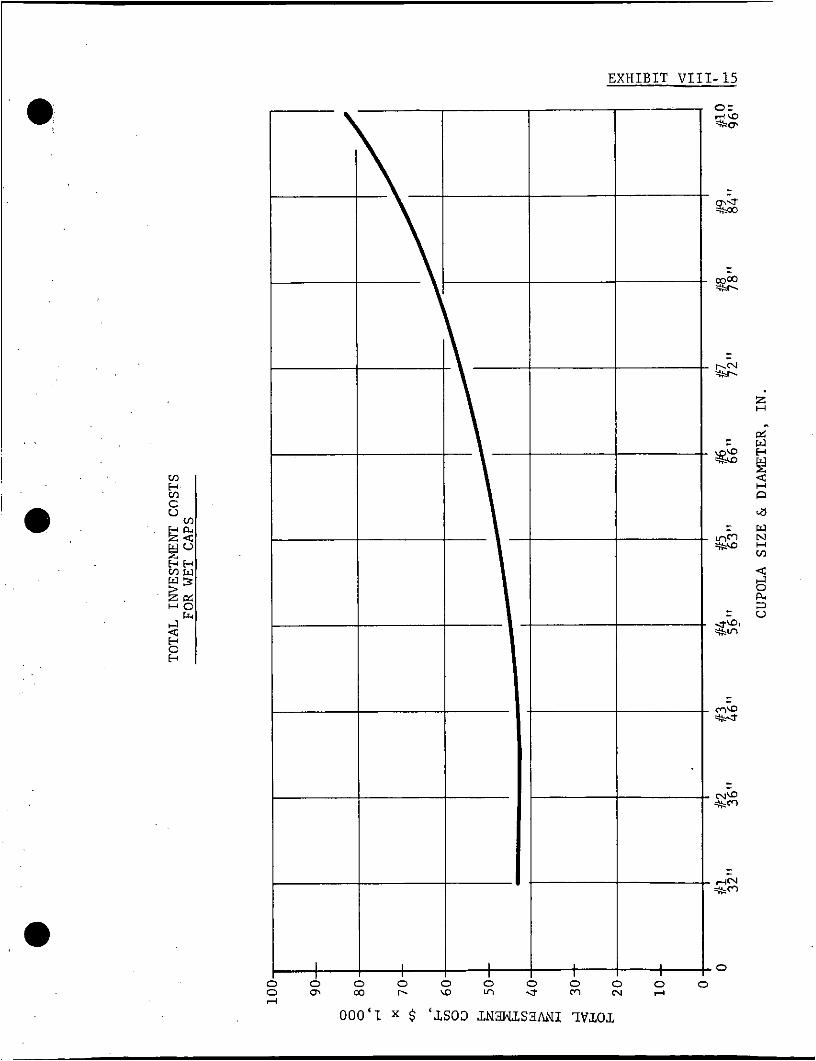
EXHIBIT VIII- 15
, a
I
I 0 0 0 r. \D lrl
0 0 0 0 m N 4
.o
OOO'I X $ 'LSO3 LN3hlLSZANI TVLOL

m m m m
4" rl
. . . .
I I .
EXHIBIT VIII-16
hh
vv FIN
.. YI W U 0 z
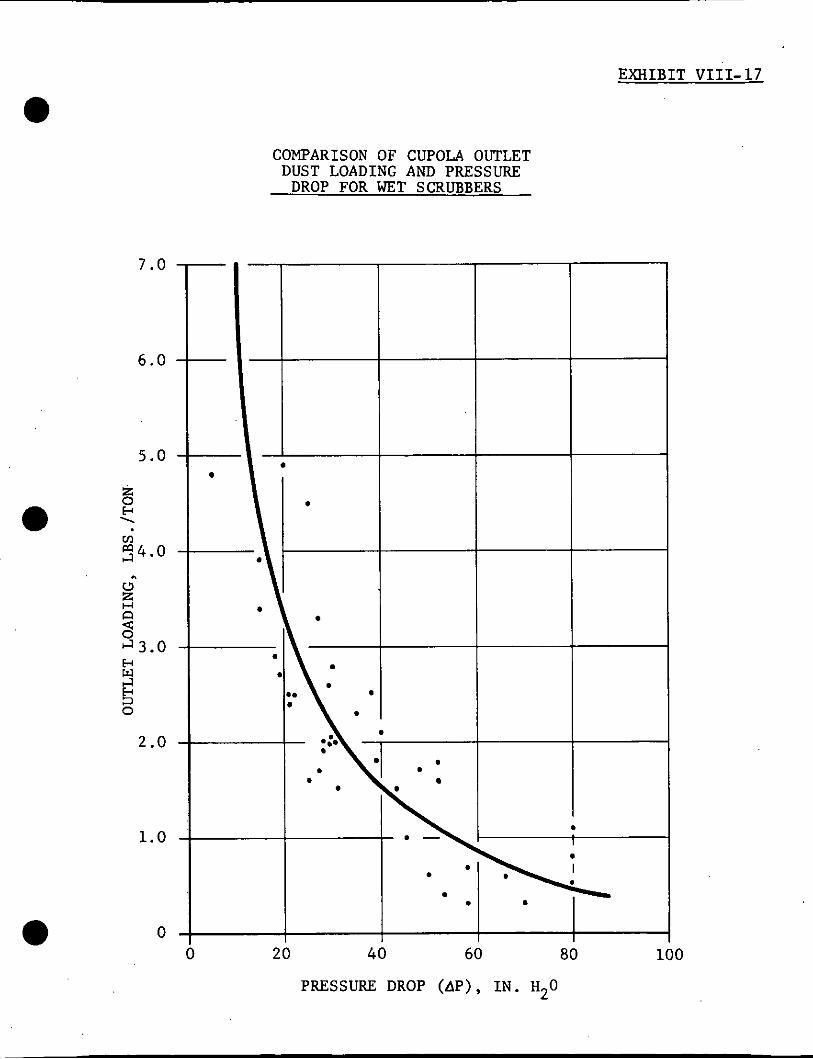
EXHIBIT V I I I - 17
e COMPARISON OF CUPOLA OUTLET
D U S T LOADING AND PRESSURE DROP FOR WET SCRUBBERS
a
a
7.0
6.0
5.0
VI 3 4 . 0 I
L!l 5 8 n
3.0 w w
E 0
2.0
1.0
-r
0- 0 20 4
.
60 80 100
P R E S S U R E DROP ( A P ) , I N . H20

EXHIBIT V I I I - 1 8
\
0 U
m m 0
0 m N
0 N
0

EXHIBIT VIII- 19
E 0 m N
0 0 N
0 Lrl rl
0 0 rl
0 m
1 0
000‘1 X $ ‘&SO3 (I3TTVLSNI 3LWIXOllddV

EXHIBIT VI I I -20
320
280
240
0 0 0 ,-I
x ,.e
- 200 a m w V 8 160
a
80
40
0
T O T A L ANNUAL C O S T S FOR H I G H
ENERGY WET SCRUBBERS ON CUPOLAS
,000- HOUR YEAR
,000- HOUR YEAR
I YEAR
0 20 40 60 80 100
GAS VOLUME, ACFM x 1,000 ~~

EXHIBIT V I I I - 2 1
0 0 0
I4
X
200
160
120
80
60
0
TOTAL ANNUAL COSTS
ENERGY WET SCRUBBERS ON CUPOLAS
FOR LOW
2,000- HOUR YEAR
YEAR 3UU- HUUK I
YEAR I LOW ENERGY
I I I
40 60 80
GAS VOLUME, ACFM x 1,000
. .
10

E X H I B I T V I I I - 22
RELATIVE CHANGE I N TOTAL ANNUAL COSTS VS. PRESSURE
DROP FOR WET SCRUBBERS
1 . 3 -
1 . 2 -
1.0 -
a C

E X H I B I T V I I I - 2 3 . '.
e
280
240
200
160
120
80
40
0
TOTAL ANNUAL COST FOR F A B R I C FILTERS ON CUPOLAS
( A i r C o o l i n g of Gas)
4,000.HOUR YEAR
2,000- HOUR YEAR
0 20 40 60 80
GAS VOLUME, ACFM x 1,000
YEAR
0

EXHIBIT V I I I - 2 4
d
2 2 s “ 5
\ \
d
; 5 0 z 0 0 0
4 *
I I I
n 0 0 z el
0 el
_ .
3
2 , p. t-3
1. m 0 m 0 N ’ 0 r. m ” ”
OOO‘T X $ ‘SLSO3 lVnNNV 1VLOL
m 0 N
a

EXHIBIT VIII-25 .
Lr, Lr, 0
El < H VI
3 e? 0 0 n w U
ii W > 0 Fp <
Lr, Lr, 0
!i < H
v) < U
e? 0 0 n w U
5 V E3 I I I
sa
C C C P
-5 - F '0
0 0 0 .I
d I-
I I I I I
0 0 hl
ln r. d
0 ln 4
m (v d
0 0 rl
ln r.
0 ln
ln hl
0
0 0 0
d
X
VI
w z 0
e
8 L
U
G 3 n 0 & PI 4
z z <
2l

EXHIBIT V I I I - 2 6
0 rl
c
C C C
d 0
-0
!5
d 0 - x- 0 0
N I
m \D U N
$ ‘L73hl A 0 NOL XId LSO3 0
0 m o d o
0
rl
X
v) m z
. N 0 r l b
0 m
0
6
EXHIBIT V I I I - 2 7 I:,
I I I
I --!-Is I
-f m N d 0
$ ‘LTW d0 NOL t13d LSO3

h h 0
w - 3- V
w > 0 m - <-
I
-0 < c7 e: 0 0 a
$ l e : 2- - m
I 5 0 z
I I d
EXHIBIT VII I -28
e: 2 E3 0 z
0
m 0
m 0
N
0
d
$ ‘LTXM 30 NOL 8I3d LSO3
0 0 N
m r. d
0 m d
m N d
0 0 d
m PI
0 m
m N
0

i
EXHIBIT VIII-29 !I
0 03 \o e N 0 rl
$ ‘LlW tI0 NOL X13d LSO3

,?
EXHIBIT VIII-30,. :. . ..
e
a
a
d d 0 0 0 0 C I C I
I't 0 .. rl
El N r(
. . W
.In l-
0 l-
0 a
0 lrl
0 e
0 m
0 N
El
N 0 W \o
$ 'LXU4 JO NO& 'tl3d LSO3

I S W R Y OF CAPITAL COSTS TO PRODUCE IRON UNDER VARIOUS PRODUCTION AND OPERATING CONDITIONS
A1terna:e Melt Rate TonsfHour Number ope ra t ing HoursIYear
1 Cupola-Lined Cold B l a s t No Holding Furnace
Bui ld ings and Melting Department Equipment Emission Cont ro l Equipment (Fabric F i l t e r )
T o t a l
Emission Control a s Percent of T o t a l Cost
2 Cupola- Hot Blas t - Induct i on Holding Furnace
Bui ld ings and Melting Department Equipment Emission Cont ro l Equipment (Wet Scrubber)
T o t a l
Emission Cont ro l A s Percent of To ta l Cost
3 E l e c t r i c Arc- Induct ion Holding Furnace
Buildings and Melting Department Equipment Emission Control Equipment (Fabric F i l t e r )
T o t a l
Emission Control a s Percent of To ta l Cost
4 Care less Induction-No Holding Furnace
Bui ld ings and Melting Department Equipment Emission Control Equipment (Afterburner)
T o t a l
Emission Cont ro l a s Percent of T o t a l Cost
'15 500 1.000 I 2,000 4.000
3 395,000 $ 395,000 60.000 60,000
$ 455.000 $ 455.000
13.2% 13.2%
$ 826,000 $ 826,000 120 .ooo 120 .ooo
$ 946,000 $ 946.000
12 .7% 12.7%
$ 813,000 5 .ooo $ 813,000 5,000
$ 818.000 $ 818.000
0.6% 0.6%
$ 497,000 65 .OOO
$ 562,000
11.6%
$ 507.000 $ 507,000 70 .OOO 70,000
$ 577,000 $ 577,000
12 .1% 12 .1%
$ 826,000 120,000
$ 946,000
12.7%
$ 813,000 5 .ooo
$ 818.000
0.6%
Note: The assumptions made i n t h e development of these f i g u r e s a r e inc luded i n t h e t e x t d i scuss ion .
15 1.000 2 .ooo 4,000
$1,012,000 $1,221,000 $1,221.0 2 1 0 . 0 0 ~ 220.000 220.0
$1.222.000 $1,441.000 $ L & U 17.2% 15.3% 15.3
$1,329,000 $1,329 .O 190,000 190.0
$1,519,000 $1,519.0
12.5% 12 .5 ~
$2,352,000 $2,352.000 $2,352, 163,000 163.000 163.
$2.515.000 $2.515.000 $=
6.5% 6.5% 6 .
$1,670,000 $1,670,000 $1,670, 10,000 10.000 10,
$1,680.000 $l.b80.000 $=
0.6% 0.6% 0 .
30 2.000 4.000
$2,099,000 440,000
$2,539,000
17.3%
$2,159,000 390.000
$2.549.000
15.3%
$3,765,000 245 .OOO
$4,010,000
6.1%
$2,963,000 15.000
$2.978.000
0.5%
$2,099,000 440,000
$2.539.000
17.3%
$2.159.000 390.000
$2.549.000
15.3%
$3,765,000 245.000
$4,010,000
6.1%
$2,963,000 15.000
$2,978,000
0.5%
EXHIBIT VIII-31
50 2 .ooo 4.000
$2,869,000 $2,869,000 690.000 690.000
$3 559.000 $3,559,000
19.4% 19.4%
$3.244.000 $3,244.000 630,000 630.000
$3.874.000 $3,874.000
16.3% 16.3%
$5,174,000 $5,174,000 326.000 326,000
$5,500,000 $5,500,000
5.9% 5.9%
$4,039,000 $4,039,000 19.000 19.000
$4,058,000 $4.058.000 ~
0.5% 0.5%

EXHIBIT VIII-32
e
Al te rna te Number
SLIMMARY OF OPERATING COSTS FOR PRODUCING IRON UNDER VARIOUS PRODUCTION AND OPERATING CONDITIONS
Melt Rate TonsIHour Operating HourslYear
1 Cold B l a s t , Lined Cupola Without Holding Furnace Using Fabr i c F i l t e r Co l l ec to r
Costs Per Ton
Direct Mate r i a l Conversion Cost
S u b t o t a l
Emission Control
T o t a l
Emission Control as Percent of To ta l ~~~ ~~~
' 2 H o t Blast , Water-Cooled, Unlined Cupola wi th Channel Induct ion Holding Furnace Using High Energy Wet Scrubber
Costs Per Ton
Di rec t Ma te r i a l Conversion Cost
S u b t o t a l
Emission Control
T o t a l
Emission Control a s Percent of To ta l
3 E l e c t r i c Arc'Furnace wi th Channel Induct ion Holdin Furnace Using Fabric F i l t e r Co(i1ector
Costs Pe r Ton
Direct Mate r i a l Conversion Cost
S u b t o t a l
Emission b n t r o l
T o t a l
Emission Control a s Percent of To ta l
4 Coreless Induct ion Furnace wi th Charge P rehea te r , Without Holding Furnace, Without Emission Control Except on Preheater
Costs Per Ton
Direct Ma te r i a l Conversion Cost
S u b t o t a l
Emission Control
. T o t a l
. Emission*Control a s Percent of To ta l
5 500 1.000 2.000 4,000
$ 51.09 i $ 51.09 $ 51.09 65.84 44.90 35.47 $116.93 s m $xs%i 1o.00 6.00 3.50 $126.93 - $101.99 $90.06
7.9% 5.9% 3.9%
$ 47.14 $ 47.14 38.04 29.48 $ss.ls $76.62 3.50 2.50
$&& $79.12 3.9% 3.2%
$ 44.69 $ 44.69 $ 44.69 143.72 84.95 $188.41 $129.64 $99.78 22.40 3
$210.81 $142.04 . '$106.28 10.6% 8.7% 6.1%
$ 47.06 $ 47.06 $ 47.06 134.14 80.47 53..77.
$181.20 $127.53 $100.83 .46 .27 .17 $181.66 - $127.80 $1o1.00 -
.3% .2%. .2%
15 1,000 2.000 4.000
$ 51.09 $ 51.09 $ 51.09 - 33.22 25.70 ~~ s m $m 4.00 2.33 1.33 $e,&& $79.12 $71.98
4.5% 2.9% 1.9%
I & - . .- -. - - - - - - Note: The assumptions made in the development of these f i g u r e s are included in t h e text discuaaiu&
$ 47.14 $ 47.14 26.51 19.22 $73.65 $66.36 2.00 1.25 $75.65 $67.61
2.6% 1.8%
$ 44.69 $ 44.69 $ 44.69 74.78 33.33 $119.47 $- $78.02 5.47 2 2.13 $124.94 $95.90 $so.ls -
4.4% 3.4% 2.7%
$ 47.06 $ 47.06 $ 47.06 51.01 35.12 26.52 $98.07 $82.18 $73.58 .20 .14 .11
$'98.27 - $82.32 $73.69 .2% .2% .2%
30 2.000 4.000
$ 51.09 $ 51.09 16.40
$73.01 S A U L 2 2.33 1.33 $75.34 $68.82 __
3.1% 1.9%
$ 47.14 $ 47.14 16.05
$68.85 $63.19 1.83 1.17
$70.68 $65.36 2.6% 1.89.
$ 44.69 $ 44.69 41.44 29.47 $86.13 $74.16 2.45 1.60
$88.58 $75.76 2.8% 2.1%
$ 47.06 $ 47.06 33.05 24.12 $80.11 $71.18 .12 .10
$80.23 $71.28 .2% . 1%
50 2.000 4.000
$ 51.09 $ 51.09 18.55 14.16
$4221 1.80 1.00 $=u&!&/ $66.25
2.5% 1.5%
$ 47.14 $ 47.14 18.83 14.00 $65.97 $61.14 1.65 .98
$67.62 $A 2.4% 1.6%
$ 44.69 $ 44.69 37.14 26.79 $81.83 $-
1.96 1.28 $83.79 $72.76 -
2.3% 1.8%
$ 47.06 $ 47.06 28.81' 21.62 $75.87 $68.68 .11 .09
$75.98 $68.77 . 1% .1%

$180
160
140
120
H 80 8
60
40
20
0
E X H I B I T VIII-33 . .~ ..
C A P I T A L AND OPERATING COSTS P E R TON VS. OPERATING
F A B R I C F I L T E R (ALTERNATE NO. 1) HOURS PER YEAR F O R COLD BLAST CUPOLA WITH
--- = C A P I T A L COSTS P E R TON O F
5 TONSIHR.
CAPACITY
1,000 2,000 3,000 4 ,
OPERATING HOURSIYEAR
I 5 TONSIHR. 0 T O N S r H R . '0 T O N S I H R . I

a
a
$90
80
70
60
50
40
30
20
10
E X H I B I T V I I I - 3 4 I I'
C A P I T A L AND OPERATING COSTS P E R TON VS. OPERATING
WET SCRUBBER (ALTERNATE NO. 2 ) HOURS P E R YEAR FOR HOT BLAST CUPOLA WITH
115 TONSIHR. 30 TONSIHR. 50 TONSIHR.
I = OPERATING COSTS PER TON O F PRODUCTION
C A P I T A L COSTS P E R TON O F CAPACITY I ---- =
~~ -- I I I
1,000 2,000 3,000 4,000
OPERATING HOURSIYEAR

EXHIBIT VIII-35
$360
320
280
UJ.
E- 240 e: w &
m
0 200
160
120
80
40
0
CAPITAL AND OPERATING COSTS PER TON VS. OPERATING HOURS PER YEAR FOR ELECTRIC ARC FURNACE WITH
FABRIC FILTER (ALTERNATE NO. 3)
-'-I-- I
-\ ;F \
_ - I '+- -I, ! \'.
- = OPERATING COSTS PER TON OF PRODUCTION
I I I I
1,000 2,000 3,000 4,000
OPERATING HOURS/YEAR
CAPACITY
t. 1. l.
R. R. R.

E X H I B I T V I I I - 36
0 C A P I T A L AND OPERATING COSTS P E R TON VS. OPERATING
HOURS P E R m A R FOR CORELESS INDUCTION FURNACE WITH AFTERBURNER ON PREHEATER (ALTERNATE NO. 4 )
. -
e
E OPERATING COSTS P E R TON OF PRODUCTION - I --- = C A P I T A L COSTS P E R TON OF CAPACITY
‘ I \ I
I I
1,000 2,000
T c I00 4,000
..
..
L .
L .
L .
OPERATING HOURSIYEAR

b. 2 '
: e 0 0 z z
c u . 0 Ln
N * d 9 N *
3
EXHIBIT IX-1 (Revised)
0
-a * 9
:: n -

EXHIBIT XI- 1
Iwmrnw OF IRON m u m MISSIONS PROn UELTING OPERITIONS. 1969
Total 3 P a r t i c u l a t e Carbon P a r t i c u l a t e Carbon
Productfm Production Generated, Generated, Emitted, Emitted Cast in s Molten Iron Emissions Monoxide Emissions Monoxide
RePio" Tona (1) Tona (1) Tons 13) Tons (I 1 TOM (41 &)
New Emland 235.000 362,000 3.800 49,000 2.800 24,500 mine New Hampshire vetmont Hsssechusetts Rhode Is land Connecticut
51.000 594.000 38,000 297,000 Middle At l an t i c 3.501,OOO 5,143,000 New York New Je r sey Pennsylvania
Ohio Indians
East N. Central 8,225,000 12.613.000 126.000 1,541,000 94.500 770,500
West N. Central 607.000 881.000 9,100 115,000 ' 6.800 57,500 Minnesota I W a Missouri Nebraske Kensss N . Dakota S. Dakota
Delaware South At l an t i c 473,000 662,000 6,800 88,000 5,100 44,000
HBryland
N. Carolina s. Carolins
Florida
Virginia w. Virginia
Georgia
27,700 304,000 20,800 152,000 East 5 . Central 2,300,000 2,887,000 Kentucky Mississ ippi Alabama Tennessee
ArkenSaS Louisiens Oklahoma TeXBB
west s. Central 531,000 748.000 7,700 100,000 5.800 50,000
243,000 332,000 3.300 38,000 2,500 19.000 Montana Colorado Arizona Nevada - ( 2 ) Idaho New Mexico . ( 2 ) wywing - ( 2 )
499.000 739.000 7.600 95,000 5.700 47,500 Washington
Ca l i fo rn i s Hawai i Alaeks
Oregon
g&&g 1.462.000 Total ~ 0 0 0 24.367.000
Notes: (1)
( 2 )
(3)
(4)
( 5 )
Castings and molten iron production q u a n t i t i e s from cupolas and e l e c t r i c arc furnaces only.
No iron foundries are located in Nevada, NW mxieo. and Wpmiw. Par t i cu la t e emissions and carbon monoxide generated are t h e estimated m e x h produced.
Pa r t i cu la t e emissions emitted are estimated a t 752 of M X ~ producd , with an average 25% being col lected.
Carbon monoxide emitted 18 estimated a t 50% being burned and 50% re- leased t o t h e atmosphere.

EXHIBIT XI-2
&&ion
New Ennland Maine New Hampshire Vermont Massachusetts Connecticut
Middle A t l a n t i c New York
'New J e r s e y Pennsylvania
East North Cen t ra l Ohio Indiana I l l i n o i s Michigan Wisconsin
West North Cen t ra l Minnesota Iowa Missouri Nebraska North Dakota South DBkota
South A t l a n t i c De lava r e
. Maryland Vi rg in i a West Virginia North Carolina South Csrolina Georgia F lo r ida
East South Cen t ra l Kentucky Miss i s s ipp i Alabama Tennessee
West South Cen t ra l Arkansas Louisiana Okla horn Texas
Mountain Montana Colorado Arizona Nevada (1) Idaho New Mexic (1) Wyoming (I?
P a c i f i c Washington Oregon Ca l i fo rn ia H a w a i i Alaska -
INVENTORY OF IRON F O W R Y MISSIONS FROM NON-MELTIE OF'ERATIONS . 1969
Castings Product ion
Tons
239,000
3,643,000
8,453,000
677,000
485,000
2,327,000
551.000
249,000
531,000
17,155.000
T o t a l
Molten I r o n Emissions Emissions Product ion Generated Emitted Tone Tons Tons
P a r t i c u l a t e P a r t i c u l a t e
368,000 21,000 1.100
5,603,000 319,400
13,001,000 741,100
1,041,000
746,000
59,300
42,500
3,579,000 204,000
847.000
383,000
48,300
21,800
16,200
37,700
3,000
2,200
10,400
2,500
1,100
2,400 46,600 817,000
- 26.385.000 1.504.000 76.600 __
Note: (1) No i r o n foundries are loca ted i n Nevada, New Mexico, and Wyoming.

a CUSSIPICATION I
]by weight.
D i f f i c u l t v of C ~ D tura Based on degree of confinement of emissions a t source.
-1tv Qf ScDara t i o n Comparison of p a r t i c l e s i re d i s t r i b u t i o n and other charac te r i s t ics . of emia. i o n s af fec t ing d i f f i c u l t y of separat ion.
type of system an pressure drop.
equipment is standard and wss-produced, requires d e t a i l e d engineering, or complete design engineering.
cont ro l devices t o perform s a t i s f a c t o r i l y .
EXHIBIT XI-3 Page 1 of 2
J s u u Q R E IRON FOlRIDlY mSSION CONTROL
1- 5
h
a a r s e
3asy
Sasy
Low
Low
Readily Available
Very Capable
i M
6-10
%derate
lbdium
Uoderate
Moderate
Kadirna
Available
Moderately Capable
7- 80 e
NG NUPlBER
11-15
Hish
Fine
D i f f i c u l t
D i f f i c u l t
High
High
D i f f i c u l t t o Find
Capable
110 11
16-20 - Very High
Very Fine
Extremely D i f f i c u l t
Extremely D i f f i c u l t
Extremely High
Extremely High
Experimental or P i l o t Plant Systems Only
Not Capable
L60
Low Uedirna High
a

Department
Scrap ya r d s
1 Melting
Molding, Pouring ti Shakeout
Cleaning ti Finish ing
Sand Conditioning
Core Department
P a t t e r n Shop
PRIORITY RATING CHART
I R O N FOUNDRY EMISSION CONTROL
Operation
Raw m a t e r i a l handling and
Charge makeup
Cupola Direct E l e c t r i c Arc Induct i o n Reverberatory Charge Prehea t ing Magnesium Treatment
Mo Id ing Pouring Shakeout
Abrasive Cleaning Grinding Annealing and Heat Treating Pa i n t i n g
Dry Sand Handling Prepared Sand Handling Screening
s t o r a g e
- Mixing Drying and Reclamation
O i l Sand Core Baking S h e l l and Cold Se t Sand
Curing
Wood P a t t e r n Making Metal P a t t e r n Making
Amount of
E m i s s i o r
1 1
15 10 1 1 5 5
1 5
20
15 2 1 3
10 10 10 15 10
10
15
5 5
Par t i c 1t S i z e
,-
5
15 20 10 10 10 18
5 10 10
7 3 5 5
10 10 10 10 10
20
20
3 5
D i f f i c u l t y of
Capture
15 15
10 5 5 5 5 5
8 15 10
4 3 3 6
10 10
5 5 5
5
15
5 5
Di f f icu l t ! of
Separa t io1
5 5
20 15 15 15 15 20
10 15 10
5 5 5 8
10 5 5 5 5
5
20
5 5
c o s t of Cont r o 1
7quipmenl
5 5
20 15 0 0
10 10
5 5 5
5 5 5 5
10 0
10 10 10
5
10
5 5
c o s t of Ami l i a r y Equipment
5 5
20 10 0 0 5 5
7 15
5
5 5 5 5
10 10
5 5 5
10
15
5 5
I
Cont r o 11 EquipmenF
4va i l a bi1.i t 1
5 5
10
lo 5 i 5 5
10
5 5 5
5 5 5 5
5 5 5 5 5
10
10
5 5
Control Equipment
R e 1 i a b i lit
5 5
10 10 5 5
10 10
5 5 5
5 5 5 5
5 5 5 5 5
10
15
5 5
Tota 1 P r i o r i t y
Rating
46 46
120 95 4 1 4 1 65 8 3
46 75 70
51 3 3 34 42
70 55 55 60 55
75
120
38 40
I

EXHIBIT X I I - 1
PROPOSED RESEARCH AND DEVELOPMENT PROJECTS
Summarization
Resu l t s of program w i l l p rovide input t o more a c c u r a t e l y r e l a t e cupola ope ra t ion and des ign v a r i a b l e s t o emiss ions . and thereby a s s i s t i n developing s o l u t i o n s t o emissions problems.
Resu l t s o f program w i l l r e l a t e i r o n oxide formation i n cupola t o ope ra t ing v a r i a b l e s , and may lead t o r educ t ion i n oxide f o m t i o n .
Resu l t s of program w i l l p rovide more quant i - t a t i v e means f o r measuring cupola emissions l e v e l s by means of o p a c i t y t e s t s .
Known Research
I None
None
P r i o r i t i e s Estimated Cost Desc r ip t ion
Cont ro l led program of cupola s t a c k emission sampling by r e sea rch i n s t i t u t e 'o r u n i v e r s i t y t o determine e f f e c t on t h e q u a n t i t y and type of emissions.
An ex tens ion of P ro jec t #l t o provide q u a n t i t a t i v e da ta on e f f e c t of v a r i a b l e s on i r o n oxide f o m t i o n i n t h e cupola.
An ex tens ion of P r o j e c t #1 t o provide da ta on r e l a t i o n s h i p between q u a n t i t y of f i n e m e t a l l i c oxides i n cupola gases and opac i ty of s t a c k plume.
Development of f a b r i c m a t e r i a l s f o r f a b r i c f i l t e r s , which w i l l be r e s i s t a n t t o h igh temperatures and c o r r o s i v e gases .
T i t l e
S tack Sampling Program 1
Medium l e v e l $50,000,$75,000 p r i o r i t y
I ron Oxide Formation
None Medim l e v e l $50,000-$75,000 p r i o r i t y
Fine Oxide-Opacity Rela t i o n s h i p
I Brunswick Corp. and Applied Research Cont ro l Div. j o i n t development program. NAPCA sponsored f i b e r g l a s s and h igh temperature f a b r i c f i l t e r s t u d i e s .
B u t l e r & Kutny system o f us ing sand f o r gas coo l ing and a i r p rehea t ing . Kenney & Schoff w i t h Mejes t i c I ron Wokks- system f o r burning cupola gas and p rehea t ing a i r .
Battelle Memorial I n s t i t u t e w i t h Cooper Bessemer, f u e l f i r e d , s h a f t me l t ing furnace . General Motors w i th Ajax Magnethermic, i nduc t ion heated continuous melt fu rnace .
I Holley,
I
I I
High Temperature Fabr ic Medium l e v e l $75,000- $100,000 p r i o r i t y
New f a b r i c m a t e r i a l s w i l l expand use of f a b r i c f i l t e r c o l l e c t o r s , w i l l reduce c o s t s o f c o l l e c t i o n , and make them more r e l i a b l e .
Medium l e v e l p r i o r i t 1
$100,000-$150,000 Development o f an e f f i c i e n t and r e l i a b l e was te h e a t recovery system w i l l improve cupola economics and reduce coke consumption. a 5 Waste Heat U t i l i z a t i o n Development of means fo r e f f i c i e n t u t i l i z a -
t i o n o f s e n s i b l e h e a t and hea t of combustion of cupola s t a c k gases .
Development of continuous i r o n me l t ing furnace us ing o i l o r gas f u e l or e l e c t r i c power f o r economical, low emission mel t ing .
Medium l e v e l $200,000-$300,000 p r i o r it yl
Development o f an e f f i c i e n t , economical, low emission i r o n me l t ing furnace w i l l provide a means o f r ep lac ing t h e cupola f o r i r o n mel t ing .
6 Continuous Mel t ing Furnace
Medium l e v e l $30,000-$50,000 U.S. Bureau of Mines Study-dismantling junk p r i o r i t y au tos t o produce q u a l i t y s c r a p . I
I I
Resu l t s of program w i l l provide means for economical, e f f i c i e n t s c r a p c leaning and p repa ra t ion t o se rve groups of foundr ies from c e n t r a l i z e d source .
New b inde r m a t e r i a l s needed t o reduce odors and t o x i c i t y of gases produced dur ing coremaking.
Resu l t s of program w i l l improve c o l l e c t i o n e f f i c i e n c y and reduce c o s t s by e l imina t ing or reducing q u a n t i t y of f i n e p a r t i c l e s .
Development of uses f o r was te products w i l l improve economics of dus t c o l l e c t i o n and i r o n foundry ope ra t ion .
7 Scrap P repa ra t ion Development of economical, c e n t r a l i z e d sc rap p repa ra t ion f a c i l i t y t o se rve i r o n foundr ies .
I Medium l e v e l $100,000-$150,000 None repor ted-but manufacturers of co re p r i o r i t y b inder chemicals be l ieved t o be workcng
Core Binder Mate r i a l s
Agglomeration of Fines
Waste Product U t i l i z a t i o n
Total A l l Programs
Development of co re b inder m a t e r i a l s w i th low l e v e l of a c r i d or noxious gas evo lu t ion during cu r ing .
Development of s o n i c method of agglomeration of f i n e p a r t i c l e s t o make them e a s i e r t o c o l l e c t .
Development of uses f o r waste products from mel t ing ope ra t ions .
8
9
10
I on problem.
Low l e v e l $75.000-$100,000 None p r i o r i t y ,
Low lev21 $20,000-$30,000 Zo l l e r Cas t ings Co.-use o f cupola emdssions p r i o r i t y ; f o r f e r t i l i z e r . Swindell Dressler-ude o f
s t e e l p l a n t was tes .
I $850.000-$1.230 .OOO
i
I