usability in it-systems of financial firms
TRANSCRIPT
Usability in IT-Systems of Financial Firms
A distant dream or reality?
A M I R A R O U L A
Bachelor of Science Thesis Stockholm, Sweden 2011
Usability in IT-Systems of Financial Firms
A distant dream or reality?
A M I R A R O U L A
Bachelor’s Thesis in Engineering and Management (15 ECTS credits) at the School of Industrial Engineering and Management Royal Institute of Technology year 2011 Supervisor at CSC was Åke Walldius Examiner was Stefan Arnborg URL: www.csc.kth.se/utbildning/kandidatexjobb/teknikmanagement/2011/ roula_amira_K11102.pdf Royal Institute of Technology School of Computer Science and Communication KTH CSC SE-100 44 Stockholm, Sweden URL: www.kth.se/csc

2
Usability in IT-systems of financial firms
- A distant dream or reality?
Abstract:
Banks have long been early adopters of technology; when it comes to usability, this thesis shows that they are also early adopters of new academic research. The problem is not adoption of a usability way of thinking, but in the way this is communicated in an organization. This thesis argues that HCI research needs to shift focus to the organizational aspect of actually implementing usability, no matter which definition of usability is used.
A greater focus on usability work in the form of usability evaluation and inclusion of end users in iterative IT development projects will not only be beneficial for banks’ cost reduction efforts, it will also be beneficial for the external users of the banks’ IT-systems, the private consumers, in the form of more usable and time efficient systems.
Different usability evaluation methods need to be used, depending on the particular function or system to be evaluated. This thesis argues that VSM is an easy to use method that can be implemented when evaluating the usability of a system or function.

3
Användbarhet i finansiella företags IT-system
- En dröm eller verklighet?
Sammanfattning:
Banker har länge varit tidiga med att använda ny teknologi; denna uppsats visar på att de också är tidiga med att ta till sig ny forskning om användbarhet. Problemet ligger inte i att använda ett tankesätt som inkluderar användbarhet, men i att kommunicera det till den övriga organisationen. Denna uppsats argumenterar för att MDI-forskningen behöver ändra fokus till den organisationella aspekten av att implementera användbarhet, oavsett vilken definition av användbarhet som används.
En större fokus på användbarhetsarbete i form av utvärderingar och inkludering av externa användare i iterativa IT-utvecklingsprojekt kommer att gynna både bankerna, i form av kostnadsreduktioner, och de privata bankkunderna, i form av mer användbara och tidsbesparande system.
Olika metoder för att utvärdera användbarhet behöver användas beroende på vilken funktion eller system som skall utvärderas. Denna uppsats argumenterar för att VSM är en metod som kan användas i syfte att utvärdera användbarhet hos ett system eller funktion, på ett lättimplementerat sätt.

4
PREFACE Thanks goes to all those at Handelsbanken who gave their time and effort to contribute to this thesis, and to the further enhancement of MDI research.
Thanks also to the test users who gave their time to take the VSM test.
As to maintain their anonymity, the names of the interviewed individuals will not be listed here.
Thanks also go to my supervisor, Åke Walldius, and my fellow students who helped with their valuable input during our thesis seminars.

5
TABLE OF CONTENTS Preface ............................................................................................................................................................. 4
1. Introduction................................................................................................................................................. 7
1.1 Background............................................................................................................................................ 7
1.2 Problem description .............................................................................................................................. 8
1.3 Objective ................................................................................................................................................ 9
2. Limitations and development of the study ................................................................................................ 10
2.1 Thesis limitations ................................................................................................................................ 10
2.2 Development of the study.................................................................................................................... 10
3. Theory ....................................................................................................................................................... 12
3.1 Definitions of usability......................................................................................................................... 12
3.1.1 Objective goals to make systems usable ....................................................................................... 15
3.1.2 Factors affecting usability ............................................................................................................. 16
3.1.3 Evaluation methods ...................................................................................................................... 16
3.2 Agile Development .............................................................................................................................. 19
3.2.1 Scrum ............................................................................................................................................ 19
3.2.2 Lean Software Development ......................................................................................................... 19
3.2.3 Value Stream Mapping .................................................................................................................. 20
3.3 Buyer competence and usability ......................................................................................................... 22
3.4 IT-systems in financial firms ............................................................................................................... 23
3.4.1 History of IT in banking ................................................................................................................ 23
3.4.2 IT investments in banking ............................................................................................................ 24
4. Empirical Study ......................................................................................................................................... 26
4.1 Research Design .................................................................................................................................. 26
5. Case study .................................................................................................................................................. 28
5.1 Choice of case object ............................................................................................................................ 28
5.1.1 Business and organizational description ...................................................................................... 28
5.2 Executing the field study ..................................................................................................................... 29
5.2.1 UMOD – Handelsbanken’s (SHB’s) IT decision making tool ......................................................... 29
5.2.2 Working with usability activities at Handelsbanken (SHB) ......................................................... 30
5.2.3 The function to be studied ............................................................................................................ 39
5.2.4 Conducting the VSM ...................................................................................................................... 39
6. Analysis and results ................................................................................................................................... 47
6.1 Analysis and Results of the interviews ................................................................................................ 47
6.2 Analysis and Results of the VSM .......................................................................................................... 49
7. Conclusion ................................................................................................................................................. 52

6
8. Discussion .................................................................................................................................................. 53
9. Further Research ....................................................................................................................................... 54
10. References ............................................................................................................................................... 55
Appendix 1: Interview Basic Questions ........................................................................................................ 58
Appendix 2: VSM Excel Sheet, containing Example of Future State Map ...................................................... 59
Appendix 3: The SHB internet payment platform ......................................................................................... 60
Appendix 4: The log in page of the SHB internet payment platform ............................................................ 63

7
1. INTRODUCTION
1.1 BACKGROUND
According to The Standish Group’s ”The CHAOS Report” from 1994, only 30% of all IT-systems developed can be viewed as successful (defined as within budget, in time and with the required functionality). Among the factors of success, they found “user involvement”, “clear statement of requirements” and “executive management support” in the top of the list.
2011, 17 years later, not much has changed; the majority of all IT development projects fail.
According to a book by Karlander (2001), more than 10 billion SEK is wasted each year on failed IT-projects in Sweden. Karlander further states that the most common reason for these failures is the lack of competence by the buyer organization and a lack of understanding of the work IT-consultants do. Karlander argues that this is not a new phenomenon brought about by the dotcom crash; this has been an issue since the 80:ies.
Though prior research on usability has focused on the definition of the term, there is also previous research that focuses more on soft issues such as organization and relationships (Galliers, 1991) within firms. IT-management is believed to rely not only on technology, but also on organizational and businesswise issues.
Issues attributed to difficulties in implementing usability work in an organization are presented by Ottersten and Berndtsson (2002); the authors argue that myths, lack of adequate incitement programs, working methods and organizational structures are to blame. The authors find that when an organization has been made aware of the advantages of incorporating usability in systems development, it is important to find a usability sponsor within management to secure long term efforts towards usability.
Speaking of usability and the organizational aspect, The Standish Group also states that many IT managers found politics to be a major cause for IT- system implementation failures.
It is the involvement of the whole organization, and in particular the end users, that seems to be the key success factor. In a research project by Willcocks (1992) where 50 firms were investigated (of which 12 were financial firms), 44% of the companies failed to include end users in their evaluations of IT-systems!
In an article written the same year as Willcocks research project, a model that is more socially oriented was suggested (Lyytinen, Klein & Hirscheim, 1991). This model is to give a broader and fuller understanding of the goings-on in an office and the operations conducted in the company. The authors argue that the traditional system development process has a too narrow view on the office and that this leads to system failures and misused systems; they suggest a broader model that has a socially oriented perspective,

8
which takes into account the work conducted at offices and has an understanding for information systems used by them. By understanding the goings on of offices, design and evaluation activities become more precise.
Another possible reason of the high failure rates of IT system developments and their implementation is the time lag between new attained research results and the implementation of such results (Bubenko, 1986). According to Bubenko, it can take 10 to 15 years before new research results are implemented in practice.
Nielsen (1994) found that 50 % of all program code in an IT-system is user interface. A question that arises is if 50 % of the system development is spent on usability issues as well.
1.2 PROBLEM DESCRIPTION
Based on the problems described above, relating to failed IT-systems (economically, technically and implementationally) and indications that usability work is an important factor for the success of IT investments (The Standish Group, 1994; Willcocks, 1992; Lyytinen, Klein & Hirscheim, 1991; Nielsen, 1994), this thesis will investigate how usability work is or is not implemented in a financial firm, and shed light on what can be done to increase the inclusion of usability work in financial firms. The investigation of the implementation of usability work in a bank, or lack thereof, will focus on (1) investigating the understanding of one or several of the exiting definitions of usability among the bank employees via interviews (see the Appendix for basic interview questions), (2) the education, involvement and interest in usability work (defined as including end users in all aspects of the system development process, i.e. user tests, usability evaluations etc) among the interviewed employees and (3) how usability work is prioritized by different parts of the bank (system developers, management, business architects etc).
This thesis will further employ a form of Value Stream Mapping test on a specific function used by the financial firm’s main customers; the function to be tested is the transaction function in the bank’s internet payment platform which is used by the bank’s public banking customers. The test of this function is done mainly to assess the feasibility of conducting a VSM test as a usability evaluation method, rather than the economical implications of the test result. Including end users in the usability evaluation of a system or function, as stated by Willcocks (1992), is a key success factor in the system development process.
The VSM test, in the light of the usability implementation investigation described above, will be used to show that a VSM test is a low-cost method in evaluating the usability of banks’ systems and functions.
The choice of VSM as a usability evaluation method is justified by
1. The ease of implementation; VSM, in theory and in practice, only requires pen and paper to map a process.
9
2. It is a low cost method; VSM only requires pen and paper, thus no expensive equipment is needed. One person is enough to conduct the test (mapping a process, clocking and writing down user comments) and the test involves a limited amount of test users and one expert user.
The VSM test is to be viewed as a pilot test in conducting VSM for usability evaluation purposes; Value Stream Mapping, as used in this thesis, mainly involves targeting a function involving several systems currently in use, and not a system under development which is otherwise the case when VSM is employed in Lean System Development studies and projects.
1.3 OBJECTIVE
The thesis has a threefold objective:
1. To use interviews in order to asses to what extent usability is or is not implemented in a financial firm’s IT systems, in the manner described above (Chapter 1.2, Problem description).
2. Conduct a Value Stream Mapping (VSM) test in a usability evaluation purpose, and try to show the ease with which such a test can be conducted; the test is related to the first objective in that it is intended to show that a VSM test is a low-cost method for conducting usability evaluations of banks’ IT systems and functions
3. To discuss the results obtained from point 1 and 2, and relate them to existing research

10
2. LIMITATIONS AND DEVELOPMENT OF THE STUDY
2.1 THESIS LIMITATIONS
As this thesis is a Bachelor thesis with the time constraint it implies, the thesis will be limited to:
Mapping a typical IT function of an organization in the financial industry, namely a retail bank.
One function will be tested, the function involving money transactions via the internet payment platform of the bank studied.
If the thesis finds that new theory is needed, this will be noted but not further investigated as it is beyond the scope of a Bachelor thesis.
The definition of financial firms will be limited to include firms who use in-house built IT-systems and/or are responsible for their own IT-system specification (via CIO or consultants) to a large extent. Firms who outsource their whole IT-functions will not be relevant for this thesis.
The number of VSM tests conducted will be limited
To fully generalize around the results obtained, one would need to study more than one company. As this thesis will only be focusing on financial firms, the object company will be used to generalize around other financial firms of similar size and business to the extent this is possible.
Another limitation is in the use of the Value Stream Mapping tests. The tests will be used as a pilot test, in order to show the ease of conducting a VSM in evaluating usability of a function. The amount of test users will be limited, but it is the practical feasibility of conducting a VSM test itself that is in focus and not the results themselves.
Furthermore, a Future State Map (FSM) will not be created within the boundaries of this study, as it is the execution of the test itself that is of interest. Directions on how to use the obtained Current State Map (CSM) in order to create a Future State Map and how to use the results will be detailed in Chapter 4.1, “Research Design”. For more information on the definitions of VSM, FSM and CSM, consult Chapter 3.2.3, “Value Stream Mapping”.
Another limitation is thus:
The VSM test conducted for this thesis will capture the effectivity and satisfaction of the function tested, but not its efficiency; this would require that a Future State Map (FSM) is conducted
2.2 DEVELOPMENT OF THE STUDY
The original focus of the thesis was on finding a usability definition that was suitable for the financial sector, and quantifying the cost of not implementing usability work with the use of VSM.
11
As the study progressed, it soon became clear that it was not an increase of the understanding of what usability is that was needed in order to enhance the usability of IT systems of financial firms. The study object seemed to comprehend the different existing definitions of usability well, and was not in any need of detailing one specific definition of usability to improve its usability activities.
As the bank studied used the PENG method (Dahlgren, Lundgren and Stigberg, 2000) to conduct cost benefit analysis, which included steps similar to VSM, and interviewees indicated they included usability aspects when using the method, it became clear that the study object already used methods to quantify the cost of not implementing usability activities. The interviewees further indicated however, that the way in which usability work was included when quantifying costs related to system development might need to be further enhanced in order to include alternative costs of not including usability activities in system development.
Furthermore, one of the interviewees indicated that the use of usability evaluation methods on existing systems and systems under development might be too expensive to add to smaller projects (projects of the size 2 million SEK or below). Thus, the thesis shifted focus from using VSM as a tool for quantifying the cost of not implementing usability activities to conducting a VSM pilot study to show the ease of executing such a test in evaluation purposes. The bank overestimates the costs of conducting usability evaluations using end users directly, and thus underestimates the benefits in the form of effectivity and user satisfaction that can be gained by conducting usability evaluations, such as a VSM test. As the VSM method only needs pen and paper (or an Excel sheet) to be conducted, the VSM is easy to implement, and as it requires the mapping of a specific function with end users as well as expert users, it gives a good picture of how usable a function is.
Also, the VSM test was originally intended to test a specific system. It soon became clear during the study, that a more appropriate focus would be a specific function. The reason is that users interact with the study objects systems in the way of conducting a function, like making a transfer or payment; such a function might involve several systems.

12
3. THEORY This section will focus on describing the theories on which the analysis and results will be based upon.
First, in Chapter 3.1, different forms of usability definitions will be described as well as factors affecting usability and different ways in which usability can be evaluated.
In Chapter 3.2, the agile development technique will be described, and examples given on how it is implemented.
Chapter 3.3 will describe theories focused on buyer competence and how this is connected to usability issues.
Lastly, Chapter 3.4 will discuss the history of IT investments in the financial sector and IT investments in banking.
3.1 DEFINITIONS OF USABILITY
The chapter about usability in Benyon (2010) starts with the following sentence:
“Usability has always been the central pursuit of human-computer interaction”
What is usability? There are many different definitions based on different perspectives, for example psychology or measurability. Usability is usually seen only as a non-functional requirement; to obtain a user centered system design however, both functional and non-functional requirements, where the user is in focus, are needed (Gulliksen & Göransson, 2002). Usability has also been described as a quality attribute in interactive products; a product is highly usable if it accomplishes the target group’s purposes (Ottersten & Berndtsson, 2002). The focus is on obtaining usable systems and functions connected to them.
The definition of usability has varied over time. As stated in the introduction of, one of the key factors of obtaining a successful IT-system is to include usability activities in the development process.
The choice of usability definition is secondary to actually choosing one definition and implementing a user centered system development process.
Thus, this thesis will not focus on which definition of usability is the most appropriate, and focus more on detailing if, how and to what extent usability has been implemented when developing a specific function.
There are many well used and important definitions of usability, and the following section will describe some of them.

13
ALLWOOD’S (1998) DEFINITION OF USABILITY
Allwood (1998) has a psychological definition of usability; Allwood views usability as an iterative characteristic, i.e. that usability is decided by several characteristics and the way they work together at a given usability situation. The usability characteristics are:
Adaptation to the task; the program is to follow a natural and normal structure step-by-step when solving a problem.
User friendliness. The program should give the user support for his/her way of thinking and should be adaptable to individual users.
User acceptance. It is important that the users are motivated and have a positive attitude towards the computer systems they use.
User competence. The users must understand how the program works in order to use it in a successful way in their daily work. Education, manuals and help functions increase the users’ competence and ability.
Allwood argues that we use computers to enhance our productivity. A computer program that is both effective and productive is characterized by high usability. Programs become productive when they are adapted to human psychological conditions. An interface should thus be designed so that it activates existing knowledge in the user’s memory. Humans can take existing knowledge and apply it in other settings, and this is something that needs to be kept in mind when creating a computer program and help material for it.
Allwood thus advocates an iterative development model when developing computer programs and their corresponding manuals and help material; create a first version, test it on real users, make changes, test it again etc.
This focus on psychological aspects of a system makes Allwood’s definition of usability difficult to measure and thus difficult to connect to specific usability goals.
ISO 9241-11:1998 - ERGONOMIC REQUIREMENTS FOR OFFICE WORK WITH VISUAL DISPLAY TERMINALS
(VDTS) - PART 11: GUIDANCE ON USABILITY
ISO 9242-11 is an international standard and is part of “ISO 9241 – Ergonomic requirements for office work with visual display terminals (VDTs)”. The ISO 9241-11 standard was finalized in 1998.
ISO defines usability as:
"The extent to which a product can be used by specified users to achieve specified goals with effectiveness, efficiency, and satisfaction in a specified context of use.”
The three key expressions in this definition are:
Effectiveness; this key expression describes to what extent a goal or mission has been accomplished.
14
Efficiency; this describes, as opposed to effectiveness, the degree of effort that was exerted in order to reach a goal or mission. The less effort is exerted, the better.
Satisfaction; this key expression refers to the degree of satisfaction and positive feelings that the product brings forth when used.
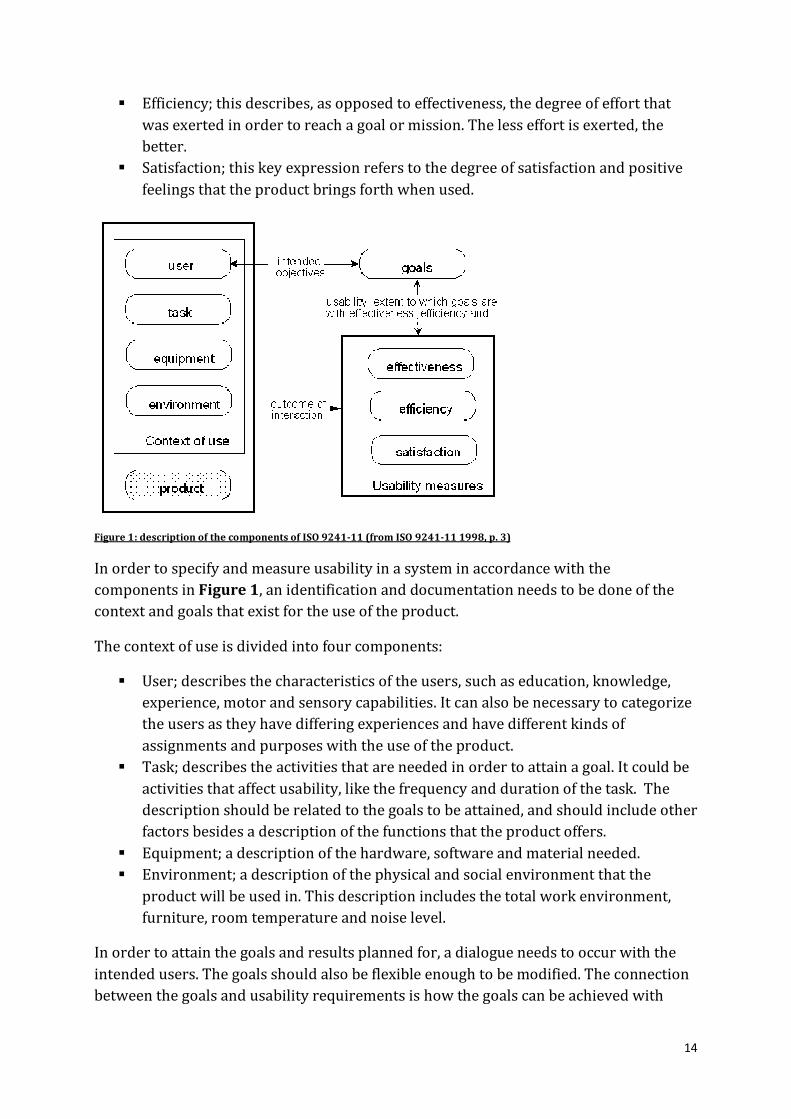
Figure 1: description of the components of ISO 9241-11 (from ISO 9241-11 1998, p. 3)
In order to specify and measure usability in a system in accordance with the components in Figure 1, an identification and documentation needs to be done of the context and goals that exist for the use of the product.
The context of use is divided into four components:
User; describes the characteristics of the users, such as education, knowledge, experience, motor and sensory capabilities. It can also be necessary to categorize the users as they have differing experiences and have different kinds of assignments and purposes with the use of the product.
Task; describes the activities that are needed in order to attain a goal. It could be activities that affect usability, like the frequency and duration of the task. The description should be related to the goals to be attained, and should include other factors besides a description of the functions that the product offers.
Equipment; a description of the hardware, software and material needed. Environment; a description of the physical and social environment that the
product will be used in. This description includes the total work environment, furniture, room temperature and noise level.
In order to attain the goals and results planned for, a dialogue needs to occur with the intended users. The goals should also be flexible enough to be modified. The connection between the goals and usability requirements is how the goals can be achieved with
15
effectiveness, efficiency and satisfaction. The product itself should follow the usability requirements with these three attributes.
The ISO definition states that the product must be adapted to the specified users, their specified context and their specified goals. The ISO definition of usability puts a lot of focus on the specified users getting their needs satisfied.
This is the most used definition of usability, as it is quantifiable.
NIELSEN’S (1994) DEFINITION OF USABILITY
Nielsen (1994) describes usability as a quality attribute of a system, which assesses how easy it is to use; Nielsen uses the following five quality components to define usability:
Learnability: How easy is it for users to accomplish basic tasks the first time they encounter the design?
Efficiency: Once users have learned the design, how quickly can they perform tasks?
Memorability: When users return to the design after a period of not using it, how easily can they reestablish proficiency?
Errors: How many errors do users make, how severe are these errors, and how easily can they recover from the errors?
Satisfaction: How pleasant is it to use the design?
According to Nielsen, about 10% of the budget set up for the development of a system should be set aside to improve usability.
3.1.1 OBJECTIVE GOALS TO MAKE SYSTEMS USABLE Nielsen (1994) suggests the following work flow when creating a usable system:
1. Before starting the new design, test the old design to identify the good parts that you should keep or emphasize, and the bad parts that give users trouble.
2. Unless you are working on an intranet, test your competitors' designs to get cheap data on a range of alternative interfaces that have similar features to your own. (If you work on an intranet, read the intranet design manual to learn from other designs.)
3. Conduct a field study to see how users behave in their natural habitat.
4. Make paper prototypes of one or more new design ideas and test them. The less time you invest in these design ideas the better, because you'll need to change them all based on the test results.
5. Refine the design ideas that test best through multiple iterations, gradually moving from low-fidelity prototyping to high-fidelity representations that run on the computer. Test each iteration.

16
6. Inspect the design relative to established usability guidelines, whether from your own earlier studies or published research.
7. Once you decide on and implement the final design, test it again. Subtle usability problems always creep in during implementation.
Nielsen also points to the importance of doing users tests early on in system development and to keep testing at every step, as problems that may occur will be more difficult to correct later on.
3.1.2 FACTORS AFFECTING USABILITY Which factors that affect usability depends on which definition of usability is used. Allwood points at four important factors: (1) adaptation, (2) user friendliness, (3) user acceptance and (4) user competence.
Benyon (2005) gives the following four factors as drivers for computer system usability (PACT): (1) people, (2) activities that people want to conduct, (3) context in which interaction with the given system will happen and (4) technologies (hardware and software).
3.1.3 EVALUATION METHODS Fagerström (2003) argues that different evaluation methods should be used within the same organization, as different methods are optimal for different situations. Evaluations of IT-systems can be based on economical, strategic and organizational criteria, and give different results due to these differing perspectives.
Described below are some of the commonly used usability evaluation methods.
HEURISTIC EVALUATION
There are several methods that comprise Heuristic Evaluation. What characterizes these methods is that an expert HCI individual examines a proposed design to analyze how it measures up against a set of principles for good design, called “heuristics”.
In 1994, Jacob Nielsen (1994) defined a set of 10 heuristics which is popularly used, defined below as:
1. Visibility of System Status; provide users timely and appropriate feedback about the system’s status.
2. Match Between System and the Real World; speak the user’s language using terms and concepts that are familiar to the intended audience. Information should be organized naturally and logically based on what users are accustomed to seeing in the real world.
3. User Control and Freedom; users should experience perceived control as they interact with the system.

17
4. Consistency and Standards; user controls, icons, terminology, and error messaging should be consistent throughout the interface. Where appropriate, industry and platform standards should be applied.
5. Error Prevention; prevent user errors by user-testing the interface to identify problem areas for typical users and re-designing it to more clearly communicate the consequences of users’ actions. When deleting information that may be difficult to recreate, offer users a confirmation to delete the data. Additionally, provide the ability to undo actions that users could accidentally commit and, consequently, lose important information.
6. Recognition Rather Than Recall; reduce the memory load of users by presenting familiar icons, actions, and options whenever possible. Do not require the user to recall information from one screen to another. Use mouse-over tooltips to describe the functionality of icons which may be unfamiliar.
7. Flexibility and Efficiency of Use; novice and expert users use systems differently. The system should be easy and efficient to use by novices and experts alike. Provide “accelerators” for expert users to more efficiently navigate your application to complete the most frequent tasks.
8. Aesthetic and Minimalist Design; avoid displaying excessive information and design elements, as they will visually compete with more relevant information on the screen.
9. Help Users Recognize, Diagnose, and Recover from Errors; present error messages that give users instructions about how to recover from an error, rather than cryptic codes that users do not understand.
10. Help and Documentation; it is usually best to design an interface to be so simple to use that Help and Documentation is unnecessary; however, there may be times when it is necessary to access Help.
The problem with this method is the use of an expert instead of an actual user; what an expert views as a usable system or function will not necessarily reflect that of a real user.
THINKING ALOUD
According to Gulliksen and Göransson (2002), evaluating a system using the Thinking Aloud method means that users continuously verbalize their ideas, assumptions, expectations, hesitations, discoveries etc. when testing a system.
As an evaluator, you sit beside the users and note their thoughts while they use a system; this method is thus user centered.
As it means sitting with a user while they think out loud, this method takes time and might thus be viewed as expensive.
QUESTIONNAIRES/SURVEYS
Surveys and questionnaires are quantitative methods of evaluation. Surveys can help capture users’ opinions and thoughts about a system quantitatively, if the survey

18
questions are clearly specified and when the users’ task procedures are clearly defined (Usability First.com).
COGNITIVE WALKTHROUGH
Cognitive Walkthrough is a paper-based method to evaluate the level of usability of a system (most commonly a website). An expert checks through “steps” based on the most typical user tasks supported by the system.
The method is based on the human information processing view of cognition and was originally developed by Lewis (1990) and further developed by Wharton to apply to interactive systems in general (Wharton, 1994). The method requires the following inputs:
Understanding the people who are supposed to use the system A set of scenarios representing common and uncommon critical sequences of
activities A complete description of the interface of the system
After gathering the inputs above, the evaluator uses a set of four questions at each individual step in the interaction:
Will the user try to achieve the effect that the subtask has? Does the user understand that this subtask is needed to reach the user's goal?
Will the user notice that the correct action is available? E.g. is the button visible?
Will the user understand that the wanted subtask can be achieved by the action? E.g. the right button is visible but the user does not understand the text and will therefore not click on it.
Does the user get feedback? Will the user know that they have done the right thing after performing the action?
By asking these questions at each step, usability problems are detected.
ONE-ON-ONE INTERVIEWS
Based on a discussion guide, interviews help the evaluator gain information about the users’ attitudes towards a system. It is a method for discovering facts and opinions held by the user for a product being designed. The one-on-one interviews are usually conducted using one interviewer and one interviewee at a time.
The method can be at risk of evaluator bias, and the users’ not being sure of what they think of a system and whether it is usable in their daily work. The interview reports thus need to be analyzed carefully. The one-on-one interviews, as they are done individually, are also costly.

19
The method is effective at capturing user attitudes and identifying mistakes however, and is advised to be used in order to develop the system in a usable way.
3.2 AGILE DEVELOPMENT
On a ski trip in February 2001, 17 software developers met up and wrote The Agile Manifesto (Beck, 2001), where they describe the twelve principles of agile software. A new way of developing IT systems was born.
Agile is a set of iterative and incremental development methodologies that aim to improve quality and success rates in IT system development.
Below, two agile methods are described; only the Lean Development Software method is of interest to the study that will be conducted. SCRUM is described nonetheless, as it is a well used and known method within agile.
3.2.1 SCRUM SCRUM can be described as an agile development process consisting of a set of “sprints” lasting for about 1 to four weeks each and typically used in small projects. Tasks are described and prioritized in a backlog, which is continuously updated at the beginning of each sprint. The buyer typically meets the development team when each sprint starts, but does not influence the team in-between such meetings.
SCRUM is an iterative process, unlike the traditional linear waterfall process, which makes it possible to go back and change specifications from the buyer organization. This also makes it difficult however, to plan in advance how to develop a project in a straight line fashion.
3.2.2 LEAN SOFTWARE DEVELOPMENT Lean Software Development is an “agile” approach to lean production, and can be viewed as the IT form of the lean production framework.
Lean production is a concept based on the Toyota Production System. As defined by Poppendieck (2007), software development in this context is seen as an empirical process. Poppendieck developed seven principles of Lean Software Development that is the core of the method which its tools are based upon.
The seven principles are:
1. Eliminate waste; this includes partially done software and unused extra features 2. Build quality in; testing to prevent, not to find them. Write simple code, and
expect to change it when necessary. 3. Create knowledge; software development is a knowledge process, and detailed
design of the software should come during coding, not prior in the form of requirements
4. Defer commitment; plan thoughtfully and commit sparingly.

20
5. Deliver fast; deliver software fast and with quality by continuously improving processes
6. Respect people; this principle follows three cornerstones: a. Having an entrepreneurial leader b. Expert technical workforce; companies should nurture expertise within
their organization instead of buying and selling it c. Responsibility-based planning and control; allow self-organization to
achieve goals for the teams responsible for a project. 7. Optimize the whole; do not optimize tasks separately
Lean production focuses on waste elimination and customer needs. Once value has been defined, lean production focuses on mapping which activities are value adding and non-value adding. Poppendieck has translated Shingo’s (1981) Seven wastes of manufacturing into the Seven wastes of software development:
1. Partially done work 2. Extra features 3. Relearning 4. Handoffs 5. Task switching 6. Delays 7. Defects
Once this mapping of a process is complete, focus shifts to waste elimination.
There are several tools and frameworks that have been designed to implement Lean Software Development. This thesis focuses on one of these tools, Value Stream Mapping (VSM), which can be adapted to non-production processes.
3.2.3 VALUE STREAM MAPPING VSM is a tool that helps an organization visualize its work processes using visual maps; the goal of VSM is to identify, demonstrate and decrease waste in such processes. VSM can be viewed as a diagnostic tool used in lean initiatives. The definition of waste in this context is any activity that does not add value to the final product. As it helps identify value adding/decreasing activities, VSM can be viewed as a strategic planning tool.
VSM is mainly used for production environments, but can be adapted for non-production environments. Simple icons and notations are used when implementing VSM, and for this thesis the icons below will be used (see Figure 2).

21
Figure 2: VSM, current and future state icons; the time taken to finish each step is to be indicated beneath each step’s icon
The current state map provides information on the current process, from start to finish. After completion of a current state map, a future state map is created using lean principles to redesign the current process where waste is eliminated. According to Poppendieck, a future state map is not an ideal map, but shows an improved state. Once the biggest delays are addressed, a new current state map and subsequently future state map are drawn.
In this thesis, Value Stream Mapping will be used to map a process; a function carried out by users, which might incorporate several systems. The function is to represent an average function used by users, external (customers) or internal (employees).
Poppendieck suggest mapping a project when using VSM, but this is regarding systems being developed. The objective of this thesis does not necessarily focus on projects under construction, it is rather expected that the process to be mapped is a systems or systems currently under use.
As VSM uses simple tools (one only needs a pen and paper, or an Excel sheet) it is a very cheap and effective method to use when evaluating the usability of a process.
This thesis will map how long a function takes to carry out by a “normal user”, and how long it takes for an “expert” to carry out the same function. This thesis defines a normal user, expert user and function as described below:
Function: an activity, like (i) paying a bill online, (ii) filling in a transaction order at a branch office or (iii) a small company using its system infrastructure to connect to a bank in order to check the company’s deposit balance, etc.
“Normal user”: a normal user is a part of the intended User Group, as defined during production of the system/systems that are affected when a function is carried out
“Expert user”: an expert user is someone (i) with deep understanding of what systems are involved in executing the function and (ii) has deep knowledge in how to exactly and correctly execute the function
When the clocking of activities is done, the expert user execution time is set as min. value, and the normal users’ average execution time is analyzed.
The definition of value added activity for a bank can be defined as:
Current State1 2 3
Logging in Transfer Confirm
Future State1 2 3

22
Activities that reduce the bank’s non-interest costs (ex. reduction of maintenance on existing IT systems)
Activities that generate revenue (for example, getting new public or corporate clients to pay for more products and services)
Waste is defined as all activities that do not fulfill the criteria stated above. An example of waste is an internal user spending time on repairing existing code instead of creating revenue generating projects, or an external user spending too much time on an activity, and later on chooses a competitor to get the job done faster. Another example is customers calling the bank’s IT Support, which is a cost to the bank in the form of employees and other administrative, non-interest costs.
3.3 BUYER COMPETENCE AND USABILITY
Besides being usable, a system is expected to fulfill the needs of the buyer as well (Ottersten & Berndtsson, 2002). It is often assumed that the buyer knows exactly what the purpose of the IT system to be developed is; most often though, the buyer has a thought or an idea as to what the purpose of the system is, and such needs can change as time passes by. Such ideas are not enough by themselves to make a development process succeed, as they most often are too vaguely formulated. The criteria defined by the buyers are not always related to usability, e.g. product life, adaptability of the product etc.
Ottersten and Berndtsson (2002) argue that, regardless of how the buyer specifies the purpose of a system to be developed, it is the sum of many users’ experiences and usage of a system that generates benefit to the buyer. The authors also argue that requirements are captured in three steps:
1. Mapping the idea behind the system (interviews and workshops with the buyer and idea generation).
2. User group analysis (interviews and observations of users in their working environments).
3. Requirement specification (detailing and specifying requirements; user and system requirements are synced in this step).
In particular, step 3, the system requirement specification should clearly state the benefit per user group, the context in which the product is to be used, usability goals and general requirements regarding the product’s presentation and behavior.
When evaluating a project’s cost versus its benefits, one of the methods used in the IT sector is the PENG method. The PENG method (Prioritering Efter NyttoGrunder, Eng. prioritizing based on benefits) is used to evaluate IT investments, in the means of conducting a benefit analysis (Dahlgren, Lundgren, Stigberg, 2000). The method uses ten steps further categorized into preparation, analysis and securing quality.
The ten steps are:

23
Preparation
1. Decide on the purpose 2. Create insight 3. Decide upon and limit the object 4. Describe the object (processes/system)
Analysis
5. Identify benefit effects 6. Structure the benefit effects 7. Value the benefit effects 8. Calculate the costs of the benefit
Securing quality
9. Validate and estimate the risks and hindrances 10. Calculate the net benefit, determine who is responsible for the different benefit
effects
PENG can also be used to analyze an investment already made, to ensure that it adds value to the company. The fourth step in the PENG method is describing processes, where the mapping of before and after states are used; this is very similar to the value stream mapping approach used in Lean Software Development, as described by Poppendieck (2007).
3.4 IT-SYSTEMS IN FINANCIAL FIRMS
3.4.1 HISTORY OF IT IN BANKING Banks have always needed to handle large quantities of information. In adaptation to the nature of their business and competition, banks started adopting technology early. The first calculator of sorts for office use was introduced in 1887, called the “Comptometer”. Storing data on punch cards, the so called tabulation machines, was introduced by Herman Hollerith by the end of the 19th century. Such small revolutions none the less, paper information was key until the World War 2 (Steiner & Teixeira, 1990), as there was no technology powerful enough to replace the paper information used by banks. Though banks were helped by calculators and tabulating machines, these devices did not help the banks store data in any other way than on paper.
This changed when computers started being developed, and banks became early adopters of them.
Along with new technology, came new programming technologies. IBM created the Report Program Generator (RPG) language in 1959 in order to facilitate the transition for IBM tabulating machine unit record equipment technicians to the new computers being created. COBOL was an alternative programming language available at the time. COBOL is business and finance oriented and is, still today, used extensively by banks.
24
Movin and Zandelin (2009) address the paradigm shift that we see today, the change in our view of data storage; the change from storing data in internally used computers and servers to cloud computing. Cloud computing, in short, means that certain functions such as the usage of a word-processor, are not run from the company’s own internal systems but outside of it, “in the cloud”, i.e. the internet (external servers). One concern that has been raised regarding cloud computing and storing data “in the cloud” has been the safety issue; on the question of how secure “the cloud” is, three security managers say that sensitive data should not be stored in the cloud (Ingenjören, nr 2 2011, p. 20). One can argue that customer data handled by banks is highly sensitive data.
What the next IT revolution in banking will be remains to be discovered.
3.4.2 IT INVESTMENTS IN BANKING In an article by iET Solutions featured at Financial Services Technology (Issue 5, ITSM & Performance Mgmt), the work of a CIO of a financial firm is described as:
“CIO’s of financial services and insurance firms must balance multiple objectives: maximize return, mitigate risk, improve performance and increase agility. These objectives need to be accomplished in the midst of an unparalleled and often unpredictable amount of change”
The major function of IT investments for banks are to minimize non-interest expenses, roughly put (Steiner & Teixeira, 1990). The authors estimate that about 65% of the total IT-system expenses of banks go to support the function associated with funds transactions; the rest of the expenses are attributed to distribution (i.e. branches) and customer services. Distribution in particular, is one of the key factors adding value to banks, as the differing services offered by banks become very noticeable to customers through branches. Obviously, a change in this investments trend, investing more in value added functions rather than routine ones, is necessary to gain competitive advantage in the long run.
Steiner and Teixeira point at three kinds of IT-investments; investments in core technology (what the authors call M1), investments in application software which assists the core technology (M2) and software targeted at customers (M3).
The M1, M2 and M3 terms will be used to address core technology, assisting software applications and software targeted at consumers in this thesis.
Financial firms are, according to Hitt et al (Hitt, Frei, Harker, 1998), the major investors in information technology in the U.S. economy, where banks spend as much as 15% of non-interest expenses on IT. According to Hitt et al, there are large variations in performance and efficiency in the outcomes of IT investment decisions.
Banks’ IT-budgets are high, and are estimated to grow until what the authors identify as the underlying physical limits of computer technology is reached (Steiner & Teixeira, 1990). Applications are the heart of banks’ IT infrastructure; it is thus interesting to see
25
that of the budget set aside for applications investments, 50-80% is spent on maintenance of old programs (Steiner & Teixeira, 1990).
As the authors also state, the constant growth in processing power of computers will lead to more change, and requires banks to be properly prepared for this fact.
Brynjolfsson and Hitt (1994, 1996) and Lichtenberg (1995) found that IT investment had a positive and statistically significant contribution to firm output. Brynjolfsson and Hitt (1998) also found a strong relationship between IT and productivity growth and that this relationship grows stronger as longer time periods are considered.
Prasad and Harker (1997) conclude in a study of retail banks in the U.S. that additional investments in IT may have no additional benefit for the banks and is more of a strategic choice to stay in par with competition, but that IT labor contributes significantly to output; their study focuses both on productivity and profitability, based on Brynjolfsson and Hitt’s distinction of the two issues. Their results state that while banks may have overinvested in IT capital, they benefit from hiring and retaining IT labor. The authors also observe that when looking at the dollar amount of money spent on in-house vs. outsourced IT, the former has a positive correlation with firm performance (27%) while the latter had a negative correlation with firm performance (-9%). Similar results are obtained when looking at IT development budgets; they found that the more in-house development a firm has, the better the firm performance (19.2%) and the more outsourcing the worse the performance (-7.5%). That is, firm performance is affected positively if the firm has in-house development, and is affected negatively if it outsources its IT system development.
Parsons et al (Parsons, Gotlieb & Denny 1993) find evidence supporting the hypothesis that investments in IT leads to economies of scale and output growth without an increase in inputs.
Alpar and Kim (1991) examined the cost efficiency of banks overall and found that IT investment was associated with greater cost efficiency, although the effects were less evident when financial ratios were used as the outcome measure. Brynjolfsson and Hitt (1995) found that “firm effects” can account for as much as half of the contribution of IT found in these earlier studies; recent results have found these firm effects to be organizational and strategic factors. Firms with more delegated authority and teams make greater investments in IT and receive greater benefits from it. Regarding the strategic factor, firms that invest in IT to create more customer value have greater performance than firms that invest in IT to reduce costs.
New regulation such as Basel 3 and MiFID 2 will also call for more IT investments, in order for banks to comply with these new regulations. In an article by ComputerWeekly (Nick Huber, 2004), Georgina O’Toole states that such regulation changes help to better integrate IT systems and enhance datacenters.

26
4. EMPIRICAL STUDY An object firm will be studied using a case study approach, based on the single-case study definition by Yin (2009). The following methods will be used in the case study:
Interviews of the IT departments within the study object, and - if allowed – the studied IT function’s end users
Value Stream Mapping; clocking the time used for each step of a specific function Go through the study objects IT-system documentation
The results will be compared to the interviews and existing theory on VSM and usability.
4.1 RESEARCH DESIGN
A research design, as defined by Yin (2009) guides a researcher through the processes (1) data gathering, (2) analysis and (3) interpretation of results. The chosen research design sets the boundaries of generalizations of the results obtained.
Yin describes three kinds of investigations that can be carried out using a case study: exploratory, explanatory and descriptive. This thesis follows an exploratory research design, as a result of the chosen problem description.
The research design encompasses a case study, where interviews and a Value Stream Mapping test will be conducted.
According to the theory behind VSM, waste can be defined as time better spent on other activities. According to HCI theory, such waste can decrease or be eliminated by incorporating usability into the design of a function.
A step-by-step implementation of VSM has been suggested by Tapping et al (Tapping, Luyster, Shuker, 2002), which consists of the following three steps:
1. Selection of a function to analyze and constructing a Current State Map (CSM) for the selected function
2. Identification and analysis of wastes encountered along the value stream 3. Design of a Future State Map (FSM) which depicts a future state in which the
wasteful activities are removed from the function
As stated in the thesis limitation (Chapter 2.1, p. 9), a Future State Map will not be created within the boundaries of this study, as it is the execution of the test itself and the obtained Current State Map that are of interest.
Thus, only step 1 and step 2 will be executed. Step 2 will not be an in-depth analysis of the wastes that might be encountered (such as wastes relating to the M1 and M2 parts of the banks’ IT systems connected to the function to be analyzed). Instead, the waste analysis conducted will be based on the M3 part of the internet platform, and will be based on the results from the CSM and test user comments.

27
The study object can choose to take the obtained results (or preferably, conduct their own VSM) and further analyze the wastes encountered and conduct step 3:
In order to follow up on the test conducted, the bank could choose to create a Future State Map. The steps needed to create a Future State Map are the following:
Taking the results from the Current State Map, locate the wasteful parts of the function
Identify ways in which systems involving the function can be changed or adapted in order to remove waste from the process
Locating waste is aided by the Current State Map, which will give quantifiable results on the usability of the function (comparing the time taken by an expert in relation to that of a normal user executing the function) and user comments which will be gathered.
Actually using the results obtained from the Future State Map to make the execution of the studied function more usable will take time depending on which systems are affected by the wastes identified. The number of systems affected is also an important variable in determining how much time and money such changes need.
The knowledge of the existence of waste (and the nature of the waste) in their systems and functions can be a valuable asset for the banks when they invest in future, more efficient systems and functions.
28
5. CASE STUDY
5.1 CHOICE OF CASE OBJECT
The bank that will be studied is Handelsbanken (SHB). Together with Nordea, SEB and Swedbank, Handelsbanken is considered to be one of Sweden’s largest banks. Handelsbanken is the chosen study object, and will be used to generalize around the other three major banks and other financial firms in Sweden in the extent this is possible; such generalization should be done with caution, as one cannot generalize on the basis of one study object.
Interviews will be conducted with Handelsbanken’s different IT divisions, as well as a representative from the management.
5.1.1 BUSINESS AND ORGANIZATIONAL DESCRIPTION The bank was founded in 1871, and is today operating in 22 countries with 11 000 people employed.
Handelsbanken (SHB) has a philosophy of focusing on customer knowledge: the customer cannot open an account online, and must thus visit one of the offices at least once during their relationship with the bank.
SHB is a commercial bank offering full service to private customers and firms, via local offices in each of the countries where the bank operates: Sweden, Denmark, Norway, Finland and the UK. The bank decentralized its operations in the 1970: ies and works primarily via its local offices, which are the heart of the bank’s operations; a quote from the bank’s website relating to its corporate philosophy is “the office is the bank”. The bank has 461 offices in Sweden, 53 in Denmark, 45 in Finland, 49 in Norway, 90 in the UK and 17 offices in countries outside the home markets.
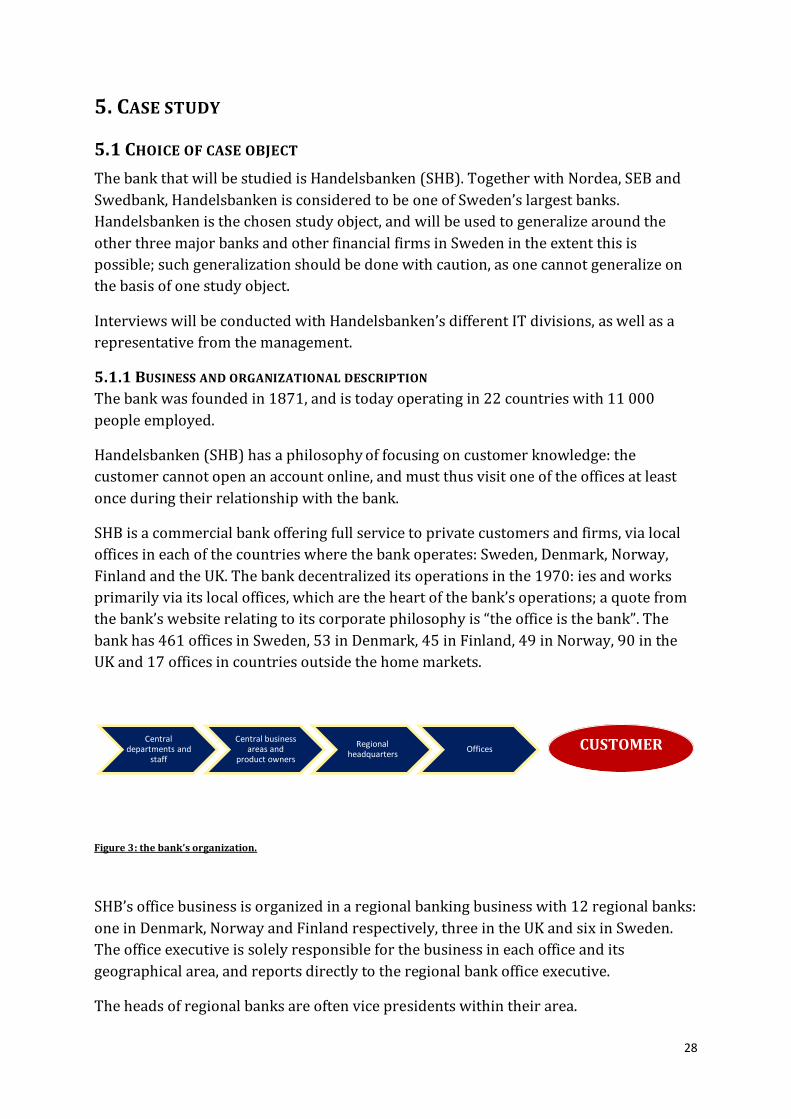
Figure 3: the bank’s organization.
SHB’s office business is organized in a regional banking business with 12 regional banks: one in Denmark, Norway and Finland respectively, three in the UK and six in Sweden. The office executive is solely responsible for the business in each office and its geographical area, and reports directly to the regional bank office executive.
The heads of regional banks are often vice presidents within their area.
Central departments and
staff
Central business areas and
product owners
Regional headquarters Offices CUSTOMER

29
5.2 EXECUTING THE FIELD STUDY
The study encompasses interviews and a VSM test, as stated above. The interviewees have been chosen from different parts of the bank’s IT and business divisions and departments.
In total, 15 people have been interviewed. Their respective roles will not be further described as to maintain their anonymity. The respective role title of the interviewees will be mentioned where relevant, but not further described.
The interviews took place in the respective office of the interviewees, and took 1-2 hours on average to conduct. Further questions to the interviewees were sent via e-mail. In two cases, follow up interviews were conducted.
The following section starts with a description of UMOD, the bank’s IT decision making tool. This is followed by a description of working with usability activities at Handelsbanken (SHB), a description of the function to be studied and the execution of the VSM test.
5.2.1 UMOD – HANDELSBANKEN’S (SHB’S) IT DECISION MAKING TOOL UMOD is a Group wise decision making tool, owned by the project offices, with the intention to make IT investments cost efficient. The focus is on the results obtained, rather than the methods used; in practice this means that the different development teams are free to choose between methods such as agile and incremental. If a project is not developed in-house, UMOD covers guidelines relating to the purchase process of external systems. UMOD is influenced by the Rational Unified Process (RUP), which is an iterative software development process framework. RUP is based on a set of content elements describing what is to be produced, the necessary skills required and the step-by-step explanation describing how specific development goals are to be achieved.
It is worth noting that UMOD is targeted at individuals within a project group who have the decision making authority and leadership position, for example buyers, investigators, key personnel within an IT project etc. This means that the workings and details of UMOD are not necessarily known to others who are not key personnel within an IT project group.
The model is a set of general guidelines, which must be followed at all times; deviation from the model may be allowed if it is well motivated and documented.
UMOD differentiates between different kinds of IT projects, depending on their financial size (program/project/mission).
A project generally has a budget over 2 million SEK, programs have budgets over 100 million SEK and missions have budgets of lower than 2 million SEK (missions are further divided into small, middle sized and large). To simplify the reading, all IT projects are called projects henceforth, if one of the project forms is not specifically addressed.

30
The following steps are what comprise the UMOD model:
Result o Investigate (initiated from the buyer). The investigation part of the
process results in benefit measures, which will aid the buyer to compare and choose between different projects
o Establish; this follows up on the investigation, creating clear result goals o Structure o Detail o Completion o Verify o Introduce
Result review Decision Planning and follow up Roles and responsibilities Templates
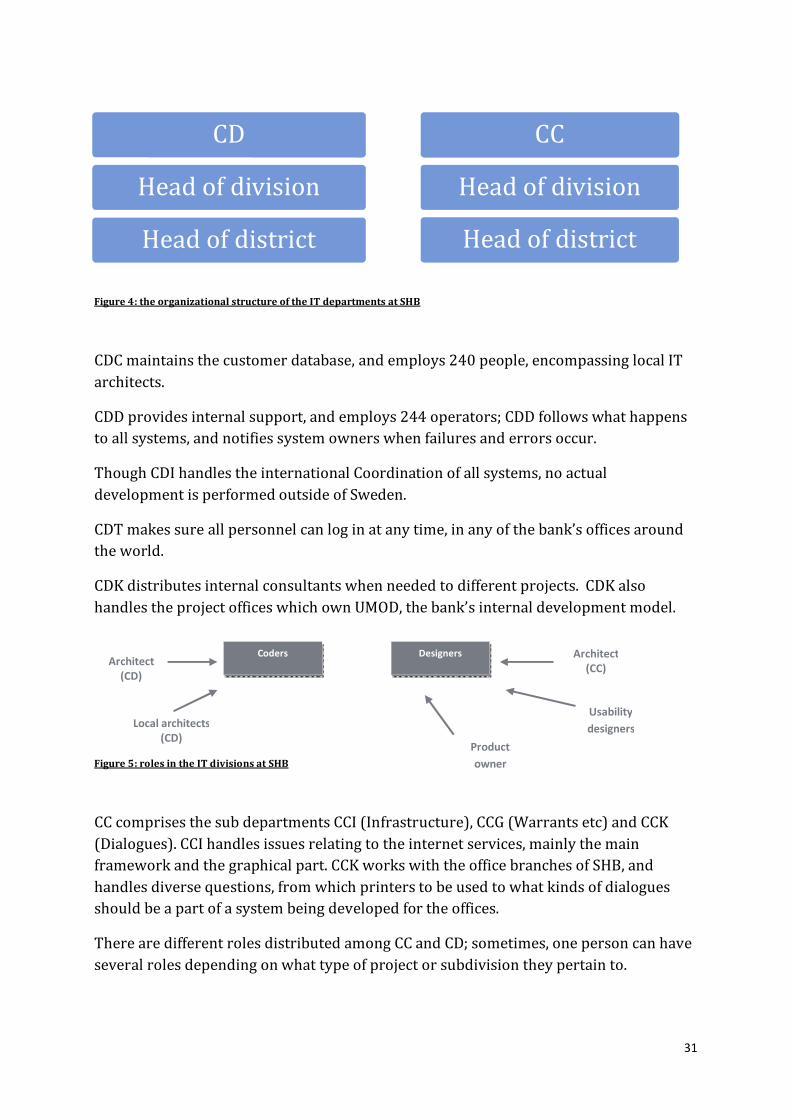
5.2.2 WORKING WITH USABILITY ACTIVITIES AT HANDELSBANKEN (SHB) SHB has two IT departments: CD (Central Development) and CC (Central Infrastructure), says a representative from the Central Human Resource office. CD can be said to hand the overall programming and development part of the IT work at SHB, and CC handles office and business support in the form of business and usability advice. In terms of hierarchy, CD and CC are formally on an equal level. The organizational map for the two IT departments is depicted in Figure 4.
Whilst the head of CD is a vice president of his area, this is not the case for the head of CC; one reason for this could be that the head of CC has not had his post for a longer period of time, but might also reflect a management view of priority between the two main divisions.
There are several project offices within Handelsbanken but the most important ones are run by CC and CD. CD is the owner of UMOD and CC is responsible for the pre-study phase.
The departments within CD are: CDB (IT support for payments, cash management, capital management and insurance), CDC (development of general systems and architecture), CDD (Maintenance), CDE (Economy), CDF (IT support for Handelsbanken Finance and Stadshypotek), CDI (International Coordination), CDP (Personnel), CDT (Technical infrastructure and IT Security), CDM (Capital Market Support) and CDK (Internal Consultants).
There are also other development departments such as HDP and HCBP which have product owners for public and corporate systems; these departments do not belong to CD or CC.
31
CD
Head of division
Head of district
CC
Head of division
Head of district
Figure 4: the organizational structure of the IT departments at SHB
CDC maintains the customer database, and employs 240 people, encompassing local IT architects.
CDD provides internal support, and employs 244 operators; CDD follows what happens to all systems, and notifies system owners when failures and errors occur.
Though CDI handles the international Coordination of all systems, no actual development is performed outside of Sweden.
CDT makes sure all personnel can log in at any time, in any of the bank’s offices around the world.
CDK distributes internal consultants when needed to different projects. CDK also handles the project offices which own UMOD, the bank’s internal development model.
Figure 5: roles in the IT divisions at SHB
CC comprises the sub departments CCI (Infrastructure), CCG (Warrants etc) and CCK (Dialogues). CCI handles issues relating to the internet services, mainly the main framework and the graphical part. CCK works with the office branches of SHB, and handles diverse questions, from which printers to be used to what kinds of dialogues should be a part of a system being developed for the offices.
There are different roles distributed among CC and CD; sometimes, one person can have several roles depending on what type of project or subdivision they pertain to.
Coders Architect
(CD)
Local architects (CD)
Designers Architect (CC)
Product owner
Usability designers

32
The business architect (CC) is responsible for usability and efficiency in the IT-systems. The interaction designer (CC) is responsible for usability issues and offers the product owners and the programming team (CD) support with Dialogues. The numbers of people with usability positions and competence are perceived to be few, however, by one of the interviewees.
CD does have a usability resource that is not part of CC, which sometimes comes in at the beginning and end of a project, usually to assist in conducting user tests.
In the ideal case, the development and programming side (CD) would have more usability competence and interaction designers who could design Dialogues and then communicate with the business architects (CC), regarding usability issues on a larger scale. In practice however, the product owner, interaction designer and the business architect are, in many cases, the ones who communicate regarding usability. A business architect at CCK, a division under CC, further feels that CD as a whole, sometimes has a narrow view of what an interaction designer does: “they usually think we do GUI’s - only surface, no depth”, says the business architect.
That usability is mainly seen as GUI is a view commonly shared among the people interviewed, even those with usability responsibilities.
SHB differentiates between a system owner and a product owner. A system owner is not supposed to have an IT background, says the Head of System Management (Cash Management) as their job is to administer systems from a business perspective; this includes following up on maintenance costs and signing Service Level Agreements with CD.
Another category of employees working alongside system owners are those who are system responsible.
Employees who are system responsible at the CDBO sub division (payments part of CD) have a mixed educational background; the three system responsible who were interviewed had studied Applied System Science, Computer Technology Development and a mixed IT and economy degree, respectively.
The official bank definition of the role system responsible, according to the deputy area manager, is:
“As a system responsible, you have full responsibility of the development, administration and maintenance of the system towards the system owner. You are the supplier’s (CD’s) contact person regarding all things related to the system in question”.
The system responsible can be said to have the technical responsibility of a product, and to warn the product owners if they find flaws in their ideas. The 15 system responsible at CDBO administer around 40 java based systems and 10 COBOL based systems.

33
CDBO mainly works with Cash Management (the corporate side), but also with Private Banking systems. CDBO as a sub division came to be after an acquisition of Skånska Banken in 1990, and employed 12 people. Today, CDBO comprises around 37 employees and three consultants. This increase in employees and focus on the CDBO branch, situated in Malmö, was a strategical action based on the business knowledge and competence existing at the office, states the deputy area manager.
CDBO is responsible for systems’ architecture, presentational interface (GUI), databases and business logics.
The bank, and the banking sector in general, did not offer much self-service to customers in the 90: ies, says the deputy area manager; the customer went to the bank, not the other way around. This changed around the end of the 90: ies, and in 1997 SHB launched its internet payment platform. Today, CDBO’s work focuses mainly on self service and payment systems.
When asked about the Core Technology (M1) part of the systems used, such as Bankgirocentralen (BGC), the deputy area manager states that they are satisfied with it, and they have had no problems with it. The Bgc system is used for batches at night but has also been used day time with the internet payment platform without any incidents, says the deputy area manager. The deputy area manager clarifies that it is important that all transactions are trimmed, to ensure efficient transactions.
Bankgirocentralen is, according to the definition on its official website: “Bankgirocentralen BGC AB offers products and services for clearing of payments, transfers, electronic invoices and security on the Internet in Sweden.” Bankgirocentralen is owned by SEB, Swedbank, Handelsbanken, Nordea, Danske Bank, SkandiaBanken, Ålandsbanken Sverige AB and Länsförsäkringar Bank.
CCI is identified as the main partner to communicate with regarding usability issues by all interviewees at CDBO. CCI provides style guides which govern certain part of the work conducted at CDBO. Product owners are also identified as a part of the SHB organization that CDBO has close communication with; the product owners approach CCI with an idea, which they later take up with CDBO.
Two system responsible of Java systems (the presentation layer of COBOL) say that SHB’s decentralized organization has both strengths and weaknesses. The freedom to choose models and work as it befits the situation gives them a certain freedom, say the two system owners. UMOD is not used actively by them, though they know it is used for larger projects.
One of the system responsible says that “we are responsible for making sure that what the customer puts into the system gets into SHB’s systems”.
Keeping and maintaining old systems is not seen in good light at SHB they state: “If you keep systems that are too old, the transfer pricing system used in the bank will lead to
34
these systems having to write down functionalities to cheaper and more efficient solutions”.
When asked as to how cost benefit calculations are executed, they did not recognize the PENG method.
The M1, M2 and M3 model way of thinking (Steiner & Teixeira, 1990) is not used specifically as concepts, but the structure of their payment systems is divided into these three categories, say the two system responsible.
If they are to use the terms M1, M2 and M3 to describe SHB’s IT systems and programs, the system responsible state that CDBO is moving from an M3 focus to changing the technical layer of M2. M2 is usually coded in COBOL, whilst M3 is coded in Java. An alternative is needed to COBOL they say, as the programming language is no longer a part of most programmers’ educational curriculum. The coders at SHB are given internal education in COBOL, to enhance the competence in this area.
On the organizational aspect, one of the system responsible from CDBO states that she has regular and good contact with the product owners in Stockholm; usually, she contacts them 2-3 times a week. Communication with CCI is another matter, as CCI is perceived to be a narrow sector; the two system responsible wish for more cooperation in order to draw from each other’s competences.
In good times, money is spent on usability, and is scaled back during bad times. “We need to raise awareness regarding usability activities, among ourselves and others” one of the interviewed system responsible says. “Getting more education in the matter would be worth a lot to us”.
Big changes due to regulations like SEPA that need to be conducted quickly can lead to usability actions having to be set aside.
When asked about how usability activities are incorporated into his daily work with one of the systems, the system administrator interviewed stated that it is always there; he simply thinks of how he himself uses the bank’s payment platform as a customer. The system administrator gives an example of a change done in order to improve usability: when users use the scroll box intended to bring forth a list of previously chosen accounts to pay with, the user was presented with the one used the latest. This presented the problem of users accidentally choosing an account with low balance when making payments. The user is, after the change, presented with a blank payment account scroll bar.
Further asked about how usability activities are prioritized in his work, the system administrator states that “making functions work comes first, then usability issues. Errors simply cannot be allowed to occur when it comes to transactions. The amount of time we can put down on usability work depends on how good the requirement

35
specification is. When you arrive to the user interface of the development process, it is basically impossible to go back and conduct usability work”.
Speaking of the buyer competence in the bank, the system administrator states that the communication with the buyers could be improved. The system administrator feels that certain individuals within the organization think too much on their specific products and systems; this creates incentive problems he states, that could affect development quality and the execution of usability activities.
The system administrator states that he does tell the buyer if they have forgotten something in the requirement specification, as to help them with the requirement specification process.
Testers and test leaders work alongside system owners and system responsible both in Stockholm and at the Malmö CDBO office. A test leader plans the tests and staffing for different tests. A test leader at CDBO states that they always have the usability of their product in focus when working. When conducting tests, no external customers are used. Access to them is granted indirectly however: “I keep regular contact with IT Support to gain knowledge about what customers want. The customers’ wishes direct much of the projects and missions that are conducted in the bank” says the interviewed test leader.
The use of tests is mainly conducted when a system is finalized; “I am working on getting us early into the development process” states the test leader.
The role as test leader varies, depending on what system they are working with. “We have customer oriented eyes. It is stated clearly in the vision of the bank, to always have the customer in focus. The value of usability work is highlighted in the internal education we get as test leaders”, says the test leader.
The test leader states that there is a focus on the product ownership structure by certain individuals – the internet platform is divided into different product owners - and that this can take away focus from customers and affects the usability of the bank’s products.
Asked about their budgets or Economic Business Planning (EVPL) as it is called in SHB, the test leader says that they use a method sounding similar to the PENG method.
The test leader states that customer support get annoyed customer calls when usability measures have not been included in a new project, and one quickly notes that the costs of taking all these calls costs more than implementing usability activities. “IT Support has great knowledge about customer needs, and we at the bank need to become better at involving IT Support in the changes that are done to the internet platform”.
Listening too much to the customers who call in can be problematic however, as the callers do not necessarily represent all other customers. The test leader agrees that this can be a problem, and exemplified with a calendar function that many callers wished for, but that many others complained about when it was introduced.

36
When asked, the works superintendent at the IT Support says that around 90-95% of the calls they receive are regarding internet related issues, and around 10-15 % of these are related to transactions. When a change has been introduced as a consequence of customer feedback regarding a certain issue, IT Support notice that calls relating to that issue decrease.
The bank has both an internal and external IT Support, and the interviewed works superintendent belongs to the external one. “It is not uncommon that we get internal calls as well though”, says the works superintendent.
The most recurrent calls are regarding transactions, questions relating to the SHB offices, file questions etc.
The works superintendent states that there are many different types of customers who call in: “they are used to different kinds of systems, and all have their own different habits” says the works superintendent.
Making available and user centered platforms is important and it is something the maintenance leader feels he gets support for from the rest of the organization “they understand the value in what we do. The product owners are very good at listening to what we have to say”.
Product owners are product specialists with responsibilities regarding the functionality, packaging and economy of products (SHB Annual Report 2010, p. 14). Product owners are perceived to be the visionaries and marketers of the bank’s products towards customers; they are the ones who come up with ideas which they present to the system owners and CD in order to start an investigation on whether a project is warranted and profitable. Product owners’ work incorporates usability to a large degree, states a product owner at the private payment development team (HDPU). Usability in the product owner context is defined as GUI by the interviewed product owner; usability is defined as the interface part of the systems (M3), and not the underlying technology or software (M1 and M2).
The Head of Business and Product development for Private Banking (HDPU), also head of the 12 product owners at the private payment development team, states that usability is a part of his and his colleagues’ daily work. When asked as how often the internet payment system for private customers is changed due to customer feedback, the head of HDPU answers that though the core platform has not been changed since the start in 1997, the graphical interface is changed on a regular basis. It is difficult to change the interface in a way that pleases all customers, and there is also a risk to changing it; the head of HDPU argues that customers whish for internet payment functions to remain the way they are used to them, and sometimes react negatively to changes.
Evaluations and follow ups are conducted regularly at HDPU on the products developed but not using big customer surveys, which is a budget issue says the head of HDPU; HDPU mainly works with missions (the smallest form of IT development project, usually

37
with a budget of 100, 000 – 2,000,000 SEK) and evaluations become expensive in this context. There are mainly three types of evaluations done by HDPU:
1. The main customer group is contacted, and customers are chosen in a randomized fashion. Round table discussions are conducted, and statistically significant results are obtained.
2. Evaluations where customers are chosen when entering a branch office, and are asked to think about and discuss a specific function. These evaluations are not conducted in a scientific manner.
3. Customer feedback left via customer support
The last form of evaluation is the one most commonly used. Though the head of HDPU agrees that more evaluations involving end users would benefit the bank, he states that it is not possible to conduct them for smaller missions.
One factor that might increase profitability argues the head of HDPU is internet penetration; the bank would make 3.5 billion SEK extra per year if internet penetration could be increased.
“Our core systems for payments is good and stands well regarding performance, economy and functionality but we miss the bit about new technological solutions in the customer graphical interface, we know that, but our systems get the job done”, states head of HDPU. It is core functionality of the internet payment system that matters the most for customers the head of HDPU argues, not the latest technical solutions.
The Head of Business Development and the product owners on the Cash management (corporate) side, says that the bank defines the role of product owner as working with (1) functionality, (2) packaging, (3) economy, (4) competitor coverage and (5) sales support. “As a product owner, you own the money” says the head of business development. The product owner is the one who decides how much money that is ok to spend on a project; in taking such a decision, the product owners must find out how much money they will get back on the investments they make, in relation to the costs. The head of business development states that many of the investments made are purely for the sake of keeping up with competitors, and are thus products that not necessarily will pay for their costs.
The money made per company is higher than the money made per private customer. The pay function for the corporate systems is also much more advanced than the one on the public side, states the head of business development. The payments made on the corporate side are huge, and the system requirements are set with this in mind.
The interviewed business architect brings forth the matter of how important questions reach top management, and that more people within top management should know more about IT. The need for more insight regarding IT might be one way of addressing the view of usability as being a GUI issue, the business architect argues.

38
The uphill road to acceptance by CD (of the work done by CC) and the buyers of IT-systems is perceived to be high and the responsible parties must sometimes be convinced of the value of adding usability activities in the budget. The pricing methods used by the buyer are, from the usability perspective, viewed as flawed, as they do not encompass future costs due to the lack of usability and future cost reductions due to usability features in the systems. This affects efforts in securing quality in the end products (IT-systems), and the burden of providing proof of how usability can increase quality in accordance to how much it costs falls on CCK.
A technical architect (TA) from CD with responsibility for internet security perceives the use of UMOD as very good and consistent. She had a very good overview of the different parts of UMOD, and when to use them. The TA perceives that there is always a priority to make between usability and safety issues, as these do not go hand in hand; more usability will require less security and vice versa.
The TA states furthermore that it is difficult to put a price and cost tag on issues such as usability and the goodwill it might entail with customers and employees, which will affect how they are handled in the cost analysis process. When doing a cost analysis, the “PENG” method is used, says the TA.
That the bank uses the PENG method for cost benefit analysis regarding IT investments is further confirmed by a representative from the SHB management.
The IT investment strategy of SHB regarding Core Technology is a wait-and-see approach, says the Head of System Management. The head of system management states that she is not worried about the M3, consumer oriented investments; such investments do not take a lot of time and money to conduct (for example, changing a website or an interface). What worries the head of system management however are the M1 and M2 investments (investments in core technology and assisting application software). The bank is dependent on old core technology for their payment transactions. The Swedish banking system is old, and is based on old systems. The head of system management argues that Sweden lacks a lot of the new banking technology infrastructure we see in emerging markets.
The development of systems and products, as well as product improvement is made in each country separately, in a decentralized manner; systems such as the one for the internet payment might thus look differently for the different SHB country branches (SHB Annual Report 2010, SHB, p. 14).
The bank is limited in what it can do due to laws and regulations, and the head of system management’s team work a lot with compliance issues such as SEPA (Single Euro Payment Area) and PSD (Payment Service Directive). Tough not mandatory by law in Sweden, it is a regulation all banks must abide by in order to conduct transactions with the US.

39
30% of the budget of the System Management Division is spent on complying with different laws and regulations, 20-25% on technically mandated activities, 10-15% on infrastructure and the rest is spent on development.
5.2.3 THE FUNCTION TO BE STUDIED Instead of testing a system or set of systems, we will be testing a function. Both the interviewed head of system management and business architect assert that the bank is moving from looking at systems to looking at functions or processes.
The function to be studied, and which we will base the VSM upon, is the function at the heart of all banks: making a payment or transfer. Here, one can choose the payment or transfer function for corporations or private customers, and this thesis will focus on the transfer function for private customers. The reasons behind these choices are
The problem of getting test users to pay for a payment live, in relation to getting them to make a simple transfer of money to a different account
Private customers are easier to get a hold of then corporate customers The main customer base of the bank are private customers, even though
corporate customers are more profitable on a per customer basis
Making a transfer, as a private consumer can be made either by (1) going to one of the SHB offices and transferring manually or (2) transferring via the internet.
The process to be studied is making a transfer via the internet. We will follow users through the transfer steps, from logging in (start) to signing the transfer to another account outside of the bank (finish).
The steps included in the function transfer are stated below:
Step 1: Logging into SHB's internet payment platform. Step 2: Going into the dialogue “Pay and Transfer” (Betala och Överföra) Step 3: Going into the dialogue “Transfer” (Överföra) Step 4: Registering the amount to be paid, to whom and when the payment shall
be made Step 5: Confirm (pressing the “Execute” button)
Step 1, steps 2-4 and step 5 will be clocked as three separate steps when conducting the tests around the function Transfer.
5.2.4 CONDUCTING THE VSM 10 of the VSM tests were conducted at an SHB office and 3 at the respective location of the test user (one at KTH and two at the respective domiciles of the test users).
5 of the test users were male, and 8 were female.
The age span among the test users was 21 to 67 years, and the average age of the test users was 40 years.
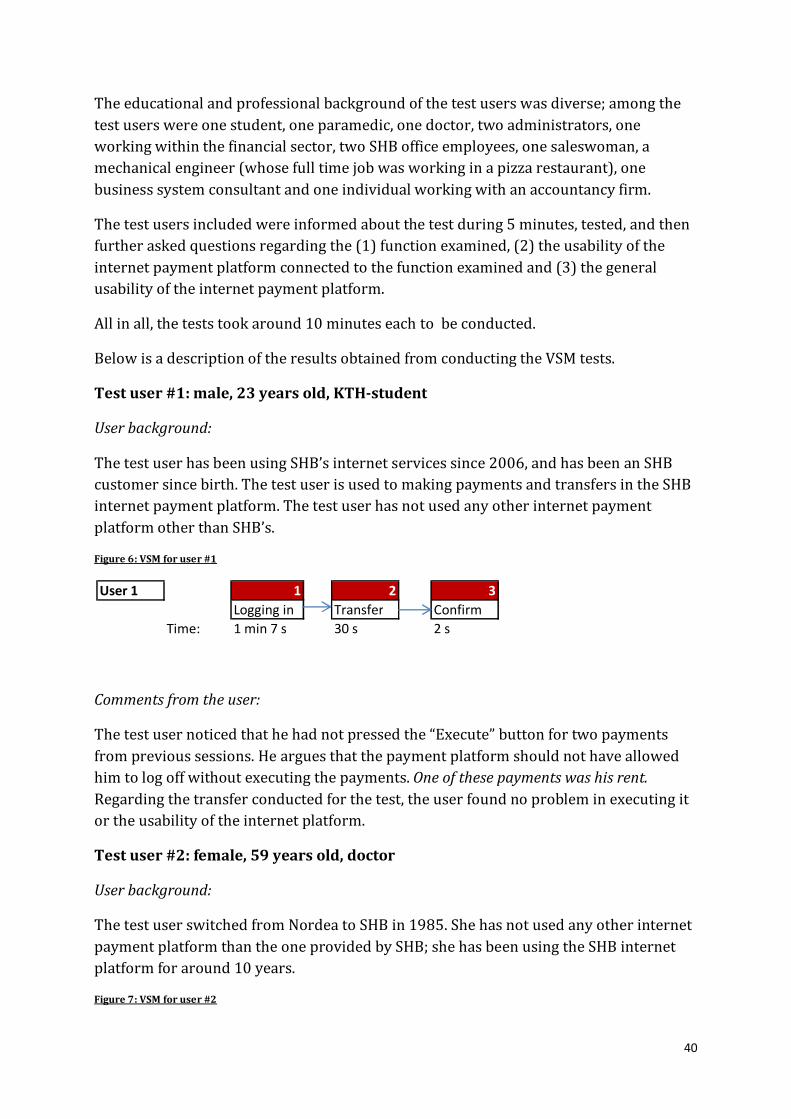
40
The educational and professional background of the test users was diverse; among the test users were one student, one paramedic, one doctor, two administrators, one working within the financial sector, two SHB office employees, one saleswoman, a mechanical engineer (whose full time job was working in a pizza restaurant), one business system consultant and one individual working with an accountancy firm.
The test users included were informed about the test during 5 minutes, tested, and then further asked questions regarding the (1) function examined, (2) the usability of the internet payment platform connected to the function examined and (3) the general usability of the internet payment platform.
All in all, the tests took around 10 minutes each to be conducted.
Below is a description of the results obtained from conducting the VSM tests.
Test user #1: male, 23 years old, KTH-student
User background:
The test user has been using SHB’s internet services since 2006, and has been an SHB customer since birth. The test user is used to making payments and transfers in the SHB internet payment platform. The test user has not used any other internet payment platform other than SHB’s.
Figure 6: VSM for user #1
Comments from the user:
The test user noticed that he had not pressed the “Execute” button for two payments from previous sessions. He argues that the payment platform should not have allowed him to log off without executing the payments. One of these payments was his rent. Regarding the transfer conducted for the test, the user found no problem in executing it or the usability of the internet platform.
Test user #2: female, 59 years old, doctor
User background:
The test user switched from Nordea to SHB in 1985. She has not used any other internet payment platform than the one provided by SHB; she has been using the SHB internet platform for around 10 years.
Figure 7: VSM for user #2
User 1 1 2 3Logging in Transfer Confirm
Time: 1 min 7 s 30 s 2 s
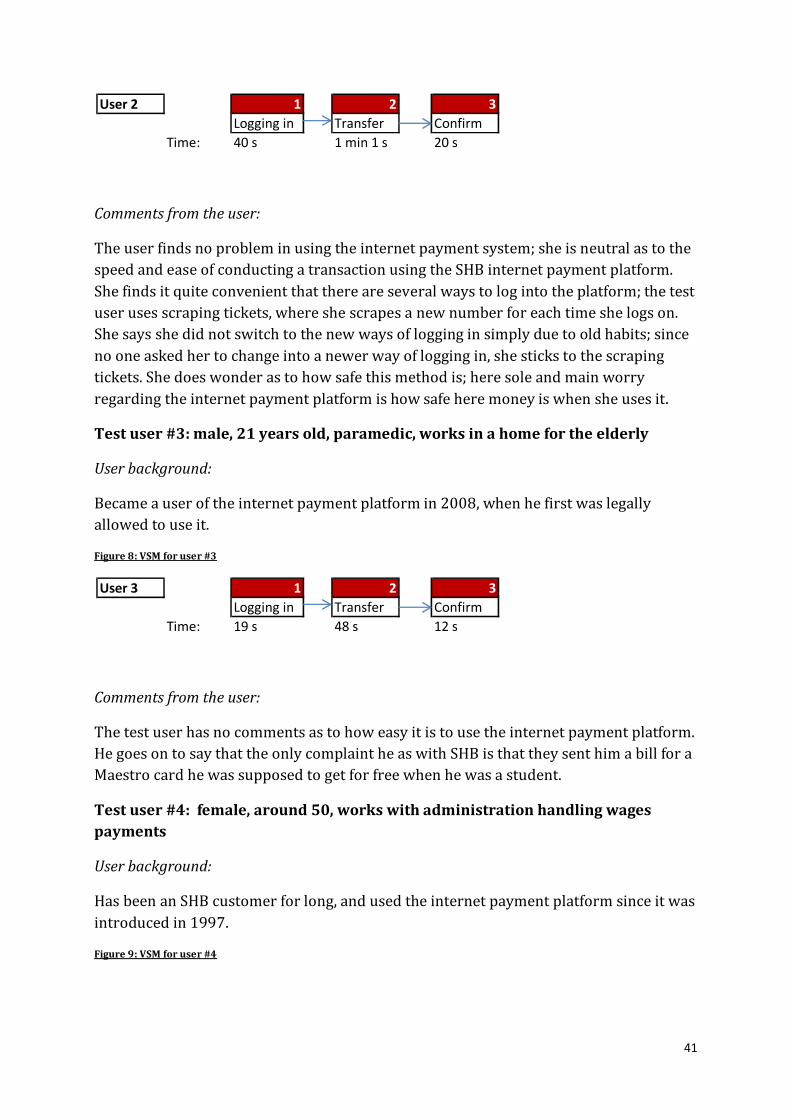
41
Comments from the user:
The user finds no problem in using the internet payment system; she is neutral as to the speed and ease of conducting a transaction using the SHB internet payment platform. She finds it quite convenient that there are several ways to log into the platform; the test user uses scraping tickets, where she scrapes a new number for each time she logs on. She says she did not switch to the new ways of logging in simply due to old habits; since no one asked her to change into a newer way of logging in, she sticks to the scraping tickets. She does wonder as to how safe this method is; here sole and main worry regarding the internet payment platform is how safe here money is when she uses it.
Test user #3: male, 21 years old, paramedic, works in a home for the elderly
User background:
Became a user of the internet payment platform in 2008, when he first was legally allowed to use it.
Figure 8: VSM for user #3
Comments from the user:
The test user has no comments as to how easy it is to use the internet payment platform. He goes on to say that the only complaint he as with SHB is that they sent him a bill for a Maestro card he was supposed to get for free when he was a student.
Test user #4: female, around 50, works with administration handling wages payments
User background:
Has been an SHB customer for long, and used the internet payment platform since it was introduced in 1997.
Figure 9: VSM for user #4
User 2 1 2 3Logging in Transfer Confirm
Time: 40 s 1 min 1 s 20 s
User 3 1 2 3Logging in Transfer Confirm
Time: 19 s 48 s 12 s

42
Comments from the user:
The text is a bit small, the test user feels. She is very positive to the SHB payment platform though, and feels that SHB’s log in box is much easier to use than SEB’s and Swedbank’s, which she uses daily at work.
Test user #5: male, 67 years old, works in the financial sector
User background:
The test user states that he uses the SHB internet payment platform regularly. He has used the internet payment platform since 1997, and has been a customer since 1962. The test user has also worked at the bank around the 60: ies.
Figure 10: VSM for user #5
Comments from the user:
The user finds the payment and transfer function to be usable and is very satisfied with it.
Test user #6: female, 41 years old, works at an SHB office
User background:
[Wishes not to state].
Figure 11: VSM for user #6
Comments from the user:
User 4 1 2 3Logging in Transfer Confirm
Time: 29 s 21 s 17 s
User 5 1 2 3Logging in Transfer Confirm
Time: 33 s 1 min 22 s 14 s
User 6 1 2 3Logging in Transfer Confirm
Time: 29 s 39 s 13 s

43
The user says it’s good that she does not need to sign when she transfers money between her accounts. When transferring, she finds it comfortable to have the scroll list where previous payment and transfer recipients are listed.
When the user finalized the transfer, she forgot to add the recipient name and got an error message in the form of a red dot beside the empty recipient name textbox.
Test user #7: female, 27 years old, works at an SHB office
User background:
Has been a customer since she was born, and used the internet payment system since she turned 18 years old.
Figure 12: VSM for user #7
Comments from the user:
The user was not allowed to sign the transfer, and was confused as to why at first; she then figured out after a while that it was because she had forgotten to add a recipient name.
Test user #8: male, 29 years old, production administration manager
User background:
Before switching to Handelsbanken in December 2010, together with his fiancé, the test user had been a customer at Swedbank for 8-10 years.
Figure 13: VSM for user #8
Comments from the user:
The test user states that he stayed with Swedbank for so long because he liked their internet payment platform. The test user appreciated that someone from SHB’s IT Support called him asking about his views on the usability of the internet payment platform.
One major drawback with SHB’s internet payment platform that greatly agitated the test user was the way his fund placements were listed. He states that he cannot find his placements and his pension funds. He wants his funds to be listed under a clearly visible funds-category under the Economical Overview (third button in the menu to the left).
User 7 1 2 3Logging in Transfer Confirm
Time: 17 s 1 min 6 s
User 8 1 2 3Logging in Transfer Confirm
Time: 43s 1 min 17 s 16 s

44
Though he says he dislikes the internet payment platform he appreciates the log in box, as it can be used for other purposes, when visiting administrative authorities for example.
Test user #9: female, 30 years old, saleswoman at a shop
User background:
The test user #9 is fiancé to test user #8. The test user has been an SHB customer since 18 years back. She switched to Swedbank when she got together with test user #8, then switched back to SHB.
Figure 14: VSM for user #9
Comments from the user:
The test user finds the SHB internet payment function easy to use. Finding things is difficult, she states though, and she finds it difficult to see what transactions she has conducted.
Test user #10: male, mechanical engineer currently working at a pizza restaurant
User background:
The test user has been a customer at SHB since 2001, and states that he has used the internet payment platform for long.
Figure 15: VSM for user #10
Comments from the user:
None.
Test user #11: female
User background:
[Wishes not to state].
Figure 16: VSM for user #11
User 9 1 2 3Logging in Transfer Confirm
Time: 26 s 53 s 11 s
User 11 1 2 3Logging in Transfer Confirm
Time: 19 s 2 min 10 s 17 s

45
Comments from the user:
The test user forgot to add the recipient at first, and was confused as to what needed to be changed when she could not sign the transfer. The test user has used the SHB internet payment platform for 5-6 years. She has been a customer at SEB for a period, and then switched back to SHB. She is very satisfied with the log-in box; she used to log in using a file installed in her computer, which she did not like as she often needed to do transactions even when she did not have access to her stationary home computer.
Test user #12: female, 48 years old, Business system consultant (IT), used to be an economist
User background:
Uses the SHB internet payment platform daily (which she has used for a long time), and uses it for many different purposes. She has been using the log-in box for a year.
Figure 17: VSM for user #12
Comments from the user:
She feels that the system keeps getting better, with improvements done continuously.
Test user #13: female, runs her own accountancy firm
User background:
She has been an SHB customer since 89, and used the internet payment platform for long. Used to log in using a file, and then switched to the log in box which she prefers.
Figure 18: VSM for user #13
Comments from the user:
User 11 1 2 3Logging in Transfer Confirm
Time: 42 s 1 min 25 s 23 s
User 12 1 2 3Logging in Transfer Confirm
Time: 15 s 29 s 5 s
User 13 1 2 3Logging in Transfer Confirm
Time: 24 s 1 min 16 s 8 s

46
Forgot to add the recipient name, but quickly saw the error when she was not allowed to sign the transfer due to the error. She dislikes the fact that SHB does not work well with the web browser Mozilla Firefox, as she does not like using Internet Explorer. Another complaint is the trouble logging in without using the cord to connect the log in box to the computer; she further emphasis that these are the only problems she has with the internet payment platform of SHB. She feels that Swedbank’s log-in box is better, since it is smaller. She feels insecure using the same pin code when using the SHB box, and prefers Swedbank’s system with different pin codes for each log in session. The test user uses all four major Swedish bank’s internet payment platforms when working with her accountancy firm.
Expert user: Works superintendent at IT Support
Figure 19: VSM for the expert user
The choice of the works superintendent as an expert user was based on his deep knowledge of the function studied and the systems involving it. The expert user works daily with the function that is being studied, and is assumed to know the function by heart, as his division (IT Support) receive calls where 90-95% of them are IT related, and 10-15% are payment and transfer related. The difficult customer calls are directed by the IT Support staff to him, which puts pressure on his knowledge of the internet platform.
Expert 1 2 3Logging in Transfer Confirm
Time: 14 s 11 s 9 s

47
6. ANALYSIS AND RESULTS This section will summarize the interviews and VSM by analyzing and relating them to the theory mentioned in the introduction and theory part of the thesis.
It should be noted that the interviewees were given the opportunity to comment on the text relating to their respective interview; certain quotes and information were changed or removed due to such feedback.
Furthermore, information that was deemed to be confidential to the bank has also been removed.
6.1 ANALYSIS AND RESULTS OF THE INTERVIEWS
Knowledge about usability issues and its importance was shared by all those interviewed, and they viewed usability as an important and integral part of their daily work. Though everyone interviewed showed great interest in issues relating to usability activities, certain factors hampering such activities were noted.
Looking at the definitions of usability available, there was not one predominant definition of usability used by the interviewees. Several of the employees interviewed referred to usability as relating to GUI and interface issues only.
As argued by Karlander (2001), buyer competence is an important factor for IT System Development success. The Standish Group also point to a “clear statement of requirement” being an important factor to successful IT system development projects (The Standish Group, 1994). Three of the interviewees have questioned the competence of certain buyers at SHB, and they attribute this lack of competence on experience and work load on the part of the buyers. One of the interviewees also feels that the differing educational backgrounds on the buyer and supplier side contribute to communicational problems. Such relationship and organizational aspects of IT management needs to be addressed (Galliers, 1991).
As argued by Ottersten and Berndtsson (2002), regardless of how the buyer specifies the purpose of a system to be developed, it is the sum of many users’ experiences and usage of a system that generates benefit to the buyer. Inclusion of end users can thus be an important part of the buyer requirement specification work (Ottersten and Berndtsson, 2002; The Standish Group, 1994). Willcocks (1992) found in his study in 1992 that 44% of the 50 firms investigated failed to include end users in their IT-system evaluation; in the study object’s case, end users are included indirectly via feedback reported to IT Support, and directly in certain larger projects. Usability evaluations of IT systems and functions including end users directly were rare, however.
A question brought forth by four of the interviewees is how incentives might be distorted by certain product and system owners in the bank, who look only for the interest of their specific product or system rather than the chain of products and systems. If this is the case, such a situation might hamper the implementation of usability measures in the
48
bank. ISO 9412-11 states that usable systems work in the manner they are intended in a certain situation, and for this to happen, all systems connected to a specific function must work as intended. As a difficulty to implementing usability in an organization, Ottersten and Berndtsson (2002) mention a lack of incitement program, and show the importance of how such incitements might affect usability work. An incitement program seems to be in place at SHB, but does not work to enhance usability activities.
Willcocks (1992) also points to the importance of including the whole organization in usability activities, and a product and system ownership structure centered on single systems or functions might hamper the communication and work relationship between different parts of the bank’s IT departments.
Another hindrance to usability implementation as pointed out by Ottersten and Berndtsson (2002) is myths. As some of the interviewees said, people with usability responsibilities among them, usability issues are seen as including GUI (M3) parts only. Such notions need to be addressed, in order for usability implementation to be improved and secured within the organization. As ISO 9241-11 (1998) indicates, usability includes M1 and M2 aspects as well, as all systems connected to a certain function or product will be affecting its usability.
Though questions have been raised by the interviewees regarding the communicational and incitement part of the organizational structure of the IT departments, the political level works well for them; none of the interviewees had any complaints on their status or hierarchical level within the organization, or the freedom they have to work as needed in different situations. The interviewed business architect did state however, that her department lacked the necessary authorization to require usability activities from CD. Three of the interviewees are very satisfied with the flat organizational structure at SHB, and feel that it gives them freedom to include usability activities in their daily work life.
Another factor attributed to successful usability implementation in an organization is a usability sponsor within management (Ottersten and Berndtsson, 2002; The Standish Group, 1994); such a usability sponsor does exist within SHB’s management, and the knowledge available within the bank regarding usability is perceived to be good by the interviewed management representative, though some of the interviewees feel the knowledge regarding usability work needs to be enhanced in the organization as a whole, using internal education. The interviewed business architect stated that more usability oriented positions need to be available in the bank, and that management should have more knowledge of IT and usability questions.
50% of all code in an IT system is user interface (Nielsen, 1994), and as stated in the introduction, a question that arises is whether 50% of the system development is spent on usability activities. The information from the interviewees diverges on the matter, and it becomes difficult to draw any quantifiable conclusions regarding how much of the system development is put on usability activities. One of the interviewed System

49
responsible stated that usability work is included when vital technical aspects are finished.
Nielsen (1994) further emphasizes the importance of including user tests early on in the development process, and to keep testing at every step. User tests are included at the beginning and end of projects, but not in an iterative manner as Nielsen (1994) describes.
In 1990, 50-80% of IT-budgets were spent on maintenance of old programs (Steiner & Teixeira, 1990). At SHB today, the interviewees agree on this number being much lower, though no exact number or percentage point has been given.
Regarding how much of the IT system development budget is put on usability measures, no exact measure has been given; Nielsen (1994) suggests using 10% of the budget for such activities.
6.2 ANALYSIS AND RESULTS OF THE VSM TEST
The average time taken to conduct the three VSM steps for the 13 test users is shown in Figure 20 below.
Figure 20: average time per step in seconds, test users
The time it took the expert user to conduct the three VSM steps is shown in Figure 21.
Figure 21: average time per step in seconds, expert user
The expert user was thus (1) 2.21 times faster in logging into the SHB internet payment platform, (2) 5.53 times faster in conducting a transfer from an SHB account to an account in a different bank and (3) 1.40 times faster in signing the transfer.
This result, though not statistically significant, is interesting.
The question arises, why the expert is much faster than the average test user in all three steps of the functions and what this can be attributed to.
Looking at the test user comments, the following can be gleaned. Four of the test users (where one of them was employed at an SHB office) could not perceive the error message given by the internet payment platform when they forgot to include the recipient name; the error recognition (Nielsen’s (1994) heuristic evaluation method, point 9) measures were lacking, as the only notice given by the platform of an error
Average 1 2 3Logging in Transfer Confirm
Time: 31 61 13
Expert 1 2 3Logging in Transfer Confirm
Time: 14 11 9

50
having been made was a small red dot in connection with the box where the recipient name was to be inserted and an error message at the top of the page, in small letters. No error message was given near the box where the recipient name was to be inserted, and the process simply did not proceed beyond the transfer step until the user learned what the problem was, and corrected it. One can understand the minimalist design approach (Nielsen’s (1994) heuristic evaluation method, point 8) used here when designing the small red error dot, but it should not have as a price that certain users, such as novices or intermediate users, cannot discern what the error actually is.
One of the test users forgot to pay his rent, due to the system not forcing the user to sign a payment before logging out. The choice between user flexibility (to pay when they wish) and user safety (not forgetting to pay important bills) is a difficult one. This relates to error prevention (Nielsen’s (1994) heuristic evaluation method, point 5), and Nielsen argues that interfaces should be re-designed to clearly communicate the consequences of the user’s actions. That is, the user should be made aware that by not signing his or her bill, it will not be paid until the user does sign. Such a warning should be shown not only in conjunction with the payment or transfer, but also as the user logs in or out of the internet payment platform.
Another distinction is between the test users who always have used the SHB internet platform and those who have used another one before using the SHB platform, or who use several platforms in parallel at work. Users who are familiar with another system will have an increased work load of adapting their way of thinking to the SHB internet platform, and this will affect their attitude towards the platform in question (Allwood, 1998).
The time it takes to perform step 1 in the conducted VSM test, logging in, is affected by which means of logging in is used. There are four ways of logging in; using a log in box with a cord, using a log in box without a cord, using a scraping ticket and using e-identification (certificate). Each of these log in options takes different amount of time for different users, and is more or less desirable depending on the context (ISO 9241-11, equipment component). The test users asked appreciated that there were several ways of logging in; one of the test users argued that the log in box with a cord was cumbersome to take with her to work, whilst others appreciated the flexibility of not having to use a file installed in a stationary computer.
The conducted VSM captures, to a certain extent, the satisfaction felt by the test users when using the function and the effectiveness of the function that was studied. The satisfaction was captured as the test users were allowed to comment on the function tested and the underlying platform. The effectiveness is captured and quantified using the VSM methodology of clocking the users when they execute certain steps of a function.

51
Different usability evaluation methods need to be used (Fagerström, 2003) depending on the particular function or system to be evaluated. This thesis argues that VSM is a method that can be used when evaluating the usability of a system or function.

52
7. CONCLUSION
The choice of usability definition is secondary to actually choosing one definition and implementing a user centered system development process.
This thesis finds both organizational and communicational reasons as to why usability work is not included in projects in an iterative way.
HCI research needs to focus more on organizational matters, in order to help companies produce usable and successful systems.
A greater focus on usability work in the form of usability evaluation and inclusion of end users in iterative IT development projects will not only be beneficial for banks’ cost reduction efforts, it will also be beneficial for the external users of the banks’ IT-systems, the private consumers.
Value Stream Mapping, as used in this thesis, gives an effective way of estimating user satisfaction in a quantitative way. The method gives banks the possibility of implementing a usability evaluation method that is cost effective and good at mapping user satisfaction and identification of possible flaws in a function.
As stated earlier in the thesis, Steiner and Teixeira (1990) point at three kinds of IT-investments; investments in core technology (what the authors call M1), investments in application software which assists the core technology (M2) and software targeted at customers (M3).
SHB clearly thinks about usability issues, and has many usability champions. The problem lies in how they view usability; it is perceived to encompass merely the M3 part of their systems, and not their M1 and M2 systems.
This thesis argues that in order for banks to handle new technological improvement and change, and the fact that emerging markets embrace these at a very fast pace (The Economist, May 14th – 20th 2011, pp. 19-21), more focus needs to be put on usability issues in all parts of their investments, not only M3, but the whole hole chain (M1, M2 and M3).
The winner will be the one who is the fastest in implementing new technological improvements and understanding how usability work is connected to the whole M1, M2 and M3 chain.

53
8. DISCUSSION The weakness of a single study as compared to multiple field studies is in the strength of the results obtained and the extent with which one can generalize. This thesis uses one large bank to generalize over the other three major banks in Sweden, and one function to generalize over other functions.
The VSM test was conducted with a limited amount of test users; this limits the statistical significance of the results obtained. The VSM test conducted in this study can be viewed as a pilot study, for future use, and shows the ease with which such a study can be conducted.
A question that arises is how representative the transfer function is of all other internet payment platform functions the bank has. Indeed, one needs to reflect upon how representative such a function is of all the other functions used both internally by the bank (employees) and externally by customers (private and corporate). Clearly, one cannot generalize on the basis of the results found, and this is not the intention of the conducted VSM test. As stated in the problem description, the VSM test is intended to be used as a pilot test in conducting VSM tests for usability evaluation purposes.
One further need to discuss the bias of the interviewees when asked about the usability activities conducted at the bank; the interview text material in the thesis was edited after an interview had been summarized. Some of the times, the changes were simply due to misunderstandings or when confidential information had been discussed. However, most often, the text changes were brought on by interviewees who changed their minds regarding certain comments and quotes. The thesis section summarizing the interviews should be read with this in mind.

54
9. FURTHER RESEARCH More field studies which are practical rather than purely theoretical and academical are needed. This is highly pointed out by the bank, and can be a possible answer to the issue highlighted by Bubenko; that it takes 10-15 years for new theory to be implemented in practice.
A multiple field study, incorporating all major banks in Sweden, is a natural follow up to this thesis.
This thesis focused on the private banking side of the bank’s IT systems and functions; another interesting focus would be the corporate side.
Yet another interesting perspective to cover is internal users, as this thesis focused on the external ones. The internal users (such as office employees, Capital Markets employees etc) are forced to live with the systems employed by the bank, whilst external users can simply switch banks if they are not satisfied with the systems used.
55
10. REFERENCES Allwood, C.M., (1998), Människa-datorinteraktion. Ett psykologiskt perspektiv. Studentlitteratur, Lund
Alpar, P., and M. Kim, (1991), "A Microeconomic Approach to the Measurement of Information Technology Value." Journal of Management Information Systems 7, No. 2: 55-69
Bankgirocentralen (BGC). Internet link: http://www.bgc.se/Default____2985.aspx
Beck (2001), Agile manifesto. Internet link: http://www.agilemanifesto.org/
Benyon, D. (2010), “Designing Interactive Systems”. Pearson Education Limited. Second edition
Brynjolfsson, E. & Hitt, L. (1994), Creating Value and Destroying Profits? Three Measures of Information Technology´s Contributions. MIT Sloan School, Cambridge
Brynjolfsson, Erik and Hitt, Lorin (1996) Paradox Lost? Firm-level Evidence on the Returns to Information Systems Spending, Management Science, Vol. 42, No. 4, pp. 541-558, April 1996
Brynjolfsson, E. & Hitt, L. (1998), Beyond the productivity paradox, Communications of the ACM CACM Homepage archive, Volume 41 Issue 8, Aug. 1998
Bubenko, J. A., (1986), Information systems methodologies- a research view. SYSLAB Report No. 40, The Systems Development and Artificial Intelligence Laboratory, University of Stockholm, Sweden
Dahlgren, L.E., Lundgren, G., Stigberg, L. (2000), ”Öka Nyttan av IT! Att skapa och värdera nytta i verksamheten med hjälp av PENG”, Ekerlids Förlag
Fagerström, B. (2003). “IT-användning – En analysmodell för IT-nytta”. Luleå Tekniska Universitet, p. 41
Financial Services Technology, Issue 5, ITSM & Performance Mgmt, “IT is a critical service to insurance and financial firms”. Internet link: http://www.fsteurope.com/article/IT-is-a-critical-service-to-insurance-and-financial-firms/
Galliers, R. D. (1991), Strategic Information Systems Planning: Myths, Reality and Guidelines for Successful Implementation. European Journal of Information Systems, Vol. 1 No. 1sid. 55-64
Gulliksen, J., Göransson, B., (2002). Användarcentrerad systemdesign – en process med fokus på användare och användbarhet. Studentlitteratur
Handelsbanken Annual Report 2010
56
Hitt, L. and E. Brynjolfsson, "Productivity, Business Profitability, and Consumer Surplus: Three Different Measures of Information Technology Value,” MIS Quarterly, June 1996, 121-142
Ingenjören, nr 2, 2011, p. 20
ISO 9241-11:1998. Ergonomic requirements for office work with visual display terminals (VDTs) - Part 11: Guidance on usability. Internet link: http://www.iso.org/iso/catalogue_detail.htm?csnumber=16883
Karlander, L. (2001), Därför blir IT projekt så dyra. Svenska Förlaget liv och ledarskap AB
Lewis, C., Polson, P., Wharton, C. and Rieman, J., (1990), Testing a walkthrough methodology for theory-based design of walk-up-and-use interfaces. Proceedings of CHI ’90 Conference, Seattle, WA, 1-5 April. ACM Press, New York, pp. 235-242
Lichtenberg, F., “The Output Contributions of Computer Equipment and Personnel: A Firm Level Analysis,” Economics of Innovation and New Technology (3:4), 1995
Lyytinen, K. Klein, K. & Hirschheim, R. (1991), The effectiveness of office information systems: a social action perspective. Journal of Information Systems nr. 1 pp 41-60.
Nick Huber, Monday 23 February 2004 16:09, ComputerWeekly.com. Internet link: http://www.computerweekly.com/Articles/2004/02/23/200436/Barclays39-IT-team-steps-up-preparation-for-new-financial.htm
Nielsen, J. (1994), Usability Engineering, Morgan Kaufmann Publishers
Movin, S., Zandelin, N., (2009), “IT för konkurrenskraft. Trender och utveckling”, Liber
Ottersten, I., Berndtsson, J., (2002), Användbarhet i praktiken, Studentlitteratur.
Parsons, D., C.C. Gotlieb, and M. Denny, “Productivity and Computers in Canadian Banking,” in Z. Griliches and J. Mairesse (Eds.) Productivity Issues in Services at the Micro Level, Kluwer, Boston, 1993
Poppendieck, M. & T. (2007), “Implementing Lean Software Development”, Addison-Wesley
Prasad, B. and P.T. Harker (1997), “Examining the Contribution of Information Technology Toward Productivity and Profitability in U.S. Banking,” Working Paper, Financial Institutions Center, The Wharton School, University of Pennsylvania, Philadelphia, PA
Shingo, S. (1981), Study of Toyoda Production System from an Industrial Engineering Viewpoint, Productivity Press, chapter 5

57
Steiner, T.D., Teixeira, D.B., (1990), “Technology in Banking – Creating value and destroying profits”, Dow Jones-Irwin
Schwaber , K., Beedle, M., (2001), “Agile Software Development with Scrum”, Prentice Hall; 1 edition
Tapping, D., Luyster, T. and Shuker, T., Value Stream Management, 2002 (Productivity Press: New York)
The Economist, May 14th – 20th 2011, pp. 19-21
The Standish Group (1994). ”The CHAOS Report”
Usability First. Internet link: http://www.usabilityfirst.com/usability-methods/surveys/
Wharton, C., Rieman, J., Lewis, C. and Polson, P., (1994), The cognitive walkthrough method: a practitioner’s guide. In Nielsen, J. and Mack, R.L. (eds), Usability Inspection methods. Wiley, New York
Willcocks, L. (1992), Evaluation Information Technology investments: research findings and reappraisal. Journal of Information Systems nr. 2, pp. 243-268
Yin, R. K., (2009), Case Study Research. Design and Methods. 4th edition. Applied Social Research Methods Series, volume 5. Sage, Los Angeles

58
APPENDIX 1: INTERVIEW BASIC QUESTIONS
Tell me a about your educational background, where you have worked before and why you
started at SHB
Tell me about your [division name] and your role as [role name]
Tell me about the tasks you do at work
What kinds of models and abstractions do you work with?
What kind of system/product do you work with?
To what extent do you incorporate usability activities in your work?
How do you define the term usability?
What kind of cost benefit analysis method does your division use?
Questions were added depending on the role of the interviewee and the answers given.

59
APPENDIX 2: VSM EXCEL SHEET, CONTAINING EXAMPLE OF FUTURE
STATE MAP
Steps in the Process
Current State Map1 2 3
Logging in Transfer Confirm
Future State1 2 3
Future StateStep Task Usability (% of time)
Min. Max. Min. Max. Min. Max.123
PeopleCycle Time Touch Time
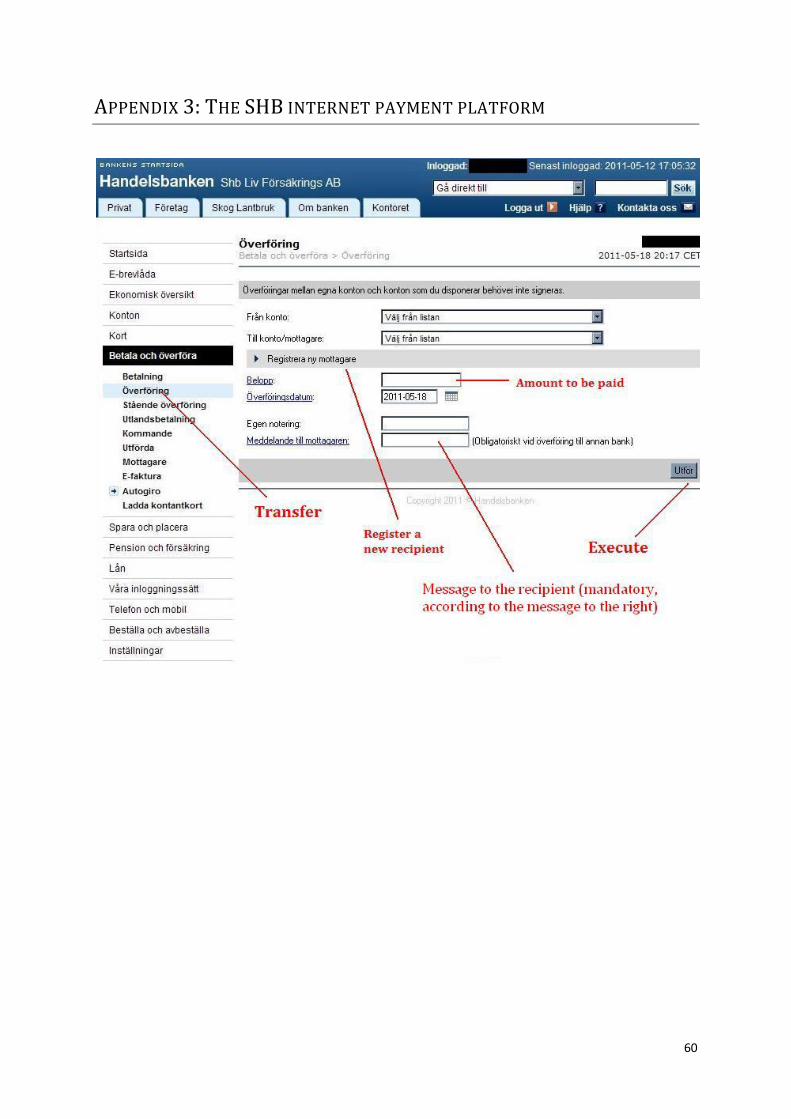
60
APPENDIX 3: THE SHB INTERNET PAYMENT PLATFORM

61
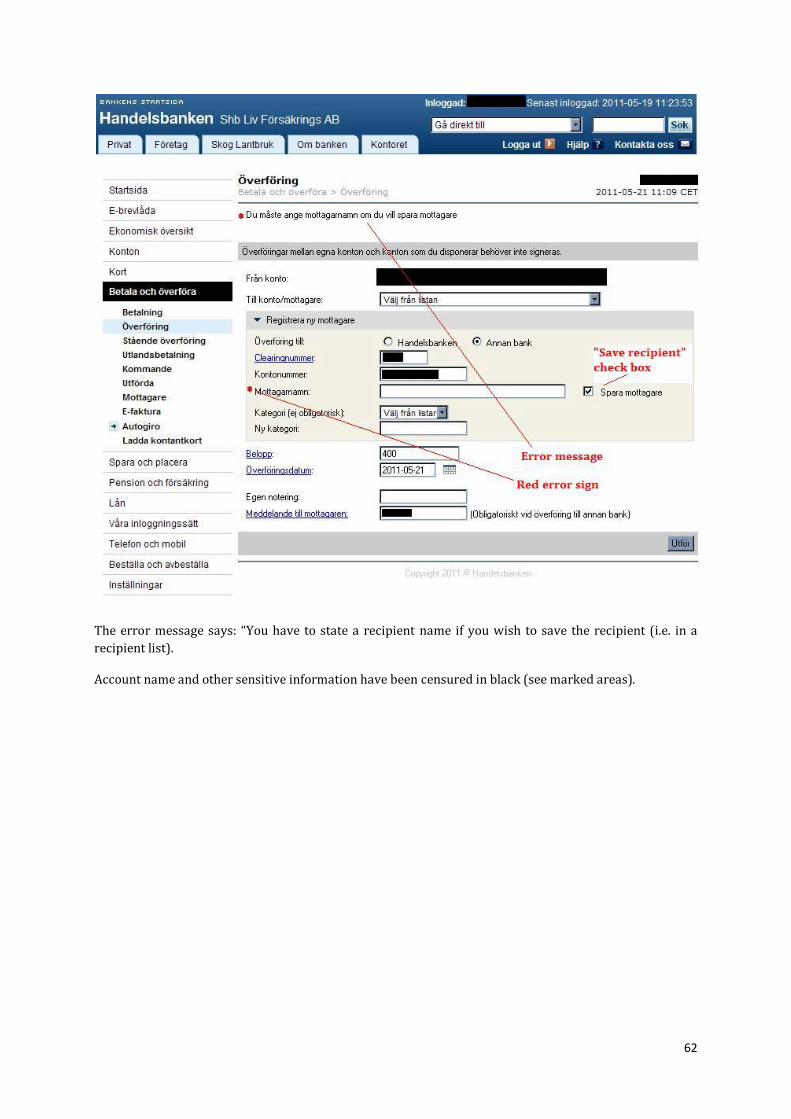
62
The error message says: “You have to state a recipient name if you wish to save the recipient (i.e. in a recipient list).
Account name and other sensitive information have been censured in black (see marked areas).

63
APPENDIX 4: THE LOG IN PAGE OF THE SHB INTERNET PAYMENT
PLATFORM

www.kth.se