usability/sentiment for the enterprise and enterprise · usability/sentiment for the enterprise and...
TRANSCRIPT

Running Head: USABILITY/ Sentiment for the Enterprise and ENTERPRISE 1
Usability/Sentiment for the Enterprise and ENTERPRISE
David Meza and Sarah Berndt
Office of the Johnson Space Center Chief Knowledge Officer
https://ntrs.nasa.gov/search.jsp?R=20140007413 2018-07-21T05:36:46+00:00Z

Usability/Sentiment for the Enterprise and ENTERPRISE 2
ABSTRACT
The purpose of the Sentiment of Search Study for NASA Johnson Space Center
(JSC) is to gain insight into the intranet search environment. With an initial usability
survey, the authors were able to determine a usability score based on the Systems
Usability Scale (SUS). Created in 1986, the freely available, well cited, SUS is
commonly used to determine user perceptions of a system (in this case the intranet
search environment).

Usability/Sentiment for the Enterprise and ENTERPRISE 3
USABILITY/SENTIMENT FOR THE ENTERPRISE AND THE ENTERPRISE
The advanced nature of "search" has facilitated the movement from keyword
match to the delivery of every conceivable information topic from career, commerce,
entertainment, learning… the list is infinite. At NASA Johnson Space Center (JSC ) the
Search interface is an important means of knowledge transfer. By indexing multiple
sources between directorates and organizations, the system's potential is culture
changing in that through search, knowledge of the unique accomplishments in
engineering and science can be seamlessly passed between generations.
This paper reports the findings of an initial survey, the first of a four part study to
help determine user sentiment on the intranet, or local (JSC) enterprise search
environment as well as the larger NASA enterprise. The survey is a means through
which end users provide direction on the development and transfer of knowledge by way
of the search experience. The ideal is to identify what is working and what needs to be
improved from the users’ vantage point by documenting:
· Where users are satisfied/dissatisfied.
· Perceived value of interface components.
· Gaps which cause disappointment in search experience.
The near term goal is it to inform JSC Search in order to improve users’ ability to
utilize existing services and infrastructure to perform tasks with a shortened life cycle.
Continuing steps include an agency based focus with modified questions to accomplish
a similar purpose.

Usability/Sentiment for the Enterprise and ENTERPRISE 4
LITERATURE REVIEW
SUS Use
According to the inventor of the System Usability Scale (SUS), John Brooke, it was
originally a way to arrive at “some objective measures that would demonstrate the value
of particular changes was fundamental to that justification in order to get UI changes
included in a product release” (Brooke, 2013). Its intentional use is not diagnostic, but
the determination of the problematic/agreeable system status. The SUS is a “tool to
quickly and easily collect a user’s subjective rating of a product’s usability” (Brooke,
1996). It is ideal for collecting data because it does not have the same time, equipment,
and personnel restraints as more traditional evaluations such click-through or eye
tracking studies. By participating in the survey, users were able to quickly release their
results while continuing to work and without interrupting the work of others, who are
often required to serve as moderators for traditional studies. Additional characteristics of
the SUS are its ease of use and administration, as well as its reliability and validity,
regardless of sample size (Usability.gov, 2013).
SUS Construction
Although SUS was intended to be “quick and dirty” that refers only to its use; it was
constructed with care. The ten questions selected were taken from a pool of 50 after
careful evaluation and analysis. The questionnaire statements are scored on a 5-point
scale ranging from “strongly agree” to “strongly disagree.” The items constituting the final
questionnaire were selected on the basis of several criteria:
There had to be strong intercorrelations between all of the items selected.
The total number of items had to be limited because of the constraints of time
that we were working under when administering the questionnaire.

Usability/Sentiment for the Enterprise and ENTERPRISE 5
Although usability for the usability survey was indeed a strong consideration, the
survey originators chose questions which would require participants to think
about their response before supplying the requested information.
The creators of the SUS selected 10 statements from the original pool; the
intercorrelations between all 10 were in the range r=± 0.7 to ± 0.9. In addition, we
selected statements so that the common response to five of them was strong agreement
and to the other five, strong disagreement. (Brooke, 2013).
Validation
In their 2008 study, Bangor, Kortum & Miller reviewed SUS data collections from
numerous projects and lifecycle stages spanning nearly a decade. Thanks to SUS
versatility, modifications of the original questions set make it a viable tool.
In another work, measuring usability.com, it is reported that the SUS has become an
industry usability standard for websites, mobile devices, software and hardware. At
over 25 years old, the SUS is versatile, widely used and remains relevant despite
technological advances (Sauro, 2011).
Scoring
The SUS uses 10 subjective questions and, most commonly, a 5 point Likert
scale to gather in inputs used to arrive at the usability score (Usability.gov, 2013).
Sauro’s 2010 validity study of the SUS compared 5 and 7 point scales in consideration
of response error. It was reported that due to the 10 question limit imposed by the SUS,
the 7 point scale is beneficial because there was no “interpolating between choices.”
For example, when survey participants were unable to choose between 2 and 3 points
on the 5 point Likert, the additional 2 points provided an extral level of granulation to
more precisely reflect user sentiment. Sauro’s work points to an additional SUS 7 point
validation that found “Seven point Likert scales appear to be sensitive enough to record
Usability/Sentiment for the Enterprise and ENTERPRISE 6
a more accurate evaluation of the interface while remaining relatively compact” (Finstad,
2010).
Instruction for normalizing the 5 point Likert in relation to the SUS, is readily
available from Usability.gov link to ‘SUS-A Quick and Dirty Usability Scale (Brooke,
1986). For use at JSC, additional modifications, described below, were made to
normalize the 7-point Likert.
Application
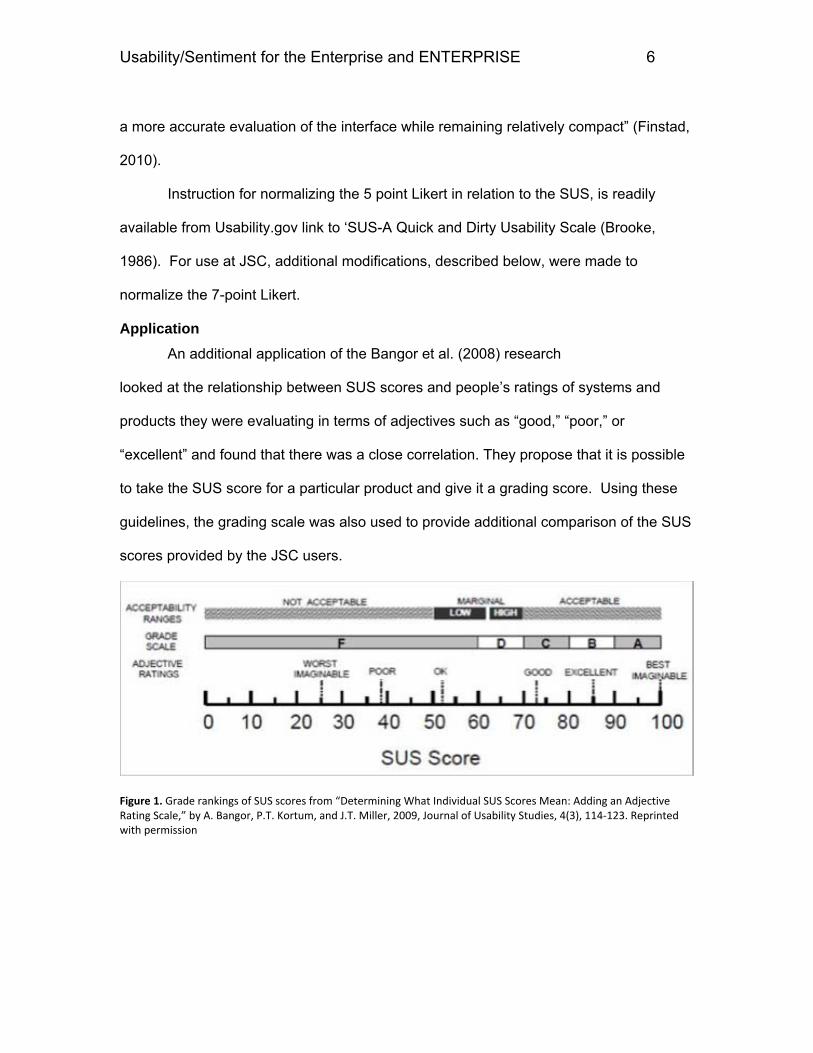
An additional application of the Bangor et al. (2008) research
looked at the relationship between SUS scores and people’s ratings of systems and
products they were evaluating in terms of adjectives such as “good,” “poor,” or
“excellent” and found that there was a close correlation. They propose that it is possible
to take the SUS score for a particular product and give it a grading score. Using these
guidelines, the grading scale was also used to provide additional comparison of the SUS
scores provided by the JSC users.
Figure 1. Grade rankings of SUS scores from “Determining What Individual SUS Scores Mean: Adding an Adjective Rating Scale,” by A. Bangor, P.T. Kortum, and J.T. Miller, 2009, Journal of Usability Studies, 4(3), 114‐123. Reprinted with permission

Usability/Sentiment for the Enterprise and ENTERPRISE 7
METHODOLOGY
At JSC, the Search Usability Scale (SUS) was used to determine the usability of
the intranet search interface, from the user’s perspective. A detailed description of the
SUS can be found in the LITERATURE REVIEW section above.
Users were asked to voluntarily respond to the survey during the 3 week period
of activity. Once the survey was closed, the responses were tabulated and scored
based on the SUS methodology. Analysis of the scores is presented below.
Participants
The JSC Search interface is accessible to every employee via the Search page,
as well as open text search boxes in registered web sites such as the JSC home page.
It was appropriate to use a mechanism to reach out the broadest audience of information
users. SUS survey distribution was primarily from the employee newsletter JSC Today
and a link from the Knowledge Online site. The survey announcement described the
SUS and its purpose and was distributed on three successive Mondays, coinciding with
the activity period. The commonality of Centerwide infrastructure meant survey
respondents were equally likely to come from the Mission Operations Directorate as the
Information Resource Directorate.
A common goal of survey research is to collect data representative of a
population, in this case users of the JSC Search. The research uses information
gathered from a drawn sample back to the population, within the limits of acceptable
error. However, when critiquing business education research, Wunsch state that “two of
the most consistent flaws included (1) disregard for sampling error when determining the
sample size, and (2) disregard for response and non-response bias (Kortlik, 2001).

Usability/Sentiment for the Enterprise and ENTERPRISE 8
To determine an acceptable amount, the Cochran sample size formula for continuous
data was used. Cochran’s formula:
∗
t = value for the selected alpha level in each tail
s = estimate of the standard deviation in the population
d = acceptable margin of error for mean being estimated
In this analysis, the alpha level, the level of risk the researcher is willing to take
that the true margin of error may exceed the acceptable margin of error is .025 for each
tail. Thereby t = 1.96.
The estimate for the standard deviation on the population for a 7 point scale is
calculated by dividing 7 by 6, the number of standard deviations that include almost all of
the possible values in the range. Based on this, s = 1.167.
The acceptable margin of error for the mean being estimated is calculated by
taking the number of points on the primary scale (7) and multiplying by the acceptable
margin of error (.04), the error researcher is willing to accept.
Based on this formula the minimum sample size is 67. Seventy one responses
were received providing sufficient data to infer back to the population.
Usability/Sentiment for the Enterprise and ENTERPRISE 9
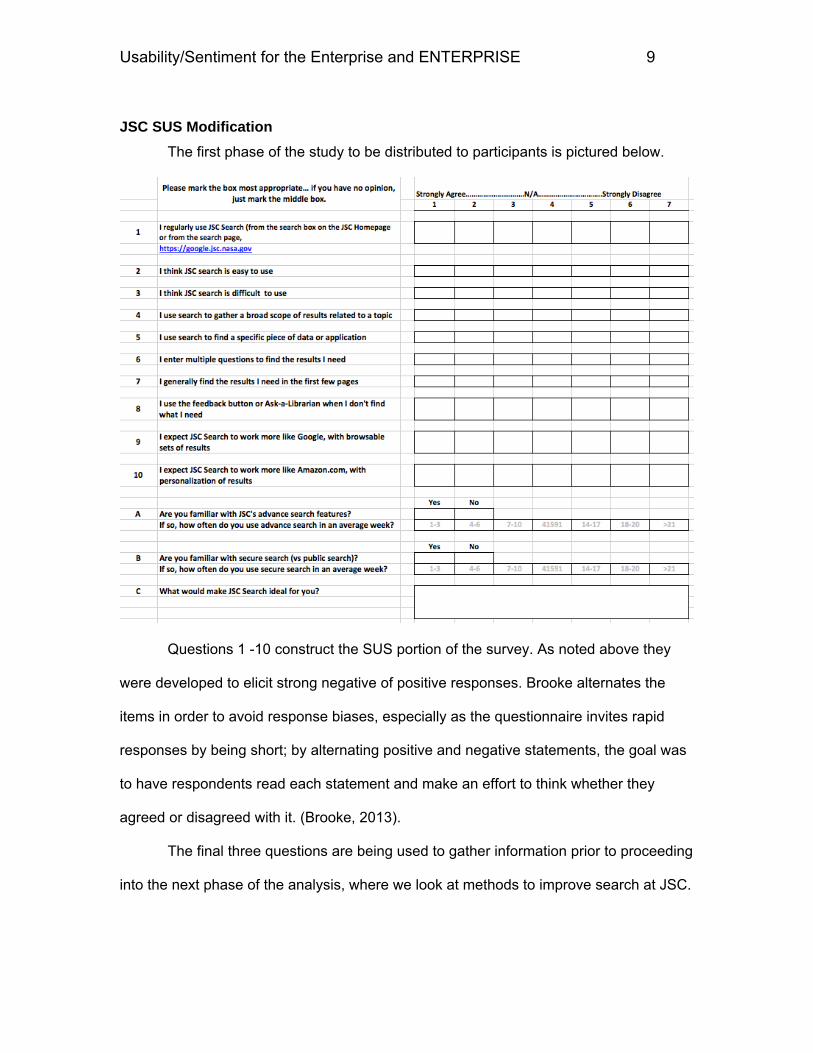
JSC SUS Modification
The first phase of the study to be distributed to participants is pictured below.
Questions 1 -10 construct the SUS portion of the survey. As noted above they
were developed to elicit strong negative of positive responses. Brooke alternates the
items in order to avoid response biases, especially as the questionnaire invites rapid
responses by being short; by alternating positive and negative statements, the goal was
to have respondents read each statement and make an effort to think whether they
agreed or disagreed with it. (Brooke, 2013).
The final three questions are being used to gather information prior to proceeding
into the next phase of the analysis, where we look at methods to improve search at JSC.

Usability/Sentiment for the Enterprise and ENTERPRISE 10
The survey was made available to all JSC employees on an internal SharePoint
site. SharePoint’s internal survey creation tool was used and the data was exported into
a comma separated value (csv) file for analysis in R.
ANALYSIS
The raw scale scores submitted by the users (see Appendix) were used to calculate
each individual users SUS score. The Total column in the spreadsheet holds the SUS
score; it was calculated by totaling the sum of the positive question scale score – 1 and
the difference of 7 minus the negative question scale score. The Score column contains
the final SUS score after it has been normalized to the 100 point scale. The following
histograms provide a visualization of the dispersion of the users’ responses for each
question.

Usability/Sentiment for the Enterprise and ENTERPRISE 11
Presentation of Data

Usability/Sentiment for the Enterprise and ENTERPRISE 12

Usability/Sentiment for the Enterprise and ENTERPRISE 13

Usability/Sentiment for the Enterprise and ENTERPRISE 14
SUS Score
Since we are using a scoring system ranging from 0 to 100, researchers and readers
often interpret SUS scores as percentages, which they are not. The normative data collected by
Bangor, Kortum, and Miller (2008) and Sauro (2011) provided the basis for positioning SUS
scores as percentiles, providing a more meaningful basis for interpreting SUS scores. Tullis and
Stetson’s (2004) research showed that using SUS enables you to get a measure of the
perceived usability of a system with a small sample (say, 8-12 users) and be fairly confident that
you’ve got a good assessment of how people see your system or product. With that in mind we
will review the results from the JSC SUS survey.
In reviewing the summary statistics of the SUS scores, the scores fell into an
approximate 50 point range with a maximum of 83.35 and a minimum of 31.67. This is a
relatively small range that is not uncommon. Many people refrain from scoring something
extremely high because of a belief there is always room for improvement. Conversely, people
will not rate an item extremely poor if it provides some perceived value. Fifty percent of the
scores were within 51.68 and 67.93 with the median score being 61.01, again a tight range. We
interpret this to suggest half of the users have a fairly common perception of the system
usability. However, as demonstrated by the summary statistics, 75% of the users scored the
system at 67.93 or lower, a score that indicates a level of dissatisfaction from three-fourths of
the population.
How can the results best be interpreted? While a 100-point scale is intuitive in many
respects and allows for relative judgments, information describing how the numeric score
translates into an absolute judgment of usability is not known. Using Bangor’s, et al. research
the SUS scores were overlaid an adjective rating and grade scale to add clarity. The following
sections describe the results.

Usability/Sentiment for the Enterprise and ENTERPRISE 15
Adjective Rating
Minimum 31.67
1st Quartile 51.68
Median 60.01
Mean 59.85
3rd Quartile 67.93
Maximum 83.35
Standard Deviation 12.10
Table 1: JSC Usability Results

Usability/Sentiment for the Enterprise and ENTERPRISE 16
A study was conducted by Bangor et al to determine if an adjective description scale
would be useful in providing a more intuitive depiction of the respondent’s usability perception. A
correlational analysis was conducted to determine how well the ratings (using the adjective
rating scale) matched the corresponding SUS scores given by participants (i.e., via their ten
individual ratings). Results were highly significant (α<0.01) with r=0.822. The findings suggest
the use of an adjective scale would be helpful in providing a subjective label to the SUS score,
one users would be able to decipher quickly.
The histogram of the respondents SUS score is displayed again below, this time, the
adjective description scale is overlaid. The figure clearly shows most, 75%, of the responses
were below “Good”. On the positive side, 67% of this total fell between “Ok” and “Good”, with
the reminder, 33%, below “Ok”.
Histogram of JSC User’s SUS Scores: Adjective Scale

Usability/Sentiment for the Enterprise and ENTERPRISE 17
Grade Rating
Over the course of the 10 year study reported by Bangor, Kortum, and Miller an
anecdotal pattern in the test scores had begun to emerge that equated quite well with letter
grades given at most major universities. The concept of applying a letter grade to the usability of
the product was appealing because it is familiar to most of the people who work on design
teams regardless of their discipline. Having an easy-to-understand, familiar reference point that
can be easily understood by engineers and project managers facilitates the communication of
the results of testing. Like the standard letter grade scale, products that scored in the 90s were
exceptional, products that scored in the 80s were good, and products that scored in the 70s
were acceptable. Anything below a 70 had usability issues that were cause for concern.
Histogram of JSC User’s SUS Scores: Grade Scale

Usability/Sentiment for the Enterprise and ENTERPRISE 18
Categories of Issues Identified by JSC Users

Usability/Sentiment for the Enterprise and ENTERPRISE 19
DISCUSSION
As with any improvement initiative, one must first examine and document the current
reality of the situation. In this scenario, a method was needed to determine the usability of a
search interface in addition to the user’s perception on how well the search system was
providing results. The use of the SUS provided a mechanism to quickly ascertain information in
both areas, by adding one additional open-ended question at the end. The first ten questions
allowed us to examine the usability of the system, while the last questions informed us on how
the users rated the performance of the search results. The final analysis provides us with a
better understanding of the current situation and areas to focus on for improvement.
The power of search applications to enhance knowledge transfer is indisputable. The
performance impact for any user unable to find needed information undermines project lifecycle,
resource and scheduling requirements. Ever-increasing complexity of content and the user
interface make usability considerations for the intranet, especially for search, a necessity
instead of a ‘nice-to-have’. Despite these arguments, intranet usability is largely disregarded
due to lack of attention beyond the functionality of the infrastructure (White, 2013).
The data collected from users of the JSC search system revealed their overall sentiment
by means of the widely-known System Usability Scale. Results of the scores suggest 75%,
±0.04, of the population rank the search system below average. In terms of a grading scaled,
this equated to D or lower. It is obvious JSC users are not satisfied with the current situation,
however they are eager to provide information and assistance in improving the search system.
A majority of the respondents provided feedback on the issues most troubling them. This
information will be used to enrich the next phase, root cause analysis and solution creation.
Future Work
Understanding the existence of a challenge is the first step in defining a long term
solution. The information collected in this survey provides the base line report to develop a

Usability/Sentiment for the Enterprise and ENTERPRISE 20
course of action. Based on the survey results, the quality of search results, in conjunction with
the interface ease-of-use are the two user-defined areas for improvement. In the next phase of
the study, the Knowledge Management Office in collaboration with the Information Resources
Directorate will research users’ tendencies and requirements as they pertain to search habits.
The ultimate goal is to design and implement a search environment based on discovery needs.
Future research to explore, define, and deliver the most relevant data in a format responsive to
user queries is highly recommended.
Usability/Sentiment for the Enterprise and ENTERPRISE 21
REFERENCES
Bangor, A., Kortum, P. T., & Miller, J. T. (2008). An empirical evaluation of the system usability
scale. Intl. Journal of Human–Computer Interaction, 24(6), 574-594.
Brooke, J. (1996). SUS-A quick and dirty usability scale. Usability evaluation in industry, 189, 194.
Brooke, J. (2013). SUS: A Restrospective. Journal of Usability Studies, 8(2), 29-40. Retrieved from
http://www.upassoc.org/upa_publications/jus/2013february/JUS_Brooke_February_2013.pdf
Kotrlik, J. W., & Higgins, C. C. (2001). Organizational research: Determining appropriate sample size
in survey research appropriate sample size in survey research. Information Technology,
Learning, and Performance Journal, 19(1), 43.
Rangaswamy, A., Giles, C. L., & Seres, S. (2009). A strategic perspective on search engines:
Thought candies for practitioners and researchers. Journal of Interactive Marketing, 23(1),
49-60.
Sauro, J.S. (2011) Measuring Usability with the System Usability Scale (SUS).
Measuring Usability with the System Usability Scale. Retrieved Oct. 2013 from
https://www.measuringusability.com/sus.php.
Sauro, J.S. (2010, August 25). Should you use 5 or 7 point scales? Measuring Usability. Retrieved
January 14, 2014 from http://www.measuringusability.com/blog/s-points.php.
Tullis, T., Stetson, J. (2004). Proceedings of UPA 2004: Usability Professionals’ Assoication
conference. Retrieved from www.usabilityprofessionals.org/usability.../UPA-2004-
TullisStetson.pdf
White, Martin. (2012). Enterprise Search. Sebastopol, CA: O’reilly.
Usability/Sentiment for the Enterprise and ENTERPRISE 22
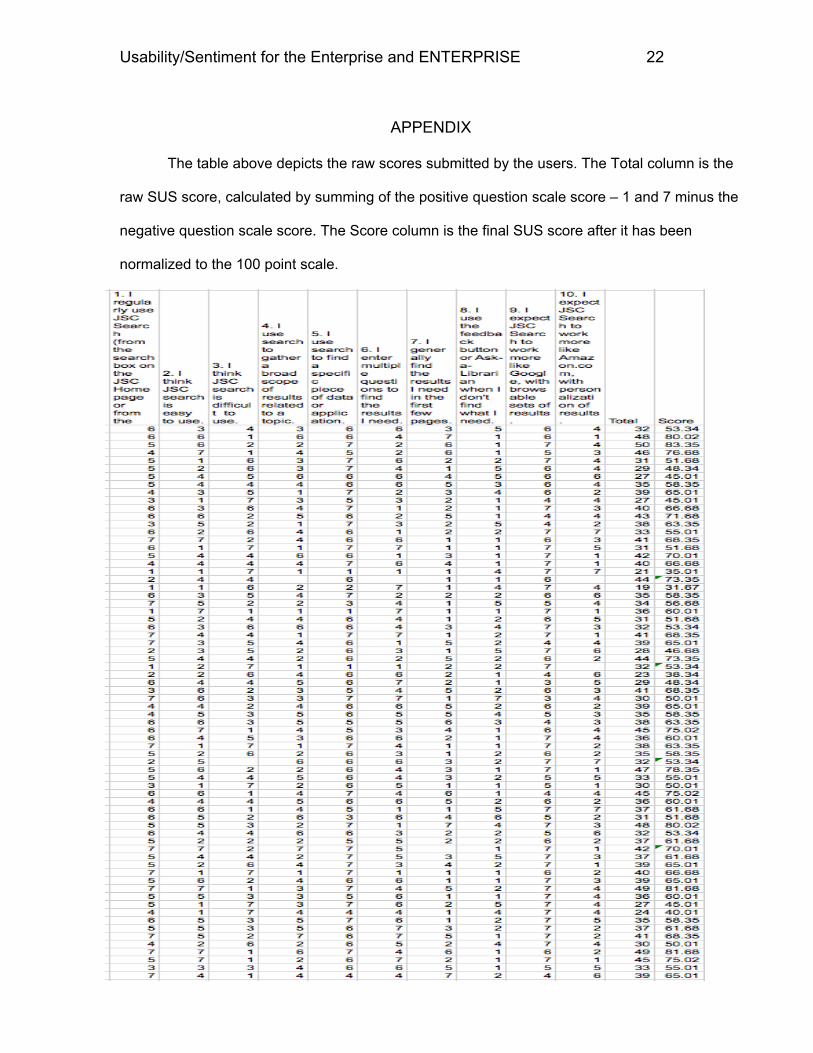
APPENDIX
The table above depicts the raw scores submitted by the users. The Total column is the
raw SUS score, calculated by summing of the positive question scale score – 1 and 7 minus the
negative question scale score. The Score column is the final SUS score after it has been
normalized to the 100 point scale.