usaid libya public financial management (bab al ta …
TRANSCRIPT

USAID LIBYA PUBLIC FINANCIAL MANAGEMENT (BAB AL TAMKEEN) PROGRAM QUARTERLY REPORT FY 2020 Quarter 2 Report January 1, 2020 – March 31, 2020
The Pragma Corporation Principal Contact: Paul Davis 116 East Broad Street Falls Church, Virginia 22046 DISCLAIMER: This report was produced for review by the United States Agency for International Development. It was prepared by the Libya Public Financial Management Program, implemented by The Pragma Corporation. The author’s views expressed in this publication do not necessarily reflect the views of the United States Agency for International Development or the United States Government.


i | BAB AL TAMKEEN ACTIVITY REPORT (QUARTER 2, FY 2020) USAID.GOV
TABLE OF CONTENTS
Acronyms ............................................................................................................................................................ i
Executive Summary .......................................................................................................................................... 1
Component 1: Public Financial Management .............................................................................................. 1
Component 2: Reform Libya’s Electricity Sector ...................................................................................... 9
Component 3: Improve Business Environment ...................................................................................... 12
Self Reliance Grants ...................................................................................................................................... 14
Communications/outreach .......................................................................................................................... 15
Monitoring, Evaluation, and Learning (MEL) ............................................................................................ 15
LIST OF ANNEXES
ANNEX 1: LPFM PARTNER MUNICIPALITIES
ANNEX 2: MONITORING, EVALUATION, AND LEARNING (MEL) AND PITT TABLE
ANNEX 3: SUCCESS STORIES
ANNEX 4: ILLUSTRATIVE TRAVEL PLAN
ANNEX 5: ANALYTICAL REPORTS
5.1 - Wage Bill Analysis Report
5.2 - Exchange rate management report
5.3 - Technical note on the impact of the oil blockade
5.4 - Budget Execution Report
5.5 – Macro-fiscal Development Monthly Reports (January-March 2020)

i | BAB AL TAMKEEN ACTIVITY REPORT (QUARTER 2, FY 2020) USAID.GOV
ACRONYMS AmCham American Chamber of Commerce in Libya BEE Business Enabling Environment CBL Central Bank of Libya CoA Chart of Accounts COP Chief of Party CPI Consumer Price Index CSO Civil Society Organization CVA Customs Valuation Agreement DB Doing Business EE Energy Efficiency EPHS Essential Package of Primary Healthcare Services ES Electricity Sector FX Foreign Exchange GATT General Agreement on Tariffs and Trade GDP Gross Domestic Product GDSC Government Decision Support Center GECOL General Electricity Company of Libya GNA Government National Accord GoL Government of Libya GTEL GECOL Telecom GTZ German Agency for Technical Cooperation HCLA High Council for Local Administration HR Human Resources ICT Information Communications Technology IMF International Monetary Fund LBC Libyan Business Council LED light-emitting diode LESP Libya Economic Stabilization Program LLIDF Libyan Local Investment & Development Fund LPFM Libya Public Financial Management LWBC Libyan Women in Business Committee LYD Libyan Dinar MC Municipal Councils MEG Middle East Economic Growth MEL Monitoring, Evaluation, and Learning METAL Monitoring and Evaluation for Tunisia and Libya MF Team Macro-Fiscal Team MFU Macro Fiscal Unit MoEd Ministry of Education MoEcon Ministry of Economy MoF Ministry of Finance MoH Ministry of Health MoJ Ministry of Justice MoLG Ministry of Local Government

ii | BAB AL TAMKEEN ACTIVITY REPORT (QUARTER 2, FY 2020) USAID.GOV
MoP Ministry of Planning NEEAP National Energy Efficiency Action Plan NOC National Oil Corporation OPGW Optical Ground Wire OTJ On-The-Job Training OSR Own Source Revenue PC Presidential Council PE Primary Education PEFA Public Expenditure and Financial Accountability PFM Public Financial Management PHC Primary Health Care PIP Public Investment Program PITT Performance Indicator Tracking Table PPD Public-Private Dialogue PPP Public-Private Partnership PSAP Private Sector Advocacy Platform REMO Regional Education Monitoring Offices SME Small and Medium Enterprises SPS Sanitary and phytosanitary SWM Solid Waste Management TBT Technical Barriers to Trade TC Technical Committee TFA Trade Facilitation Agreement TFESR Task Force for Electricity Sector Reforms TPM Third-Party Monitoring TWG Technical Working Group UNDP United Nations Development Programme USAID United States Agency for International Development WTO World Trade Organization VTC Video Teleconference Center

1 | BAB AL TAMKEEN ACTIVITY REPORT (QUARTER 2, FY 2020) USAID.GOV
EXECUTIVE SUMMARY USAID’s Libya Public Financial Management (LPFM) Program - known as “Bab Al Tamkeen” – is a 5-year initiative (currently with $14.9 million in funding over two years) designed to address critical macro-fiscal, electricity sector, and enabling environment constraints facing the post-Arab Spring Libyan economy.
Public Financial Management (PFM). The PFM Component continued to effectively implement its activities at the subnational level, where the team deepened the capacity of municipalities to develop own source revenue (OSR) budgets that prioritize public service delivery and to identify and forecast their OSR resources. The PFM team also made progress with its municipal pilot programs in the areas of solid waste management (SWM), primary health care (PHC), and primary education (PE). The PFM team also developed a regulation on local revenue that is in line with best practice. At the national level, the Macro-Fiscal (MF) team increased the Macro-Fiscal Unit (MFU) capacity to track and analyze macro-fiscal trends. Furthermore, the MFU undertake related policy-relevant research activities to collate and analyze macro-fiscal data; and to produce critically important, regular, budget-relevant reporting documents. As a result, MFU staff produced a rigorous year-end budget execution table and monthly fiscal reports that are now published on the MoF’s website and Facebook page. The team also supported the MFU in preparing analytical reports on the wage-bill and the exchange rate regime.
Electricity Sector (ES). The ES Team worked with the technical committees of the Task Force for Electricity Sector Reforms (TFESR) on the finalization of an electricity sector decree that would establish an independent electricity sector regulator and enable competition and the unbundling of GECOL. During the reporting period, the ES Team met with GECOL Chairman, Abdelmajeed Hamza, in Tunis and provided him with an overview of the ES team’s work plan for the next two years. The Chairman agreed on the need to pursue the reforms that are the objective of the team’s work plan, including the adoption of the ES decree. The chairman also agreed with the ES Team’s goals of promoting the implementation of tariffs that will move GECOL closer to cost recovery, advancing the unbundling and restructuring of GECOL, and introducing measures to enable private sector electricity generation.
Business Enabling Environment (BEE). The team organized three focus group discussions with Libyan businesses. Two were co-sponsored by the Libyan Business Council (LBC) for business representatives from Tripoli and Sabha. The third was co-sponsored by the Misrata Chamber of Commerce for its local members. The BEE Team also held individual interviews with SMEs in these cities. Using the results of its legal/regulatory assessment and the information obtained from the focus groups and interviews, the team updated its list of priority reforms. It began developing proposed reforms in the areas of access to credit and minority shareholder rights. The BEE team also prioritized competition law and public-private partnerships (PPP), which businesses identified as priorities. The BEE Team also completed its assessment following the conformity of Libya’s foreign trade regime with eight core WTO agreements. The BEE Team prepared recommendations to improve Libya’s conformity with these agreements, which are being integrated into the WTO Accession Action Plan that the BEE Team plans to deliver to the GoL during the first half of the third quarter.
COMPONENT 1: PUBLIC FINANCIAL MANAGEMENT The PFM Component continued to effectively implement its activities at the subnational level, where the team deepened the capacity of municipalities to develop OSR budgets that prioritize public service delivery and to identify and forecast their OSR resources. The PFM team also made progress with its municipal pilot programs in the areas of solid waste management (SWM), primary health care (PHC), and primary education (PE). The PFM team also developed a regulation on local revenue that is in line with best practice. Also, on February 4, USAID approved revisions to the LPFM Workplan, which

2 | BAB AL TAMKEEN ACTIVITY REPORT (QUARTER 2, FY 2020) USAID.GOV
authorized LPFM to work across 44 total municipalities during Year 1, including a significant number of non-GNA municipalities.1
At the national level, the Macro-Fiscal (MF) team – through formal and on-the-job (OTJ) training – increased the capacity of the MFU to track and analyze macro-fiscal trends. Furthermore, the MFU team undertake related policy-relevant research activities, to collate and analyze macro-fiscal data, and to produce critically important, regular, budget-relevant reporting documents. As a result, MFU staff produced a rigorous year-end budget execution table and monthly fiscal reports that are now published on the MoF’s website and Facebook page. The team also supported the MFU in preparing analytical reports on the wage-bill and the exchange rate regime, with suggested adjustments that could improve macroeconomic stability and diversification.
Fiscal Decentralization & Subnational PFM
Developing Own Source Revenue Budget Capacity at the Municipal Level
The PFM Component continued to effectively implement its activities at the subnational level, where the program deepened the capacity of municipalities to develop OSR budgets that prioritize public service delivery. Through technical and OTJ training, the PFM Team also expanded the capacity of municipalities to identify and forecast their OSR resources. The PFM team also developed a regulation on local revenue that is in line with best practice.
For OSR budget development, the Team adopted a phased approach to ensure sustainable learning throughout the process. Municipalities applied a template that was customized to municipal needs, and that included detailed local revenue and expenditure classifications in accordance with a coding system. The PFM Team then fine-tuned those procedures and improved the municipalities’ budgetary allocation systems and objectives for revenue and expenditure items. The team developed a municipal chart of accounts (CoA) that was based on the Ministry of Finance's (MoF’s) CoA but adjusted to make it more suitable to municipalities. These improvements were complemented by integrating more realistic budget justification narratives into the budget document for each revenue/expenditure category.
The PFM team also provided targeted technical and OTJ training that helped develop local capacity to identify and forecast OSR in 21 original LESP municipalities. During the quarter, OSR budgets were approved by 14 of the concerned mayors and submitted to the Ministry of Local Government (MoLG). The mayors of two municipalities approved the OSR budgets, which are now being submitted to MoLG. In two other municipalities, the OSR budgets are still under mayoral review. The remaining three municipalities are developing their OSR budgets. OSR budgets that are submitted to MoLG require the approval of both MoLG and MoF. Once approved, MoF can provide the municipalities with their budget allocation. The approval of submitted OSR budgets is expected after the promulgation of the Regulation on Local Revenue.
1 While the re-intensification of conflict and the COVID-19 crisis have effectively restricted major programmatic interventions in Quarter 2 to the original set of 22 LPFM-supported municipalities, it is expected that major outreach activities across the network of new municipalities will be undertaken during Quarters 3-4. Further expansion of pilot municipalities in the SWM, PHC, and PE spheres is also expected to occur over this timeframe.

3 | BAB AL TAMKEEN ACTIVITY REPORT (QUARTER 2, FY 2020) USAID.GOV
The PFM Team held a workshop on February 13 in Tripoli for the OSR budgeting staff of 14 partner municipalities.2 Six of the attending municipalities were more advanced, having already prepared draft 2020 OSR budgets and estimates (Kabaw, Khoms, Misurata, Zuwarah, Yafran, and Wadi Albwanies). At the workshop, the team worked with these six municipalities to finalize their OSR budgets, which were submitted to the MoLG later in February.
The other eight attending municipalities participated in the training to learn from the experience of the six more advanced partner municipalities. During the workshop, the PFM recommended that the MoLG issued follow-up letters on February 23 to the 14 attending municipalities to request their medium-term budgets, which include the investments needed to improve the infrastructure for critical municipal services; e.g., education and health, the focus of the Government of Libya (GoL) decentralization policy.
Enhancing the legislative foundations for municipal own-source revenues
In late December of 2019, the High Council for Local Administration (HCLA) provided the team with a draft of a “Regulation on Local Revenue.” The draft regulation was intended to advance decentralization by authorizing municipalities to collect and budget various types of OSR. The team reviewed the draft regulation and identified numerous drafting issues and inconsistencies with best practices. The team developed 25 pages of comments suggesting major revisions and provided these to the HCLA. Three meetings were held with the HCLA lawyers in February to review the team’s comments. The HCLA lawyers then asked the team to prepare an entirely new draft. In early March, the team delivered its 30-page draft regulation to the HCLA. The team and the HCLA lawyers held extensive discussions to clarify issues and discuss modifications. In mid-March, the agreement was reached on a draft that was far more in line with best practice and municipal financing needs than the original draft. The HCLA then submitted the draft to the Minister of MoLG, who delivered the draft to the Presidential Council (PC) on March 30. It is now being reviewed by the MoF. The regulation remains a high priority for the Government National Accord (GNA) and is expected to be finalized and promulgated by the end of April.
Primary Health Care (PHC)
In early January, the team – in collaboration with representatives of MoLG and Ministry of Health (MoH) – finalized the PHC operational plan. The team followed the completion of the plan with a workshop on January 21 to promote buy-in from both ministries and representatives of the municipalities of Tripoli
2 The other eight municipalities could not travel to Tripoli for security reasons and will receive training in April and May 2020, by VC if needed.
Representatives from 14 municipalities and the MoLG, MoF, and HCLA attend a workshop on OSR Budgeting in Tripoli on February 13

4 | BAB AL TAMKEEN ACTIVITY REPORT (QUARTER 2, FY 2020) USAID.GOV
Center, Misurata, Gharyan, Sabha, and South Alzawiya. Within the week following the workshop, the plan was approved by both ministries. A central element of the plan is the establishment of a municipality-specific essential package of primary healthcare services (EPHS) that includes the basic PHC services of greatest importance to citizens of the concerned municipality. The team also carried out the basic costing of the EPHS for select clinics within Tripoli Center. The team assisted the pilot municipalities in establishing their PHC task forces with staff from both the municipality and the MoH regional health directorate. In February, the PHC team expanded this work to the PHC Centers of Nofliyeen, Fashloum, and Shuhada Al Mansoura. The PHC team worked with the MoLG to identify the departments within each pilot municipality that will serve on the task force that is to implement the PHC operational plan. The pilot municipalities and the MoLG then selected the specific staff from the concerned departments to be assigned to the task force. Brega, a non-GNA municipality, sent the PHC Team a letter committing to establish a task force to work on the piloting of PHC services.
The MoH agreed with the PHC team’s proposal to establish health offices in certain municipalities to replace the concerned Regional Health Directorates. The PHC team also met with the Department for Regional Health Services Directorates to clarify the respective responsibilities of the directorates and the municipal health offices. Because establishing the municipal health offices requires a legal foundation, the team held several meetings with the Director of the Legal Office of the General Secretariat of the HCLA, who confirmed that the PC would need to issue a decree formalizing the role of municipal health offices.
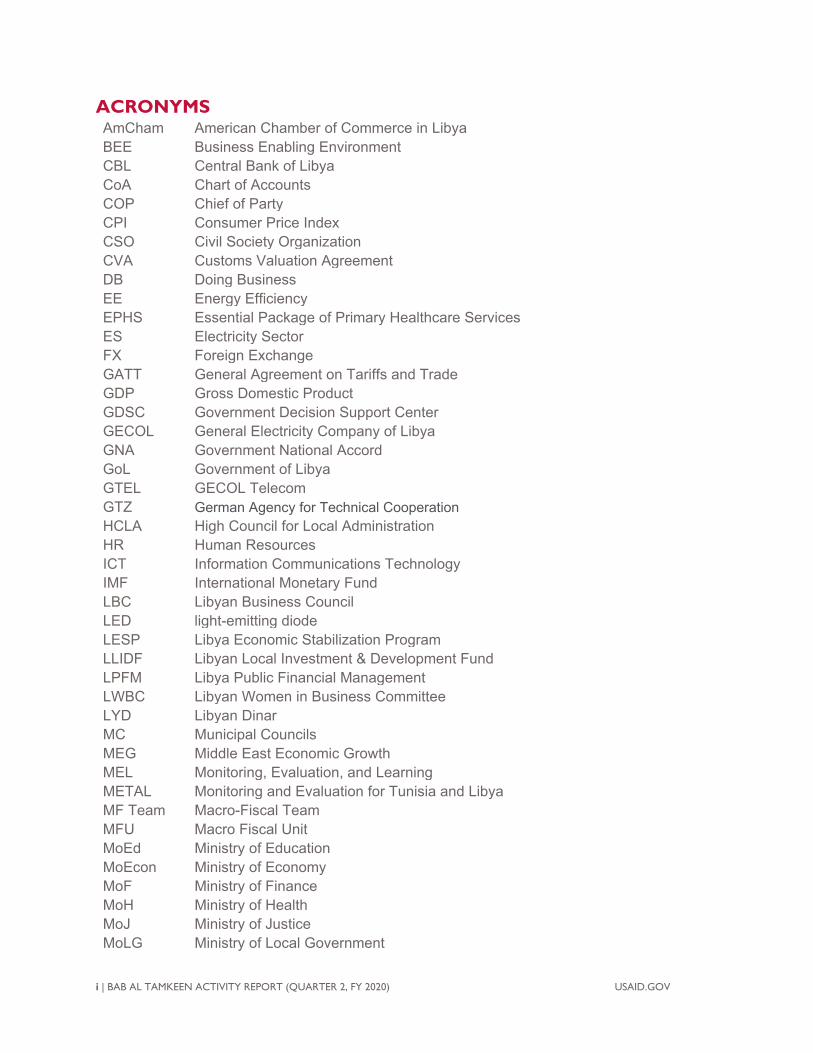
In early March, the PHC team identified the data that will be needed to develop a public investment plan (PIP) for each pilot municipality. The team started the data collection at the PHC centers of Nofliyeen and Fashloum in Tripoli Center. The PHC visited these facilities on several occasions to assess their infrastructure status and to discuss with staff the availability of vital inputs, including the basic medical equipment as per the list developed by the team. The PIP analysis for the centers in Tripoli Center also covers the infrastructure needed by the clinics to deliver the basic package of services. Once completed, the analysis will be used to conduct similar analyses for the PHC centers in the other pilot municipalities.
Due to the COVID-19 pandemic, in mid-March, the PC issued instructions requiring civil servants to work from home, which has resulted in the suspension of the pilot training program. Consequently, the PHC team is developing a plan for the use of video teleconference centers (VTCs) to conduct the training. The PHC team is committed to implementing its work plan while tailoring its objectives and targets to respond to COVID-19 needs of municipalities at the PHC level. The team is reviewing the measures adopted by other countries to fight the pandemic at the PHC level.
Patient data manual registration process at Nofliyeen PHC clinic in Tripoli Center
5 | BAB AL TAMKEEN ACTIVITY REPORT (QUARTER 2, FY 2020) USAID.GOV
Solid Waste Management (SWM)
During the quarter, the SWM Team worked at both the national level (with the PC, MoLG, and MoF) and the municipal level on a range of SWM issues. In January, the team followed up with the MoLG on the measures that had been taken to identify locations for temporary and permanent landfills. The team and MoLG discussed the operations of the MoLG’s newly formed committee, which was tasked to identify appropriate locations. Following the advice of the SWM Team, the PC also established a new committee tasked with coordinating all SWM measures. However, progress on cross-ministry coordination has so far been limited due to the lack of funds to procure SWM services and the impact of COVID-19.
The SWM team also worked to operationalize the SWM strategy at the nine legacy LESP municipalities by (1) assisting the Municipal Councils (MCs) to introduce rigorous SWM operational procedures; (2) assisting the MCs to take concrete steps towards implementing
transparent, competitive procurement of SWM collection and disposal services; and, (3) compiling the data needed to prepare 2021 budgets on SWM expenditures.
To institutionalize the municipal role in improving SWM services, the SWM team proposed that each municipality formally establish an SWM Working Group (SWMWG) to take charge of ensuring implementation of the SWM operational procedures. The SWM Team also provided the municipalities with the necessary procurement documentation. For some municipalities, such as Khoms, the team discussed the establishment of collection zones based on the daily volume of solid waste produced and the planned collection routes and transfer activities. Based on the SWM Team’s recommendation, Surman designated its General Sanitation Department as the organizer of all SWM operations in the municipality.
The team assisted Tripoli Center to finalize two open SWM procurements, which resulted in the award of two separate contracts in January. One contract exceeded LYD 5 million and therefore required approval by MoF’s Control Office, which has yet to be given. The other contract was less than LYD 5 million; however, the parties have delayed performance due to the failure of the MoLG and MoF – contrary to their prior commitments – to make the funding for the contracts available. The SWM team is working with the MoLG to advocate that the funding be included in the GoL’s 2020 Financial Arrangements.
The lack of funding for SWM procurements affects all SWM pilot municipalities. The interruption in the flow of oil revenue since January has caused the MoF to limit municipal expenditures. The LPFM Team has been making a concerted effort - using its contacts at the MoF - to arrange a meeting with the Minister, where the funding of SWM procurements will be a discussion point. The meeting, initially planned for March, was postponed due to intensification of the conflict and the GoL’s focus on COVID-19. These discussions are expected to be renewed early in Quarter 3.
At the same time, the SWM Team is working with all SWM municipalities to ensure they are prepared to launch SWM procurements as soon as the funding issue is resolved. As an alternative approach, the team is working with pilot municipalities and the MoLG to modify their OSR budgets to provide the needed funding as soon as the Regulation on Local Revenue is promulgated. The SWM team also
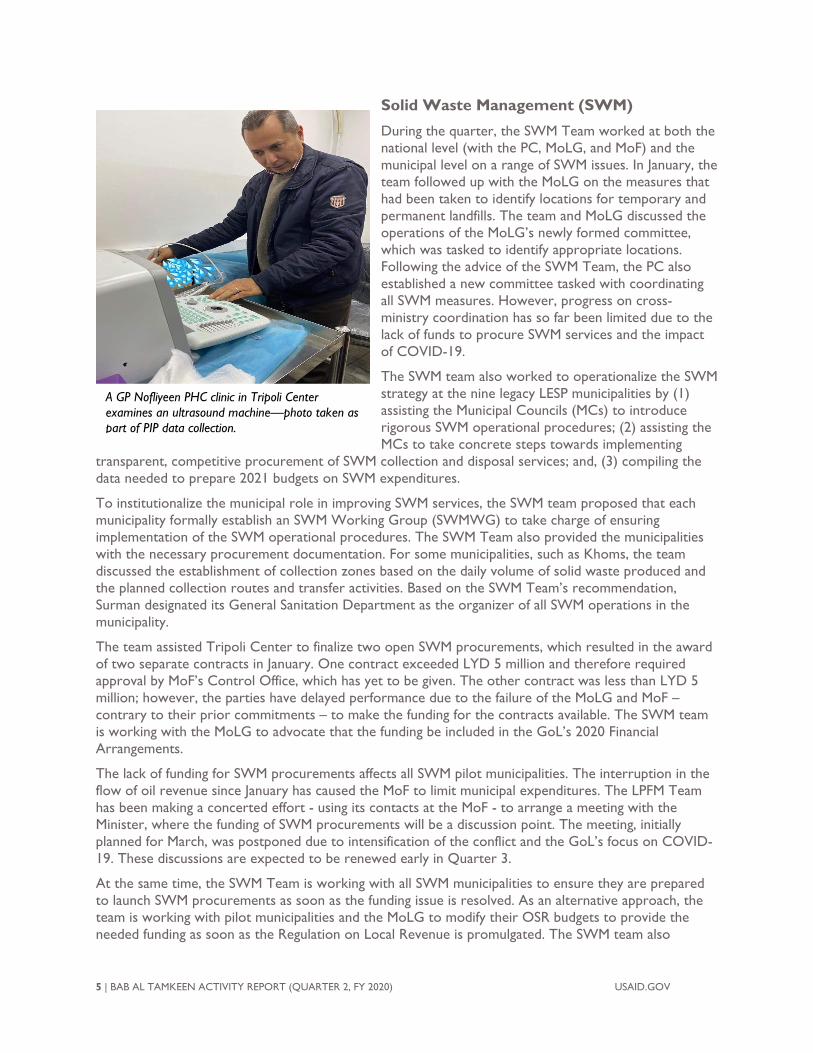
A GP Nofliyeen PHC clinic in Tripoli Center examines an ultrasound machine—photo taken as part of PIP data collection.
6 | BAB AL TAMKEEN ACTIVITY REPORT (QUARTER 2, FY 2020) USAID.GOV
continues to dialogue with other donor programs (e.g., UNDP, GTZ) that may have funding to support municipal SWM activities.
The SWM team assisted the municipalities of Tripoli Center, Souq Al Jumma, Khoms, and Surman in compiling the data needed to prepare a 2021 budget on SWM expenditures. In Q3, the team will replicate this work in the five other SWM pilot municipalities. The SWM Team has already identified and started collecting the data for SWM public investment plans (PIPs) for the nine LESP municipalities. The main investments would be upgrading the available landfills by constructing sanitary-based space within the landfill footprint currently used as open dumpsites, while also considering developing transfer stations. The upgrade would cover the free remaining airspace in the landfills to help provide operational capacity, where applicable.
The LPFM advisors will determine the cost structure of these investments and will help compute the cost-benefit analysis parameters for the proposed public investments. Major types of data being analyzed include annualized solid waste quantities, the target citizens within municipalities who are the main beneficiaries, the solid waste collection vehicles, and the operational expenses that will complement the capital expenditures.
Primary Education (PE)
During the quarter, the PE Team and the MoEd identified five senior MoEd officials to work on the PE Technical Working Group (TWG). The PE Team then began assisting the TWG with the development of a three-year PE operational plan, which has required intensive collaboration between the Team and the TWG members, who previously had very limited familiarity with decentralized education systems. The PE Team worked tirelessly on orienting the TWG on the split between MoEd’s centralized role at the policy level and the administrative responsibilities to be mobilized at the pilot municipalities. Through intensive working sessions with the TWG, the PE team successfully advanced the understanding of MoEd officials on the options and approaches suitable for educational decentralization in Libya. This led to MoEd’s approval in January for the initiation of the PE pilots.
The PE Team and the TWG held several working sessions to assign tasks among TWG members and to ensure a division of labor between the TWG and the relevant Regional Education Monitoring Offices (REMOs). The REMOs play an important role in implementing MoEd directives at the subnational level, and the PE Team has identified them as key stakeholders in the PE operational plan. The Team then held a planning meeting in March involving the TWG and the REMOs. It was agreed that the team and the TWG will: (1) develop a legislative framework to govern the relationship between the REMOs and municipalities; (2) establish a list of prioritized education services; (3) define the required capacities of all staff who will occupy key positions under the operational plan.
Following up on its March 9 operational planning meeting with the PE TWG and representatives from the REMOs, the PE Team developed and distributed a questionnaire to the REMOs aimed at obtaining their input and assistance in determining the primary education services best suited for transfer to municipalities. The TWG is completing the process of collecting the questionnaires and, with the PE Team’s assistance, will expeditiously develop a targeted analysis of the results.
As part of outlining the sectoral PIP needs, the PE Team and the TWG agreed to update the “Nationwide School Assessment,” a study conducted by the Ministry of Education in 2012. Even though it is a somewhat dated analysis, the study currently provides the only baseline of the sector’s key indicators, and a 2012 assessment of the sector’s infrastructure and facilities. In parallel, the PE Team will target upgrading the schools’ infrastructure to improve the quality/coverage of cost-efficient PE services.
The PE Team also undertook the first-round mapping of 35 Civil Society Organizations (CSO)s that are potentially active in the area of PE, which included preliminary capacity assessment of these CSOs in the
7 | BAB AL TAMKEEN ACTIVITY REPORT (QUARTER 2, FY 2020) USAID.GOV
10 PE Pilot municipalities in terms of their potential roles in monitoring and evaluating schools. Out of the 35 CSOs, the PE team was able to reach seventeen and collected information about the type of activities they engage in and their target beneficiaries. The PE Team also identified each CSO’s local and international counterparts, and, in some cases, the donors that fund their activities.
The PE Team was planning to hold a roundtable discussion in March for the CSOs and the TWG to confirm oversight/social accountability roles that could be assigned for CSOs within the PE operational plan. However, the session was canceled due to the current GoL measures restricting group activities to fight the COVID-19 pandemic. The PE Team will continue its efforts to map out CSOs that would be the suitable partners in improving the PE services at the subnational level, by seeking assistance from the REMOs to open up communication channels with potential CSOs and unlock information prospects. The Team will also work intensively with MoLG to identify the most feasible authority transfer opportunities in light of new municipal requirements in the wake of the COVID-19 pandemic.
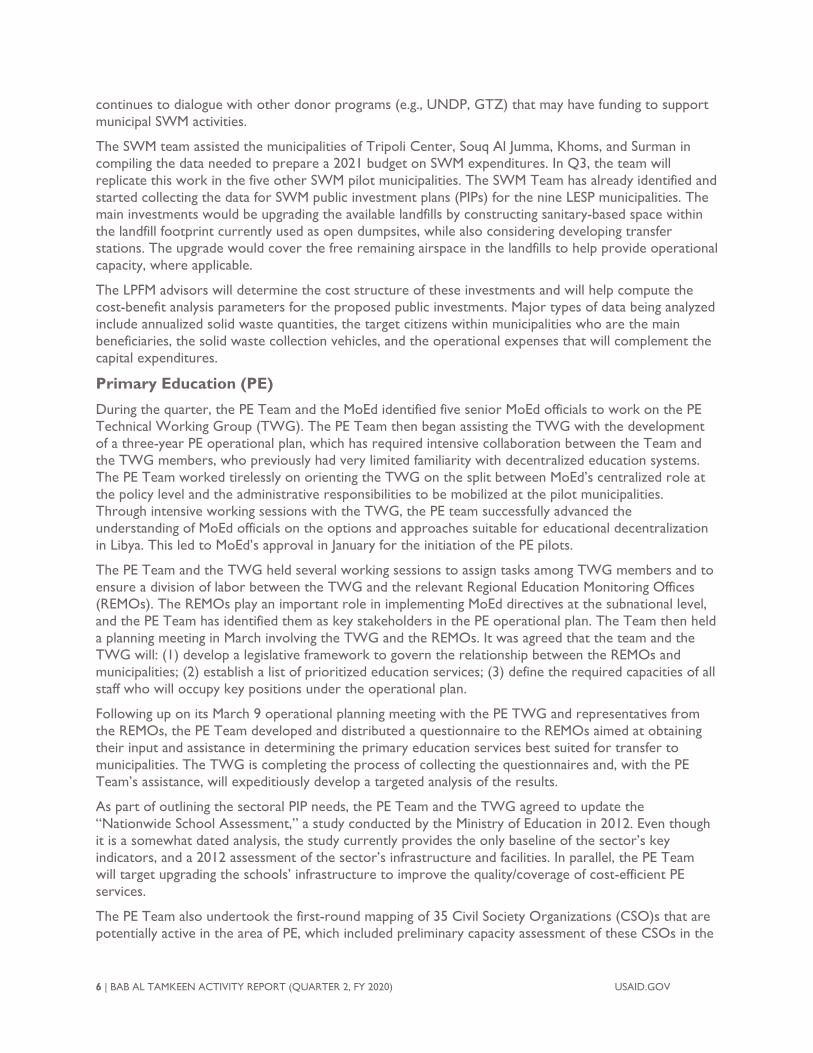
National Level LPFM Engagement: MFU Capacity Development, Studies & Analysis For Use By Libyan Decision-Makers During Quarter 2, the LPFM Macro-Fiscal (MF) team – through technical support and formal and OTJ training – increased the capacity of the MFU to track and analyze macro-fiscal trends, to undertake related policy-relevant research activities, to collate and analyze macro-fiscal data, and to produce critically important, budget-relevant reporting documents. As a result, MFU staff produced a rigorous year-end budget execution table and monthly fiscal reports that are now published on the MoF’s website and Facebook page. The team also supported the MFU with preparing rigorous and practical analytical reports on the wage-bill and the exchange rate regime. Additionally, the MF team assisted MFU in developing an important technical note on the current and prospective impact of the blockade on budgetary performance. LPFM and MFU leadership also agreed on an MFU training program for the remainder of Year 1, including a rigorous curriculum for the MoF’s Institute for Public Financial Management.
The MF team worked to build the MFU’s capacity in various areas, particularly on core macro-fiscal issues and the four basic macroeconomic sectors: the system of national accounts, presentation of supply and use tables, input-output analysis, and financial programming. These sectors were used to assess the impact of and the potential policy responses to the oil blockade.
These sessions were accompanied by OTJ training provided daily. These included collecting oil statistics from the National Oil Corporation (NOC), which allowed the MFU to estimate oil GDP as a share of national GDP. For non-oil GDP, the MF team engaged the MFU in analytical activities designed to improve estimates of the size and composition of the non-oil sector. The absence of statistical surveys since 2012 has increased the difficulty of estimating the magnitude and structure of Libya’s non-oil GDP. In response, the MF team introduced basic input-output tables to facilitate a simple GDP estimation process. The methodologies of different international institutions (IMF, World Bank) were studied, and a GDP deflator was used to demonstrate alternative methods for estimating real GDP. The team and the MFU then prepared detailed budget execution tables, which allow assessing each GDP
Internal macro-fiscal training for MFU and MoF officials.

8 | BAB AL TAMKEEN ACTIVITY REPORT (QUARTER 2, FY 2020) USAID.GOV
component to make projections. Forecasting tools for assessing potential primary revenue sources were also introduced as part of this OTJ mentoring.
Development of Macro-Fiscal Monitoring & Analysis Reports
The afore-mentioned sessions significantly improved the organization of the databases the MFU is developing, and the preparation of the budget execution tables published on the MoF's website and Facebook page. A Budget Execution Report for 2019 was prepared and is currently being finalized. The team also worked intensively with MFU staff to strengthen their capacity to prepare the monthly macro-fiscal updates published on the MoF's website. The January and February reports contained a rigorous analysis of the effects of the oil blockade on the Libyan economy, the GoL budget, and the balance of payments. The March Macro-Fiscal Report includes an assessment of the economic consequences of the COVID-19 pandemic.
Given the current COVID-19 restrictions in Libya, the MF team is organizing weekly Skype calls with the MFU team and continues to be in daily contact individually with its various members. These discussions allow the team to continue to work with the MFU on the joint development of new economic forecasts that reflect changing economic circumstances. A short-term econometric model was prepared within the MFU that takes account of the impact of key variables (including money supply and the exchange rate) on the parallel market to assess the impact of changes in these variables on inflation.
Preparation of Technical Reports on Major Macro-structural Issues
The MF Team supported the MFU in drafting a technical note on the structure of the excessive public sector wage bill, with international comparisons to illustrate how this issue impacts Libya’s macro-fiscal health and economic diversification prospects. The note includes detailed projections reflecting Libya's demographic evolution and the corresponding changes to the wage bill, as well as best practice recommendations to improve wage bill management. Another major analytical report was prepared by the MFU on the exchange rate regime. This report addresses the dual exchange rate problem caused by the foreign exchange (FX) tax, which severely penalizes exporters. The report also tackles the fundamental question of the optimal choice of exchange rate regime in an oil-dependent country like Libya. It analyzes the impact of an overvalued exchange rate on macroeconomic stability and economic diversification, the consequences of fluctuations in the parallel market on key macroeconomic performance variables, and the impact of alternative exchange rate regimes on government revenues and expenditures. The report proposes a gradual approach to introducing greater exchange rate flexibility, including specific macro-structural policy measures/actions needed to facilitate an efficient and relatively smooth transition to a flexible exchange rate.
Training Program for MoF Financial Institute and MFU Staff
The MF Team developed a detailed 9-month curriculum for the MoF’s Financial Institute that will provide officials from public sector institutions with a solid grounding in basic macro-fiscal policy analysis principles, as well as a practical understanding of the applied budget formulation and applied policy analysis. The Team also developed a core training program for MFU staff that focuses on macro-economic modeling, budget projections, and revenue modeling.
National-Level PFM Reforms In mid-December Q1, USAID requested LPFM to revise its Year 1 work plan to include several major national level PFM activities principally within the mandate of the MoF. LPFM presented the revised work plan to USAID in late December, which USAID approved on February 3. USAID met in mid-February with MoF leadership to discuss these changes. However, the MoF has since been heavily focused on the consequences of the re-intensification of the conflict and, more recently, the COVID-19 crisis and the loss of oil revenue. Furthermore, LPFM has not been able to position the concerned advisory experts in Tripoli due to COVID-19. Consequently, LPFM expects to initiate proactive

9 | BAB AL TAMKEEN ACTIVITY REPORT (QUARTER 2, FY 2020) USAID.GOV
discussions on these potential program areas early in Quarter 3 with senior MoF stakeholders and to assess in coordination with USAID stakeholder engagement interest under current circumstances.
COMPONENT 2: REFORM LIBYA’S ELECTRICITY SECTOR
During the quarter, the Electricity Sector (ES) team worked with GECOL and other sector stakeholders to advance the component’s objectives. Weekly meetings were held with GECOL’s chairman and board members. The team assisted GECOL with the development of a draft National Energy Efficiency Action Plan (NEEAP) that aims to reduce consumption by 20% over five years, and the establishment of regional billing and collection targets to reduce commercial losses. The ES team also held workshops to advance the development of an electricity decree that authorizes the reform of the sector. And the team resumed its assistance to realign GECOL’s workforce and generate non-electric revenues.
Assist TFESR to develop and advocate for an electricity sector decree
During the quarter, the Task Force for Electricity Sector Reform (TFESR) established a Legal Technical Committee to develop a draft electricity sector decree providing for the reform of the sector by authorizing the unbundling of GECOL and the participation of the private sector in electricity generation and distribution.3 On January 27, the ES team held the first workshop for this committee to review the necessary elements of the decree. On March 9, a second workshop was held to initiate the drafting of the decree. .
Reduce Commercial Losses and Enhance Revenue at GECOL
The ES team continued to assist GECOL with the reduction of its commercial losses. The ES team held several workshops for GECOL’s Customer Service Regional Managers and key Customer Service support staff to review the details of the established 2020 regional billings and collections targets. The workshops also trained the participants on the use of the newly enhanced web-based dashboard tool developed by the ES team to assist in improving billings and collections and lowering commercial losses.
3 The construction of the first private sector electricity generation facility (a 100 MW solar plant) is proposed to begin later
this year. The proposed solar plant is expected to sell its output to GECOL under a Power Purchase Agreement (PPA).
Members of Legal Technical Committee participating in the electricity sector reform workshop

10 | BAB AL TAMKEEN ACTIVITY REPORT (QUARTER 2, FY 2020) USAID.GOV
Members of the GECOL Commercial Losses Technical Committee participating in the electricity sector reform workshop
Revenue enhancement - non-electric revenue
The ES team developed a recommended strategy for GECOL to pursue nonelectric revenue generation through the monetization of GECOL’s vast fiber-optic network. GECOL management intends to present the strategy to its Board when conditions permit. The basic elements of the ES team’s proposed strategy are (1) Create a wholly-owned GECOL subsidiary – GECOL Telecom (GTEL) - providing telecom services; (2) Assign GTEL exclusive rights to use GECOL’s optical ground wire (OPGW) infrastructure for providing telecom services; (3) Have GTEL obtain a Class 1 telecommunications service license; (4) Transfer GECOL’s ICT department to GTEL and outsource all GECOL ICT service needs to GTEL; (5) Execute inter-company service agreements between GECOL and GTEL; and (6) Enter into a PPP arrangement for the management of GTEL with a competitively selected enterprise. Promote the establishment of an independent regulator
The ES team held several workshops early in the quarter for the TFESR’s Regulatory Technical Committee. The workshops were held to obtain the committee’s comments on the draft independent regulator decree. Representatives from the MoLG and CSOs attended. After incorporating the comments from the workshops, the ES team and the PC’s energy advisors met on March 1, where the team presented the decree. Discussions focused on the best way to present the decree to the Prime Minister (PM). The meeting concluded with an agreement that the ES team would prepare a package for the PM that includes an explanatory memorandum. The PC advisors committed to providing their comments on the decree in March, but these had not been received as of the writing of this report. The ES team plans to prepare the package and to deliver it to the advisors during the next quarter.
Members of the Regulatory Technical Committee unit participating in the workshop

11 | BAB AL TAMKEEN ACTIVITY REPORT (QUARTER 2, FY 2020) USAID.GOV
Assist GECOL to realign and reduce its workforce
Libyan government subsidies to the electricity sector are the highest in the MENA region. They represented 9.1% of Libya’s GDP in 2018, with overstaffing at GECOL representing nearly 1%. The ES team resumed its work with GECOL’s Technical Committee on Workforce Realignment on a workforce realignment plan that moves GECOL closer to its regional peers in terms of workforce size. Currently, the work is focused on determining the recommended staffing for unbundled core businesses and support services. The ES team and the technical committee are identifying which of GECOL’s functions are core and which are not. The ES Team intends to prepare a five-year deployment, training, and HR development plan to support the transition from the current workforce of 41,000 to 14,000.
Improve private sector participation in the electricity sector
The ES team worked with the TFESR and GECOL to review modalities for private sector participation in the electricity sector. The ES Team assisted with assessing the costs and benefits of private sector participation and the technical and legal requirements. The ES Team emphasized the potential benefits of private sector participation in distribution services, including the introduction of smart meters, pre-paid meters, and collection kiosks. The ES team’s recommendations will be used as inputs to GECOL’s unbundling plan. The ES team developed an action plan for GECOL’s introduction of smart and prepaid meters, starting with a pilot in Tripoli Center and then expanding to other Tripoli municipalities. Prepaid and smart meters dramatically improve revenue collection and decrease commercial losses, major objectives of the LPFM program. The action plan was developed after LPFM sponsored meetings with Tripoli Center, MoLG, and GECOL. The plan aims for meter installation to commence by November 1, 2020. Increase Energy Conservation and Demand Side Management
During the quarter, the ES team and GECOL’s Energy Efficiency & Conservation Technical Committee completed a draft of the 2020 National Energy Efficiency Action Plan (NEEAP). The draft plan was provided by GECOL to the MoP’s Energy Efficiency (EE) Committee. The plan targets 20% less electricity consumption by 2025. The plan reflects the “Arab End Use Electricity Efficiency Improvement and Conversation Guidelines.” The ES team had planned to present the NEEAP to the EE Committee during a March 2020 workshop; however, all March workshops were postponed due to the COVID-19 pandemic. Feedback will now be obtained via VTCs with committee members during April and May. Achieving the NEEAP’s energy efficiency goals will require appropriate implementing measures, and the ES team will assist the MoP’s High Committee for Energy Efficiency to develop the needed measures. GECOL unbundling and restructuring
During the quarter, the ES team held a workshop for a new GECOL Technical Committee on the Financial Unbundling of GECOL. The ES team is assisting the committee with developing financial models for an unbundled GECOL with core and non-core businesses, as is consistent with best practice and international unbundling models. During its inaugural meeting, the committee agreed to split into four working groups. The ES team will conduct workshops and training events for each working group. The four working groups are assisted in their day-to-day work by the ES team. The assistance will continue until the financial models for unbundling are presented to the TFESR and GECOL.

12 | BAB AL TAMKEEN ACTIVITY REPORT (QUARTER 2, FY 2020) USAID.GOV
Figure 1 - Members of the GECOL financial unbundling Technical Committee participating in the electricity sector reform workshop
COMPONENT 3: IMPROVE BUSINESS ENVIRONMENT The BEE component assists Libya with establishing a business environment that facilitates business creation and operation, thereby boosting economic growth and diversification. The BEE Team pursues this objective by assisting Libya reform and increase the transparency of its commercial legal/regulatory regime, increasing its integration into global markets by preparing the country for WTO accession, and enhancing its attractiveness to international investors by raising its scores on the World Bank’s Doing Business (DB) indicators. During the quarter, the BEE Team continued to gather, translate, and review the existing legislation and regulations that form the basis of the business environment. The team also advanced the development of the WTO Accession Action Plan and held in-depth discussions with key public and private sector stakeholders on its work on enabling environment reforms and WTO accession. In the public sector, the team held discussions with counterparts from the Government Decision Support Center (GDSC), the Ministry of Economy (MoEcon), the Ministry of Justice (MoJ), the Libyan Local Investment and Development Fund (LLIDF), the Customs Bureau, the legal office of the Presidential Council (PC), and the Libyan Capital Markets Authority. Of greatest significance, the GDSC committed to establish and lead working groups – that would include the BEE team and the PC’s legal office – to review and further develop the BEE team’s proposed legislative reforms. And the PC’s legal office agreed to establish a Legal Reform Unit that would participate in the GDSC working groups, and then advocate the agreed reforms at the PC. The BEE team also actively engaged in the private sector during the quarter. In February, the team and the Libyan Business Council (LBC) organized two focus groups. The participants in the two groups included 18 SMEs from Tripoli and Sabha, two business lawyers, the LBC’s Chairman and staff, and representatives from the GDSC, AmCham, and the Libyan Women’s Business Council (LWBC). In March, the BEE team and the Misrata Chamber of Commerce co-sponsored a third focus group for eight Misrata-based local businesses. The BEE Team also held individual interviews with 17 additional SMEs in Tripoli and Misrata. In total, the representatives of 35 SMEs operating in a wide range of sectors and industries participated in either the focus groups or individual interviews All stakeholders expressed enthusiastic support for the work of the BEE team to help Libya identify, develop, and adopt critical enabling environment reforms. Both public and private sector counterparts expressed a desire to collaborate with the BEE team. In particular, the private sector stakeholders identified many specific reforms to the enabling environment they deemed necessary. They strongly support the establishment of a publicly accessible online platform where all laws, regulations, and decrees can be obtained. There was broad consensus on the need for reforms that will (i) increase

13 | BAB AL TAMKEEN ACTIVITY REPORT (QUARTER 2, FY 2020) USAID.GOV
access to credit; (ii) make customs processing and import/export licensing more streamlined, transparent, and uniformly applied; (iii) enable public-private partnerships for the infrastructure projects that will be needed when the conflict ends; (iv) address unfair competition by firms that operate outside the law; (v) lessen the current restrictions on foreign investment; and (vi) establish a more transparent, open, fair, and competitive government procurement process. Both public and private sector counterparts also expressed substantial interest in advancing the readiness of Libya for WTO accession and in need to implement a legal/regulatory review function to identify and correct the many inconsistencies, gaps, overlaps, and ambiguities in the current legislative/regulatory regime. Assess Libya’s Business Enabling Environment
During the quarter, the BEE Team continued its assessment of the legal and regulatory framework and bureaucratic practices affecting commerce and business operations. These work laws and regulatory instruments are relevant to WTO membership requirements and, therefore, the WTO Accession Action Plan. The review also covered many of the laws and regulations relating to the areas identified by the private sector as problematic. More specifically, the BEE team reviewed the regimes governing, access to credit, investment promotion, foreign investment, labor relations, taxes, customs and foreign trade regulation, government procurement, competition, business organizations, corporate governance, shareholder rights, capital markets, accounting and auditing, and intellectual property. Identify Priority Reforms and Develop Policy Briefs
Using the information obtained from its own legislative/regulatory review and analysis, as well as the insights of the private sector, the BEE team revised its list of priority reforms areas, focusing on the areas where significant reforms are both needed and achievable under the prevailing circumstances, which do not currently permit the adoption of new laws or amendments to laws. The team began developing drafts of legislation (decrees) and accompanying memoranda (policy briefs) in the areas of secured transactions, import/export licensing, and minority shareholder rights. The proposed drafts and explanatory memoranda are expected to be delivered to GoL counterparts in late April/early May. The explanatory memoranda will review the need for the reform – how Libya’s current regime is inconsistent with BEE best practices – and the main elements of the draft legislation. The BEE team also prioritized the development of proposed reforms in the areas of unfair competition, public-private partnerships, foreign investment, customs, and government procurement, all of which have been identified by the BEE Team as key private sector priorities, where meaningful reforms are achievable under current circumstances. The BEE Team also established a group of “second-tier” reforms: (i) a decree governing commercial arbitration; (ii) streamlined court procedures to more expeditiously resolve contract disputes; (iii) procedures enabling the expeditious enforcement of judgments resulting from commercial cases; and (iv) amendments to the Labor Code to ease hiring/firing restrictions and to reduce impediments to women participation in the workforce; Develop the WTO Accession Action Plan
During the quarter, the BEE Team also completed its assessment of the conformity of the relevant elements of Libya’s foreign trade regime with the core WTO agreements: the Trade Facilitation Agreement; the Agreement on Trade-Related Aspects of Intellectual Property; the Agreement on Technical Barriers to Trade; the Agreement on the Application of Sanitary and Phytosanitary Measures; the Customs Valuation Agreement; the Rules of Origin Agreement; the General Agreement on Tariffs and Trade; and the Government Procurement Agreement. This assessment involved a review of Libyan

14 | BAB AL TAMKEEN ACTIVITY REPORT (QUARTER 2, FY 2020) USAID.GOV
legislation as well as on-the-ground research that included discussions with private sector firms, the Libya Customs Authority, customs brokers, and the Ministry of Economy. As an output of the assessment, the team prepared recommendations to improve the conformity of Libya’s regime with the WTO agreements, and these are being integrated into the WTO Accession Action Plan under development by the team. The Action Plan identifies the areas where Libya’s legislative framework governing WTO-relevant subject matter requires modification; it also provides an accession roadmap for the GoL that describes the significant milestones and how to achieve them efficiently. The BEE Team plans to deliver the Action Plan to the GoL during by early May. Establish PSAP at LBC and Hold Focus Groups
During the quarter, the BEE Team met regularly with the Chairman of the LBC. They agreed on the steps for establishing the Private Sector Advocacy Platform (PSAP) and scheduled the first two private sector focus groups for February. The BEE Team and LBC staff then collaboratively planned the focus groups, which were held on February 5 and 16. The participants in the first focus group included the LBC Chairman, two business lawyers, representatives from 10 Tripoli SMEs, the GDSC, AmCham, and the LWBC. The participants in the second focus group, also co-sponsored with the LBC, included representatives from eight Sabha-based SMEs. In March, the BEE team held another focus group that was co-sponsored by the Misrata Chamber of Commerce for eight local businesses from that municipality. The BEE Team also conducted individual interviews with SMEs in all three cities. In total, 35 SMEs operating in a wide range of sectors and industries participated in the focus groups and interviews. Through this engagement, the team identified the reforms of the greatest interest to the private sector. Technical Reform Secretariat, PPD, Training, Legislative Database
In January, the BEE team met on several occasions with the two GDSC officials that had been assigned by the Head of the GDSC to coordinate with LPFM. The GDSC officials agreed that the GDSC’s Secretariat will serve as the technical reform secretariat and will establish the working groups to review the recommended legislative reforms and explanatory memoranda developed by the BEE team. It was agreed that the BEE team and the PC’s legal office would be included in all working groups. The SMEs that participated in the focus groups and interviews broadly expressed strong interest in the establishment of a central publicly accessible on-line database where all laws, regulations, and decrees can be obtained. By the end of the quarter, the Team had collected and organized a substantial number of the concerned legal and regulatory instruments. The team, therefore, began planning for the award of a grant to fund the establishment and initial operation of the database. The award is expected to be made in the third quarter.
SELF RELIANCE GRANTS In this quarter, the operationalization of the Grants Program commenced. The LPFM Grants Manual was developed and subsequently approved by USAID on January 22. The Grants Officer was recruited and joined the LPFM team from January 19, 2020. Following the appointment of the Grants Manager, development began on finalizing all the relevant grants documentation for the project, including a Standard Operating Procedure for grants making; the grants templates; the grants file structure and checklist.

15 | BAB AL TAMKEEN ACTIVITY REPORT (QUARTER 2, FY 2020) USAID.GOV
To support the grants program, two CSO mapping exercises were designed to identify appropriate CSOs that could be potential grantees supporting LPFM’s activities. The first was completed by the PE Team in January-February to identify education-oriented CSOs, which could collaborate with the PE Team’s support to the government’s education decentralization program. The second CSO mapping exercise, which would cover CSOs across the full spectrum of LPFM activities, was designed and subcontracted to Counterpart International (CI) to cover all of Libya. This exercise commenced in mid-March 2020, but due to the movement limitations imposed due to the COVID-19 pandemic and the increase in conflict, the exercise is now being redesigned to account for these factors. The CSO mapping report, which is expected to be completed by the end of May, will identify local CSOs that may be considered for the LPFM’s Self-Reliance Grants Program.
With the completion of the CSO mapping in May, we expect grant activities to accelerate in Q3. We envisage the completion of impactful grant actions even during the COVID-19 crisis.
COMMUNICATIONS/OUTREACH LPFM/Bab al Tamkeen’s communications/outreach efforts this quarter focused on highlighting project achievements at both the national and municipal levels in Libya, underscoring both the complexities of project objectives and their relevance to the Libyan people. A new communications specialist, based in Tripoli, was able to conduct interviews and collect testimonials from project partners and stakeholders to give voice to the impacts of the project’s technical assistance and support from a Libyan perspective. The communications specialist also launched a dissemination plan to reach out to Libyan media and social media, obtaining agreements from journalists from 11 local radio stations, three television stations, the two major English news websites, one daily newspaper, and other sites to feature our newsworthy stories or interview partners we recommend to discuss project activities and relevance. LPBM/Bab Al Tamkeen highlights were featured in the monthly USAID/Libya newsletter for January, February, and March. Five spotlight stories were produced, featuring improving the business enabling environment, WTO accession, supporting young entrepreneurs, decentralization and OSR, and electricity conservation.
MONITORING, EVALUATION, AND LEARNING (MEL) Please see Annex 2 for the MEL Summary and the LPFM Performance Indicator Tracking Table for FY20 Q2.


1 | BAB AL TAMKEEN ACTIVITY REPORT (QUARTER 2, FY 2020) USAID.GOV
ANNEX 1: LPFM PARTNER MUNICIPALITIES
Table 1: New Municipalities to be included under LPFM
Municipality Population Diversity
GNA Elected Mayor
Deal w/
GNA
Probability of success Security
PFM
Region Size Political will
Administrative Capacity LESP LPFM
1 Zawiyah 163,325 North West Medium X X X X X X X 2 Sirte 118673 North Middle Medium X X X X 3 Harawa 5654 North Middle V.Small X X X X X X X 4 Kaleej Alsedra 22933 North East Small X X X X X 5 Awbari 32382 South West Small X X X X X X X 6 Alriyayna 14774 West. Mountain Small X X X X X X X 7 Alkufra 44314 Far Southeast Small X X X X X X 8 Jalu 19033 South Middle Small X X X X X X 9 Oujla 9028 South Middle V.Small X X X X X X 10 Suluq 24280 North East Small X X X X X 11 Tajoura 143516 Greater Tripoli Medium X X X X X X X 12 Garabulli 52407 Greater Tripoli Small X X X X X X X 13 Msallata 75174 North Middle Small X X X X X X X
14 Ghadames 10943 Southwest Middle Small X X X X X X X
15 Derej 12,098 Wes. Mountain Small X X X X X X X 16 Ejdabia 125,613 North East Medium X X X X 17 Benghazi 732,114 North East Large X X X X 18 Albayda 164611 North East Medium X X X X X 19 Sahel Eljabal 37242 North East Small X X X X X X 20 Tokra 23180 North East Small X X X X X X 21 Shahat 59,027 North East Small X X X X X
22 Derna 104,755 North East Medium X X X X

2 | BAB AL TAMKEEN ACTIVITY REPORT (QUARTER 2, FY 2020) USAID.GOV
Table 2: Municipalities to be supported under LPFM (Including municipalities retained from LESP)
Cluster Municipality Population Region Size GNA Elected Mayor
Deal w/
GNA
Political will
Admin Capacity Security LESP LPFM SWM PHC Pedu
1
A
Souq Alghoma 320000 Greater Tripoli Large X X X X X X X X X X 2 Abu Saleem 280000 Greater Tripoli Large X X X X X X X X X X 3 Janzour 300000 Greater Tripoli Larage X X X X X X X X X X 4 Tripoli Center 200000 Greater Tripoli Medium X X X X X X X X X X 5 Tajoura 143516 Greater Tripoli Medium X X X X X X X 6 Alsayeh 24018 Greater Tripoli Small X X X X War zone 7
B
Zawara 34503 North West Small X X X X X X X X X X 8 South Zawiyah 11739 North West Small X X X X X X X X X 9 Sebratha 102038 North West Medium X X X X X
10 Surman 67884 North West Small X X X X X 11 Zawiyah 163325 North West Medium X X X X X X X 12
C
Misurata 487693 North Middle Large X X X X X X X X X X
13 Brega 34,519 North East Small X X X X X X X X 14 Sirte 118673 North Middle Medium X X X X X X X 15 Harawa 5654 North Middle V.Small X X X X X X X 16 Kaleej Alsedra 22933 North East Small X X X X X X X 17 Tarhouna 146966 North Middle Medium X X X X War zone 18
D
Albouanis 9494 South Middle V.Small X X X X X X X X X 19 Algherifa 35064 South Middle Small X X X X X X X X X X 20 Brak 36847 South Middle Small X X X X X X X X X 21 Sebha 128388 South Middle Medium X X X X X X X X 22 Awbari 32382 South West Small X X X X X X X

3 | BAB AL TAMKEEN ACTIVITY REPORT (QUARTER 2, FY 2020) USAID.GOV
Cluster Municipality Population Region Size GNA Elected Mayor
Deal w/
GNA
Political will
Admin Capacity Security LESP LPFM SWM PHC Pedu
23
E
Gheryain 212000 Wes. Mountain Medium X X X X X X X X X X 24 Alasabaa 35354 Wes. Mountain Small X X X X X X X X X 25 Alriyayna 14774 West. Mountain Small X X X X X X X 26 Yefern 21559 Wes. Mountain Small X X X X X X X X X X 27
F
Suluq 24280 North East Small X X X X 28 Alkufra 44,314 Far Southeast Small X X X X X X 29 Jalu 19,033 East Middle Small X X X X X X 30 Benghazi 732,114 North East Large X X X X 31 Oujla 9,028 East Middle V.Small X X X X X X 32 Ejdabia 125,613 North East Medium X X X X X 33
G
Zelitin 280000 North Middle Large X X X X X X X X X 34 Garabulli 52407 Greater Tripoli Small X X X X X X X 35 Alkhoms 191943 North Middle Medium X X X X X X X X X 36 Msallata 75174 North Middle Small X X X X X X X 37
H Kabou 9657 Wes. Mountain V.Small X X X X X X X X X
38 Ghadames 10943 Southwest Middle Small X X X X X X X 39 Derej 12098 Wes. Mountain Small X X X X X X X 40
I
Emsaed 16256 Far Northeast Small X X X X X X X X 41 Tobruq 158826 East Medium X X X X 42 Albayda 164611 North East Medium X X X X X X 43 Sahel Eljabal 37242 North East Small X X X X X X 44 Tokra 23180 North East Small X X X X X X 45 Shahat 59027 North East Small X X X X X 46 Derna 104755 North East Medium X X X X
46 46 44 24 22 19 19 10

4 | BAB AL TAMKEEN ACTIVITY REPORT (QUARTER 2, FY 2020) USAID.GOV

5 | BAB AL TAMKEEN ACTIVITY REPORT (QUARTER 2, FY 2020) USAID.GOV
Western area details


1 | BAB AL TAMKEEN ACTIVITY REPORT (QUARTER 2, FY 2020) USAID.GOV
ANNEX 2: MONITORING, EVALUATION, AND LEARNING (MEL) AND PITT TABLE FY20 Q2 Activities Summary
During the second quarter of FY 2020, the LPFM MEL team finalized tasks and activities. As a result, during the quarter, the MEL team accomplished the following tasks:
• January 15, 2020: Submitted LPFM Q1 report to USAID/Libya COR, • January 23, 2020: Submitted LPFM Activities GIS Information to USAID/Libya COR, • March 11, 2020: Received USAID/Libya COR request for amendment of AMELP and ITT, and • March 31, 2020: The submitted final version of LPFM AMELP & ITT to USAID/Libya COR for
approval.
Building MEL capacity within LPFM: During FY19 Q2, the MEL team continued conducting weekly calls with the MEL field team members as well as one-on-one coaching calls, to support MEL practices and procedures and respond to MEL-related data collection and verification questions. In addition, the LPFM MEL Team arranged an intensive onsite training and working group event in LPFM Tunis office in early February 2020 for seven working days, led by the MEL Senior Advisor in order to: support the on-boarding of the new MEL Specialist for Tripoli; conduct a quality control review of the LPFM MEL system; enhance awareness and involvement of component teams to align work plan deliverables to LPFM MEL outcomes indicators; brief the incoming LPFM COP on the status of the MEL tasks and systems; and to support the baseline survey efforts for the component teams. Further coaching was also delivered to the MEL field Manager on the grant process, indicators definitions, and standard operating procedure (SOP) development.
As part of MEL Team capacity building, MEL team conducted two Quality Assurance/Quality Control internal assessments on Feb 27th and March 24th to confirm that all performance data is backed up with robust supporting evidence, to verify data accuracy, ensure that all MEL documents are compliant with ADS standards, and that data is up to date and aligned across all MEL system tools. Finally, as part of communication across the Pragma MEL team, on March 30-31, the MEL Tripoli field specialist participated in a USAID/METAL-facilitated collaborative learning crash course to learn from experience and best practices examples as shared by MEG YESS team and acquired from Third Party Monitoring.
LPFM Adaptive Management /CLA Efforts:
In addition to the CLA capacity building training course of MEL team with the USAID/METAL Third Party Monitoring implementor, the MEL Team has engaged in exchanges with METAL to explore and share methodologies for remote monitoring of LPFM events conducted remotely in response to the global COVID-19 crisis. The LPFM MEL team is working with the Component Teams to institute a system for remote monitoring in a way that guarantees accurate attendance tracking and an independent interviewing process of beneficiaries. In addition, USAID/METAL has agreeing to share its monitoring analytics data that can be used for activities trend analysis and assessments by LPFM.
As part of an internal feedback loop to share performance data with decision-makers, the LPFM MEL Team has consolidated and shared all events/workshops lessons learned and requirements with technical teams (sign-in sheets, photos, etc.) to be used for their internal reports and activity follow up and planning. In addition, TPM reports are shared with the Public Outreach and Communication Team so that they can identify relevant quotes and information/data from this objective source for some of their YESS-related communications products. The MEL team has postponed its Annual Adaptive Management

2 | BAB AL TAMKEEN ACTIVITY REPORT (QUARTER 2, FY 2020) USAID.GOV
Training for all LPFM management and senior staff until after the end of the COVID-19 crisis and/or Ramadan.
LPFM GIS Information: By Component
LPFM MAP FY20 Q2
Activity Theory of Change and Logic Model
The purpose of the “Libya Public Financial Management” (LPFM) activity is to advance Libya’s national stability through three objectives. First, LPFM will strengthen the Government of Libya’s (GOL) public financial management (PFM) policies and processes to strengthen the fiscal foundations for sustainable and inclusive growth. Second, LPFM will provide technical assistance and capacity building for Libya’s electricity sector. Third, LPFM will seek to improve Libya’s business, enabling the environment to stimulate the growth of the private sector.
LPFM supports USAID’s development hypothesis which states that if the GOL can achieve greater efficiency and effectiveness in the management of public finances, including through more efficient management of the electricity sector, then macroeconomic stability will be restored, creating the fiscal space for greater public investment in critical services and infrastructure, increasing Libya’s political and social stability. It further hypothesizes that if Libya can create a business environment that is conducive to economic growth and job creation, then this will help to legitimize the state, increase political and economic stability, and give the Libyan people hope for the future.
Pragma’s approach is based on the fundamental premise that in order to establish responsive and participatory governance, Libya requires well-functioning institutional and legal systems. LPFM presents a unique opportunity to support the design and implementation of systems that ensure rational, systematic, transparent, and efficient allocation and use of public money (including oil revenue), as well as expand and diversify private sector development by actively promoting competition, access to finance, and foreign and domestic trade and investment.
3 | BAB AL TAMKEEN ACTIVITY REPORT (QUARTER 2, FY 2020) USAID.GOV
The LPFM team has identified a set of critical assumptions and risks, including: • Security conditions – that security conditions will remain the same or deteriorate. In addition to
analyzing changes in security from credible sources (including the Pragma LPFM security provider) in real-time to make prudent and expeditious program decisions, a context indicator Fragile States Index for Libya, which will be used to assess how changes in security and conflict in Libya may impact the achievement of results. If the security conditions deteriorate to the point that the program staff cannot safely implement the program and participants are restricted in their movements, LPFM contingency planning includes the following options: (1) move the TCN staff from Tripoli to Tunis and have them remotely manage the program until security improves; (2) explore options to have events scheduled/located in Tunisia or another relevant third country; and (3) utilize DVCs when possible;
• Macro-economic stability – that economic indicators either remain stable or improve, again so that Libyan stakeholders can make decisions with the expectation that the economy will not deteriorate significantly over the next 12 to 18 months. This assumption will be tracked by a context indicator GDP Annual Growth Rate and through discussions with the LPFM stakeholders; and
• Political stability – that there is sufficient governance that Libyans can make decisions with the expectation that things will not change significantly over the next 12 to 18 months. This assumption/risk will be tracked not only through discussions with LPFM stakeholders, including leadership of other USAID programs such as the Libya Local Governance/Civil Society Project. It will be measured through context indicators, including the World Bank’s Ease of Doing Business Score for Libya and Freedom House’s Freedom Rating for Libya.
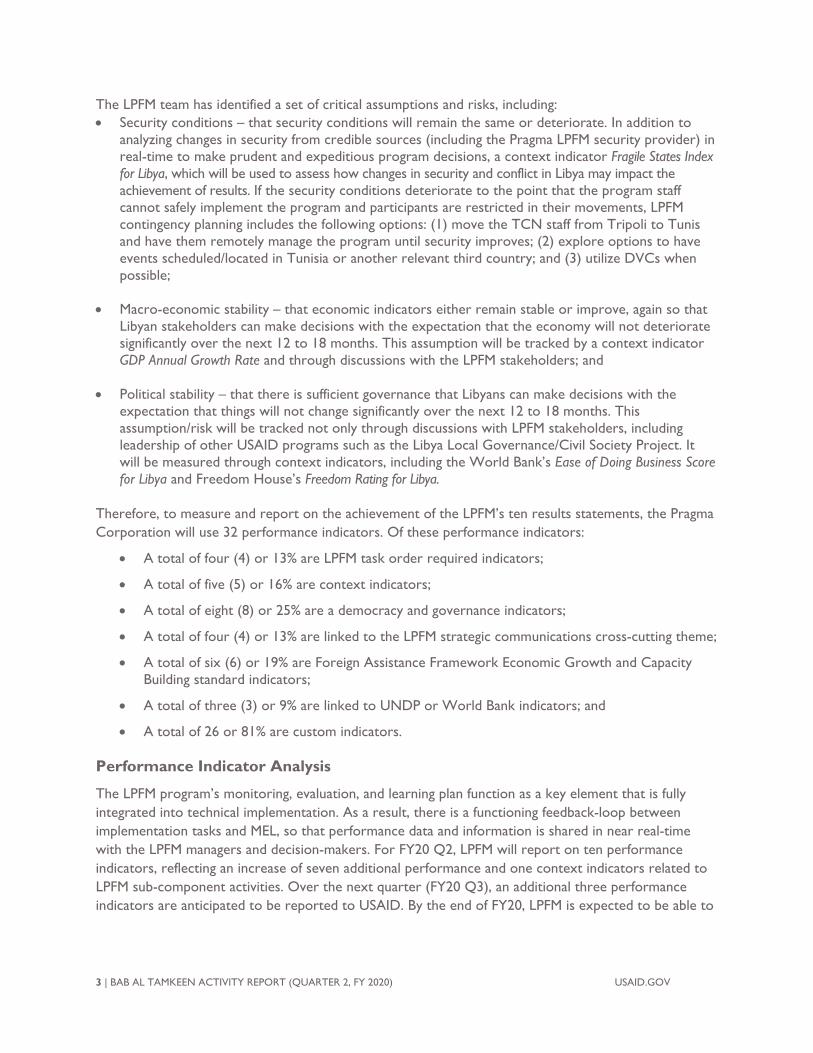
Therefore, to measure and report on the achievement of the LPFM’s ten results statements, the Pragma Corporation will use 32 performance indicators. Of these performance indicators:
• A total of four (4) or 13% are LPFM task order required indicators;
• A total of five (5) or 16% are context indicators;
• A total of eight (8) or 25% are a democracy and governance indicators;
• A total of four (4) or 13% are linked to the LPFM strategic communications cross-cutting theme;
• A total of six (6) or 19% are Foreign Assistance Framework Economic Growth and Capacity Building standard indicators;
• A total of three (3) or 9% are linked to UNDP or World Bank indicators; and
• A total of 26 or 81% are custom indicators.
Performance Indicator Analysis
The LPFM program’s monitoring, evaluation, and learning plan function as a key element that is fully integrated into technical implementation. As a result, there is a functioning feedback-loop between implementation tasks and MEL, so that performance data and information is shared in near real-time with the LPFM managers and decision-makers. For FY20 Q2, LPFM will report on ten performance indicators, reflecting an increase of seven additional performance and one context indicators related to LPFM sub-component activities. Over the next quarter (FY20 Q3), an additional three performance indicators are anticipated to be reported to USAID. By the end of FY20, LPFM is expected to be able to

4 | BAB AL TAMKEEN ACTIVITY REPORT (QUARTER 2, FY 2020) USAID.GOV
report on a total of 17 performance indicators. The remaining LPFM performance indicators4 are either end-of-program indicators or will be available for collection during year two, and as a result, will be reported in FY21.
Component Result 1: Capacity for Libya’s public financial management at the national and sub-national levels will be strengthened
Indicator 1.1b: Number of executive branch personnel trained with USG assistance (Archived Standard DR 2.2): This key LPFM contract required output indicator measures the breadth and depth of training focused on executive branch personnel. Data for this indicator is collected through daily sign-in sheets. In the final approved LPFM AMELP (March 2020), it was determined by USAID that this indicator will also be disaggregated by age; beginning in FY20 Q3, this disaggregation will be included in the reporting of this data to USAID. To date, LPFM has trained officials from seven executive branch institutions.
MEL Table 1: Actuals for LPFM 1.1b Number of executive branch personnel trained with USG assistance (Archived Standard DR 2.2)
LOP TARGET 200
ACTUALS FY20 TARGET 100
ACTUALS (CUM.) 38
LOP % ACHIEVED 38% FY 20 Q1 TOTAL FY 20 Q2 TOTAL
Q2 TARGET 35
Q2 % ACHIEVED 109% TOTAL POP 5 TOTAL POP 33
SEX OF PARTICIPANTS MALES 4 MALES 27
FEMALES 1 FEMALES 6
Executive Office of Participant Ministry of Local Government
Ministry of Local Government, Presidential Council, Ministry of
Planning, Ministry of Health, Ministry of Finance, MoF/Macro Fiscal Unit,
Ministry of Education, Supreme Council for Local Administration
Topic of Training
Second Workshop on the Assessment of the Municipal PFM Project, Workshop with MFU team
covering - report preparation on macroeconomic projections and
wage bill
Launching the Primary Health Care Operational Plan in Libya (in six pilot
municipalities), 2020 municipal budget improvements workshop,
Workshop on OSR Budgets for the additional wave of LPFM
4 Not including LPFM context indicators, which will be used to analyze overall performance when these secondary data sources become available.

5 | BAB AL TAMKEEN ACTIVITY REPORT (QUARTER 2, FY 2020) USAID.GOV
municipalities
Location of the Training (Number of events at the
location) Two events held in Tripoli Three events held in Tripoli
Indicator 1.1c: Number of government officials receiving USG-supported anti-corruption training (Standard DR 2.4-1): This key LPFM contract-required output indicator measures the breadth and depth of anti-corruption training focused on municipal-level personnel. To address anti-corruption, the PFM Team designed and developed a municipality-oriented anticorruption training workshop and materials with the expectation that the training would commence in March. In addition, the LPFM PFM team has also built anticorruption sessions into the OSR budget workshops that took place during the period of performance (and is included in the performance data for both indicators 1.1b and 1.2c). Unfortunately, before the dedicated anti-corruption training could begin, the Libyan borders were closed due to the COVID-19 crisis, and the STTA consultant was therefore unable to enter Libya to start the training. The dedicated anti-corruption training is now rescheduled for the next quarter; the PFM team is exploring remote and/or on-line training options to deliver this training in case the Libyan COVID-19 response makes training in Libya logistically impractical.
Indicator 1.2b: Number of Sub-national governments entities receiving USG assistance to improve their performance (Archived Standard DR 2.3, Linked to UNDP/Libya 3.1.1): This contract required key output indicator tracks the number LPFM-partner municipalities who are key targets of efforts to increase the capacity of municipalities to operate effectively and transparently while preserving accountability. Data for this indicator is collected through activity records (in this case, a diagnostic tool that assessed the capacity of the municipalities against Public Expenditure and Financial Accountability (PEFA) priority areas and dimensions, training activities, and consultations). LPFM conducted and completed the baseline assessment of PEFA scores on eight priority areas of PEFA in FY20 Q1 with 19 municipalities. During this reporting period, the PFM team conducted training sessions, consultations, and providing other TA to a total of 25 targeted municipalities, including six new municipalities.

6 | BAB AL TAMKEEN ACTIVITY REPORT (QUARTER 2, FY 2020) USAID.GOV
MEL Table 2: Actuals for LPFM 1.2b: Number of Sub-national governments entities receiving USG assistance to improve their performance (Archived Standard DR 2.3, Linked to UNDP/Libya 3.1.1)
LOP TARGET 28 ACTUALS
FY20 TARGET 18
LOP % ACHIEVED
89% FY 20 Q1 TOTAL FY 20 Q2 TOTAL
ACTUALS 25
FY20 % ACHIEVED
139% TOTAL POP 19 TOTAL POP 25
SUB-NATIONAL ENTITIES
Cluster A Suq-Aljumah, Abu-Saleem, Janzour, Tripoli Center Cluster A
Suq-Aljumah, Abu-Saleem, Janzour, Tripoli Center,
Tajoura
Cluster B South Azzawia, Zuwarah Cluster B South Azzawia, Zuwarah,
Sabratha, Surman, Zawiyah
Cluster C Misurata, Zelitin, Alkhomes Cluster C Misurata, Brega
Cluster D Wadi-Albwanies, Alghoriafa,
Brak-Elshati Cluster D
Wadi-Albwanies, Alghoriafa, Brak-Elshati, Sabha, Awbari
Cluster E Gharyan, Alasabaa, Yefern Cluster E Gharyan, Alasabaa, Yefern,
Alriyayna
Cluster F --- Cluster F ---
Cluster G Khoms, Zletin Cluster G Khoms
Cluster H Kabaw Cluster H Kabaw, Derej, Ghadames
Cluster I Emsaad, Tobruq Cluster I ---
Indicator 1.2c: Number of sub-national government entity personnel trained with USG assistance: This key LPFM output indicator measures the breadth and depth of training focused on municipal-level personnel. In the final approved LPFM AMELP (March 2020), it was determined by USAID that this indicator will also be disaggregated by age; beginning in FY20 Q3, this disaggregation will be included in the reporting of this data to USAID. To date, LPFM has trained representatives from 25 sub-national government entities. During the period of performance, the PFM team also trained a representative from the Libyan Commission of Civil Society.5
5 Because this individual does not work for a sub-national government entity, the individual is not included in the totals for indicator 1.2c.

7 | BAB AL TAMKEEN ACTIVITY REPORT (QUARTER 2, FY 2020) USAID.GOV
MEL Table 3: Actuals for LPFM 1.2c: Number of sub-national government entity personnel trained with USG assistance
LOP TARGET 175 ACTUALS
ACTUALS (CUM.) 64
LOP % ACHIEVED 37% FY 20 Q1 TOTAL FY 20 Q2 TOTAL
Q2 TARGET 25
Q2 % ACHIEVED 256% TOTAL POP 34 TOTAL POP 64 (cum.)
SEX OF PARTICIPANTS MALES 31 MALES 30
FEMALES 3 FEMALES 0
Municipalities Represented at the PFM
training
Cluster A (Suq-Aljumah, Abu-Saleem, Janzour, Tripoli-Center); Cluster B
(Zuwarah, South Azzawia, Sabratha, Surman); Cluster C (Misurata, Brega);
Cluster D (Wadi-Albwanies, Alghoriafa, Brak-Elshati, Sabha); Cluster E
(Gharyan, Alassaba, Yafarn); Cluster G (Khoms); Cluster H (Kabaw)
Cluster A (Suq-Aljumah, Tripoli-Center, Tajoura); Cluster B (Zuwarah, South
Azzawia, Surman, Zawiyah); Cluster C (Misurata); Cluster D (Alghoriafa, Brak-
Elshati, Sabha, Awbari); Cluster E (Gharyan, Alriyayna); Cluster G
(Khoms); Cluster H (Kabaw, Ghadames, Derej)
The topic of the Training Second Workshop on the Assessment
of the Municipal PFM Project
Launching the Primary Health Care Operational Plan in Libya (In Six Pilot Municipalities), 2020 municipal budget improvements workshop, Workshop on
OSR Budgets for new LPFM municipalities
Location & Number of Training
One event held in Tripoli Three events held in Tripoli
Indicator 1.3a: Number of MFU analytical products disseminated: MFU analytical activities are designed to help the government establish a sound annual and medium-term budgetary envelope consistent with its price and exchange rate stability goals and to understand the trade-offs inherent in alternative expenditure and revenue allocation policies for attainment of the macro-stability and poverty-reducing growth goals. It is also designed to help inform decision-makers regarding the impact of key structural constraints on economic stability and broad-based growth performance. The LPFM/PFM team works with the Ministry of Finance’s Macro Fiscal Unit (MFU) to produce monthly and quarterly analytical products that are used by key decision-makers to make fiscal decisions. Analysis of the MFU’s FaceBook page show over 1,300 likes, 181 comments, and 13 shares. The LPFM/PFM team will continue to work with the MFU to collect and analyze the public reaction to the analytical products shared through social media.

8 | BAB AL TAMKEEN ACTIVITY REPORT (QUARTER 2, FY 2020) USAID.GOV
MEL Table 4: Actuals for LPFM 1.3a: Number of MFU analytical products disseminated
LOP TARGET 40 ACTUALS
ACTUALS (CUM.) 9 FY 20 Q2 TOTAL
LOP % ACHIEVED 23%
Q2 TARGET 6 TOTAL POP 9
Q2 % ACHIEVED 150%
The topic of MFU Analytical Product (and number
disseminated)
Monthly Analysis & Projection: Macro Fiscal Reports
5
Monthly Budget execution: Table 1
Quarterly Report: Budget execution table
2
Quarterly Projection Report: Economic Outlook Report
1
Method(s) of Dissemination
Hard Copy 6
MoF Facebook Page 3
MoF Web Page 2
Location of Dissemination/Recipient
Tripoli, Libya / Minister of Finance, Deputy Minister of Finance, Head of the MFU, and General public
Component Result 2: Modernization and commercialization of Libya’s electricity sector improved
Indicator 2.a: Commercial losses as a % of net production: The proportion of production used to meet technical losses, and final energy needs are important indicators of the firm’s efficiency in transporting and accounting for energy use and provide key insights regarding the financial sustainability of the firm. This key outcome indicator tracks LPFM assistance to GECOL to reduce commercial losses. During the period of performance, the LPFM Electricity Sector team confirmed the actual programmatic baseline, which resulted in a significant negative increase (from an estimated baseline of 32% of commercial losses as a percentage of net production to an actual baseline of 34.55%). Despite this, there was a positive impact on reducing commercial losses as a result of LPFM assistance during the period of performance, and the quarterly target was achieved.6 As a result, the LPFM Electricity Sector team expects to achieve the FY20 target.
6 LPFM uses USAID’s rule of thumb for assessing whether actuals meet the targets, where targets will have been met if the actual is within ±10 percent of the target.
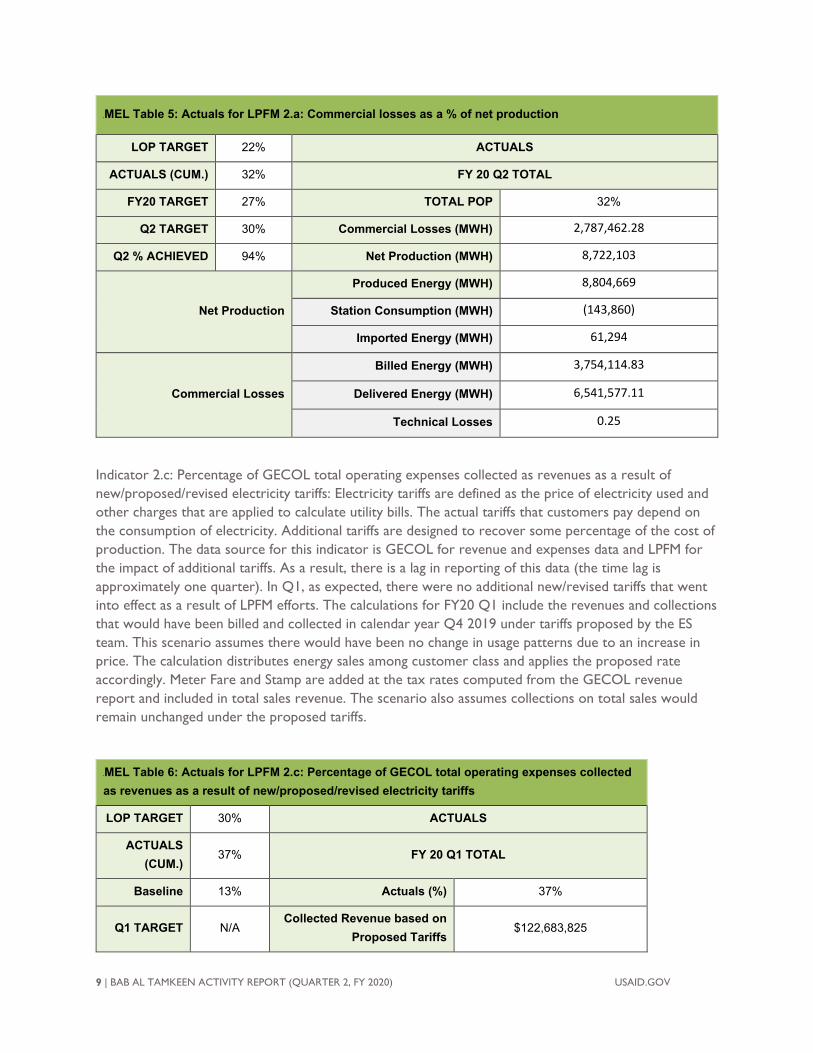
9 | BAB AL TAMKEEN ACTIVITY REPORT (QUARTER 2, FY 2020) USAID.GOV
MEL Table 5: Actuals for LPFM 2.a: Commercial losses as a % of net production
LOP TARGET 22% ACTUALS
ACTUALS (CUM.) 32% FY 20 Q2 TOTAL
FY20 TARGET 27% TOTAL POP 32%
Q2 TARGET 30% Commercial Losses (MWH) 2,787,462.28
Q2 % ACHIEVED 94% Net Production (MWH) 8,722,103
Net Production
Produced Energy (MWH) 8,804,669
Station Consumption (MWH) (143,860)
Imported Energy (MWH) 61,294
Commercial Losses
Billed Energy (MWH) 3,754,114.83
Delivered Energy (MWH) 6,541,577.11
Technical Losses 0.25
Indicator 2.c: Percentage of GECOL total operating expenses collected as revenues as a result of new/proposed/revised electricity tariffs: Electricity tariffs are defined as the price of electricity used and other charges that are applied to calculate utility bills. The actual tariffs that customers pay depend on the consumption of electricity. Additional tariffs are designed to recover some percentage of the cost of production. The data source for this indicator is GECOL for revenue and expenses data and LPFM for the impact of additional tariffs. As a result, there is a lag in reporting of this data (the time lag is approximately one quarter). In Q1, as expected, there were no additional new/revised tariffs that went into effect as a result of LPFM efforts. The calculations for FY20 Q1 include the revenues and collections that would have been billed and collected in calendar year Q4 2019 under tariffs proposed by the ES team. This scenario assumes there would have been no change in usage patterns due to an increase in price. The calculation distributes energy sales among customer class and applies the proposed rate accordingly. Meter Fare and Stamp are added at the tax rates computed from the GECOL revenue report and included in total sales revenue. The scenario also assumes collections on total sales would remain unchanged under the proposed tariffs.
MEL Table 6: Actuals for LPFM 2.c: Percentage of GECOL total operating expenses collected as revenues as a result of new/proposed/revised electricity tariffs
LOP TARGET 30% ACTUALS
ACTUALS (CUM.)
37% FY 20 Q1 TOTAL
Baseline 13% Actuals (%) 37%
Q1 TARGET N/A Collected Revenue based on
Proposed Tariffs $122,683,825

10 | BAB AL TAMKEEN ACTIVITY REPORT (QUARTER 2, FY 2020) USAID.GOV
Q1 % ACHIEVED
37% Operating Expenses based
on Proposed Tariffs $333,444,917
GECOL Data for FY20 Q1 Collected Revenue (USD) $60,433,777
Operating Expenses (USD) $336,718,570
Average exchange rate October-December 2019: 1 USD = .713 LYD
Indicator 2.1b: Number of people trained in technical energy fields supported by USG assistance (EG 7.3-1): This key LPFM output indicator measures the breadth and depth of training focused on energy. Data for this indicator is collected through daily sign-in sheets. People who attend multiple, non-duplicative training may be counted once for each training they completed in the reporting period. In the final approved LPFM AMELP (March 2020), it was determined by USAID that this indicator will also be disaggregated by age; beginning in FY20 Q3, this disaggregation will be included in the reporting of this data to USAID. Because the Electricity Sector Team had already built good working relationships with key stakeholders in Libya, the program was able to immediately begin to schedule and conduct training on LPFM’s electricity sector topics. The training was provided by LPFM advisors presenting best practices electric utilities in the MENA region and worldwide, presenting and seeking agreement with the participants on the next steps. The number of people trained on ES has exceeded the target due to the project reaching out to other key players in the electricity sector. Whereas GECOL has been our primary counterparts, the LPFM project expanded its reach to other electricity sector players such as the Presidential Council, Civil Society, Local Governance sand municipalities, therefore increasing the number of people invited and trained in ES workshops.

11 | BAB AL TAMKEEN ACTIVITY REPORT (QUARTER 2, FY 2020) USAID.GOV
MEL Table 7: Actuals for LPFM 2.1.b: Number of people trained in technical energy fields supported by USG assistance (EG 7.3-1)
LOP TARGET 150 ACTUALS
ACTUALS (CUM.) 111
LOP % ACHIEVED 74% FY 20 Q1 TOTAL FY 20 Q2 TOTAL
Q2 TARGET 40
Q2 % ACHIEVED 278% TOTAL POP 46 TOTAL POP 111 (cum)
SEX OF PARTICIPANTS MALES 46 MALES 64
FEMALES 0 FEMALES 1
PARTICIPANT ORGANIZATION(S)
GECOL (80% of participants); GoL (13%); Private Sector/Other (7%)
GECOL (68%); GoL (8%); Private Sector/Other (23%)
LOCATION OF TRAINING Tripoli LPFM Office (4 events) Tripoli LPFM Office (8 events)
TOPIC OF TRAINING
Workshop on GECOL revenue enhancement,
Task Force for Electricity Sector Reforms workshop,
Revenue Enhancements - Non-Electric Revenue,
Commercial Loss Reduction
Independent Electricity Sector Regulator Workshop, Proposed draft electricity law,
Independent Electricity Sector Follow-up Workshop, Unbundling of Libya Electricity
Sector, Independent Electricity Sector
Commercial Losses Workshop, Drafting electricity law session 1, Drafting
electricity law session 2
Component Result 3: Economic governance and business enabling environment improved
Indicator 3.c: Person hours of USG-supported training completed in trade and investment (EG 2-1): This key LPFM output indicator measures the breadth and depth of training focused on energy. Data for this indicator is collected through daily sign-in sheets. People who attend multiple, non-duplicative training may be counted once for each training they completed in the reporting period. In the final approved LPFM AMELP (March 2020), it was determined by USAID that this indicator will also be disaggregated by age; beginning in FY20 Q3, this disaggregation will be included in the reporting of this data to USAID. The LPFM BEE component conducted three focus group discussions in Q2 with participants from the private sector to get feedback and suggestions on priority legal issues that should be reformed. As part of this effort, the LPFM BEE team identified relevant training topics related to legal research, analysis, and the enabling environment for private sector development, investment, and WTO accession. Training planned for FY20 Q2 has been postponed due to the Libyan response to the COVID-19 crisis and the re-intensification of the conflict. The BEE team is exploring options for remote and/or on-line training in these key trade and investment-related topics for the next quarter.

12 | BAB AL TAMKEEN ACTIVITY REPORT (QUARTER 2, FY 2020) USAID.GOV
USAID Third Party Monitoring of LPFM
During Q2 FY20, USAID/METAL completed ten third-party monitoring visits to LPFM activities and has shared eight reports with LPFM including:
MEL Table 8: FY20 Q2 Third Party Monitoring
LPFM Component
LPFM Event/Partner TPM Visit Date Date Shared With LPFM
Location
PFM #08 Workshop on the Primary Health Care Operational Plan
Jan 21, 2020 March 25, 2020 Tripoli
ES #09 Independent Regulator Electricity workshop
Jan 22,2020 March 25,2020 Tripoli
PFM #10 Wage-bill analysis and control strategies
Jan 23,2020 March 25,2020 Tripoli
ES #11 Workshop for draft electricity law Jan 27,2020 March 25,2020 Tripoli
BEE #12 First, focus group discussion on priority legal issues that should be reformed
Feb 5 ,2020 March 25, 2020 Tripoli
ES #13 Workshop for the technical committee of the electricity regulatory authority
Feb 6, 2020 March 25, 2020 Tripoli
PFM #14 Workshop on Own Source Revenue (OSR) Municipal Budgeting
Feb 13 ,2020 March 25,2020 Tripoli
ES #15 Electricity Sector - Commercial losses workshop to review regional billing and collection target performance
Feb 26 ,2020 March 25,2020 Tripoli

13 | BAB AL TAMKEEN ACTIVITY REPORT (QUARTER 2, FY 2020) USAID.GOV
Performance Indicator Tracking Table
The LPFM MEL System maintains a performance indicator tracking table (PITT) to support regular updating of the indicator values and for analysis and reporting. The LPFM PITT includes baseline values and dates, targets, and actual indicator values for all performance indicators collected and reported for the life of the project. For FY20 Q2, the PITT includes ten performance indicators (including one context indicator). As actual data for the LPFM performance indicators are collected, the indicator data will be added to the table.
LPFM Performance Indicator
Baseline FY 2020 Cum. Total
FY20 Target
Progress to LOP Target
LOP Target Date Value
Q1 Actual
Q1 Target
Q2 Actual
Q2 Target
Q3 Actual
Q3 Target
Q4 Actual
Q4 Target
LPFM Component Result 1: Capacity for Libya’s public financial management at the national and sub-national levels will be strengthened
1.1b # of executive branch personnel trained with USG assistance (Archived Standard DR 2.2)
Oct.-19
0 5 0 33 35 30 35 38 100 19% 200
Notes: The Q2 target for this indicator was exceeded.
1.1c # of government officials receiving USG-supported anti-corruption training (Standard DR 2.4-1)
Oct.-19
0 0 0 0 5 10 10 0 25 0 75
Notes: The Q2 target for this indicator was not met. The PFM anticorruption training had to be postponed due to restrictions related to both the Libyan and Tunisian response to COVID-19. By Q4, the target for this indicator will be achieved.
1.2b
# of Sub-national governments entities receiving USG assistance to improve their performance (Archived Standard DR 2.3, Linked to UNDP/Libya 3.1.1)
Oct.-19
0 19 18 25 cum 18 cum 18 cum 18 cum 25 18 89% 28
Notes: The Q2 target for this indicator was met as expected.

14 | BAB AL TAMKEEN ACTIVITY REPORT (QUARTER 2, FY 2020) USAID.GOV
LPFM Performance Indicator
Baseline FY 2020 Cum. Total
FY20 Target
Progress to LOP Target
LOP Target Date Value
Q1 Actual
Q1 Target
Q2 Actual
Q2 Target
Q3 Actual
Q3 Target
Q4 Actual
Q4 Target
1.2c # of sub-national government entity personnel trained with USG assistance
Oct.-19
0 34 0 64 cum 25 25 25 64 75 37% 175
Notes: The Q2 target for this indicator was exceeded.
1.3a # of MFU analytical products disseminated
Oct.-19
0 0 0 9 6 6 6 9 18 32% 28
Notes: The Q2 target for this indicator was exceeded.
LPFM Component Result 2: Modernization and commercialization of Libya’s electricity sector improved
2.a Commercial losses as a % of net production
Oct.-19
35% 0 0 32% 30% 29% 27% 32% 27% 22% 22%
Notes: The Q2 target for this indicator was met.
2.c
% of GECOL total operating expenses collected as revenues as a result of additional electricity tariffs
Oct.-19
<13% 37%7 0 13% 15% 20% 37% 20% 127% 30%
Notes: There is a data lag for this indicator. The Q2 target for this indicator was exceeded, based on the potential impact of LPFM/ES proposed tariffs.
2.1.b # of people trained in technical energy fields supported by USG assistance (EG 7.3-1)
Oct.-19
0 46 0 111 cum
40 25 10 111 75 74% 150
7 Based on tariffs proposed by LPFM/ES.

15 | BAB AL TAMKEEN ACTIVITY REPORT (QUARTER 2, FY 2020) USAID.GOV
LPFM Performance Indicator
Baseline FY 2020 Cum. Total
FY20 Target
Progress to LOP Target
LOP Target Date Value
Q1 Actual
Q1 Target
Q2 Actual
Q2 Target
Q3 Actual
Q3 Target
Q4 Actual
Q4 Target
Notes: The Q2 target for this indicator was exceeded.
LPFM Component Result 3: Economic governance and business enabling environment improved
3.c Person hours of USG-supported training completed in trade and investment (EG 2-1)
Oct.-19
0 0 0 0 200 200 200 0 600 0% 1,200
Notes: The Q2 target for this indicator was not met. The BEE trade and investment-related training had to be postponed due to restrictions related to both the Libyan and Tunisian response to COVID-19 and due to the re-intensification of conflict. By Q4, the target for this indicator will be achieved.
Context Indicators
C5 Average hours of electricity service per week over the last three months
Sept.-19
TBD 163
Hours N/A N/A N/A N/A N/A N/A N/A
Notes: No targets are set for context indicators. There is a data lag for this indicator.


1 | BAB AL TAMKEEN ACTIVITY REPORT (QUARTER 2, FY 2020) USAID.GOV
ANNEX 3: SUCCESS STORIES

2 | BAB AL TAMKEEN ACTIVITY REPORT (QUARTER 2, FY 2020) USAID.GOV
Fearless and Female: A Young Woman Entrepreneur Breaking Gender Barriers in Libya
Libya Public Financial Management (LPFM)
“The Libyan woman must break the stereotypes that limit her ambition, she must serve herself, she must not be afraid of the opinion of the public, and she must start the first step and be courageous to succeed.”
– Enas Alamin, Owner of Orjwan party and events enterprise Enas Alamin has an air of self-assurance well beyond her 21 years. Her youth belies the fact that she already has five years of entrepreneurial experience at the helm of a successful party and events business, called Orjwan, which she runs from her hometown of Misrata, Libya. Ms. Alamin’s business currently employs seven staff, manages five to six events each day, and has 10,000 followers on its Facebook page.
“I have wanted to run my own business since I was a teenager. Even then, I was telling my friends that I didn’t want to rely on my parents for money,” says Ms. Alamin. “Now, my goal is to expand my business across Libya and into the region.” Ms. Alamin is proud of the fact that she paid the costs for her university training in business finance and investment and has purchased all the equipment for her company over the years on her own, including a car. Her independent streak is highly unusual in Libya, where social and economic norms remain decidedly patriarchal. Moreover, Ms. Alamin’s determination to work in the private sector is notable in a country where most jobs have traditionally been provided by the public sector, and onerous business regulations have discouraged private enterprise development.
As Libya transitions along a difficult course towards a more decentralized and democratic system of government, LPFM is working with both the public and private sectors to strengthen the country’s capacity to diversify its economy away from its massive reliance on government jobs and build a robust private
Enas Alamin, Photo: S. Hamid for LPFM

3 | BAB AL TAMKEEN ACTIVITY REPORT (QUARTER 2, FY 2020) USAID.GOV
sector that can generate sustainable employment. Small and medium-sized enterprises (SMEs) are particularly critical as engines of job growth, especially when it comes to employing more vulnerable populations, including youths, women, refugees, and internally displaced people.i However, their potential for making marked contributions to Libya’s economic development has been hindered by cumbersome regulations, a lack of capital, and challenges regarding the capacity to apply sophisticated marketing or management techniques.
To better gauge the status of Libya’s business enabling environment from the perspective of business owners themselves, LPFM has been conducting focus groups with SME entrepreneurs from every region of the country. Among these, several have specifically targeted current and aspiring young business owners, like Ms. Alamin – all under age 30 years. The focus groups have garnered feedback from these young people on their experiences launching and running their enterprises, their impetus for wanting to work in the private sector, and on the regulatory or practical hurdles that have stood in their way.
Feedback from more established business owners has identified some of the most urgent challenges as being related to cumbersome or inefficient regulations in areas such as banking, private investment, taxation, customs, and labor market operations. In response, LPFM has identified numerous short-term reforms that can address these barriers, while also applying internationally recognized best practices; for example, adopting a decree based on the UN Model Law on Secured Transactions to increase credit availability or following the lead of the corporate governance principles of the Organization for Economic Cooperation and Development (OECD) for creating policies to protect investors.
However, the LPFM team also is taking into consideration the different sets of concerns and aspirations elicited by Libya’s new generation of entrepreneurs to help drive its technical assistance and the direction of its policy reform activities. Ms. Alamin and her peers are displaying an eagerness to learn more about the rights and rules of running a formal business and of obtaining further supports and training – including through digital resources – to take their businesses to the next step. Moreover, they are revealing a shared craving for greater contacts with business peers and groups. “We need money, yes, but I’m not going to ask for that here,” noted one young male participant. “Give me a chance to be visible to other businessmen. I am looking for networking and connections.”
Along with the input from younger voices concerning their business development needs, the confidence and hopefulness shown by Ms. Alamin are bringing key insights to LPFM regarding the potentially growing role of women as business leaders and drivers. “Libyan women are now better placed than ever before,” she says. “Libyan women have started to enter the labor market and take well advantage of opportunities. Women in Libya are already beginning to be able to self-actualize.”
The feedback from dynamic women like Ms. Alamin is confirming the commitment of USAID and LPFM to ensuring that gender equity is fully integrated into legal and regulatory reforms meant to boost private sector growth – and that women’s contributions are not left behind in Libya’s transition to a more diversified and resilient economy.

4 | BAB AL TAMKEEN ACTIVITY REPORT (QUARTER 2, FY 2020) USAID.GOV
The Woman Trying to Flip the Switch to Energy Conservation in Libya Libya Public Financial Management (LPFM) “Libya is a country rich in energy resources, but with artificially low electricity prices and people experiencing daily power outages due to the fighting, there is no public awareness of the need to conserve energy, nor a culture of energy efficiency.” – Mariam El Forgani, Team Leader for Energy Efficiency, General Electric Company of Libya (GECOL)
Mariam El Forgani has been at the forefront of activities and strategies to promote energy conservation and renewable power in numerous countries across the Middle East and Central Europe. Her time abroad has honed her skills, made a place for her name on international publications, and helped her garner respect from colleagues around the world. However, back in Libya, Ms. El Forgani faces an uphill battle. Not only is she trying to wean her fellow Libyans of their seemingly insatiable appetite for electrical energy, but she also is trying to be taken seriously as a female trailblazer in a male-dominated industry.
“Regardless of what I have achieved abroad, the attitude here is, ‘you are only a woman,’ and it is not easy for women to lead in a male-oriented society,” she explains.
Ms. El Forgani does have the support of her (all male) team, and of USAID’s LPFM, which has been collaborating with her to develop Libya's National Energy Action Plan (NEEAP). The plan targets changes in energy consumption patterns through the enactment of public policies designed to promote more efficient technologies and practices, along with consumer awareness building to drive changes in energy use and demand.
PHOTO: M. ELFORGANI

5 | BAB AL TAMKEEN ACTIVITY REPORT (QUARTER 2, FY 2020) USAID.GOV
“Several high ranking decision-makers at GECOL and in the Ministry of Planning are supporting our approach, and there is a very good chance that the plan will be approved by the Ministry of Planning, and then implemented – which would be a great step forward in the development of a sustainable energy policy for Libya,” says Ms. El Forgani.
Libyans pay very little in electricity costs, and per capita consumption remains 3-4 times that of other countries in the region. In the face of continued fighting, rising prices for basic goods, and daily power cuts that can last up to eight hours, the stresses of daily life take priority over energy savings.
“We already are late compared to our neighbors, and the rest of the world,” says Ms. El Forgani. “Raising consciousness around energy conservation will take time.”
In the near term, she and her team are targeting quicker wins, including key changes that will help Libya to achieve its goal of reducing energy consumption by 20% in the next five years. LPFM has been consistently supporting their initiatives, helping to finalize the action plan and to conduct audits of government buildings to identify energy savings opportunities. LPFM also is working with GECOL to slowly increase electricity prices to help drive down demand while improving the company’s transparency and business practices to offer a more reliable service for customers. Another key focus for GECOL and LPFM has been a proposed national LED light bulb change-out program, which seeks to replace less efficient light bulbs in both residential and non-residential use through incentive plans and the abolishment of non-LED bulb imports. A plan detailing the timing scenarios for the LED change-out program and its cost/benefits will be presented to the Presidential Council’s High Committee on Energy in March 2020.
Ms. El Forgani is spearheading the renovation of GECOL’s woefully outdated energy efficiency testing lab to improve the Libyan market for more efficient appliances and equipment. As another tactic for changing consumer energy habits, she also is working with the Ministry of Education to insert energy efficiency and conservation material into the education system, ranging from primary school classrooms to technical institutions and universities.
“Climate change awareness has not gained the foothold here that it has in other countries, and young people remain largely unaware,” says Ms. El Forgani, “But they represent the audience most likely to absorb new ideas and change their habits.”
Libya is endowed with vast resources of oil, wind, and sun to power its path toward self-reliance – but its most underutilized natural resources may well be the country’s talented women. LPFM is dedicated to supporting not only Libya’s national energy conservation activities but also the strong women, like Mariam El Forgani, driving the effort to turn them into tangible results.
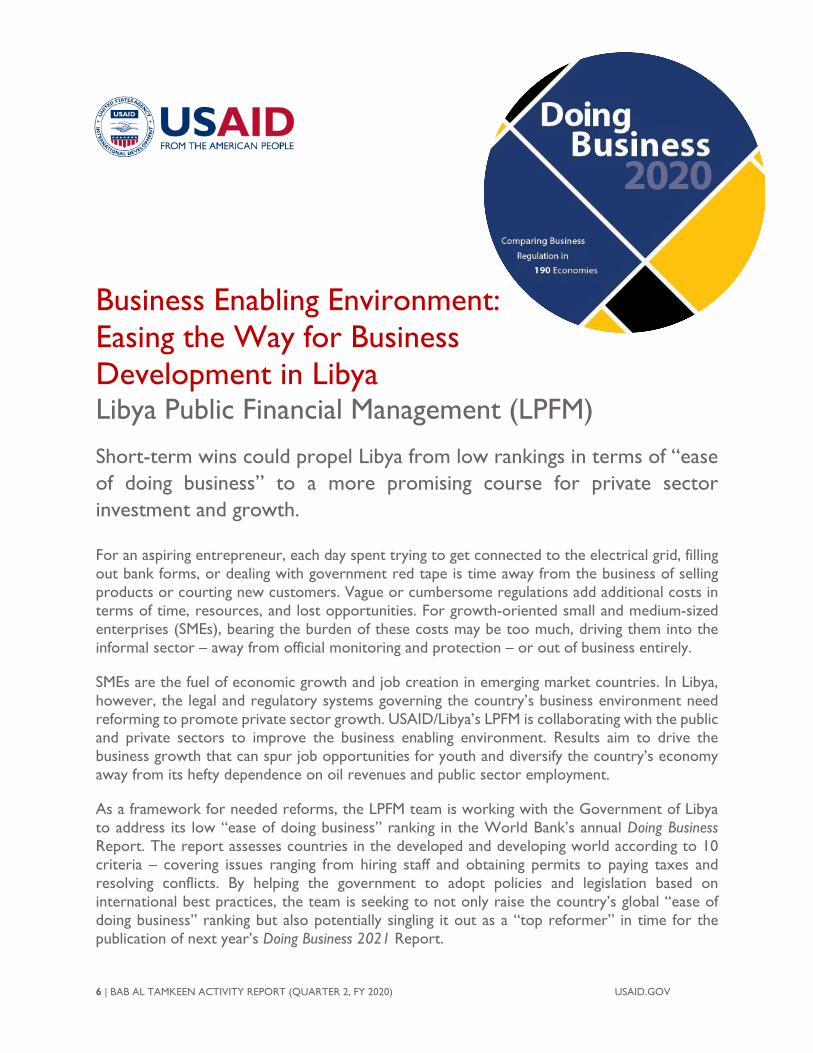
6 | BAB AL TAMKEEN ACTIVITY REPORT (QUARTER 2, FY 2020) USAID.GOV
Business Enabling Environment: Easing the Way for Business Development in Libya Libya Public Financial Management (LPFM)
Short-term wins could propel Libya from low rankings in terms of “ease of doing business” to a more promising course for private sector investment and growth.
For an aspiring entrepreneur, each day spent trying to get connected to the electrical grid, filling out bank forms, or dealing with government red tape is time away from the business of selling products or courting new customers. Vague or cumbersome regulations add additional costs in terms of time, resources, and lost opportunities. For growth-oriented small and medium-sized enterprises (SMEs), bearing the burden of these costs may be too much, driving them into the informal sector – away from official monitoring and protection – or out of business entirely.
SMEs are the fuel of economic growth and job creation in emerging market countries. In Libya, however, the legal and regulatory systems governing the country’s business environment need reforming to promote private sector growth. USAID/Libya’s LPFM is collaborating with the public and private sectors to improve the business enabling environment. Results aim to drive the business growth that can spur job opportunities for youth and diversify the country’s economy away from its hefty dependence on oil revenues and public sector employment.
As a framework for needed reforms, the LPFM team is working with the Government of Libya to address its low “ease of doing business” ranking in the World Bank’s annual Doing Business Report. The report assesses countries in the developed and developing world according to 10 criteria – covering issues ranging from hiring staff and obtaining permits to paying taxes and resolving conflicts. By helping the government to adopt policies and legislation based on international best practices, the team is seeking to not only raise the country’s global “ease of doing business” ranking but also potentially singling it out as a “top reformer” in time for the publication of next year’s Doing Business 2021 Report.

7 | BAB AL TAMKEEN ACTIVITY REPORT (QUARTER 2, FY 2020) USAID.GOV
The LPFM team is targeting lower-performing indicators, with proposed reforms that could deliver tangible, near-term improvements aligned with internationally recognized good governance principles. For example, to help businesses to enforce contracts, the team is supporting legal reforms reflecting the UN Model Law on International Commercial Arbitration and other modern international codes to update the country’s hopelessly outmoded legal arbitration regime. Similarly, to facilitate access to credit for growth-minded businesses, the LPFM team is proposing the adoption of a decree based on the UN’s (UNCITRAL) Model Law on Secured Transactions. Helping the Government create decrees defining the rights of shareholders and protecting minority investors, the team is looking to adapt corporate governance principles from the Organization for Economic Cooperation and Development.
To help businesses resolve insolvency issues, LPFM is focused on facilitating the implementation of existing legislation that is meant to address bankruptcy, liquidation, and reorganization proceedings but is not widely understood. The team is supporting the dissemination of detailed implementation regulations, along with a practice guide and training workshops for legal professionals, to ensure that the regulations are translated into widespread practice.
LPFM has been working with the General Electricity Company of Libya (GECOL) to improve its business practices and ensure more reliable and cost-effective electricity services. To strengthen the business-enabling environment, the LPFM team is pushing for GECOL reforms that will measurably improve businesses’ access to electricity, such as reducing the time it takes to apply for a new electricity connection and ensuring that electricity tariffs are posted publicly on the GECOL Website and Facebook page. The team also has been supporting the establishment of an independent regulator for the electricity sector, which is expected soon and will further boost Libya’s ease of doing business score.
The LPFM team is engaged in numerous activities with Libya’s public and private sectors to create a healthier business-enabling environment. Addressing the country’s “ease of doing business” rating provides a visible and potentially powerful framework for highlighting the impacts of some of those reform efforts. Improving Libya’s standing in time for the publication of Doing Business 2021 will send a strong positive signal to the international investment community – and to the Libyan people – that the government, supported by USAID, is undertaking serious national reforms for bolstering business development and sustainable economic growth.
Figure 1: Doing Business 2020 Rankings (1-190) for Libya

8 | BAB AL TAMKEEN ACTIVITY REPORT (QUARTER 2, FY 2020) USAID.GOV
Business Enabling Environment: Trading Up - Connecting Libya to the World Economy Libya Public Financial Management (LPFM)
Libya is aspiring to join the World Trade Organization (WTO). Meeting the requirements for WTO accession is a USAID priority, as it would mean dramatic improvements in Libya’s trade and investment environment, enabling economic growth and encouraging market competitiveness and innovation.
Strong trade policies open the world to larger markets. Wider trade brings new products and technologies to consumers and can be a catalyst for companies to become more productive and profitable. It offers expanded markets, it delivers access to the latest inputs and know-how, and it infuses domestic business with fresh ideas from other countries.
WTO is the world’s governing body for ensuring free and open trade across countries. Its 164 member countries have successfully met the legislative and structural requirements for aligning with WTO’s trade rules and standards. For countries seeking to join WTO, one of the strong motivations for undertaking the arduous accession process is to improve their business-enabling environment and attract greater investments from both domestic and foreign sources.
Libya is an aspiring WTO member, and its journey to WTO accession, interrupted in 2011, has regained a strong foothold with support from USAID/Libya’s LPFM. Working closely with the Government of Libya and other state agencies, LPFM is using the WTO accession process as a platform for launching domestic structural reforms that will help open and diversify its economy, leading to more productive business and economic growth.
The LPFM team is developing a WTO Accession Plan for Libya, in consultation with the Libyan Customs Authority, the Central Bank of Libya, and a wide range of ministries (Economy & Industry, Transportation, Finance, Planning, Health, Telecommunications, and Agriculture, Livestock, & Marine Wealth). The plan covers a full spectrum of topics ranging from customs, export/import licensing, and intellectual property, to food safety, animal health, banking, and
9 | BAB AL TAMKEEN ACTIVITY REPORT (QUARTER 2, FY 2020) USAID.GOV
more. It specifies the reforms needed to bring Libya into conformity with WTO requirements, along with a detailed roadmap of the procedural steps for pursuing membership.
WTO accession is a multi-year objective. The terms and conditions of membership include not only reviews and reforms of existing regulations, but also the (often lengthy) negotiations of trade agreements and tariffs. However, the process of applying for WTO membership can also bring shorter-term gains, and so the LPFM team is supporting the Government of Libya to undertake more immediate initiatives that will both be in alignment with WTO requirements and bring about some quick wins for improving Libya’s the trade and investment environment.
Among these, the team is assisting the Government of Libya with assessing the country’s regulatory framework against the requirements of WTO’s 2017 Trade Facilitation Agreement (TFA). LPFM advisors have identified specific, near-term measures that would bring Libya into conformity with the TFA, better positioning it for WTO accession. In many cases, the changes require the improved implementation of existing regulations rather than new laws. For example, Libya’s Law on Customs of 2010 already reflects many of the principles and standards specified in WTO agreements and the World Customs Organization’s Revised Kyoto Convention, leading the team to focus on addressing the challenges hindering the implementation of the law.
In several cases, the LPFM team is working with authorities to meet TFA requirements regarding the application of more harmonized and efficient systems to ease the flow of trade. The advisors are working with Libyan officials to integrate border management across the multiple entities involved in inspecting and testing imports for both port and land entry crossing points. They are collaborating with the government to ensure that customs procedures, fees, and hours of operation are consistent and consistently applied across all points of entry. To streamline entry declarations, the team has proposed to assist the Customs Authority and Ministry of Finance in establishing system-wide procedures for pre-arrival declarations in accordance with current law and TFA standards. Likewise, it has made recommendations to Libya’s Presidential Council for enforcing regulations and TFA rules requiring the systematic replacement of paper-based forms with electronic declaration forms.
To meet a further WTO TFA requirement, LPFM advisors are working with government officials to draft a Presidential Council decree establishing a National Trade Facilitation Committee (NTFC). The committee will serve as a central, coordinated institutional framework for implementing trade facilitation measures, with members from both the private sector and relevant government ministries and agencies. Once established, the LPFM team will provide the NFTC with ongoing technical assistance on proposed trade facilitation reforms.
The WTO standards and agreement serve as the legal foundation for global trade. They bind governments to maintain trade policies that are predictable and transparent, leading to both better governance and trade-related private-sector growth. By breaking down trade barriers, accession to the WTO system also breaks down other barriers between peoples and across trading economies. For Libya, alignment with the WTO’s international standards means the establishment of a straighter course towards a more open government and the achievement of the political and economic reforms for greater prosperity and self-reliance.

10 | BAB AL TAMKEEN ACTIVITY REPORT (QUARTER 2, FY 2020) USAID.GOV
Going Local: Strengthening Municipal Public Services Management and Delivery Libya Public Financial Management (LPFM) “There is a new culture of decentralization in Libya bubbling to the surface, with the genuine political will to bring the state, in the form of public services and utilities, closer to citizens.” – H.E. Dr. Mohammad Ammari Zayed, Presidential Council Member, Deputy Prime Minister, & Chairman, Technical Committee for the Transfer of Authorities to Municipalities
Despite the renewed fighting and trying times in his region, Faraj Aban, the Mayor of Janzour Municipality, considers himself an optimist. Elected to office in 2014, Mayor Aban takes a very hands-on approach to his job, as evidenced by his willingness to pitch in to help clean up after winter floods, for example. These days, Mayor Aban is rolling up his sleeves to take on a new set of tasks; however – the transfer of fiscal responsibilities from the Libyan central government to selected pilot municipalities, including Janzour.
For decades, the people of Libya lived under an opaque and centralized government regime that dictated every public expenditure from major infrastructure investments to neighborhood garbage collection. Today, the country is undergoing a process of government decentralization, and LPFM is supporting needed municipal government reforms and capacity building to deliver more responsive public services to the Libyan people. The process is helping to establish new public trust and transparency in government, and it may also serve as a tactical solution for resolving conflict for greater stability from the bottom up.
“The budgeting process for municipalities used to be entirely top-down. The national government set the budget and established the levels of expenditures by category,” says Mayor Aban. “Now that responsibility is being transferred to the municipal level, where it should be. Citizens can see
11 | BAB AL TAMKEEN ACTIVITY REPORT (QUARTER 2, FY 2020) USAID.GOV
up close how we are spending the money and that we are serious about addressing the erosion of basic public services.”
LPFM is providing technical assistance to 22 pilot municipalities in Libya, including Janzour, to bolster their expertise and fiscal systems, so that they can take on the new public financial management responsibilities that come with decentralized authority. The project expects to designate a further 22 municipalities as pilots, expanding the project’s reach to cover every region of the country and a majority of its population.
Initially, most municipalities lacked the basic administrative functions to respond with any degree of efficiency or transparency to the growing public service needs of their citizens. LPFM is introducing municipal officials to best practices and forecasting models for public financial management. It has built its capacity for undertaking the municipal budget formulation process, including how to solicit and incorporate public input. Each municipality has formed a Citizen’s Budgeting Committee, which has been trained by LPFM, along with dozens of civil society organizations in how to participate in a citizen’s budgeting process. Each of the pilot municipalities submitted a 2020 budget to the Ministry of Local Government – a historical first. As a measure of improved transparency, the municipalities posted their budgets on social media, so that anyone could see the estimated local revenues, service costs, and allocations.
“Previously, our municipal staff just handled public salaries,” says Mayor Aban. “This year, we were able to prepare and present a municipal budget and balance sheet, including projections for own-source revenue sources and expenditures.”
Own source revenue refers to local fees that municipalities are being allowed to collect for the first time from publicly operated entities (e.g., museums, billboards, public gardens) or city services (e.g., garbage collection, business licensing, building permits). The goal is to use these funds to pay for the local services that impact the daily lives of local people, such as health care or youth sports and training facilities.
LPFM has been collaborating closely with the Ministry of Local Government in its efforts to shift government authorities and services to the local level to satisfy citizens’ needs better while also injecting much-needed legitimacy into Libyan governance. Recent decrees are moving towards formally transferring more control over own source revenues and the provision of basic services to the municipalities. The 22 participating municipalities have undergone training with Bab al Tamkeen to map and forecast all the existing sources of own-source revenues in their localities. Ministry officials have publicly hailed the improvements in own-source revenue forecasting and local government budgeting as the first concrete advances in municipal fiscal competence that they have seen to date.
The greater transparency in municipal governance processes is buttressing improved relations between city hall and the local citizenry, and the increased space for public voices is helping to redress deeply ingrained inequities leftover from the Qaddafi regime. “The transparency and social involvement in the municipal budget process have been unprecedented, and it is producing better, more responsive results,” says Salah Othman Fattah, who as Director of Provincial and Municipal Affairs within the Ministry of Local Government runs the department that receives and reviews the municipal budgets. “The more you inform constituents, the more confidence and

12 | BAB AL TAMKEEN ACTIVITY REPORT (QUARTER 2, FY 2020) USAID.GOV
trust you create between the citizens and the government – and these are real steps towards consolidating stability in Libya.”
Municipal leaders are key partners in USAID programming in Libya, and they are drawing increasing respect and legitimacy in Libya. Their proximity to the concerns of their citizens puts them in a unique position to help address local drivers of conflict and instability, and better align local governance with citizen interests. Theirs is the base of the foundational changes in Libya that may help guide the country’s institutions and communities to advance national stability and self-reliance.

1 | BAB AL TAMKEEN ACTIVITY REPORT (QUARTER 2, FY 2020) USAID.GOV
ANNEX 4: ILLUSTRATIVE TRAVEL PLAN
Due to the COVID-19 crisis, no travel is currently possible.

1 | BAB AL TAMKEEN ACTIVITY REPORT (QUARTER 2, FY 2020) USAID.GOV
ANNEX 5: ANALYTICAL REPORTS
Annex 5.1 - Wage Bill Analysis Report Annex 5.2 - Exchange rate management report Annex 5.3 - Technical note on the impact of the oil blockade Annex 5.4 – Budget Execution Report Annex 5.5 – Macro-fiscal Development Monthly Report (January -March 2020)


1
ANNEX 5.1 - Wage Bill Analysis Report
•
لیبیا في العام المال إدارة برنامج
LIBYA PUBLIC FINANCIAL MANAGEMENT PROGRAM (LPFM)
Working Paper No. 1/2020-MFU
ANALYSIS OF THE PUBLIC WAGE BILL IN LIBYA
By
Amer KARKER
With support of Alsedig ECHAIBI and Zouhair EL KADHI
February 2020
Government of Libya Ministry of Finance Macro-Fiscal Unit
Disclaimer and Acknowledgements: The views expressed in this paper are those of the authors and do not necessarily reflect the views of the Ministry of Finance or Government of Libya. The authors are grateful to the Minister of Finance and the Deputy of the minister of finance for their encouragement. However, errors, if any, are the responsibility of the authors.

2
Contents Executive summary ...................................................................................................................................................... 1
I. Macro-Fiscal context .......................................................................................................................................... 2
II. Sectoral distribution of Employees and Wage Bill ...................................................................................... 7
III. International comparison ............................................................................................................................... 11
IV. Outcomes and Conclusion ............................................................................................................................ 12
Figure 1: Budget Spending and Revenue (Millions of LYD) ............................................................................. 2 Figure 2: Wage bill as a Share of Total Government Expenditures, 2010-19 ............................................ 4 Figure 3: Wage Bill as a Share of Oil Revenues, 2010-19 ............................................................................... 4 Figure 4: Inflation Rate (CPI, YoY changes) ........................................................................................................ 5 Figure 5: Average Nominal Annual Wage, 2010-2019 ..................................................................................... 5 Figure 6: Public Employment, 2010-19 ................................................................................................................ 6 Figure 7: Distribution of employees, 2019 ......................................................................................................... 8 Figure 8: Distribution of Wage Bill, 2019 ........................................................................................................... 8 Figure 9: Employee Recruitment, 2015-2019 ..................................................................................................... 9 Figure 10: Education Sector Employees, 2015-2019........................................................................................... 9 Figure 11: Health Sector Employees, 2015-2019 ............................................................................................. 10 Figure 12: Government Employment (percent of 15-64 population), 2018 .............................................. 11 Figure 13: Government Wage Bill (percent of total spending), 2018 ......................................................... 12
Box 2: Libya Demographics profile .......................................................................................................................... 7

1
Executive summary
The public sector in Libya has increasingly become the country's main employer due to a weakened and shrinking private sector. The budget allocation for recurrent costs, primarily the salaries and allowances of civil servants and government officials, is high and severely limits funding for capital expenditure. The increasing public sector wage bill is alarming, and risks are stifling regular government functions, slowing investment, and dampening growth.
It is within this context that the Ministry of Finance announced in February 2020 the execution and implementation of an integrated and comprehensive Public Financial Reform program for Libya. Panned reforms include, among other things, establishing a committee to rationalize the salaries of public sector employees and create a comprehensive salary and recruitment management system that will limit further expansion of the public sector and reduce payroll duplications and ghost workers.
This paper provides an analysis of the public wage bill in Libya and makes policy recommendations for addressing various wage bill concerns within the context of current economic and political conditions in the country. These include:
1- Integrating public wage bill macro-fiscal strategies into medium-term budgetary plans. Rationalization of the wage bill should be gradual and should be accompanied by other relevant macrostructural reform measures;
2- Aligning remuneration and employment policies with the quality and efficiency of public service delivery. Sectoral analyses by expenditure area will be an important first step. Wage bill reform is complex and should not simply be reduced to a cut in wages, but rather linked to improvements in public service delivery;
3- A functional payroll review in each ministry/department is needed to identify potential areas for efficiency gains. A payroll audit would help verify current staffing levels and quantify the prevalence of ghost employees. This would facilitate the reallocation process and lay the groundwork for improved wage-bill management guidelines and processes designed to prevent the re-emergence of wage-bill fraud.
4- Strengthening institutions, data collection, and information systems with regard to human resource management and compensation control approaches and mechanisms. This would include an initial review of existing regulations and mechanisms and compensation linkages to productivity;
5- Wage bill reform should not be isolated from other reforms. Rather, the Libyan government should look for potential synergies that will strengthen social protections and purchasing power, contribute to economic diversification, and improve the country’s business climate.
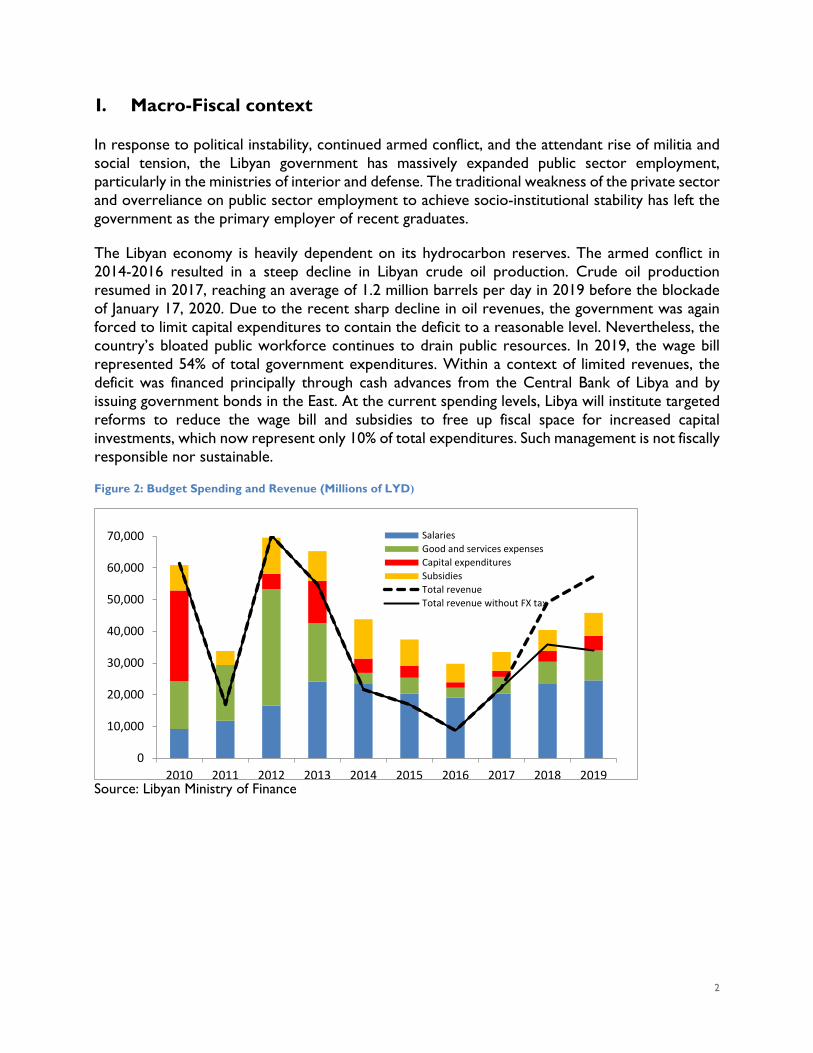
2
I. Macro-Fiscal context
In response to political instability, continued armed conflict, and the attendant rise of militia and social tension, the Libyan government has massively expanded public sector employment, particularly in the ministries of interior and defense. The traditional weakness of the private sector and overreliance on public sector employment to achieve socio-institutional stability has left the government as the primary employer of recent graduates.
The Libyan economy is heavily dependent on its hydrocarbon reserves. The armed conflict in 2014-2016 resulted in a steep decline in Libyan crude oil production. Crude oil production resumed in 2017, reaching an average of 1.2 million barrels per day in 2019 before the blockade of January 17, 2020. Due to the recent sharp decline in oil revenues, the government was again forced to limit capital expenditures to contain the deficit to a reasonable level. Nevertheless, the country’s bloated public workforce continues to drain public resources. In 2019, the wage bill represented 54% of total government expenditures. Within a context of limited revenues, the deficit was financed principally through cash advances from the Central Bank of Libya and by issuing government bonds in the East. At the current spending levels, Libya will institute targeted reforms to reduce the wage bill and subsidies to free up fiscal space for increased capital investments, which now represent only 10% of total expenditures. Such management is not fiscally responsible nor sustainable.
Figure 2: Budget Spending and Revenue (Millions of LYD)
Source: Libyan Ministry of Finance
0
10,000
20,000
30,000
40,000
50,000
60,000
70,000
2010 2011 2012 2013 2014 2015 2016 2017 2018 2019
SalariesGood and services expensesCapital expendituresSubsidiesTotal revenueTotal revenue without FX tax
3
In 2019, the wage bill8 reached some 24.5 billion dinars, roughly 53.5% of total expenditures. Between 2010 and 2019, the wage bill more than doubled, increasing from 9,183 million LYD in 2010 to 24,512 million LYD in 2019, while total expenditure fell by about 25% over the same period, i.e., capital and other expenditures decreased to offset the increased wage bill. The chronic fiscal deficit is largely attributable to wage bill increases. In 2019, the government payroll absorbed approximately 78% of oil revenues. With more than 1.8 million employees, the public sector is paying salaries to roughly 80% of the workforce, estimated at 2.4 million (UN, WB database: 2,422,193 in 2019). Using debt to finance salaries cannot be sustained over the long term.
This is exacerbated by the opaque structure of public wages. According to multiple sources, the government’s payroll includes thousands of ghost workers and is further exacerbated by systemic weaknesses in the manner in which public wages are calculated, including:
1) Large subsidies on fuel and utilities that fund the payrolls of thousands of state-owned enterprises. For example, GECOL currently spends over LYD 1bn on its 46,000 registered employees;
2) A significant number of wages are paid under Chapter 2, Goods and Services; and
3) Some state employees receive additional payments for services rendered through separate contracts.
Consequently, a comprehensive public sector human resources audit is required to identify ghost employees, as well as employees who receive supplementary salaries from other public entities.
Libya’s large wage bill leaves little budgetary/fiscal space for public investment, social safety net transfers/assistance programs, or financing of necessary public goods and services. In addition to revenues generated by the foreign exchange tax, expenditures must be planned in accordance with revenues from foreign exchange earnings (oil exports) and substantial imports of equipment and consumer goods.
The escalation of Libya’s wage bill began in 2013 following the establishment of the coalition government in April 2013 and ensuing increased public sector employment, primarily in the education sector, as well as for defense and homeland security forces, causing the wage bill to soar.
8The public sector wage bill is comprised of regular payroll expenditures, including basic salary and housing and other allowances payable to public servants. It also includes other personnel-related expenditures which are not paid on a regular basis, such as fees, commissions and honoraria, reimbursement of medical expenses, and other personnel benefits. It does not include wages paid by state-owned enterprises such as GECOL (slightly over 1 billion LYD per year) that are paid from subsidies included in Chapter 4 of the budget, as opposed to Chapter 1 (salaries).

4
Figure 3: Wage Bill as a Share of Total Government Expenditures, 2010-19
Source: Libyan Ministry of Finance
In addition to siphoning off an unsustainable percentage of the national budget, Libya’s swollen wage bill also limits incentives for private sector employment, making an assessment of the public wage bill that much more imperative. Increasing budgetary pressures must be urgently addressed through expenditure cuts or increased revenue-generation. While the FX tax generated additional revenue, it represents a transitional measure and does not generate sufficient foreign currency to pay for imports. Given that new sources of revenue will take time to develop, the most immediate solution to addressing the country’s current fiscal pressures is to reduce its swollen wage bill, including wage and hiring freezes.
Figure 4: Wage Bill as a Share of Oil Revenues, 2010-19
Source: Libyan Ministry of Finance
The number of civil servants in Libya doubled between 2010 and 2019, rising from 900,000 in 2010 to 1.8 million in 2019. At the same time, public services have deteriorated sharply, in part because the low salaries paid to public workers inhibit productivity. This underscores the urgent need for reforms. The situation worsened during 2015-2018 when inflation reached over 30 percent, and real wages decreased considerably:
15%
54% 54%64%
58% 54%
0%10%20%30%40%50%60%70%
2010 2011 2012 2013 2014 2015 2016 2017 2018 2019
16%
74%
25%47%
118%
192%
286%
106%
71% 78%
0%
50%
100%
150%
200%
250%
300%
2010 2011 2012 2013 2014 2015 2016 2017 2018 2019
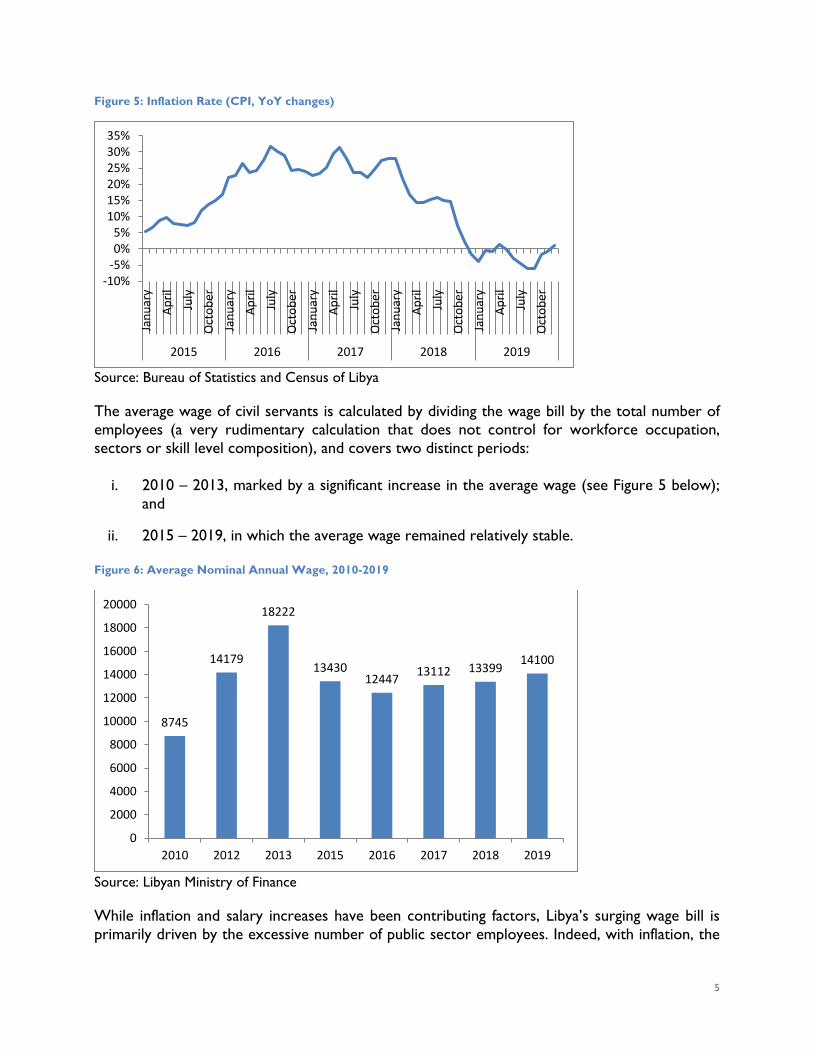
5
Figure 5: Inflation Rate (CPI, YoY changes)
Source: Bureau of Statistics and Census of Libya
The average wage of civil servants is calculated by dividing the wage bill by the total number of employees (a very rudimentary calculation that does not control for workforce occupation, sectors or skill level composition), and covers two distinct periods:
i. 2010 – 2013, marked by a significant increase in the average wage (see Figure 5 below); and
ii. 2015 – 2019, in which the average wage remained relatively stable.
Figure 6: Average Nominal Annual Wage, 2010-2019
Source: Libyan Ministry of Finance
While inflation and salary increases have been contributing factors, Libya’s surging wage bill is primarily driven by the excessive number of public sector employees. Indeed, with inflation, the
-10%-5%0%5%
10%15%20%25%30%35%
Janu
ary
April
July
Oct
ober
Janu
ary
April
July
Oct
ober
Janu
ary
April
July
Oct
ober
Janu
ary
April
July
Oct
ober
Janu
ary
April
July
Oct
ober
2015 2016 2017 2018 2019
8745
14179
18222
1343012447 13112 13399 14100
0
2000
4000
6000
8000
10000
12000
14000
16000
18000
20000
2010 2012 2013 2015 2016 2017 2018 2019

6
average real wage has been falling since 2014. This decline has had a major impact on purchasing power and may well be contributing to declines in productivity and social cohesion. Figure 7: Public Employment, 2010-19
Source: Libyan Ministry of Finance
In 2000, there was one public sector employee for every 13.2 persons. In 2010, this increase to one in 6, and in 2019 to one in 3.5. Given the average household size of five, each household is likely to have more than members employed in the public sector.
8%
17%24%
27%28%
12%
25%
35% 36% 41%
5%
15%
25%
35%
45%
2000 2005 2010 2012 2013 2015 2016 2017 2018 2019
Public Employment as Share of Total PopulationPublic Employment as Share Population 15-64 oldes

7
II. Sectoral distribution of Employees and Wage Bill
The graphic below provides a break-down of public sector employees by public ministry, with the highest number employed in at the Ministry of Education (37%), followed by the Ministry of the Interior (14%), Ministry of Health (12%), and Ministry of Defense (10%). These four ministries alone account for roughly three-quarters of all public sector employees (74%). While this distribution is not unusual and is, in fact, very similar to other countries in the MENA region, what is alarming in Libya is the sheer number of employees as a percentage of the working population.
Box 1 : Demographics Profile
Libya has a very small population density of about 3 people per square kilometer. The current estimated population is roughly 6.5 million people. Based on an annual growth rate of 1.6, the population is projected to reach 6.9 million in 2030 and 7.08 million in 2035. It is a young population with an average age of 29.
Children under 4 years of age represent 10% of the population, and is projected to drop to only 6% by 2035. Similarly, the proportion of the population aged between 5 and 14 is expected to fall from 18% to 13% by 2035. Labor market pressures will continue as the population aged 15 to 65 years increases from 67% to an estimated 70% in 2035. The proportion of the population aged 65 and over is expected to double from 5% to 10% over the same period.
This change in demographics presents two significant challenges. First, as the number of job seekers increases, so will the pressure on the government to generate new employment opportunities. Second, a doubling of the elderly population will increase demand for limited health care services. This will be partially offset by lower educational demand as the student population declines.
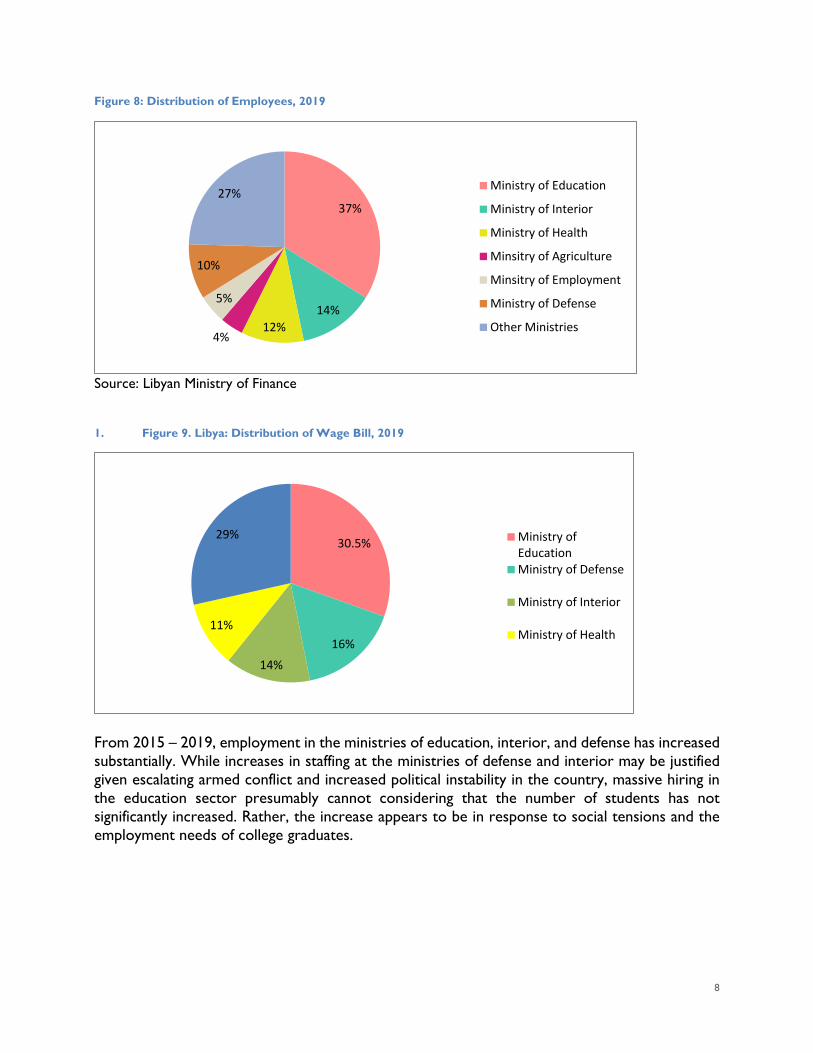
8
Figure 8: Distribution of Employees, 2019
Source: Libyan Ministry of Finance
1. Figure 9. Libya: Distribution of Wage Bill, 2019
From 2015 – 2019, employment in the ministries of education, interior, and defense has increased substantially. While increases in staffing at the ministries of defense and interior may be justified given escalating armed conflict and increased political instability in the country, massive hiring in the education sector presumably cannot considering that the number of students has not significantly increased. Rather, the increase appears to be in response to social tensions and the employment needs of college graduates.
37%
14%12%
4%
5%
10%
27% Ministry of Education
Ministry of Interior
Ministry of Health
Minsitry of Agriculture
Minsitry of Employment
Ministry of Defense
Other Ministries
30.5%
16%14%
11%
29% Ministry ofEducationMinistry of Defense
Ministry of Interior
Ministry of Health

9
Figure 10: Employee Recruitment, 2015-2019
Source: Libyan Ministry of Finance
Sectoral Analysis: Education Sector
The number of education sector employees in Libya is comparatively high, with one teacher for every six pupils in primary and secondary school. This is the highest teacher/student ratio in the world. Consequently, the wage bill in education corresponds to around 30.5% of the total wage bill and 16% of total expenditures. This is higher than total capital expenditures and approximates expenditures on government subsidies. At the same time, education outcomes are substantially below those in many other countries.
An analysis of expenditures in wages and direct investments suggests that the wage bill has crowded out investment expenditures. Teacher salaries tend to represent the bulk of sectoral expenditures, at between 75-80% of total expenditures. Since the majority of education expenditures are for teacher salaries and education outcomes remain sub-standard, there is a clear need to reform the sector. The core challenge under current constrained budgetary circumstances is to enhance pedagogical performance within the context of an essentially fixed resource envelope. 2.
Figure 11: Employees in the Education Sector, 2015-2019
Source: Libyan Ministry of Finance
98381
71740
52563
35201
10138
0 20000 40000 60000 80000 100000 120000
Ministry of Education
Ministry of Interior
Ministry of Health
Minsitry of Agriculture
Minsitry of Employment
559,268570,263 574,520
657,649 655,489
500,000520,000540,000560,000580,000600,000620,000640,000660,000680,000
2015 2016 2017 2018 2019

10
Sectoral Analysis: Health
Employees in the health sector represent about 12% of the total workforce and about 11% of the payroll. While these numbers are similar to those of other transitional economies, in Libya, a much larger proportion of the population (>50%) travel abroad for their healthcare, even for minor ailments.
Even more significant is the growth of the health sector spending over the last 20 years. The Ministry of Health’s budget increased from LYD 0.5 billion in 2000 to LYD 2.8 billion in 2010, to LYD 4 billion in 2019. The increase in goods and services (Chapter Two) was offset by a decrease in capital expenditures in the same proportion, so this rise is due entirely to increasing salaries.
An analysis of expenditure structures (wages and other expenditures) indicates a crowding-out effect for public investment associated with the magnitude of current expenditures and, in particular, the size of the wage bill. While the share of capital expenditures increased sharply from 2000 to 2010, it fell significantly over the period 2010-2019. Capital expenditure represented only 12% of the total health budget in 2019 (475 million LYD), while the share of the wage bill rose from 49% to 65% from 2000 to 2019. This is an unprecedented situation that has resulted in health facilities experiencing endemic shortfalls in needed equipment/supplies.
In addition, we have observed severe limitations on budgetary transparency. According to the audit office, it is possible that deceased persons continue to receive salaries. In addition, many people are receiving unjustified benefits and bonuses. This situation begs the question of how goods and services are being financed; and whether insufficient availability of drugs, surgical equipment, and essential supplies are hampering service quality and/or coverage. The COVID-19 pandemic underscores the immediate need to further rationalize the structure of public health expenditures. Figure 12: Health Sector Employees, 2015-2019
Source: Libyan Ministry of Finance
153,506 157,761174,574
206,069 211,315
0
50,000
100,000
150,000
200,000
250,000
2015 2016 2017 2018 2019

11
III. International comparison
As seen in Figure 12 below, Libya has the highest ratio of civil servants to the population aged 15-64, exceeding 40% or double the average of other countries in the MENA region. The large percentage of government employment in Libya, and a relatively small private sector, attest to the lack of alternative employment opportunities in the country. This, in turn, serves in part to underscore the ‘crowding out’ effect that the huge allocation of public resources to state employment has on the private sector since it artificially distorts the reservation wage for private sector employment. Moreover, it should be noted that most private companies work for the state.
Figure 13: Government Employment (percent of 15-64 population), 2018
Since 2011, in response to social tensions, several regional governments have been forced to further increase the number of civil servants to address youth discontent. This has led to a spiraling increase in the number of civil servants. Overall wage bill and has become the single largest budgetary constraint in Libya. As in many countries, the size of the wage bill has made budget management highly complex/challenging; and bordering on becoming fiscally unsustainable.9
9 These ratios do not include the wage bill of state-owned enterprises, which is important in countries like Algeria and Egypt following their past socialist experiments.
0 10 20 30 40 50
TunisiaLibya
AlgeriaIrak
KuwaitSaudi Arabia
QatarEgypt
Morocco

12
Figure 14. Government Wage Bill (percent of total spending), 2018
IV. Outcomes and Conclusion
The ratio of capital to current expenditure in Libya has declined from 88% in 2010 to 10% in 2019. This has greatly reduced budget allocations supporting capital investment in intermodal infrastructure, transport, health, and education. In this regard, the current wage bill severely constrains funding for reconstruction, infrastructure development, energy generation, and agriculture improvements needed to rebuild the country following years of conflict.
International experience shows that higher public wage bill expenditures do not necessarily translate into improved service delivery or enhanced education and health outcomes. Counter-intuitively, the opposite is more typically the case. Additionally, countries, where a larger percentage of the labor force is employed in the public sector, have typically failed to reduce overall unemployment. Large numbers of public sector employees can discourage risk-taking, penalizing private-sector job creation, and undermining competitiveness. At the same time, a high and growing wage bill again has tended to crowd out capital expenditures and weakened fiscal sustainability in many countries.
The wage bill in Libya constituted about 53.5 percent of the budget in 2019. Despite recently announced commitments by the Minister of Finance concerning the rationalization of the government’s wage bill, it is unlikely that major reductions in the wage-bill will be effectuated in the near-term. To do so would require the concerted efforts of multiple institutional stakeholders. This is likely to prove particularly challenging in the current political environment in Libya, and light of the contractionary macroeconomic pressures stemming from the COVID-19 pandemic. Over the medium and longer-term, transformational reforms of the employment system and major wage-bill reductions can be achieved. To be successful and sustainable, these will need to be coordinated effectively with measures to foster private-sector job creation and mitigate any short-term impacts on vulnerable population groups, in particular the poor, women, and youth. The following key issues should be addressed expeditiously within this context:
0 10 20 30 40 50 60
TunisiaLibya
AlgeriaIrak
KuwaitSaudi Arabia
QatarEgypt
Morocco

13
Public Sector Restructuring
Serious efforts to restructure the public sector typically entail a functional review of all public sector activities. This will help to expose areas of duplication and identify non-core functions. This should be followed by new process re-engineering and outsourcing some services. Rationalization of various government institutions should be undertaken to weed out duplication of work (i.e., dual-pay for the same job). Efforts in this area have already been applied in Tunisia, for instance, through audits and the operation of salary rationalization committees.
Employee Audits
The government has committed to conducting an audit process to identify legitimately employed personnel and to eliminate "ghost workers" from the civil service payroll. Large amounts of money have been and are still being paid to non-existent workers - those who have left public service or have died. Employee audits should logically contribute to wage bill savings and reductions in fraud.
Recruitment Practices
Hiring should be merit-based and corrupt practices or political patronage eliminated. Along the same lines, there needs to be a transparent and competitive recruitment policy for vacant postings. Staff Hiring
Since 2011, the government has recruited new staff, particularly in the education, health, and interior sectors, which has increased the wage bill. However, most new hires are merely duplicating the work of existing staff. It is critically important to curtail/eliminate the implicit policy of redundant hires. Payroll System Strengthening
Libya does not have an effective salary control system able to detect/impede meddling by government officials. Strengthening wage control systems would help identify and eliminate cases of fictitious workers and dual payments and, in turn, reduce the wage bill. The use of advanced ICT systems should be deployed to support this effort. An audit of the current payroll system and its operation would help to identify existing shortcomings and major potential improvements. Salary and Wage Increases
Government authorities should centralize HR management and carry out a comprehensive evaluation and rationalization of staff positions; to bring wage levels in line with levels that can be sustainably supported and to ensure equity among employees. Additionally, they should review current civil servant wage structures, linking them to productivity and level of effort. The existing 33 different wage tables in Libya must be harmonized, in an effort to reduce the wage bill and curtail/eliminate ghost workers. It will be critically important to transition towards ta remuneration package effectively pegged to performance.
Public Wage Bill Management Best Practices
Effective restructuring takes time and requires considerable technical capacity and a resilient and robust government. The table below presents a few best practices for prudent public wage management. Examples

14
of countries that have succeeded in significantly curbing bloated wage-bills include Greece, Portugal, and Romania.
Greece managed to slash its government wage bill by more than a third over a five-year period (2010-2014). The most important legislative interventions to reduce the public sector wage bill and operational expenditures included:
• A reduction of public sector salaries (in various forms); • A 30% reduction in recruitment for indefinite-term, fixed-term and project-based employment
contracts in the public sector for 2010; • Enhanced staffing mobility throughout the public sector; • Introduction of a public sector labor reserve system paying 60% of the designated basic salary to
those assigned to the 'reserve,' with the aim of reducing the cost of overstaffing; • Establishment of a firm 1:10 ratio of public sector recruitment to departures from 2010-2016; • Collective bargaining procedures for firm-level agreements were simplified, allowing the
implementation of less favorable conditions than those offered by sectoral/occupational agreements. Firms were allowed to extend daily working hours during periods of high employment;
• Collective dismissal rules were eliminated, although the number of collective dismissals requested from 2008–16 was very low;
• The creation of a platform in 2013 that allowed the public and private sectors to electronically notify competent authorities regarding any new hiring/firing actions, modification of contracts, and other required actions. This increased transparency and reduced costs.
• Biometric monitoring of government employees to identify ghost workers and ghost pensioners, followed by automation of payroll payments to validated workers;
• Improvements in the Development of an MTFF/MTEF that allowed a more strategic approach to staffing (also adopted in Portugal and Romania).
Control of public sector wages through nominal, or real freezes delivered significant fiscal savings while narrowing the gap between public and private wages in Portugal and Romania. Wage freezes also had the effect of making public sector jobs less attractive. Government compensation structures were reformed through competitive, equitable, and transparent remuneration. In the case of Portugal, the government also made structural changes to improve oversight, address inefficiencies, and increase flexibility in the management of human resources. One important step was the development of comprehensive government employment and the remuneration database in 2011. This enhanced oversight and transparency and became an essential tool in identifying inefficiencies and potential reform areas.

15
Public Wage Bill Management: Best Practices Measures Short Term Structural Compensation - Wage freezes, ceilings, or reductions
- Elimination the indexation of allowances
- Reduction in the number and size of allowances.
- Simplification of the salary scale/new salary grid addressing equity.
- Rationalization of premiums and bonuses
- Harmonizing wage structures
- Rationalizing allowances
- Introducing comparisons of public and private sector compensation
- Tightening the link between pay and performance.
- Design, structure, and operate a new payment system.
Employment - Partial or selected hiring freezes
- Employment caps or cuts
- Attrition-based employment reduction
- Early Retirement
- Introducing flexibility in the management of human resources
- Restructuring the public sector and identifying understaffing and/or overstaffing following a public employment audit.
- Identifying and eliminating ghost workers
- Enhancing quality and control of payroll (e.g., payroll census and elimination of ghost workers)
- Replacing career-based employment with position-based employment for some jobs
- Connecting pay to performance and reducing public-private wage differentials.
Scenario Analysis: Below is a hypothetical analysis of the impact of an anticipated reduction in the wage-bill, based on the application of a basic accounting framework model. It is assumed that recruitment stops and that there is no replacement of retirees (attrition-based approach to public sector employment reduction).
The Minister of Finance has already planned a 12% drop in the wage bill for 2020. This objective, while difficult within the context of the armed conflict and the current COVID-19 crisis, appears attainable and justifiable. The requirement for a significant increase in healthcare and other public health/sanitation-related expenditures creates a need - and additional political scope - for a modest contraction in public employment in favor of other public expenditure demands. In addition, currently constrained budgetary circumstances to underscore the importance of speeding up the implementation of the previously mentioned new public sector wage system, such that it becomes operational this year. Key assumptions also include a 10% decrease in the workforce and the overall wage bill beginning in 2022. Achieving this objective would require a multi-year action plan with clear and well-conceived wage-bill reduction measures. A clear and credible wage-bill reduction target should be fixed within the context of medium-term fiscal

16
framework goals. 10 In addition, adjoining business enabling environment measures should be adopted to encourage the absorption of departing employees into the private sector.
2018 2019 2020 2021 2022 2023 2024 2025
Number of employees 1761852 1800687 1587306 1507940 1357146 1221432 1099288 989360 Wage-Bill (MLYD) 23606.6 24512.0 21607.4 20527.0 18474.3 16626.9 14964.2 13467.8
Salary per employee (LYD) 13398.7 13612.6 13612.6 13612.6 13612.6 13612.6 13612.6 13612.6 Payroll/Total expenditure ratio 60% 54% 57% 54% 50% 46% 42% 39% Total expenditure (MLYD) 39287 45813 38207 38207 37181 36309 35572 34956
Current expenditure 32660.0 41175.0 31107.4 30027.0 27974.3 26126.9 24464.2 22967.8 % of total expenditure 83% 90% 81% 79% 75% 72% 69% 66%
Capital expenditure 6627 4638 7100 8180.37 9206.72 10181.7 11108 11988 Capital expenditure % of
total expenditure 17% 10% 19% 21% 25% 28% 31% 34% Change in capital
expenditure 4739 -1989 2462 1080 1026 975 926 880 Total revenue (MLYD) 49111 57365.0 11922.0 25596.9 42960.2 47251.6 49100.4 55865.5 Oil Revenue 33476.0 31395.0 6132.0 19622.4 36792.0 40880.0 42515.2 49056.0
Oil production 000b/d 961.1 1009.2 500 800 1200 1250 1300 1500 Oil price $ 67 75.0 30.0 60.0 75.0 80.0 80.0 80.0 Non-oil revenues (5% increase from 2021) 2435.0 2523.0 3690.0 3874.5 4068.2 4271.6 4485.2 4709.5
FX Tax 13200 23447 2100 2100 2100 2100 2100 2100 Overall balance 9824 11552 -26285 -12610 5779 10943 13528 20910
Under such a scenario, the wage bill would be around 13.6 billion LYD in 2025, i.e., about 39% of total expenditures. The equivalent amount of expenditures would be redirected into urgently needed physical and social infrastructure. Accompanying investment climate policy/institutional reform measures would lead to a larger and more dynamic private sector and, therefore, a more diversified economy.
10 Meeting this objective would be made easier through the implementation of a proactive employment verification/ghost employee reduction strategy and program.
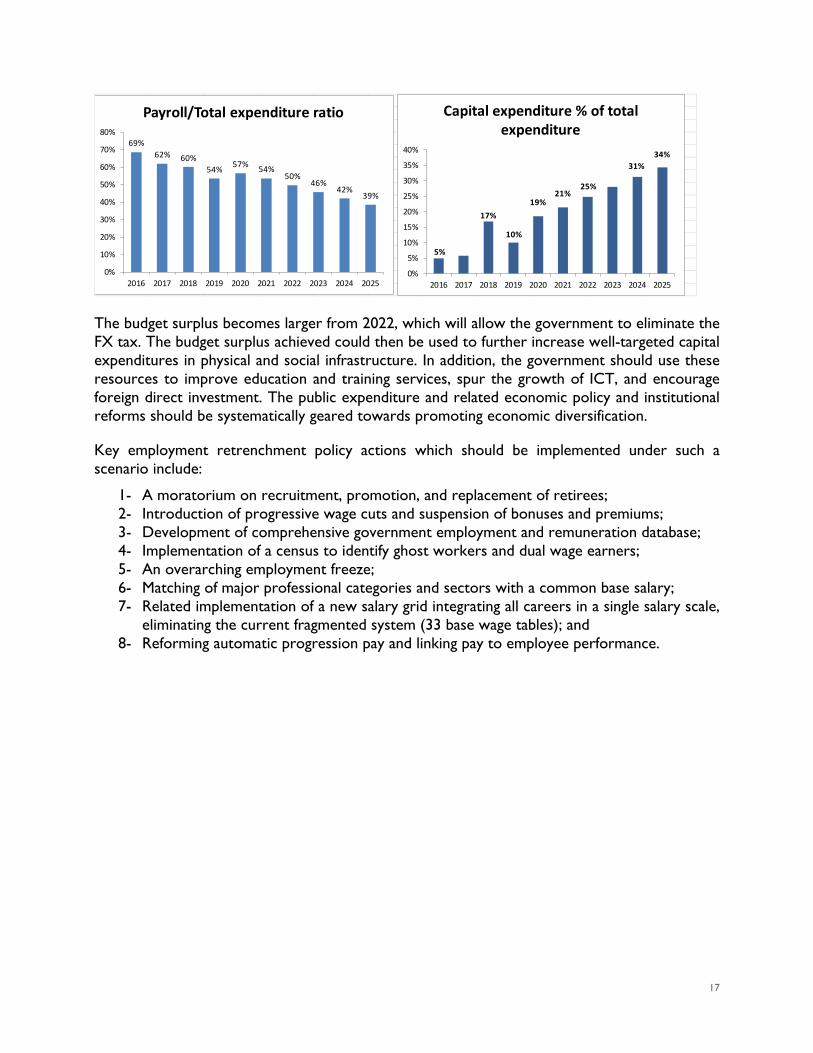
17
The budget surplus becomes larger from 2022, which will allow the government to eliminate the FX tax. The budget surplus achieved could then be used to further increase well-targeted capital expenditures in physical and social infrastructure. In addition, the government should use these resources to improve education and training services, spur the growth of ICT, and encourage foreign direct investment. The public expenditure and related economic policy and institutional reforms should be systematically geared towards promoting economic diversification.
Key employment retrenchment policy actions which should be implemented under such a scenario include:
1- A moratorium on recruitment, promotion, and replacement of retirees; 2- Introduction of progressive wage cuts and suspension of bonuses and premiums; 3- Development of comprehensive government employment and remuneration database; 4- Implementation of a census to identify ghost workers and dual wage earners; 5- An overarching employment freeze; 6- Matching of major professional categories and sectors with a common base salary; 7- Related implementation of a new salary grid integrating all careers in a single salary scale,
eliminating the current fragmented system (33 base wage tables); and 8- Reforming automatic progression pay and linking pay to employee performance.
69%62% 60%
54% 57% 54%50%
46%42%
39%
0%
10%
20%
30%
40%
50%
60%
70%
80%
2016 2017 2018 2019 2020 2021 2022 2023 2024 2025
Payroll/Total expenditure ratio
5%
17%
10%
19%21%
25%
31%34%
0%
5%
10%
15%
20%
25%
30%
35%
40%
2016 2017 2018 2019 2020 2021 2022 2023 2024 2025
Capital expenditure % of total expenditure


i
Annex 5.2 - Exchange Rate Management Report
لیبیا في العام المال إدارة برنامج
LIBYA PUBLIC FINANCIAL MANAGEMENT PROGRAM (LPFM)
Which Exchange Rate Regime for Libya?
April 2020
Government of Libya Ministry of Finance Macro-Fiscal Unit
Technical note No. 2/2020-MFU
Disclaimer and Acknowledgements: The views expressed in this paper are those of the authors and do not necessarily reflect the views of the Ministry of Finance or Government of Libya.
The authors are grateful to the Minister of Finance and the Deputy of the Minister of Finance for their encouragement. However, errors, if any, are the responsibility of the authors.


i
CONTENTS
I. The Exchange Rate Regime Adopted in Libya: Pros and Cons ........................................................... 1
I.1. The exchange rate regime ................................................................................................................................ 1
I.2. What are the consequences of the fixed exchange rate regime in case of negative exogenous shock? ... 3
I.3. Is the current exchange rate regime appropriate? .......................................................................................... 5
II. What exchange rate regimes for hydrocarbon-exporting countries? ............................................. 8
II.1. What is the experience of oil-exporting countries that have suffered from falling oil prices during the 2014-2016 period? ............................................................................................................................................................. 9
II.2. The Importance of Fiscal Policy in Counteracting the Procyclicality of a Fixed Exchange Rate Regime 12
III. Which Equilibrium Exchange Rate is Appropriate for Libya? ......................................................... 14
III.1. How could the equilibrium exchange rate be realistically determined? .................................................. 14
III.2 An optimal exchange rate policy for Libya: A practical approach: ............................................................ 14
IV. Which path for Libya in facing the challenges ahead? ....................................................................... 17
IV.1 How best to lay the groundwork for a sound Macro-Fiscal policy framework ...................................... 18
References: ............................................................................................................................................................... 20
Figure 1: Exchange rate USD/LYD ........................................................................................................................... 2 Figure 2: SDR/LYD ....................................................................................................................................................... 2 Figure 3: Money Supply and Foreign Exchange Reserves ................................................................................... 3 Figure 4:Money Supply and Inflation ........................................................................................................................ 4 Figure 5: Nominal GDP and Government Expenditures .................................................................................... 4 Figure 6: Inflation and Exchange rate on the Parallel Market ............................................................................ 5 Figure 7: Libyan Import by currency / Figure 8: SDR basket ......................................................................... 6 Figure 9: Official Exchange rate and Exchange rate on the Parallel Market ................................................... 7 Figure 10: Spread between the Exchange rate on the Parallel Market and the Official rate ..................... 8 Figure 11: Oil price and US Nominal Effective Exchange Rate ...................................................................... 13 Figure 12: Nominal and Real Effective Exchange Rates .................................................................................... 16
Table 1: Exchange Arrangement Classification .................................................................................................. 12


1
In the absence of diversification and more developed monetary policy tools, high volatility, and uncertainty over foreign exchange inflows, Libya maintains a fixed exchange rate regime pegged to the SDR (Special Drawing Rights). Monetary policy is, therefore, entirely oriented towards this external objective, which has led to the emergence of a parallel market when the fulfillment of the exchange rate objective and the relative foreign exchange reserve preservation has not allowed the foreign exchange supply to meet demand.
The sharp depreciation of the dinar on the parallel market and the resulting imported inflation, as well as illegal activities, led the authorities to temporarily adopt a dual exchange rate system which allowed the Central Bank of Libya (CBL) to meet the demand for foreign exchange and generate tax revenues for the Government. While this temporary solution has helped to generate a fiscal surplus and reduce imported inflation while preserving foreign exchange reserves, it cannot be sustained over time as it hinders the development of an export-oriented private sector and thus the diversification process.
This raises the question of the appropriateness of the current exchange rate regime for the Libyan economy, and the experience of other oil-exporting countries shows that the level of diversification is one of the key factors in the choice of exchange rate regime. Indeed, the process of diversifying the economy is crucial, and the evolution of the exchange rate regime can either constrain or promote progress in this direction.
I. THE EXCHANGE RATE REGIME ADOPTED IN LIBYA: PROS AND CONS
I.1. THE EXCHANGE RATE REGIME
According to IMF exchange rates arrangements (April 2019), Libya is following a fixed exchange rate regime pegged to SDR, a tolerated parallel market for private transactions, and a new FX tax on imports by the private sector.
Historically, Libya adopted a dollar peg in 1973 following the oil price jump. The rate adopted was 1$=0.297 LD up to 1986. But did not adopt a convertible currency despite ample foreign reserves since foreign exchange control was a common rule. Until 1982, quantitative restrictions on foreign currency trading and soaring oil prices caused a significant increase in the reserves.
In the face of international sanctions and embargoes imposed on Libya during the period 1983–99, the pegged exchange rate was not sustainable since fiscal and monetary policies were not supportive of a sustainable exchange rate in line with foreign currencies.

2
Figure 15: Exchange rate USD/LYD
In March 1986, some flexibility was introduced through a peg to SDR with +_7.5 percent, and the new CBL law allows to revise the exchange rate according to economic development. In 1994, a commercial rate was used for certain purposes until a dual exchange rate system was put in place in February 1999, with a special exchange rate used besides the “official” exchange rate pegged to the SDR. In 2002, rates were unified with a depreciation of the official rate by 50 percent. In 2003 a further 15 percent depreciation was adopted to replace the tax on letters of credit; canceled in June 2003 when Libya accepted the IMF article 8 and eliminated import licensing requirements and all restrictions on current account operations. In June 2003, the Libyan Dinar was pegged to SDR at the rate of 0.5175 SDR per one LD. This rate is still in effect until now, as shown in the graph below for 1 SDR = 1.93 LYD.
Figure 16: SDR/LYD
A small fluctuation was noticed since the end of February between 1.88 and 1.97, around 1.93. (+ or – 2 percent): it was an appreciation up to March 20, then a depreciation to get back to 1.93 at the end of the month (probably in relation to oil price movement).
00.20.40.60.8
11.21.41.6
1970
1972
1974
1976
1978
1980
1982
1984
1986
1988
1990
1992
1994
1996
1998
2000
2002
2004
2006
2008
2010
2012
2014
2016
2018
USD/LYD

3
I.2. WHAT ARE THE CONSEQUENCES OF THE FIXED EXCHANGE RATE REGIME IN CASE OF NEGATIVE EXOGENOUS SHOCK?
In the event of a negative shock, this fixed exchange rate avoids a depreciation of the currency, the consequences of which would be imported inflation. Its impact on total inflation depends on the marginal propensity to import, which is important in Libya. The country's economic structure, therefore, makes it particularly vulnerable to a wage-price spiral, which would, therefore, self-feeding inflation (assuming an accommodative monetary policy). The oil blockade from 17 January 2020 and the impact of COVID-19 on international oil prices presents strong similarities with the episode of sharp declines in oil prices and production that occurred from 2014 to 2016. In Libya, these shocks led to a 35 percent decline in cumulative real GDP over these three years and a 45 percent decline in foreign exchange reserves. Indeed, the cumulative 84 percent decrease in Government revenue led to a cumulative LYD 60 billion deficit partly funded by the CBL, leading to an increase of Money supply / GDP ratio that put pressures on foreign exchange reserves.
Figure 17: Money Supply and Foreign Exchange Reserves
While the CBL had taken measures to limit foreign exchange sales, the domestic currency supply increase resulting from the expansionary funding of the fiscal deficit, combined with the severe constraints on the supply of foreign exchange at the official rate, led to the massive use of the parallel foreign exchange market. This, in turn, resulted in a 71 percent dinar depreciation over the same period. This confluence of factors, in turn, fueled inflation – exactly the outcome which the fixing of the nominal exchange rate was supposed to avoid.
0
20
40
60
80
100
120
1400.0
0.5
1.0
1.5
2.0
2.5
3.02010 2011 2012 2013 2014 2015 2016 2017 2018 2019
International Reserves (billion US dollars) (IMF/IFS) RHSMoney Supply (CBL)/GDP current prices (WB/WDI) LHS, Inverted scale
Money Supply (inverted scale) and International Reserves

4
Figure 18:Money Supply and Inflation
The constraints on monetary policy within the context of a large negative shock thus led to a stagflationary situation, that could not be counter-balanced by counter-cyclical economic policies. Public spending decreased by 35 percent (i.e., fiscal policy ineffective became pro-cyclical). Within this context, diversifying government revenues through the introduction of direct and indirect tax instruments, and diversifying economic activity by stimulating the growth of the private sector, should be a priority medium-term objective.
Figure 19: Nominal GDP and Government Expenditures
The sustainable effectiveness of a fixed exchange rate regime will effectively depend on how long the central bank will be able to draw on foreign exchange reserves after a shock. In this regard, the CBL has generally been extremely prudent in exchange for sales. This has had an impact on imports, which fell by 70 percent over the 2014-2016 period. This drastic decline in the face of a significant - though more
-5
0
5
10
15
20
25
30
0.0
0.5
1.0
1.5
2.0
2.5
3.0
2010 2011 2012 2013 2014 2015 2016 2017 2018 2019
Money supply and Inflation
Inflation CPI (annual % changes) (WB/WDI) RHSMoney Supply (CBL)/GDP current prices (WB/WDI)
0
20 000
40 000
60 000
80 000
100 000
120 000
2009 2010 2011 2012 2013 2014 2015 2016 2017 2018
Nominal GDP and Goverment Expenditures(Millions of LYD)
Government expenditures Nominal GDP (WB)
Source: MoF and World Bank

5
modest - 44 percent drop in foreign exchange inflows resulted in an increase in reserves (expressed in months of imports) from 22 months in 2014 to 47 months in 2016.
Compared to most countries - including oil-producing countries - these levels seem extremely high, though that can, in part, be explained by the high volatility and homogeneity of foreign exchange inflows. In response, economic agents have resorted to the parallel market, thus greatly diminishing the main advantage of the fixed exchange rate regime - since inflation has increased with the depreciation of the dinar in the parallel market – where most FX transactions are occurring.
Figure 20: Inflation and Exchange rate on the Parallel Market
Moreover, this parallel market has encouraged illegal activities and the strengthening of armed groups, fueling political and economic instability. In September 2018, when the level of foreign exchange reserves had improved, the monetary authorities announced an increase in the supply of foreign exchange but were unable to meet the full amount of demand at the official rate of 1.39 dinars per dollar.
In order to meet demand while maintaining the fixed exchange rate regime, the authorities sold the dollar at the rate of 3.69 dinars per dollar, by applying a 183 percent fee on the sale of foreign currency. This allowed the government to collect the gains previously earned by traders on the parallel market, and to ensure a rapid convergence of the parallel market rate to the official rate plus fees. The very rapid tightening - 3 months - of the spread between the rate on the parallel market and the official rate allowed a subsequent reduction in the fees rate in August 2019 to 163 percent, which resulted in an immediate 7 percent appreciation of the dinar by the same rate on the parallel market. Since then, the spread has fallen to low levels of only 0.3 dinars, paving the way for future fees rate cuts, until the January 2020 oil blockade (which led to the spread increase by more than 1 dinar in 3 months). This then raises the fundamental question of the efficiency of the exchange rate regime.
I.3. IS THE CURRENT EXCHANGE RATE REGIME APPROPRIATE?
The disadvantages of a fixed exchange rate regime are well known (Setser 2007), in particular, that when monetary policy is used to achieve an external policy objective, it is not available to be utilized as a countercyclical stabilization instrument. Moreover, fiscal policy is also strongly constrained by the
1
2
3
4
5
6
7
8
9
10
-10
-5
0
5
10
15
20
25
30
35
40
Dec
-14
Mar
-15
Jun-
15Se
p-15
Dec
-15
Mar
-16
Jun-
16Se
p-16
Dec
-16
Mar
-17
Jun-
17Se
p-17
Dec
-17
Mar
-18
Jun-
18Se
p-18
Dec
-18
Mar
-19
Jun-
19Se
p-19
Dec
-19
Mar
-20
Inflation (YoY) and Exchange rate on the parallel market (LYD per USD)
Overall Inflation Exchange rate (RHS)

6
monetary policy under such circumstances. It cannot be utilized for countercyclical purposes in the event of a shock, as may currently be observed in Libya. But on the other hand, a peg to the dollar makes it theoretically possible to limit the risks of Dutch disease, until an appropriate fiscal policy can fight against this phenomenon within a stabilized context. Moreover, the dollar peg provides a credible and easy way to hold anchor for monetary policy and is easier to manage for international trade and financial transactions in the absence of developed financial markets (Khan 2009). However, even in the case of the choice of maintaining a fixed exchange rate regime, the peg should be not only with the dollar but with a basket of currencies, or an oil price peg, which would be more effective in countercyclical terms, given the inverse correlation between the dollar and the oil price.
So, regarding Libya, was this peg to SDR appropriate? Pegging a currency to a basket of foreign currencies reduces the volatility of the exchange rates. In this respect pegging the LD to SDR (42 percent $, 31 percent euro, ….) stabilizes the value of imports from different countries. Libyan imports originate mainly from Europe, China-Dubai, South Mediterranean countries, and dollar transactions, as shown in the graph below. However, the SDR composition differs from import shares by currency. We note in this regard that the euro share is appropriate (31 percent for both), while the $ and ‘strong currency’ share of SDR is high while the opposite is the case for weaker currencies (as a share of imports). This tends to create an implicit import bias - since the Libyan dinar follows relatively strong currencies, they will be able to obtain relatively cheaper imports, valued in LD, from China and other neighboring countries due to LD appreciation. Therefore, the SDR choice as a basket is not appropriate for Libya and tends to lead to a nominal appreciation of the Libyan dinar.
With regard to exports, they are denominated in $ and will tend to be impacted by its fluctuation around the SDR. A rising $ yields higher export revenues, valued in Libyan dinar. A dollar peg would stabilize the value of exports, but not that of imports.
Since Libyan trade flows are on average roughly equally distributed between imports and exports, an ‘appropriate’ basket for the CBL to follow to minimize exchange rate volatility and avoid nominal LD appreciation might be 60 percent - $, 20 percent - Euro, 10 percent - Yuan and 10 percent for other currencies (Turkey-Egypt-Tunisia).
Figure 21: Libyan Import by currency Figure 22: SDR basket
Concerning the exchange rate level adopted (1SDR = 1.93 LYD): a stable exchange rate when combined with inappropriate fiscal and monetary policies leads to different imbalances. The fast growth of
32.4%
21.3%26.7%
19.5%
Libyan Import share(others are weak currencies(south Mediterranean Sea))
Euro Yuan $ Others
30.90%
10.90%41.80%
16.40%
SDR basket (others are yen and pound)
Euro Yuan $ Others

7
government expenditures (salaries) and of the money supply to finance budgetary needs will lead to higher demand for foreign currencies for imports and transfers, within the context of limited exports. This is particularly the case with export revenues declining due to falling oil prices or limited production, as has frequently happened since 201,1 and transpired this year with the oil blockade.
The initial major macro imbalance which emerges under this type of circumstance is the current account deficit associated with an overvalued exchange rate, which puts pressure on foreign exchange reserves at the pegged rate. This leads to the rationing of foreign currencies by the CBL.
The second key macroeconomic imbalance resulting from this set of policies is a rise in inflation. This is driven by the scarcity premium associated with market bottlenecks created by those who can get access to foreign exchange - either from the parallel market or from the CBL - for private transfers or tourism allowances.
As a result, the FX rate in the parallel market diverges from the official rate (near LYD 1.4 /$), under the pressure of high demand for foreign exchange to finance consumption, within the context of limited domestic supply capacity to consumers. The results of this dynamic are demonstrated in the graph below:
Figure 23: Official Exchange rate and Exchange rate on the Parallel Market
0.001.002.003.004.005.006.007.008.009.00
10.00
Dec
-14
Mar
-15
Jun-
15
Sep-
15
Dec
-15
Mar
-16
Jun-
16
Sep-
16
Dec
-16
Mar
-17
Jun-
17
Sep-
17
Dec
-17
Mar
-18
Jun-
18
Sep-
18
Dec
-18
Mar
-19
Jun-
19
Sep-
19
Dec
-19
Mar
-20
Official Exchange rate and Exchange rate on the parallel market (LYD per USD)
Exchange rate parallel marketOfficial exchange rateOfficial exchange rate including fees

8
Figure 24: Spread between the Exchange rate on the Parallel Market and the Official rate
With this backdrop, the FX tax was set in 2018 to allocate foreign currencies at a higher cost (+183 percent reduced later to 163 percent), effectively resulting in a dual exchange rate system: an official rate (1$=1.4 LYD) for exports, government imports and the ‘family head’ allowance, and a second rate (1$=3.8 LYD) applied to letters of credit for private imports and transfers. As a result, inflation slowed because the foreign exchange was supplied to importers at this new rate – cheaper than the parallel market rate of over LYD 5 per $ (at the time the tax was introduced). The private rate was later reduced to LYD 3.6 per $ in order to place further downward pressure on prices (negative inflation rate in 2019).
As a result of the oil blockade and with the prospect of an increasing parallel market rate, the CBL has proposed an increase in the FX tax in order to supply FX at a higher price, in a manner which would help limit imports. This would increase the costs of imports for conventional importers but would dampen the overall exchange rate and inflationary pressures by reducing demand for FX in the parallel market.
However, although this policy tool may help in the short term, it will not solve the core underlying macroeconomic policy issue, as long as fiscal and monetary policies remain expansionary and promote ongoing price pressures and a resulting damaging appreciation of the real exchange rate.
In addition, the current dual exchange rate system heavily penalizes the exporting sector (since exporters surrender FX at the highly overvalued official rate), and strongly hinders urgently needed progress towards diversification of the Libyan economy.
II. WHAT EXCHANGE RATE REGIMES FOR HYDROCARBON-EXPORTING COUNTRIES?
The experience of other oil-exporting countries provides considerable insight into the disadvantages mentioned earlier. A floating exchange rate regime generally allows for smoother/more efficient adjustment in the face of a negative shock. In addition, economic policies, whether monetary or fiscal,
0.20
0.40
0.60
0.80
1.00
1.20
1.40
1.60
Spread between the exchange rate on the parallel market and the official rate + FX fees
9
can be designed in a manner that effectively meets countercyclical stabilization objectives. Monetary policy is not subject, or at least less stringently subject, to the exchange rate target or foreign exchange reserve controls. Fiscal policy can pursue countercyclical stabilization objectives without the risk of impacting foreign exchange reserves and ultimately leading to monetary tightening. If the core objective is to reduce the trade deficit with the rest of the world, the most important task is to increase productivity to improve price competitiveness on a sustainable basis. Increasing non-price competitiveness requires a long-term investment in education and research and development, as well as major enabling environment reforms. In the shorter term, countries often seek to focus on increasing their price competitiveness.
Under flexible exchange rate regimes, the change in trade flows depends on trade elasticities (Marshall-Lerner condition) and requires the existence of locally produced substitutable goods. Under a fixed exchange rate regime, it may be possible to devalue, with the risks that this entails if the devaluation is too low or too high. If this fails, the trade balance, which at first naturally deteriorates as the value of imports rises, will not subsequently improve from increased export revenues. The hoped-for J-curve effect is never achieved. If devaluation is not possible (currency unions) or not desired, a depreciation of the real exchange rate must be achieved, which is sometimes called an internal devaluation. A depreciation of the real exchange rate can be achieved by austerity measures that will limit demand and/or by measures to reduce labor costs. On the import side, it is generally necessary, in addition to diversifying the country's economy, to improve non-price competitiveness so that consumers will gradually switch to local products.
II.1. WHAT IS THE EXPERIENCE OF OIL-EXPORTING COUNTRIES THAT HAVE SUFFERED FROM FALLING OIL PRICES DURING THE 2014-2016 PERIOD?
Responses to this shock depended mainly on the degree of diversification and the level of foreign exchange reserves. In this regard, the cumulative 55 percent drop in oil prices forced several exporting countries to introduce greater flexibility in their exchange rate regimes, starting with Russia in November 2014, Kazakhstan in August 2015, Azerbaijan in December 2015, Nigeria in June 2016 and Egypt in November 2016. The impact on economic diversification appears to have been mixed thus far. In addition, the success of exchange rate flexibility also depends on the reasons behind the policy’s adoption. In the case of Nigeria and Egypt, these countries had no choice but to devalue because the level of available foreign exchange reserves had reached the minimum acceptable level (4 months for Nigeria, less than three months for Egypt), and devaluation was unavoidable. While the exchange rate regime became a de jure floating regime, it quickly became a de facto managed, so-called "stabilized" regime (IMF 2019) to limit imported inflation. Azerbaijan, which had adopted a free float after a managed float, returned to a peg with the dollar to limit inflation, which had jumped immediately to 13 percent - from less than 4 percent - at the time of the second devaluation in December 2015.
Another country, Russia, which, in addition to suffering from the oil price drop, was also under international sanctions in 2014, experienced a one-third drop in its foreign exchange reserves from $480 billion in 2013 to $310 billion at the end of 2014 and had only 14 months of imports left in November 2014. Russia has introduced greater flexibility in its exchange rate regime, in a period of ruble depreciation - 47 percent depreciation in 7 months - which began in July 2014 with the start of the oil price drop. Faced with the sharp fall in foreign exchange reserves, Russia acted in prevention before they became too low, thus preserving reserve management leeway.

10
Faced with this change in Russia's exchange rate regime and the sharp depreciation of the ruble, Kazakhstan, whose main trading partner is Russia, adopted a de jure floating exchange rate regime in 2015. However, de facto it managed to keep its currency close to the ruble, thus effectively aligning itself with Russian monetary policy. At the time of this regime change, the country had 25 months of foreign exchange reserves.
Other major oil-producing and exporting countries have long-established managed floating exchange rate regimes. As is the case for Libya, Algeria's exports are about 95 percent composed of hydrocarbons, and the remaining exports are mainly hydrocarbon derivatives. The share of hydrocarbon GDP in total GDP is even higher than in Libya, reaching 83 percent of GDP in 2018. The current account fell into a massive deficit position at that time (16.5 percent of GDP in 2015 and 2016). This has continued even subsequent to the recovery in international oil prices from 2017 onwards - the current account deficit still stood at 12.5 percent of GDP in 2019, despite the 30 percent depreciation of the NEER since 2014, and the inflation differential with major trading partner countries kept the REER relatively constant.
In consequence, the Central Bank has needed to draw on its foreign exchange reserves, which by the end of 2019 had decreased by 68 percent since 2013 (from $194 billion to $62 billion). The fall is expected to continue, since before the COVID-19 crisis broke out, the 2020 Finance Law projected a further annual decline in foreign exchange reserves to $51.6 billion, with reserves falling 12.4 months of imports (under a $50 a barrel price assumption). The magnitude of the current account deficit supports the idea of a significant overvaluation of the Algerian dinar, despite its continuous depreciation since 2012 against all currencies. The gradual lifting of exchange controls, regularly requested by the IMF, which considers the dinar to be overvalued, has not been implemented by the Algerian monetary authorities – the latter reportedly fear an acceleration of capital outflows and additional imported inflation. Foreign currency-denominated debt, although still quite low, is increasing as a result. The maintenance of exchange controls has, inevitably, led to the existence of a parallel foreign exchange market, with a premium of around 50 percent.
The Algerian example of a continuous depreciation of the dinar for almost a decade without benefit to the private sector should be considered. Indeed, in the absence of enabling environment reforms and a rebounding private sector, the depreciation of the NEER mainly feeds inflation, which prevents the REER from decreasing, thus threatening to effectively cancel out potential gains in price competitiveness. One of the main reasons for this failure is the lack of impetus towards diversification. This fundamentally reflects the lack of commitment to put in place the structural reforms required to promote private sector development. In this regard, Algeria remains near the bottom of the World Bank's Doing Business ranking, ranked 157th out of 190 in 2020.
Other oil-exporting countries with more diversified economies have maintained a more cautious approach to their exchange rate regimes. Kuwait, whose oil GDP in 2018 represented 52 percent of its total GDP, has adopted a currency peg against an undisclosed currency basket. In the latest Article IV report for Kuwait (March 2020), the IMF expressed the idea that while a more flexible exchange rate regime in the context of a developed non-oil tradable sector could help absorb shocks, it is unlikely to be effective in facilitating external adjustment given the current structure of the economy. This, in turn, reflects the dominant role of oil in exports, the high share of imported labor in domestic value-added, and the use of dollar invoicing.
IMF staff emphasized that the pegged exchange rate puts a greater onus on fiscal policy and structural reforms to support competitiveness, and facilitate external adjustment. Kuwait is continuing its efforts to improve its business environment and, along with four other oil-producing countries (Saudi Arabia,

11
Bahrain, and Nigeria), is one of the ten countries in terms of upward movement in the Doing Business 2020 rankings, rising to 83rd place out of 190.
The other GCC countries all have their currencies pegged to the US dollar and are making efforts to improve the business environment. Among these, Saudi Arabia is the economy that has risen most in the Doing Business 2020 ranking. It now ranks in the top third - 62nd out of 190 - and the country has, on numerous occasions, demonstrated its willingness to continue its efforts on the path of diversification. In 2018, oil GDP accounted for 66 percent of its total GDP.
For the same reasons explained as for Kuwait, the latest IMF Article IV on Saudi Arabia (September 2019) concludes that "the peg remains the best exchange rate option for Saudi Arabia given the current structure of the economy," explaining that the pegged exchange rate provides the country with a longstanding and credible policy anchor. The IMF adds that given the close link between the fiscal and external balance and the structure of the Saudi Arabian economy, with exports dominated by oil and oil-related products and limited substitutability between imports and domestically produced goods, "external adjustment will be driven by fiscal policy rather than the exchange rate."
Alkhareif, Albakr, and Alsayaary (2016) demonstrated that the pass-through of real exchange rate changes on the trade balance position for countries with this type of economic structure could below. In oil-producing countries, price-elasticities of imports and exports are lower than for most other countries (Hakura and Billmeier 2008), thus making it difficult to achieve Marshall Lerner conditions.
Even for oil-exporting countries that are more advanced in their progress towards diversification, such as Qatar (share of hydrocarbon GDP in total GDP was 32 percent in 2018), the IMF reaches similar conclusions in its latest Article IV (April 2019). Finally, other countries with similarities to Libya, such as Iraq (95 percent of exports are hydrocarbons), have also adopted a currency peg against the US dollar. In this case, the control of inflation allowed by the peg has induced an inflation differential in favor of Iraq. Thus, despite an appreciation of NEER over the period 2015-2018, the REER has remained relatively stable, making it possible to maintain a certain degree of price competitiveness for the private sector (of course Iraq still faces massive enabling environment improvement issues which severely constrain private sector expansion).

12
Table 2: Exchange Arrangement Classification
Norway Free-floating
Azerbaijan Managed floating arrangement, then de jure Free-floating then de facto. Stabilized arrangement from April 2017
Kazakhstan De jure Floating. Interventions from 2015 targeted towards stability vis-à-vis the Russian ruble
Russia De jure Free-floating but major interventions from 2017 onwards. FX purchases and sales by the MoF according to international oil price (pivotal value 40$pb)
Algeria Managed floating
Egypt De jure Floating from November 2016. De facto stabilized from March 2017.
Nigeria Multiple exchange rates. De jure floating. De facto stabilized.
Kuwait Conventional peg to a currency composite. Libya Conventional peg to the SDR. Bahrain Conventional peg to the US dollar. Iraq Conventional peg to the US dollar. Qatar Conventional peg to the US dollar. Saudi Arabia Conventional peg to the US dollar. United Arab Emirates
Conventional peg to the US dollar.
Source: Annual Report on Exchange Arrangements and Exchange Restrictions 2018 (April 2019)
II.2. THE IMPORTANCE OF FISCAL POLICY IN COUNTERACTING THE PROCYCLICALITY OF A FIXED EXCHANGE RATE REGIME
For some oil-exporting countries, the IMF recommends maintaining a peg with the dollar, despite the procyclicality of such a policy. The latter is related to the (traditionally) inverse correlation between the dollar to which these currencies are pegged and the international price of oil. This, in turn, tends to mean that when the price of oil drops, the pegged exchange rate is strengthening the currency and making imports cheaper.
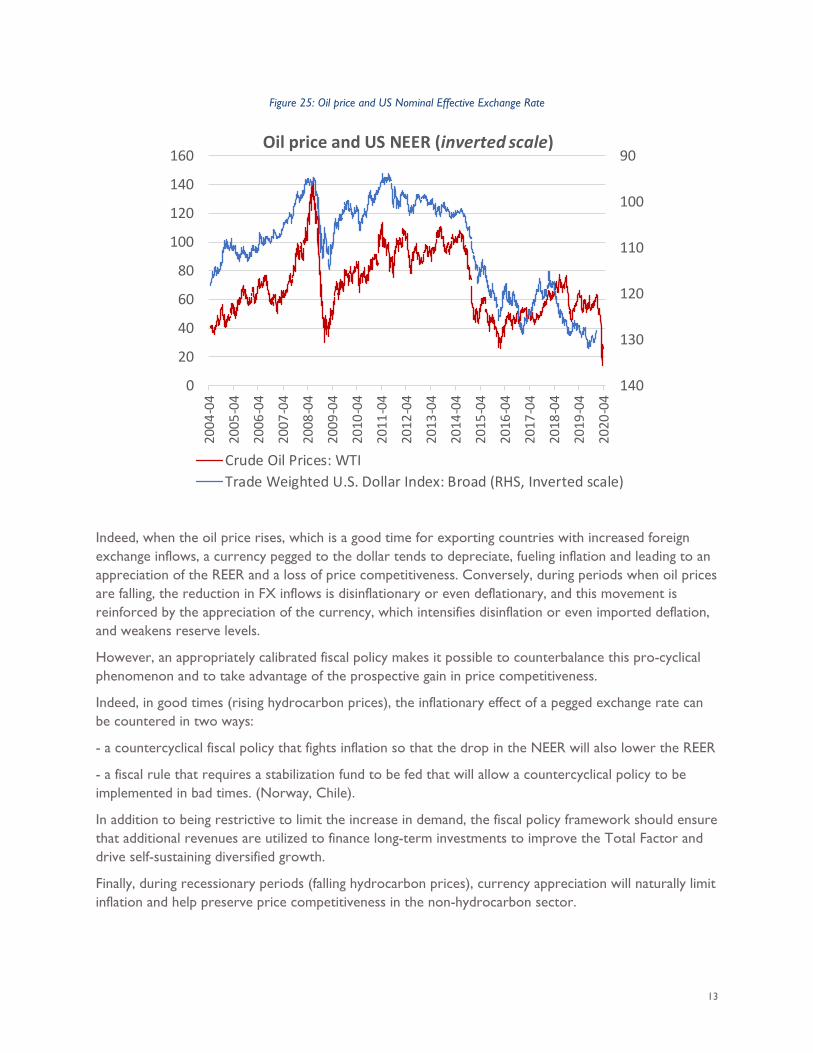
13
Figure 25: Oil price and US Nominal Effective Exchange Rate
Indeed, when the oil price rises, which is a good time for exporting countries with increased foreign exchange inflows, a currency pegged to the dollar tends to depreciate, fueling inflation and leading to an appreciation of the REER and a loss of price competitiveness. Conversely, during periods when oil prices are falling, the reduction in FX inflows is disinflationary or even deflationary, and this movement is reinforced by the appreciation of the currency, which intensifies disinflation or even imported deflation, and weakens reserve levels.
However, an appropriately calibrated fiscal policy makes it possible to counterbalance this pro-cyclical phenomenon and to take advantage of the prospective gain in price competitiveness.
Indeed, in good times (rising hydrocarbon prices), the inflationary effect of a pegged exchange rate can be countered in two ways:
- a countercyclical fiscal policy that fights inflation so that the drop in the NEER will also lower the REER
- a fiscal rule that requires a stabilization fund to be fed that will allow a countercyclical policy to be implemented in bad times. (Norway, Chile).
In addition to being restrictive to limit the increase in demand, the fiscal policy framework should ensure that additional revenues are utilized to finance long-term investments to improve the Total Factor and drive self-sustaining diversified growth.
Finally, during recessionary periods (falling hydrocarbon prices), currency appreciation will naturally limit inflation and help preserve price competitiveness in the non-hydrocarbon sector.
90
100
110
120
130
1400
20
40
60
80
100
120
140
160
2004
-04
2005
-04
2006
-04
2007
-04
2008
-04
2009
-04
2010
-04
2011
-04
2012
-04
2013
-04
2014
-04
2015
-04
2016
-04
2017
-04
2018
-04
2019
-04
2020
-04
Oil price and US NEER (inverted scale)
Crude Oil Prices: WTITrade Weighted U.S. Dollar Index: Broad (RHS, Inverted scale)

14
III. WHICH EQUILIBRIUM EXCHANGE RATE IS APPROPRIATE FOR LIBYA?
Theoretically, for a country whose non-hydrocarbon trade balance is structurally in deficit, a depreciation/ evaluation - depending on the exchange rate regime - of the currency makes it possible to restore the price competitiveness of exports, after a negative supply shock.
In addition to the existence of substitutable goods, the effect of this depreciation/devaluation depends largely on the value-added to imported intermediate goods - and, therefore, on factor productivity.
If factor productivity is low, the beneficial effect will be muted. Even if the Marshall-Lerner condition is met, a major depreciation/devaluation initially leads to an increased trade deficit - as a result of imported inflation. And if this imported inflation leads to a wage-price spiral, there will be no beneficial effect, and the temptation to undertake further depreciation actions will accelerate. Under such a scenario, the desired J-curve effect will not be achieved, and the trade deficit may unnecessarily widen.
In the case of a fixed exchange rate regime, if a devaluation is desired, it is important to choose the right level of devaluation. If the devaluation is too little or too high, the negative effects will outweigh the positive. It is, therefore, important to assess the misalignment between the actual exchange rate and the equilibrium exchange rate, which will help policy-makers effectively calibrate the necessary devaluation.
III.1. HOW COULD THE EQUILIBRIUM EXCHANGE RATE BE REALISTICALLY DETERMINED?
Such an assessment can be carried out within the framework of the Methodology for CGER Exchange Rate Assessments 1 (IMF 2006). For instance, the external sustainability-based approach to optimal exchange rate determination focuses principally on the stability of Net Foreign Assets. However, limitations exist in applying this type of approach in the case of Libya; for instance, this would require an estimate of potential growth. This can be quite difficult in the case of an oil-producing country where it is difficult, among other things, to estimate equilibrium labor market conditions and a “natural rate” of unemployment. Indeed, the determination of an output gap in such a case can be extremely challenging, since the lack of diversification and the resulting vulnerability of the economy to frequent exogenous shocks renders it difficult to asses the potential output gap.
More generally, the External Balance Assessment (EBA), which requires a panel of countries, does not fully capture the characteristics of commodity-exporting and non-diversified countries (IMF Article Kuwait 2020). Other methods adapted to oil-exporting countries (Bems and Carvalho Filho 2009) can, of course, be explored (e.g., consumption-based model to target inter-generational equity).
To overcome the constraints of normative equilibrium exchange rate models, alternative approaches can be considered that attempt to establish a co-integration relationship between the REER and its main explanatory variables. However, while some of them may apply to the Libyan case, such as the fiscal balance or public expenditure, liquidity (money supply), net foreign assets or the level of foreign exchange reserves, other commonly used variables such as the productivity differential or even the degree of openness or terms of trade would likely prove less meaningful, given Libya’s current lopsided economy
1 Consultative Group on Exchange Rate Issues

15
structure. Such a BEER2-type method makes it possible to consider the specific characteristics of a country’s economic and institutional structure and to avoid having to resort to standard variables such as the productivity differential (Krueger, Kamar, and Carlotti 2009).
III.2 AN OPTIMAL EXCHANGE RATE POLICY FOR LIBYA: A PRACTICAL APPROACH:
In light of the limitations characterizing more formalized/structured optimal exchange rate analysis approaches, we explore here a more practical approach. We use as our starting point a basic empirical observation: With an exchange rate on the parallel market above 4 dinars per dollar since 2016, the 1.4 dinars per dollar official rate appears overvalued.
To measure the degree of over-valuation of the local currency, we computed the nominal and real effective exchange rates from 2010 (base 100) to 2019 (shown in the graph below), where the increase of the index connotes an appreciation of the dinar (see also Annex 1). The effective rates are computed by reference to Libyan trade and balance of payments figures for 2018 (with some corrections for export figures due to the oil price peak of 2018 ($73 PB versus an average of $52 PB since 2015).
The results indicate that the nominal exchange rate of the Libyan dinar was quite stable due to the SDR peg, which kept its official value close the main components of the SDR basket (dollar and euro mainly); with a small average depreciation of 2 percent in 2015 and an appreciation of 4.4 percent in 2019.
However, in real terms, the dinar appreciated by 13 percent in 2015 compared to 2010. Moreover, subsequently, inflationary pressures led to a 96 percent real appreciation in 2019 when compared to 2010. This, in turn, introduced large discrepancies in purchasing power, which discourage exports and artificially cheapen imports (at the official rate). This situation systematically discourages local production and increases the country’s oil dependency from the vantage point of economic output, public sector revenues, and private consumption.
2 Behavioral Equilibrium Exchange Rate

16
Figure 26: Nominal and Real Effective Exchange Rates
In order to estimate the appropriate exchange rate - that is the fair price of 1 $ in terms of dinars, the parallel market can provide a useful barometer of what people are “willing to pay” under free-market conditions. However, under circumstances of scarcity and bottlenecks, this rate cannot be considered as the equilibrium rate, since it is quite volatile and relates only to a portion of FX transactions in the economy. It is also subject to speculative pressures.
An alternative approach would be to examine a period in the past which did not face binding FX constraints: In 2012, the official rate could be considered as a quasi-equilibrium rate, since the macroeconomic situation was still highly stable at that time (reserves, current account surplus, GDP growth, inflation) as shown below:
Data Source: EIU 2010 2011 2012 2014 2015
Current Account Balance $ million 16800 3192 23836 -108 -5429
Foreign exchange reserve $ billion 99 104 118 115 89
Inflation, CPI percent 2,4 15,9 6,1 2,6 8,7
Real GDP Growth (percent change) 4,3 -61,4 102,2 -16,9 -26,1
Compared to 2012, the dinar appreciated in nominal terms by 4 percent at the end of 2019. However, it appreciated by 79 percent in real terms, as demonstrated by the NEER and REER graph above. Economic decisions are, of course, based on the evolution of the real exchange rate evolution.
80
100
120
140
160
180
200
2010 2011 2012 2013 2014 2015 2016 2017 2018 2019
Effective Exchange rates: Nominal (NEER) and Real (REER)
NEER REER

17
This would imply that a devaluation of the LD by 79 percent would be needed, ceteris paribus, to reestablish a quasi-equilibrium rate. Under these assumptions, the optimal rate would, therefore, be LYD 2.5 per $. This will restore favorable financial conditions for a stable and sustainable economic recovery if oil production resumes.
Whether to adopt a one-shot adjustment to equilibrium or a gradual approach is heavily dependent on country-specific economic and institutional conditions. Often a gradual approach is advised to reduce the social costs typically associated with a major exchange rate adjustment and its effect on prices. However, in Libya, households are already paying the higher prices driven by the parallel market exchange rate, and the exchange rate adjustment would be accompanied by a more ample supply of foreign exchange reserves by CBL to meet demand.
Also, the one-shot adjustment avoids speculative demand for FX to avoid future depreciation of the local currency. However, this would also again be associated with an immediate social cost for the population, and buffering options should be considered (see next section).
IV. WHICH PATH FOR LIBYA IN FACING THE CHALLENGES AHEAD? The history of oil-producing countries, particularly over the last decade, demonstrates that the exogenous shocks to which they are subjected can be significant. In this regard, a recent IMF study (IMF staff team of the Middle East and Central Asia and Research Departments, 2020) demonstrates that the financial wealth of the GCC countries could diminish massively over the next five years due to the decline in hydrocarbon revenues if concurrent tax reforms are not implemented. It should be noted that this study was conducted just before the COVID-19 crisis, and was therefore based on a $61 PB in 2020, and then decreasing to $57 PB by 2023. Such a prospect, reinforced by the COVID-19 crisis, means that considerable pressure is likely to be exerted on the foreign exchange reserves of these countries, which are among the richest on the planet. This also implies that the fixed exchange rate regimes of these countries will likely need to be gradually geared towards greater flexibility.
This, in turn, emphasizes the importance of economic diversification. In this regard, three GCC countries are among the seven countries that have made the most progress in the Doing Business criteria in the last year (2020 ranking). The impact of this type of improvement in the business climate could be further re-enforced by a depreciation of the REER, an indicator of price competitiveness since these countries benefit from particularly well-controlled inflation.
As for Libya, the country is ranked 186th out of 190 in the WBDB rankings, which underscores the importance of moving proactively on key measures to improve the investment climate for private sector firms and entrepreneurs. Without this effort, a more flexible exchange rate regime is unlikely to generate the desired stimulative impact on private investment and diversified growth.
This result can be seen from the 50% devaluation undertaken in 2012 - it was aimed fundamentally at limiting imports, and was not accompanied by structural reforms designed to increase domestic supply, or to attract additional foreign investment. Ultimately sound fiscal policies and ambitious enabling environment reforms are required if more flexible exchange rate management policies are to succeed in driving a diversified local production and export base and robust employment growth.
18
IV.1 HOW BEST TO LAY THE GROUNDWORK FOR A SOUND MACRO-FISCAL POLICY FRAMEWORK
Following three exceptionally difficult years in terms of oil revenues between 2014 and 2016, a dual exchange rate was introduced in Libya in October 2018. This was done to curb the depreciation of the dinar in the parallel market and to limit its negative consequences in terms of inflation and smuggling while maintaining a fixed exchange rate regime. While the official exchange rate has been kept relatively fixed at around 1.4 dinars per dollar, private importers have had to buy foreign exchange by paying a (roughly) 1633 percent tax to limit the demand for foreign exchange. If FX demand were higher, it would lead to an uncontrolled decrease in foreign exchange reserves.
At this point, it is fundamentally important to transition away from a dual exchange rate regime – from both an economic efficiency and transparency perspective. While the current FX policy framework allows the exchange rate regime to be maintained without a drastic reduction in foreign exchange reserves - avoiding an increase in public debt and containing inflation - this dual exchange rate regime doubly penalizes the exporting private sector. It does so because imported intermediate goods are heavily taxed, while finished goods are exported at an official exchange rate that is grossly overvalued.
This directly undermines price competitiveness for private-sector producers. It also favors imports over local production. The dual-rate, of course, also encourages rampant speculation since some transactions do not pay the FX tax - such as the ‘family head’ allowance and goods imported goods by Government entities. This bifurcation of the FX pricing regime, of course, leads to arbitrage activities and higher prices – as a rule, prices for tradeable commodities are at the margin set in accordance with parallel market exchange rates. Therefore, this policy should be revised to encourage diversification of economic activity and enhance local production, in a manner which will help reduce oil revenue dependency of the country over time.
Achievement of this goal will require that ambitious fiscal reform measures be undertaken. Discussion regarding a number of these has already been initiated within the Government. The issue of subsidy reduction has been widely discussed by the Government. While it remains a major medium-term priority, it will likely be postponed in the short-run, due to the hardships associated with both the recent re-intensification of civil conflict, as well as the major supply and demand shocks likely to be associated with the COVID-19 crisis
At the same time, the impact of the current subsidy regime on availability and pricing of goods and services for most consumers should be examined further, to determine how best to replace them by direct transfer payments, even while gradually moving toward a market pricing regime. Within such a context, the increase in oil sector budgetary revenues linked to a depreciation of the dinar could be allocated in a prioritized manner to compensate for the pricing impact associated with a major reduction in subsidies, through direct transfers to low-income families, and through well-targeted social and physical infrastructure expenditures that spur increased private sector growth.
In addition, the impact of oil price fluctuations on exchange rate stability and macroeconomic imbalances can be addressed through the adoption of a policy to hold the vast majority of oil revenue resources off-shore in financial investments. A sovereign oil/wealth fund provides an effective cushion to absorb
3 Initially 183 percent

19
revenue fluctuations due to oil price changes. The reserves accumulated in this fashion can be used when the oil price falls below the breakeven price needed to cover the balance of payment requirements and Government needs (both are linked); under a stable and controlled fiscal and monetary policy framework. It also limits the endemic Dutch Disease pressures which would otherwise exist during a period of high prices and thereby can help promote economic diversification objectives as well.
The establishment of a credible and sound fiscal policy framework is crucially important for the purposes of facilitating a successful transition towards a more flexible exchange rate management system. This will help eliminate the pressure for massive deficit financing support of the government from the central bank, which in turn will relieve the pressure on the exchange rate from the associated rundown in reserves and limit political pressure for the ongoing maintenance of a dualistic exchange regime to limit inflationary pressures. It also is critically important to rationalize public expenditures in order to maximize their beneficial impact on physical and social infrastructure development and private sector diversification potential. A critical starting point for progress in this area is the establishment of a robust medium-term fiscal framework.
20
REFERENCES: Alkhareif R.M., Albakr B.A., Alsayaary S.S., 2016, "Exchange Rates Pass-Through in Saudi Arabia," SAMA (Saudi Arabian Monetary Agency) Working Paper WP 16/2.
Bems R. and Carvalho Filho I., 2009, "Exchange Rate Assessments: Methodologies for Oil Exporting Countries," IMF Working Papers 09/281 (Washington: International Monetary Fund).
Hakura D.S. and Billmeier A., 2008, " Trade Elasticities in the Middle East and Central Asia: What is the Role of Oil?" IMF Working Paper 08/216 (Washington: International Monetary Fund).
International Monetary Fund Research Department, 2006, “Methodology for CGER Exchange Rate Assessments,” Washington DC: IMF.
International Monetary Fund. 2019. Annual Report on Exchange Arrangements and Exchange Restrictions 2018. Washington, DC: IMF.
IMF staff team of the Middle East and Central Asia and Research Departments, 2020, " The Future of Oil and Fiscal Sustainability in the GCC Region," Report No 20/01.
Khan, M., 2009, “The GCC Monetary Union: Choice of Exchange Rate Regime,” Peterson Institute for International Economics Working Paper WP 09-1. (Washington: Peterson Institute for International Economics).
Kruger R., Kamar B., and Carlotti J-E, 2009, " Establishing Conversion Values for New Currency Unions: Method and Application to the planned Gulf Cooperation Council (GCC) Currency Union," IMF Working Papers 09/184, (Washington: International Monetary Fund).
Setser B., 2007, "The case for Exchange rate Flexibility in Oil-Exporting Economies" Peterson Institute for International Economics, Policy Brief n°PB07-8, November.
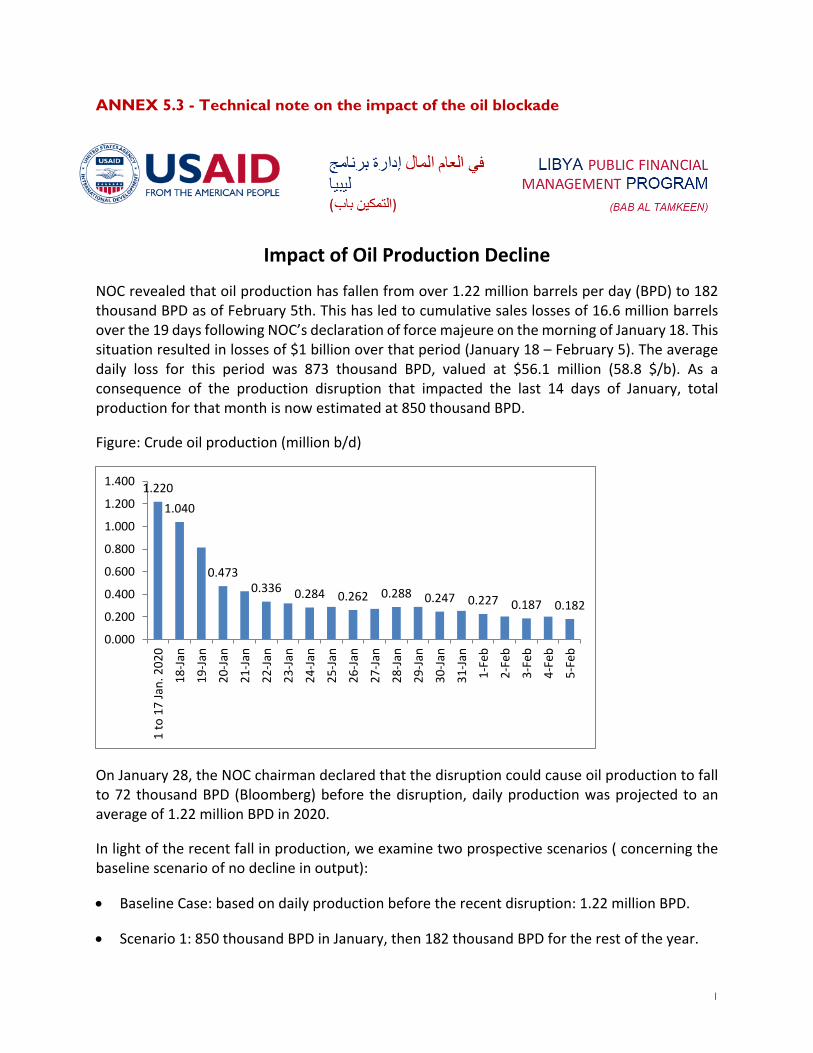
1
ANNEX 5.3 - Technical note on the impact of the oil blockade
Impact of Oil Production Decline
NOC revealed that oil production has fallen from over 1.22 million barrels per day (BPD) to 182 thousand BPD as of February 5th. This has led to cumulative sales losses of 16.6 million barrels over the 19 days following NOC’s declaration of force majeure on the morning of January 18. This situation resulted in losses of $1 billion over that period (January 18 – February 5). The average daily loss for this period was 873 thousand BPD, valued at $56.1 million (58.8 $/b). As a consequence of the production disruption that impacted the last 14 days of January, total production for that month is now estimated at 850 thousand BPD.
Figure: Crude oil production (million b/d)
On January 28, the NOC chairman declared that the disruption could cause oil production to fall to 72 thousand BPD (Bloomberg) before the disruption, daily production was projected to an average of 1.22 million BPD in 2020.
In light of the recent fall in production, we examine two prospective scenarios ( concerning the baseline scenario of no decline in output):
• Baseline Case: based on daily production before the recent disruption: 1.22 million BPD.
• Scenario 1: 850 thousand BPD in January, then 182 thousand BPD for the rest of the year.
1.2201.040
0.4730.336 0.284 0.262 0.288 0.247 0.227 0.187 0.182
0.000
0.200
0.400
0.600
0.800
1.000
1.200
1.400
1 to
17
Jan.
202
0
18-Ja
n
19-Ja
n
20-Ja
n
21-Ja
n
22-Ja
n
23-Ja
n
24-Ja
n
25-Ja
n
26-Ja
n
27-Ja
n
28-Ja
n
29-Ja
n
30-Ja
n
31-Ja
n
1-Fe
b
2-Fe
b
3-Fe
b
4-Fe
b
5-Fe
b

2
• Scenario 2: 850 thousand BPD in January, then 72 thousand BPD for the rest of the year.
Scenario Baseline Case:
Without Oil Production Cut
Scenario 1: (850,000 BPD in
January then 182,000 BPD until
the end of the year)
Scenario 2: (850,000 BPD in
January then 72,000 BPD until
the end of the year)*
Annual Average Daily BPD (thousands) 1,219 238 137 Price per barrel ($) 61.3 61.3 61.3 Annual Average Daily revenue from Oil revenue ($M) 70.2 13.7 7.9 Other daily revenue, almost entirely from FX Tax ($M) 50.8 50.8 41.6
Daily budget expenditure ($M) 92 92 92 Daily Surplus (Deficit) ($M) 29.0 (27.5) (42.5) Annual Surplus (Deficit) ($B) 10.6 (10.0) (15.5)
Notes Based on daily production on January 1, 2020
Loss based on effective
production through February
5, 2020
Loss based on NOC Chairmen comments on
January 28, 2020
* With reduced FX tax due to the decrease of imports of goods and services by the oil sector
Assuming constant expenditures, the base-line case (or return to normal production conditions scenario), yields an annual budget surplus of $10.6 billion.
Under Scenario 1, based on the assumption that oil production drops to 182 thousand BPD through the remainder of the year, the budget deficit would reach -$10 billion with constant non-oil revenues (almost entirely generated by the FX tax). This could be financed by the CBL (funded indirectly by a modest rundown in reserves) and would add to the stock of government debt. The Libyan government could not continue functioning in this manner without significant changes in expenditure levels for 2020.
Under Scenario 2, based on the assumption that oil sales drop to 72 thousand BPD through the remainder of the year, the fiscal deficit would be significantly larger -$15.5 billion, which takes into account the knock-on effect of a decrease in revenue generated by the FX tax. Under Scenario 2, the disruption is projected to lead to a drop in imports that are linked to oil production, and, based on the historical balance of payments data, that drop is projected to reduce FX tax revenue by 20%.
Assuming that the CBL chooses to at least partially finance the deficit through increased LYD monetary emissions to limit the rundown of foreign reserves, the full financing of the deficit

3
would likely be associated with a re-emergence of inflationary pressures and exchange rate depreciation. The drop in GDP associated with very low oil production, aggravated by the likely increase in the money supply required to finance the resulting fiscal deficit, could again raise inflation back to double-digit levels unless the CBL was to supply sufficient foreign exchange to finance the current level of import demand.
In the recent past, the CBL has targeted increases in the supply of foreign exchange sufficient to keep annual inflation below the 30% range - this is what transpired over the 2016-2017 period. If the government wishes to avoid this type of outcome, it would prospectively need to contemplate significant expenditure cuts by mid-way through 2020.
Instead of reducing expenditures, the government could increase the FX transactions tax to stem the deterioration of the black market exchange rate and increase non-oil revenues. This would further “lock-in” public sector dependence on the FX tax as a major source of revenue, with its accompanying negative impact on financial sector transparency and economic diversification incentives. Should currency supply bottlenecks occur, they would encourage the parallel market, adding more inflationary pressure, which is exactly what the government is trying to prevent. As a result, significantly increasing the FX transactions tax is unlikely to be effective.
With regard to the balance of payments situation, the ongoing disruption of oil production will reduce the main source of foreign exchange for the CBL. Foreign exchange inflows have already been negatively impacted by the decline of oil prices over the past year (from an average price per barrel of $70 in 2018 to $64 in 2019), and that price decline is projected to continue in 2020. This combination of factors can be expected to result in a balance of payments deficit and a reduction in foreign reserves of approximately $20.0 billion under Scenario 2. Total foreign reserves stood at $77 billion as of late 2019.
Finally, the oil blockade will induce a significant drop in GDP estimated at well over 50% under Scenario 1 and at over two-thirds of GDP under Scenario 2. (In both 2011 and 2014 oil production cuts caused a reduction in GDP of approximately 50%.) However, the projected fall in GDP will not necessarily induce a massive drop in consumption if the Government continues to pay salaries and provide subsidies out of accumulated oil revenue reserves at the CBL, or the proceeds from new borrowing. However, in such a case, the CBL will need to draw down reserves to maintain the supply of FX to fund the demand for imports. In conclusion, the prolonged oil blockade will induce a drop in GDP, exports and export receipts, and government oil revenue. However, overall national demand will continue to be high, financed largely by government expenditures (salaries). That financing will be provided by the CBL, which can be expected to generate inflationary pressures and a reduction of foreign reserves.


i
ANNEX 5.4 – Budget Execution Report
Macroeconomic and Fiscal Analysis Unit
Public Finance Bulletin Follow-up on the implementation of public financial
arrangements
Annual Calendar Review 2019

ii
Contents
Introduction ......................................................................................................................... 1
Methodology and Concepts ................................................................................................ 2
Executive Summary ............................................................................................................ 3
Total Revenue ..................................................................................................................... 4
Total Expenditures .............................................................................................................. 7
Public Debt........................................................................................................................ 12
Overall Balance & Summary ............................................................................................ 13

1
Introduction
This Bulletin reports on the implementation of Libya’s annual budget for FY 2019, which starts January 1st, 2019, and goes through December 31st, 2019. Specifically, the Bulletin presents data and analysis on both planned and actual total revenue, total expenditure, and public debt.
Bulletin is part of a strategy by the Libyan Ministry of Finance to meet local and international standards of fiscal accountability and transparency. Moreover, the statistical practices of the Ministry of Finance and the government of Libya are designed to reflect international standards, national laws, and local financial legislations.
The Bulletin was written by the Macroeconomic and Fiscal Analysis Unit under the Libyan Ministry of Finance, which was initiated under decree n°294 by the Minister of Finance. In addition to producing routine Bulletins, the Ministry of Finance also publishes Macro Fiscal and Financial statistics, as well as reports and procedures on the implementation of Libya’s annual budget. The Bulletin also supports National Accord decree n° 375 on the adoption of financial arrangements.
The Bulletin uses public finance statistics collected by the Ministry of Finance. These statistics report on the following government departments: Tax Department, Customs Department, Budget Department, Treasury Department, Financial Resources Department, and Control Department.
The Bulletin is subject to periodic revision on the accuracy of reported data and methodologies used. Amendments to the Bulletin will be made as necessary.

2
Methodology and Concepts
Total Revenues Revenue earned by the government from tax and non-tax sources during a fiscal year and also called government revenue.
Tax revenues Tax imposed on individuals and companies includes direct and indirect (i.e., sales) taxes.
Non-tax revenues
Revenue from the profits of public institutions, such as the Central Bank and telecommunication companies. This also includes revenues from services fees, stamps, customs, fines, and crossing fees collected by government ministries.
Other revenues Revenue from foreign currency fees.
Total Expenditures Government expenditures on salaries, goods and services, development, and subsidies.
Chapter One: Salaries Wages and salaries of civilians and military employees. It also includes state contributions to retirement and health insurance funds.
Chapter Two: Goods and Services
Expenditures on government activities, such as electricity, communication, and water expenditures.
Chapter Three: Capital Expenditures Development
Construction expenditures (roads, dams, ports, airports) or building public facilities (educational institutions, hospitals, and departments).
Chapter Four: Subsidies Expenditures on medicine, fuel, electricity, public lighting, hygiene, water, and sanitation.
Overall balance (Surplus or Deficit)
Fiscal Surplus: Total Revenue > Total Expenditure Fiscal Deficit: Total Revenue < Total Expenditure
Deficit financing The Central Bank issues bonds or prints money to help cover the government’s fiscal deficit. Rather than using taxes to cover the deficit, the government is borrowing from the Central Bank.

3
Executive Summary The government of Libya experienced a fiscal surplus in 2019, shown in Table 1 below. Overall, total revenue was 58,001 million LYD, while total expenditure was only 46,114 million LYD, resulting in a surplus of 11,887 million LYD. Further, total expenditure in 2019 was nearly equal to allocated expenditure (98.5%), while total revenue exceeded the estimated amount (123.9%).
Table 1: Total Government Revenues and Expenditures from 1 Jan 2019 to 31 Dec 2019 (in millions of LYD)
Estimated Actual Collection rate/ Execution %
Actual-Estimated
Total Revenues 46,800 58,001 123.9 11,201
Total Expenditures 46,800 46,114 98.5 -686
Overall Balance 0 11,887 - -
Source: Ministry of Finance’s Monthly Follow-up Reports (Budget Department, Treasury Department, Control Department, Customs Department, and Tax Department). Numbers included amounts and transfers in accordance with decrees issued by the Presidential Council of GNA during 2019.
The actual total revenue was larger than expected primarily because of rising foreign exchange revenue, but also because of growing oil revenue. However, the actual total expenditure was slightly smaller than expected due to lower payments on wages/salaries and development projects.
Public debt has also increased to nearly 80 billion LYD in 2018 (see the section on Public Debt). With rising debt balances, a fiscal surplus was driven considerably by foreign exchange fee-related revenue, and an overall static level of government expenditure, Libya faces many economic challenges. Oil revenue has been the largest source of total revenue, however having experienced years of fiscal deficits and now growing levels of public debt, traditional sources of income are insufficient to address the growing needs of Libya.
46 800 46 800
0
58001
46114
11887
0
10 000
20 000
30 000
40 000
50 000
60 000
70 000
Total revenue Total expenditure Budget surplus / deficit
Millions of LYD
Figure 1: Revenue and Expenditure 2019
Estimated
Actual

4
Total Revenue
Total revenue was 58,001 million LYD in 2019, shown in Table 2 below. This amount is higher than was estimated, due to a rise in foreign exchange revenue from an estimated 15,800 million LYD to an actual 23,447 million LYD. In addition to foreign exchange revenue, oil revenue was also larger than expected by 4,995 million LYD. The largest components of total revenues are oil revenue (54.1 percent) and foreign exchange rate revenue (40.4%), shown in Table 2 and Figure 1A below. Non-oil revenue makes up only 5.4% of total revenues.
Table 2: Government revenues by sources for 2019 (in a million LYD)
Sources Estimated revenues
Actual revenues
Collection rate %
Oil revenues 26,400 31,395 118.9
Non-oil revenues including: 4,600 3,159 68.7
Profits and Income tax 1,200 1,582 131.8
Customs revenues 800 296.0 37.0 Telecommunication revenues 750 262.0 34.9 Central Bank of Libya’s profit 300 125.0 41.7 Revenue from the sales of fuel in the local market 800 300.0 37.5 Services and other fees 750 594.0 79.2
Total oil and non-oil revenues 31,000 34,554 111.5 Revenues from foreign exchange tax 15,800 23,447 148.4 Total revenues 46,800 58,001 123.9
Source: Ministry of Finance’s Monthly follow-up reports 2019 (Budget Department, Treasury Department, Control Department, Customs Department, Tax Department)
Oil revenue, 54.1%
Non-oil revenue, 5.4%
Revenues from foreign
exchange, 40.4%
Figure 1A: Share of Total Revenue

5
1. Oil Revenues
Oil revenue was 31,395 million LYD in 2019, which is 4,995 million LYD greater than estimated. In fact, the amount of oil revenue estimated for 2019 was less than the amount of oil revenue in 2018. Oil revenue declined as expected, from 2018 to 2019, but the amount of oil revenue was still larger than the amount budgeted.
Figure 2 below shows both oil revenue and total revenue between 2010 and 2019. Both oil and total revenue peaked in 2012 and 2013, fell through 2016, and have generally increased since then. Figure 2 shows that oil revenue has historically held a significant share of total revenues (~90 or more), but less so in recent years (~54% in 2019).
2. Non-Oil Revenues
Non-oil revenue was 3,159 million LYD in 2019, which is lower than the estimated amount of 4,600 million LYD (68.7%). Most non-oil revenues came primarily from the taxes on profits and incomes, which brought in more revenue than anticipated (131.8%). All other sources of non-oil revenues were lower than expected, as shown in figure 3 below. Non-oil revenues performed anemically because of security and instability issues, but also distortions in the tax policy framework, as well as opaque and inefficient enforcement, collection, and transfer practices.
Figure 4 shows the relative share of each type of revenue source out of all non-oil revenue. Profits and income taxes provided the largest share of non-oil revenues (50%), followed by services and other fees (19%), customs fees (9%), telecommunications taxes (8%), and taxes on the central bank of Libya (4%).
0
10 000
20 000
30 000
40 000
50 000
60 000
70 000
2010 2011 2012 2013 2014 2015 2016 2017 2018 2019 2019est.
Millions of LYDFigure 2: Government Revenues 2019
Total Revenue
Oil revenue
Fin.Arr. 2019

6
1 200
800 750
300
800 750
1 582
296.0 262.0125.0
300.0
594.0
0
200
400
600
800
1 000
1 200
1 400
1 600
1 800
Tax
es a
nd fe
es o
nin
com
e fr
omec
onom
ic a
ctiv
ities
Cust
oms
reve
nue
Com
mun
icat
ions
reve
nue
Prof
its o
f the
Cen
tral
Bank
of L
ibya
Inco
me
from
sel
ling
fuel
in th
e lo
cal
mar
ket
Serv
ice
fees
and
othe
r inc
ome
Millions of LYD
Figure 3: Non-Oil Revenue 2019
Estimation for the year Actual
Profits and Income tax, 50%
Customs revenues, 9%
Telecommunication revenues, 8%
Central Bank of Libya’s profit, 4%
Revenue from the sales of fuel in the local market, 9%
Services and other fees, 19%
Figure 4: Share of Total Non-Oil Revenue
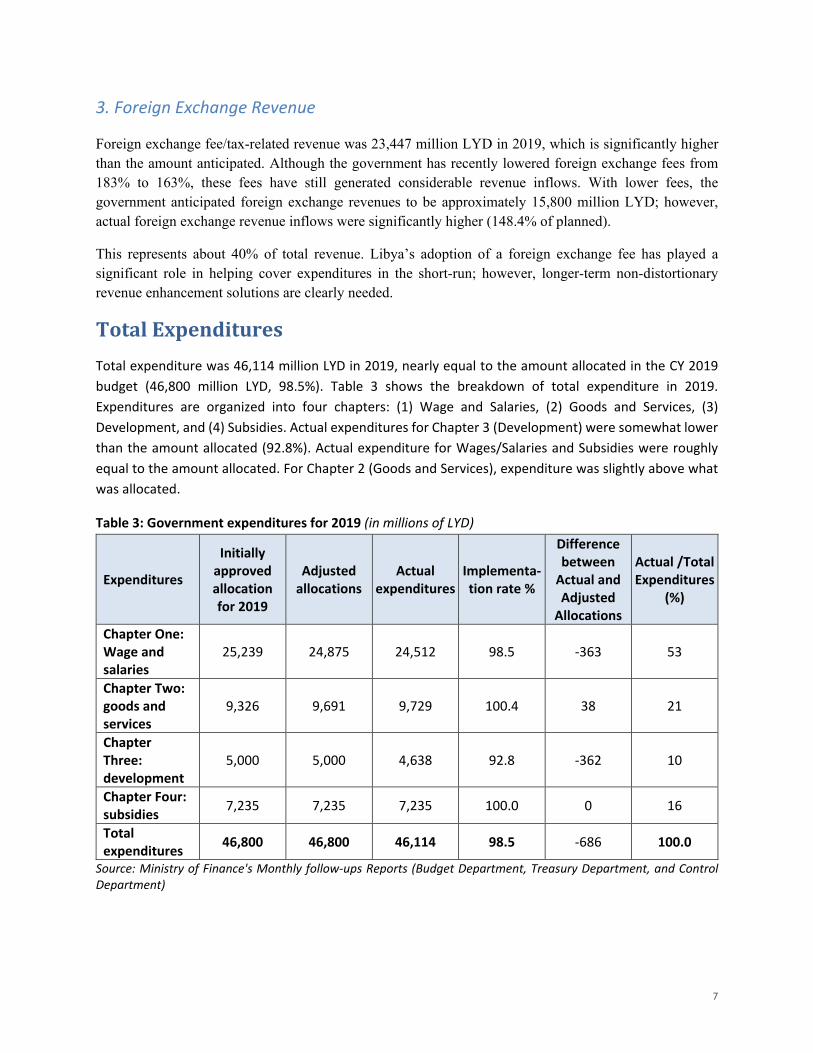
7
3. Foreign Exchange Revenue
Foreign exchange fee/tax-related revenue was 23,447 million LYD in 2019, which is significantly higher than the amount anticipated. Although the government has recently lowered foreign exchange fees from 183% to 163%, these fees have still generated considerable revenue inflows. With lower fees, the government anticipated foreign exchange revenues to be approximately 15,800 million LYD; however, actual foreign exchange revenue inflows were significantly higher (148.4% of planned).
This represents about 40% of total revenue. Libya’s adoption of a foreign exchange fee has played a significant role in helping cover expenditures in the short-run; however, longer-term non-distortionary revenue enhancement solutions are clearly needed.
Total Expenditures
Total expenditure was 46,114 million LYD in 2019, nearly equal to the amount allocated in the CY 2019 budget (46,800 million LYD, 98.5%). Table 3 shows the breakdown of total expenditure in 2019. Expenditures are organized into four chapters: (1) Wage and Salaries, (2) Goods and Services, (3) Development, and (4) Subsidies. Actual expenditures for Chapter 3 (Development) were somewhat lower than the amount allocated (92.8%). Actual expenditure for Wages/Salaries and Subsidies were roughly equal to the amount allocated. For Chapter 2 (Goods and Services), expenditure was slightly above what was allocated.
Table 3: Government expenditures for 2019 (in millions of LYD)
Expenditures
Initially approved allocation for 2019
Adjusted allocations
Actual expenditures
Implementa-tion rate %
Difference between
Actual and Adjusted
Allocations
Actual /Total Expenditures
(%)
Chapter One: Wage and salaries
25,239 24,875 24,512 98.5 -363 53
Chapter Two: goods and services
9,326 9,691 9,729 100.4 38 21
Chapter Three: development
5,000 5,000 4,638 92.8 -362 10
Chapter Four: subsidies 7,235 7,235 7,235 100.0 0 16
Total expenditures 46,800 46,800 46,114 98.5 -686 100.0
Source: Ministry of Finance's Monthly follow-ups Reports (Budget Department, Treasury Department, and Control Department)

8
Figure 6 shows the share of expenditure for each Chapter out of total expenditure in 2019. Wages and salaries represent the largest share of total expenditure (53%), followed by goods and services (21%), subsidies (16%), and development expenditure (10%). The disproportionately low share of expenditures allocated to capital spending limits the scope for improved physical/social infrastructure conditions and enhanced economic diversification opportunities; increasing the share of public spending directed towards development programs could play a helpful role in stimulating diversified private sector development and spurring urgently needed job growth.
Figure 8 shows total expenditures between 2010 and 2019. Aggregate spending peaked in 2012 and 2013, fell through 2016, and has gradually increased since. The increase in expenditures over the past few years appears to largely reflect budgetary pressures associated with heightened political economy and security instability.
Chapter One: Wage & Salaries , 53%
Chapter Two: Goods & Services, 21%
Chapter Three: Development , 10%
Chapter Four: Subsidies, 16%
Figure 6: Share of Chapter Expenditure/Total Expenditure
0
10 000
20 000
30 000
40 000
50 000
60 000
70 000
80 000
2010 2011 2012 2013 2014 2015 2016 2017 2018 2019
Millions of LYD Figure 8: Evolution of Government Expenditures

9
The next section reviews each major component of total expenditure, but overall there are a few important trends to note: (1) Recurrent expenditures (wage and salaries, goods and services, and subsidies) account for 90% of total spending, leaving only 10% for development expenditures, (2) The wage-bill represents the largest share of total expenditures (54%) (the government is still the main employer with over 1/8 million employees in 2019), and (3) Subsidies are roughly 1,000 LYD per capita, with the largest share of all subsidies spent on fuel (57%).
Chapter One: Wages and Salaries
Chapter 1 expenditures were initially budgeted at 25,239 million LYD, which was later adjusted downward slightly to 24,875 million LYD. Actual spending for the year was 24,512 million LYD (98.5% of planned). It should be noted that data coverage for public sector institutions in the Eastern region of Libya appears to be limited; and that the Ministry of Finance has recently initiated budgetary data collation processes to improve its overall data on wage and salary expenditures. Figure 9 shows wage/salary expenditures between 2010 and 2019. Again wage-bill spending had peaked in 2013 and fallen through 2016 and then spiked again in recent years.
Chapter Two: Goods and Services
Expenditures on Goods and Services represented (21%) of total spending in 2019. The initial allocation of funding in this area represented 9,326 million LYD, later adjusted upwards to 9,691 million LYD. Actual spending was even greater at 9,729 million LYD (100.4% of planned expenditures).
Figure 10 shows the goods and services expenditure between 2010 and 2019. Goods and services expenditure peaked in 2012, fell through 2014, and has increased steadily since. Total expenditure on goods and services between 2010 and 2013 was significantly higher on average than between 2014 and 2019.
24 51224 875
0
5 000
10 000
15 000
20 000
25 000
30 000
2010 2011 2012 2013 2014 2015 2016 2017 2018 2019 2019est.
Millions of LYD Figure 9: Salaries
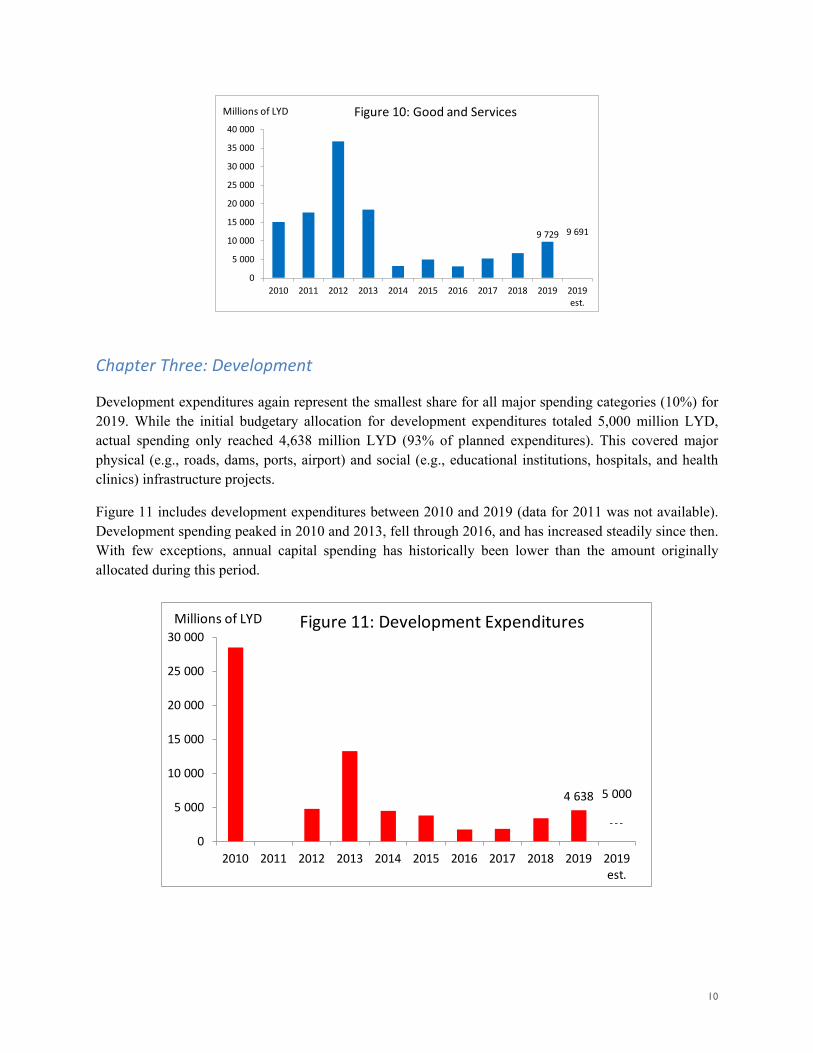
10
Chapter Three: Development
Development expenditures again represent the smallest share for all major spending categories (10%) for 2019. While the initial budgetary allocation for development expenditures totaled 5,000 million LYD, actual spending only reached 4,638 million LYD (93% of planned expenditures). This covered major physical (e.g., roads, dams, ports, airport) and social (e.g., educational institutions, hospitals, and health clinics) infrastructure projects.
Figure 11 includes development expenditures between 2010 and 2019 (data for 2011 was not available). Development spending peaked in 2010 and 2013, fell through 2016, and has increased steadily since then. With few exceptions, annual capital spending has historically been lower than the amount originally allocated during this period.
9 729 9 691
0
5 000
10 000
15 000
20 000
25 000
30 000
35 000
40 000
2010 2011 2012 2013 2014 2015 2016 2017 2018 2019 2019est.
Millions of LYD Figure 10: Good and Services
4 638 5 000
0
5 000
10 000
15 000
20 000
25 000
30 000
2010 2011 2012 2013 2014 2015 2016 2017 2018 2019 2019est.
Millions of LYD Figure 11: Development Expenditures

11
Chapter Four: Subsidies
Subsidy-related expenditures represented 16% of total spending for 2019. Expenditures in this area were budgeted at 7,235 million LYD, and actual spending approximated this amount. Figure 12 demonstrates subsidy expenditure patterns between 2010 and 2019. Annual spending in this area peaked in 2012 and 2014, fell through 2016, and has again risen slightly since.
22%
57%
11%
6% 4%Medicine
Fuel
Electricity and publiclightingHygiene
Water and sanitation
Figure 13: Subsidies Expenditure Distribution
7 235 7 235
0
2 000
4 000
6 000
8 000
10 000
12 000
14 000
2010 2011 2012 2013 2014 2015 2016 2017 2018 2019 2019est.
millions of LYD Figure 12: Subsidies

12
The government provides subsidies for medicine, fuel, electricity/public lighting, hygiene, and water and sanitation. Figure 13 shows the share of total subsidy expenditure, which each category represents. Fuel subsidies account for the largest share (57%), followed by medicine (22%), electricity (11%), hygiene (6%), and water and sanitation (4%).
While the 7 billion LYD in public sector subsidy expenditures equals roughly 1,000 LYD per capita, these expenditures do not appear to have played an effective role in facilitating adequate provision/coverage of critical infrastructural and social services. This underscores the importance of re-evaluating the overall soundness of utilizing untargeted subsidy programs as a centerpiece of the public sector’s social stabilization strategy. It also further illustrates the importance of examining how best to calibrate the overall breakdown of spending across major expenditure categories; in a manner that will facilitate the more effective provision of vital physical and social infrastructure and related social services to the Libyan population.
Public Debt
Although the government registered a fiscal surplus for 2018 and 2019, it currently holds a significant volume of public debt (data for 2019 not available yet), as indicated in figure 15 below. In 2018, the combined debts of the Government of National Accord and Eastern governments totaled over 80 billion LYD. Debt Projections for 2019 are even higher (more than 90 billion LYD). To finance the debt, the Government of Libya has turned to its central bank to provide accommodative fiscal financing support.
0
20
40
60
80
100
2012 2013 2014 2015 2016 2017 2018 Q32019
Billions of LYD Figure 15: Debt
GNA Eastern Government
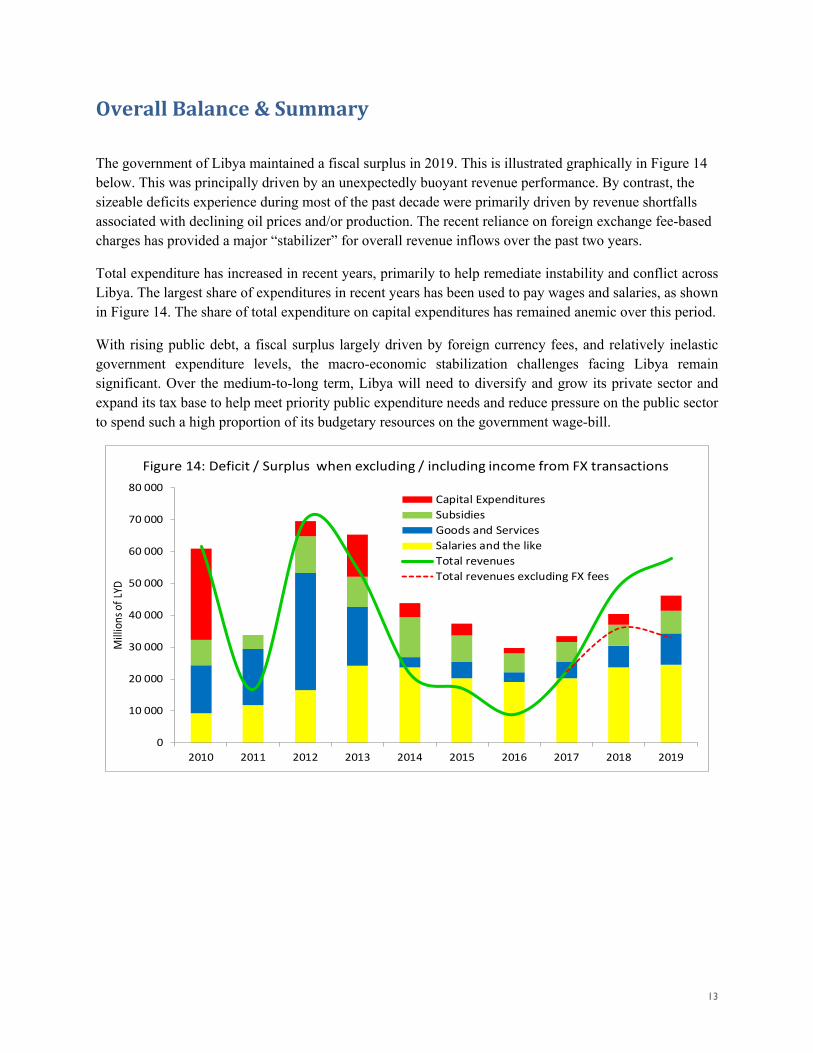
13
Overall Balance & Summary
The government of Libya maintained a fiscal surplus in 2019. This is illustrated graphically in Figure 14 below. This was principally driven by an unexpectedly buoyant revenue performance. By contrast, the sizeable deficits experience during most of the past decade were primarily driven by revenue shortfalls associated with declining oil prices and/or production. The recent reliance on foreign exchange fee-based charges has provided a major “stabilizer” for overall revenue inflows over the past two years.
Total expenditure has increased in recent years, primarily to help remediate instability and conflict across Libya. The largest share of expenditures in recent years has been used to pay wages and salaries, as shown in Figure 14. The share of total expenditure on capital expenditures has remained anemic over this period.
With rising public debt, a fiscal surplus largely driven by foreign currency fees, and relatively inelastic government expenditure levels, the macro-economic stabilization challenges facing Libya remain significant. Over the medium-to-long term, Libya will need to diversify and grow its private sector and expand its tax base to help meet priority public expenditure needs and reduce pressure on the public sector to spend such a high proportion of its budgetary resources on the government wage-bill.
0
10 000
20 000
30 000
40 000
50 000
60 000
70 000
80 000
2010 2011 2012 2013 2014 2015 2016 2017 2018 2019
Mill
ions
of L
YD
Capital ExpendituresSubsidiesGoods and ServicesSalaries and the likeTotal revenuesTotal revenues excluding FX fees
Figure 14: Deficit / Surplus when excluding / including income from FX transactions

1
ANNEX 5.5 – MACRO-FISCAL DEVELOPMENT MONTHLY REPORT
(January -March 2020)


Libya Macro Fiscal Developments Monthly Report, January 2020
DISCLAIMER: THE AUTHOR’S VIEWS EXPRESSED IN THIS PUBLICATION DO NOT NECESSARILY REFLECT THE VIEWS OF THE UNITED STATES AGENCY FOR INTERNATIONAL DEVELOPMENT OR THE UNITED STATES GOVERNMENT.
MACRO FISCAL UNIT TEAM 1
لیبیا في العام المال إدارة برنامج
( التمكین باب )
LIBYA PUBLIC FINANCIAL MANAGEMENT PROGRAM
(BAB AL TAMKEEN)
Overview
Uncertainty about oil production (blockade) and price (Coronavirus) poses important fiscal risks.
The risk of a return to the reemergence of a large balance of payments gap, as well as a fiscal deficit, are quite significant.
Significant cuts in expenditure will, in all likelihood, need to be carried out to avoid a sharp drop in foreign exchange reserves.
After six months of relatively stable oil production that stood at 1.220 million barrels per day (BPD) at mid-January, the closure of loading and export ports on January 17th necessitated a gradual halt in production, due to a lack of available storage capacity. Following this blockade, production gradually declined to 255 thousand BPD at the end of January, which lowered average January production to 850 thousand BPD. Prior to the blockade, oil revenues were expected to be around LYD 32 billion in 2020 (close to 2019 figures). This assumed average production of 1300 thousand BPD and was based on an anticipated slight decline in the price of oil (-4.3 percent, or $61.3 per barrel (PB) according to the January 2020 IMF WEO update). If the blockade were to continue, it would have significant implications on exports and the balance of payments situation, in addition to forcing a sharp reduction in government revenues.
The risk of returning to a fiscal deficit in 2020 is significant
The revenue losses for January equaled $746 million (LYD 1050 million). If the blockage were to continue, and assuming oil prices remain at $55/barrel, the budget could begin to incur a deficit as early as April. In addition to the drop in oil revenues, the production cut will lead to a reduction in imports of goods and services, and a resulting decrease in FX tax revenues. (See table below).
Unless a significant drop in imports occurs, a significant current account imbalance is expected to emerge in 2020
If average annual oil production remains under 1200 BPD, which is now likely, a current account deficit will re-emerge for the first time since 2016. Unless drastic cuts in imports were to occur, and if oil prices remain at $55/barrel (taking into account as well the possible impact of the coronavirus issue on economic activity at the international level), a current account deficit of about LYD 0.8 billion could be expected to emerge, under the assumption that the blockade was to end in February. It could reach LYD 3.2 billion if production only resumes at the end of March. (See table below).
A decrease in foreign exchange reserves is likely
This situation will in all likelihood lead to a significant drop in foreign exchange reserves, which had remained quite stable in 2019 (at about $77 billion). This stability was due to relatively steady oil revenues (which experienced only a 6 percent decline in relation to 2018 figures). In addition, the fees on FX transactions effectively raised the price of the dollar and helped control demand, thereby helping avert the need to draw down on foreign exchange reserves. The oil blockade, if maintained, leaves three alternatives: (i) increase the level of the FX fees to meet foreign exchange demand and limit recourse to the parallel market, (ii) draw down foreign exchange reserves, or (iii) allow parallel market operations to control FX supply/demand trends (which will likely lead to a sharp depreciation of the dinar, and generate additional short-run inflationary pressures. If the blockade were to continue until June, the level of reserves could be expected to fall towards its lowest levels since 2016 ($63 billion). (See the table below).
In terms of utilizing the FX tax for purposes of helping restabilize fiscal and balance of payment performance, a 20-basis point increase in the FX fee rate - that is a return to a 183% fee rate - would generate just under LYD

Libya Macro Fiscal Developments Monthly Report, January 2020
DISCLAIMER: THE AUTHOR’S VIEWS EXPRESSED IN THIS PUBLICATION DO NOT NECESSARILY REFLECT THE VIEWS OF THE UNITED STATES AGENCY FOR INTERNATIONAL DEVELOPMENT OR THE UNITED STATES GOVERNMENT.
MACRO FISCAL UNIT TEAM 2
لیبیا في العام المال إدارة برنامج
( التمكین باب )
LIBYA PUBLIC FINANCIAL MANAGEMENT PROGRAM
(BAB AL TAMKEEN)
3 billion. It would of course also result in further depreciation of the dinar. This increase in budgetary revenues would only maintain fiscal balance through May, under the assumptions referenced earlier (please see the table below).
At the same time, it should be noted that with foreign exchange reserves currently standing at 3.5 years of annual imports for 2019, the Central Bank of Libya (CBL) can almost certainly afford to draw significantly on its reserves for stabilization purposes. This would, in turn, imply a reserve drawdown by $11 billion by June 2020 to $66 billion. In this regard, the CBL will probably be very reluctant to let reserves fall below 2016 levels ($63.1 billion).
Significant cuts in spending should be considered in 2020
If the contraction of oil production and related fiscal revenues continues over the coming months, the government will need to make significant spending cuts. This reduction should not focus exclusively on capital spending (although a drop of as much as 45 billion dinars in 2020 can be anticipated if current conflict-laden conditions continue to inhibit public investment spending). It will, at the same time,
be important to adjust/reign in wage & salary and subsidy expenditures in order to decrease spending pressures.
A return to stagflation cannot be ruled out
In January, the dinar depreciated by about 6 percent on the parallel market, increasing the spread with the FX Fee-based rate from 0.32 dinars to 0.56, its highest level since December 2018. If this upward trend continues, inflation will return to two-digit levels in 2020, within the context of declining GDP performance. It will also create stronger incentives for accessing FX resources on a preferential basis for possible arbitrage purposes. This signals that an effective adjustment policy may, in the end, represent a mix of the reserve drawdown and FX fee uptick options presented above. It also tends to underscore the longer-term importance of initiating the design of far-reaching macro-structural reforms, which can reduce long-run dependence on the oil sector from both economic growth and a fiscal balance perspective, as well as laying the groundwork for the eventual unification of the exchange rate.
Risk Profile of Fiscal and External Balances Given Oil Output and Price Uncertainty
Fiscal Risk (oil production side)Oil blockade until the end of February
Oil blockade until the end
of March
Oil blockade until the end
of April
Oil blockade until the end
of May
Oil blockade until the end
of June
Daily K BPD (2020 average) 1 128 1 029 931 833 735Average Price per barrel ($) (IMF WEO Jan. 20) 61.3 61.3 61.3 61.3 61.3Estimated 2020 oil revenues (Billion LYD) 30.0 27.4 24.8 22.2 19.6Estimated 2020 non-oil revenues (Billion LYD) 25.3 24.6 23.9 23.3 22.6Expenditures (Billion LYD) 48.0 47.5 47.0 46.5 46.0Annual Surplus (Deficit) (Billion LYD) 7.3 4.5 1.7 -1.1 -3.9Current Account (Billion LYD) 3.0 0.2 -2.5 -5.3 -7.8Change in Foreign Exchange Reserves (Billion USD) -1.6 -3.6 -5.5 -7.4 -9.4
Fiscal Risk (including oil price side)Daily K BPD (2020 average) 1 128 1 029 931 833 735Average Price pb ($) (Futures prices as of Feb.10) 55.0 55.0 55.0 55.0 55.0Estimated 2020 oil revenues (Billion LYD) 26.9 24.6 22.2 19.9 17.6Estimated 2020 non-oil revenues (Billion LYD) 25.3 24.6 23.9 23.3 22.6Expenditures (Billion LYD) 48.0 47.5 47.0 46.5 46.0Annual Surplus (Deficit) (Billion LYD) 4.2 1.7 -0.8 -3.3 -5.9Current Account (Billion LYD) -0.8 -3.2 -5.6 -7.9 -10.2Change in Foreign Exchange Reserves (Billion USD) -4.4 -6.1 -7.7 -9.4 -11.1

Libya Macro Fiscal Developments Monthly Report, February 2020
DISCLAIMER: THE AUTHOR’S VIEWS EXPRESSED IN THIS PUBLICATION DO NOT NECESSARILY REFLECT THE VIEWS OF THE UNITED STATES AGENCY FOR INTERNATIONAL DEVELOPMENT OR THE UNITED STATES GOVERNMENT.
LIBYA PUBLIC FINANCIAL MANAGEMENT (LPFM) MACRO FISCAL UNIT TEAM 1
Overview
Fiscal risks sharply increased in February and could worsen in March due to the oil blockade and Coronavirus
Further dinar depreciation and intensified pressures on international reserves expected
Internal and External factors could lead to the economic recession and higher inflation
Fiscal risks increased as a result of oil blockade and price shrinks Oil revenues decreased by 68% to LYD 779 million in February, from LYD 2,471 million in January. This decline resulted principally from an 82% drop in production (from 850 thousand barrels per day (BPD) in January to 154 thousand BPD in February) and a 13% drop in the oil price (from $63.6 per barrel (PB) to $55.0 bp). If the oil blockade continues, March revenues are also expected to be drastically affected. In this regard, average production is not expected to exceed 95 thousand BPD (a further 38% drop), and the average price per barrel is expected to be around $35 (a further 36% drop). This could lower March oil revenues below the LYD 300 million levels. Non-oil revenues, excluding foreign exchange fees, rose sharply in February to LYD 417 million; but this is partly due to a catch-up in 2019 on communications revenues, as well as an improvement in tax revenues collection. Revenues from foreign exchange fees increased sharply by 54% and recouped the loss due to the oil blockade. However, these upswings not expected to continue. While this increase helps budgetary performance temporarily, it underscores the sharp deterioration of the overall economic situation.
Increased speculation threatens the Dinar Indeed, the depreciation of the dinar as a result of the oil blockade has led to increased speculation: while in 2019, monthly purchases of foreign exchange for personal purposes averaged 162 million, they jumped to 495 million in January and 910 million in February, generating more than half of the revenue associated with these fees (LYD 2.1 billion out of 3.7 billion in February). While in 2019, purchases of dollars by individuals represented 25% of those provided for trade finance, this ratio rose to 131% in February - despite a 29% increase in purchases of dollars for trade finance, also presumably in part for speculative reasons.
As long as the oil blockade continues, dollar inflows will not be sufficient to meet demand, unless foreign exchange reserves are drawn down significantly. In February alone, foreign exchange sales amounted to $2.54 billion, while the inflow of dollars due to oil revenues was limited to $0.55 billion. Under these conditions, the risk of further depreciation of the dinar is significant. While the spread between the official exchange rate (plus tax) and the parallel market rate had decreased to 0.3 dinars by the end of 2019, it had doubled to 0.6 dinars by the end of February - and could approach 1.0 dinar in March.
Limitations on foreign currency sales are twofold inflationary After the significant volume of speculative sales transactions for foreign exchange in January and February, decisions were taken to limit currency sales to slow the decline in foreign exchange reserves. Such a decision to limit the sale of foreign exchange subject to the fees would lead to a decrease in revenue inflows from these fees. This would further reinforce the negative impact of the projected 15% decrease in imports on budgetary revenues, which, ceteris paribus, would lead to an LYD 4 billion decrease in revenue. In addition, these developments could also generate significant additional inflationary pressures due to : (i) the consequent depreciation of the dinar (ii) the resulting shortage of imported products and related supply bottlenecks. On the other hand, maintaining the spread at 0.3 dinars with a parallel market exchange rate of 4.5 LYD/$ would require an increase in the tax rate to 198%. If such an increase were to be adopted for the second quarter, it would generate an LYD 2.8 billion increase in revenue over the remainder of the year.
Baseline scenario - stagflation
0.200.300.400.500.600.700.800.901.00
Jan-
19
Feb-
19
Mar
-19
Apr-
19
May
-19
Jun-
19
Jul-1
9
Aug-
19
Sep-
19
Oct
-19
Nov
-19
Dec
-19
Jan-
20
Feb-
20
Mar
-20
Spread between the exchange rate on the parallel market and the official rate + FX fees

Libya Macro Fiscal Developments Monthly Report, February 2020
DISCLAIMER: THE AUTHOR’S VIEWS EXPRESSED IN THIS PUBLICATION DO NOT NECESSARILY REFLECT THE VIEWS OF THE UNITED STATES AGENCY FOR INTERNATIONAL DEVELOPMENT OR THE UNITED STATES GOVERNMENT.
LIBYA PUBLIC FINANCIAL MANAGEMENT (LPFM) MACRO FISCAL UNIT TEAM 2
As a result of the expected sharp decline in revenues, projected expenditures for 2020 have been cut by 16 percent to LYD 38.5 billion. Of course, fiscal austerity will lead to a decline in non-oil GDP. Under the most optimistic hypothesis (i.e., a resumption of oil production at the end of March), real GDP could fall by more than 10% in 2020. Moreover, this does not take into account the prospective e contractionary impact of the COVID-19 pandemic, which could significantly curtail activities in the non-oil sector. The overall impact of this confluence of negative external factors will likely be stagflationary.
Fiscal risk has risen sharply, but debt is not expected to increase. In addition to the continuing oil blockade, the failure of the OPEC+ negotiations and the further decline in world oil demand due to the worsening the COVID-19 pandemic have indeed led to a sharp downward revision of oil price forecasts, and an average oil price below $40 is now projected for 2020. Under such a scenario, and even if the oil blockade ended in March, oil revenues would be projected at around 16 billion, i.e., only half of what was expected at the beginning of the year (see table below). Under an optimistic assumption of an end to the oil blockade early in the second quarter, the fiscal surplus would virtually disappear. However, assuming the oil blockade were to last longer, the LYD 11.5 billion fiscal surpluses generated in 2019 could be utilized to partially finance the deficit.
The external risk is higher
Another point linked to the oil blockade and weighing on foreign exchange reserves is the increase in refined products imports. In 2019, about half of the refined products consumed were imported. As a result of the shutdown of refineries in the country, the additional amount of imports of refined products was expected to be around LYD 250 million in February. Assuming an average oil price of $38.5 in 2020, the additional imports would be about LYD 174 million per additional month that the oil blockade lasts.
Already, it is highly likely that the current account will fall into a deficit position for the first time since 2016, even if the oil blockade were to end now. Within this context, foreign exchange reserves, which reached $76 billion at the end of December 2019, would fall by more than $7 billion. They would thus drop below their 2017 level, thereby erasing the gains of the past two years. Even under the optimistic assumption of a recovery in production by the beginning of the second quarter, the level of reserves would only be 6 billion above the low point reached in 2016 Within this context the government will need to restrain expenditures, focusing on continuing wage/salary payments and meeting vital expenditure needs from FX tax revenues and past surpluses. Under these circumstances, the CBL will have to draw down on FX reserves to limit inflationary pressures and be prepared to use $1.1 billion of its reserves for each month that the oil blockade continues.
Fiscal and External Balances' risks given Oil output and Price Uncertainty
*Oil price forecast is based on Brent Crude Oil Futures quotes as of March 17.

لیبیا في العام المال إدارة برنامج
( التمكین باب )
Libya Macro Fiscal Developments Monthly Report, March 2020
DISCLAIMER: THE AUTHOR’S VIEWS EXPRESSED IN THIS PUBLICATION DO NOT NECESSARILY REFLECT THE VIEWS OF THE UNITED STATES AGENCY FOR INTERNATIONAL DEVELOPMENT OR THE UNITED STATES GOVERNMENT.
LIBYA PUBLIC FINANCIAL MANAGEMENT (LPFM) MACRO FISCAL UNIT TEAM 1
Overview
Libya currently experiencing major exogenous shocks that could lead to a fall of up to 85 percent in Government revenue
Exceptional circumstances will require an equally exceptional use of monetary policy
Libya is facing a concurrence of violent exogenous shocks which has happened twice in the last decade
Fiscal risks continue to increase. In addition to the costs of the war and its impact on oil production, Libya is now facing the consequences of the COVID-19 pandemic. Oil production fell by a further 34 percent in March to an average of 100,000 barrels per day (BPD), bringing the average production for the first quarter down to only 368,000 BPD. Moreover, as a result of lower global demand, the oil price also fell a further 40 percent to $33.0 BPD in March, with the first quarter average price at $50.5 BPD. Finally, emergency spending due to the conflict is estimated at LYD 5 billion in the 2020 Financial Arrangement (i.e., the annual budget); however, the impact of war is much greater as large parts of the economy remain inactive. These three factors are cumulative and will most likely affect the economy well into next year as well.
Sharp impact on production
Estimated impacts of the COVID-19 crisis on GDP growth in the world vary from a 3-10 point reduction. In Libya, GDP depends heavily on oil production (average share of 65%). In 2011, oil production decreased by 70% (from 1.7 to 0.5 million BPD), and GDP decreased by 49% (from 93 to 47 billion LD). This year’s oil production is expected to decrease between 40% (Hypothesis H1 detailed in the table below) and 87% (H4), depending on the blockade and the COVID-19 crisis duration. Therefore, GDP is expected to decrease by 28% if the blockade stops in May, and by 61% if it lasts up to the end of the year.
With the COVID-19 crisis, oil prices dropped and have impacted economic aggregates (valued at current prices). However, real growth is also affected by the decrease of activity in the private sector, which represents just under 20% of Libyan GDP (excluding the private share in the oil sector). With a 10% decrease in private activity, the total decrease of GDP in 2020 compared to 2019, due to the combined effect of both shocks, would most likely vary between 30% (H1) and 63% (H4), depending on their duration.
The impact of decreased oil revenue on Government revenue
The impact of the COVID-19 on Government revenues is principally due to the resulting lower prices in crude oil since taxes represent a very small contribution to the budget (4%). Estimates for 2020, shown in the table below, are based on the following assumptions:
- A decrease in production, due to the oil blockade, to 90K BPD in April and during the remainder of the blockade period. The average monthly production was 850K BPD in January, 155K in February, and 100K in March. Production would pick up gradually after the blockade (under this hypothesis), reaching the 1000K bpd level. In this regard, the pre-blockade level is unlikely to be reached this year, even if the oil blockade were to end soon.
- A decrease in the price of oil. (This will be impacted by the COVID-29 crisis as well as other factors (economic downturn, OPEC+ negotiations, political/security environment).
The estimation of Government revenues depends heavily on the timing of the end of the blockade, as well as the duration and severity of the COVID-19 crisis. Under each scenario, the impact of the blockage exceeds the price effects.
In the worst-case scenario (H4 - under which the blockade lasts until the end of the year, and the COVID-19 crisis extends into September), revenues are estimated at $5.9 billion. These would cover only 20% of expenditures for 2020. The resulting fiscal deficit would be covered by CBL through local currency financing (principally

لیبیا في العام المال إدارة برنامج( التمكین باب )
Libya Macro Fiscal Developments Monthly Report, March 2020
DISCLAIMER: THE AUTHOR’S VIEWS EXPRESSED IN THIS PUBLICATION DO NOT NECESSARILY REFLECT THE VIEWS OF THE UNITED STATES AGENCY FOR INTERNATIONAL DEVELOPMENT OR THE UNITED STATES GOVERNMENT.
LIBYA PUBLIC FINANCIAL MANAGEMENT (LPFM) MACRO FISCAL UNIT TEAM 2
for wage payments). However, the CBL will under this scenario need to use nearly $18 billion in FX reserves to finance the current account deficit; in order to finance the importation of the goods needed to meet the demand generated by envisaged government expenditures. This would be required to avoid inflationary pressure and parallel market expansion.
Under the best-case scenario (H1 -under which the blockade ends in May, and the COVID-19 crisis winds down in June), revenues would cover about 40% of expenditures. This would result in an LYD 23.4 billion deficit to be covered by CBL. In this case, a much lower $9 billion drawdown of reserves would be required.
Given the magnitude of these shocks the central bank will likely need to ease monetary policy
Most western economies and oil-exporting and emerging countries have increased central bank refinancing of the economy and delayed service debt by private borrowers in response to the contractionary pressures associated with the COVID-19 crisis. In the case of Libya, any quantitative easing from the CBL would inevitably be followed by a drawdown of FX reserves, because of the high import content of local demand. Indeed, if the COVID-19 pandemic and the oil blockade last for an extended
timeframe, the LBC should be prepared to use part of its Forex reserves for the import of vital goods. Otherwise, the dinar would depreciate in the parallel market, and inflation could again reach double digits.
The CBL could increase its deficit financing for the budget in part by using surpluses from the FX tax. It is important to note in this regard that the CBL and the government currently have an arrangement in place which mandates that only LYD 2.1 billion will be transferred to the 2020 budget, specifically to finance capital expenditures ( which have otherwise been cut from 5 billion LYD in 2019 to 2.1 billion LYD in 2020). Remaining revenues from the FX tax will be subject to further discussions between the Government and the CBL.
In any case, the prospective duration of COVID-19 – which is quite unclear at the moment - could change the current macro-fiscal rules of the game, and force the Government to opt for a more unconventional mix of adjustment policies. Under less optimistic scenarios, this could require major incremental CBL financing, that would need to be followed by a drawdown on Forex reserves to meet additional import demand.
Prospective Macro-Fiscal Impact of Major Exogenous Shocks
CBL funding increased according to the duration of the crisis
Blockade end May
Coronavirus end June
Blockade end June
Coronavirus end July
Blockade end July
Coronavirus end August
Blockade end December
Coronavirus end
SeptemberH1 H2 H3 H4
Daily K BPD (2020 average) 1220 650 450 350 200Average Oil price per barrel ($) 61.3 43 41 39 37Estimated 2020 oil revenues (Billion LYD) 32 6 12.1 8.0 5.9 3.2Estimated 2020 non-oil revenues (Billion LYD) 3.2 3.2 3.0 2.9 2.8 2.7Total revenues 35.7 9.2 15.1 10.9 8.7 5.9Expenditures (Billion LYD) 38.5 38.5 38.5 38.5 38.5 38.5Government deficit (Billion LYD) 2.8 29.3 23.4 27.6 29.8 32.6Domestic Financing 2.8 29.3 23.4 27.6 29.8 32.6
Old Balance from the year 2019 (Billion LYD) 0.5 0.5 0.5 0.5 0.5 0.5Fx tax (Billion LYD) 2.1 2.1 2.1 2.1 2.1 2.1CBL Funding (Billion LYD)* 0.2 26.7 20.8 25.0 27.2 30.0
Government revenue losses estimate for 2020 (Billion LYD)
Without blockade without
Coronavirus
2020 Budget