usb mini spectrum analyzer user’s guide tsa5g35
TRANSCRIPT

67-15233 34th
Ave.
Surrey, BC V3S 2T7
604-637-2167
Page 1 of 21
USB Mini Spectrum Analyzer User’s Guide
TSA5G35
Triarchy Technologies, Corp.
67-15233 34th
Ave.
Surrey, BC V3S 2T7
604-637-2167
Page 2 of 21
USB Mini Spectrum Analyzer User’s Guide
Copyright Notice
Copyright © 2011 Triarchy Technologies, Corp. All rights reserved.
Initial Version November 2011
Documentation version 2.3
No part of this publication may be reproduced, transmitted, transcribed, stored in a retrieval system, or translated into
any language or computer language, in any form or by any means, electronic, mechanical, magnetic, optical, chemical,
manual, or otherwise, without the prior written permission of Triarchy Technologies, Corp.
Technical Support
For technical support, please call 1-604-637-2167, send email to [email protected], or visit our website at
http://www.triarchytech.com
67-15233 34th
Ave.
Surrey, BC V3S 2T7
604-637-2167
Page 3 of 21
Table of Contents
1 GETTING STARTED .................................................................................................4
1.1 INSTALL PC APPLICATION ..................................................................................................................................4
1.2 UNINSTALL PC APPLICATION: .............................................................................................................................9
1.3 SYSTEM CONNECTION.....................................................................................................................................10
2. OPERATIONS .......................................................................................................10
2.1 SIGNAL PARAMETERS .....................................................................................................................................10
2.2 FREQUENCY SETTING......................................................................................................................................12
2.3 SPAN SETTING.............................................................................................................................................12
2.4 AMPLITUDE SETTING ......................................................................................................................................13
2.5 SWEEP TIME SETTING.....................................................................................................................................14
2.6 TRACE SELECTION ..........................................................................................................................................14
2.7 CURRENT TRACE............................................................................................................................................15
2.8 AVERAGE TRACE............................................................................................................................................15
2.9 MAX TRACE .................................................................................................................................................15
2.10 DENSITY MEASUREMENT...............................................................................................................................15
3. MEASUREMENT SUPPORT FEATURES .................................................................16
3.1 SELECT MEASUREMENT CURVE .........................................................................................................................16
3.2 MARKER .....................................................................................................................................................16
3.3 BANDWIDTH MEASUREMENT ...........................................................................................................................17
3.4 ZOOM-IN ....................................................................................................................................................18
3.5 IMAGE HARDCOPY .........................................................................................................................................20
3.6 CURRENT CURSOR COORDINATES ON DISPLAY ......................................................................................................21

67-15233 34th
Ave.
Surrey, BC V3S 2T7
604-637-2167
Page 4 of 21
1 Getting Started
1.1 Install PC Application
System Requirements:
To use this USB mini spectrum analyzer, your system must meet the following minimum requirements:
Windows XP, Windows 7, or Windows Vista:
-- 1 Gigahertz (GHz) or faster 32-bit (x86) or 64-bit (x64) processor
-- 1 Gigabyte (GB) RAM (32-bit) or 2 GB RAM (64-bit)
-- 100 MB hard disk space (Buffered data may need extra space)
Insert CD into the computer, open the USB_APP folder at CD root folder, and click the setup.exe to install
software. When you see the installation window, click “Next”. Please see Figure 1
Figure 1 Installation View
Choose the proper installation folder, and then click “Next”. Please see Figure 2

67-15233 34th
Ave.
Surrey, BC V3S 2T7
604-637-2167
Page 5 of 21
Figure 2 Select Installation Folder
Click “Next” to install program, a warning window may pop up about unknown publisher, which can be
ignored. Please click “YES” to continue, then see Figure 3
Figure 3 Start Installation

67-15233 34th
Ave.
Surrey, BC V3S 2T7
604-637-2167
Page 6 of 21
After the program is successfully installed, you will get the message stating the Intallation
Complete, ,, please see Figure 4, then click “Close”to close the installation program.
Figure 4 Successfully Installed
You may open the Windows Explorer to find the program folder where application is installed, the folder is
C:/Triarchy Tech and sub folder is /TSA5G35 USB mini spectrum analyzer. Please see Figure 5.
Figure 5 Installation Folder View
67-15233 34th
Ave.
Surrey, BC V3S 2T7
604-637-2167
Page 7 of 21
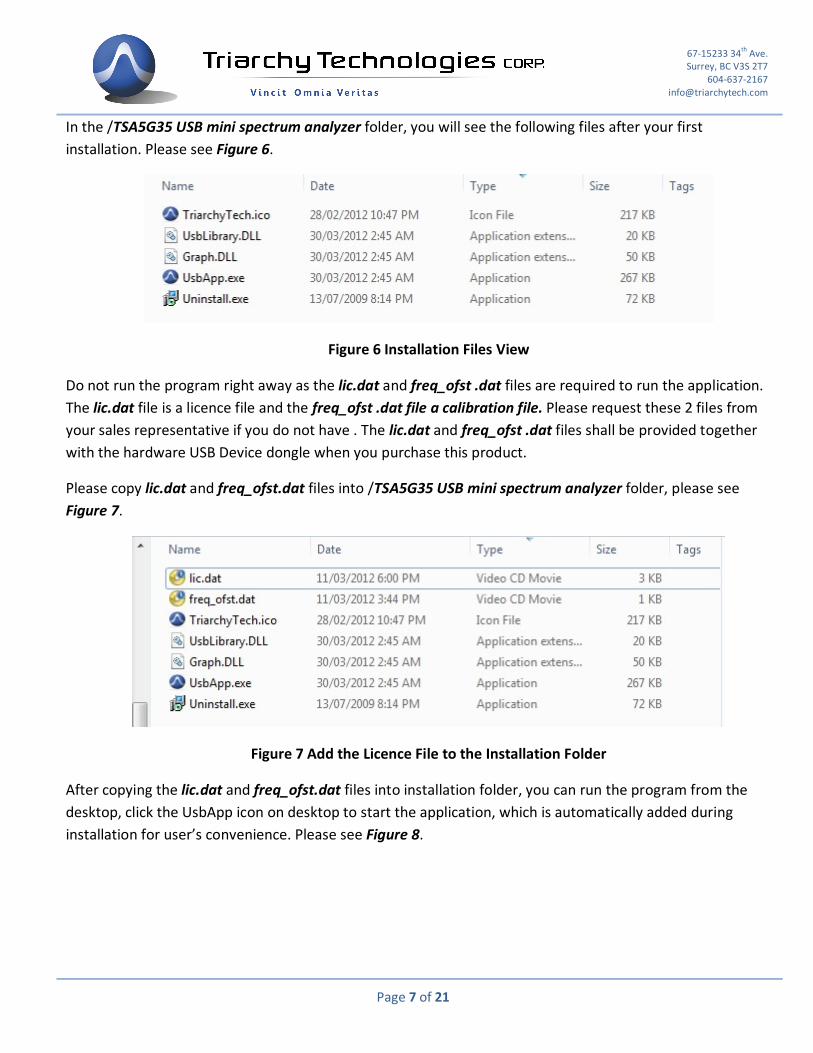
In the /TSA5G35 USB mini spectrum analyzer folder, you will see the following files after your first
installation. Please see Figure 6.
Figure 6 Installation Files View
Do not run the program right away as the lic.dat and freq_ofst .dat files are required to run the application.
The lic.dat file is a licence file and the freq_ofst .dat file a calibration file. Please request these 2 files from
your sales representative if you do not have . The lic.dat and freq_ofst .dat files shall be provided together
with the hardware USB Device dongle when you purchase this product.
Please copy lic.dat and freq_ofst.dat files into /TSA5G35 USB mini spectrum analyzer folder, please see
Figure 7.
Figure 7 Add the Licence File to the Installation Folder
After copying the lic.dat and freq_ofst.dat files into installation folder, you can run the program from the
desktop, click the UsbApp icon on desktop to start the application, which is automatically added during
installation for user’s convenience. Please see Figure 8.

67-15233 34th
Ave.
Surrey, BC V3S 2T7
604-637-2167
Page 8 of 21
Figure 8 UsbApp Shortcut Icon on Desktop
You will see spectrum analyzer application start-up window as shown in Figure 9.
Figure 9 Application Window before USB Device Connected
Plug the TSA5G35 USB mini spectrum analyzer into the PC USB port, the program should recognize the USB
device, then show Device Vendor, Device S/N and Firmware version. If all the information is correct, the
application is connected to the USB device successfully. Please see Figure 10

67-15233 34th
Ave.
Surrey, BC V3S 2T7
604-637-2167
Page 9 of 21
Figure 10 UsbApp Connected with USB Mini Spectrum Analyzer Device
1.2 Uninstall PC Application:
If you want to uninstall the PC program, please go to the control panel to look for the Program/uninstall a
program item, you will find the TSA5G35 USB mini spectrum analyzer program in the list, double click it,
then program will be uninstalled. Please see Figure 11.
Figure 11 Uninstall View

67-15233 34th
Ave.
Surrey, BC V3S 2T7
604-637-2167
Page 10 of 21
1.3 System Connection
Figure 12 shows the system connection, TSA5G35 connects to the computer through the USB port and the
connection between TSA5G35 and RF signal generator can be wired via coaxial cable or wireless via antenna.
The RF signal generator could be any RF transmission device.
Figure 12 System Connection
2. Operations
2.1 Signal Parameters
When the application starts, the screen displays as shown in Figure 13. The default span is 5 MHz, the
default reference level is 0 dBm, and the center frequency is empty. The center frequency will be set up by
the user.

67-15233 34th
Ave.
Surrey, BC V3S 2T7
604-637-2167
Page 11 of 21
Figure 13 Start Display
If the license file does not match the license number inside the TSA5G35, a warning message will pop up to
inform the user, as shown in Figure 14. The license file contains the calibration data, which is different from
one device dongle to another. The unit will not work correctly if there is no matched license file.
Figure 14 Missing License File Notification Message
When a signal presents at the input, the signal spectrum will be displayed as shown in Figure 15. In this
example, the signal is centered at 1000 MHz. The spectrum display by default shows only the current trace.
The average trace, peak trace, and density of the signal level are turned off. If you want to turn on different
traces, you can enable different traces by clicking tabs above display.
Figure 15 Spectrum Display with Signal

67-15233 34th
Ave.
Surrey, BC V3S 2T7
604-637-2167
Page 12 of 21
2.2 Frequency Setting
The center frequency is entered into Center-freq(MHz) input. Then the TSA5G35 will scan from center_freq
- span/2 to center_freq + span/2. The display window will show the signal spectrum after clicking the start
button. The valid center frequency range is from 1 MHz to 5350 MHz.
For example: if the center frequency is set to 5300 MHz and the device is connected with a RF signal
generator with frequency of 5300 MHz signal level 0 dBm and, the display will look similar as shown in
Figure 16.
Figure 16 Frequency set at 5300 MHz
2.3 SPAN Setting
The SPAN value can be selected by user. SPAN values are 1 MHz, 5 MHz, 10 MHz, 20 MHz, 50 MHz, 100 MHz,
500 MHz, and 1000 MHz.
The TSA5G35 has two bands, low band is from 0 to 850 MHz and high band from 850 MHz to 5350 MHz.
The 850 MHz frequency is the band edge. When SPAN is set at 500 MHz or 1000 MHz, SPAN range cannot
cross over the band edge, so that, 1000 MHz SPAN cannot work at low band.
When SPAN setting is from 1 MHz to 100 MHz, the span range can cross over the 850 MHz band edge.
For example, if SPAN is set to 500 MHz, the frequency is set at 600 MHz, the SPAN range will be from 350
MHz to 850 MHz. If the frequency is set to 700 MHz, the UsbApp will pop up the warning message to
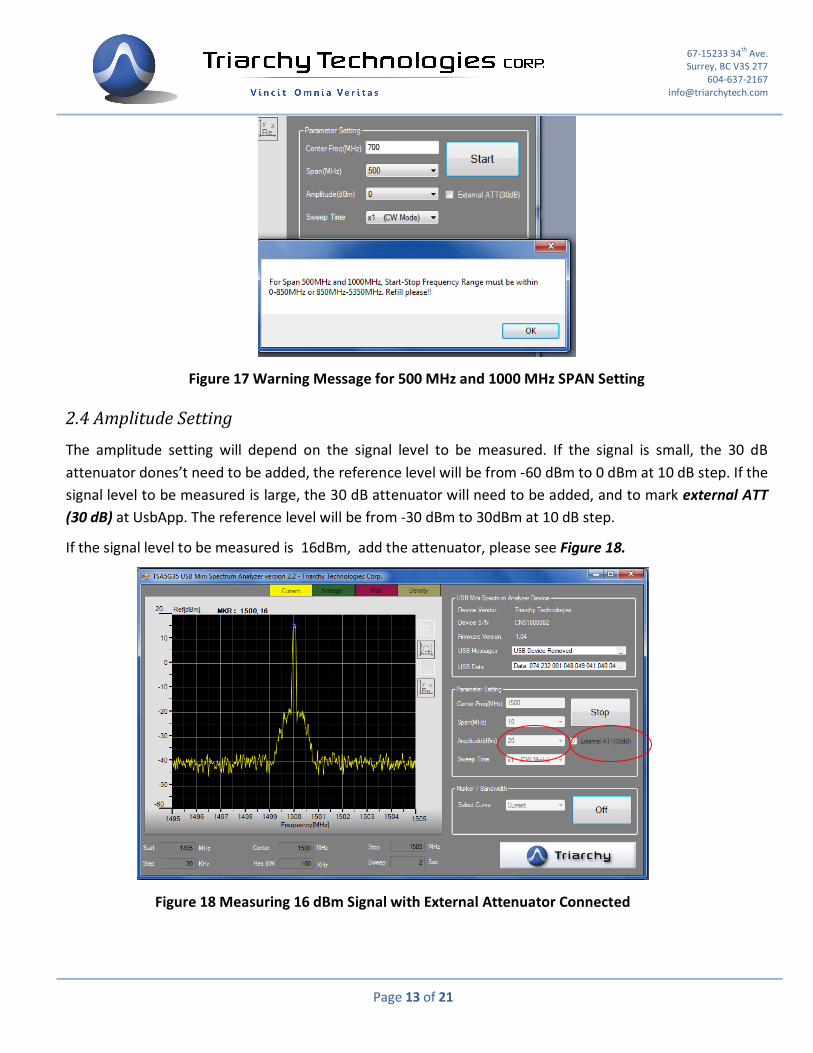
remind the user to enter a proper value for the span, Please see the warning message as shown in Figure 17.
67-15233 34th
Ave.
Surrey, BC V3S 2T7
604-637-2167
Page 13 of 21
Figure 17 Warning Message for 500 MHz and 1000 MHz SPAN Setting
2.4 Amplitude Setting
The amplitude setting will depend on the signal level to be measured. If the signal is small, the 30 dB
attenuator dones’t need to be added, the reference level will be from -60 dBm to 0 dBm at 10 dB step. If the
signal level to be measured is large, the 30 dB attenuator will need to be added, and to mark external ATT
(30 dB) at UsbApp. The reference level will be from -30 dBm to 30dBm at 10 dB step.
If the signal level to be measured is 16dBm, add the attenuator, please see Figure 18.
Figure 18 Measuring 16 dBm Signal with External Attenuator Connected
67-15233 34th
Ave.
Surrey, BC V3S 2T7
604-637-2167
Page 14 of 21
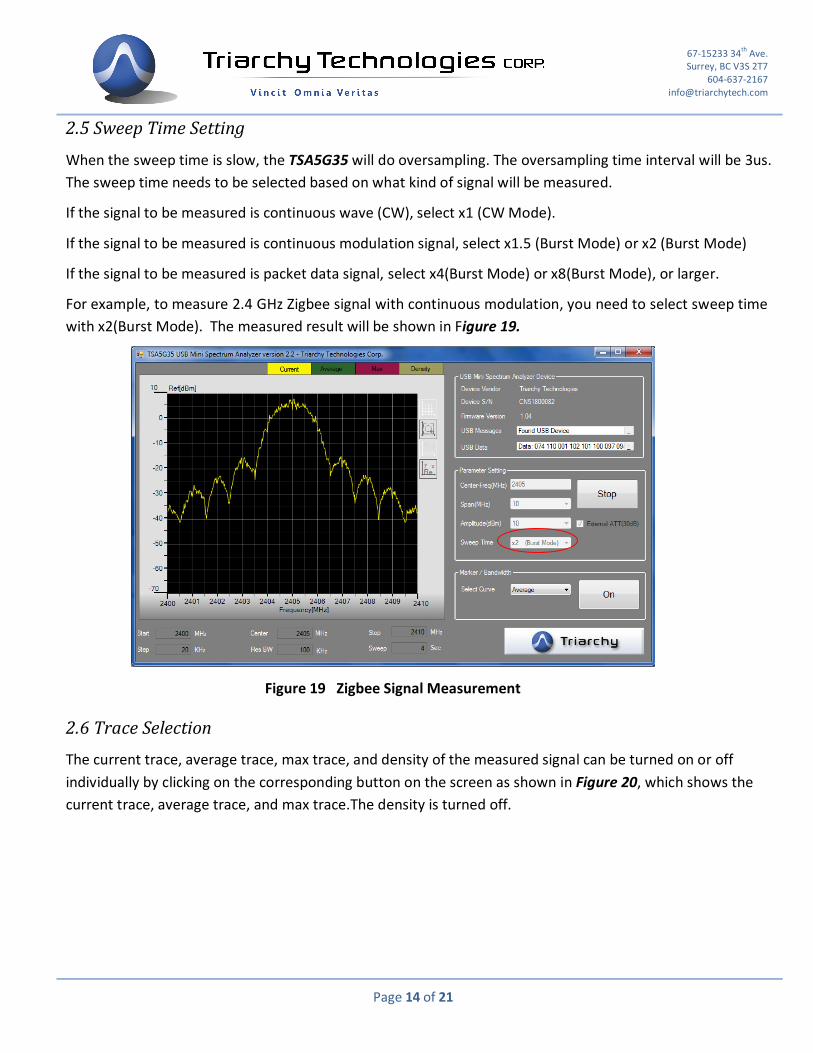
2.5 Sweep Time Setting
When the sweep time is slow, the TSA5G35 will do oversampling. The oversampling time interval will be 3us.
The sweep time needs to be selected based on what kind of signal will be measured.
If the signal to be measured is continuous wave (CW), select x1 (CW Mode).
If the signal to be measured is continuous modulation signal, select x1.5 (Burst Mode) or x2 (Burst Mode)
If the signal to be measured is packet data signal, select x4(Burst Mode) or x8(Burst Mode), or larger.
For example, to measure 2.4 GHz Zigbee signal with continuous modulation, you need to select sweep time
with x2(Burst Mode). The measured result will be shown in Figure 19.
Figure 19 Zigbee Signal Measurement
2.6 Trace Selection
The current trace, average trace, max trace, and density of the measured signal can be turned on or off
individually by clicking on the corresponding button on the screen as shown in Figure 20, which shows the
current trace, average trace, and max trace.The density is turned off.

67-15233 34th
Ave.
Surrey, BC V3S 2T7
604-637-2167
Page 15 of 21
Figure 20 Current Trace, Average Trace, and Max Trace Are Turned on
2.7 Current Trace
The current trace is to display the real time signal spectrum, and the default display will be current trace.
The current trace will be updated with each scan over the frequency range When the input signal is
changed, the current trace will change immediately. When the device is used to measure the modulated
signal and packet signal, you need to increase the sweep time to get a better spectrum waveform.
2.8 Average Trace
The average trace is adopted 16 points of moving average algorithm. It can reduce the signal noise when
measuring CW signal. It will conjecture the signal repeat rate for modulated or packet signal measurement,
if the average trace is very low comparing to the max trace, it means the signal repeat rate is very low.
2.9 Max Trace
The max trace will hold the maximum signal level with each scan. Max trace can be used to measure the
modulated signals, and random signals. The max trace will show envelop of modulated signals. When you
do an EMC test, you can use the max trace to pick up the max signal.
2.10 Density Measurement
The density image will show the modulated signal with the detailed signal energy distribution, even when
two signals are overlapped, you can still watch and find the two signals from the density image. It is very
useful to analyze the modulated signal.

67-15233 34th
Ave.
Surrey, BC V3S 2T7
604-637-2167
Page 16 of 21
Since density measurement will use up a lot PC computing resource, the default option for density
measurement is off. For a low performance PC, turning on this option may cause PC to respond slowly.
3. Measurement Support Features
There are measurement support features, including Marker, Bandwidth Measurement, trace Zoom-In. and
Image Hardcopy. In this guide curve and trace are interchangeable.
3.1 Select Measurement Curve
Before selecting Marker/Bandwidth functions, you shall choose which curve to be measured. There are
Current, Average and Max curves, select one on Select Curves window and click “On” button in the
Marker/Bandwidth panel as shown in Figure 21, and then run into the Marker/Bandwidth mode.
Figure 21 Select Current Trace to Measure
3.2 Marker
To place a marker on the signal by moving the cursor near the peak of the signal, right click the mouse, a
pop-up menu will be shown, go into the Marker item:
Selecting the marker “to peak” will place the marker at the peak of the signal around cursor area.
Selecting the marker “to notch” will place the marker at the notch of the signal around cursor area.
Selecting the marker “to curve” will place the marker at cross point of the cursor y axial and curve.
67-15233 34th
Ave.
Surrey, BC V3S 2T7
604-637-2167
Page 17 of 21
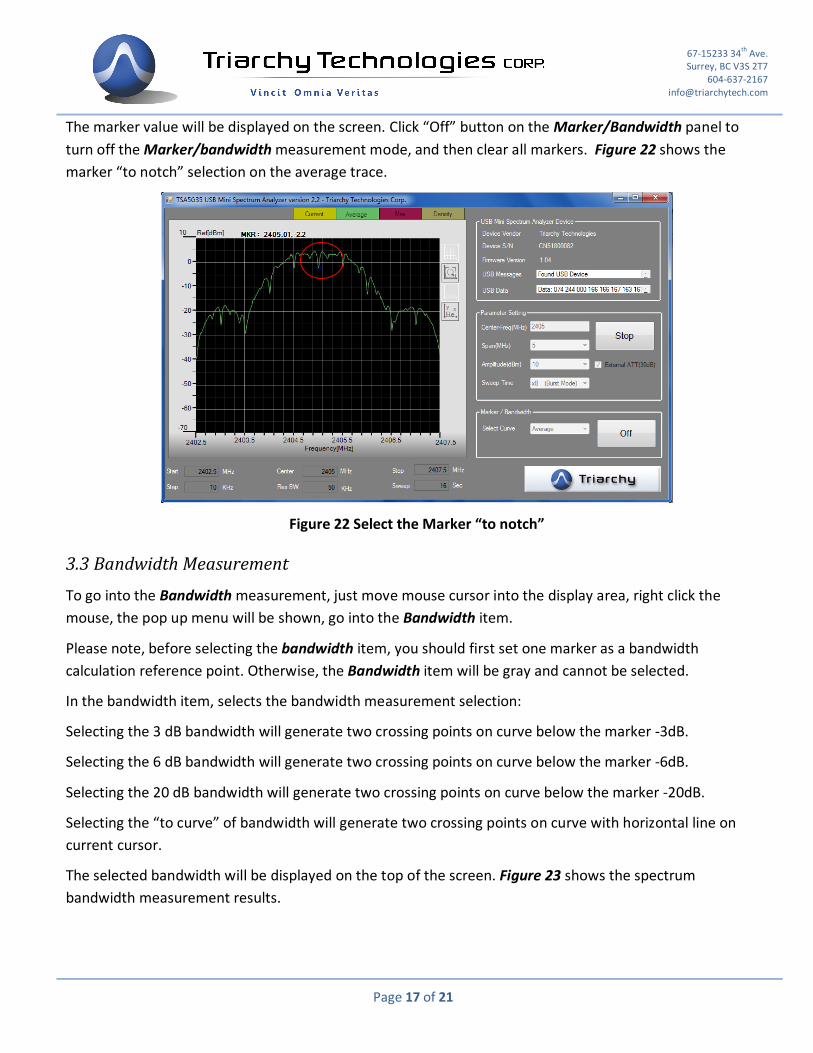
The marker value will be displayed on the screen. Click “Off” button on the Marker/Bandwidth panel to
turn off the Marker/bandwidth measurement mode, and then clear all markers. Figure 22 shows the
marker “to notch” selection on the average trace.
Figure 22 Select the Marker “to notch”
3.3 Bandwidth Measurement
To go into the Bandwidth measurement, just move mouse cursor into the display area, right click the
mouse, the pop up menu will be shown, go into the Bandwidth item.
Please note, before selecting the bandwidth item, you should first set one marker as a bandwidth
calculation reference point. Otherwise, the Bandwidth item will be gray and cannot be selected.
In the bandwidth item, selects the bandwidth measurement selection:
Selecting the 3 dB bandwidth will generate two crossing points on curve below the marker -3dB.
Selecting the 6 dB bandwidth will generate two crossing points on curve below the marker -6dB.
Selecting the 20 dB bandwidth will generate two crossing points on curve below the marker -20dB.
Selecting the “to curve” of bandwidth will generate two crossing points on curve with horizontal line on
current cursor.
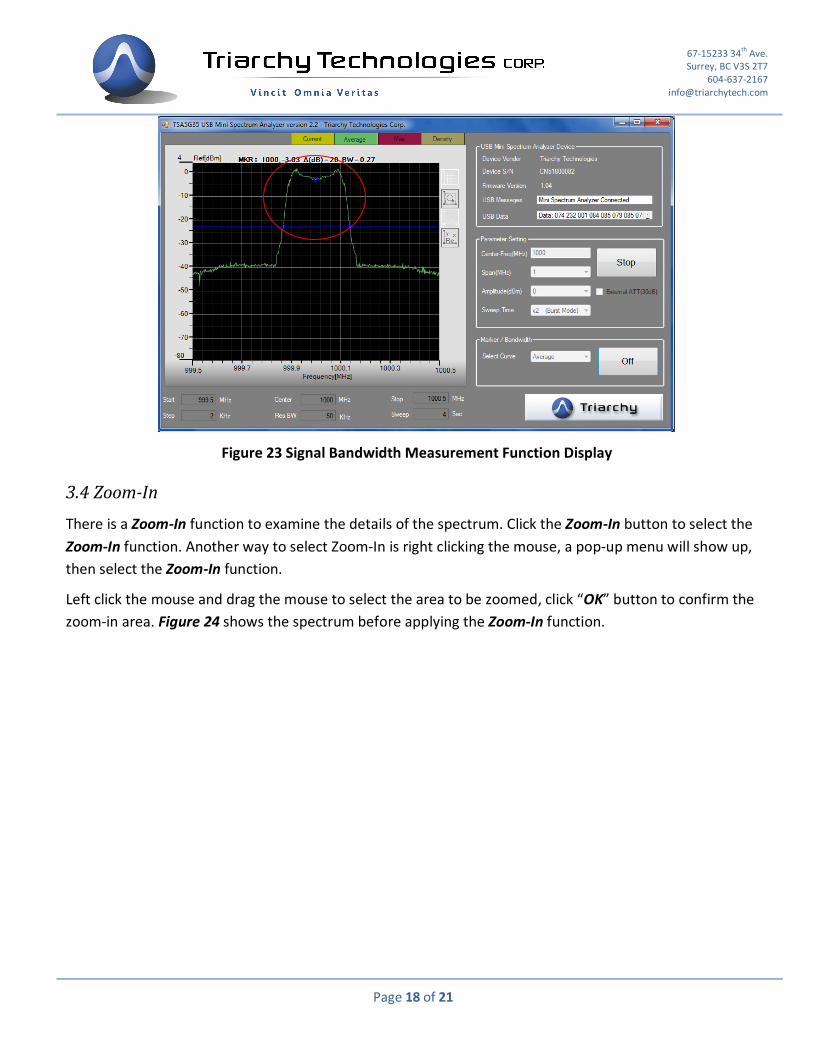
The selected bandwidth will be displayed on the top of the screen. Figure 23 shows the spectrum
bandwidth measurement results.
67-15233 34th
Ave.
Surrey, BC V3S 2T7
604-637-2167
Page 18 of 21
Figure 23 Signal Bandwidth Measurement Function Display
3.4 Zoom-In
There is a Zoom-In function to examine the details of the spectrum. Click the Zoom-In button to select the
Zoom-In function. Another way to select Zoom-In is right clicking the mouse, a pop-up menu will show up,
then select the Zoom-In function.
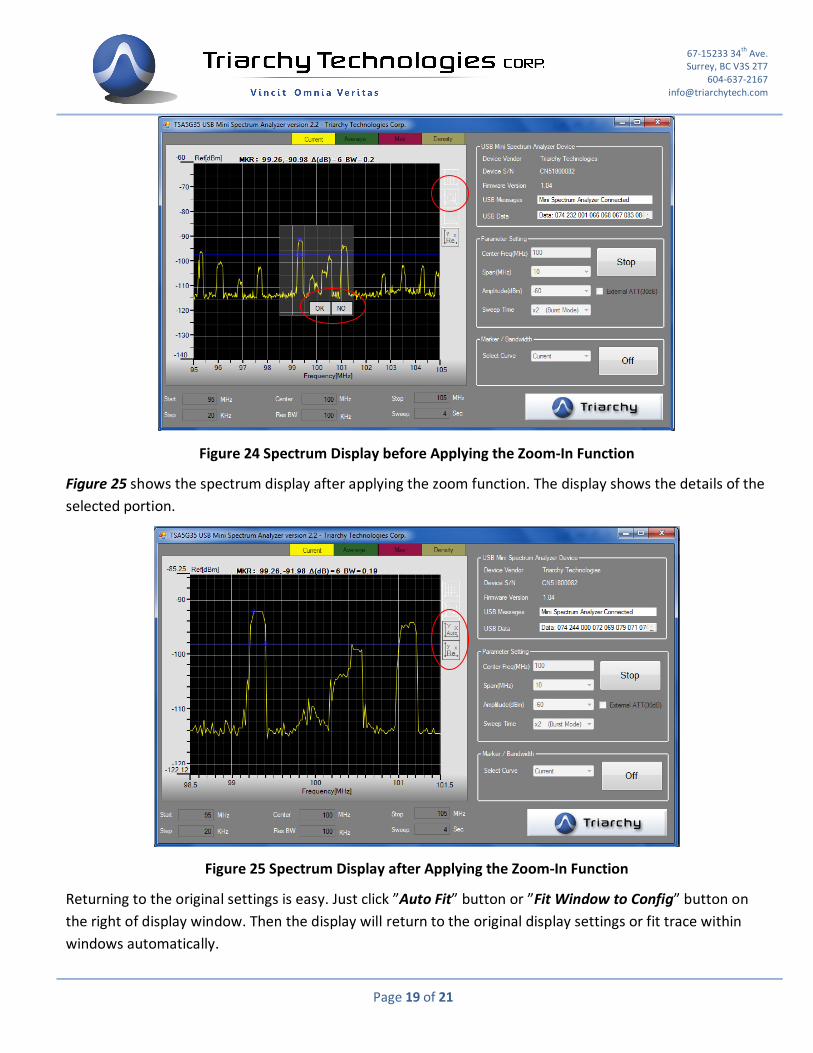
Left click the mouse and drag the mouse to select the area to be zoomed, click “OK” button to confirm the
zoom-in area. Figure 24 shows the spectrum before applying the Zoom-In function.
67-15233 34th
Ave.
Surrey, BC V3S 2T7
604-637-2167
Page 19 of 21
Figure 24 Spectrum Display before Applying the Zoom-In Function
Figure 25 shows the spectrum display after applying the zoom function. The display shows the details of the
selected portion.
Figure 25 Spectrum Display after Applying the Zoom-In Function
Returning to the original settings is easy. Just click ”Auto Fit” button or ”Fit Window to Config” button on
the right of display window. Then the display will return to the original display settings or fit trace within
windows automatically.
67-15233 34th
Ave.
Surrey, BC V3S 2T7
604-637-2167
Page 20 of 21
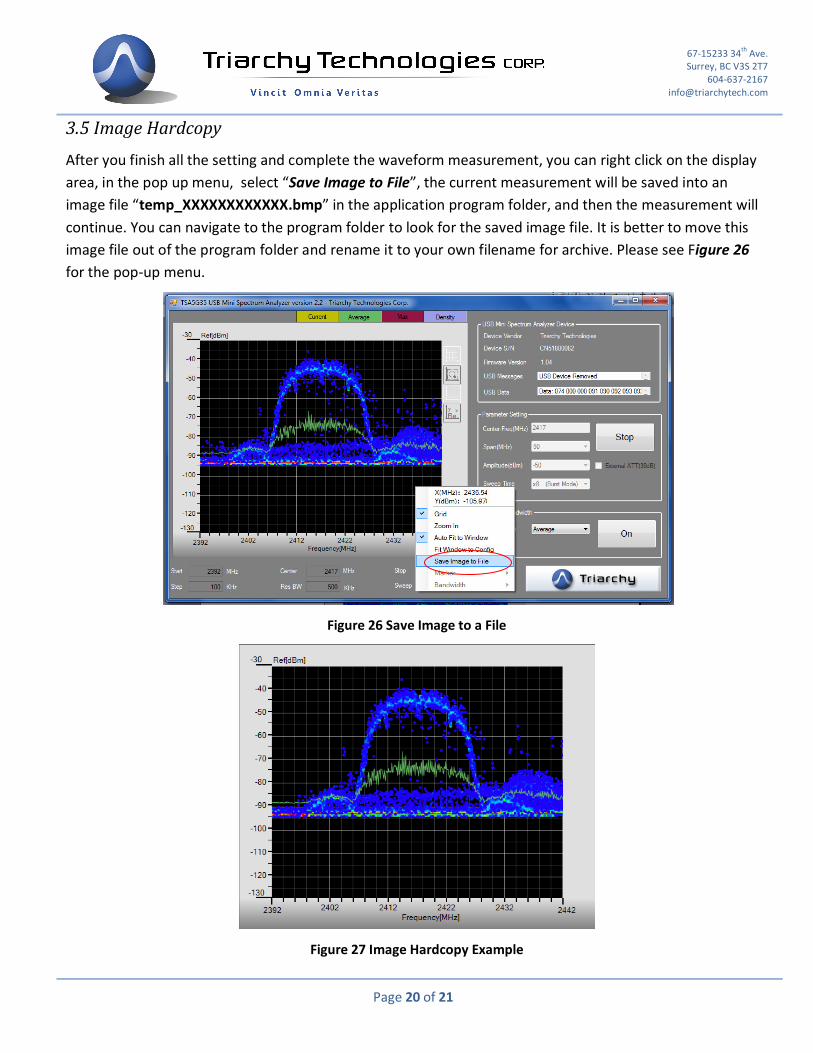
3.5 Image Hardcopy
After you finish all the setting and complete the waveform measurement, you can right click on the display
area, in the pop up menu, select “Save Image to File”, the current measurement will be saved into an
image file “temp_XXXXXXXXXXXX.bmp” in the application program folder, and then the measurement will
continue. You can navigate to the program folder to look for the saved image file. It is better to move this
image file out of the program folder and rename it to your own filename for archive. Please see Figure 26
for the pop-up menu.
Figure 26 Save Image to a File
Figure 27 Image Hardcopy Example

67-15233 34th
Ave.
Surrey, BC V3S 2T7
604-637-2167
Page 21 of 21
3.6 Current Cursor Coordinates on Display
When mouse cursor is located on the display area, right click the mouse, top of the pop-up menu will show
the coordinates of current cursor: frequency and level in dBm, this feature can work as a simple marker
function. Please see Figure 28.
Figure 28 Cursor Coordinates on Display