usd 500 kansas city, kansas schools - kansas state …ksde.org/portals/0/school...
TRANSCRIPT
USD 500 Kansas City, Kansas Schools
i
• Budget General Information (characteristics of district)
• Supplemental Information for Tables in Summary of Expenditures
• KSDE Website Information Available
• Summary of Expenditures (Sumexpen.xlsx)
1
2014-15 Budget General Information USD #: 500
Introduction
The Kansas City, Kansas Public Schools (KCKPS) is a nationally recognized urban school district that serves approximately 21,500 students. With a Head Start program, three preschools, 30 elementary schools, 8 middle schools, and 5 high schools, the district serves a wonderfully diverse mixture of students. A remarkable 63 different languages are spoken in the homes of our students. To serve those students, the district employs approximately 3,700 staff, including more than 1600 teachers.
Board Members Dr. Evelyn Hill, President Ms. Vicki S. Meyer, Vice-President Ms. Brenda C. Jones Mrs. Christal Watson Mr. George Breidenthal Mr. Richard Kaminski Mrs. Gloria Willis
Key Staff Superintendent: Dr. Cynthia Lane Assistant Superintendents: Marcy Clay, Elementary Dr. Jayson Strickland, Secondary Chief of Staff: David A. Smith Chief Financial Officer: Dr. Kelli Mather Chief of Human Resources: Edwin Hudson Chief of Police: Chief Rick Armstrong Director of Finance: Connie Brand Director of Educational Research David Rand and Assessment Director of Curriculum Alan King Director of Student Services Lisa Garcia Director of Special Education Michelle Colvin (interim) Clerk of the Board Susan Westfahl
Vision
Striving to become one of the Top 10 school districts in the nation, by creating a generation of innovative thinkers who will change the world.
Goal
Each student will exit high school prepared for college and careers in a global society, and at every level, performance is on-track and on-time for success.
2
The District’s Accomplishments and Challenges Accomplishments:
• The Kansas City, Kansas Public Schools has achieved a dramatic and unparalleled rise in student achievement.
o Reading achievement has risen from 11 percent of students meeting proficiency in 1996 to 67 percent of students meeting the standard in 2011.
o Math achievement has risen from 3 percent of students meeting proficiency in 1996 to 69 percent meeting the standard in 2011.
• Despite not having sufficient resources, the district has always worked tirelessly to do what is right for its students.
o Students from disadvantaged economic backgrounds frequently begin school behind their more-advantaged counterparts from wealthier communities, particularly in the area of language development. Even so, they are expected to reach the same high standards. In order to positively impact these students, the district implemented a preschool program in 1997, which has since grown more than 275 percent. Currently, more than 800 students are being served. Decades of research show that children who attend high-quality pre-K programs are academically stronger in reading and math. They also have more social skills and are better prepared for school.
o To ensure that students are "school ready" by the time they enter first grade, KCKPS implemented all-day kindergarten at all elementary school sites in 2007.
o In 2007, KCKPS became the first district in the Kansas City metropolitan area to lease a laptop computer for every high school student, and one of the first urban districts in the nation. The Laptops for Learning Program is designed to help students to transition from being “consumers of learning” to being “producers of knowledge,” ready to compete with students from across the world in the 21st century.
• Sumner Academy of Arts and Science was ranked by U.S. News and World Report magazine as the number 68 school on their list of top high schools in the country out of 21,000 public high schools. These rankings are based on the number of international baccalaureate tests taken, as well as student performance on these exams.
• Leadership begins at the top. KCKPS has benefited from strong and consistent leadership from its Board of Education, which has allowed it to maintain consistency in its improvement efforts. The KCKPS Board of Education is a recipient of the Magna Award, a national recognition program that honors school board best practices and innovative programs that advance student learning.
3
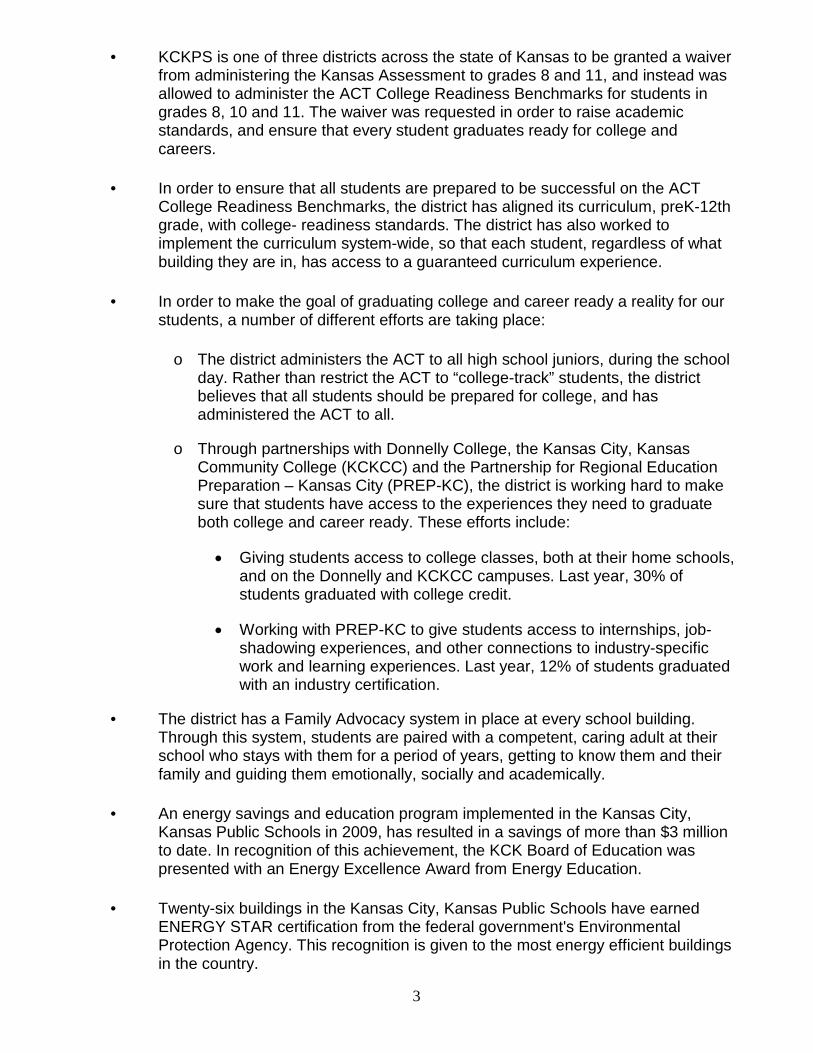
• KCKPS is one of three districts across the state of Kansas to be granted a waiver from administering the Kansas Assessment to grades 8 and 11, and instead was allowed to administer the ACT College Readiness Benchmarks for students in grades 8, 10 and 11. The waiver was requested in order to raise academic standards, and ensure that every student graduates ready for college and careers.
• In order to ensure that all students are prepared to be successful on the ACT College Readiness Benchmarks, the district has aligned its curriculum, preK-12th grade, with college- readiness standards. The district has also worked to implement the curriculum system-wide, so that each student, regardless of what building they are in, has access to a guaranteed curriculum experience.
• In order to make the goal of graduating college and career ready a reality for our students, a number of different efforts are taking place:
o The district administers the ACT to all high school juniors, during the school day. Rather than restrict the ACT to “college-track” students, the district believes that all students should be prepared for college, and has administered the ACT to all.
o Through partnerships with Donnelly College, the Kansas City, Kansas Community College (KCKCC) and the Partnership for Regional Education Preparation – Kansas City (PREP-KC), the district is working hard to make sure that students have access to the experiences they need to graduate both college and career ready. These efforts include:
• Giving students access to college classes, both at their home schools, and on the Donnelly and KCKCC campuses. Last year, 30% of students graduated with college credit.
• Working with PREP-KC to give students access to internships, job- shadowing experiences, and other connections to industry-specific work and learning experiences. Last year, 12% of students graduated with an industry certification.
• The district has a Family Advocacy system in place at every school building. Through this system, students are paired with a competent, caring adult at their school who stays with them for a period of years, getting to know them and their family and guiding them emotionally, socially and academically.
• An energy savings and education program implemented in the Kansas City, Kansas Public Schools in 2009, has resulted in a savings of more than $3 million to date. In recognition of this achievement, the KCK Board of Education was presented with an Energy Excellence Award from Energy Education.
• Twenty-six buildings in the Kansas City, Kansas Public Schools have earned ENERGY STAR certification from the federal government's Environmental Protection Agency. This recognition is given to the most energy efficient buildings in the country.

4
• Each winter, more than 1400 students spend an entire Saturday competing in Math Relays. In Math Relays, students compete in four major strands: algebra, geometry, number concepts, and statistics and probability. A Sigma category also exists for students who want to compete in all strands. Students also compete in an annual “Battle of the Books” in which students demonstrate their knowledge about books they have read, through a series of competitions.
• Students at J.C Harmon High School have determined the DNA sequence for a gene, GAPC (glyceraldehyde-3-phosphate dehydrogenase), from the Helianthus annuus plant (the common sunflower). This gene has never been sequenced before in this species.This work was completed during a Biotechnology 2 course, which is a college course given through Kansas City Kansas Community College. The findings were recently published on GenBank, a genetic database hosted by the National Library of Medicine through the National Institutes of Health.
• Three KCKPS high schools offer nationally certified Project Lead the Way (PLTW) programs. PLTW is a national program designed to create a pipeline of students prepared to be leaders in science, technology, engineering and mathematics.
• In 2012, Kansas City, Kansas was named one of America’s Promise Alliance’s 100 Best Communities for Young People. This national aware was given to KCK to recognize its outstanding and innovative work in addressing he dropout crisis, and for its programs and services that make it an outstanding place for youth to live, learn and grow.
• Despite a significant shortfall in funding from the state, the district has managed to continue to move forward in its quest to provide students and staff with quality, modern facilities. Through diligent stewardship of resources, prioritization of needs, and use of available financing options (including Qualified School Construction Bonds, which allowed us to finance several building projects at essentially no interest cost) the district has managed to:
o Build additions to three elementary schools and one high school, and complete construction on three brand new elementary schools (replacing buildings that were functionally obsolete) as well as a new library for the southern part of the community.
o Replace the central office, moving from a condemned building to a brand new, far more functional facility, while paying less than it cost to rent the old facility.
• Staff in KCKPS demonstrate their commitment to the Kansas City, Kansas community by being one of the top 5 employers in giving to United Way, giving almost $100,000 last year. This is the largest amount given by any school district in the metro Kansas City area.
• Students from KCKPS were among the lead plaintiffs in the case that is currently before the Kansas Supreme Court on school funding. In March, the Kansas Supreme Court ruled that funding in Kansas was inequitable.
5
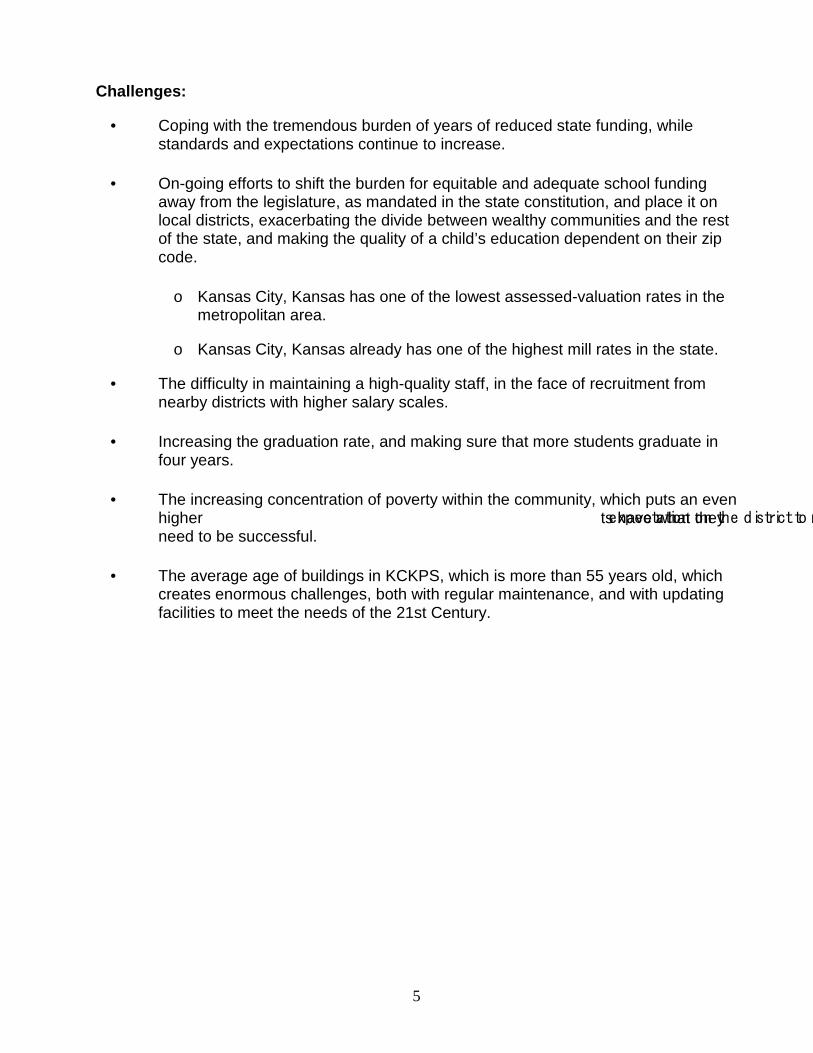
Challenges:
• Coping with the tremendous burden of years of reduced state funding, while standards and expectations continue to increase.
• On-going efforts to shift the burden for equitable and adequate school funding away from the legislature, as mandated in the state constitution, and place it on local districts, exacerbating the divide between wealthy communities and the rest of the state, and making the quality of a child’s education dependent on their zip code.
o Kansas City, Kansas has one of the lowest assessed-valuation rates in the metropolitan area.
o Kansas City, Kansas already has one of the highest mill rates in the state.
• The difficulty in maintaining a high-quality staff, in the face of recruitment from nearby districts with higher salary scales.
• Increasing the graduation rate, and making sure that more students graduate in four years.
• The increasing concentration of poverty within the community, which puts an even higher expectation on the district to m ts have what they need to be successful.
• The average age of buildings in KCKPS, which is more than 55 years old, which creates enormous challenges, both with regular maintenance, and with updating facilities to meet the needs of the 21st Century.
6
Supplemental Information for the Following Tables 1. Summary of Total Expenditures by Function (All Funds) 2. Summary of General Fund Expenditures by Function 3. Summary of Supplemental General Fund Expenditures by Function 4. Summary of General and Supplemental General Fund Expenditures by Function 5. Summary of Special Education Fund by Function 6. Instruction Expenditures (1000) 7. Student Support Expenditures (2100)
8. Instructional Support Expenditures (2200) 9. General Administration Expenditures (2300) 10. School Administration Expenditures (2400)
11. Central Services Expenditures (2500) 12. Operations and Maintenance Expenditures (2600)
13. Transportation Expenditures (2700) 14. Other Support Services Expenditures (2900)
15. Food Service Expenditures (3100)
16. Community Services Operations (3300) 17. Capital Improvements (4000) 18. Debt Services (5100)
19. Miscellaneous Information – Transfers (5200) 20. Miscellaneous Information Unencumbered Cash Balance by Fund 21. Reserve Funds Unencumbered Cash Balance 22. Other Information – Enrollment Information 23. Miscellaneous Information Mill Rates by Fund 24. Other Information – Assessed Valuation and Bonded Indebtedness
7
Note: The FTE (full time equivalency) used in this report to calculate the “Amount Per Pupil” is defined as following: Enrollment (FTE) includes the enrollment of the district used for state aid and budget authority, and all other preschool enrollment and kindergarten students attending full time.
8
KSDE Website Information Available K-12 Statistics (Building, District or State Totals) http://svapp15586.ksde.org/k12/k12.aspx
• Attendance / Enrollment Reports • Staff Reports • Graduates / Dropouts Reports • Crime / Violence Reports
School Finance Reports and Publications http://www.ksde.org/Agency/FiscalandAdministrativeServices/SchoolFinance/ReportsandPublications.aspx
• Assessed Valuation • Cash Balances • Headcount Enrollment • Mill Levies • Personnel (Certified/Non-Certified) • Salary Reports
Kansas Building Report Card http://svapp15586.ksde.org/rcard/
• Attendance Rate • Graduation Rate • Dropout Rate • School Violence • Assessments
o Reading o Mathematics o Writing
• Graduates Passing Adv. Science Courses • Graduates Passing Adv. Math Courses
USD# 500
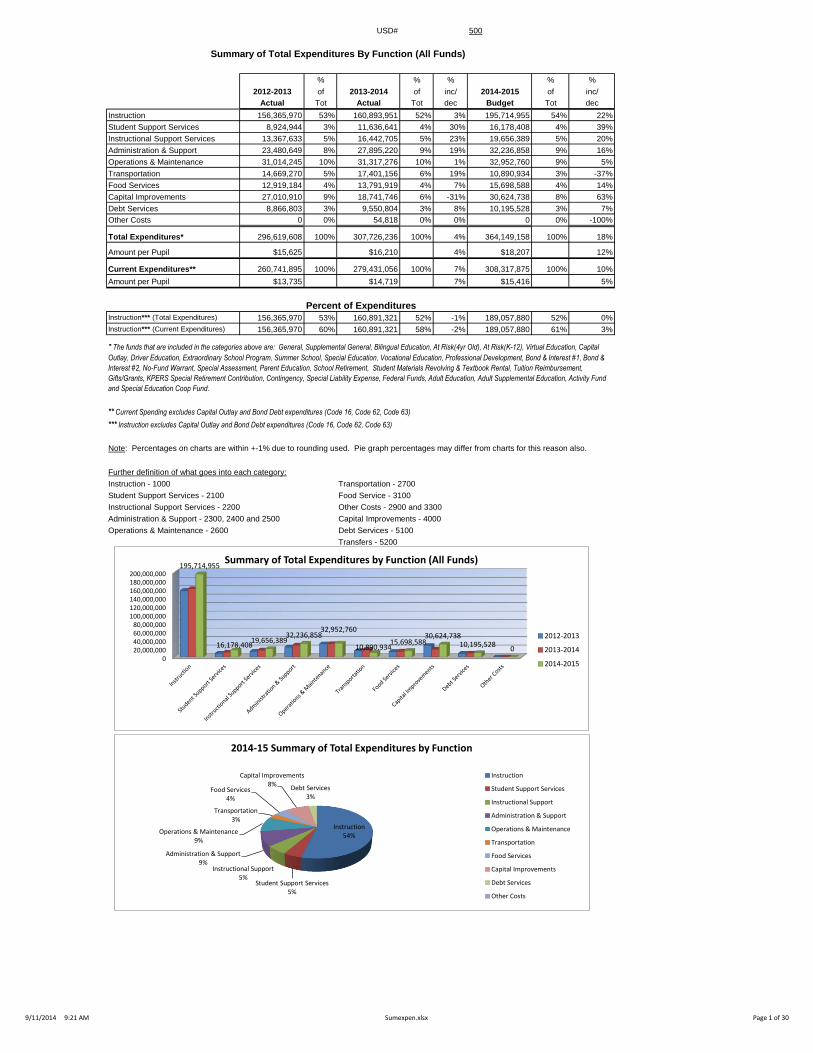
Summary of Total Expenditures By Function (All Funds)
% % % % %
2012-2013 of 2013-2014 of inc/ 2014-2015 of inc/
Actual Tot Actual Tot dec Budget Tot dec
Instruction 156,365,970 53% 160,893,951 52% 3% 195,714,955 54% 22%
Student Support Services 8,924,944 3% 11,636,641 4% 30% 16,178,408 4% 39%
Instructional Support Services 13,367,633 5% 16,442,705 5% 23% 19,656,389 5% 20%
Administration & Support 23,480,649 8% 27,895,220 9% 19% 32,236,858 9% 16%
Operations & Maintenance 31,014,245 10% 31,317,276 10% 1% 32,952,760 9% 5%
Transportation 14,669,270 5% 17,401,156 6% 19% 10,890,934 3% -37%
Food Services 12,919,184 4% 13,791,919 4% 7% 15,698,588 4% 14%
Capital Improvements 27,010,910 9% 18,741,746 6% -31% 30,624,738 8% 63%
Debt Services 8,866,803 3% 9,550,804 3% 8% 10,195,528 3% 7%
Other Costs 0 0% 54,818 0% 0% 0 0% -100%
Total Expenditures* 296,619,608 100% 307,726,236 100% 4% 364,149,158 100% 18%
Amount per Pupil $15,625 $16,210 4% $18,207 12%
Current Expenditures** 260,741,895 100% 279,431,056 100% 7% 308,317,875 100% 10%
Amount per Pupil $13,735 $14,719 7% $15,416 5%
Instruction*** (Total Expenditures) 156,365,970 53% 160,891,321 52% -1% 189,057,880 52% 0%
Instruction*** (Current Expenditures) 156,365,970 60% 160,891,321 58% -2% 189,057,880 61% 3%
Note: Percentages on charts are within +-1% due to rounding used. Pie graph percentages may differ from charts for this reason also.
Further definition of what goes into each category:
Instruction - 1000 Transportation - 2700
Student Support Services - 2100 Food Service - 3100
Instructional Support Services - 2200 Other Costs - 2900 and 3300
Administration & Support - 2300, 2400 and 2500 Capital Improvements - 4000
Operations & Maintenance - 2600 Debt Services - 5100
Transfers - 5200
Percent of Expenditures
* The funds that are included in the categories above are: General, Supplemental General, Bilingual Education, At Risk(4yr Old), At Risk(K-12), Virtual Education, Capital
Outlay, Driver Education, Extraordinary School Program, Summer School, Special Education, Vocational Education, Professional Development, Bond & Interest #1, Bond &
Interest #2, No-Fund Warrant, Special Assessment, Parent Education, School Retirement, Student Materials Revolving & Textbook Rental, Tuition Reimbursement,
Gifts/Grants, KPERS Special Retirement Contribution, Contingency, Special Liability Expense, Federal Funds, Adult Education, Adult Supplemental Education, Activity Fund
and Special Education Coop Fund.
*** Instruction excludes Capital Outlay and Bond Debt expenditures (Code 16, Code 62, Code 63)
** Current Spending excludes Capital Outlay and Bond Debt expenditures (Code 16, Code 62, Code 63)
020,000,00040,000,00060,000,00080,000,000
100,000,000120,000,000140,000,000160,000,000180,000,000200,000,000
195,714,955
16,178,408 19,656,389
32,236,858 32,952,760
10,890,934 15,698,588
30,624,738 10,195,528
0
Summary of Total Expenditures by Function (All Funds)
2012-2013
2013-2014
2014-2015
Instruction 54%
Student Support Services 5%
Instructional Support 5%
Administration & Support 9%
Operations & Maintenance 9%
Transportation 3%
Food Services 4%
Capital Improvements 8%
Debt Services 3%
2014-15 Summary of Total Expenditures by Function
Instruction
Student Support Services
Instructional Support
Administration & Support
Operations & Maintenance
Transportation
Food Services
Capital Improvements
Debt Services
Other Costs
9/11/2014 9:21 AM Sumexpen.xlsx Page 1 of 30

USD# 500
Summary of General Fund Expenditures
by Function
% % % % %
2012-2013 of 2013-2014 of inc/ 2014-2015 of inc/
Actual Tot Actual Tot dec Budget Tot dec
Instruction 11,365,004 16% 9,886,815 14% -13% 14,636,241 19% 48%
Student Support 590,597 1% 819,087 1% 39% 2,106,817 3% 157%
Instructional Support 4,255,336 6% 4,038,057 6% -5% 5,422,311 7% 34%
Administration & Support 19,369,969 28% 21,779,360 31% 12% 23,570,315 31% 8%
Operations & Maintenance 26,042,586 37% 23,504,563 34% -10% 25,625,130 34% 9%
Transportation 8,490,323 12% 9,695,832 14% 14% 5,119,472 7% -47%
Capital Improvements 0 0% 0 0% 0% 0 0% 0%
Other Costs 0 0% 0 0% 0% 0 0% 0%
Total Expenditures 70,113,815 100% 69,723,714 100% -1% 76,480,286 100% 10%
Amount per Pupil $3,693 $3,673 -1% $3,824 4%
The Summary of General Fund Expenditures chart information comes from pages 6-13 and only uses the 'General Fund' line items.
0
5,000,000
10,000,000
15,000,000
20,000,000
25,000,000
30,000,000
Instruction StudentSupport
InstructionalSupport
Administration& Support
Operations &Maintenance
Transportation CapitalImprovements
Other Costs
14,636,241
2,106,817
5,422,311
23,570,315
25,625,130
5,119,472
0 0
Summary of General Fund Expenditures
2012-2013
2013-2014
2014-2015
Instruction 19%
Student Support 3%
Instructional Support 7% Administration &
Support 31%
Operations & Maintenance
33%
Transportation 7%
2014-15 Summary of General Fund Expenditures by Function
Instruction
Student Support
Instructional Support
Administration & Support
Operations & Maintenance
Transportation
Capital Improvements
Other Costs
9/11/2014 9:21 AM Sumexpen.xlsx Page 2 of 30

USD# 500
Summary of Supplemental General Fund Expenditures
by Function
% % % % %
2012-2013 of 2013-2014 of inc/ 2014-2015 of inc/
Actual Tot Actual Tot dec Budget Tot dec
Instruction 34,097,631 80% 29,723,001 65% -13% 36,549,153 74% 23%
Student Support 2,978,659 7% 3,133,758 7% 5% 2,321,103 5% -26%
Instructional Support 1,766,195 4% 3,581,177 8% 103% 7,368,345 15% 106%
Administration & Support 0 0% 3,124,663 7% 0% 2,760,866 6% -12%
Operations & Maintenance 3,570,509 8% 6,237,904 14% 75% 0 0% -100%
Transportation 346,152 1% 103,956 0% -70% 228,580 0% 120%
Capital Improvements 0 0% 0 0% 0% 0 0% 0%
Other Costs 0 0% 0 0% 0% 0 0% 0%
Total Expenditures 42,759,146 100% 45,904,459 100% 7% 49,228,047 100% 7%
Amount per Pupil $2,252 $2,418 7% $2,461 2%
The Summary of Supplemental General Fund Expenditures chart information comes from pages 6-13 and only uses the 'Supplemental
General Fund' line items.
0
5,000,000
10,000,000
15,000,000
20,000,000
25,000,000
30,000,000
35,000,000
40,000,000
Instruction StudentSupport
InstructionalSupport
Administration& Support
Operations &Maintenance
Transportation CapitalImprovements
Other Costs
36,549,153
2,321,103
7,368,345
2,760,866
0 228,580 0 0
Summary of Supplemental General Expenditures by Function
2012-2013
2013-2014
2014-2015
Instruction 74%
Student Support 5%
Instructional Support 15%
Administration & Support 6%
2014-15 Summary of Supplemental General Fund Expenditures by Function
Instruction
Student Support
Instructional Support
Administration & Support
Operations & Maintenance
Transportation
Capital Improvements
Other Costs
9/11/2014 9:21 AM Sumexpen.xlsx Page 3 of 30
USD# 500
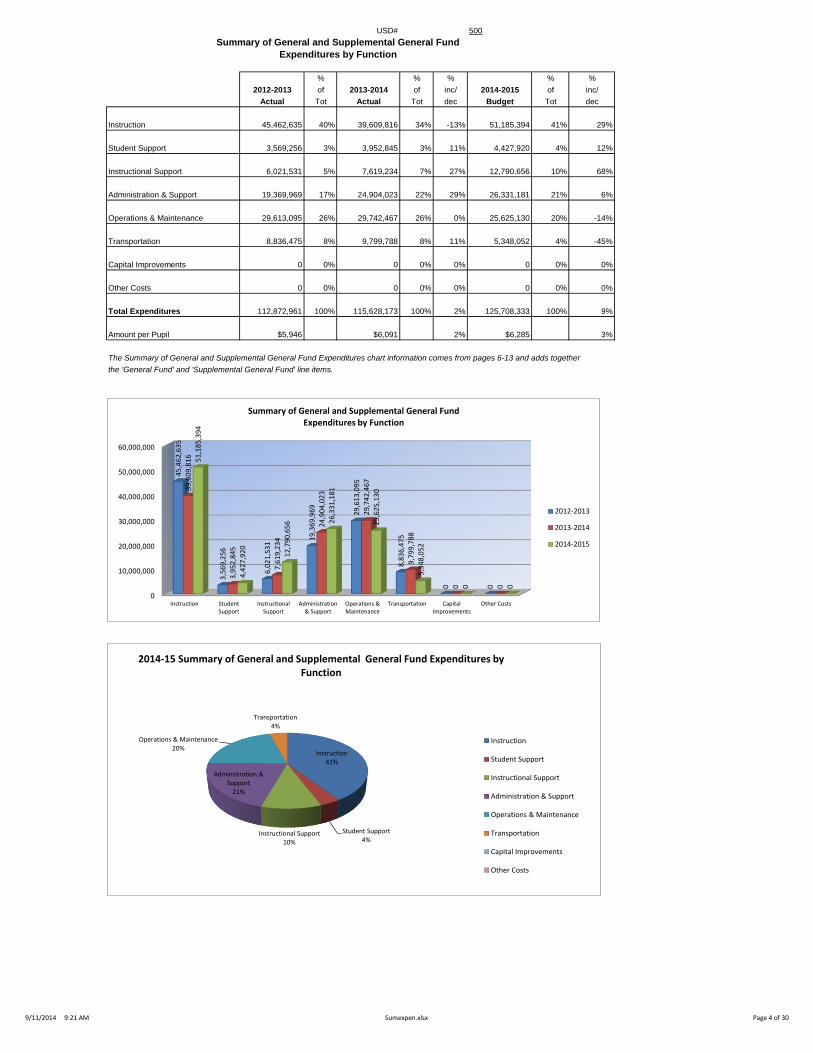
Summary of General and Supplemental General Fund
Expenditures by Function
% % % % %
2012-2013 of 2013-2014 of inc/ 2014-2015 of inc/
Actual Tot Actual Tot dec Budget Tot dec
Instruction 45,462,635 40% 39,609,816 34% -13% 51,185,394 41% 29%
Student Support 3,569,256 3% 3,952,845 3% 11% 4,427,920 4% 12%
Instructional Support 6,021,531 5% 7,619,234 7% 27% 12,790,656 10% 68%
Administration & Support 19,369,969 17% 24,904,023 22% 29% 26,331,181 21% 6%
Operations & Maintenance 29,613,095 26% 29,742,467 26% 0% 25,625,130 20% -14%
Transportation 8,836,475 8% 9,799,788 8% 11% 5,348,052 4% -45%
Capital Improvements 0 0% 0 0% 0% 0 0% 0%
Other Costs 0 0% 0 0% 0% 0 0% 0%
Total Expenditures 112,872,961 100% 115,628,173 100% 2% 125,708,333 100% 9%
Amount per Pupil $5,946 $6,091 2% $6,285 3%
The Summary of General and Supplemental General Fund Expenditures chart information comes from pages 6-13 and adds together
the 'General Fund' and 'Supplemental General Fund' line items.
0
10,000,000
20,000,000
30,000,000
40,000,000
50,000,000
60,000,000
Instruction StudentSupport
InstructionalSupport
Administration& Support
Operations &Maintenance
Transportation CapitalImprovements
Other Costs
45
,46
2,6
35
3,5
69
,25
6
6,0
21
,53
1 1
9,3
69
,96
9
29
,61
3,0
95
8,8
36
,47
5
0
0
39
,60
9,8
16
3,9
52
,84
5
7,6
19
,23
4
24
,90
4,0
23
29
,74
2,4
67
9,7
99
,78
8
0
0
51
,18
5,3
94
4,4
27
,92
0
12
,79
0,6
56
26
,33
1,1
81
25
,62
5,1
30
5,3
48
,05
2
0
0
Summary of General and Supplemental General Fund Expenditures by Function
2012-2013
2013-2014
2014-2015
Instruction 41%
Student Support 4%
Instructional Support 10%
Administration & Support
21%
Operations & Maintenance 20%
Transportation 4%
2014-15 Summary of General and Supplemental General Fund Expenditures by Function
Instruction
Student Support
Instructional Support
Administration & Support
Operations & Maintenance
Transportation
Capital Improvements
Other Costs
9/11/2014 9:21 AM Sumexpen.xlsx Page 4 of 30
USD# 500
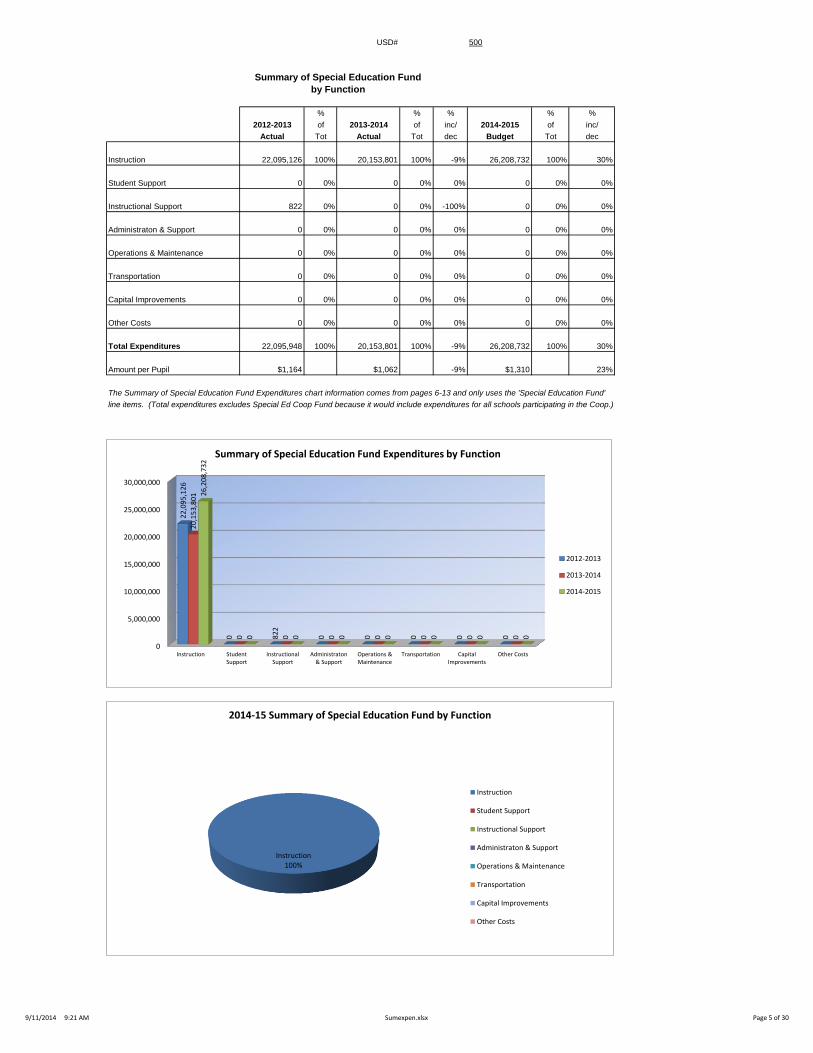
Summary of Special Education Fund
by Function
% % % % %
2012-2013 of 2013-2014 of inc/ 2014-2015 of inc/
Actual Tot Actual Tot dec Budget Tot dec
Instruction 22,095,126 100% 20,153,801 100% -9% 26,208,732 100% 30%
Student Support 0 0% 0 0% 0% 0 0% 0%
Instructional Support 822 0% 0 0% -100% 0 0% 0%
Administraton & Support 0 0% 0 0% 0% 0 0% 0%
Operations & Maintenance 0 0% 0 0% 0% 0 0% 0%
Transportation 0 0% 0 0% 0% 0 0% 0%
Capital Improvements 0 0% 0 0% 0% 0 0% 0%
Other Costs 0 0% 0 0% 0% 0 0% 0%
Total Expenditures 22,095,948 100% 20,153,801 100% -9% 26,208,732 100% 30%
Amount per Pupil $1,164 $1,062 -9% $1,310 23%
The Summary of Special Education Fund Expenditures chart information comes from pages 6-13 and only uses the 'Special Education Fund'
line items. (Total expenditures excludes Special Ed Coop Fund because it would include expenditures for all schools participating in the Coop.)
0
5,000,000
10,000,000
15,000,000
20,000,000
25,000,000
30,000,000
Instruction StudentSupport
InstructionalSupport
Administraton& Support
Operations &Maintenance
Transportation CapitalImprovements
Other Costs
22
,09
5,1
26
0
82
2
0
0
0
0
0
20
,15
3,8
01
0
0
0
0
0
0
0
26
,20
8,7
32
0
0
0
0
0
0
0
Summary of Special Education Fund Expenditures by Function
2012-2013
2013-2014
2014-2015
Instruction 100%
2014-15 Summary of Special Education Fund by Function
Instruction
Student Support
Instructional Support
Administraton & Support
Operations & Maintenance
Transportation
Capital Improvements
Other Costs
9/11/2014 9:21 AM Sumexpen.xlsx Page 5 of 30

USD# 500
Instruction Expenditures (1000)
% %
2012-2013 2013-2014 inc/ 2014-2015 inc/
Actual Actual dec Budget dec
General 11,365,004 9,886,815 -13% 14,636,241 48%
Federal Funds 10,321,634 13,169,610 28% 16,896,672 28%
Supplemental General 34,097,631 29,723,001 -13% 36,549,153 23%
At Risk (4yr Old) 952,707 1,200,954 26% 1,283,637 7%
At Risk (K-12) 33,287,657 36,976,651 11% 37,819,197 2%
Bilingual Education 6,169,687 6,434,672 4% 7,274,712 13%
Virtual Education 0 0 0% 0 0%
Capital Outlay 0 2,630 0% 6,657,075 253021%
Driver Education 0 0 0% 0 0%
Declining Enrollment 0 0 0% 0 0%
Extraordinary School Program 0 0 0% 0 0%
Food Service 0 0 0% 0 0%
Professional Development 0 0 0% 0 0%
Parent Education Program 0 0 0% 0 0%
Summer School 92,728 95,720 3% 167,000 74%
Special Education 22,095,126 20,153,801 -9% 26,208,732 30%
Cost of Living 0 0 0% 0 0%
Vocational Education 2,512,588 2,757,150 10% 2,536,830 -8%
Gifts/Grants 1,567,447 7,773,136 396% 7,432,821 -4%
Special Liability 0 0 0% 0 0%
School Retirement 1,067,110 693,704 -35% 0 -100%
Extraordinary Growth Facilities 0 0 0% 0 0%
Special Reserve 0 0 0%
KPERS Spec. Ret. Contribution 7,996,703 9,009,823 13% 10,541,493 17%
Contingency Reserve 0 0 0%
Text Book & Student Material 47,334 150,801 219%
Activity Fund 99,710 91,813 -8% 0 -100%
Bond and Interest #1 0 0 0% 0 0%
Bond and Interest #2 0 0 0% 0 0%
No-Fund Warrant 0 0 0% 0 0%
Special Assessment 0 0 0% 0 0%
Temporary Note 0 0 0% 0 0%
SUBTOTAL 131,673,066 138,120,281 5% 168,003,563 22%
Enrollment (FTE)* 18,984.2 18,984.2 0% 20,000.0 5%
Amount per Pupil 6,936 7,276 5% 8,400 15%
Adult Education 0 0 0% 0 0%
Adult Supplemental Education 0 0 0% 0 0%
Tuition Reimbursement 0 0 0% 0 0%
Special Education Coop 24,692,904 22,773,670 -8% 27,711,392 22%
TOTAL 156,365,970 160,893,951 3% 195,714,955 22%
NOTE: Gifts/Grants includes private grants and grants from nonfederal sources.
Amount per pupil excludes the following funds: Adult Education, Adult Supplemental Education, Special Education Coop
and Tuition Reimbursement.
*Enrollment (FTE) includes the enrollment of the district used for state aid and budget authority, and all other preschool enrollment
and kindergarten students attending full time.
0
10,000,000
20,000,000
30,000,000
40,000,000
2012-2013 2013-2014 2014-2015
11,365,004 9,886,815 14,636,241
34,097,631 29,723,001
36,549,153
22,095,126 20,153,801
26,208,732
Instruction Expenditures
GeneralSupplemental GeneralSpecial Education
0
50,000,000
100,000,000
150,000,000
200,000,000
2012-2013 2013-2014 2014-2015
156,365,970 160,893,951
195,714,955 Instruction Expenditures
9/11/2014 9:21 AM Sumexpen.xlsx Page 6 of 30
USD# 500
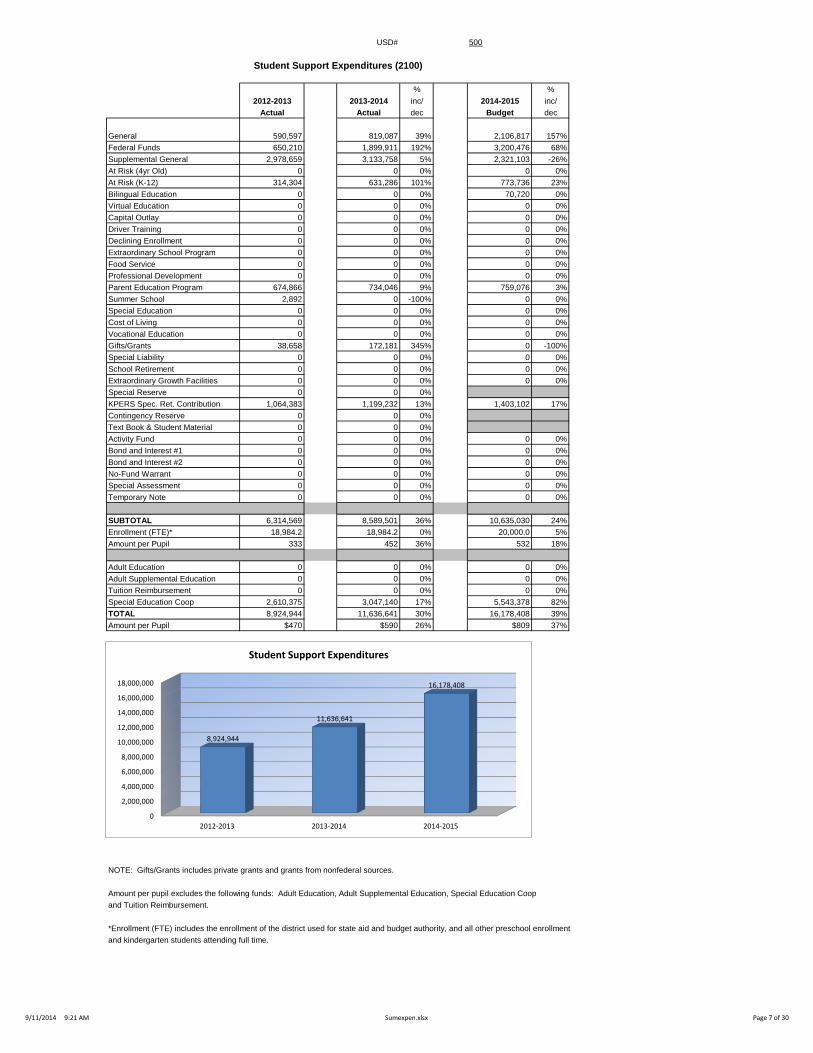
Student Support Expenditures (2100)
% %
2012-2013 2013-2014 inc/ 2014-2015 inc/
Actual Actual dec Budget dec
General 590,597 819,087 39% 2,106,817 157%
Federal Funds 650,210 1,899,911 192% 3,200,476 68%
Supplemental General 2,978,659 3,133,758 5% 2,321,103 -26%
At Risk (4yr Old) 0 0 0% 0 0%
At Risk (K-12) 314,304 631,286 101% 773,736 23%
Bilingual Education 0 0 0% 70,720 0%
Virtual Education 0 0 0% 0 0%
Capital Outlay 0 0 0% 0 0%
Driver Training 0 0 0% 0 0%
Declining Enrollment 0 0 0% 0 0%
Extraordinary School Program 0 0 0% 0 0%
Food Service 0 0 0% 0 0%
Professional Development 0 0 0% 0 0%
Parent Education Program 674,866 734,046 9% 759,076 3%
Summer School 2,892 0 -100% 0 0%
Special Education 0 0 0% 0 0%
Cost of Living 0 0 0% 0 0%
Vocational Education 0 0 0% 0 0%
Gifts/Grants 38,658 172,181 345% 0 -100%
Special Liability 0 0 0% 0 0%
School Retirement 0 0 0% 0 0%
Extraordinary Growth Facilities 0 0 0% 0 0%
Special Reserve 0 0 0%
KPERS Spec. Ret. Contribution 1,064,383 1,199,232 13% 1,403,102 17%
Contingency Reserve 0 0 0%
Text Book & Student Material 0 0 0%
Activity Fund 0 0 0% 0 0%
Bond and Interest #1 0 0 0% 0 0%
Bond and Interest #2 0 0 0% 0 0%
No-Fund Warrant 0 0 0% 0 0%
Special Assessment 0 0 0% 0 0%
Temporary Note 0 0 0% 0 0%
SUBTOTAL 6,314,569 8,589,501 36% 10,635,030 24%
Enrollment (FTE)* 18,984.2 18,984.2 0% 20,000.0 5%
Amount per Pupil 333 452 36% 532 18%
Adult Education 0 0 0% 0 0%
Adult Supplemental Education 0 0 0% 0 0%
Tuition Reimbursement 0 0 0% 0 0%
Special Education Coop 2,610,375 3,047,140 17% 5,543,378 82%
TOTAL 8,924,944 11,636,641 30% 16,178,408 39%
Amount per Pupil $470 $590 26% $809 37%
NOTE: Gifts/Grants includes private grants and grants from nonfederal sources.
Amount per pupil excludes the following funds: Adult Education, Adult Supplemental Education, Special Education Coop
and Tuition Reimbursement.
*Enrollment (FTE) includes the enrollment of the district used for state aid and budget authority, and all other preschool enrollment
and kindergarten students attending full time.
0
2,000,000
4,000,000
6,000,000
8,000,000
10,000,000
12,000,000
14,000,000
16,000,000
18,000,000
2012-2013 2013-2014 2014-2015
8,924,944
11,636,641
16,178,408
Student Support Expenditures
9/11/2014 9:21 AM Sumexpen.xlsx Page 7 of 30
USD# 500
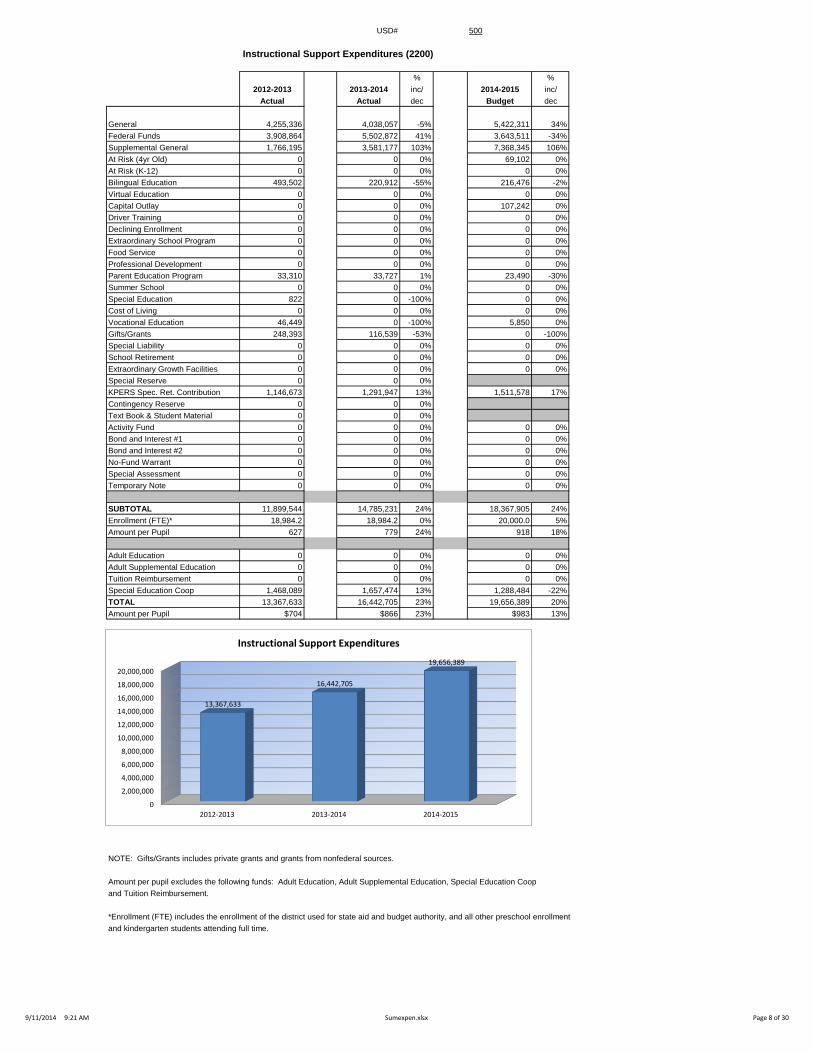
Instructional Support Expenditures (2200)
% %
2012-2013 2013-2014 inc/ 2014-2015 inc/
Actual Actual dec Budget dec
General 4,255,336 4,038,057 -5% 5,422,311 34%
Federal Funds 3,908,864 5,502,872 41% 3,643,511 -34%
Supplemental General 1,766,195 3,581,177 103% 7,368,345 106%
At Risk (4yr Old) 0 0 0% 69,102 0%
At Risk (K-12) 0 0 0% 0 0%
Bilingual Education 493,502 220,912 -55% 216,476 -2%
Virtual Education 0 0 0% 0 0%
Capital Outlay 0 0 0% 107,242 0%
Driver Training 0 0 0% 0 0%
Declining Enrollment 0 0 0% 0 0%
Extraordinary School Program 0 0 0% 0 0%
Food Service 0 0 0% 0 0%
Professional Development 0 0 0% 0 0%
Parent Education Program 33,310 33,727 1% 23,490 -30%
Summer School 0 0 0% 0 0%
Special Education 822 0 -100% 0 0%
Cost of Living 0 0 0% 0 0%
Vocational Education 46,449 0 -100% 5,850 0%
Gifts/Grants 248,393 116,539 -53% 0 -100%
Special Liability 0 0 0% 0 0%
School Retirement 0 0 0% 0 0%
Extraordinary Growth Facilities 0 0 0% 0 0%
Special Reserve 0 0 0%
KPERS Spec. Ret. Contribution 1,146,673 1,291,947 13% 1,511,578 17%
Contingency Reserve 0 0 0%
Text Book & Student Material 0 0 0%
Activity Fund 0 0 0% 0 0%
Bond and Interest #1 0 0 0% 0 0%
Bond and Interest #2 0 0 0% 0 0%
No-Fund Warrant 0 0 0% 0 0%
Special Assessment 0 0 0% 0 0%
Temporary Note 0 0 0% 0 0%
SUBTOTAL 11,899,544 14,785,231 24% 18,367,905 24%
Enrollment (FTE)* 18,984.2 18,984.2 0% 20,000.0 5%
Amount per Pupil 627 779 24% 918 18%
Adult Education 0 0 0% 0 0%
Adult Supplemental Education 0 0 0% 0 0%
Tuition Reimbursement 0 0 0% 0 0%
Special Education Coop 1,468,089 1,657,474 13% 1,288,484 -22%
TOTAL 13,367,633 16,442,705 23% 19,656,389 20%
Amount per Pupil $704 $866 23% $983 13%
NOTE: Gifts/Grants includes private grants and grants from nonfederal sources.
Amount per pupil excludes the following funds: Adult Education, Adult Supplemental Education, Special Education Coop
and Tuition Reimbursement.
*Enrollment (FTE) includes the enrollment of the district used for state aid and budget authority, and all other preschool enrollment
and kindergarten students attending full time.
0
2,000,000
4,000,000
6,000,000
8,000,000
10,000,000
12,000,000
14,000,000
16,000,000
18,000,000
20,000,000
2012-2013 2013-2014 2014-2015
13,367,633
16,442,705
19,656,389
Instructional Support Expenditures
9/11/2014 9:21 AM Sumexpen.xlsx Page 8 of 30
USD# 500
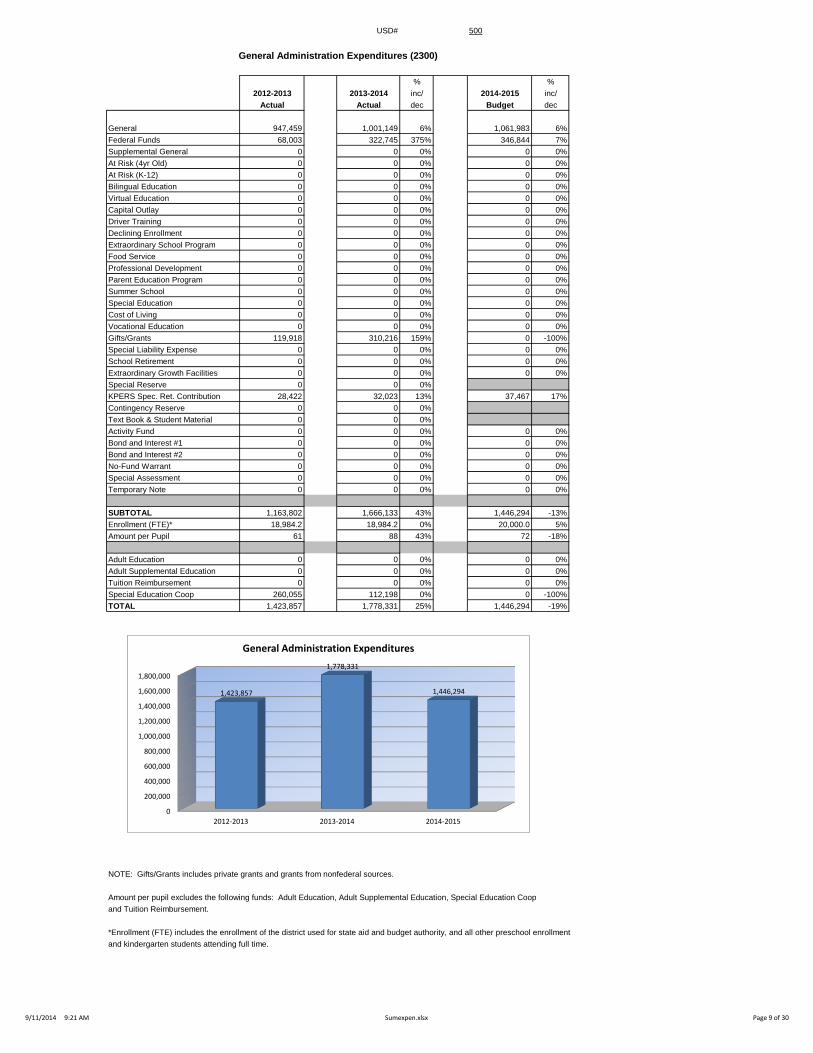
General Administration Expenditures (2300)
% %
2012-2013 2013-2014 inc/ 2014-2015 inc/
Actual Actual dec Budget dec
General 947,459 1,001,149 6% 1,061,983 6%
Federal Funds 68,003 322,745 375% 346,844 7%
Supplemental General 0 0 0% 0 0%
At Risk (4yr Old) 0 0 0% 0 0%
At Risk (K-12) 0 0 0% 0 0%
Bilingual Education 0 0 0% 0 0%
Virtual Education 0 0 0% 0 0%
Capital Outlay 0 0 0% 0 0%
Driver Training 0 0 0% 0 0%
Declining Enrollment 0 0 0% 0 0%
Extraordinary School Program 0 0 0% 0 0%
Food Service 0 0 0% 0 0%
Professional Development 0 0 0% 0 0%
Parent Education Program 0 0 0% 0 0%
Summer School 0 0 0% 0 0%
Special Education 0 0 0% 0 0%
Cost of Living 0 0 0% 0 0%
Vocational Education 0 0 0% 0 0%
Gifts/Grants 119,918 310,216 159% 0 -100%
Special Liability Expense 0 0 0% 0 0%
School Retirement 0 0 0% 0 0%
Extraordinary Growth Facilities 0 0 0% 0 0%
Special Reserve 0 0 0%
KPERS Spec. Ret. Contribution 28,422 32,023 13% 37,467 17%
Contingency Reserve 0 0 0%
Text Book & Student Material 0 0 0%
Activity Fund 0 0 0% 0 0%
Bond and Interest #1 0 0 0% 0 0%
Bond and Interest #2 0 0 0% 0 0%
No-Fund Warrant 0 0 0% 0 0%
Special Assessment 0 0 0% 0 0%
Temporary Note 0 0 0% 0 0%
SUBTOTAL 1,163,802 1,666,133 43% 1,446,294 -13%
Enrollment (FTE)* 18,984.2 18,984.2 0% 20,000.0 5%
Amount per Pupil 61 88 43% 72 -18%
Adult Education 0 0 0% 0 0%
Adult Supplemental Education 0 0 0% 0 0%
Tuition Reimbursement 0 0 0% 0 0%
Special Education Coop 260,055 112,198 0% 0 -100%
TOTAL 1,423,857 1,778,331 25% 1,446,294 -19%
NOTE: Gifts/Grants includes private grants and grants from nonfederal sources.
Amount per pupil excludes the following funds: Adult Education, Adult Supplemental Education, Special Education Coop
and Tuition Reimbursement.
*Enrollment (FTE) includes the enrollment of the district used for state aid and budget authority, and all other preschool enrollment
and kindergarten students attending full time.
0
200,000
400,000
600,000
800,000
1,000,000
1,200,000
1,400,000
1,600,000
1,800,000
2012-2013 2013-2014 2014-2015
1,423,857
1,778,331
1,446,294
General Administration Expenditures
9/11/2014 9:21 AM Sumexpen.xlsx Page 9 of 30
USD# 500
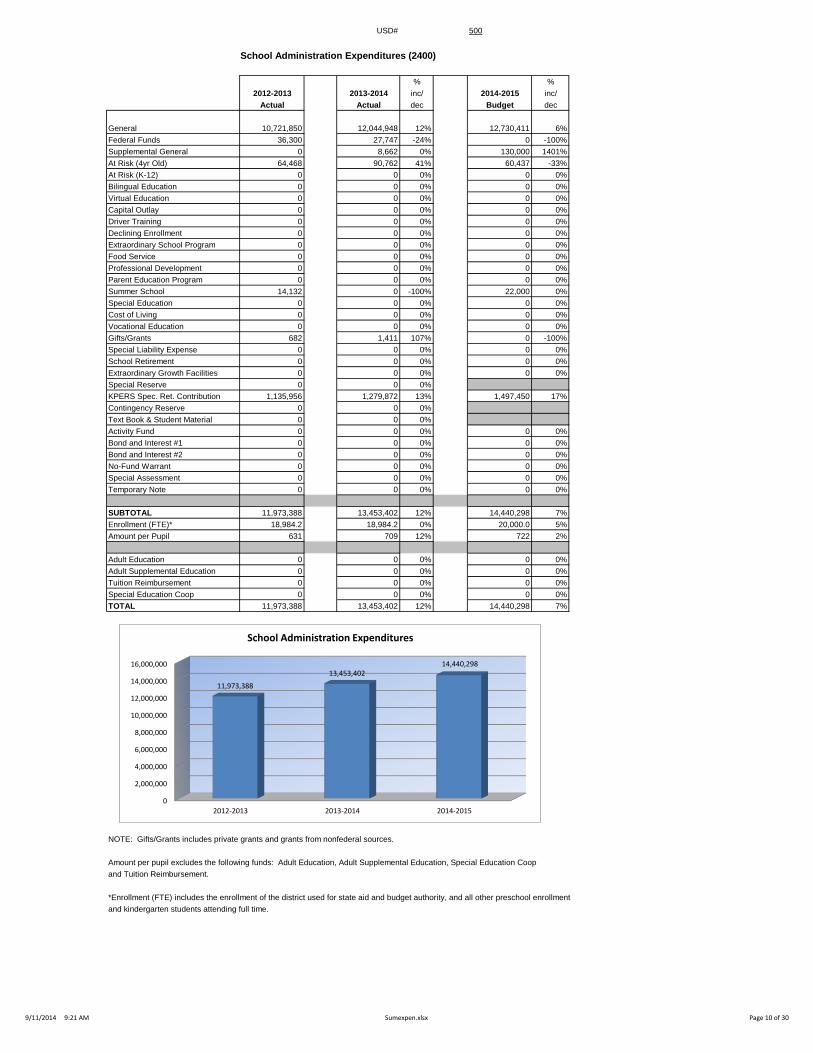
School Administration Expenditures (2400)
% %
2012-2013 2013-2014 inc/ 2014-2015 inc/
Actual Actual dec Budget dec
General 10,721,850 12,044,948 12% 12,730,411 6%
Federal Funds 36,300 27,747 -24% 0 -100%
Supplemental General 0 8,662 0% 130,000 1401%
At Risk (4yr Old) 64,468 90,762 41% 60,437 -33%
At Risk (K-12) 0 0 0% 0 0%
Bilingual Education 0 0 0% 0 0%
Virtual Education 0 0 0% 0 0%
Capital Outlay 0 0 0% 0 0%
Driver Training 0 0 0% 0 0%
Declining Enrollment 0 0 0% 0 0%
Extraordinary School Program 0 0 0% 0 0%
Food Service 0 0 0% 0 0%
Professional Development 0 0 0% 0 0%
Parent Education Program 0 0 0% 0 0%
Summer School 14,132 0 -100% 22,000 0%
Special Education 0 0 0% 0 0%
Cost of Living 0 0 0% 0 0%
Vocational Education 0 0 0% 0 0%
Gifts/Grants 682 1,411 107% 0 -100%
Special Liability Expense 0 0 0% 0 0%
School Retirement 0 0 0% 0 0%
Extraordinary Growth Facilities 0 0 0% 0 0%
Special Reserve 0 0 0%
KPERS Spec. Ret. Contribution 1,135,956 1,279,872 13% 1,497,450 17%
Contingency Reserve 0 0 0%
Text Book & Student Material 0 0 0%
Activity Fund 0 0 0% 0 0%
Bond and Interest #1 0 0 0% 0 0%
Bond and Interest #2 0 0 0% 0 0%
No-Fund Warrant 0 0 0% 0 0%
Special Assessment 0 0 0% 0 0%
Temporary Note 0 0 0% 0 0%
SUBTOTAL 11,973,388 13,453,402 12% 14,440,298 7%
Enrollment (FTE)* 18,984.2 18,984.2 0% 20,000.0 5%
Amount per Pupil 631 709 12% 722 2%
Adult Education 0 0 0% 0 0%
Adult Supplemental Education 0 0 0% 0 0%
Tuition Reimbursement 0 0 0% 0 0%
Special Education Coop 0 0 0% 0 0%
TOTAL 11,973,388 13,453,402 12% 14,440,298 7%
NOTE: Gifts/Grants includes private grants and grants from nonfederal sources.
Amount per pupil excludes the following funds: Adult Education, Adult Supplemental Education, Special Education Coop
and Tuition Reimbursement.
*Enrollment (FTE) includes the enrollment of the district used for state aid and budget authority, and all other preschool enrollment
and kindergarten students attending full time.
0
2,000,000
4,000,000
6,000,000
8,000,000
10,000,000
12,000,000
14,000,000
16,000,000
2012-2013 2013-2014 2014-2015
11,973,388
13,453,402 14,440,298
School Administration Expenditures
9/11/2014 9:21 AM Sumexpen.xlsx Page 10 of 30
USD# 500
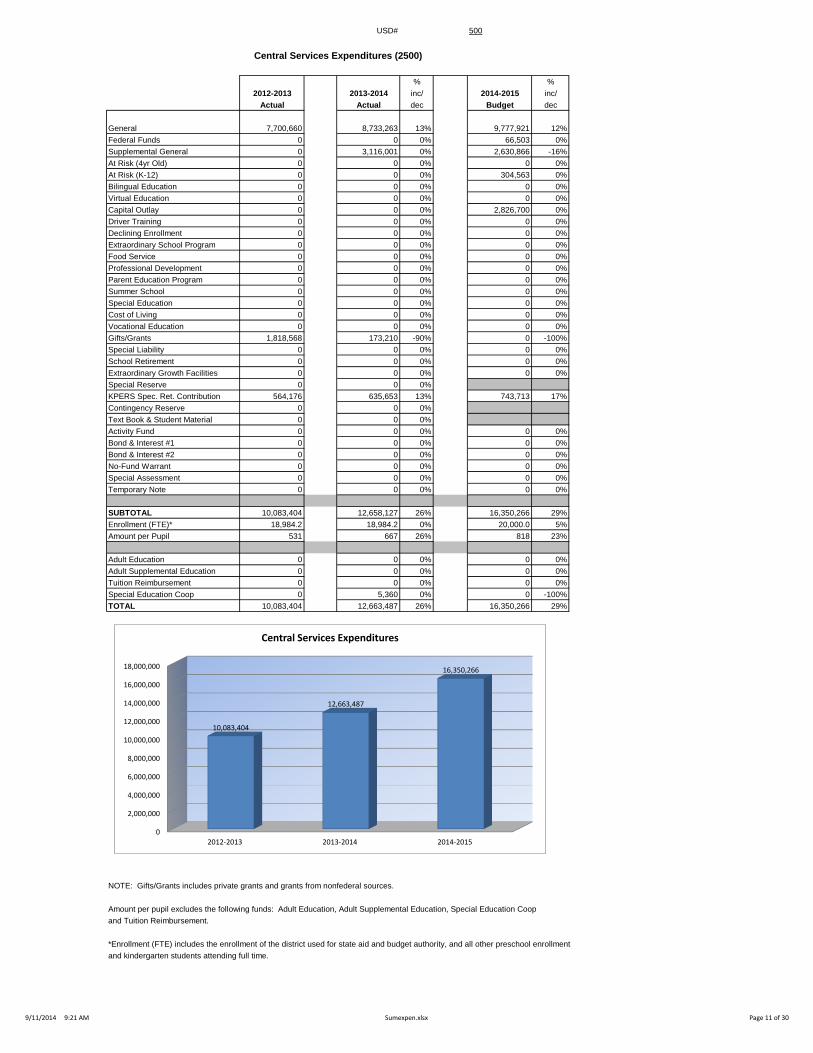
Central Services Expenditures (2500)
% %
2012-2013 2013-2014 inc/ 2014-2015 inc/
Actual Actual dec Budget dec
General 7,700,660 8,733,263 13% 9,777,921 12%
Federal Funds 0 0 0% 66,503 0%
Supplemental General 0 3,116,001 0% 2,630,866 -16%
At Risk (4yr Old) 0 0 0% 0 0%
At Risk (K-12) 0 0 0% 304,563 0%
Bilingual Education 0 0 0% 0 0%
Virtual Education 0 0 0% 0 0%
Capital Outlay 0 0 0% 2,826,700 0%
Driver Training 0 0 0% 0 0%
Declining Enrollment 0 0 0% 0 0%
Extraordinary School Program 0 0 0% 0 0%
Food Service 0 0 0% 0 0%
Professional Development 0 0 0% 0 0%
Parent Education Program 0 0 0% 0 0%
Summer School 0 0 0% 0 0%
Special Education 0 0 0% 0 0%
Cost of Living 0 0 0% 0 0%
Vocational Education 0 0 0% 0 0%
Gifts/Grants 1,818,568 173,210 -90% 0 -100%
Special Liability 0 0 0% 0 0%
School Retirement 0 0 0% 0 0%
Extraordinary Growth Facilities 0 0 0% 0 0%
Special Reserve 0 0 0%
KPERS Spec. Ret. Contribution 564,176 635,653 13% 743,713 17%
Contingency Reserve 0 0 0%
Text Book & Student Material 0 0 0%
Activity Fund 0 0 0% 0 0%
Bond & Interest #1 0 0 0% 0 0%
Bond & Interest #2 0 0 0% 0 0%
No-Fund Warrant 0 0 0% 0 0%
Special Assessment 0 0 0% 0 0%
Temporary Note 0 0 0% 0 0%
SUBTOTAL 10,083,404 12,658,127 26% 16,350,266 29%
Enrollment (FTE)* 18,984.2 18,984.2 0% 20,000.0 5%
Amount per Pupil 531 667 26% 818 23%
Adult Education 0 0 0% 0 0%
Adult Supplemental Education 0 0 0% 0 0%
Tuition Reimbursement 0 0 0% 0 0%
Special Education Coop 0 5,360 0% 0 -100%
TOTAL 10,083,404 12,663,487 26% 16,350,266 29%
NOTE: Gifts/Grants includes private grants and grants from nonfederal sources.
Amount per pupil excludes the following funds: Adult Education, Adult Supplemental Education, Special Education Coop
and Tuition Reimbursement.
*Enrollment (FTE) includes the enrollment of the district used for state aid and budget authority, and all other preschool enrollment
and kindergarten students attending full time.
0
2,000,000
4,000,000
6,000,000
8,000,000
10,000,000
12,000,000
14,000,000
16,000,000
18,000,000
2012-2013 2013-2014 2014-2015
10,083,404
12,663,487
16,350,266
Central Services Expenditures
9/11/2014 9:21 AM Sumexpen.xlsx Page 11 of 30
USD# 500
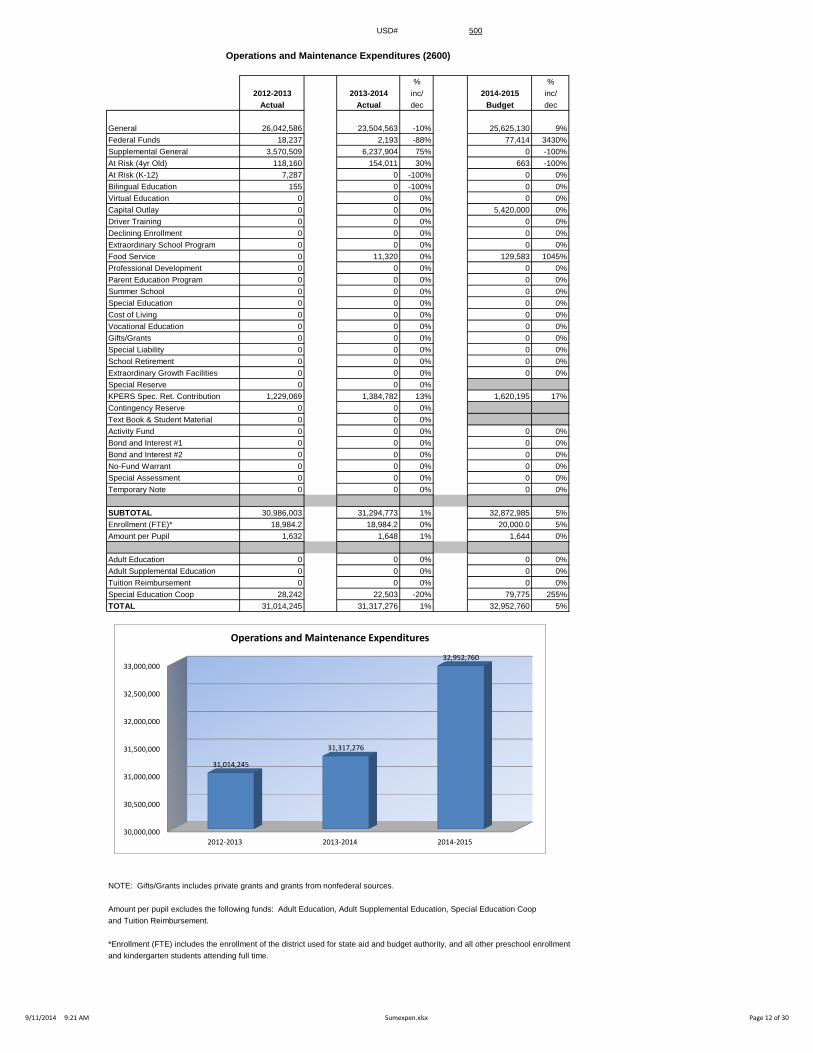
Operations and Maintenance Expenditures (2600)
% %
2012-2013 2013-2014 inc/ 2014-2015 inc/
Actual Actual dec Budget dec
General 26,042,586 23,504,563 -10% 25,625,130 9%
Federal Funds 18,237 2,193 -88% 77,414 3430%
Supplemental General 3,570,509 6,237,904 75% 0 -100%
At Risk (4yr Old) 118,160 154,011 30% 663 -100%
At Risk (K-12) 7,287 0 -100% 0 0%
Bilingual Education 155 0 -100% 0 0%
Virtual Education 0 0 0% 0 0%
Capital Outlay 0 0 0% 5,420,000 0%
Driver Training 0 0 0% 0 0%
Declining Enrollment 0 0 0% 0 0%
Extraordinary School Program 0 0 0% 0 0%
Food Service 0 11,320 0% 129,583 1045%
Professional Development 0 0 0% 0 0%
Parent Education Program 0 0 0% 0 0%
Summer School 0 0 0% 0 0%
Special Education 0 0 0% 0 0%
Cost of Living 0 0 0% 0 0%
Vocational Education 0 0 0% 0 0%
Gifts/Grants 0 0 0% 0 0%
Special Liability 0 0 0% 0 0%
School Retirement 0 0 0% 0 0%
Extraordinary Growth Facilities 0 0 0% 0 0%
Special Reserve 0 0 0%
KPERS Spec. Ret. Contribution 1,229,069 1,384,782 13% 1,620,195 17%
Contingency Reserve 0 0 0%
Text Book & Student Material 0 0 0%
Activity Fund 0 0 0% 0 0%
Bond and Interest #1 0 0 0% 0 0%
Bond and Interest #2 0 0 0% 0 0%
No-Fund Warrant 0 0 0% 0 0%
Special Assessment 0 0 0% 0 0%
Temporary Note 0 0 0% 0 0%
SUBTOTAL 30,986,003 31,294,773 1% 32,872,985 5%
Enrollment (FTE)* 18,984.2 18,984.2 0% 20,000.0 5%
Amount per Pupil 1,632 1,648 1% 1,644 0%
Adult Education 0 0 0% 0 0%
Adult Supplemental Education 0 0 0% 0 0%
Tuition Reimbursement 0 0 0% 0 0%
Special Education Coop 28,242 22,503 -20% 79,775 255%
TOTAL 31,014,245 31,317,276 1% 32,952,760 5%
NOTE: Gifts/Grants includes private grants and grants from nonfederal sources.
Amount per pupil excludes the following funds: Adult Education, Adult Supplemental Education, Special Education Coop
and Tuition Reimbursement.
*Enrollment (FTE) includes the enrollment of the district used for state aid and budget authority, and all other preschool enrollment
and kindergarten students attending full time.
30,000,000
30,500,000
31,000,000
31,500,000
32,000,000
32,500,000
33,000,000
2012-2013 2013-2014 2014-2015
31,014,245
31,317,276
32,952,760
Operations and Maintenance Expenditures
9/11/2014 9:21 AM Sumexpen.xlsx Page 12 of 30
USD# 500
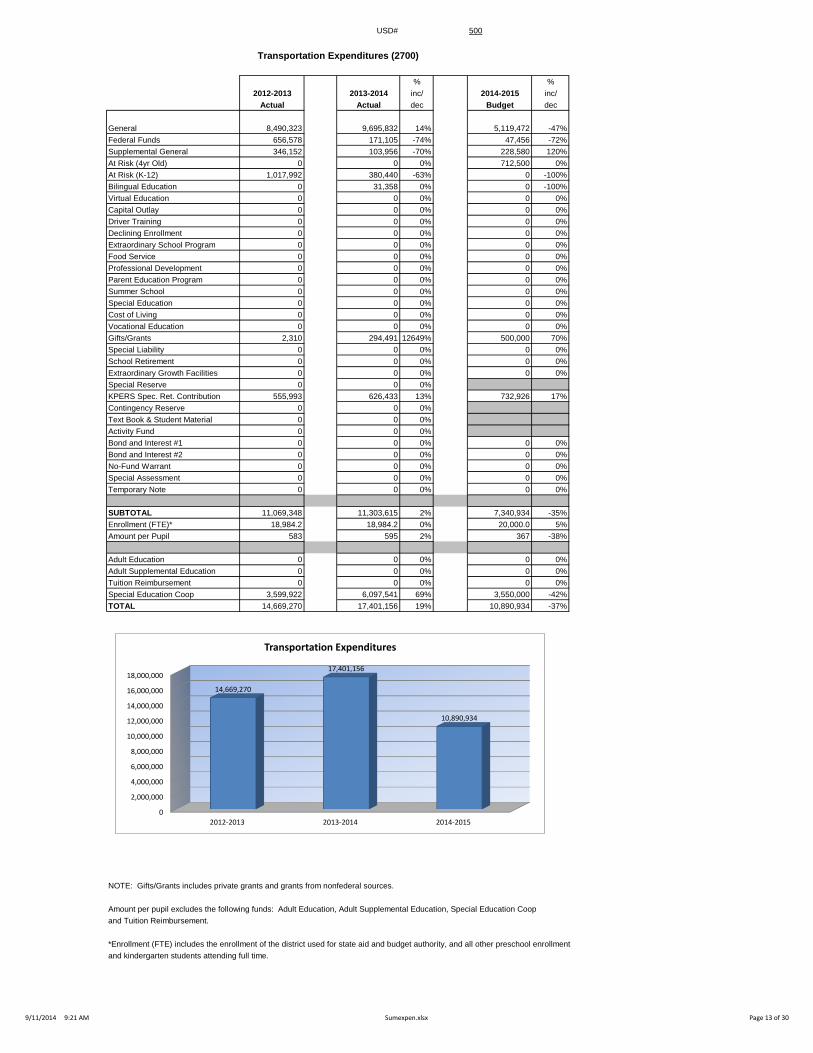
Transportation Expenditures (2700)
% %
2012-2013 2013-2014 inc/ 2014-2015 inc/
Actual Actual dec Budget dec
General 8,490,323 9,695,832 14% 5,119,472 -47%
Federal Funds 656,578 171,105 -74% 47,456 -72%
Supplemental General 346,152 103,956 -70% 228,580 120%
At Risk (4yr Old) 0 0 0% 712,500 0%
At Risk (K-12) 1,017,992 380,440 -63% 0 -100%
Bilingual Education 0 31,358 0% 0 -100%
Virtual Education 0 0 0% 0 0%
Capital Outlay 0 0 0% 0 0%
Driver Training 0 0 0% 0 0%
Declining Enrollment 0 0 0% 0 0%
Extraordinary School Program 0 0 0% 0 0%
Food Service 0 0 0% 0 0%
Professional Development 0 0 0% 0 0%
Parent Education Program 0 0 0% 0 0%
Summer School 0 0 0% 0 0%
Special Education 0 0 0% 0 0%
Cost of Living 0 0 0% 0 0%
Vocational Education 0 0 0% 0 0%
Gifts/Grants 2,310 294,491 12649% 500,000 70%
Special Liability 0 0 0% 0 0%
School Retirement 0 0 0% 0 0%
Extraordinary Growth Facilities 0 0 0% 0 0%
Special Reserve 0 0 0%
KPERS Spec. Ret. Contribution 555,993 626,433 13% 732,926 17%
Contingency Reserve 0 0 0%
Text Book & Student Material 0 0 0%
Activity Fund 0 0 0%
Bond and Interest #1 0 0 0% 0 0%
Bond and Interest #2 0 0 0% 0 0%
No-Fund Warrant 0 0 0% 0 0%
Special Assessment 0 0 0% 0 0%
Temporary Note 0 0 0% 0 0%
SUBTOTAL 11,069,348 11,303,615 2% 7,340,934 -35%
Enrollment (FTE)* 18,984.2 18,984.2 0% 20,000.0 5%
Amount per Pupil 583 595 2% 367 -38%
Adult Education 0 0 0% 0 0%
Adult Supplemental Education 0 0 0% 0 0%
Tuition Reimbursement 0 0 0% 0 0%
Special Education Coop 3,599,922 6,097,541 69% 3,550,000 -42%
TOTAL 14,669,270 17,401,156 19% 10,890,934 -37%
NOTE: Gifts/Grants includes private grants and grants from nonfederal sources.
Amount per pupil excludes the following funds: Adult Education, Adult Supplemental Education, Special Education Coop
and Tuition Reimbursement.
*Enrollment (FTE) includes the enrollment of the district used for state aid and budget authority, and all other preschool enrollment
and kindergarten students attending full time.
0
2,000,000
4,000,000
6,000,000
8,000,000
10,000,000
12,000,000
14,000,000
16,000,000
18,000,000
2012-2013 2013-2014 2014-2015
14,669,270
17,401,156
10,890,934
Transportation Expenditures
9/11/2014 9:21 AM Sumexpen.xlsx Page 13 of 30

USD# 500
Other Support Services Expenditures (2900)
% %
2012-2013 2013-2014 inc/ 2014-2015 inc/
Actual Actual dec Budget dec
General 0 54,818 0% 0 -100%
Federal Funds 0 0 0% 0 0%
Supplemental General 0 0 0% 0 0%
At Risk (4yr Old) 0 0 0% 0 0%
At Risk (K-12) 0 0 0% 0 0%
Bilingual Education 0 0 0% 0 0%
Virtual Education 0 0 0% 0 0%
Capital Outlay 0 0 0% 0 0%
Driver Training 0 0 0% 0 0%
Declining Enrollment 0 0 0% 0 0%
Extraordinary School Program 0 0 0% 0 0%
Food Service 0 0 0% 0 0%
Professional Development 0 0 0% 0 0%
Parent Education Program 0 0 0% 0 0%
Summer School 0 0 0% 0 0%
Special Education 0 0 0% 0 0%
Cost of Living 0 0 0% 0 0%
Vocational Education 0 0 0% 0 0%
Gifts/Grants 0 0 0% 0 0%
Special Liability 0 0 0% 0 0%
School Retirement 0 0 0% 0 0%
Extraordinary Growth Facilities 0 0 0% 0 0%
Special Reserve 0 0 0%
KPERS Spec. Ret. Contribution 0 0 0% 0 0%
Contingency Reserve 0 0 0%
Text Book & Student Material 0 0 0%
Activity Fund 0 0 0%
Bond and Interest #1 0 0 0% 0 0%
Bond and Interest #2 0 0 0% 0 0%
No-Fund Warrant 0 0 0% 0 0%
Special Assessment 0 0 0% 0 0%
Temporary Note 0 0 0% 0 0%
SUBTOTAL 0 54,818 0% 0 -100%
Enrollment (FTE)* 18,984.2 18,984.2 0% 20,000.0 5%
Amount per Pupil 0 3 0% 0 -100%
Adult Education 0 0 0% 0 0%
Adult Supplemental Education 0 0 0% 0 0%
Tuition Reimbursement 0 0 0% 0 0%
Special Education Coop 0 0 0% 0 0%
TOTAL 0 54,818 0% 0 -100%
NOTE: Gifts/Grants includes private grants and grants from nonfederal sources.
Amount per pupil excludes the following funds: Adult Education, Adult Supplemental Education, Special Education Coop
and Tuition Reimbursement.
*Enrollment (FTE) includes the enrollment of the district used for state aid and budget authority, and all other preschool enrollment
and kindergarten students attending full time.
0
10,000
20,000
30,000
40,000
50,000
60,000
2012-2013 2013-2014 2014-2015
0
54,818
0
Other Support Services Expenditures
9/11/2014 9:21 AM Sumexpen.xlsx Page 14 of 30
USD# 500
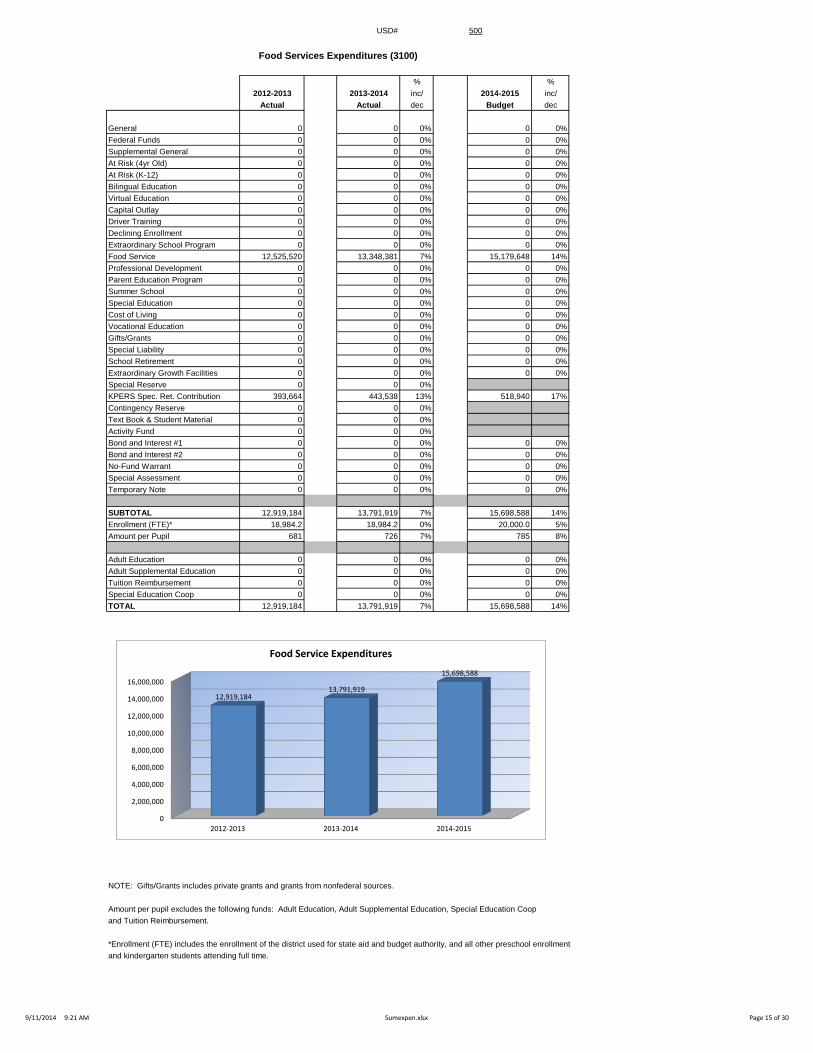
Food Services Expenditures (3100)
% %
2012-2013 2013-2014 inc/ 2014-2015 inc/
Actual Actual dec Budget dec
General 0 0 0% 0 0%
Federal Funds 0 0 0% 0 0%
Supplemental General 0 0 0% 0 0%
At Risk (4yr Old) 0 0 0% 0 0%
At Risk (K-12) 0 0 0% 0 0%
Bilingual Education 0 0 0% 0 0%
Virtual Education 0 0 0% 0 0%
Capital Outlay 0 0 0% 0 0%
Driver Training 0 0 0% 0 0%
Declining Enrollment 0 0 0% 0 0%
Extraordinary School Program 0 0 0% 0 0%
Food Service 12,525,520 13,348,381 7% 15,179,648 14%
Professional Development 0 0 0% 0 0%
Parent Education Program 0 0 0% 0 0%
Summer School 0 0 0% 0 0%
Special Education 0 0 0% 0 0%
Cost of Living 0 0 0% 0 0%
Vocational Education 0 0 0% 0 0%
Gifts/Grants 0 0 0% 0 0%
Special Liability 0 0 0% 0 0%
School Retirement 0 0 0% 0 0%
Extraordinary Growth Facilities 0 0 0% 0 0%
Special Reserve 0 0 0%
KPERS Spec. Ret. Contribution 393,664 443,538 13% 518,940 17%
Contingency Reserve 0 0 0%
Text Book & Student Material 0 0 0%
Activity Fund 0 0 0%
Bond and Interest #1 0 0 0% 0 0%
Bond and Interest #2 0 0 0% 0 0%
No-Fund Warrant 0 0 0% 0 0%
Special Assessment 0 0 0% 0 0%
Temporary Note 0 0 0% 0 0%
SUBTOTAL 12,919,184 13,791,919 7% 15,698,588 14%
Enrollment (FTE)* 18,984.2 18,984.2 0% 20,000.0 5%
Amount per Pupil 681 726 7% 785 8%
Adult Education 0 0 0% 0 0%
Adult Supplemental Education 0 0 0% 0 0%
Tuition Reimbursement 0 0 0% 0 0%
Special Education Coop 0 0 0% 0 0%
TOTAL 12,919,184 13,791,919 7% 15,698,588 14%
NOTE: Gifts/Grants includes private grants and grants from nonfederal sources.
Amount per pupil excludes the following funds: Adult Education, Adult Supplemental Education, Special Education Coop
and Tuition Reimbursement.
*Enrollment (FTE) includes the enrollment of the district used for state aid and budget authority, and all other preschool enrollment
and kindergarten students attending full time.
0
2,000,000
4,000,000
6,000,000
8,000,000
10,000,000
12,000,000
14,000,000
16,000,000
2012-2013 2013-2014 2014-2015
12,919,184 13,791,919
15,698,588
Food Service Expenditures
9/11/2014 9:21 AM Sumexpen.xlsx Page 15 of 30
USD# 500
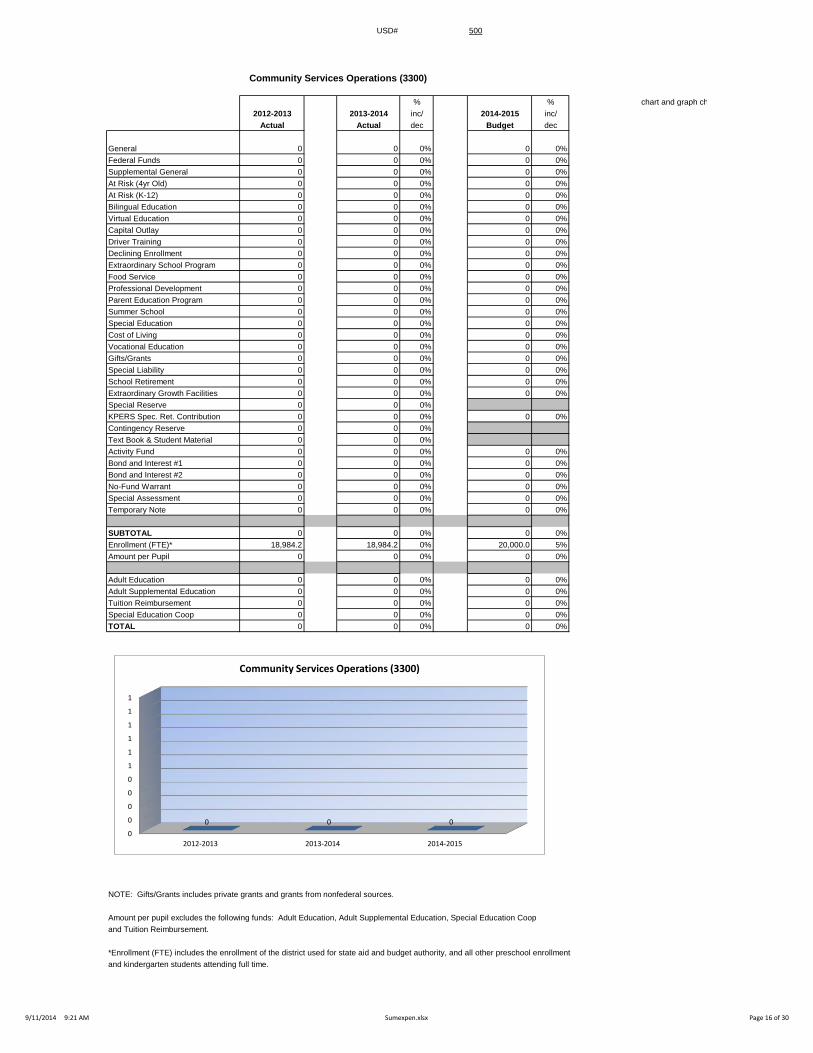
Community Services Operations (3300)
% % chart and graph checked
2012-2013 2013-2014 inc/ 2014-2015 inc/
Actual Actual dec Budget dec
General 0 0 0% 0 0%
Federal Funds 0 0 0% 0 0%
Supplemental General 0 0 0% 0 0%
At Risk (4yr Old) 0 0 0% 0 0%
At Risk (K-12) 0 0 0% 0 0%
Bilingual Education 0 0 0% 0 0%
Virtual Education 0 0 0% 0 0%
Capital Outlay 0 0 0% 0 0%
Driver Training 0 0 0% 0 0%
Declining Enrollment 0 0 0% 0 0%
Extraordinary School Program 0 0 0% 0 0%
Food Service 0 0 0% 0 0%
Professional Development 0 0 0% 0 0%
Parent Education Program 0 0 0% 0 0%
Summer School 0 0 0% 0 0%
Special Education 0 0 0% 0 0%
Cost of Living 0 0 0% 0 0%
Vocational Education 0 0 0% 0 0%
Gifts/Grants 0 0 0% 0 0%
Special Liability 0 0 0% 0 0%
School Retirement 0 0 0% 0 0%
Extraordinary Growth Facilities 0 0 0% 0 0%
Special Reserve 0 0 0%
KPERS Spec. Ret. Contribution 0 0 0% 0 0%
Contingency Reserve 0 0 0%
Text Book & Student Material 0 0 0%
Activity Fund 0 0 0% 0 0%
Bond and Interest #1 0 0 0% 0 0%
Bond and Interest #2 0 0 0% 0 0%
No-Fund Warrant 0 0 0% 0 0%
Special Assessment 0 0 0% 0 0%
Temporary Note 0 0 0% 0 0%
SUBTOTAL 0 0 0% 0 0%
Enrollment (FTE)* 18,984.2 18,984.2 0% 20,000.0 5%
Amount per Pupil 0 0 0% 0 0%
Adult Education 0 0 0% 0 0%
Adult Supplemental Education 0 0 0% 0 0%
Tuition Reimbursement 0 0 0% 0 0%
Special Education Coop 0 0 0% 0 0%
TOTAL 0 0 0% 0 0%
NOTE: Gifts/Grants includes private grants and grants from nonfederal sources.
Amount per pupil excludes the following funds: Adult Education, Adult Supplemental Education, Special Education Coop
and Tuition Reimbursement.
*Enrollment (FTE) includes the enrollment of the district used for state aid and budget authority, and all other preschool enrollment
and kindergarten students attending full time.
0
0
0
0
0
1
1
1
1
1
1
2012-2013 2013-2014 2014-2015
0 0 0
Community Services Operations (3300)
9/11/2014 9:21 AM Sumexpen.xlsx Page 16 of 30
USD# 500
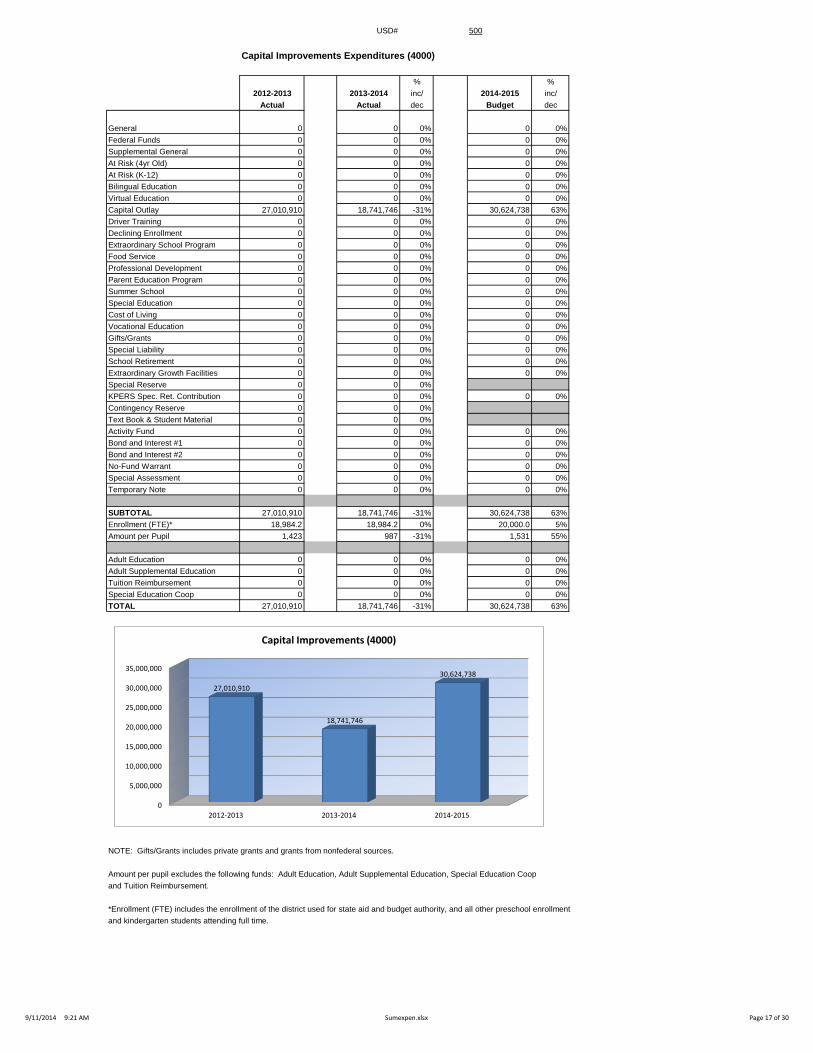
Capital Improvements Expenditures (4000)
% %
2012-2013 2013-2014 inc/ 2014-2015 inc/
Actual Actual dec Budget dec
General 0 0 0% 0 0%
Federal Funds 0 0 0% 0 0%
Supplemental General 0 0 0% 0 0%
At Risk (4yr Old) 0 0 0% 0 0%
At Risk (K-12) 0 0 0% 0 0%
Bilingual Education 0 0 0% 0 0%
Virtual Education 0 0 0% 0 0%
Capital Outlay 27,010,910 18,741,746 -31% 30,624,738 63%
Driver Training 0 0 0% 0 0%
Declining Enrollment 0 0 0% 0 0%
Extraordinary School Program 0 0 0% 0 0%
Food Service 0 0 0% 0 0%
Professional Development 0 0 0% 0 0%
Parent Education Program 0 0 0% 0 0%
Summer School 0 0 0% 0 0%
Special Education 0 0 0% 0 0%
Cost of Living 0 0 0% 0 0%
Vocational Education 0 0 0% 0 0%
Gifts/Grants 0 0 0% 0 0%
Special Liability 0 0 0% 0 0%
School Retirement 0 0 0% 0 0%
Extraordinary Growth Facilities 0 0 0% 0 0%
Special Reserve 0 0 0%
KPERS Spec. Ret. Contribution 0 0 0% 0 0%
Contingency Reserve 0 0 0%
Text Book & Student Material 0 0 0%
Activity Fund 0 0 0% 0 0%
Bond and Interest #1 0 0 0% 0 0%
Bond and Interest #2 0 0 0% 0 0%
No-Fund Warrant 0 0 0% 0 0%
Special Assessment 0 0 0% 0 0%
Temporary Note 0 0 0% 0 0%
SUBTOTAL 27,010,910 18,741,746 -31% 30,624,738 63%
Enrollment (FTE)* 18,984.2 18,984.2 0% 20,000.0 5%
Amount per Pupil 1,423 987 -31% 1,531 55%
Adult Education 0 0 0% 0 0%
Adult Supplemental Education 0 0 0% 0 0%
Tuition Reimbursement 0 0 0% 0 0%
Special Education Coop 0 0 0% 0 0%
TOTAL 27,010,910 18,741,746 -31% 30,624,738 63%
NOTE: Gifts/Grants includes private grants and grants from nonfederal sources.
Amount per pupil excludes the following funds: Adult Education, Adult Supplemental Education, Special Education Coop
and Tuition Reimbursement.
*Enrollment (FTE) includes the enrollment of the district used for state aid and budget authority, and all other preschool enrollment
and kindergarten students attending full time.
0
5,000,000
10,000,000
15,000,000
20,000,000
25,000,000
30,000,000
35,000,000
2012-2013 2013-2014 2014-2015
27,010,910
18,741,746
30,624,738
Capital Improvements (4000)
9/11/2014 9:21 AM Sumexpen.xlsx Page 17 of 30

USD# 500
Debt Services Expenditures (5100)
% %
2012-2013 2013-2014 inc/ 2014-2015 inc/
Actual Actual dec Budget dec
General 0 0 0% 0 0%
Federal Funds 0 0 0% 0 0%
Supplemental General 0 0 0% 0 0%
At Risk (4yr Old) 0 0 0% 0 0%
At Risk (K-12) 0 0 0% 0 0%
Bilingual Education 0 0 0% 0 0%
Virtual Education 0 0 0% 0 0%
Capital Outlay 0 0 0% 0 0%
Driver Training 0 0 0% 0 0%
Declining Enrollment 0 0 0% 0 0%
Extraordinary School Program 0 0 0% 0 0%
Food Service 0 0 0% 0 0%
Professional Development 0 0 0% 0 0%
Parent Education Program 0 0 0% 0 0%
Summer School 0 0 0% 0 0%
Special Education 0 0 0% 0 0%
Cost of Living 0 0 0% 0 0%
Vocational Education 0 0 0% 0 0%
Gifts/Grants 0 0 0% 0 0%
Special Liability 0 0 0% 0 0%
School Retirement 0 0 0% 0 0%
Extraordinary Growth Facilities 0 0 0% 0 0%
Special Reserve 0 0 0%
KPERS Spec. Ret. Contribution 0 0 0% 0 0%
Contingency Reserve 0 0 0%
Text Book & Student Material 0 0 0%
Activity Fund 0 0 0% 0 0%
Bond and Interest #1 8,866,803 9,550,804 8% 10,195,528 7%
Bond and Interest #2 0 0 0% 0 0%
No-Fund Warrant 0 0 0% 0 0%
Special Assessment 0 0 0% 0 0%
Temporary Note 0 0 0% 0 0%
SUBTOTAL 8,866,803 9,550,804 8% 10,195,528 7%
Enrollment (FTE)* 18,984.2 18,984.2 0% 20,000.0 5%
Amount per Pupil 467 503 8% 510 1%
Adult Education 0 0 0% 0 0%
Adult Supplemental Education 0 0 0% 0 0%
Tuition Reimbursement 0 0 0% 0 0%
Special Education Coop 0 0 0% 0 0%
TOTAL 8,866,803 9,550,804 8% 10,195,528 7%
NOTE: Gifts/Grants includes private grants and grants from nonfederal sources.
Amount per pupil excludes the following funds: Adult Education, Adult Supplemental Education, Special Education Coop
and Tuition Reimbursement.
*Enrollment (FTE) includes the enrollment of the district used for state aid and budget authority, and all other preschool enrollment
and kindergarten students attending full time.
8,200,000
8,400,000
8,600,000
8,800,000
9,000,000
9,200,000
9,400,000
9,600,000
9,800,000
10,000,000
10,200,000
2012-2013 2013-2014 2014-2015
8,866,803
9,550,804
10,195,528
Deb Services (5100)
9/11/2014 9:21 AM Sumexpen.xlsx Page 18 of 30
USD# 500
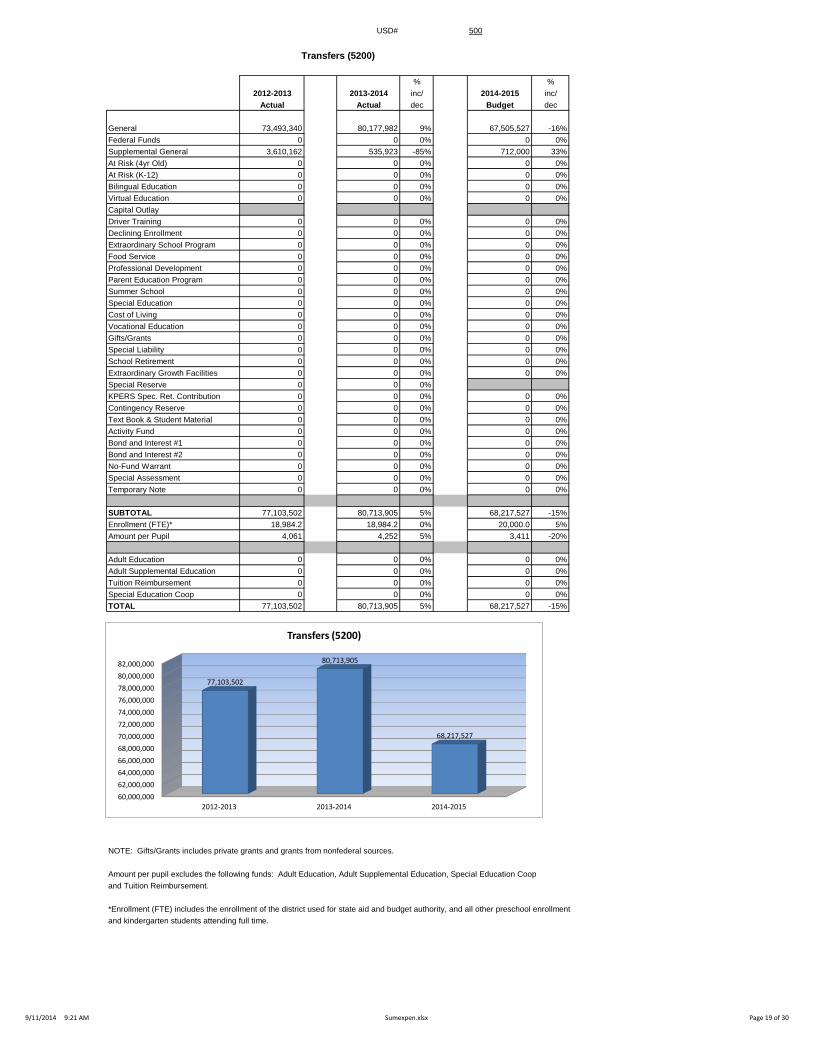
Transfers (5200)
% %
2012-2013 2013-2014 inc/ 2014-2015 inc/
Actual Actual dec Budget dec
General 73,493,340 80,177,982 9% 67,505,527 -16%
Federal Funds 0 0 0% 0 0%
Supplemental General 3,610,162 535,923 -85% 712,000 33%
At Risk (4yr Old) 0 0 0% 0 0%
At Risk (K-12) 0 0 0% 0 0%
Bilingual Education 0 0 0% 0 0%
Virtual Education 0 0 0% 0 0%
Capital Outlay
Driver Training 0 0 0% 0 0%
Declining Enrollment 0 0 0% 0 0%
Extraordinary School Program 0 0 0% 0 0%
Food Service 0 0 0% 0 0%
Professional Development 0 0 0% 0 0%
Parent Education Program 0 0 0% 0 0%
Summer School 0 0 0% 0 0%
Special Education 0 0 0% 0 0%
Cost of Living 0 0 0% 0 0%
Vocational Education 0 0 0% 0 0%
Gifts/Grants 0 0 0% 0 0%
Special Liability 0 0 0% 0 0%
School Retirement 0 0 0% 0 0%
Extraordinary Growth Facilities 0 0 0% 0 0%
Special Reserve 0 0 0%
KPERS Spec. Ret. Contribution 0 0 0% 0 0%
Contingency Reserve 0 0 0% 0 0%
Text Book & Student Material 0 0 0% 0 0%
Activity Fund 0 0 0% 0 0%
Bond and Interest #1 0 0 0% 0 0%
Bond and Interest #2 0 0 0% 0 0%
No-Fund Warrant 0 0 0% 0 0%
Special Assessment 0 0 0% 0 0%
Temporary Note 0 0 0% 0 0%
SUBTOTAL 77,103,502 80,713,905 5% 68,217,527 -15%
Enrollment (FTE)* 18,984.2 18,984.2 0% 20,000.0 5%
Amount per Pupil 4,061 4,252 5% 3,411 -20%
Adult Education 0 0 0% 0 0%
Adult Supplemental Education 0 0 0% 0 0%
Tuition Reimbursement 0 0 0% 0 0%
Special Education Coop 0 0 0% 0 0%
TOTAL 77,103,502 80,713,905 5% 68,217,527 -15%
NOTE: Gifts/Grants includes private grants and grants from nonfederal sources.
Amount per pupil excludes the following funds: Adult Education, Adult Supplemental Education, Special Education Coop
and Tuition Reimbursement.
*Enrollment (FTE) includes the enrollment of the district used for state aid and budget authority, and all other preschool enrollment
and kindergarten students attending full time.
60,000,000
62,000,000
64,000,000
66,000,000
68,000,000
70,000,000
72,000,000
74,000,000
76,000,000
78,000,000
80,000,000
82,000,000
2012-2013 2013-2014 2014-2015
77,103,502
80,713,905
68,217,527
Transfers (5200)
9/11/2014 9:21 AM Sumexpen.xlsx Page 19 of 30
USD# 500
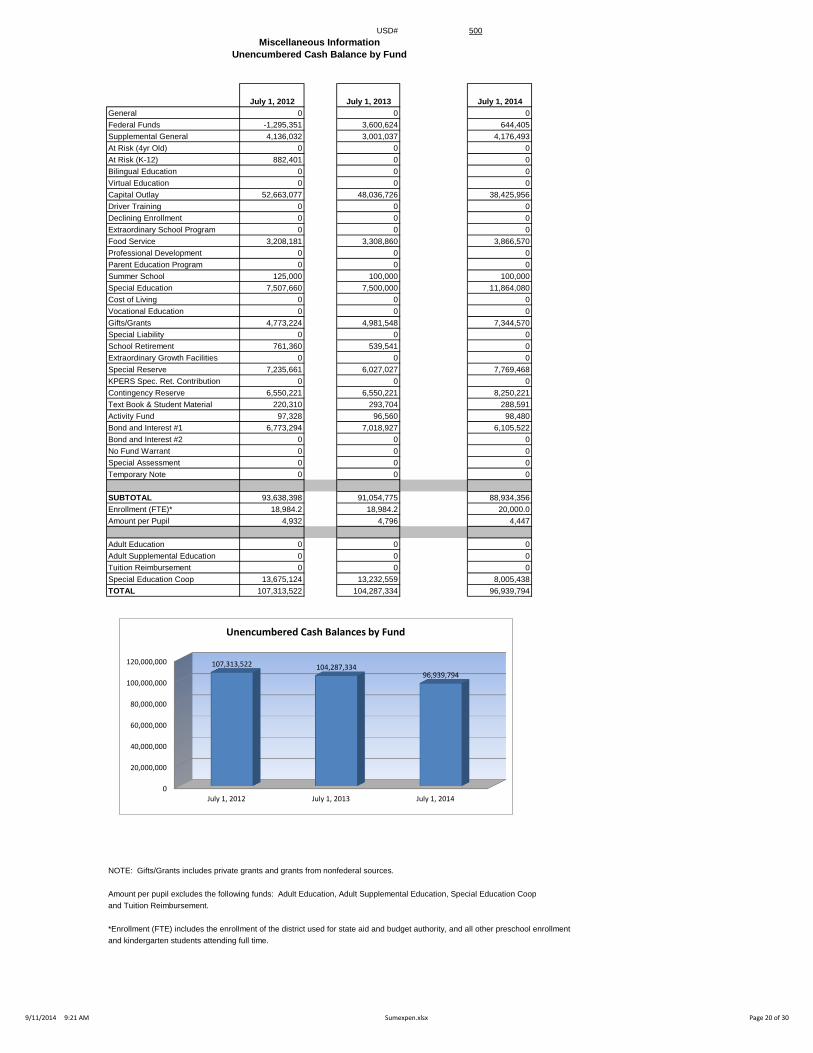
Miscellaneous Information
Unencumbered Cash Balance by Fund
July 1, 2012 July 1, 2013 July 1, 2014
General 0 0 0
Federal Funds -1,295,351 3,600,624 644,405
Supplemental General 4,136,032 3,001,037 4,176,493
At Risk (4yr Old) 0 0 0
At Risk (K-12) 882,401 0 0
Bilingual Education 0 0 0
Virtual Education 0 0 0
Capital Outlay 52,663,077 48,036,726 38,425,956
Driver Training 0 0 0
Declining Enrollment 0 0 0
Extraordinary School Program 0 0 0
Food Service 3,208,181 3,308,860 3,866,570
Professional Development 0 0 0
Parent Education Program 0 0 0
Summer School 125,000 100,000 100,000
Special Education 7,507,660 7,500,000 11,864,080
Cost of Living 0 0 0
Vocational Education 0 0 0
Gifts/Grants 4,773,224 4,981,548 7,344,570
Special Liability 0 0 0
School Retirement 761,360 539,541 0
Extraordinary Growth Facilities 0 0 0
Special Reserve 7,235,661 6,027,027 7,769,468
KPERS Spec. Ret. Contribution 0 0 0
Contingency Reserve 6,550,221 6,550,221 8,250,221
Text Book & Student Material 220,310 293,704 288,591
Activity Fund 97,328 96,560 98,480
Bond and Interest #1 6,773,294 7,018,927 6,105,522
Bond and Interest #2 0 0 0
No Fund Warrant 0 0 0
Special Assessment 0 0 0
Temporary Note 0 0 0
SUBTOTAL 93,638,398 91,054,775 88,934,356
Enrollment (FTE)* 18,984.2 18,984.2 20,000.0
Amount per Pupil 4,932 4,796 4,447
Adult Education 0 0 0
Adult Supplemental Education 0 0 0
Tuition Reimbursement 0 0 0
Special Education Coop 13,675,124 13,232,559 8,005,438
TOTAL 107,313,522 104,287,334 96,939,794
NOTE: Gifts/Grants includes private grants and grants from nonfederal sources.
Amount per pupil excludes the following funds: Adult Education, Adult Supplemental Education, Special Education Coop
and Tuition Reimbursement.
*Enrollment (FTE) includes the enrollment of the district used for state aid and budget authority, and all other preschool enrollment
and kindergarten students attending full time.
0
20,000,000
40,000,000
60,000,000
80,000,000
100,000,000
120,000,000
July 1, 2012 July 1, 2013 July 1, 2014
107,313,522 104,287,334 96,939,794
Unencumbered Cash Balances by Fund
9/11/2014 9:21 AM Sumexpen.xlsx Page 20 of 30
USD# 500
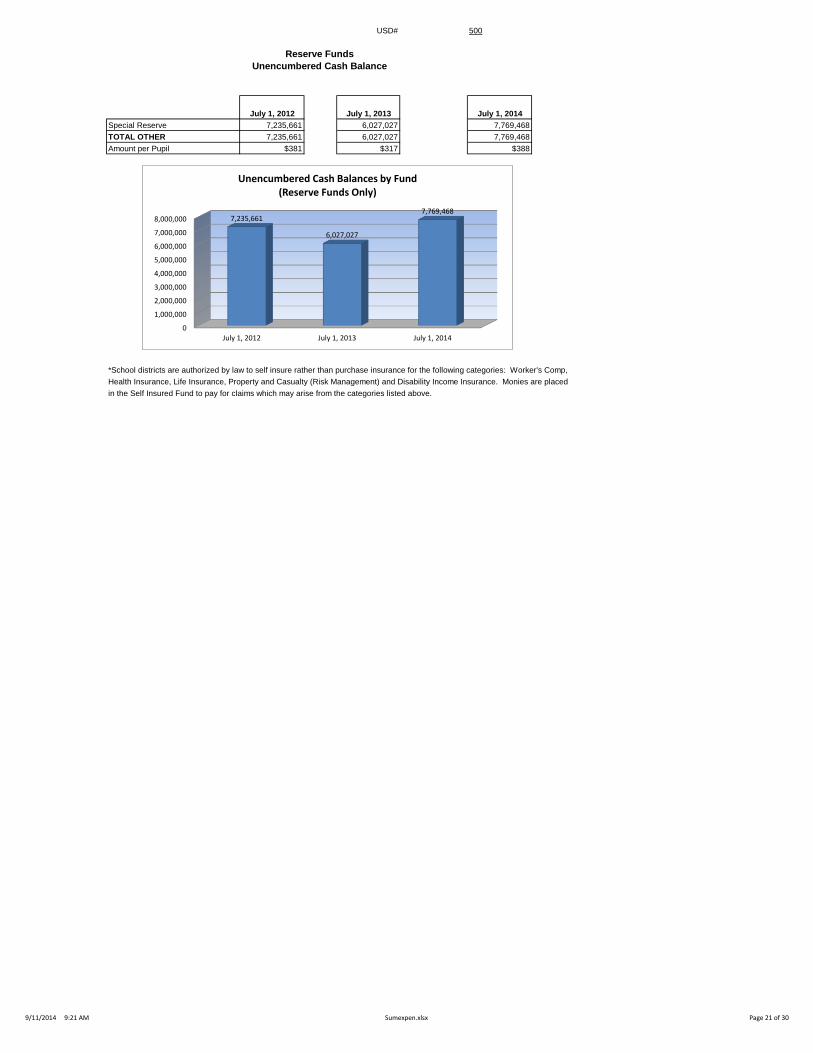
Reserve Funds
Unencumbered Cash Balance
July 1, 2012 July 1, 2013 July 1, 2014
Special Reserve 7,235,661 6,027,027 7,769,468
TOTAL OTHER 7,235,661 6,027,027 7,769,468
Amount per Pupil $381 $317 $388
*School districts are authorized by law to self insure rather than purchase insurance for the following categories: Worker's Comp,
Health Insurance, Life Insurance, Property and Casualty (Risk Management) and Disability Income Insurance. Monies are placed
in the Self Insured Fund to pay for claims which may arise from the categories listed above.
0
1,000,000
2,000,000
3,000,000
4,000,000
5,000,000
6,000,000
7,000,000
8,000,000
July 1, 2012 July 1, 2013 July 1, 2014
7,235,661
6,027,027
7,769,468
Unencumbered Cash Balances by Fund (Reserve Funds Only)
9/11/2014 9:21 AM Sumexpen.xlsx Page 21 of 30
USD# 500
2010-2011 2011-2012 % 2012-2013 % 2013-2014 % 2014-2015 %
Actual Actual inc/ Actual inc/ Actual inc/ Budget inc/
dec dec dec dec
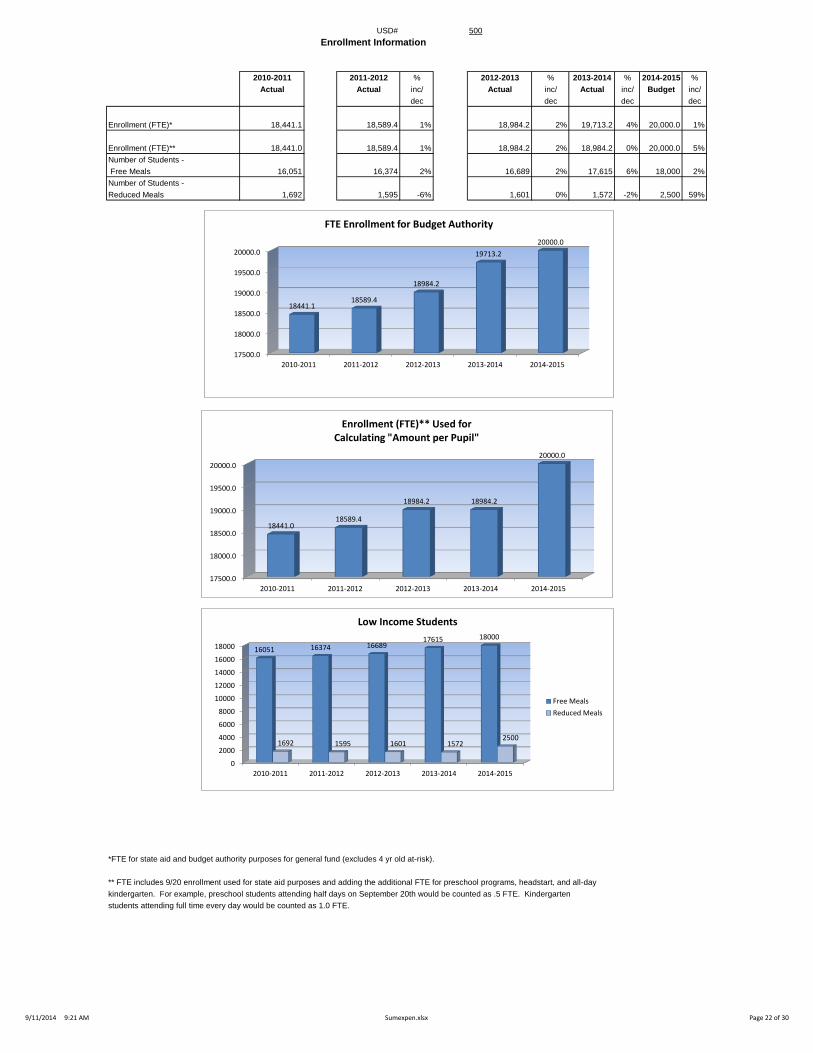
Enrollment (FTE)* 18,441.1 18,589.4 1% 18,984.2 2% 19,713.2 4% 20,000.0 1%
Enrollment (FTE)** 18,441.0 18,589.4 1% 18,984.2 2% 18,984.2 0% 20,000.0 5%
Number of Students -
Free Meals 16,051 16,374 2% 16,689 2% 17,615 6% 18,000 2%
Number of Students -
Reduced Meals 1,692 1,595 -6% 1,601 0% 1,572 -2% 2,500 59%
*FTE for state aid and budget authority purposes for general fund (excludes 4 yr old at-risk).
** FTE includes 9/20 enrollment used for state aid purposes and adding the additional FTE for preschool programs, headstart, and all-day
kindergarten. For example, preschool students attending half days on September 20th would be counted as .5 FTE. Kindergarten
students attending full time every day would be counted as 1.0 FTE.
Enrollment Information
17500.0
18000.0
18500.0
19000.0
19500.0
20000.0
2010-2011 2011-2012 2012-2013 2013-2014 2014-2015
18441.0 18589.4
18984.2 18984.2
20000.0
Enrollment (FTE)** Used for Calculating "Amount per Pupil"
0
2000
4000
6000
8000
10000
12000
14000
16000
18000
2010-2011 2011-2012 2012-2013 2013-2014 2014-2015
16051 16374 16689 17615 18000
1692 1595 1601 1572 2500
Low Income Students
Free Meals
Reduced Meals
17500.0
18000.0
18500.0
19000.0
19500.0
20000.0
2010-2011 2011-2012 2012-2013 2013-2014 2014-2015
18441.1 18589.4
18984.2
19713.2
20000.0
FTE Enrollment for Budget Authority
9/11/2014 9:21 AM Sumexpen.xlsx Page 22 of 30
USD# 500
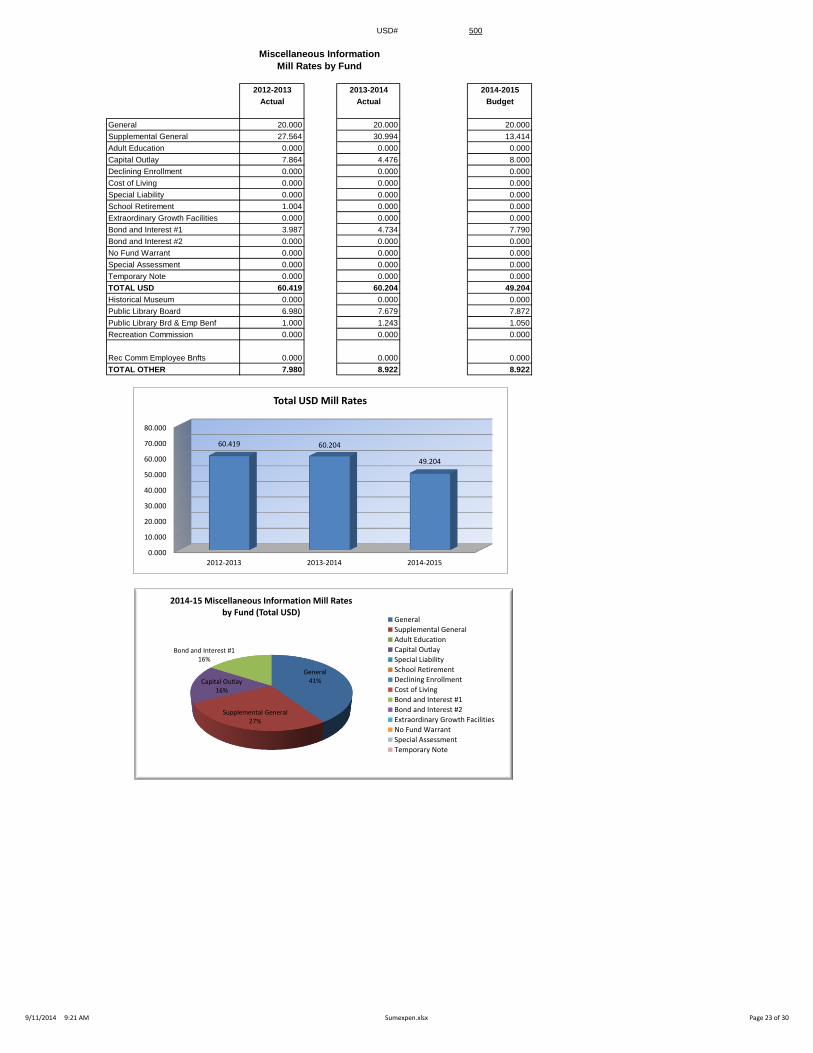
Miscellaneous Information
Mill Rates by Fund
2012-2013 2013-2014 2014-2015
Actual Actual Budget
General 20.000 20.000 20.000
Supplemental General 27.564 30.994 13.414
Adult Education 0.000 0.000 0.000
Capital Outlay 7.864 4.476 8.000
Declining Enrollment 0.000 0.000 0.000
Cost of Living 0.000 0.000 0.000
Special Liability 0.000 0.000 0.000
School Retirement 1.004 0.000 0.000
Extraordinary Growth Facilities 0.000 0.000 0.000
Bond and Interest #1 3.987 4.734 7.790
Bond and Interest #2 0.000 0.000 0.000
No Fund Warrant 0.000 0.000 0.000
Special Assessment 0.000 0.000 0.000
Temporary Note 0.000 0.000 0.000
TOTAL USD 60.419 60.204 49.204
Historical Museum 0.000 0.000 0.000
Public Library Board 6.980 7.679 7.872
Public Library Brd & Emp Benf 1.000 1.243 1.050
Recreation Commission 0.000 0.000 0.000
Rec Comm Employee Bnfts 0.000 0.000 0.000
TOTAL OTHER 7.980 8.922 8.922
0.000
10.000
20.000
30.000
40.000
50.000
60.000
70.000
80.000
2012-2013 2013-2014 2014-2015
60.419 60.204
49.204
Total USD Mill Rates
General 41%
Supplemental General 27%
Capital Outlay 16%
Bond and Interest #1 16%
2014-15 Miscellaneous Information Mill Rates by Fund (Total USD)
General
Supplemental General
Adult Education
Capital Outlay
Special Liability
School Retirement
Declining Enrollment
Cost of Living
Bond and Interest #1
Bond and Interest #2
Extraordinary Growth Facilities
No Fund Warrant
Special Assessment
Temporary Note
9/11/2014 9:21 AM Sumexpen.xlsx Page 23 of 30
USD# 500
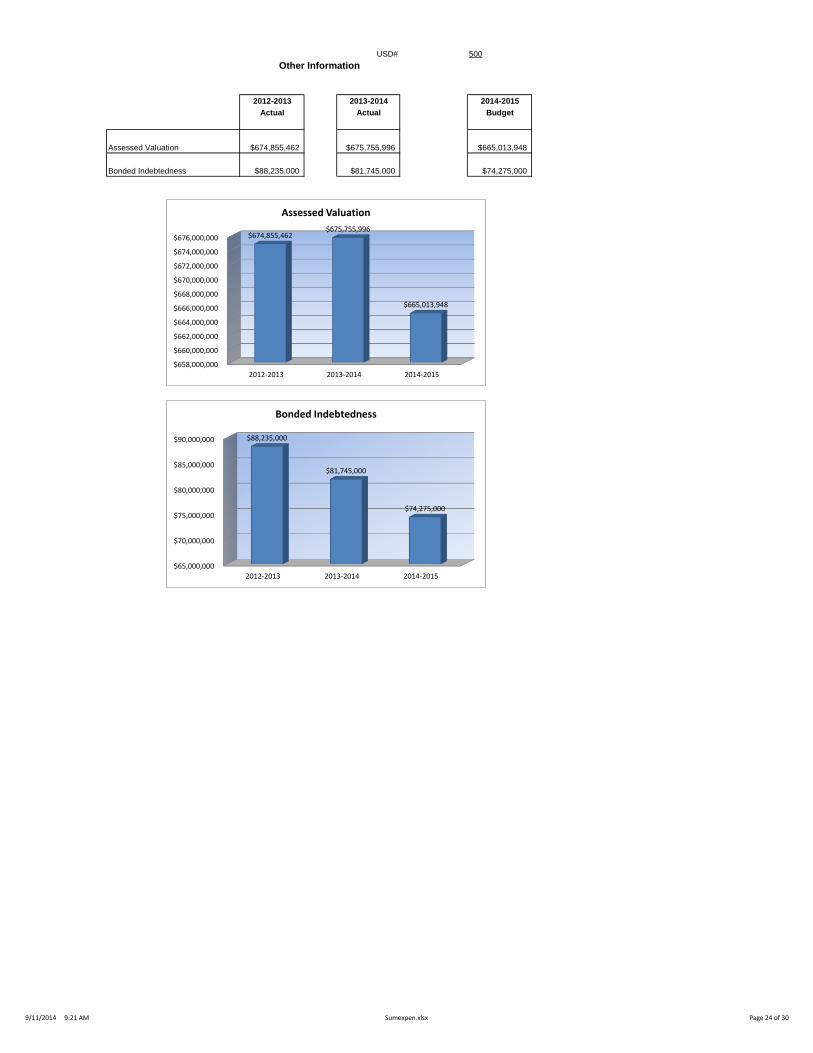
Other Information
2012-2013 2013-2014 2014-2015
Actual Actual Budget
Assessed Valuation $674,855,462 $675,755,996 $665,013,948
Bonded Indebtedness $88,235,000 $81,745,000 $74,275,000
$658,000,000
$660,000,000
$662,000,000
$664,000,000
$666,000,000
$668,000,000
$670,000,000
$672,000,000
$674,000,000
$676,000,000
2012-2013 2013-2014 2014-2015
$674,855,462 $675,755,996
$665,013,948
Assessed Valuation
$65,000,000
$70,000,000
$75,000,000
$80,000,000
$85,000,000
$90,000,000
2012-2013 2013-2014 2014-2015
$88,235,000
$81,745,000
$74,275,000
Bonded Indebtedness
9/11/2014 9:21 AM Sumexpen.xlsx Page 24 of 30
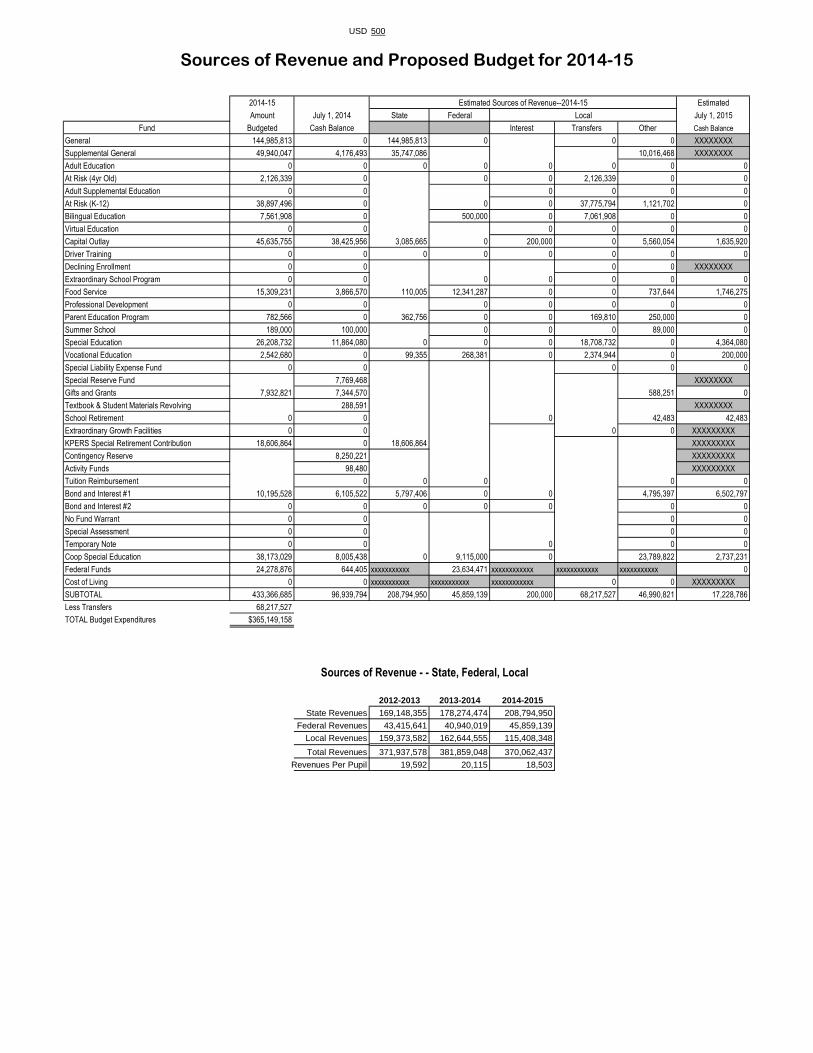
USD 500
2014-15 Estimated Sources of Revenue--2014-15 Estimated
Amount July 1, 2014 State Federal Local July 1, 2015
Fund Budgeted Cash Balance Interest Transfers Other Cash Balance
General 144,985,813 0 144,985,813 0 0 0 XXXXXXXX
Supplemental General 49,940,047 4,176,493 35,747,086 10,016,468 XXXXXXXX
Adult Education 0 0 0 0 0 0 0 0
At Risk (4yr Old) 2,126,339 0 0 0 2,126,339 0 0
Adult Supplemental Education 0 0 0 0 0 0
At Risk (K-12) 38,897,496 0 0 0 37,775,794 1,121,702 0
Bilingual Education 7,561,908 0 500,000 0 7,061,908 0 0
Virtual Education 0 0 0 0 0 0
Capital Outlay 45,635,755 38,425,956 3,085,665 0 200,000 0 5,560,054 1,635,920
Driver Training 0 0 0 0 0 0 0 0
Declining Enrollment 0 0 0 0 XXXXXXXX
Extraordinary School Program 0 0 0 0 0 0 0
Food Service 15,309,231 3,866,570 110,005 12,341,287 0 0 737,644 1,746,275
Professional Development 0 0 0 0 0 0 0
Parent Education Program 782,566 0 362,756 0 0 169,810 250,000 0
Summer School 189,000 100,000 0 0 0 89,000 0
Special Education 26,208,732 11,864,080 0 0 0 18,708,732 0 4,364,080
Vocational Education 2,542,680 0 99,355 268,381 0 2,374,944 0 200,000
Special Liability Expense Fund 0 0 0 0 0
Special Reserve Fund 7,769,468 XXXXXXXX
Gifts and Grants 7,932,821 7,344,570 588,251 0
Textbook & Student Materials Revolving 288,591 XXXXXXXX
School Retirement 0 0 0 42,483 42,483
Extraordinary Growth Facilities 0 0 0 0 XXXXXXXXX
KPERS Special Retirement Contribution 18,606,864 0 18,606,864 XXXXXXXXX
Contingency Reserve 8,250,221 XXXXXXXXX
Activity Funds 98,480 XXXXXXXXX
Tuition Reimbursement 0 0 0 0 0
Bond and Interest #1 10,195,528 6,105,522 5,797,406 0 0 4,795,397 6,502,797
Bond and Interest #2 0 0 0 0 0 0 0
No Fund Warrant 0 0 0 0
Special Assessment 0 0 0 0
Temporary Note 0 0 0 0 0
Coop Special Education 38,173,029 8,005,438 0 9,115,000 0 23,789,822 2,737,231
Federal Funds 24,278,876 644,405 xxxxxxxxxxx 23,634,471 xxxxxxxxxxxx xxxxxxxxxxxx xxxxxxxxxxx 0
Cost of Living 0 0 xxxxxxxxxxx xxxxxxxxxxx xxxxxxxxxxxx 0 0 XXXXXXXXX
SUBTOTAL 433,366,685 96,939,794 208,794,950 45,859,139 200,000 68,217,527 46,990,821 17,228,786
Less Transfers 68,217,527
TOTAL Budget Expenditures $365,149,158
2012-2013 2013-2014 2014-2015
State Revenues 169,148,355 178,274,474 208,794,950
Federal Revenues 43,415,641 40,940,019 45,859,139
Local Revenues 159,373,582 162,644,555 115,408,348
Total Revenues 371,937,578 381,859,048 370,062,437
Revenues Per Pupil 19,592 20,115 18,503
Sources of Revenue and Proposed Budget for 2014-15
Sources of Revenue - - State, Federal, Local
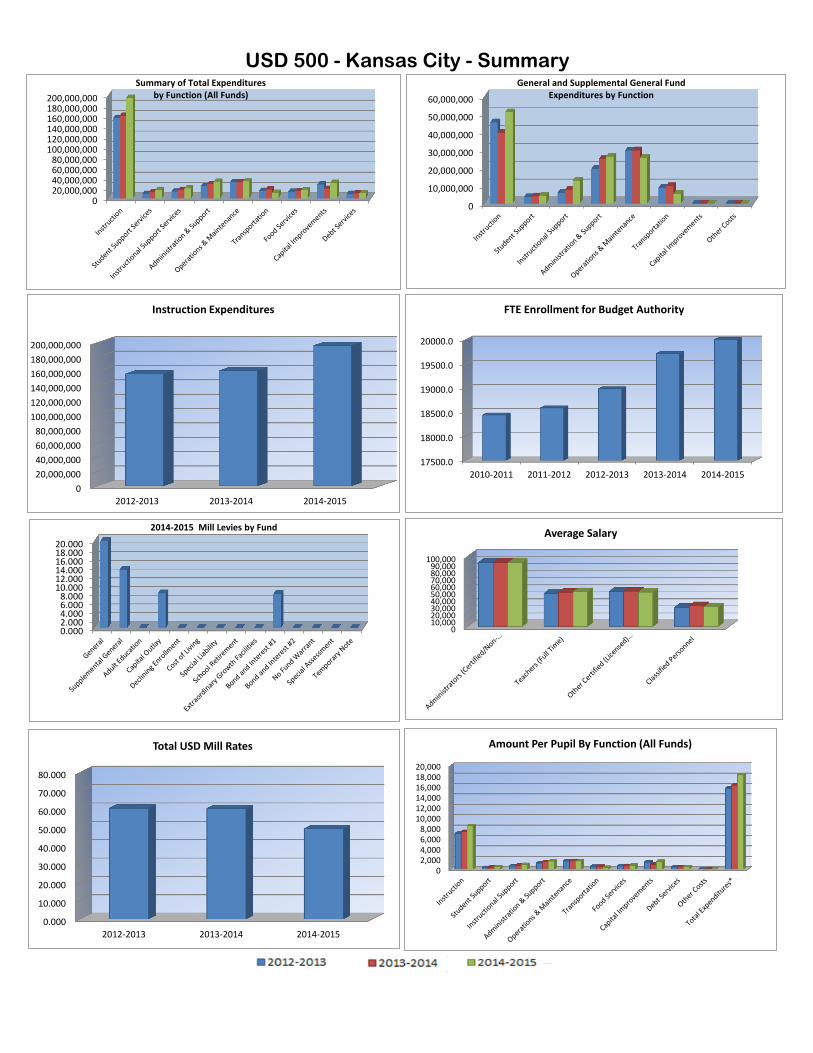
USD 500 - Kansas City - Summary
020,000,00040,000,00060,000,00080,000,000
100,000,000120,000,000140,000,000160,000,000180,000,000200,000,000
Summary of Total Expenditures by Function (All Funds)
0
10,000,000
20,000,000
30,000,000
40,000,000
50,000,000
60,000,000
General and Supplemental General Fund Expenditures by Function
0
20,000,000
40,000,000
60,000,000
80,000,000
100,000,000
120,000,000
140,000,000
160,000,000
180,000,000
200,000,000
2012-2013 2013-2014 2014-2015
Instruction Expenditures
17500.0
18000.0
18500.0
19000.0
19500.0
20000.0
2010-2011 2011-2012 2012-2013 2013-2014 2014-2015
FTE Enrollment for Budget Authority
0.0002.0004.0006.0008.000
10.00012.00014.00016.00018.00020.000
2014-2015 Mill Levies by Fund
010,00020,00030,00040,00050,00060,00070,00080,00090,000
100,000
Average Salary
0.000
10.000
20.000
30.000
40.000
50.000
60.000
70.000
80.000
2012-2013 2013-2014 2014-2015
Total USD Mill Rates
02,0004,0006,0008,000
10,00012,00014,00016,00018,00020,000
Amount Per Pupil By Function (All Funds)

Intentionally left blank

Intentionally left blank

Intentionally left blank

Intentionally left blank