usda bmi project domestic ase january 28, 2016 … · usda bmi project – domestic ase january 28,...
TRANSCRIPT

USDA BMI Project –
Domestic ASE
January 28, 2016
Attendee Summary Package

In collaboration withUSDA: Validate Vision Phase Deliverable| February 4, 2016
Business Management Improvement Framework
• Confirm Project Plan• Review policy, process
and strategy documents
• Gain high-level understanding of stakeholders, processes, systems, and performance
• Identify constraints, requirements, and critical success factors
• Hold ASE event and workshops to develop future state vision and capabilities
• Recommend process priorities
• Conduct stakeholder interviews, facilitated sessions and focus groups
• Collect performance data
• Evaluate User Satisfaction
• Support As-Is process modeling
• Analyze baseline data• Identify change
management factors• Identify improvement
opportunities
• Identify and interview SMEs
• Conduct workshops and facilitated sessions
• Conduct benchmarking and best practice reviews
• Develop To-Be process maps
• Define performance measures
• Document policies, regulations, reference material as required
• Develop high-level OCM Approach
• Confirm costs assumptions
• Evaluate alternatives from To-Be design
• Model alternatives’ cost and benefits
• Confirm alignment to USDA Transformation efforts
• Prepare the business case
• Facilitate USDA prioritization
• Present final recommended to-be operating model
• Develop full Implementation Plan
• Develop supporting OCM, communication and training products
• Develop content to support realization of to-be operating model (eg, policy papers, SOPs, requirements documentation, performance management tools, etc.)
ValidateVision
Conduct“As-Is”
Develop“To-Be”
DevelopBusiness Case
Implementation Plan
2

In collaboration withUSDA: Validate Vision Phase Deliverable| February 4, 2016
USDA Domestic Knowledge Wall
3
USDA
----------------------------------~,,,) y
• a
•
Capge111ini
~-
··--- ..
.;;.,. ... w . .... '" .,....,. ,,..,.s,,.. . Nfl4'flir tn• ,. .. ,u
____ ...._.._ ... --~
~

In collaboration withUSDA: Validate Vision Phase Deliverable| February 4, 2016
Introduction
4
USDA
y-----------------------~7~/
Capge111ini USDA W•)ut I ll "11•0111 • ..,,,..., ••

In collaboration withUSDA: Validate Vision Phase Deliverable| February 4, 2016
Introduction (cont.)
5
y
pvp..posE ED\J\C1\1f Mttl /\UGtN PN?-Tl6\PmT~ on lJ\~Df\'~ BM\ RlJ\MA\JOfl-V-, 8~1 ~XP~l1f\1\0NS ~ UtL DOM~Sll& Pfl06irz-AM I ~ 61~N~[l-A1~ OlAf2-60MMoN Vl~\ON t< Sl-Op~ ~ lD~N1\P( \7fl06'P-AM IM Pfl-OV~MtNT OPPDrtllAN\T\ t; S w ~M Yl1?W tw VA~lDf>\W Vl~\ON P~"~E
Capge111ini USDA W•)ut I U "11•0111 • ..,,,..., ••

In collaboration withUSDA: Validate Vision Phase Deliverable| February 4, 2016
Introduction (cont.)
6
USDA
y------------------------------'/ OBJE[, TIVE:S \0611?\\-\E?JZ- 'Nl:3 WIU, ... v AL-ll1N f?)(Pl?liJ\-rtoNs G)1 ~ BtAsttJ~gs MP..Nt\6't::M~NT
\ MP~V~M~ITT AZA~l?WOF-\l- l\PPll-01\l+\ Y' UONfl~ ~ lAND~~11\Nl7\t'1G\ 4 lASDJ\ DOMt-S11&
SV1PPL--'( Cil-\Alf\J 61Afl.Nt;~t> ~ -tW,: • \i-l?Vlt-V\I 6}- P1>IAC.'(, \'~l-t?~S 111.t1A- S1!l4\18Gi'( \/OW M~\S • STh\l\;:\-IOL.{)'Gl2- lN-W\2-Vl~S, ~ . • pow tvl~ITT~ti Ptz.D~&'S~S. S'{SleMS, ,.,.,t~ \7~12-fO\?-MAN~
Y ~'tJ8 \V~N\\P\~P U>N~\ITT~, ~~tAll2-f;M~, Mt.Iv (,.f-l1l l1\L-- SW:Vt?S.S f UIO '2-S y (,,-Ol,-U\i;oJ2-A1l\/a-Y 6'~N~~~ tA.u. \Nfo~11oN tttJ...
-\E?ST ~ Wf>.ft COMMON F\ltT111\2-B ~~-n; \Jl~\OM OM.)_
W&'IF-~D CAPAB\lr\'Tt~S

In collaboration withUSDA: Validate Vision Phase Deliverable| February 4, 2016
Introduction (cont.)
7
blV~NS y W E W\\...t,. PoUVl..S <IYI 011\Jl- M t~SI oN ( i?;>lllS I N f:SS) twi."-'
NWl \00\.--S Dl/112-INGt \1-\IS BMI PHASi;:
USDA
y Wf;: NE:l;::D tr Dt::r\Ni;:: 011112-- t:='ll\1..-L-- PO~Al...- 4/n.J.- Mt;;;A~vtll-G OVl\l.SE:<W E S A6'!AINS\ ~v '(,Pl.\Z-()Slll/\'-
'f" Wr? WANT w MA)(IMIP'fi OlllJZ-ABIL--1\Y t- AVt-ll~VG Olll~ Mt.S~lDN ~TA\l-ltJGi ADV~NTA61G lfl-- AU-4?P-n::::D ISVIPPL--'( Wf>..lt-.1 CAP~B\v\llt:::.S
• \Mf>tl-OV~ loMWl"Nll-A.\ION A.MONG? AtA,-- S\A~\.\Ol.-0~~ - S\111\P\.-lP( O~"-NlYlc:T!Of\JAL.- A.t1IVllNISTP-"-TIDN UML
STP..\l-~\\0\,{)~(2- \Z€l'Ol2=Tl N6t '-I' wr;: M\.tST ~NS\A~ W l3 SA11SP( \7~6tt.tl-A\OIZ-'( wr..1- L-t:<6rAL
VON~~\"'1\S -'-I.AS~ IMP- lt-NOV\l~Dbii;; ·r.- INf'o(L-M Pot-tl:.-'( Mf>..\l-\?'\l-S ~I Wf>..Nbit:<.S W\-\ll'/l-l UVIL-t> '2-t?DIAW 13~\2-P-\~(2..S -to NA-\\~VIN6t OIAIZ- M IS.SION
- 11\SDAU..H~ l-D to "' Plff't?f-\?t'lt SE'T 'I- ~DJ>-.P-DS ~ tA&DA ~/\IA.!>\ Mi:;'l?T-t.w Nt?~OS ~ VP..tl..\IMS Pf!-1>6f P..AMS
(S MA\A.- '"' A vf\'!Lbl~) Wl-ll~ IU<MAI NIN6, li?~l.\llP..l!>!A'?° - Pf-OV!Jl-A.MfVll~Ui ""'" {;<)N-ff?-AL-llNG! l.-A.W~
'fl' w~ Wf>..N\ t .. G\t;;Nl:? \Z-A'Tl:? N~W '~ (}No.f.- ~v1srr .pl\SI 1P l2J\S W\-\DS~ \IM~ ~w.i £,fJM~
USDA 2zZi5

In collaboration withUSDA: Validate Vision Phase Deliverable| February 4, 2016
Level 1 Processes
L1 Process Name Commercial Definition USDA Context
1.0 Idea to Retire Managing the entire lifecycle of a product from
concept creation, product definition and
development, product launch, retirement
Managing product lifecycle, (includes market
research, specification development, updating
specifications, and phasing out of catalog items
2.0 Business to
S&OP
Translating overall business objectives/targets
into planning – including Business & Financial
Planning, Sales & Operations Planning, and
Reviewing Process Performance
Aggregating State and RA demand into defined
quantities
3.0 Demand to
Supply
Matching demand to supply including: demand
planning, supply planning, inventory &
warehouse management, quality inspection
Management of orders in WBSCM. Managing
brown box inventory at processors & physical
inventory at MFW’s
4.0 Procure to Pay Process of sourcing good and including,
managing suppliers, issuing solicitations,
awarding contracts, managing accounts
payable
AMS procurement activities subject to state and
federal laws
5.0 Order to Cash Process of creating, approving/issues orders,
distributing goods and receiving invoices
Delivery of product to states and RA’s &
management of entitlement spend
6.0 Enterprise Data
Management
Management of master data to support
transactional processing and reporting
Materials, vendors, & customers in WBSCM,
KPI’s and performance metrics
• Level 1 (L1) processes are high level process groups that are focused on a function or activity
• L1 processes are then decomposed (‘broken down’) into the component Level 2 processes
8

In collaboration withUSDA: Validate Vision Phase Deliverable| February 4, 2016
Level 1 Processes: High Level Depiction
Commodity
Vendors
Processors
4.0 Procure to Pay 5.0 Order to Cash
GovernmentSourcePay Order
2.0 Business to S&OP
6.0 Enterprise Data Management
1.0 Idea to Retire
3.0 Demand to Supply
State Distribution
Agencies
Commercial
Distributors
Household
Programs
9

In collaboration withUSDA: Validate Vision Phase Deliverable| February 4, 2016
1.0: Idea to Retire
1.1 Manage Idea / Create Concept
1.2 Define Product
1.3 Develop Product
1.4 Qualify Product
1.5 Launch and Maintain
Product
1.6 Assortment
Planning
• Speaking with
vendors about
new products
• Surveying
schools to
determine
product
preferences
• Attendance at
trade shows &
conferences
• Finding product
offerings to
comply with
nutritional
guidelines
• Plan for
developing
product
(including
planning for
sourcing,
regulatory
requirements,
risk
management)
• Defining
product,
specs,
grading
standards,
potential
suppliers,
nutritional
standards
• Commercial
availability
• Development
of product
including
design,
prototyping,
development
collaboration
and
sourcing,
packaging
design,
planning for
logistics /
distribution,
cost
estimation
• Conducting
market
research,
RFIs, taste
testing
• Qualifying
suppliers:
incorporating
RFI results
and prototypes
into product
design
• Finalizing
product and
packaging
specifications
• Qualify
product
demand
• Product
samples prior
to FTL commit
(assumes
consistent
supplier)
• Product catalog
launch, product
maintenance,
specification
update/change
• Pilot programs
• New product
communication
• Timing of new
product launch,
procurement
cycle & ramp
up
• Product
retirement: plan
for ceasing
product
procurement,
phasing out
inventory in
supply chain
•Determination of
products to be
offered in the
USDA catalog
•SKU
rationalization
process
•Integration with
master data
management
10

In collaboration withUSDA: Validate Vision Phase Deliverable| February 4, 2016
2.0: Business to S&OP
2.1 Business & Financial Planning (Budget Program Allocation)
2.2 Sales and Operations
Planning
2.3 Review and Monitor Process Performance
• Allocating funds within each program
• Determining strategic initiatives and
historical data to drive fund
allocation
• State and RA decisions on catalog
offerings
• Cycle Menus- rotating standard
menu, use actual pricing, not Nov.
est. (menus drive food order, not
other way around)
• SKU rationalization
• Align entitlement/order timelines
• Reconciling demand forecasts
• Managing supply chain risks and
emergency demand shortfalls
• Move to pull inventory system
• Separate ordering from forecasting
• Automate
• No more state ordering without local
input
• Performing periodic assessments
of business to sales and
operational planning
• Analyzing results to continually
improve planning process and
reduce operational shortcomings
• Reporting back to USDA state
usage
11

In collaboration withUSDA: Validate Vision Phase Deliverable| February 4, 2016
3.0: Demand to Supply
3.1 Demand Planning3.2 Supply Planning
3.3 Inventory Management
3.4 Warehouse Management
3.5 Quality Inspection
• Collaborating with
RA's to gather
future demand
forecasts
• Using historical
data and decision
tools to aid in
demand planning
• Determining
forecast trends and
seasonality
• “Plan B” for supply
problems (weather,
AI, etc.)
• Using demand
forecasts to
determine freight
requirements and
consistent product
pipelines
• Determining
optimal
distribution
networks based
on those
requirements
• Align with
commercial
forecasting
• Optimize
distribution/orderi
ng sizes
• Inventory level
determination
• Inventory turn
management
• Pull/push trigger,
batch
management
• Standardized
accounting
methodology
(FIFO, LIFO,
replacement cost,
etc.)
• Data
management -->
real time
• Training
• Order quantities
driving aging
• Manage 3PL
warehousing
policy
• Pick/pack/ship
planning
• Stock
rotation(FIFO)
• Developing quality
parameters for
each commodity
• Determining when,
how, and where the
inspections will
take place in the
supply chain
• Quality checks not
consistent/accurate
12

In collaboration withUSDA: Validate Vision Phase Deliverable| February 4, 2016
4.0: Procure to Pay
4.1 Sourcing4.2 Solicitation Development
4.3 Solicitation Issuance,
Evaluation, Award
4.4 Receive and Manage
Commodities
4.5 Manage Accounts Payable
• Supplier strategy
and planning, e.g.
establishing long
term contracting
plans, strategic
sourcing, planning
supplier
scorecards, Small
Business
procurement
planning
• Supplier
management,
supplier
performance
evaluation,
providing feedback
• Gathering and
analyzing spend
analytics to drive
sourcing decisions
• Develop
solicitations
incorporating
requirements and
specifications with
a long term
strategic focus on
maximizing
agency value
• Communicated
Evaluation Criteria
to bidders.
• Determine
Contract Type, bid
timeline.
• Issuing
commodity/freight
bids, evaluating
responses,
evaluating past
performance,
awarding vendors
• Supplier
collaboration: e.g.
reverse auctions,
Q&A, industry
days, etc.
• Create,
approve/issue
purchase order
• Receipting&
confirmation,
product
identification
tracking &
traceability
• Account for and
resolve
overages,
shortages, and
damages.
• Track shipments
• Quality control –
grading &
inspection,
checkloading
• Document
supplier
performance
• Invoice receipt and
verification, manage
claims, payment
approval and
processing
• Automated Invoice
and Payment
processes
• Begin claims
management
process (if
necessary)
• Relay any rate
discrepancies to
involved
stakeholders as
soon as they are
identified
• PO Closeout/release
of funds
13

In collaboration withUSDA: Validate Vision Phase Deliverable| February 4, 2016
5.0: Order to Cash
• RA’s order against
estimated demand
from annual plan
• Analyze planned
vs. actuals for type
and amount of
food for
subsequent
annual
estimates/plans
• RA Orders come in
more frequently;
represent product
that has already
been purchased
• Analyze recipient
requests including
availability
checking (available
to promise) –
• Expand NW
type/Regional
warehouses as
option
• Pricing calculation
– based on actual
cost (product
already purchased)
• Real-time Data and
delivery scheduling
• Sales order
confirmation
• Have visibility to
Manage and
track distribution
of commodities
throughout supply
chain
• Track deliveries
from production
to distribution
• Goods issues,
pick/pack/ship
from warehouses
• Measure and
record how much
annual
entitlement has
been expended
• Monitor
throughout the
year
• USDA Schedule
contract (not sure
where this fits…)
• Measure and
resolve quality and
delivery issues
• Define “what is a
complaint”
• Defined warranty
periods
5.1 Receive Sales Order5.2 Sales Order
Approval and
Confirmation
5.3 Distribution of
Commodities to
Final Recipients
5.4 Managing
Entitlement
Spend
5.5 Complaints &
Recalls
14

In collaboration withUSDA: Validate Vision Phase Deliverable| February 4, 2016
6.0: Enterprise Data Management
6.1 EDM Strategy6.2 Data
Processes6.3 Data Design
6.4 Data Architecture
6.5 Implementation
• Vision, strategy,
objectives, scope,
data governance,
• Defining key
performance
indicators
• Data management,
processes and
controls, external
controls
• Communication of
data across all
programs that
includes feedback
mechanisms that
support data
reliability
• Data Security
• Increased visibility
and transparency
across the entire
supply chain
process
• Matrix for master
data objects, flow
of key data
elements,
reporting
• Data flow of
information from
distributors to
USDA
• Simplify access
to the data in the
system
• Improving overall
user experience
(user-
friendliness)
• Real-time and
accurate data
• Historical
Visibility
• Data mining and
reporting
• Transactional and
master data,
warehousing
• Integration of
internal and
external systems
to support holistic
view of
information
• Reduce system
processing time
• Product launch,
product
maintenance,
specification
update/change
• Data Archival
• Continuous
Improvement and
maintenance
15

In collaboration withUSDA: Validate Vision Phase Deliverable| February 4, 2016
Share/Synthesize Ideas
16
USDA
y-------------------------------'/ A&TI ON S
A ctions
Actions • Q.~ ~ '(" e.A3 Qt-e.. 0 n:lec::s '°"5~~ co"~"-'
· 'o\6 ~$p. ~-"CC. - ~\ .... 'k..-.c:.cu .-~ . ·,~"· '"°' y ~ ·~IC"( \~~ ·.l-"'."c. \...,._\ l\&JS i>'.u\ •• _._, ............ CA.f f">l«S ,, .... -.+-"-e>'~-
. ~~r~ s~ . ..nl.'loll ............ \...,
Capge111ini USDA
Actions - S~f\, It~ .. 0 ""' ' ' "
I.."\.... " ... . 1 - ~ '{ - Lf\<\ \.c l)c, +. b •r • Ir "" \ "'-- '""•Lolc: ,. .. ,w i . . . ...
I• <...-' '°' "" ' ·" ~· ·~ '-- \) .. "''c>r. ,. ,,.,.., .., ,,. . .-£ r ._ ~ \ , .. , ,.. ~Of\~/ f:A. , O•" k·~' • ... ) p,, ., , f .re ~
--Actions
Actions A ... f!6Pl~C:.O ,., ' 14-. , ,,.., r•
al ~I'\ tt.Tr1 '-' fl\0" -f~OCU~"-..
IC1.. ~~· .. "'.-....... f"t• • f flO~ d Cl.A' •lfl'V c:.
1c;::.., "EllW,_, ~ f'•~ ' • f'l\ocir>•-s
6J .,oo-.J»t.U T flCltN•c..C..y
Actions

In collaboration withUSDA: Validate Vision Phase Deliverable| February 4, 2016
Share/Synthesize Ideas (cont.)
17
USDA
,,~~~~------------~~~~_,,/ V lM PP-OV£ M f;;NT
OPPOl2-TVN1T lf;S
Top 5 Improvement Opportunities
1) ~U('i1Cqh(;{) <+ e"'.)"'3" .....,_. ... """'...,
. ~) l e d·...ol0!3y- ~.3"~ ~) ?IQ<'d'I·,~
\ «) -p~ i" P'S
16) r)e,tibirriy _ .,.._. LTL
! T op 5 lmprov~men~ Opportunities J
I \ .~'("()CU~+-
I ~-~'<"'ec c..S>n"'j
i ). \ "'anseor~-ti °"' 1tl.L1f' /~~~s-, <;>o.re~
I c:> T «>=.. ~\"5
- ...--- --- -· _...,
USDA =
I Top 5 lmprov~ment Opportunities
I At...TG<'V "'/(!.Cf"~,, ... <D "•VI C.T%'C!.t.,;"~ l~N 't) 6'"' AN.0 ~t>&iU>« ..,. ~c~NDl-Oc-y lf f>"{~C.As7rA.1 G-
I?\~"' l"IL.L .;t<. ~"'-•6" ~'-(A- ,.~T&TY
I
T o p 5 Improvement O p p ortunities
- L ..,,_ Ol-\-y _ S\d . p racf ;c.e ~
t.y ~D'l /fl. A .. - v~""'wid pj,.,,,/~ ... ,.~ ~
( 1>• 11 "'· 1'·• ") ' - 5 1o(U q,+.-•ft Q~'l. ._f;o "'
-lra .. ~r ......... ...,, ( dqf... i.- Ez~ ~ rr'fy c ~ .. ; ,,
'--~~~~~ ---"--~·-~~I '-~~~~~~~--'~
--·~·

In collaboration withUSDA: Validate Vision Phase Deliverable| February 4, 2016
18
USDA __________________________ ____./ y
Prioritization ( <1.~e'!")' '"(Of .. \ Av":::> · -~;:.,. (~~ 3! at. &1 I I Fe~s . 9~ 16 f~. /2-5 2-)
~ (l5 Zl
Capge111ini USDA

In collaboration withUSDA: Validate Vision Phase Deliverable| February 4, 2016
Prioritization Methodology: Factors
Five prioritization factors were identified in order to incorporate several aspects of process
improvement, including internal and external factors
Process Prioritization Factors Factor Description Factor Weight
Potential Financial Impact If improved, the potential financial impact (e.g. cost savings or
avoidance, increased capacity to distribute additional food (e.g.
Return on Investment)) that could potentially be achieved. The
higher the score, the more financial savings could be achieved. 0.21
Improved ProductivityIf improved, the process will have reduced time and/or reduced
effort (e.g. reduced administration burden, reduced waiting time,
reduced overall cycle time, reduced 'waste' (time, rework, etc.).
The higher the score, the more time could be saved 0.21
Direct Impact on Recipients (Process
Criticality) Process has a direct impact on RA's (high quality and speed of
service is important). The higher the score the more the process
impacts the final recipient receiving food aid. 0.31
Implementation Feasibility The implementation options available to improve the process
feasible and achievable to improve the process (factors would
include: cost, time, process complexity, resources, OCM) 0.16
Enterprise Environnmental Factors
support process improvement
There are few enterprise factors (e.g. organizational, regulatory,
political, cultural, infrastructure, suppliers ) that would prevent the
improvement of this project 0.11
1.0
19

In collaboration withUSDA: Validate Vision Phase Deliverable| February 4, 2016
Prioritization Methodology: Factors
Process
Prioritization Factors Factor Description Very Low
Mediu
mVery High
Potential Financial
Impact
If improved, the potential financial impact (e.g. cost savings
or avoidance, increased capacity to distribute additional
food (e.g. Return on Investment)) that could potentially be
achieved. The higher the score, the more financial savings
could be achieved.
Increase financial
cost to chain
(Negative ROI)
Neutral
Highest decrease of
financial cost to supply
(High ROI)
Improved Productivity
If improved, the process will have reduced time and/or
reduced effort (e.g. reduced administration burden, reduced
waiting time, reduced overall cycle time, reduced 'waste'
(time, rework, etc.). The higher the score, the more time
could be saved
More time/effort
across processNeutral
Highest possible
time/effort savings
across process
Direct Impact on
Recipients
(process criticality)
Process has a direct impact on RA's (high quality and
speed of service is important). The higher the score the
more the process impacts the final recipient receiving food
aid.
Highest negative impact Neutral Highest positive impact
Implementation
Feasibility
The implementation options available to improve the
process feasible and achievable to improve the process
(factors would include: cost, time, process complexity,
resources, OCM)
Lowest likelihood
improvements can be
achieved (Fewest
implementation options)
Neutral
Highest likelihood
improvements can be
achieved (Large number
of levers/options to
impact implementation)
Enterprise
Environnmental
Factors
(support process
improvement)
There are few enterprise factors (e.g. organizational,
regulatory, political, cultural, infrastructure, suppliers ) that
would prevent the improvement of this project
Lowest alignment with
environmental factors or
greatest friction
Neutral
Highest alignment with
environmental factors or
lowest friction
20
In collaboration withUSDA: Validate Vision Phase Deliverable| February 4, 2016
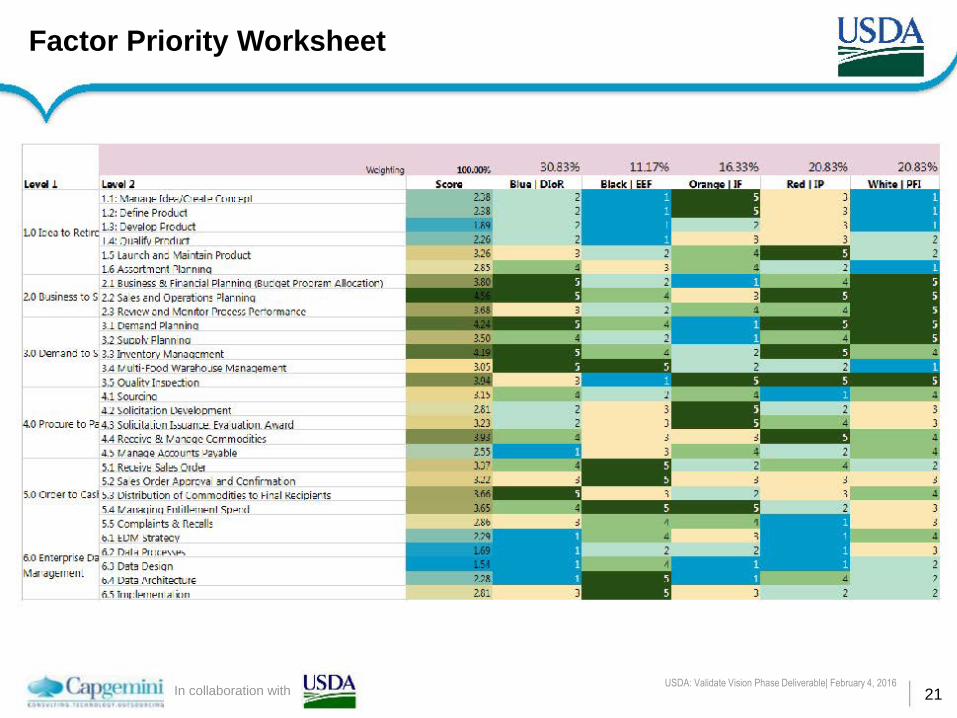
Factor Priority Worksheet
21
USDA
y-------------------------------/ LovGI ! L1111012
1.1: 11.1,. 1 11 1 1~ rd....-.,.J(':i ... 11 ... re 11 11 :-111
1.2: Define Produci
LO I: cJ to Rctirt 1.'3: Dev~op ~rc·duct I A : ()11=1lifv Prrlc111t1
1.5 Laurch and \i\aintain Product 1.6 A~:;crtm::nt f"llJr n1nQ
\\tighth g 100.<'.M»~ 30.83'3{,
---1.---'s·~•·~.,..""·--- Bluo 1 DioR 2.J8
2.1 Busin-2Ss .& Financial Pl:inninQ (8UdQet Pro:r;m A.llocatioo) 2.0 Business to$ 2.2 Sa es end Operation! Flar ninQ
2.3 Revtc'..v ~nd r-..1cnrto1 l'lrccc$!i f'lcr o--mJncc 3.1 Dsm ; n:I Pla1n inQ
3.2 Suool\· Fiann no 3.0 uemand !Os 2.3 ln\•cnt•Jrv t-.i JnJqcmcnt
3A tJ ult i· f.xi.d war~10Jse M; naciemeit
3.5 OUalitv Iosoe:tion 4.1 Sourcino_ '1.:l ~ol icita:ion De\'eb pment
0 Pro:ure to ?a 4.3 SoliLita.iL•n h~cnt:J::...Eva uatio11,,_A\.V<11d 4A Rccri•;c -& r1 J10<1c Ccmmoditic:; '1.) rJana::ie Accounts !Javable S.1 R~ti11t: Sol~ Otdi=t S.2 Sa es Order .6.p_prc-va .3r d Ccnfirm.3f on
5.0 C1rc er to Casi ) .3 Uistribut ion of com mcditie·; tc· 1--i1; 1 Kecipi~rts
SA r.r;11 i:.1:1iriq FuJill ... 11..-111 ~11 ... 11d
S.5 Complaints & Re-:ell,. b.l ~UM Str~t~V
6.0 Enterprise Da O.? o ,.1;.t Pu tc.: .. , ".,' f\1dHCIYtll !~ ll . 6;) Deta OesiQn
b.'1 una .1\1chitectt.re n .. ~ T111f:l!-• 11.-11 ~ i:u 1
Capge111ini USDA
11.17% 16.33% 20.83% Rod I IP
J
2
20.83%
2 ; ______ .;;
2
J ;
J 2 ?
2
In collaboration withUSDA: Validate Vision Phase Deliverable| February 4, 2016
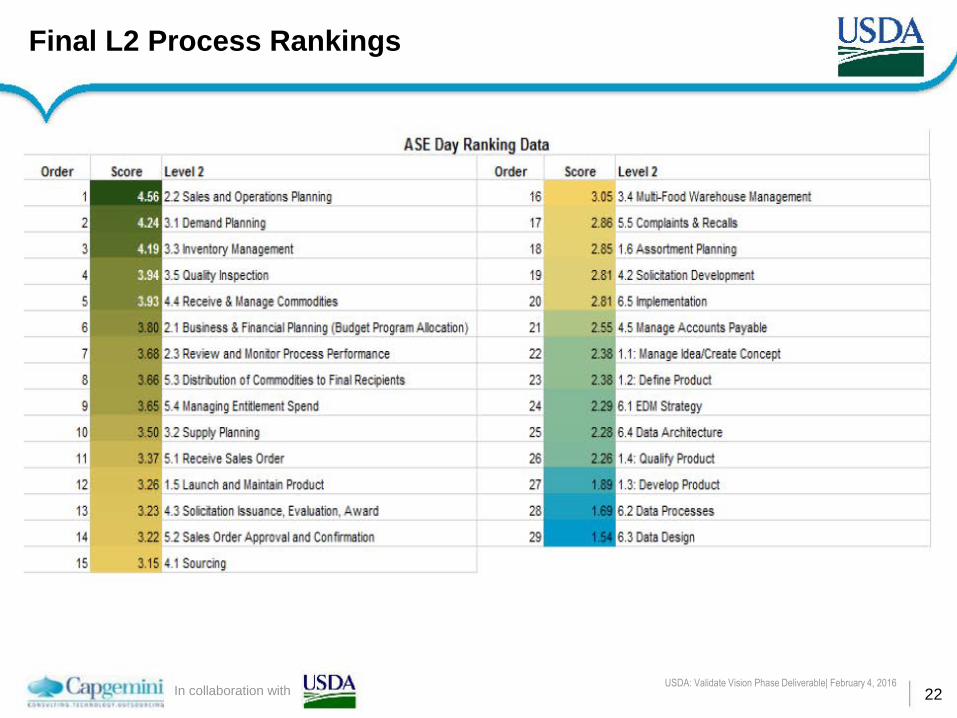
Final L2 Process Rankings
22
USDA
y------------------------------'/ Order
2
3
4
5
6
7
8
9
10
11
12
13
14
15
Score Level 2
• 2.2 Sales and Operaoons Planning
· 3.1 Demand Planning
· 3.3 Inventory Management
3.5 Qualy Inspection
4.4 Receive & Manage Comrrodtties
ASE Day Ranking Data
Order
16
17
18
19
20
2.1 Busiless & f inancial Planning (Budget Program Allocation) 21
22
5.3 Distri>ulion of Colllllodtties to Filal Re~ients 23
5.4 1.tanaging Entttlement Spend 24
3.SO 3.2 Supply Planning 25
3.3i 5.1 Receive Sales Order 26
3.26 1.5 Launch and Maintail Product
3.23 4.3 Soliciation Issuance, EvalJation, Award
3.22 5.2 Sales Order Approval and Confirmation
3.15 4.1 Sourcing
Capge111ini USDA
Score Level 2
3.0S 3.4 Mult~Food Warehouse Management
2.86 5.5 Complailts & Recalls
2.85 1.6 Assortment Planning
2.81 4.2 Solicttaoon Development
2.81 6.5 ~lementation
2.55 4.5 Manage Accounts Payable
2. 1.1: Lian age ldealCreate Concept
2.38 1.2: Define Product
2.29 6.1 EOJ,t Strategy
6. 4 Data ArcMecture
1.4: Qualify Product
1.3: Develop Product
6.2 Data Processes
6.3 Data Design

In collaboration withUSDA: Validate Vision Phase Deliverable| February 4, 2016
Thank you for your participation!
23
USDA
y------------------------------.,,,/
Capge111ini USDA