use, disposal and environmental releases of mercury
TRANSCRIPT

Use, disposal and environmental releases of mercuryAn overview of the situation in Switzerland
Chemicals2018 | State of the environment
Published by the Federal Office for the Environment FOENBern, 2018
Use, disposal and environmental releases of mercuryAn overview of the situation in Switzerland
Chemicals2018 | State of the environment

ImprintPublisher
Federal Office for the Environment (FOEN)
The FOEN is an office of the Federal Department of the
Environment, Transport, Energy and Communications (DETEC).
Authors
Amélie Ritscher, Urs von Arx, Harold Bouchex-Bellomie,
Andreas Buser
Advisory group
Ressourcen Management Agentur Wien
Suggested form of citation
Ritscher A., 2018: Use, disposal and environmental releases
of mercury. An overview of the situation in Switzerland. Federal
Office for the Environment, Bern. State of the environment
no. 1832: 50 p.
Acknowledgements
Special thanks go to Dr. Beat Brüschweiler from the Federal
Food Safety and Veterinary Office (FSVO) for revising the chapter
on human exposure to mercury and for his suggestions and
discussions that made the chapter possible in its current form.
Translation
Language Service, FOEN
Layout
Cavelti AG, Marken. Digital und gedruckt, Gossau
Cover picture
© vchal, shutterstock
Link to PDF file
www.bafu.admin.ch/uz-1832-e
(it is not possible to order a printed version)
This publication is also available in German and French.
The original language is German.
© FOEN 2018

Table of contentsAbstracts 5
Foreword 6
1 Introduction 7
2 Regulation 9
2.1 National legislation 9
2.2 Provisions under international law 9
3 Use and disposal 11
3.1 Supply and demand 11
3.2 Uses 12
3.3 Volume of waste and disposal 15
4 Environmental releases and occurrence 19
4.1 Air 19
4.2 Waterbodies 22
4.3 Soil 27
4.4 Biota 28
5 Assessment of environmental pollution 35
5.1 Assessment values 35
5.2 Assessment of environmental pollution 37
6 Human exposure 39
6.1 Food consumption 39
6.2 Ambient air 41
6.3 Dental amalgam 41
6.4 Biomonitoring 41
6.5 Summary of human exposure 43
7 References 44
Use, disposal and environmental releases of mercury © FOEN 2018 5
AbstractsBecause of its problematic properties for the environment and human health, the use of mercury should be avoided where possible and mercury releases into the environment should be kept to a minimum. The first part of this report presents an overview of the use, waste volume and disposal of mercury in Switzerland. The second part summa-rises current knowledge on environmental releases and mercury pollution in individual environmental compartments, assesses the pollution and exposure levels and highlights existing knowledge gaps. Finally, the report describes the main sources of mercury exposure in the Swiss population.
Aufgrund der problematischen Eigenschaften für die Umwelt und die Gesundheit des Menschen ist auf die Verwendung von Quecksilber möglichst zu verzichten und sind seine Umwelteinträge so gering wie möglich zu halten. Der vorliegende Bericht bietet im ersten Teil einen Überblick über den Verbrauch, das Abfallaufkommen und die Ent-sorgung von Quecksilber in der Schweiz. In einem zweiten Teil werden der Stand des Wissens zu Umwelteinträgen und der Quecksilberbelastung einzelner Umweltkomparti-mente zusammengefasst, diese Belastungen beurteilt und vorhandene Wissenslücken aufgezeigt. Zum Schluss werden die Hauptquellen für die Quecksilberbelastung der Bevölkerung in der Schweiz beschrieben.
Les propriétés du mercure sont problématiques tant pour l’environnement que pour la santé humaine. Il convient donc de renoncer au maximum à l’utilisation de cette substance et de maintenir les apports dans l’environnement au niveau le plus faible possible. Le présent rapport donne tout d’abord un aperçu des activités liées au mer-cure (utilisation, production de déchets et élimination) en Suisse. Il résume ensuite les connaissances en matière d’apports dans l’environnement ainsi que l’état de la situation relative à la charge de mercure dans les différents milieux environnementaux. Il éva-lue par ailleurs cette charge et présente les lacunes de connaissances en la matière. Finalement, il fait état des principales sources de pollution au mercure auxquelles la population est exposée.
Date le caratteristiche problematiche per l’ambiente e per la salute dell’uomo che caratterizzano il mercurio, occorre rinunciare, se possibile, al suo utilizzo e mantenere al minimo le sue immissioni nell’ambiente. La prima parte del presente rapporto offre una visione d’insieme del consumo di mercurio, della produzione di rifiuti contenenti mercurio e dello smaltimento dello stesso in Svizzera. La seconda parte riassume lo stato attuale delle conoscenze sulle immissioni di mercurio nell’ambiente e sulle riper-cussioni che esercita su singoli comparti ambientali. Inoltre valuta il suo impatto e rileva le lacune conoscitive. Infine descrive le fonti principali dell’impatto che il mercurio eser-cita sulla popolazione in Svizzera.
Keywords:
mercury, disposal,
environmental releases,
environmental occurrence
Stichwörter:
Quecksilber, Entsorgung,
Umwelteinträge, Umwelt
vorkommen
Mots-clés :
mercure, élimination, apports
environnementaux, présence
dans l’environnement.
Parole chiave:
mercurio, smaltimento,
immissioni nell'ambiente,
presenza nell'ambiente

Use, disposal and environmental releases of mercury © FOEN 2018 6
ForewordMercury is a chemical of particular concern due to long-range atmospheric transport, its persistence in the environment, its bioaccumulation capacity in ecosystems and its toxic properties. It is therefore strictly regulated in Switzerland. Under the Waters Protection Act, the Environmental Protection Act and the Chemicals Act, there are numerous pro-visions in place regulating the handling of mercury.
At an early stage it became clear that the mercury issue could not be effectively tackled through national measures alone. Measurements conducted since the 1990 s have shown that mercury is subject to long-range transboundary atmospheric transport after it is released into the air. For this reason the Aarhus Protocol on Heavy Metals, a protocol to the Geneva Convention on Air Pollution of 1979, was adopted back in 1998. It aims to reduce emissions of the heavy metals lead, cadmium and mercury and also contains product legislation for mercury. When the Protocol was amended in December 2012, the emissions mitigation measures were adapted to reflect the latest technology. The Protocol applies to the UNECE region, which covers the EU member states, Switzerland, the states of the former Soviet Union, Canada and the United States. In addition, nego-tiations on a global agreement to protect people and the environment from the negative effects of mercury were concluded successfully in January 2013. The Minamata Con-vention has since been ratified by over 90 countries, including Switzerland, and entered into force in August 2017.
Releases in recent decades have increased the occurrence of mercury in Switzerland’s environmental compartments. An initial assessment of mercury pollution in Switzerland was published 30 years ago by the then Federal Office for Environmental Protection. It estimated the volumes of mercury used and summarised the state of knowledge on mercury in the environment in Switzerland. Given the recent developments in national and international mercury regulation, this report aims to update existing knowledge on mercury in Switzerland. To this end, the report summarises knowledge about the use and fate of mercury and provides an overview of mercury pollution in Switzerland’s environmental compartments.
I would like to thank all those whose help and advice contributed to the success of this report.
Martin Schiess Head of Air Pollution Control and Chemicals Division Federal Office for the Environment (FOEN)
Use, disposal and environmental releases of mercury © FOEN 2018 7
1 IntroductionMercury is released from natural and anthropogenic
sources into the environment, where it goes through
complex biogeochemical cycles. All forms of mercury are
toxic, although methylmercury, which is formed from
microbial processes and accumulates in food webs, is
particularly so. To protect the environment and human
health, the use and environmental releases of mercury
must be minimised.
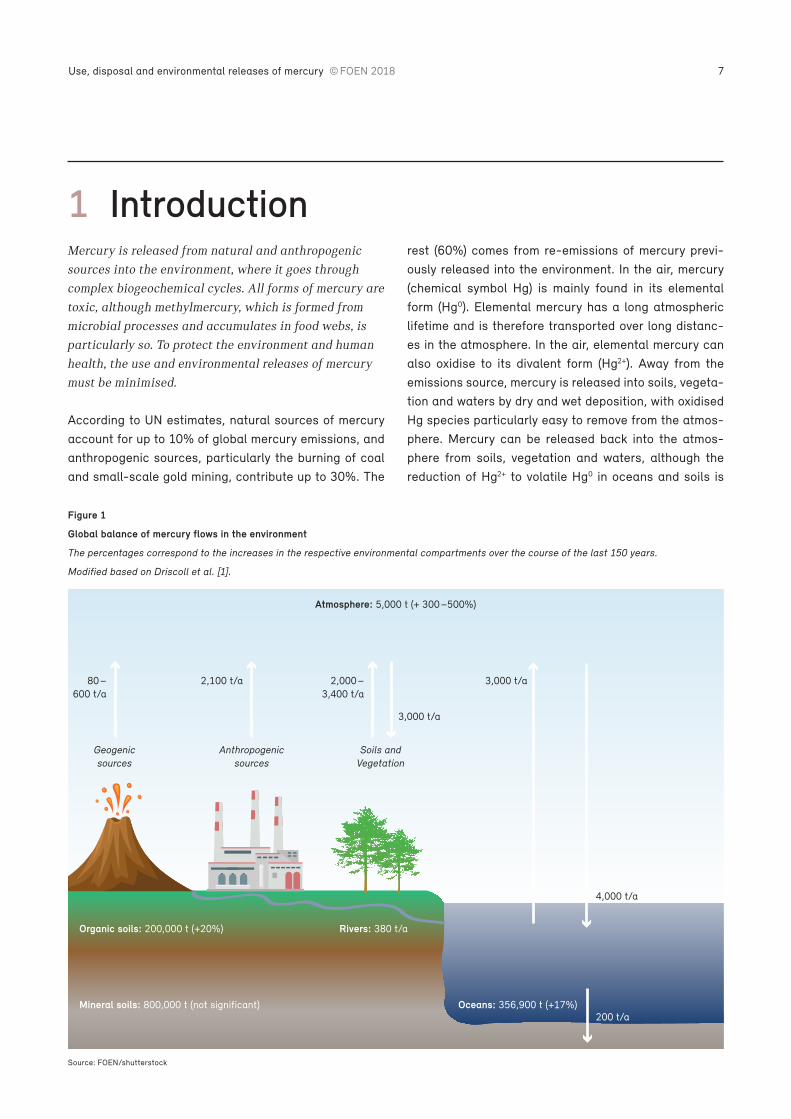
According to UN estimates, natural sources of mercury account for up to 10% of global mercury emissions, and anthropogenic sources, particularly the burning of coal and small-scale gold mining, contribute up to 30%. The
rest (60%) comes from re-emissions of mercury previ-ously released into the environment. In the air, mercury (chemical symbol Hg) is mainly found in its elemental form (Hg0). Elemental mercury has a long atmospheric lifetime and is therefore transported over long distanc-es in the atmosphere. In the air, elemental mercury can also oxidise to its divalent form (Hg2+). Away from the emissions source, mercury is released into soils, vegeta-tion and waters by dry and wet deposition, with oxidised Hg species particularly easy to remove from the atmos-phere. Mercury can be released back into the atmos-phere from soils, vegetation and waters, although the reduction of Hg2+ to volatile Hg0 in oceans and soils is
200 t/a
4,000 t/a
Atmosphere: 5,000 t (+ 300–500%)
Organic soils: 200,000 t (+20%) Rivers: 380 t/a
Mineral soils: 800,000 t (not significant) Oceans: 356,900 t (+17%)
Geogenic sources
Anthropogenic sources
Soils and Vegetation
3,000 t/a2,000–3,400 t/a
2,100 t/a80–600 t/a
3,000 t/a
Source: FOEN/shutterstock
Figure 1
Global balance of mercury flows in the environment
The percentages correspond to the increases in the respective environmental compartments over the course of the last 150 years.
Modified based on Driscoll et al. [1].

Use, disposal and environmental releases of mercury © FOEN 2018 8
primarily responsible for re-emissions into the atmos-phere (Figure 1).
In the environment, microbial processes can transform mercury into organic methylmercury (MeHg). Methylmer-cury is extremely toxic to aquatic and terrestrial organ-isms, and its accumulation is problematic, particularly in aquatic food webs. As a result of this accumulation (also known as bioaccumulation), quantities of MeHg can be found in biota that may be harmful to predators at the top of the food chain. Mercury can damage the nervous system and chronic exposure can result in behavioural changes in the animals affected. Lower fertility rates have also been observed. Owing to its developmental neurotoxicity, pregnancy and early childhood are the most susceptible periods for methylmercury exposure in humans [2, 3].
Mercury is a chemical of particular concern due to long-range atmospheric transport, its persistence in the envi-ronment, its bioaccumulation capacity in ecosystems, as well as its toxic properties. The conclusion of negotiations on a legally binding global agreement on mercury in 2013 was a multilateral success. The aim of the Minamata Convention, which entered into force in August 2017, is to protect human health and the environment from anthro-pogenic mercury emissions.
The international developments described above are being used as an opportunity to publish a status report on mercury in Switzerland. The first part of this report contains a brief introduction to national and international regulations on mercury, followed by an overview of use, waste volume and disposal of mercury in Switzerland. The second part of the report summarises the state of knowledge on environmental releases and mercury pollu-tion in individual environmental compartments, evaluates these pollution levels and highlights existing knowledge gaps. The last part presents the main sources of mercu-ry exposure in the Swiss population. This report is also accompanied by a detailed full report, which presents and describes in depth the data and assessment methods used in the overview presented here.
Use, disposal and environmental releases of mercury © FOEN 2018 9
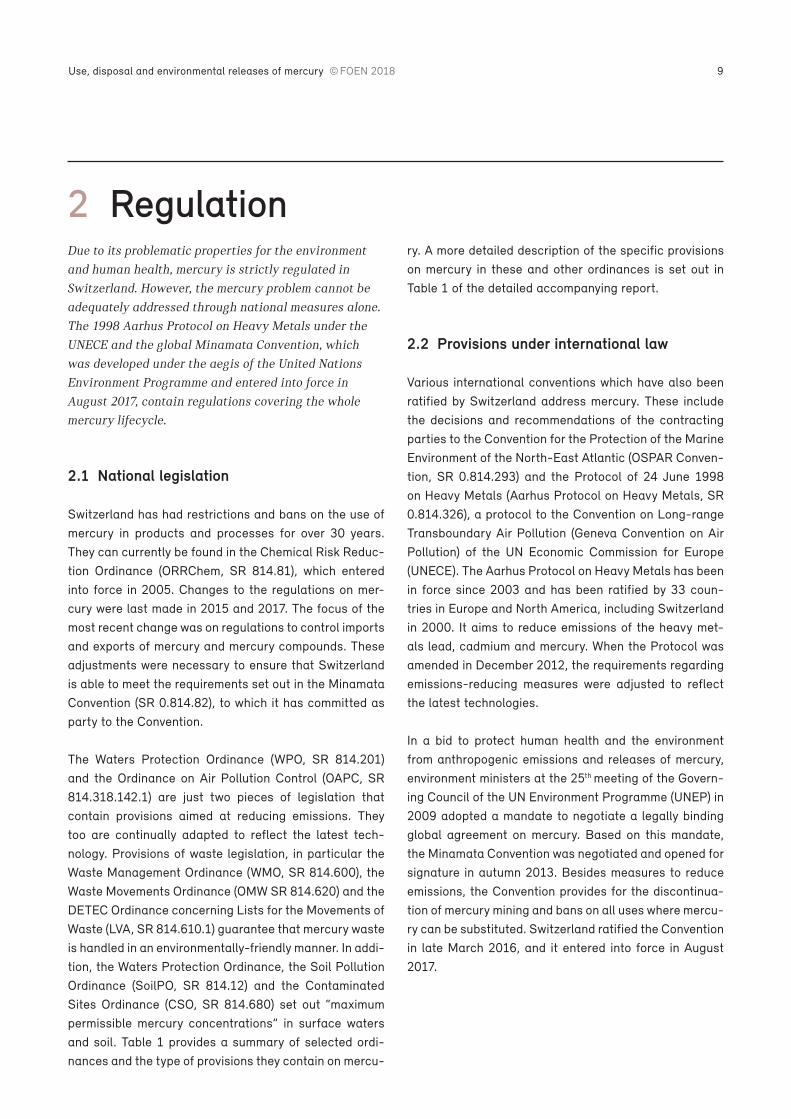
2 RegulationDue to its problematic properties for the environment
and human health, mercury is strictly regulated in
Switzerland. However, the mercury problem cannot be
adequately addressed through national measures alone.
The 1998 Aarhus Protocol on Heavy Metals under the
UNECE and the global Minamata Convention, which
was developed under the aegis of the United Nations
Environment Programme and entered into force in
August 2017, contain regulations covering the whole
mercury lifecycle.
2.1 National legislation
Switzerland has had restrictions and bans on the use of mercury in products and processes for over 30 years. They can currently be found in the Chemical Risk Reduc-tion Ordinance (ORRChem, SR 814.81), which entered into force in 2005. Changes to the regulations on mer-cury were last made in 2015 and 2017. The focus of the most recent change was on regulations to control imports and exports of mercury and mercury compounds. These adjustments were necessary to ensure that Switzerland is able to meet the requirements set out in the Minamata Convention (SR 0.814.82), to which it has committed as party to the Convention.
The Waters Protection Ordinance (WPO, SR 814.201) and the Ordinance on Air Pollution Control (OAPC, SR 814.318.142.1) are just two pieces of legislation that contain provisions aimed at reducing emissions. They too are continually adapted to reflect the latest tech-nology. Provisions of waste legislation, in particular the Waste Management Ordinance (WMO, SR 814.600), the Waste Movements Ordinance (OMW SR 814.620) and the DETEC Ordinance concerning Lists for the Movements of Waste (LVA, SR 814.610.1) guarantee that mercury waste is handled in an environmentally-friendly manner. In addi-tion, the Waters Protection Ordinance, the Soil Pollution Ordinance (SoilPO, SR 814.12) and the Contaminated Sites Ordinance (CSO, SR 814.680) set out “maximum permissible mercury concentrations” in surface waters and soil. Table 1 provides a summary of selected ordi-nances and the type of provisions they contain on mercu-
ry. A more detailed description of the specific provisions on mercury in these and other ordinances is set out in Table 1 of the detailed accompanying report.
2.2 Provisions under international law
Various international conventions which have also been ratified by Switzerland address mercury. These include the decisions and recommendations of the contracting parties to the Convention for the Protection of the Marine Environment of the North-East Atlantic (OSPAR Conven-tion, SR 0.814.293) and the Protocol of 24 June 1998 on Heavy Metals (Aarhus Protocol on Heavy Metals, SR 0.814.326), a protocol to the Convention on Long-range Transboundary Air Pollution (Geneva Convention on Air Pollution) of the UN Economic Commission for Europe (UNECE). The Aarhus Protocol on Heavy Metals has been in force since 2003 and has been ratified by 33 coun-tries in Europe and North America, including Switzerland in 2000. It aims to reduce emissions of the heavy met-als lead, cadmium and mercury. When the Protocol was amended in December 2012, the requirements regarding emissions-reducing measures were adjusted to reflect the latest technolo gies.
In a bid to protect human health and the environment from anthropogenic emissions and releases of mercury, environment ministers at the 25th meeting of the Govern-ing Council of the UN Environment Programme (UNEP) in 2009 adopted a mandate to negotiate a legally binding global agreement on mercury. Based on this mandate, the Minamata Convention was negotiated and opened for signature in autumn 2013. Besides measures to reduce emissions, the Convention provides for the discontinua-tion of mercury mining and bans on all uses where mercu-ry can be substituted. Switzerland ratified the Convention in late March 2016, and it entered into force in August 2017.

Use, disposal and environmental releases of mercury © FOEN 2018 10
Table 1
National legislation on mercury. Selected ordinances (as at July 2018)
Ordinance Type of provision on mercury
Chemical Risk Reduction Ordinance (ORRChem, SR 814.81)
• Bans on the import and export of metallic mercury and on the import of mercury com-pounds without a permit.
• Export ban on the metal from 2028 onwards for purposes other than analysis and research. Exports for the manufacture of discharge lamps and for the maintenance of roll seam welding machines can be authorised until the end of 2020, and exports for the manufacture of dental amalgam capsules until the end of 2027.
• Ban on use as an auxiliary substance in processes.• Extensive ban on mercury being used as a product component. • Precautionary ban on uses unknown before 1 January 2018.
Waters Protection Ordinance (WPO, SR 814.201)
• Threshold values for mercury content in wastewater to be discharged into surface water or sewers for certain sectors.
• Obligation to install amalgam separators in dental practices.• Numerical requirements on water quality of surface water.• Measures to protect humans and biota in the event of loads that exceed the numerical
requirement.
Air Pollution Control Ordinance (OAPC, SR 814.318.142.1)
• Preventive limiting of emissions in the exhaust gases from stationary installations. • Specific emissions limits in exhaust gases from certain installations, e. g. incinerators for
municipal and hazardous waste and cement kilns.
Soil Pollution Ordinance (SoilPO, SR 814.12)
• Guidance value for soil pollution. • Measures to protect humans and biotic communities in the event of loads that exceed the
guidance value.
Waste Ordinance (VVEA, SR 814.600)
• Auxiliary substances in processes are deemed mercury waste that must be handled and deposited in an environmentally-friendly manner.
• Metallic mercury or mercury compounds derived from the handling of mercury waste remain mercury waste which must be handled and deposited in an environmentally-friendly manner provided the metal or compounds may not be handed over for a permissible use, or the metal may not be exported with a permit in accordance with the provisions of the ORRChem.
• Requirements on the use of waste in cement production.
Waste Movements Ordinance (OMW, SR 814.620)
• Technical and organisational measures to handle hazardous waste containing mercury (identification of waste, traceable delivery, disposal permit and reporting obligations for waste disposal companies and requirements on environmentally-friendly handling).
• Measures for the import and export of hazardous waste containing mercury in accordance with the Basel Convention (SR 0.814.05).
Contaminated Sites Ordinance (CSO, SR 814.680)
• Provisions on the investigation, monitoring and remediation of polluted sites. Groundwater, surface water, air and soil must be protected from harmful effects or nuisances, including mercury.
• Concentration value for the need for remediation of soils in private gardens and allotments, children’s play areas and other facilities where children play regularly.

Use, disposal and environmental releases of mercury © FOEN 2018 11
3 Use and disposal Switzerland’s consumption of mercury as a product
component and as an auxiliary substance in processes
amounted to approximately 1,900 kg in 2012. The
amount of mercury in domestic waste is estimated at
around 3,700 kg for the same year. Approximately
2,500 kg of this was recovered in plants in Switzerland
and abroad. Virtually all mercury that is exported from
Switzerland is pure metallic mercury derived from the
processing of imported mercury waste.
3.1 Supply and demand
Demand for metallic mercury in Switzerland between 2006 and 2016 was covered by imports and domestic recycling. A business currently operates in Switzerland that recovers metallic mercury from domestic and foreign waste. Metal recovered in this way that exceeded domes-tic demand was exported.
Figure 2 shows the volumes of metallic mercury imported from 2006 to 2016 according to data from customs sta-tistics [4].
After 2008 the import volume fell sharply, from over 3,000 kg to around 600 kg a year between 2009 and 2013, and further to just 70 kg in 2016. This fall can be attributed to a decline in demand for mercury from manu-facturers of dental products, who have left Switzerland or abandoned production of dental amalgam capsules. Until recently, domestic mercury demand of 1,000 kg a year existed in a chemical factory which operated a chlor- alkali plant using the amalgam process. The supplier of the mercury was the only Swiss mercury recycler. This company also served domestic manufacturers of roll seam welding machines, research institutes and sup-pliers of chemicals for analysis and research purposes using mercury in small quantities.
Compared with imports, exports show a reverse trend: the volume of exported mercury increased sharply versus previous years to around 100,000 kg a year between 2011 and 2015, before falling back to 30,000 kg a year in 2016 (Figure 3).
2006 2007 2008 2009 2010 2011 2012 2013 2014 2015 2016
Hg intended for dental products
Impo
rted
mer
cury
[kg]
Analysis and research purposes Other uses
1,000
2,000
3,000
4,000
5,000
0
Figure 2
Swiss mercury imports in the period 2006 – 2016
Volumes of metallic mercury imported into Switzerland in kilograms, according to customs statistics [4].
Source: EZV [4]

Use, disposal and environmental releases of mercury © FOEN 2018 12
The exported mercury was recovered in the facilities of the Swiss mercury recycler; its “raw material” was mer-cury waste, which it mainly procured through imports. The fall in exports in 2016 can be attributed to a change in the business practice of the recycler. From 2015 recovered mercury was no longer sold to dealers. Customers who required mercury for appropriate uses – in other words analysis and research or the manufacture of dental amal-gam capsules – have since only been supplied directly.
3.2 Uses
Mercury is used for a limited number of applications in Switzerland. Figure 4 shows the uses and estimated volumes of mercury required in 2012 and correspond-ing estimates for 2016 and 2020. The following section describes these uses in more detail.
3.2.1 Auxiliary substances in industrial processes Mercury was used as a cathode in chlor-alkali electroly-sis at a Swiss plant until 2016. The average annual con-sumption to offset mercury losses was around 960 kg. The lost mercury ended up in the various waste products from the process. This was processed in Switzerland and
2006 2007 2008 2009 2010 2011 2012 2013 2014 2015 2016
Exp
orte
d m
ercu
ry [k
g]
0
20,000
40,000
60,000
80,000
100,000
120,000
140,000
160,000
180,000
Figure 3
Swiss mercury exports in the period 2006 – 2016
Volume of metallic mercury exported from Switzerland in kilograms, according to customs statistics. [4]. The production of the recycler is
indicated for 2006 and 2007.
Source: EZV [4]
Figure 4
Use of mercury in Switzerland
Uses of mercury in Switzerland and estimates and forecasts
of associated mercury volumes for the period 2012 – 2020 in
kilograms Hg.
2012 2016 2020
Chlor-alkali electrolysis
Plastic additivesR&D chemicals
Measuring purposesMeasuring devices
BatteriesLampsDental amalgam
Con
sum
ptio
n [k
g]
0
500
1,000
1,500
2,000
Source: Own estimates

Use, disposal and environmental releases of mercury © FOEN 2018 13
the mercury was recovered. A small portion of the mercu-ry also ended up in the environment via the air and waste-water. At the end of 2016, chlor-alkali electrolysis was switched to the mercury-free diaphragm process. Until 2013, mercury was also used as a catalyst in a chemical synthesis. The mercury was then fully regenerated by the user on site, so no extra mercury was purchased between 2008 and 2013. The use of mercury as an auxiliary sub-stance in industrial manufacturing processes has been banned since 2018.
3.2.2 Plastic additivesUntil recently, phenylmercury compounds were used as an additive in the manufacture of polyurethane mouldings (PUR) – elastomers that have a wide range of different applications [5]. Based on EU figures [7], it is estimated that some 180 kg of mercury entered the Swiss market in PUR elastomers in 2012. A ban on the sale of plastics containing mercury came into force in the EU in autumn 2017. Switzerland also introduced a similar ban at the same time.
Due to their sometimes long service lives, we can assume that PUR mouldings will still have to be disposed of for some time. It is believed that at the end of their service lives, they largely end up in incinerators with household and commercial municipal waste. Besides mouldings, coverings for sports pitches (so-called “Tartan Turf”) were also manufactured using phenylmercury compounds in the 1980s [6]. It is not possible to provide information on mercury accumulation from old coverings; it is assumed that they are disposed of in hazardous waste incineration plants.
3.2.3 Chemicals for analysis and research purposesMercury is used as a metal and in the form of compounds in laboratories. Mercury compounds for use in scientific research and development were synthesised at one loca-tion in Switzerland in 2012. In addition, such compounds were also imported as bulk products for repackaging. Some of these manufactured and repackaged compounds were exported, and some were used in Switzerland for analysis and research purposes. In 2012, domestic con-sumption was estimated to be 100 kg per year. We do not expect these volumes to change significantly for 2016 and 2020. Some of the mercury used in this way is col-
lected separately for disposal, while the rest is likely to be drained via the sewage system into wastewater treatment plants.
3.2.4 Measuring devices and measuring purposesMercury is primarily used in measuring devices as a liquid in manometers and thermometers. In addition, mercury is used to determine pore size distribution and the pore volume of materials (porosimetry). It is also used in elec-trochemical analysis methods, such as in voltammetry as an electrode. No measuring devices containing mercu-ry were manufactured in Switzerland in 2012. Based on EU surveys [8], measuring devices sold in Switzerland in 2012 contained approximately 80 kg of mercury. Further-more, mercury consumption from measurement of pore volumes and voltammetry in 2012 is estimated at around 160 kg, with the largest portion used for porosimetric measurements. Now that tried-and-tested, mercury-free alternatives exist for most measuring devices, they were banned from being placed on the market in Switzerland in 2015. However, this ban does not apply to mercury poro-simetry and voltammetry.
There are no data available on the type and quantity of measuring devices containing mercury that are disposed of in Switzerland. It is assumed that the mercury con-tained in the devices will be recovered. Mercury from porosimetry and voltammetry is usually purified by dis-tillation and re-used.
3.2.5 Dental amalgamDental amalgam is made by mixing equal parts of mercu-ry and a dental alloy. Dental amalgam is sold in capsules that contain these two components. The production of dental amalgam capsules was recently discontinued in Switzerland, but was still taking place in 2012, with most of the capsules produced being exported. In Switzerland some 35 kg of mercury was used in new amalgam fillings in 2012.
Material flows of mercury linked to the use of dental amalgam are relatively complex. In dental practices these days, most mercury is produced by drilling out old amal-gam fillings and pulling out teeth containing amalgam. For the most part amalgam fillings that have been removed end up in amalgam separators that are installed in every
Use, disposal and environmental releases of mercury © FOEN 2018 14
dental practice. The waste material is then passed on to waste management in Switzerland and abroad for fur-ther processing. A small portion of the removed fillings is not retained by the amalgam separators and ends up in the sewage system via municipal wastewater. Amal-gam fillings that are not removed remain in the mouths of patients until they die. The amalgam fillings of deceased people cause mercury to reach crematoriums, where it is largely filtered out by the crematorium exhaust air purifi-cation system. It also enters the soil through burial.
3.2.6 BatteriesUntil recently, button cell batteries still contained 0.25 – 1.2% mercury in the form of amalgamated zinc to prevent a build-up of gas and leakages. This zinc was still used by the sole Swiss manufacturer of button cell bat-teries in 2012; it has since been producing mercury-free cells. The quantity of mercury in button cell batteries that entered the market in Switzerland in 2012 is estimated to be around 160 kg. This estimate factors in the vari-ous mercury contents of the different cell types and their share of the total volume of button cell batteries sold in Switzerland in 2012 [9, 10]. Since 2016, mercury has been banned in batteries in Switzerland.
Used batteries must be handed in by consumers at an appropriate collection point for disposal. They are then disposed of, and mercury is recovered in the process. The recycling rate for batteries averaged around 70% between 2011 and 2013. There is reason to believe that the remaining 30% of used batteries ended up in inciner-ators via municipal waste.
3.2.7 Discharge lampsIn terms of lighting technology, a distinction can be drawn between discharge lamps, light-emitting diodes (LED) and thermal radiators (bulbs, halogen bulbs). Dis-charge lamps comprise fluorescent lamps, compact fluorescent lamps and high-intensity discharge lamps (sodium-vapour lamps, mercury vapour lamps and met-al halide lamps), which all rely on mercury to produce light. However, light-emitting diodes and thermal radia-tors do not contain mercury. Discharge lamps are used in households, purpose-built structures and street lighting. In addition, cold-cathode fluorescence lamps containing mercury were also still used for backlights in IT devices
in 2012. Discharge lamps are not manufactured in Swit-zerland, so demand is covered by imports.
On the basis of data on the use of different types of discharge lamps, and with assumptions on the average quantity of mercury contained in the lamp types, the vol-ume of mercury that was placed on the market through discharge lamps in 2012 is estimated at around 35 kg for interior lighting and 35 kg for street lighting and other lighting purposes [11] [107]. Furthermore, model calcu-lations by Zumbühl & Benedetti [12] and Böni & Widmer [13] can also be used to estimate that an additional 40 kg of mercury in the form of backlights for IT devices was placed on the market in 2012.
Discharge lamps and IT devices are collected and dis-posed of separately in Switzerland. However, a portion of the discharge lamps containing mercury, particular-ly compact fluorescent lamps, are also incinerated as municipal waste due to incorrect disposal.
3.2.8 Switches, relays and other componentsThe use of switches and relays containing mercury in electrical and electronic equipment used to be wide-spread. Due to chemicals legislation, the use of compo-nents of all types containing mercury in such equipment is now only possible in exceptional circumstances. This also applies to motor vehicles (passenger cars and light commercial vehicles). In addition, mercury was previously used for power transmission in the roller heads of roll seam welding machines for the manufacture of can pack-aging or industrial and reinforcement meshes. There are now mercury-free alternatives for these purposes.
Based on clarifications on the use of mercury in med-ical devices and monitoring and control instruments in the EU, we can conclude that no significant quantities of mercury were placed on the market in Switzerland via such devices in 2012. The identified components contain-ing mercury were infrared detectors, ionising radiation detectors, reference electrodes (calomel electrodes) and special switches [14]. In the case of welding machines, it is estimated that Swiss manufacturers supplied (foreign) plant operators with around 40 kg of mercury for filling roll heads in 2012.

Use, disposal and environmental releases of mercury © FOEN 2018 15
According to data from Kägi & Franov [15], companies specialising in the disposal of electrical and electronic equipment still separate a significant number of switch-es containing mercury mainly from fridges, freezers and air conditioning units. Non-separated mercury switches and other components containing mercury from these and other large appliances and from tools, machines, installations and vehicles end up in scrap processing. As a result, they contaminate the scrap and the resulting residual material when it is shredded.
3.3 Volume of waste and disposal
The volume of mercury in waste is estimated at around 3,700 kg in 2012. Figure 5 shows the contributions of the various applications. This does not include the process waste from the chemical industry that is no longer appli-cable, but which still amounted to 1,000 kg in 2012.1 PUR elastomers account for some 25% of the mercury vol-ume. Mercury-containing switches, dental amalgam and measuring devices including mercury required for meas-uring purposes each account for 10 – 15%. Meanwhile, batteries, lamps and chemicals for research purposes each account for 5% of mercury waste. Around 20% of mercury waste cannot be assigned to an application. This mainly concerns mercury contained in shredder residue (RESH) and scrap metal, and certain quantities of mer-cury that are found in sewage sludge and in waste that is fed into municipal waste incinerators.
1 The some 40,000 kg of mercury that became obsolete during the conversion of chemical synthesis and chlor-alkali production processes at two plants has since been transformed into inert mercury sulfide (cinnabar) in Swit-zerland and deposited in an underground storage facility abroad.
Figure 5
Contributions of individual applications to volume of mercury waste
Contributions of individual applications to volume of mercury waste in
Switzerland in 2012, excluding the process waste from the chlor-
alkali industry.
Source: Own estimates
To treat waste containing mercury, mercury is recovered in metallic form or transferred to deposited products. In doing so, mercury also released into the environment, particularly the air. The following paragraphs detail the fate of mercury when the waste is disposed of.
3.3.1 Mercury recoveryThermal treatment of mercury waste involves heating the waste so the metallic mercury or mercury compounds it contains vaporise or sublimate. Mercury compounds decompose into metallic mercury when heated to tem-peratures of between 400 ̊ C and 700 ̊ C through reduc-tion. The metal is then separated from the flue gas by condensation, purified by distillation and can be re-used. A company in Switzerland currently operates facilities equipped for this purpose.
12%
13%
4%
5%
6%
15%
24%
21%
Non-assigned uses PUR elastomers
Switches Batteries
R&D chemicals Measuring devices and purposes
LampsDental amalgam

Use, disposal and environmental releases of mercury © FOEN 2018 16
It is estimated that more than half of the mercury con-tained in Swiss wastes in 2012 was recovered. Table 2 provides an overview of the wastes which were assumed to have been thermally treated at plants in Switzerland and abroad, and on the estimated quantity of mercury recovered.2 On the one hand, process waste from the chemical industry was recycled, as was waste containing mercury, such as measuring devices, spent batteries and waste from the use of dental amalgam. On the other, mer-cury-containing fractions from other waste treatments, such as activated carbons loaded with mercury from the processing of used lamps, were also recycled.
Table 2
Overview of waste generated in Switzerland that was thermally
treated in Switzerland or abroad in 2012, and the estimated volume
of mercury recovered
Source product Quantity of mercury recovered [kg]
Process waste from chlor-alkali electrolysis 1,000
Disused and discarded measuring equipment 210
Contaminated mercury used for measuring purposes (especially mercury porosimetry)
155
Spent batteries (in particular button cells) 115
Dental amalgam (excess amalgam, removed amalgam fillings, residues from amalgam separators in dental practices)
240
Separated mercury-containing switches from large appliances
≈ 400
Activated carbon filters from the processing of used lamps
≈ 70
Activated carbon filters and ion exchange resins from flue gas purification in waste incineration plants
≈ 300
3.3.2 Disposal of scrap and RESHAround 70% of Switzerland’s scrap is processed using a shear and 30% with a shredder [16]. Shredding produc-es non-recyclable residues (RESH). Mercury-containing components from appliances, tools, machines, installa-
2 In the case of wastes for which there are no reliable data available on recovery, but where recovery is technically feasible and is described in the grey literature, it is assumed that recovery took place.
tions and motor vehicles that are not separated therefore partly end up in scrap metal, in particular steel scrap, and partly in RESH.
Steel scrap is melted down at two electric steel plants in Switzerland, where at temperatures of up to 1800 °C the mercury contained is transferred to crude gas. When the crude gas is subsequently de-dusted, some of the mer-cury enters the filtered dust, and the rest remains in the de-dusted crude gas and is thus emitted into the environ-ment. There are no reliable figures available on the level of mercury in filter dust that is recycled abroad. However, based on the production figures of the two Swiss steel plants and their mercury emissions factors in exhaust air, we can estimate that the scrap melted down at the plants in 2012 contained at least 50 kg of mercury [17].
Due to its high calorific value, RESH is used for thermal recovery at waste incineration plants in Switzerland and abroad. According to Wochele et al. [18], the average mercury content in RESH in 2008 was approximately 3 g per tonne. Based on this mercury content and the aver-age volume of RESH produced between 2011 and 2013 of 75,000 tonnes [19], we can estimate that this RESH contained 225 kg of mercury.
3.3.3 Disposal of used lampsThe quantity of mercury added to discharge lamps has significantly decreased in recent years, as has their market share. Nevertheless, it is assumed that discharge lamps will continue to be used and that waste should be disposed of in an environmentally sound manner. Established disposal methods exist for the recycling of discharge lamps. The leading Swiss waste disposal com-pany processes spent fluorescent tubes, energy-saving bulbs, old high-pressure discharge lamps (such as sodi-um vapour lamps) and flat screens [20, 21]. The material is broken down using a mixing drum or shredder and the different fractions (glass, metal, mixtures of plastics and metals and of fluorescent powder and glass powder) are separated using screens and metal extractors. The mer-cury contained in the lamps is found in the separated fluorescent powder, and additional mercury is chemisorp-tively bound to impregnated activated carbons from the exhaust air in the recycling process. It is estimated that between 120 kg and 150 kg of mercury was generated
Use, disposal and environmental releases of mercury © FOEN 2018 17
from old lamps and backlighting for IT devices in 2012 [12, 13, 22]. There are no reliable data on the fate of this mercury; in principle, mercury can be removed from the fluorescent powder and activated carbons and recycled. In an initial approximation it is assumed that 50% of the mercury was deposited underground with the fluorescent powder or activated carbon, and the remaining 50% of the mercury was recovered.
3.3.4 Sewage sludge disposalThe mercury contained in wastewater from industry, com-merce and households is largely retained in the sewage sludge during wastewater treatment in sewage plants. Switzerland produces some 200,000 tonnes of sewage sludge a year. Since the ban on the use of sludge in agri-culture, which came into effect in 2008, this sludge is always incinerated.
Based on average mercury content in sewage sludge of 0.6 g Hg per tonne in 2012, the quantity of mercury in sewage sludge can be estimated at 120 kg. In 2012, some 50% of the sludge was incinerated in sludge incineration plants (mono-incinerators), 25% in municipal waste incin-erators and 25% in cement works [23].
3.3.5 Waste disposal in cement worksBy using alternative raw materials and replacing tradi-tional fuels such as coal and heavy fuel oil with alterna-tive fuels, Swiss cement works are becoming more energy efficient and reducing their CO2 emissions. Because of its calorific value and mineral content, sewage sludge is both a replacement fuel and an alternative raw mate-rial. A quarter of the sludge originating from wastewa-ter treatment was incinerated in cement works in 2012, which brought around 30 kg of mercury into the rotary kilns of cement works.
Cement production is a high-temperature process in which mercury makes up a significant portion of the heavy metal emissions. The element not only enters the system via waste, but also via conventional fuels and raw materials. Due to the high temperatures, the mer-cury contained in the raw materials and fuels ends up in the crude gas and the dust it contains during cement clinker production. This dust is then separated from the crude gas via a de-dusting process and subsequently
mixed with the cement clinker in the cement mill. In this way the mercury initially introduced in raw materials and fuels enters the cement to a large extent. The rest enters the environment through the exhaust air from the plants. It can be estimated that in 2012 approximately 255 kg of mercury was fed into Swiss cement kilns. Of this, 75% (185 kg) was introduced through raw materials and 25% (70 kg) from fuels such as sewage sludge and coal. The amount of mercury emitted in the exhaust air from Swiss cement works in 2012 amounted to 0.03 g per tonne of cement produced on average [17]. It can therefore be cal-culated that of the 255 kg of mercury introduced, some 155 kg ended up in cement and 100 kg was emitted into the environment.
3.3.6 Waste incineration in municipal waste incineration plants In 2012, 3.8 million tonnes of waste were incinerated in Swiss municipal waste incineration plants. On aver-age this waste was composed of around 80% munici-pal waste, 12% construction waste, 5% sewage sludge and 4% other wastes [24]. Based on studies by Taverna & Morf [25] and Taverna & Meister [26] on the material flows of outputs from waste incineration plants (slag, fil-ter ash, flue gas purification products, exhaust air) and the mercury content of these outputs, we can assume that wastes disposed of in municipal waste incinerators in 2012 contained on average 0.3 g of mercury per tonne and that some 1,150 kg of mercury was fed into Swiss municipal waste incinerators in 2012. Around 20% of this mercury can be attributed to RESH, sewage sludge and incorrect disposal of batteries and energy-saving lamps. Further estimates on the origin of the mercury introduced into the plants are uncertain; it is assumed that mercu-ry-containing polyurethane mouldings were important Hg sources.
The majority of the Swiss municipal waste incinerators in operation in 2012 were equipped with electrostatic precipitators to separate fly ash and a downstream wet flue gas cleaning system. Most of the mercury introduced into municipal waste incinerators with waste is separat-ed from the crude gas during flue gas scrubbing and is removed from the acid scrubber water through precipita-tion [24, 25]. In this way, hydroxide sludge was produced in about two thirds of all municipal waste incinerators in
Use, disposal and environmental releases of mercury © FOEN 2018 18
2012. In a further third of plants, mercury was removed from acid scrubber water using ion exchange so it could be used to scrub the filter ash.
It is estimated that of the 1,150 kg of mercury introduced into municipal waste incineration plants, some 500 kg was deposited in hydroxide sludge. Ion exchangers load-ed with 300 kg of mercury cannot be regenerated and it is assumed that they were thermally decomposed with recovery of the mercury. The amount of mercury in the deposited slag and filter ash can be estimated at 50 kg each. It is estimated that a further 240 kg of mercury passed through the flue gas cleaning system and was emitted into the air with the clean gas [24].
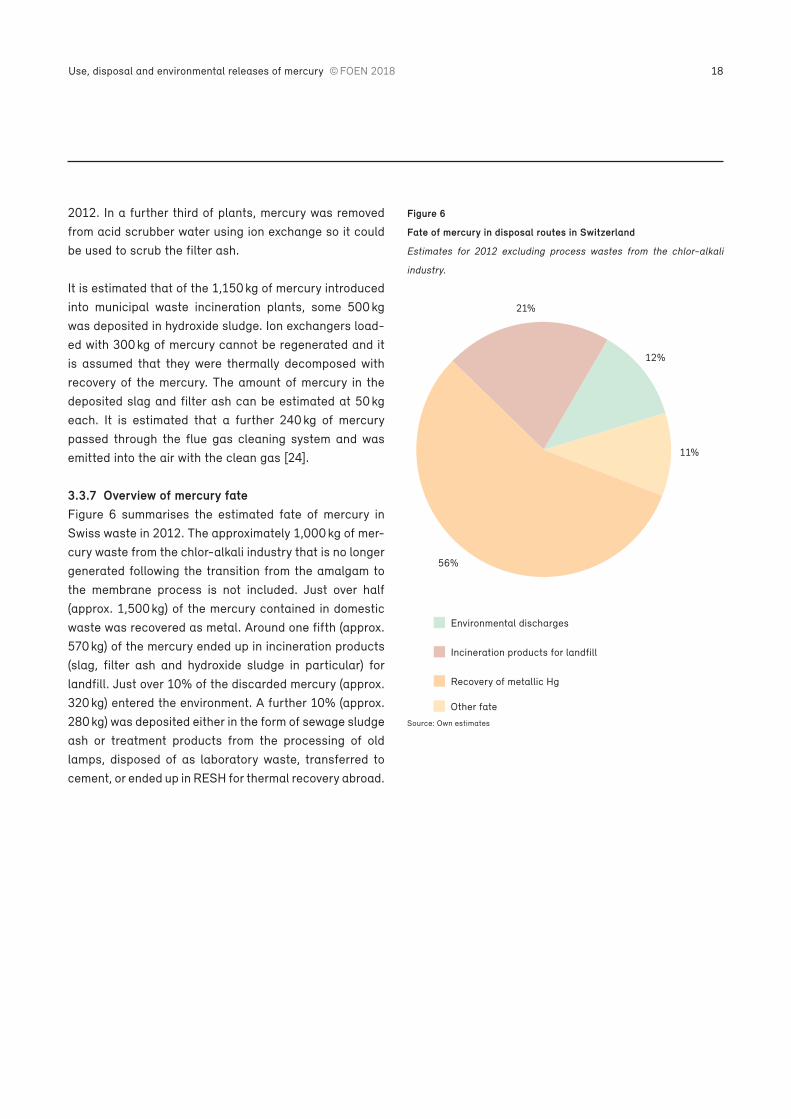
3.3.7 Overview of mercury fate Figure 6 summarises the estimated fate of mercury in Swiss waste in 2012. The approximately 1,000 kg of mer-cury waste from the chlor-alkali industry that is no longer generated following the transition from the amalgam to the membrane process is not included. Just over half (approx. 1,500 kg) of the mercury contained in domestic waste was recovered as metal. Around one fifth (approx. 570 kg) of the mercury ended up in incineration products (slag, filter ash and hydroxide sludge in particular) for landfill. Just over 10% of the discarded mercury (approx. 320 kg) entered the environment. A further 10% (approx. 280 kg) was deposited either in the form of sewage sludge ash or treatment products from the processing of old lamps, disposed of as laboratory waste, transferred to cement, or ended up in RESH for thermal recovery abroad.
Figure 6
Fate of mercury in disposal routes in Switzerland
Estimates for 2012 excluding process wastes from the chlor-alkali
industry.
21%
12%
56%
11%
Environmental discharges
Incineration products for landfill
Recovery of metallic Hg
Other fate
Source: Own estimates
Use, disposal and environmental releases of mercury © FOEN 2018 19
4 Environmental releases and occurrenceMercury is discharged into the air, waterbodies and
soils and can be measured in these environmental
compartments accordingly. In aquatic sediments and
soils, mercury is converted into methylmercury by
bacteria. Mercury accumulates in biota, with methyl
mercury accumulating particularly readily. High
concentrations of methylmercury are found in organ
isms in the limnetic compartment.
4.1 Air
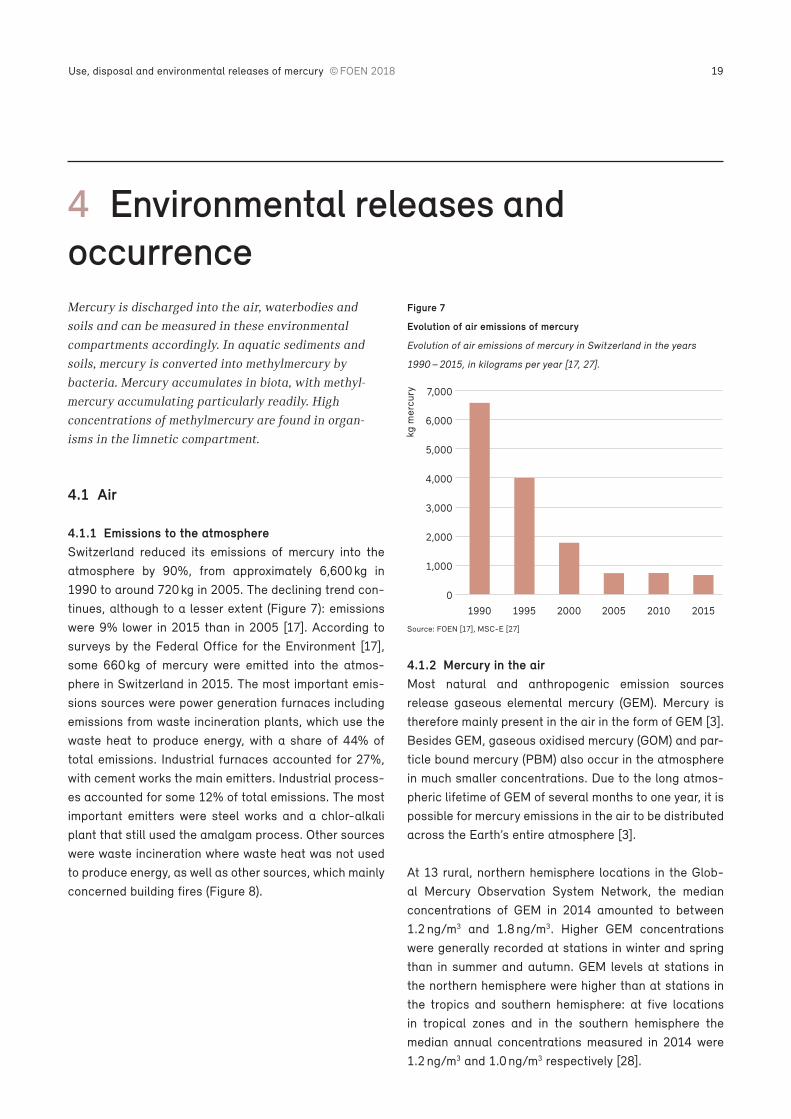
4.1.1 Emissions to the atmosphereSwitzerland reduced its emissions of mercury into the atmosphere by 90%, from approximately 6,600 kg in 1990 to around 720 kg in 2005. The declining trend con-tinues, although to a lesser extent (Figure 7): emissions were 9% lower in 2015 than in 2005 [17]. According to surveys by the Federal Office for the Environment [17], some 660 kg of mercury were emitted into the atmos-phere in Switzerland in 2015. The most important emis-sions sources were power generation furnaces including emissions from waste incineration plants, which use the waste heat to produce energy, with a share of 44% of total emissions. Industrial furnaces accounted for 27%, with cement works the main emitters. Industrial process-es accounted for some 12% of total emissions. The most important emitters were steel works and a chlor-alkali plant that still used the amalgam process. Other sources were waste incineration where waste heat was not used to produce energy, as well as other sources, which mainly concerned building fires (Figure 8).
Figure 7
Evolution of air emissions of mercury
Evolution of air emissions of mercury in Switzerland in the years
1990 – 2015, in kilograms per year [17, 27].
4.1.2 Mercury in the airMost natural and anthropogenic emission sources release gaseous elemental mercury (GEM). Mercury is therefore mainly present in the air in the form of GEM [3]. Besides GEM, gaseous oxidised mercury (GOM) and par-ticle bound mercury (PBM) also occur in the atmosphere in much smaller concentrations. Due to the long atmos-pheric lifetime of GEM of several months to one year, it is possible for mercury emissions in the air to be distributed across the Earth’s entire atmosphere [3].
At 13 rural, northern hemisphere locations in the Glob-al Mercury Observation System Network, the median concentrations of GEM in 2014 amounted to between 1.2 ng/m3 and 1.8 ng/m3. Higher GEM concentrations were generally recorded at stations in winter and spring than in summer and autumn. GEM levels at stations in the northern hemisphere were higher than at stations in the tropics and southern hemisphere: at five locations in tropical zones and in the southern hemisphere the median annual concentrations measured in 2014 were 1.2 ng/m3 and 1.0 ng/m3 respectively [28].
1990 1995 2000 2005 2010 2015
kg m
ercu
ry
0
1,000
2,000
3,000
4,000
5,000
6,000
7,000
Source: FOEN [17], MSC-E [27]

Use, disposal and environmental releases of mercury © FOEN 2018 20
0
50
100
150
200
250
300
350
290
150
40
80
30
70
kg m
ercu
ry
Power generation including waste
incineration
Industrial furnaces Other furnaces Industrial processes Waste incineration Other sources
Figure 8
Sources of air emissions of mercury
Type and size of Swiss air emissions of mercury in 2015 in kilograms per year [17].
Source: FOEN [17]
01.07.1401.09.14
01.11.1401.01.15
01.01.1401.03.14
01.03.15
01.05.1401.07.15
01.09.15
01.11.15
01.05.15
90th percentile 10th percentile MedianGEM Kaserne ZH
GE
M in
ng/
m3
1
1.5
2
2.5
3
3.5
4
4.5
Figure 9
Mercury levels in the air in Zurich
Daily median concentrations of GEM in ng/m3 from January 2014 to December 2015 at Zurich Kaserne, showing the median, 10th and 90th
percentile over the whole measurement period. The measuring station is located in the centre of the city of Zurich in a park-like courtyard [30, 31].
Source: Denzler [30], EMPA [31]

Use, disposal and environmental releases of mercury © FOEN 2018 21
Vertical profiles of GEM concentrations at altitudes of between 500 m and 3,000 m were determined in meas-urement flights over four locations in Slovenia (Iskraba, Idrija) and Germany (Leipzig, Waldhof) in 2013. No ver-tical gradients were identified; GEM concentrations at the locations varied between 1.4 ng/m3 and 1.6 ng/m3. On entering the free troposphere, levels of GEM fell to 1.3 ng/m3 at all locations and remained constant even at higher altitudes [29]. Extensive data on the occurrence of GEM in Switzerland are available for the urban loca-tion Zurich for the period from January 2014 to December 2015 [30]. Figure 9 shows the daily median concentra-tions in Zurich over the measurement period. The 10th
percentile was 1.6 ng/m3, the 90th percentile 2.1 ng/m3 and the annual median 1.8 ng/m3.
Within the framework of the European Monitoring and Evaluation Programme (EMEP), a programme under the 1979 Geneva Convention on Air Pollution, the Meteor-ological Synthesizing Centre-East uses global mercury emissions from natural and anthropogenic sources to model the resulting atmospheric mercury pollution in a spatial resolution of 50 × 50 km2. The mercury levels calculated for Switzerland were between 1.2 ng/m3 and 1.6 ng/m3 in 2014 and between 1.1 ng/m3 and 1.4 ng/m3 in 2015.
4.1.3 Deposition from the airCalculations of atmospheric deposition using the EMEP model reveal that atmospheric mercury deposition in Switzerland has fallen from 1,400 kg in 1990 to around 710 kg today. Figure 10 shows the development of mer-cury deposition in the period 1990 – 2015. Of the mercury deposited in 2014, 170 kg (25%) came from anthropo-genic sources in Europe and Central Asia (EMEP states); sources in Italy and Switzerland each contributed approx-imately 35%. Around 75% of the mercury deposited in Switzerland comes from global, natural and historical sources [32].
Figure 10
Temporal development of mercury deposition in Switzerland
Temporal development of atmospheric mercury deposition in the
period 1990 – 2015 in kilograms per year [27].
In Switzerland and other European countries, atmos-pheric mercury deposition is also monitored within the framework of a programme under the 1979 Geneva Con-vention on Air Pollution by measuring mosses. Mosses are used as indicators because they do not have roots, so they draw water, nutrients and pollutants such as mer-cury exclusively from the air. Figure 11 shows the median measured mercury concentrations in mosses between 1990 and 2015 for the five natural regions of Switzerland. The concentrations measured in this period declined by up to 50% and confirm that atmospheric mercury depo-sition is decreasing.
1990 1995 2000 2005 2010 2015
kg m
ercu
ry
0
200
400
600
800
1,000
1,200
1,400
1,600
Source: MSC-E [27]

Use, disposal and environmental releases of mercury © FOEN 2018 22
4.2 Waterbodies
Mercury occurs in water mainly in the divalent form (Hg2+) under primarily oxidising conditions. Under certain con-ditions, Hg2+ can also be reduced to volatile, elementary mercury (Hg0) via biotic or abiotic pathways [35]. In addi-tion, the bioavailability of Hg2+ is controlled by formation of complexes with organic and inorganic ligands and by adsorption on suspended solids. Mercury that is adsorbed to particles or incorporated in biomass is deposited on the bottom of the waterbody. Mercury that is deposited in this way is a reservoir for the production of methylmer-cury by sulphate-reducing microorganisms under anoxic conditions [35, 36].
4.2.1 Discharges into waterbodiesApproximately 70 kg of mercury was discharged into surface waters in Switzerland in 2015. According to a methodical approach used by the International Commis-sion for the Protection of the Rhine (ICPR) to estimate discharges of substances into waterbodies via differ-ent pathways, a distinction can be drawn between point
sources and diffuse sources [37, 38]. Figure 12 shows the relevant sources and the estimated mercury dis-charges to Swiss surface waters in 2015. Some 15% of emissions were from point sources and 85% from diffuse sources. Point sources include mercury discharges from munici pal wastewater treatment plants and direct releas-es from industry and business. Diffuse mercury sources are mainly atmospheric deposition (for standing waters), spring water inflows and soil erosion. Other diffuse sourc-es were discharges from stormwater separation systems and the discharge of untreated mixed water during peri-ods of heavy rainfall to relieve sewage treatment plants. Other diffuse discharges, such as the run-off of fertilisers used in agriculture and discharges from households not connected to the municipal sewage system, were of minor importance.
Figure 11
Mercury concentrations in mosses in Switzerland
Median mercury concentrations measured in mosses in Switzerland between 1990 and 2015 for the monitoring of atmospheric depositions.
Mosses were analysed in Switzerland’s five natural regions [33, 34].
–
10
20
30
40
50
60
70
1990 1995 2000 2005 2010 2015
Southern Alps Central Alps Northern Alps Central plateau Jura
µg H
g/kg
dry
mat
ter
Source: Thöni [33], FOEN [34]

Use, disposal and environmental releases of mercury © FOEN 2018 23
4.2.2 Occurrence in groundwater The NAQUA National Groundwater Monitoring pro-gramme records the state of and changes in Switzer-land’s groundwater resources at some 600 monitoring sites. Mercury was included in the monitoring programme at 50 sites in 2006. It was not possible to quantify mer-cury in any sample; the limit of quantification for these measurements was 500 ng/L [39]. Likewise, levels of mercury at 25 drinking water installations near landfills and contaminated sites in the canton of Aargau were nev-er quantifiable with a limit of quantification of 100 ng/L [40]. In a survey of spring water and groundwater used by the city of Zurich as sources of drinking water, no mercury concentrations above the limit of quantification of 9ng/L were detected in any sample [41, 42]. Even in analyses of groundwater under soils contaminated with mercury in southwestern Switzerland, mercury levels were always below the limit of quantification of 10 ng/L [43, 44].
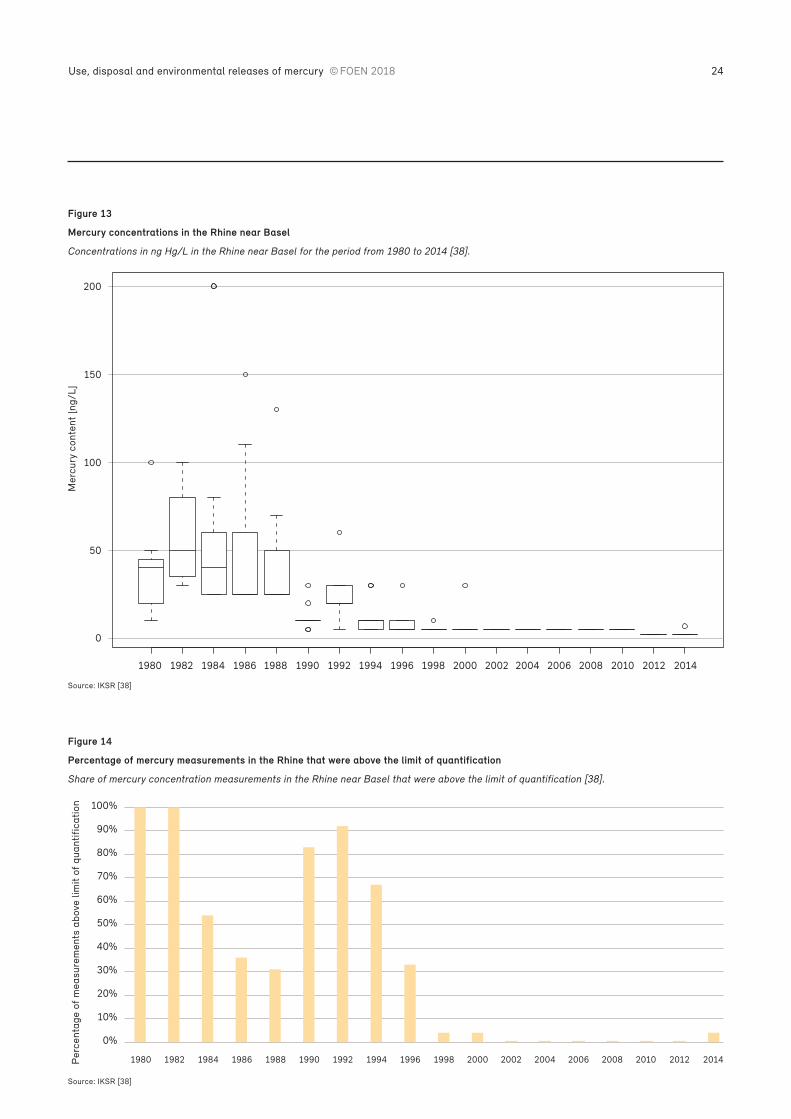
4.2.3 Occurrence in surface watersThe International Commission for the Protection of the Rhine (ICPR) has long been reporting on the concentration of mercury in the Rhine near Basel. Figure 13 shows the concentrations of mercury measured in the period 1980 to 2014. In addition, Figure 14 shows the percentage of samples in the respective year in which mercury concen-trations were above the level of quantification. Between 1980 and 1990 the total mercury concentrations (dis-solved and particulate) in the measured water samples were between 20 ng/L and 100 ng/L, although higher concentrations were measured in isolated cases. From 1990 mercury concentrations in the Rhine near Basel fell sharply, and since 2000 mercury concentrations above the limit of quantification of 10 ng/L (1996 – 2011) and 5 ng/L (from 2012) have only been detected occasionally.
Figure 12
Estimated discharges of mercury into Swiss waters
Estimated discharges of mercury into Swiss waters from various sources in 2015 in kilograms per year. “Other” diffuse sources include fertiliser
run-off from agricultural activities and discharges from households not connected to the municipal sewage system.
0
5
10
15
20
25
56 6
1213
19
5
2
kg m
ercu
ry
OthersDrainage & groundwater
inflow
Mixed water overflows due to
rainfall
Separation sewage system
Atmospheric deposition
ErosionDischarges from industry and
business
Discharges from municipal
wastewater treatment plants
Source: Own estimates
Use, disposal and environmental releases of mercury © FOEN 2018 24
Figure 13
Mercury concentrations in the Rhine near Basel
Concentrations in ng Hg/L in the Rhine near Basel for the period from 1980 to 2014 [38].
Figure 14
Percentage of mercury measurements in the Rhine that were above the limit of quantification
Share of mercury concentration measurements in the Rhine near Basel that were above the limit of quantification [38].
1980 1982 1984 1986 1988 1990 1992 1994 1996 1998 2000 2002 2004 2006 2008 2010 2012 2014
0
50
100
150
200
Mer
cury
con
tent
[ng/
L]
Source: IKSR [38]
1980 1982 1984 1986 1988 1990 1992 1994 1996 1998 2000 2002 2004 2006 2008 2010 2012 2014Per
cent
age
of m
easu
rem
ents
abo
ve li
mit
of q
uant
ifica
tion
0%
10%
20%
30%
40%
50%
60%
70%
80%
90%
100%
Source: IKSR [38]

Use, disposal and environmental releases of mercury © FOEN 2018 25
Figure 15
Mercury concentrations in suspended solids in the Rhine near Basel
Concentrations in µg Hg/kg in suspended solids in the Rhine near Basel for the period from 1990 to 2014 [38].
Source: IKSR [38]
Figure 16
Mercury loads in the Rhine near Basel
Annual mercury loads in the Rhine near Basel in the years 1975 – 2015 in kilograms per year, estimated using data from the ICPR [38].
Source: IKSR [38]
1990 1992 1994 1996 1998 2000 2002 2004 2006 2008 2010 2012 2014
Mer
cury
con
tent
[µg
/kg]
0
200
400
600
800
1,000
1,200
1,400
1975–1980 1981–1985 1986–1990 1991–1995 1996–2000 2006–2010 2011–20152001–2005
kg m
ercu
y/ye
ar
0
200
400
600
800
1,000
1,200
1,400
1,600
1,800
2,000

Use, disposal and environmental releases of mercury © FOEN 2018 26
In addition to the mercury concentration in the water, the mercury content of suspended solids is also measured in the Rhine near Basel. Figure 15 shows the measured concentrations for the period from 1990 to 2014. As for the water samples, a decrease has also been observed for suspended solids.
The Rhine drains an area of 36,500 km2 [45] as far as Basel, and its catchment area downstream of the lakes covers an area of 9,500 km2 with over 3 million inhabitants [46]. Based on the mean annual flows and annual averages for total mercury concentration at the locations Village-Neuf (1975 – 1994) and Weil am Rhein (1995 – 2015), the annual mercury loads in the Rhine near Basel can be calculated.3 The results of these calculations are shown in Figure 16; we can see that mercury loads fell sharply between 1975 and 1995. Hari & Zobrist [47] demonstrated a similar significant decrease in mercury flows in the Rhone at Porte-du-Scex between 1976 and 1998.
Mercury concentrations in Swiss surface waters are also measured by various associations and cantonal water protection agencies. For example, total mercury concen-trations of between 1.1 ng/L and 1.6 ng/L were meas-ured in Lake Constance in 2005. In four tributaries of Lake Constance (Alpenrhein, Alter Rhein, Goldach and Steinach) total mercury concentrations totalled between 1.5 ng/L and 9.5 ng/L [48]. In additional samples from watercourses in the canton of Bern and the greater Basel region, concentrations of dissolved mercury were always below 10 ng/L [49, 50].
4.2.4 Occurrence in aquatic sedimentsMercury levels in Switzerland’s aquatic sediments have been surveyed by various organisations and cantonal water protection agencies in recent decades. Figure 17 shows the average mercury concentrations in sediment samples from Lake Geneva from several surveys [51, 52]. Compared with 1978, mercury concentrations in sedi-ments have significantly decreased in recent surveys, despite occasional upward outliers. Surveys of Lake Biel,
3 For the years when mercury concentrations were below the limit of quantification, mercury concentrations in water were estimated based on the average content of suspended solids, their mercury levels and a sedi-ment-water partition coefficient of 100,000 L/kg according to the European Commission [104].
Lake Zurich and Lake Maggiore also show that levels of mercury in recent lake sediment samples have fallen con-siderably [53 – 55].
Figure 17
Mercury content in sediment samples from Lake Geneva
Average mercury content in sediment samples from Lake Geneva
from various measuring campaigns in µg/kg. The campaigns sampled
sediments from 80 – 200 locations. The second chart shows the
range of Hg contents measured in 2015 [51, 52].
Source: Loizeau et al. [51], Arbouille et al. [52]
In the canton of Zurich, sediments from the largest water-courses have been tested for heavy metals since 1999. In the case of mercury, data are available for 52 locations for the years 1999 – 2002 and 2004 – 2011. Subsequent-ly, mercury pollution at some 80% of locations decreased by 15% on average [56]. If we look at data from 2008 onwards and the levels recently measured at a location, mercury concentrations in sediments at 130 locations in watercourses in the canton of Zurich vary between
1978 1983 1988 2015
2015
µg H
g /
kg s
edim
ent
µg H
g /
kg s
edim
ent
0
100
200
300
400
500
600
700
800
0
1,000
2,000
3,000
4,000

Use, disposal and environmental releases of mercury © FOEN 2018 27
40 µg/kg and 1,360 µg/kg, with frequent concentrations of between 70 µg/kg and 200 µg/kg (10th – 90th percen-tile). Values of 60 – 200 µg/kg were frequently measured at 62 locations in waterbodies not affected by waste-water treatment plant effluent; at 36 locations with a waste water treatment plant effluent percentage of 30% or more values were similarly low, at 80 – 220 µg/kg [57].
Gascon Diez et al. [58] analysed sediment samples and settling particles in Lake Geneva, as well as their total mercury and methylmercury levels. Mercury concentra-tions of between 174 µg/kg and 270 µg/kg were meas-ured in sediment samples. In the settling particle samples mercury concentrations were between 73 µg/kg and 257 µg/kg. Concentrations of methylmercury amounted to 0.3 – 1.7 µg/kg in sediments and 0.6 – 11.4 µg/kg in settling particles.
4.3 Soil
Mercury mainly occurs in oxidised form in soils. Divalent mercury (Hg2+) forms strong complexes with organic mat-ter (such as humic or fulvic acids) present in the soil in solid, dissolved or suspended form [59 – 61]. Hg2+ can be reduced to volatile elementary Hg (Hg0) biotically or abi-otically [59]. Volatilisation rates may be between 0.03% and 1.6% relative to the total mercury concentration in the soil [62]. Mercury can also be converted into meth-ylmercury by bacteria in soils. Around 0.01 – 3% of total mercury in soils occurs in the form of methylmercury [59, 63]. Low-oxygen (anaerobic) conditions caused by high soil moisture and ready availability of organic carbon favour the formation of methylmercury; demethylation takes place under aerobic conditions [63].
The Swiss Soil Monitoring Network (NABO) comprises around 100 permanent monitoring sites that have been in operation since the mid-1980s. The sites are sampled at five-year intervals and tested on a wide variety of parameters. Among the metals, mercury concentrations are routinely measured. Half of monitoring sites are used for intensive agriculture and one fifth are in extensive-ly-used areas. Around 30% of sites are located in for-ests. Data from cantonal monitoring networks are also used to complement the national survey. The cantons are
also responsible for carrying out soil monitoring in areas where soil contamination has had or is expected to have an adverse effect on soil fertility.
Figure 18 shows the mercury concentrations measured in the fifth NABO survey conducted between 2005 and 2009 at a depth of 0 – 20 cm, broken down by type of soil use. Mercury concentrations of 50 – 180 µg/kg were frequently detected (10th and 90th percentile). The median was 80 µg Hg/kg and the extreme values were 10 µg Hg/kg and 390 µg Hg/kg [64]. Data from cantonal monitor-ing networks reveal a similar picture: for example, in the canton of Zurich during the same period, mercury con-centrations of 40 – 105 µg/kg were measured in soils at 105 locations, with extreme values of 20 µg/kg and 360 µg/kg [65]. In additional soil samples taken from a depth of 40 – 60 cm, mercury concentrations of 15 – 90 µg/kg were frequently measured at 14 locations. These values were thus similar to the levels measured at 320 locations in the period 2000 – 2004 (20 – 70 µg/kg).
An evaluation of the extensive results of soil analyses carried out by national and cantonal bodies between 1990 and 1996 was conducted by Keller & Desaules [105]. In terms of study type, around 45% of results came from soil monitoring and grid sampling, 15% from surveys of potentially hazardous sites, 15% from emitter surveys and 10% from surveys of soils close to roads. Of the over 7,000 measured values, the median was 90 µg Hg/kg and the 90th percentile was 260 µg Hg/kg. Some 3% of all values were above 500 µg/kg. Relatively high Hg values were not only measured at sites close to cremato-riums, but also in gardens, parks and settlement areas. More recent data also indicate that soil from gardens in urban areas contains remarkably high levels of mercury: in 100 samples taken from 80 locations in a town in the Swiss Plateau, mercury concentrations of 90 – 3,600 µg/kg were frequently measured [106].
Rieder et al. [66] tested around 30 uncontaminated Swiss forest soils for methylmercury and found that 0.2 – 2.4% of total mercury occurred as methylmercury; they measured methylmercury levels of < 1 – 3 µg/kg. In mercury-contam-inated soils from settlement areas and agricultural land, methylmercury levels were between 1 µg/kg and 8 µg/kg and amounted to 0.01 – 0.8% of total mercury [44].

Use, disposal and environmental releases of mercury © FOEN 2018 28
4.4 Biota
Mercury is accumulated in biota, with organic mercury in the form of methylmercury accumulating particularly readily. Mercury and methylmercury are mainly found in high concentrations in organisms in the limnetic com-partment, but also occur in terrestrial biota. The follow-ing section provides an overview of current knowledge on mercury concentrations in biota in Switzerland.
4.4.1 Terrestrial biotaTerrestrial plants can absorb mercury from the air via their leaves or from the soil via their roots [67 – 69]. There is often a statistically significant correlation between mer-cury concentrations in roots and mercury levels in soils.
However, no correlation has been established between mercury concentrations in other parts of plants and levels in the soil. This indicates that the roots act as a barrier to absorption of mercury in other parts of plants [70, 59, 68]. The mercury concentrations found in parts of plants that are above ground are thus heavily influenced by atmospheric levels of mercury [59, 69]. Based on exper-iments by De Temmerman et al. [67] on the influence of atmospheric mercury levels on mercury concentrations in exposed grass cultures (Lolium perenne), we can assume a background concentration in grass of approximately 15 µg/kg dry weight, which appears when the atmos-pheric mercury concentration is 1 – 2 ng Hg/m3. With a water content of 80 – 90%, this equates to 1.5 – 3 µg Hg/kg wet weight. In a subsequent study on leafy vegetables,
Mer
cury
con
tent
[mg/
kg D
S]
Arable farming Other Grassland Special crops ForestType of soil use
0
0.1
0.2
0.3
0.4
0.5
0.6
0.7
Figure 18
Mercury concentrations in soils
Mercury concentrations in soils used for different purposes measured in the fifth NABO survey, in mg Hg per kg of soil based on dry weight.
“Other” types of use include protected sites and monitoring locations in parks. With the exception of a single measurement, mercury concentra-
tions in soils used for special crops were below the limit of detection [64].
Gubler et al. [64]

Use, disposal and environmental releases of mercury © FOEN 2018 29
De Temmerman et al. derived background concentrations of 0.6 – 2.2 µg Hg/kg (based on the wet weight) [71]. The results of a survey on background concentrations in vegetables and cereals from Switzerland are shown in Figure 19 [72]. In this study, no mercury concentrations above the level of quantification of 0.5 µg/kg or 1 µg/kg were detected in the analysed samples of leeks, white cabbage, beetroot, potatoes and wheat. Mercury was quantified in one of five samples of endives, carrots and lettuce, and in two of five samples of celeriac. Mercury concentrations of between 190 µg/kg and 380 µg/kg and methylmercury concentrations of 3 – 8 µg/kg were identi-fied in three samples of yellow boletus mushrooms.
In 1985, Wyttenbach et al. [73] found mercury concentra-tions of 18 – 64 µg/kg (mean: 31 µg/kg) in one-year-old spruce needles from an urban area in north-eastern Swit-zerland. There are no more recent data available on the mercury contamination of deciduous and coniferous trees in Switzerland. Figure 20 presents a summary of average mercury concentrations in spruce needles and beech leaves in Germany (2001 – 2010), spruce needles in Aus-tria (2007), and leaves from various deciduous trees in the United States (2012) [69, 74, 75]. These values can also be classified as representative for Switzerland.
Regarding animals in the terrestrial compartment, Rieder et al. [66] analysed the accumulation of total mercury and methylmercury in earthworms in some 30 uncontaminat-ed Swiss forest soils. Several species of non-burrowing (epigeic) worms, topsoil-dwelling (endogenic) worms and deep-burrowing (anecic) worms were studied. Figure 21 summarises the average mercury concentrations found in the various species.
Other domestic data on the mercury exposure of ter-restrial organisms are all older and are summarised in Table 3. In the period 1983 – 1985, Mason & Weber [76] measured high average mercury content of 1,000 µg/kg in kidney samples from European polecats, which mainly feed on amphibians. In 1972, Veluz et al. [77] sampled the muscular systems of birds found dead in western Switzerland from the order passerine birds and owls, and from the families of pigeons and doves and accipitrids. A comparison with more recent data from abroad that are not presented here4 shows a relatively high level of exposure. Recent data from Switzerland on the expo-sure of accipitrids to mercury are available for the peri-od 2001 – 2002. In liver and kidney samples from seven golden eagles found in the Alps, mean mercury levels of
4 See table 20 of the accompanying report.
PotatoesBeetrootsWhite cabbageYellow boletusmushrooms
WheatLeeksLettuceCeleriacCarrotsEndives
µg H
g /
kg f
oods
tuff
Limit of quantification
0.1
1.0
10.0
100.0
1,000.0
Figure 19
Background concentrations in vegetables and cereal plants in Switzerland
Background mercury concentrations measured in vegetables and cereals in 2016 in µg/kg in fresh weight. For leeks, white cabbage, beetroots
and potatoes, no mercury concentrations above the limit of quantification were detected in any sample [72].
Source: Reber & Pacciarelli [72]

Use, disposal and environmental releases of mercury © FOEN 2018 30
Figure 20
Mercury content in leaves and needles
Summary of representative measurements of mercury content in leaves, branches and needles of various trees in Germany (2001 – 2010),
Austria (2007) and the United States (2012) in µg/kg based on dry weight [69, 74, 75].
Schulz et al. [69], Fürst [74], Tabatchnick et al. [75]
10
15
20
25
30
35
Beech (DE) Spruce (DE) Spruce needles (AUT) Deciduous trees (USA)
Mer
cury
con
tent
[µg
/kg]

Use, disposal and environmental releases of mercury © FOEN 2018 31
Figure 21
Mercury concentrations in earthworms in Switzerland
Total mercury and methylmercury in non-burrowing (epigeic),
topsoil-dwelling (endogenic) and deep-burrowing (anecic) earthworms
from 34 uncontaminated forest soils (concentrations based on dry
weight). To convert to wet weight, an approximate factor of 0.2 can be
used) [66].
Source: Rieder et al. [66]
MethylmercuryTotal mercury
epigeic endogenic
µg H
g /
kg d
ry w
eigh
t
anecic0
200
400
600
800
1,000
1,200
1,400
1,600
1,800
490
25
1,630
55
690
153
Table 3
Total mercury levels (mean ± standard deviation) in µg/kg wet weight (ww) in various matrices of terrestrial biota in Switzerland
Species Matrix Value n Period Location Ref
8 species from the suborder oscine birds
Muscular system
500 ± 350 100 – 1,200
ww 11 1972 Western Switzerland [77]
2 species from the pigeon and dove family
Muscular system
360 ± 140 200 – 600
ww 8 1972 Predominantly western Switzerland [77]
Pheasant (Phasianus colchicus) Muscular system
300 ± 100 ww 3 1972 Western Switzerland [77]
Liver 600 – 800 ww 2 1972 Western Switzerland [77]
Honey buzzard (Pernis apivoru)
Muscular system
500 ± 100 400 – 600
ww 3 1972 Western and central Switzerland [77]
Sparrowhawk (Accipiter nisus) Muscular system
2,800 ± 3,000 200 – 6,700
ww 4 1972 Western Switzerland [77]
Common buzzard (Buteo buteo) Muscular system
1,130 ± 650 300 – 3,000
ww 15 1972 Predominantly western Switzerland [77]
Tawny owl (Strix aluco) Muscular system
700 ± 100 ww 3 1972 Western Switzerland [77]
24 µg/kg and 16 µg/kg were measured [79]. Given the age of the available data and the fact that they present an incomplete picture of the mercury exposure of terrestrial biota, there is a clear need to update and expand the body of knowledge in this area.
4.4.2 Aquatic biotaThe accumulation of mercury in the aquatic food chain starts with the build-up of ionic mercury and methylmer-cury in primary producers, such as algae. The transfer of mercury from water to algae is much more efficient than for the subsequent trophic levels and bioaccumu-lation factors are correspondingly higher. However, due to trophic accumulation, mercury concentrations and the proportion of methylmercury in total mercury increase along the aquatic food chain, from plankton to fish and waterfowl.
As a primary consumer, the zebra mussel (Dreissena poly-morpha) is often used to monitor concentrations of pollut-ants in the environment [80]. It mainly feeds on plankton and detritus particles and is itself a food source for fish. In Switzerland, zebra mussels are periodically sampled

Use, disposal and environmental releases of mercury © FOEN 2018 32
as part of water quality monitoring in Lake Geneva, Lake Lugano and Lake Maggiore. The most recent such sam-ple was carried out at five locations on the Swiss bank of Lake Geneva in 2014 [81]. For Lake Lugano data are available for samples from three locations for 2010 and 2011 [82] and for Lake Maggiore from one location for the period 2011 – 2013 [83]. Zebra mussels from the Rhine near Basel (Weil am Rhein) were last included in the Ger-man Environmental Specimen Bank in 2004 and 2006 [84] (Figure 22).
The most comprehensive data on the occurrence of mer-cury in aquatic biota are available for fish. In various measurements of the flesh of perch and burbot from Lake Geneva, a downward trend in mercury concen trations has been observed since the 1970 s [85 – 88] (Figure 23). Since the early 1990s, the measured mercury concen-trations have remained relatively constant. A relatively constant level of mercury contamination has also been observed in measurements of various fish from Lake Maggiore since 2000 [89, 90] (Figure 24).
A similar consistency of mercury contamination levels was also observed in bream from the Rhine near Basel (Figure 25) [84]. Mercury was even concentrated in fish from waters that are not affected by urban areas: in rainbow trout with an average age of 3 (n = 15) from the remote Ticino mountain lake, Lago Superiore (surface area 8.3 ha, 2,100 metres above sea level), mercury con-centrations of 30 – 80 µg/kg fresh weight were measured in 2010. The mean value of 50 µg/kg fell within the range
of mean values measured between 2001 and 2009; no trend was observed in the monitoring period (Figure 26) [91].
National data are available from the 1970 s on the mercu-ry exposure of animals at higher trophic levels for water-fowl from Western Switzerland and the Swiss Plateau, and are presented in Figure 27 [77, 92]. Great crested grebes from lakes in the Swiss Plateau had lower levels of mercury contamination than those in Western Switzer-land, assuming a mercury concentration ratio of 7:3:1 for liver to feathers to muscle tissue based on fresh weight [78].
More recent data on mercury exposure in waterfowl do not exist, but such data should be collected. Compared with more recent data from abroad, the mercury exposure in individual waterfowl species from western Switzerland was relatively high 45 years ago: an analysis of compre-hensive data on the mercury exposure of waterfowl from the north-eastern United States conducted by Evers et al. between 1995 and 2003 [78] revealed mercury exposure of approximately 900 µg/kg in the muscle of fish-eating birds (e.g. goosanders). Mercury levels of approximately 300 µg Hg/kg were detected in the muscle of insect-eat-ing birds (goldeneyes) and 100 µg Hg/kg in omnivores (mallards). The muscle of herbivore species (brent geese) contained the lowest levels of mercury, at around 50 µg Hg/kg.
Species Matrix Value n Period Location Ref
Barn owl (Tyto alba) Muscular system
640 ± 220 ww 7 1972 Western Switzerland [77]
Liver 900 ww 1 1972 Western Switzerland
Eggs 600 ww 2 1972 Western Switzerland [77]
Golden eagle (Aquila chrysaetos) Liver 24 ± 17 < 10 – 57
ww 6 2000 – 2001 Alps (Austria, Germany and Switzerland)
[79]
Kidneys 16 ± 15 < 9 – 39
ww 5 2000 – 2001 Alps (Austria, Germany and Switzerland)
European polecat (Mustela putorius)
Kidneys 1,040 70 – 5,450
ww 80 1983 – 1985 Northern Switzerland [76]
Stone marten (Martes foina) Muscular system
1,000 ww 1 1972 Western Switzerland [77]
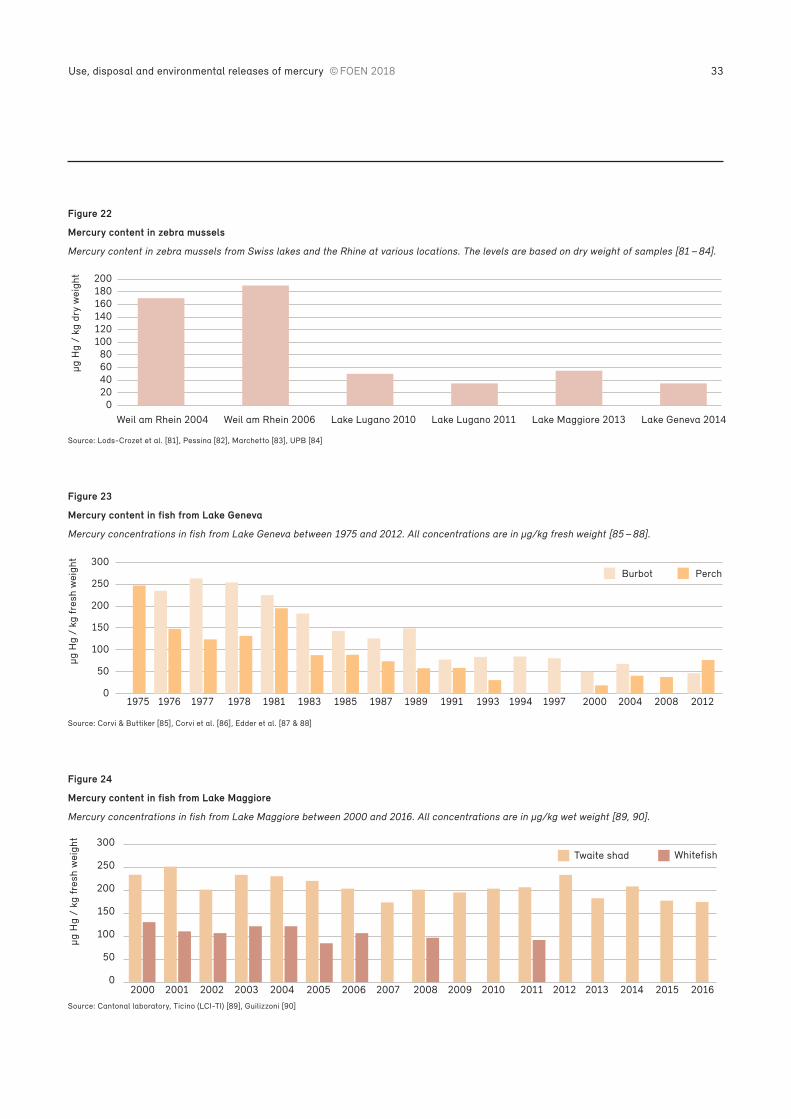
Use, disposal and environmental releases of mercury © FOEN 2018 33
Figure 22
Mercury content in zebra mussels
Mercury content in zebra mussels from Swiss lakes and the Rhine at various locations. The levels are based on dry weight of samples [81 – 84].
Source: Lods-Crozet et al. [81], Pessina [82], Marchetto [83], UPB [84]
Figure 23
Mercury content in fish from Lake Geneva
Mercury concentrations in fish from Lake Geneva between 1975 and 2012. All concentrations are in µg/kg fresh weight [85 – 88].
Source: Corvi & Buttiker [85], Corvi et al. [86], Edder et al. [87 & 88]
Figure 24
Mercury content in fish from Lake Maggiore
Mercury concentrations in fish from Lake Maggiore between 2000 and 2016. All concentrations are in µg/kg wet weight [89, 90].
Source: Cantonal laboratory, Ticino (LCI-TI) [89], Guilizzoni [90]
020406080
100120140160180200
Weil am Rhein 2004 Weil am Rhein 2006 Lake Lugano 2010 Lake Lugano 2011 Lake Maggiore 2013 Lake Geneva 2014
µg H
g /
kg d
ry w
eigh
t
0
50
100
150
200
250
300
1975 1976 1977 1978 1983 1985 1987 1989 1991 1993 1994 1997 2000 2004 2008 20121981
PerchBurbot
µg H
g /
kg f
resh
wei
ght
0
50
100
150
200
250
300
20012000 2002 2003 2005 2006 2007 2008 2009 2010 2011 2012 2013 2014 2015 20162004
WhitefishTwaite shad
µg H
g /
kg f
resh
wei
ght

Use, disposal and environmental releases of mercury © FOEN 2018 34
Figure 25
Mercury content in fish from the Rhine
Mercury concentrations in bream from the Rhine near Basel in µg/kg fresh weight. The mean age of the sampled bream was 11 years old in the
period 1995 – 2005, 5 years old in the period 2006 – 2012 and 8 years old in the period 2015 – 2016 [84].
Source: UBP [84]
Figure 26
Mercury content in fish from waters with a rural catchment area in Ticino
Mercury concentrations in non-piscivorous trout from Ticino mountain lake, Lago Superiore in µg/kg fresh weight [91].
Source: Steingruber & Colombo [91]
Figure 27
Mercury levels in waterfowl in Switzerland
Mercury concentrations in samples taken from the muscle, liver, eggs and feathers of various waterfowl in Switzerland. The samples from Western
Switzerland are from 1972; those from Lake Murten and Lake Zurich are from 1970. All concentrations are in µg/kg fresh weight [77, 92].
Source: Veluz et al. [77], Schifferli [92]
0
50
100
150
200
250
19971995 1998 1999 2001 2002 2003 2004 2005 2006 2007 2008 2009 2011 2012 2015 20162000
11-year-old fish 5-year-old fish 8-year-old fish
µg H
g /
kg f
resh
wei
ght
0
10
20
30
40
50
60
70
2001 2002 2003 2004 2005 2007 2008 2009 2010
µg H
g /
kg f
resh
wei
ght
FeathersEggsLiverMuscular system
MallardWestern CH
Tufted duckWestern CH
GoosanderWestern CH
Great crested grebe
Western CH
Adult great crested grebeLake Murten
& Lake Zurich
Juvenile great crested grebeLake Murten
& Lake Zurich
HeronWestern CH
µg H
g /
kg f
resh
wei
ght
0500
1,0001,5002,0002,5003,0003,5004,0004,5005,000

Use, disposal and environmental releases of mercury © FOEN 2018 35
5 Assessment of environmental pollutionThe limits on mercury in soils and surface waters set
out in Swiss environmental law are currently complied
with. These protect soil processes and terrestrial and
aquatic organisms from the direct effects of inorganic
mercury and methylmercury. On the other hand, a risk
for top predators in the aquatic food chain that feed
exclusively on fish cannot be ruled out.
5.1 Assessment values
To protect the environment and human health, author-ities and institutions in Switzerland and abroad have derived threshold values for the occurrence of mercury in environmental compartments and biota. These values are usually based on findings from experiments on test organisms and epidemiological studies on humans. The applicable assessment values and selected internation-al assessment values are summarised in Tables 4 and 5. More information on how these and other assessment values are derived can be found in Table 25 of the detailed accompanying report.

Use, disposal and environmental releases of mercury © FOEN 2018 36
Table 4
Selected assessment values for mercury in Switzerland
Compartment Type of assessment value Value Comment
Soil Guidance level 500 µg/kg dry matter For multi-functional land use. Set out in the Soil Pollution Ordinance (SoilPO, SR 814.12)
Concentration value 2,000 µg/kg dry matter For soils in private gardens and allotments. Set out in the Contaminated Sites Ordinance (CSO, SR 814.680)
Water Quality requirement for surface waters
10 ng/L (total dissolved Hg)
Refers to protection against direct impact on aquatic organisms. Set out in the Waters Protection Ordinance (WPO, SR 814.201)
Biota Maximum concentration 500 – 1,000 µg/kg Fish for human consumption. Set out in the Contaminants Ordinance (ContO, SR 817.022.15)
Table 5
Selected international assessment values for mercury
Compartment Type of assessment value Value Comment
Air Chronic minimum risk level (inhalation)
200 ng/m3 Defined in the United States by the Agency for Toxic Substances and Disease Registry (ATSDR)
Water Maximum allowable concentration in surface waters (ZHK-UQN)
70 ng/L Relates to direct impact on aquatic organisms in short-term exposure. Set out by the EU in Directive 2008/105/EC
Sediment Target value total mercury 500 µg/kg Defined by the International Commission for the Protection of the Rhine (ICPR)
Biota Environmental quality standard to protect top predators in aquatic food chains
20 µg/kg (fish, wet weight)
Relates to secondary poisoning through potential accumulation in the food chain. Defined by the EU in Directive 2008/105/EC

Use, disposal and environmental releases of mercury © FOEN 2018 37
The Swiss Air Pollution Control Ordinance (OAPC, SR 814.318.142.1) does not contain a mercury exposure threshold for ambient air. No threshold value has yet been stipulated in EU legislation either. Guide values from other countries for permissible mercury levels in the air (including indoor air) to protect human health range between 35 ng/m3 and 1,000 ng/m3.
The Ordinance on Soil Pollution (SoilPO, SR 814.12) stip-ulates a guideline value for multi-functional land use of 0.5 mg/kg. Under the Ordinance on Contaminated Sites (CSO, SR 814 680) private gardens and allotments, chil-dren’s playgrounds and facilities where children play reg-ularly are in need of remediation if the soil contains more than 2 mg Hg/kg.
Regarding mercury in surface waters, the Waters Pro-tection Ordinance (WPO, SR 814.201) stipulates a qual-ity requirement of 10 ng/L (total dissolved mercury). The Waters Protection Ordinance does not contain a numeri-cal quality target regarding mercury levels in aquatic sed-iments. The International Commission for the Protection of the Rhine (ICPR) defined a target value of 500 µg/kg for sediments in the Rhine.
In Switzerland and in the EU, maximum mercury levels of 500 – 1,000 µg/kg fresh weight apply to fish for human consumption. In the EU, there is also an environmental quality standard of 20 µg/kg to protect apex predators in aquatic food chains from the toxic effects of accu-mulation in the food chain (secondary poisoning). Ver-bruggen et al. [93] from the Dutch National Institute for Public Health and the Environment (RIVM) subsequently deduced that to comply with this environmental quali-ty standard, waterbodies should contain no more than 0.07 ng/L.
5.2 Assessment of environmental pollution
According to EMEP model calculations, mercury con-centrations in Swiss air amounted to 1.1 – 1.4 ng/m3 in 2015; the dominant species is gaseous elemental mer-cury. In a recent measurement campaign conducted over 24 months at an urban location in Switzerland, the 90th
percentile of daily average values was approximate-
ly 2 ng/m3. This concentration is significantly below the value of 200 ng/m3 (minimum risk level) defined by the ATSDR, at which chronic exposure is unlikely to pose a measurable risk of harmful effects [94].
According to EMEP models, the mean atmospheric mer-cury depositions amounted to some 15 g km−2 a−1 in 2015. Current deposition is therefore between 10 and 15 times higher than in the pre-anthropogenic period (around 1300), for which Roos-Barraclough & Shotyk [95] cal-culated deposition of 1 and 1.5 g km−2 a−1 with the aid of measurements of peat cores from two Swiss bogs. To protect soils and waterbodies, mercury concentrations in the air and atmospheric deposition should be kept to a minimum, for which cross-border efforts are necessary.
To assess the mercury content in Swiss soils, the guid-ance value for multi-functional land use of 500 µg/kg stipulated in the Ordinance on Soil Pollution (SoilPO, SR 814.12) is used. In the most recent survey of the National Soil Monitoring Network (NABO), mercury concentrations of 50 – 180 µg/kg were generally detected (10th and 90th
percentiles); the extreme values were 10 µg Hg/kg and 390 µg Hg/kg. Data from cantonal networks tally with the data from the NABO monitoring network, according to which mercury levels in agricultural and forest soils are unremarkable. Mercury levels are therefore largely below the guidance value set out in the Ordinance on Soil Pollution. Mercury concentrations that are above the SoilPO guidance value are sometimes detected in gar-dens in urban areas; in some soils, concentrations above 2,000 µg Hg/kg are detected due to historical releases of mercury. Under the Ordinance on Contaminated Sites (CSO, SR 814.680), private gardens and allotments, chil-dren’s playgrounds and facilities where children play regularly should be remediated if mercury levels in soils exceed this value. Soil decontamination is currently being carried out in settlements in south-western Switzer-land. In this area, soils were contaminated with mercury through the deposition of contaminated excavated mate-rial from an industrial area and/or sludge and sediments, which were excavated from a sewer contaminated with industrial wastewater during maintenance work between 1930 and 1990 [96]. As in aquatic systems, methylation and demethylation processes take place in terrestrial systems. Methylmercury accounts for around 0.01 – 3%

Use, disposal and environmental releases of mercury © FOEN 2018 38
of the total mercury in soils [59, 63]. A high level of soil moisture, anaerobic conditions and ready availability of organic carbon favour the formation of methylmercury; demethylation occurs under aerobic conditions [63]. Available data on Swiss soils show that methylmercury levels amount to up to 8 µg/kg; studies conducted abroad show similar contamination levels. Based on the results of toxicity tests conducted by Rieder & Frey [97], these values are within an acceptable range.
Data on mercury in surface waters show that the quality requirement of 10 ng/l set out in the Waters Protection Ordinance (WPO, SR 814.201) relating to mercury levels in surface waters is complied with. Sediments from the largest watercourses in the canton of Zurich have been tested for heavy metals, including mercury, since 1999. If we consider the data from 2008 onwards, the mercu-ry levels recently detected at one of the 130 locations vary from 40 µg/kg to 1,360 µg/kg; at 98% of locations, mercury levels are 285 mg/kg or lower [57]. Mercury concentrations in sediments in Zurich’s watercourses are therefore generally below the target value of 500 µg/kg set by the ICPR. Additional available data show that this also applies to other watercourses in Switzerland.
Mercury can accumulate in biota via the food chain, with methylmercury accumulating particularly readily. In the aquatic food chain, trophic transfer of mercury starts with the accumulation of ionic mercury and methylmer-cury in primary producers. Mercury concentrations and the proportion of methylmercury in total mercury usual-ly increase from phyto and zoo plankton, plankton- and fish-eating fish to waterfowl. Domestic data on mercu-ry concentrations in waterfowl are old and need to be updated. In addition, data on the mercury exposure of organisms with semi-aquatic and terrestrial habitats are rare or outdated and need to be supplemented, updated and evaluated.
The Swiss Waters Protection Act does not stipulate a permissible limit for mercury levels in molluscs and crus-taceans, fish and other biota to protect higher organisms from mercury poisoning via the food chain. In the EU, the environmental quality standard to protect organisms that are higher in the aquatic food chain from such secondary poisoning is 20 µg Hg/kg fresh weight. Data on mercury
levels in fish in Swiss waterbodies show that this value is exceeded all over Switzerland. For example, bream that were caught in the Rhine near Basel in 2016 contained average mercury concentrations of 116 µg/kg. Mercury levels of 30 – 85 µg/kg were even detected in trout from mountain lakes in Ticino in 2010. In this respect, a mer-cury concentration of 20 µg/kg should today be consid-ered a ubiquitous background level. The translation of the quality standard of 20 µg Hg/kg for biota into a quality target in the aqueous phase of less than 0.1 ng/L, as pro-posed by Verbruggen et al. [93], illustrates that to com-ply with this standard, anthropogenic mercury releases would have to be stopped. But even then, historical sed-iment contamination would continue to be a source of biota contamination.

Use, disposal and environmental releases of mercury © FOEN 2018 39
6 Human exposureMethylmercury is mainly taken up by the Swiss popula
tion through food, and inorganic mercury through food
and existing amalgam fillings. Recent domestic data on
the presence of mercury in human samples are available
for two cohorts. Compared with figures from other
countries, the mercury levels in hair and urine in the
study populations are unremarkable.
The systemic uptake of mercury in the human body var-ies widely depending on the different exposure routes and mercury species. While approximately 90% of oral-ly ingested methylmercury is absorbed in the body, only 10% of orally ingested inorganic mercury compounds is absorbed in the body, and elemental mercury is barely absorbed at all. If inhaled, however, 80% of elemental mercury is absorbed by the body. Elemental mercury is oxidised in the body to divalent mercury (Hg2+), which only crosses the body’s barriers in very small quantities and is predominantly eliminated through urine and faeces. On the other hand, absorbed methyl mercury is distrib-uted evenly throughout the body and can easily cross the blood-brain and placental barrier and accumulate in foetal blood.
The general Swiss population may be exposed to mercu-ry through food consumption, inhaled ambient air, dental amalgam fillings or through broken or damaged mercu-ry-containing products. As mercury is now barely used in products marketed in Switzerland and the use of mer-cury in industrial processes has been phased out, work-place-related exposures are rare. The following section therefore only describes the potential sources of expo-sure to mercury for the general population.
6.1 Food consumption
In 2012, the European Food Safety Authority (EFSA) determined and assessed the dietary intake of mercury in 17 EU states. The exposure of the population was esti-mated based on mercury levels in foods and data on their consumption in the various countries. A distinction was drawn between inorganic mercury and methylmercury. Based on the total mercury levels in foods, conversion
factors of 1.0 (methylmercury) and 0.2 (inorganic mercu-ry) were used for fish and fish products. For crustaceans and shellfish, the conversion factors were 0.8 (methyl-mercury) and 0.5 (inorganic mercury). For all other food groups, it was assumed that mercury is present in inor-ganic form. No corresponding exposure estimates have yet been carried out for Switzerland. However, it can be assumed that the data from neighbouring countries (Ger-many, France and Italy) are a relatively accurate reflec-tion of the situation in Switzerland.
Figure 28 shows the total mercury levels in individual foods used for exposure assessment by the EFSA. These figures show that the highest levels of mercury are found in fish and seafood. In the other foodstuffs, the mercury level was often below the limit of quantification.
Figure 29 shows the EFSA’s estimated methylmercury exposures in toddlers (1 – 3 years old), children (3 – 10 years old) and adults (18 – 65 years old) in Germany, France and Italy for average and high consumption of fish and seafood. The exposure levels for children and adults in Germany and France are relatively low. By com-parison, the estimated exposure of children and toddlers who regularly consume fish and seafood is much higher in all three countries. The estimated methylmercury expo-sure among Italian adults who regularly consume fish and seafood is also significantly higher.

Use, disposal and environmental releases of mercury © FOEN 2018 40
Figure 28
Mercury levels in foods
Median mercury levels in food groups, in µg/kg fresh weight (logarithmic representation). For samples where mercury concentrations were below
the limit of quantification, half of the limit of quantification was used to calculate the median (middle-bound values) [2].
Source: EFSA [2]
Figure 29
Human exposure to mercury
Methylmercury (MeHg) and inorganic mercury (inorg. Hg) exposure calculated for various population groups in Germany, France and Italy. The
values are given in µg/kg body weight (bw) per week (w). Exposure was calculated for average and high fish and seafood consumption (MeHg)
and for average and high food consumption (inorg. Hg), respectively [2].
Source: EFSA [2]
Drinking water
Alcoholic beverages
Milk and dairy products
Herbs, spices and condiments
Starchy roots and tubers
Snacks and desserts
Fruit and vegetable juices
Fruit and fruit products
Eggs and egg products
Animal and vegetable fats and oils
Vegetable and vegetable products
Food for infants and small children
Grains and grain products
Sugar and confectionery
Legumes, nuts and oil seeds
Non-alcoholic beverages
Meat and meat products
Fish and other seafood
Total mercury [µg Hg/kg fresh weight]0.1 1 10 100
0
1
2
3
4
5
6
Exp
osur
e [µ
g/kg
bw
w]
Toddlers
Children
Adults
Germany France Italy
Average consumption
Me-Hg
Average consumption
anorg. Hg
High consumption
Me-Hg
High consumption
anorg. Hg
Average consumption
Me-Hg
Average consumption
anorg. Hg
High consumption
Me-Hg
High consumption
anorg. Hg
Average consumption
Me-Hg
Average consumption
anorg. Hg
High consumption
Me-Hg
High consumption
anorg. Hg

Use, disposal and environmental releases of mercury © FOEN 2018 41
The significant proportion of food samples in which no measurable concentrations of mercury were found results in significant uncertainty in the estimated inorganic mer-cury intake from food. Figure 29 shows the estimated exposure of toddlers, children and adults in Switzerland’s neighbouring countries when occurrence in foodstuffs is based on middle-bound values.
6.2 Ambient air
Mercury levels of 1 – 2 ng/m3 are measured in Swiss ambient air; the dominant species is gaseous elemental mercury. There are no known domestic measurements of Hg pollution of indoor ambient air outside of work-places, and measurements are rarely conducted, even abroad [98, 99]. In Germany, mercury concentrations of 5 – 50 ng/m3 were measured in 11 offices and laborato-ries over a 24-hour measurement period in 2012, with the average being 15 ng/m3 [99]. Based on such levels of pol-lution in indoor air, we can assume that spending longer periods in such environments would result in the intake of 0.03 µg of inorganic mercury per kg of body weight per week for adults (respiration rate 20 m3 d−1, body weight 70 kg) and 0.06 µg per kg of body weight per week for tod-dlers (respiration rate 6 m3 d−1, body weight 10 kg). A tem-porarily higher mercury exposure via the air may occur if products containing mercury are mishandled. In 2012, the Bavarian Health and Food Safety Authority conducted studies on the influence of broken energy-saving lamps on mercury concentrations in indoor air. In these studies, maximum mercury concentrations of between 135 ng/m3 and 10,277 ng/m3 were measured after breaking differ-ent types of energy-saving lamps. The mercury emissions from new types of lamps were much lower than those from older types of lamps. Once the broken energy-sav-ing lamps were removed and the rooms aired, the mercury concentrations measured in the experiments decreased very quickly.
6.3 Dental amalgam
There are various estimates of human mercury exposure from dental amalgam. According to older World Health Organization (WHO) data, amalgam fillings release 4 – 21 µg of elemental mercury per day [100]. According to various studies from the 1990s, mercury exposure in people with around eight amalgam fillings can be esti-mated at 3 – 12 µg per day. For an adult, this equates to 0.3 – 1.2 µg Hg per kg of body weight per week. In the most recent assessments, Richardson [101] estimates the Hg exposure of Canadian people with amalgam fill-ings at between 0.2 µg (young people aged 12 – 18) and 0.45 µg (children aged 6 – 11) per kg of body weight per week. For adults with several amalgam fillings, these therefore represent a substantial source of inorganic mercury exposure. However, children in Switzerland do not usually have dental fillings made from amalgam [43], as this filling material has barely been used in Swiss den-tal practices for years.
6.4 Biomonitoring
Biomonitoring is the measurement of the body burden of a toxic substance by measuring different types of biolog-ical samples, such as blood, urine or hair. Different sam-ple materials can be used to measure human mercury exposure. For example, internal exposure to inorganic and organic mercury can be measured using blood tests. Internal exposure to inorganic mercury can also be deter-mined by measuring Hg concentrations in urine. Past exposure to methylmercury can be detected in hair sam-ples. Under the auspices of the Federal Office of Public Health (FOPH), Switzerland took part in a human biomon-itoring pilot study (DEMOCOPHES) coordinated by the EU between 2010 and 2012 which measured Hg concentra-tions in the hair of mother-child pairs in 17 countries. The hair samples collected in Switzerland came from 120 mothers (≤ 45 years old) and their children (6 – 11 years old) from the city of Bern and seven rural communes in Upper Aargau. In the interviews accompanying the study, 50% of mothers said they consumed fish or seafood at least once a week [102]. The results of this survey are presented in Figure 30. In Switzerland, the median mer-cury concentration in hair was 0.153 µg/g in mothers and

Use, disposal and environmental releases of mercury © FOEN 2018 42
0.076 µg/g in children. Both values were relatively low compared to the concentrations measured in subjects from other European countries. Mothers with the highest mercury concentrations in their hair ate fish and seafood more often. The number of amalgam fillings and the num-ber of broken mercury thermometers or energy- saving lamps had no influence on Hg concentrations in hair.
In addition to participation in the DEMOCOPHES study, another biomonitoring study on mercury was conduct-ed in Switzerland by the Department of Occupational and Environmental Medicine at the University of Zurich [43]. The study measured mercury concentrations in the
hair and urine of 64 mothers (25 – 55 years old) and 107 children (3 – 12 years old) from Upper Valais. This study population lives in an area where some soils contain high levels of mercury. In a survey conducted in parallel, data were collected on the number of amalgam fillings and on the consumption of sea fish and vegetables from contaminated gardens. The measured median mercury concentrations in hair and urine are shown in Figure 31. Compared with the results of the DEMOCOPHES study, the measured concentrations in hair samples are unre-markable. There were strong indications of a link between mercury concentrations in hair and the consumption of sea fish. There was also strong evidence of a correlation
Spain
Portugal
Cyprus
Denmark
Luxembourg
Belgium
Slovenia
Sweden
Ireland
Czech Rep.
UK
Switzerland
Poland
Slovakia
Germany
Romania
Hungary
Children Mothers
0.0 0.2 0.4 0.6 0.8 1.0 1.2 1.4 1.6
Figure 30
Mercury levels in the hair of European women and their children
Median mercury level in the hair (in µg/g) of women of childbearing age and their children from the DEMOCOPHES project. The samples are
taken from 1,875 women from 17 countries living in urban and rural areas in the years 2011 – 2012 [103].
Source: Castaño et al. [103]

Use, disposal and environmental releases of mercury © FOEN 2018 43
between mercury concentrations in urine samples and the number of amalgam fillings, age and when subjects last consumed sea fish. No correlation was found between mercury concentrations in hair and urine samples and the consumption of vegetables from contaminated gardens or the occurrence of mercury in soils.
6.5 Summary of human exposure
To conclude, the main source of human methylmercury exposure in Switzerland is uptake from food, particularly the consumption of fish. Regarding inorganic mercury exposure, it can be assumed that the main sources are both uptake from food and uptake from dental amalgam. Mercury exposure from the air or soil is likely to play a minor role.
Hg
leve
ls in
µg/
g ha
ir/µg
/l u
rine
Hair samples Urine samples
Mothers Children0
0.05
0.1
0.15
0.2
0.25
0.30
Figure 31
Mercury levels in hair and urine samples from children and mothers
in the canton of Valais
Measured median mercury levels in hair and urine samples from women
and children in the canton of Valais. The values for hair samples are
indicated in µg/g hair and for urine samples in µg/L urine [43].
Source: Dressel & Imo [43]

Use, disposal and environmental releases of mercury © FOEN 2018 44
7 References [1] Driscoll C.T., Mason R.P., Chan H. M., Jacob D.J.,
Pirrone N., 2013. Mercury as a global pollutant: sources pathways, and effects. Environmental Science and Technology 47(19): 4967 – 4983.
[2] EFSA (EFSA Panel on Contaminants in the Food Chain), 2012. Scientific Opinion on the risk for pub-lic health related to the presence of mercury and methylmercury in food. EFSA Journal; 10 (12): 2985, 241 pp. doi:10.2903/j.efsa.2012.2985.
[3] AMAP/UNEP, 2013. Technical Background Report for the Global Mercury Assessment 2013. Arctic Monitoring and Assessment Programme, Oslo, Norway / UNEP Chemicals Branch, Geneva, Swit-zerland. vi + 263 pp.
[4] EZV (Eidgenösische Zollverwaltung), 2018. www.gate.ezv.admin.ch/swissimpex. (Status: 04.04.2018)
[5] Lassen, C., Holt Andersen, B., Maag, J., Maxson, P., 2008. Options for reducing mercury use in products and applications and the fate of mercury already circulating in society. COWI Report.
[6] Spiess, C., 1998. Vorsicht bei der Entsorgung von Tartanbelägen. Umwelt Aargau Nr. 1.
[7] ECHA (European Chemicals Agency), 2011. Back-ground document to RAC and SEAC opinions on five Phenylmercury compounds.
[8] ECHA (European Chemical Agency), 2011a. Back-ground document to the opinions on the Annex XV dossier proposing restrictions on Mercury in measuring devices.
[9] Recknagel, S., Radant, H., 2013. Überprüfung der Schwermetallgehalte von Batterien – Analyse von Proben handelsüblicher Batterien und in Geräten ver-kaufter Batterien – Erstellung eines Probenahme-plans, Probenbeschaffung und Analytik. UBA Texte 09/2013. Umweltbundesamt, Desslau-Ross lau.
[10] INOBAT (Interessenorganisation Batterienent-sorgung), 2013. Tätigkeitsberichte 2011 / 2012 / 2013 (www.inobat.ch > Infomaterial > Dokumente und Downloads).
[11] Gasser, S., Tschudy, D., 2011. Licht im Haus – Energieeffiziente Beleuchtung. Hrsg. Fachhoch-schule Nordwestschweiz (Institut Energie am Bau). Faktor Verlag, Zürich.
[12] Zumbühl, T., Benedetti, K., 2010. Verkauf und Ent-sorgung von Flachbildschirmen in der Schweiz – Eine dynamische Modellierung. Bachelorarbeit ETH Zürich.
[13] Böni, H., Widmer, R., 2011. Entsorgung von Flach-bildschirmen in der Schweiz. EMPA und swico Recycling.
[14] Goodman, P., Robertson, C., 2006. Review of Directive 2002/95/EC (RoHS) Categories 8 and 9 – ERA Report 2006-0383. July 2006 amd. 19 Sep 2006.
[15] Kägi, T., Franov, E., 2016. Ökobilanz Stiftung SENS. Ökologischer Nutzen des Elektroge räte-Recyclings durch die SENS über 25 Jahre. CustomLCA im Auftrag der Stiftung SENS. Carbo-tech AG, Basel.
[16] Moser, K., Bertschinger, H., Hugener, M., Kramer, H., Richner, P., Richter, K., 2004. Baustoffmana-gement 21 (Stand des Wissens und Forschungsbe-darf). EMPA, Departement Materialien für das Bau- und Ingenieurwesen. Dübendorf.
[17] FOEN, 2017. Switzerland’s Informative Inventory Report 2017. Submission under the UNECE Con-vention on Long-range Transboundary Air Pollu-tion. Submission of March 2017 to the United Nations ECE Secretariat. Federal Office for the Environment FOEN. Air Pollution Control and Chemicals Division. Bern.

Use, disposal and environmental releases of mercury © FOEN 2018 45
[18] Wochele, J., Ludwig, C., Stucki, S., 2009. RESH- Behandlung mit KVAplus. Studie im Auftrag der Stiftung Auto Recycling Schweiz. Paul Scherrer Institut. Villigen.
[19] BAFU (Bundesamt für Umwelt), 2017. Abfallstatis-tiken 2011 – 2013 www.bafu.admin.ch > Topics Waste > Data, indicators and maps > Statistics (Status: 16.03.2017).
[20] SLRS (Stiftung Licht Recycling Schweiz), 2011. Jahresbericht.
[21] Sovag, 2017. Lampenrecycling www.sovag.veolia.ch/de/angebot/ lampenrecycling. (Status: 04.04.2018)
[22] Kasser, U., Savi, D., 2013. Risiken bei der Ent-sorgung von Energiesparlampen (im Auftrag der Stiftung Licht Recycling Schweiz). Büro für Umweltchemie, Zürich.
[23] Tezcan, M., 2013. Klärschlammentsorgung in der Schweiz. Klärschlammmerhebung 2012. Bundes-amt für Umwelt (Abt. Abfall und Rohstoffe), Bern.
[24] Hügi, M. (Bundesamt für Umwelt BAFU, Abteilung Abfall und Rohstoffe), 2014. Persönliche Mittei-lung.
[25] Taverna, R., Morf, L., 2009. Stoffflüsse und Kehrichtzusammensetzung in der KVA Thurgau im Jahr 2008. GEO Partner AG. Zürich.
[26] Taverna, R., Meister, R., 2011. Stoffbuchhaltung auf der KVA Hinwil (Schlussbericht 2008 – 2010). GEO Partner AG. Zürich.
[27] MSC-E (Meteorological Synthesizing Centre – East), 2017. www.msceast.org > Pollution Assess-ment > EMEP Countries > Switzerland (2017)
[28] Sprovieri, F., Pirrone, N., Bencardino, M., D’Amore, F., Carbone, F., Cinnirella, S., … Norstrom, C., 2016. Atmospheric mercury concentrations observed at ground-based monitoring sites glob-
ally distributed in the framework of the GMOS net-work. Atmospheric Chemistry and Physics, 16(18), pp.11915 – 11935. doi:10.5194/acp-2016-466.
[29] Weigelt, A., Ebinghaus, R., Pirrone, N., Bieser, J., Bödewadt, J., Esposito, G., Slemr, F., van Veltho-ven, P. F. J., Zahn, A., Ziereis, H., 2016. Tropo-spheric mercury vertical profiles between 500 and 10 000 m in central Europe, Atmos. Chem. Phys., 16, 4135 – 4146, doi:10.5194/acp-16-4135-2016.
[30] Denzler, B., 2015 (Institut für Chemie- und Bioin-genieurwissenschaften, ETH Zürich). Quecksilber-messreihen von Zürich und dem Jungfraujoch. Persönliche Mitteilung vom 29. Juni 2015.
[31] EMPA (Eidgenössische Materialprüfungs- und Forschungsanstalt, Abteilung Luftfremdstoffe/Umwelttechnik), 2015. Technischer Bericht zum Nationalen Beobachtungsnetz für Luftfremdstoffe (NABEL).
[32] Ilyin, I., Gusev, A., Rozovskaya, O., Strijkina, I, 2016. Transboundary Pollution of Switzerland by Heavy Metals in 2014 EMEP/MSC-E Report 5/2016.
[33] Thöni, L., Seitler, E., Schnyder, E., Ehrenmann, J., 2013. Deposition von Luftschadstoffen in der Schweiz. Moosanalysen 1990 – 2010. Bundesamt für Umwelt, Bern. Umwelt-Zustand Nr. 1328: 170 S.
[34] BAFU (Hrsg.) 2018: Deposition von Luftschadstof-fen in der Schweiz. Moosanalysen 1990 – 2015. Bundesamt für Umwelt, Bern. Umwelt-Zustand Nr. 1818: 133 S.
[35] Fitzgerald, W.F., Lamborg, C.H., 2007. Geochemis-try of mercury in the environment. In: Lollar, B.S. (Ed.). Environmental Geochemistry, Treatise on Geochemistry, pp. 1 – 47. Vol. 9.04, Elsevier.
[36] Kummert, R., Stumm, W., 1989. Gewässer als Ökosysteme – Grundlagen des Gewässerschutzes (2., überarb. Aufl.). Verlag der Fachvereine, Zürich.

Use, disposal and environmental releases of mercury © FOEN 2018 46
[37] Braun, M., Besozzi, D., Herata, H., Falcke, H., van Dokkum, R., Langenfeld, F., Mohaupt, V., van den Roovaart, J., Sieber, U., Sollberger, B., 2003. Rhein. Bestandesaufnahme der Emissionen prio-ritärer Stoffe. Internationale Kommission zum Schutz des Rheins (IKSR), Koblenz (D).
[38] IKSR (Internationale Kommission zum Schutz des Rheins, 2016. Gewässergütedaten. http://iksr.bafg.de/iksr/ (Status: 2. April 2018)
[39] BAFU (Bundesamt für Umwelt), 2009. Ergebnisse der Grundwasserbeobachtung Schweiz (NAQUA). Zustand und Entwicklung 2004 – 2006. Umwelt-Zustand Nr. 0903. Bundesamt für Umwelt, Bern.
[40] Schudel, H., 2002. Trinkwasserfassungen auch an belasteten Standorten einwandfrei. Umwelt Aar-gau Nr. 19 November 2002.
[41] Wasserversorgung der Stadt Zürich, 2016. Jahres-bericht 2016 Quellwasser Sihlbrugg.
[42] Wasserversorgung der Stadt Zürich, 2016. Jahres-bericht 2016 Grundwasser Hardhof.
[43] Dressel, H., Imo, D., 2016. Gutachten über eine mögliche Gesundheitsgefährdung der Bevölkerung durch quecksilberbelastete Böden im Gebiet Tur-tig und Visp. Abteilung für Arbeits- und Umwelt-medizin, Universität Zürich
[44] DUW VS (Dienststelle für Umweltschutz Kanton Wallis), 2016. Protokoll Informationsaustausch Plattform Quecksilber. 25. Januar 2016.
[45] Binderheim-Bankay, E., Jakob, A., Liechti, P., 2000. NADUF – Messresultate 1977 – 1998. Schriftenreihe Umwelt Nr. 319. Bundesamt für Umwelt, Wald und Landschaft (Hrsg.). Bern.
[46] Langenfeld, F., Mohaupt, V., van den Roovart, J., Sieber, U., Verstappen, G., Braun, M., 1999. Bestandesaufnahme der Einträge prioritärer Stof-
fe 1996. Internationale Kommission zum Schutz des Rheins (IKSR). Koblenz (D).
[47] Hari, R., Zobrist, J., 2003. NADUF – Trendanalyse der NADUF-Messresultate 1974 bis 1998. Schrif-tenreihe der EAWAG Nr. 17. Dübendorf-Zürich.
[48] Petri, M., 2007. Unproblematisch: Quecksilber im Bodensee und seinen Zuflüssen. Bodensee- Wasserversorgung. Wissensdurst – August 2007, pp. 16 – 21.
[49] AUE BS (Amt für Umwelt und Energie, Departe-ment für Wirtschaft, Soziales und Umwelt Basel-Stadt), 2009. Qualität der Oberflächengewässer im Kanton Basel-Stadt. Untersuchungsjahre 1993 bis 2008.
[50] AWA (Amt für Wasser und Abfall, Kanton Bern), 2017. Geoportalkarte Gewässerqualität www.bve.be.ch/bve/de/index/wasser/wasser/gewaesserqualitaet.html > Geoportalkarte Gewässerqualität (Status: 04.04.2018)
[51] Loizeau, J.-L., Makri, S., Arpagaus, P., Ferrari, B., Cascado-Martinez, C., Benejam, T., Marchand, P., 2017. Micropolluants métalliques et organiques dans les sédiments superficiels du Léman. Rapp. Comm. int. prot. eaux Léman contre pollut., Cam-pagne 2016: 143 – 198.
[52] Arbouille, D., Howa, H., Soan, D., Vernet, J.-P., 1989. Etude générale de la pollution par les métaux et répartition des nutriments dans les sédiments du Léman. Rapp. Comm. int. prot. eaux Léman contre pollut., Campagne 1988: 139 – 172.
[53] Berset, J.-D., Guthruf, K., Maurer, V., Ochsenbein, U., Ryser, R., Zeh, M., Jordi, B., 2012. Zustand der Fliessgewässer und Seen im Kanton Bern – Aus-wertung der Gewässerdaten von 2002 bis 2010. AWA Fakten. Amt für Wasser und Abfall (AWA) des Kantons Bern.
Use, disposal and environmental releases of mercury © FOEN 2018 47
[54] Von Gunten, H.R., Sturm, M., Moser, R.N., 1997. 200-Year Record of Metals in Lake Sediments and Natural Background Concentrations. Environ. Sci. Technol. 31, pp. 2193 – 2197.
[55] Pessina, A., 2010 / 2011 / 2012 / 2013. Lago Cere sio: indagine su DDT e sostanze pericolose. Commissione internazionale per la protezione delle acque italo-svizzere. Programma quinquen-nale 2008 – 2012 – Rapporto annuale 2009, dito 2010, 2011 e 2012. Bellinzona.
[56] Känel, B., Steinmann, P., Sinniger, J., Nieder-hauser, P., Labhart, W., Nyffenegger, K., Jenny, A., Balsiger, C., 2012. Zürcher Gewässer 2012 (Entwicklung – Zustand – Ausblick). Hrsg. AWEL (Amt für Abfall, Wasser, Energie und Luft). Zürich, 2012.
[57] AWEL (Amt für Abfall, Wasser, Energie und Luft), 2016. Fliessgewässerqualität. https://awel.zh.ch/internet/baudirektion/awel/de/wasser/ messdaten/fg_qualitaet.html#nordwesten (Status: 04.04.2018)
[58] Gascón Díez, E., Loizeau, J.-L., Cosio, C., Bouchet, S., Adatte, T., Amouroux, D., Bravo A.G., 2016. Role of Settling Particles on Mercury Methylation in the Oxic Water Column of Freshwater Systems. Environmental Science & Technology 50 (21), pp. 11672 – 11679, doi:10.1021/acs.est.6b03260.
[59] EFSA (European Food Safety Authority), 2008. Mercury as undesirable substance in animal feed. Scientific opinion of the Panel on Contaminants in the Food Chain. The EFSA Journal (2008) 654, pp. 1 – 76.
[60] Merkel, B., Sperling, B., 1998. Hydrogeochemi-sche Stoffsysteme: Teil II. DVWK-Schriften; H. 117. Wirtschafts- und Verlagsgesellschaft Gas und Wasser mbH. Bonn.
[61] Rieder, S.R., Tipping, E., Zimmermann, S., Graf-Pannatier, E., Waldner, P., Meili, M., Frey, B., 2014. Dynamic modelling of the long term behav-
iour of cadmium, lead and mercury in Swiss forest soils using CHUM-AM. Science of the Total Envi-ronment, Volume 468 – 469, pp. 864 – 876.
[62] Tipping, E., Wadsworth, R.A., Norris, D.A., Hall, J.R. Ilyin, I., 2011. Long-term mercury dynamics in UK soils. Environmental Pollution 159, pp. 3474 – 3483.
[63] Portmann, D., Reiser,R., Meuli, R., 2013. Quecksil-ber in Böden: Organische Quecksilberverbindun-gen (Landwirtschaftliche Bodennutzung). Forschungsanstalt Agroscope Reckenholz-Tänikon ART (Umweltressourcen und Landwirtschaft). Zürich.
[64] Gubler A., Schwab P., Wächter D., Meuli R. G., Keller A. 2015. Ergebnisse der Nationalen Boden-beobachtung (NABO) 1985 – 2009. Zustand und Veränderungen der anorganischen Schadstoffe und Bodenbegleitparameter. Bundesamt für Umwelt, Bern. Umwelt-Zustand Nr. 1507: 81 S.
[65] FaBo ZH (Fachstelle Bodenschutz Kanton Zürich), 2016 (www.aln.zh.ch > Bodenzustand > Mess-werte von Überwachungsstandorten. © 2016 Kan-ton Zürich).
[66] Rieder, S.R., Brunner, I., Horvat, M., Jacobs, A., Frey, B., 2011. Accumulation of mercury and methylmercury by mushrooms and earthworms from forest soils. Environmental Pollution 159, pp. 2861 – 2869.
[67] De Temmerman, L., Claeys, N., Roekens, E., Guns, M., 2007. Biomonitoring of airborne mercury with perennial ryegrass cultures. Environmental Pollu-tution 146, pp. 458 – 462.
[68] Portmann, D., Reiser,R., Meuli, R., 2013. Quecksil-ber in Böden: Herleitung eines Sanierungswertes nach AltlV und von Prüfwerten nach VBBo. Forschungsanstalt Agroscope Reckenholz- Tänikon ART (Umweltressourcen und Land-wirtschaft). Zürich.

Use, disposal and environmental releases of mercury © FOEN 2018 48
[69] Schulz, F., Hahn, S., Rüdel, H., Uhlig, S., Hettwer, K., Kaltenbach, H.-M., 2015. Integrierte Bewer-tung von Quecksilber anhand der Erhebungen der Umweltprobenbank des Bundes (UPB). Fraunhofer ITEM Hannover; Fraunhofer IME Schmallenberg; QuoData GmbH Dresden; Projektnummer (32 842).
[70] Alloway, B.J., Reimer, T., 1999. Schwermetalle in Böden: Analytik, Konzentrationen, Wechsel-wirkungen. Springer Verlag, Berlin, ISBN 3-540-62086-9.
[71] De Temmerman, L., Waegeneers, N., Claeys, N., Roekens, E., 2009. Comparison of concentrations of mercury in ambient air to its accumulation by leafy vegetables, an important step in terrestrial food chain analysis. Environmental Pollution 157, pp. 1337 – 1341.
[72] Reber, S., Pacciarelli, B., 2016. Quecksilber-Spez-ies in landwirtschaftlichen Produkten in der Schweiz (Version 2.0). Kantonales Labor Zürich, Zürich.
[73] Wyttenbach, A., Tobler, L., Bajo, S., 1991. Ele-mentgehalte in Fichtennadeln im Raum Winterthur und deren örtliche und zeitliche Variation. Sonder-druck aus «Lufthaushalt, Luftverschmutzung und Waldschäden in der Schweiz». Programmleitung NFP 14. Verlag der Fachvereine, Zürich.
[74] Fürst, A., 2007. Quecksilber in Fichtennadeln als Immissionsmarker. Forstschutz Aktuell 41, S. 18 – 20.
[75] Tabatchnick, M.D., Nogaro, G., Hammerschmidt, C.R., 2012. Potential sources of methylmercury in tree foliage. Environmental Pollution 160, pp. 82 – 87.
[76] Mason, C.F., Weber, D., 1990. Organochlorine Residues and Heavy Metals in Kidneys of Polecats (Mustela putorius) from Switzerland. Bull. Environ. Contam. Toxicol. 45: pp. 689 – 696.
[77] Veluz, S., Goeldlin, P., Praz, J.C., 1976. La pollution mercurielle de la faune sauvage en Suisse roman-de. Revue suisse Agric. 8 (5): pp. 122 – 129.
[78] Evers, D.C., Burgess, N.M., Champoux, L., Hoskins, B., Major, A., Goodale, W.M., Taylor, R.J., Poppen-ga, R., Gaigle, T., 2005. Patterns and Interpreta-tion of Mercury Exposure in Freshwater Avian Communities in Northeastern North America. Eco-toxicology 14: pp. 193 – 221.
[79] Kenntner N., Crettenand, Y., Fünfstück, Y., Janov-sky, M., Tataruch, F., 2007. Lead poisoning and heavy metal exposure of golden eagles (Aquila chrysaetos) from the European Alps, 2007. J Orni-thol 148, pp. 173 – 177.
[80] Wagner, G., Bartel, M., Klein, R., Neitzke, M., Nentwich, K., Paulus, M., Quack, M., 2003. Dreikantmuschel (Dreissena polymorpha). Richt-linie zur Probenahme und Probenaufbereitung. Umweltbundesamt, Dessau-Rosslau (D).
[81] Lods-Crozet, B., Edder, P., Klein, A., 2015. Métaux et micropolluants organiques dans les moule du Léman. Rapp. Comm. int. prot. eaux Léman contre pollut., Campagne 2014, pp. 84 – 97.
[82] Pessina, A., 2010 / 2011 / 2012 / 2013. Lago Ce resio: indagine su DDT e sostanze pericolose. Commissione internazionale per la protezione delle acque italo-svizzere. Programma quinquen-nale 2008 – 2012 – Rapporto annuale 2009, dito 2010, 2011 e 2012. Bellinzona.
[83] Marchetto, A., 2014. Indagine su DDT e sostanze pericolose nell’ecosistema del Lago Maggiore. Commissione internazionale per la protezione delle acque italo-svizzere. Programma 2013 – 2015 – Rapporto annuale 2013. Verbania Pallanza.
[84] UPB (Umweltprobendatenbank des deutschen Umweltbundesamts), 2017. (www.umweltproben-bank.de).

Use, disposal and environmental releases of mercury © FOEN 2018 49
[85] Corvi, C., Buttiker, B., 1982. Recherche du mercu-re et autres substances toxiques dans la faune piscicole. Rapp. Comm. int. prot. eaux Léman con-tre pollut., Campagne 1981, pp. 91 – 100.
[86] Corvi, C., Zimmerli, P., Ortelli, D., Khim-Heang, S., Becker van Slooten,K., 2005. Métaux et micropol-luants organiques dans les eaux, les moules et les poissons du Léman. Rapp. Comm. int. prot. eaux Léman contre pollut., Campagne 2004, pp. 55 – 78.
[87] Edder, P., Ortelli, D., Klein, A., 2013. Micropol-luants dans plusieurs espèces de poissons du Léman. Rapp. Comm. int. prot. eaux Léman contre pollut., Campagne 2012, pp. 70 – 81.
[88] Edder, P., Ortelli, D., Rapin, F., 2009. Micropollu-ants dans les poissons et écrevisses du Léman. Rapp. Comm. int. prot. eaux Léman contre pollut., Campagne 2008, pp. 73 – 89.
[89] LC-TI (Laboratorio cantonale del Cantone Ticino), 2000 / 2001 / 2002 / 2003 / 2004 / 2005 / 2009 / 2012 / 2013 / 2014 / 2016. Rapporto d’eser-cizio del Laboratorio cantonale (https://www4.ti.ch/dss/dsp/lc/laboratorio/ > Pubblicazioni > Rapporto annui).
[90] Guilizzoni, P., 2012. Indagine su DDT e sostanze pericolose nell’ecosistema del Lago Maggiore. Commissione internazionale per la protezione delle acque italo-svizzere. Programma 2008 – 2012 – Rapporto annuale 2011. Verbania Pallanza.
[91] Steingruber, S., Colombo, L., 2011. Results from the participation of Switzerland to the Internation-al Cooperative Programme on Assessment and Monitoring Effects of Air Pollution on Rivers and Lakes (ICP Waters). Annual Report 2011. Ufficio dell’Aria, del Clima e delle Energie Rinnovabili, Repubblica e Cantone Ticino, Bellinzona.
[92] Schifferli, A., 1978. Rückstände von Pestiziden und PCB bei schweizerischen Haubentauchern
Podiceps cristatus. Der Ornithologische Beobach-ter 75: S. 11 – 18.
[93] Verbruggen, E.M.J., van Herwijnen, R., Smit, C.E., 2015. Derivation of a water-based quality stand-ard for secondary poisoning of mercury. RIVM Letter report 2015-0058, 50 pp. Bilthoven (NL).
[94] ATSDR (Agency for Toxic Substances and Disease Registry), 1999. Toxicological profile for Mercury. Atlanta, GA: U.S. Department of Health and Human Services, Public Health Service.
[95] Roos-Barraclough, F., Shotyk, W., 2003. Millenni-al-Scale Records of Atmospheric Mercury Depo-sition Obtained from Ombrotrophic and Minerotrophic Peatlands in the Swiss Jura Moun-tains. Environmental Science & Technology 37 (2), pp. 235 – 244.
[96] IVS VS (Präsidium des Staatsrates Kanton Wallis. Kanzlei – IVS), 2017. Quecksilberverschmutzung – Einigung über Kostenübernahme bei Sanierungen der Böden. Medienmitteilung vom 11. Dezember 2017.
[97] Rieder, S.R., Frey, B., 2013. Methylmercury affects microbial activity and biomass, bacterial commu-nity structure but rarely the fungal community structure. Soil Biology and Biochemistry 64, pp. 164 – 173.
[98] Link, B., 1999. Richtwerte für die Innenraum luft – Quecksilber. Bundesgesundheitsblatt 42, S. 168 – 174.
[99] LGL (Bayerisches Landesamt für Gesundheit und Lebensmittelsicherheit), 2012. Arbeit, Umwelt und Gesundheit aktuell 2/12: Quecksilber aus Ener-giesparlampen. Erlangen (DE).
[100] WHO (International Programme on Chemical Safety). 1991. Environmental Health Criteria 118, Inorganic Mercury.
Use, disposal and environmental releases of mercury © FOEN 2018 50
[101] Richardson, G. M., 2014. Mercury Exposure and Risks from Dental Amalgam in Canada: The Cana-dian Health Measures Survey 2007 – 2009. Human and Ecological Risk Assessment, 20, pp. 433 – 447.
[102] BAG (Bundesamt für Gesundheit – Abteilung Che-mikalien), 2012. EU Pilotstudie DEMOCOPHES zur Schadstoffbelastung. Informationen zum Studien-design und zu den Resultaten der Schweizer Erhe-bung.
[103] Castaño, A., Cutanda, F., Esteban, M., Pärt, P., Navarro, C., Gómez, S., … Posada, M. 2015. Fish consumption patterns and hair mercury levels in children and their mothers in 17 EU countries. Environmental Research, 141, pp. 58 – 68.
[104] EC (European Commission), 2005. Substance Data Sheet Mercury and its compounds). Common Implementation Strategy for the Water Framework Directive. Environmental Quality Standards (EQS).
[105] Keller, T., Desaules, A., 2001. Böden in der Schweiz – Schadstoffgehalte und Orientierungs-werte (1990 – 1996). Bundesamt für Umwelt, Wald und Landschaft, Bern. Umwelt-Materialien Nr. 139: 115 S.
[106] AfU FR (Amt für Umwelt Kanton Freiburg), 2016. Bodenanalysen in der Stadt Freiburg. Messkam-pagnen 2011 bis 2015.
[107] SLG (Schweizer Licht Gesellschaft), 2015. Licht für die Schweiz (Lichtmarkt Schweiz – Analyse 2014). Commissioned by the Swiss Federal Office of Energy (SFOE); Hrsg. SLG, 1.10.2015. Bern.