use of a double chip seal to correct a flushing hot mix ... feature report _____ final report...
TRANSCRIPT

Office of Research & Library ServicesWSDOT Research Report
Use of a Double Chip Seal to Correct a Flushing Hot Mix Asphalt Pavement in Washington State — Final Report
Keith Anderson Kevin LittletonJim WestonJeff S. Uhlmeyer
Brett JohnsonScott DunhamStephen A. Van De Bogert
WA-RD 760.2 September 2016
16-09-0348

Experimental Feature Report
__________________________________________________________
Final Report
Experimental Feature 10-01
Use of a Double Chip Seal to Correct
a Flushing Hot Mix Asphalt Pavement
in Washington State - Final Report
Contract 7915 SR 20 Eastern Region Chip Seal 2010 MP 363.61 to MP 372.84
Engineering and Regional Operations
Construction Division
State Materials Laboratory

Experimental Feature Report
__________________________________________________________
September 2016 Page ii
1. REPORT NO. 2. GOVERNMENT ACCESSION NO. 3. RECIPIENT'S CATALOG NO.
WA-RD 760.2
4. TITLE AND SUBTITLE 5. REPORT DATE
Use of a Double Chip Seal to Correct a Flushing Hot Mix Asphalt Pavement in Washington State - Final Report September 2016
6. PERFORMING ORGANIZATION CODE WA 10-01 7. AUTHOR(S) 8. PERFORMING ORGANIZATION REPORT NO.
Keith Anderson, Kevin Littleton, Jim Weston, Jeff S. Uhlmeyer, Brett Johnson, Scott Dunham, Stephen A. Van De Bogert
. PERFORMING ORGANIZATION NAME AND ADDRESS 10. WORK UNIT NO.
Washington State Department of Transportation Materials Laboratory, MS-47365 11. CONTRACT OR GRANT NO.
Olympia, WA 98504-7365 12. SPONSORING AGENCY NAME AND ADDRESS 13. TYPE OF REPORT AND PERIOD COVERED
Washington State Department of Transportation Transportation Building, MS 47372
Final Report
Olympia, Washington 98504-7372 14. SPONSORING AGENCY CODE
Project Manager: Lu Saechao, 360-705-7260 15. SUPPLEMENTARY NOTES
This study was conducted in cooperation with the U.S. Department of Transportation, Federal Highway Administration. 16. ABSTRACT
A double chip seal was applied to an existing HMA pavement to mitigate severe flushing that existed throughout the project. Special care was taken to adjust the amount of binder used to account for the degree of flushing in the existing pavement. The double chip seal was effective for approximately two years before flushing began to appear through the seal. After five years the flushing extended throughout the project in the wheel paths of both lanes. The origin of the flushing in the double seal was judged to be from the underlying HMA and not the double seal. For this particular HMA pavement a double chip seal was not the long term solution. The double seal and underlying HMA pavement will be removed by grinding and replaced with a new HMA pavement. 17. KEY WORDS 18. DISTRIBUTION STATEMENT
Chip seal, bituminous surface treatment, surface treatment, flushing, Washington state
No restrictions. This document is available to the public through the National Technical Information Service, Springfield, VA 22616
19. SECURITY CLASSIF. (of this report) 20. SECURITY CLASSIF. (of this page) 21. NO. OF PAGES 22. PRICE
None None 56

Experimental Feature Report
__________________________________________________________
September 2016 Page iii
DISCLAIMER
The contents of this report reflect the views of the authors, who are responsible for the
facts and the accuracy of the data presented herein. The contents do not necessarily reflect the
official views or policies of the Washington State Department of Transportation or the Federal
Highway Administration. This report does not constitute a standard, specification, or regulation.

Experimental Feature Report
__________________________________________________________
September 2016 Page iv
Table of Contents
Introduction ..................................................................................................................................... 1 Location .......................................................................................................................................... 2 Methods for Correcting a Flushed Pavement with a Chip Seal ...................................................... 3
Adjust the Binder Application Rate ............................................................................................ 3 Retexturing .................................................................................................................................. 3 Inverted Double Chip Seal .......................................................................................................... 4 Sandwich Seal ............................................................................................................................. 4
Double Chip Seal Design ................................................................................................................ 5
Test Section Results .................................................................................................................... 5
Final Design ................................................................................................................................ 8
Double Chip Seal Construction ...................................................................................................... 9 Construction Test Results ......................................................................................................... 12
Double Chip Seal Performance ..................................................................................................... 13 Long-Term Performance ............................................................................................................... 14
Friction Resistance .................................................................................................................... 24 Discussion of Results .................................................................................................................... 25 Conclusion .................................................................................................................................... 26
References ..................................................................................................................................... 27 Appendix A Test Section Application Rates ............................................................................... 28
Appendix B Double Chip Seal Construction Specifications ....................................................... 30 Appendix C Skid Accident Reduction Program .......................................................................... 32 Appendix D Gradation Test Results ............................................................................................ 37
Appendix E 2015 Friction Test Results ....................................................................................... 39
Appendix F Experimental Feature Work Plan ............................................................................. 43

Experimental Feature Report
__________________________________________________________
September 2016 Page v
List of Figures Figure 1. Flushing HMA on SR 20 soon after placement. ........................................................... 1
Figure 2. Condition of flushing pavement before placement of the double chip seal. ................ 1 Figure 3. Location of test sections. .............................................................................................. 5 Figure 4. Chip seal placement on Test Section 1 (on right) with 0.27 gal/yd2 showing
slight flushing in the wheel path after the first application. ........................................ 6 Figure 5. Test Section 1 (on left) with 0.27 gal/ yd2 shows flushing in the wheel path
after construction while no flushing was present in Test Section 3 (on right) at 0.20 gal/ yd2. ............................................................................................................ 6
Figure 6. West end of Test Section 1 (on left) with 0.27 gal/ yd2 and Test Section 3 (on right) with 0.20 gal/ yd2 for the first application one year after placement. ......... 7
Figure 7. East end of Test Section 4 (on the left) with 0.20 gal/ yd2 and Test Section 2 (on the right) with 0.28 gal/ yd2 for the first application. ............................................ 7
Figure 8. Test Section 4 (on left) with 0.20 gal/ yd2 shows minimal flushing while Test Section 2 (on right) with 0.28 gal/ yd2 shows flushing in wheel paths two years after construction. ....................................................................................... 8
Figure 9. Typical 100% embedment area in Test Sections 1 and 2, one year after construction. ................................................................................................................ 8
Figure 10. Upper left – Rating 1 (No Flushing), Bottom left – Rating 4 (Entire lane flushing) and Right – Rating 3 (Consistent wheel path flushing). ............................................ 10
Figure 11. Left –Rating 1 (No flushing) and Right – Rating 2 (Intermittent flushing in wheel path). ............................................................................................................... 10
Figure 12. Appearance of the double chip seal three months after construction. ........................ 13
Figure 13. Area with embedment near 100 percent three months after construction. ................. 13 Figure 14. Three months after construction. ................................................................................ 15
Figure 15. Twenty-five months after construction. ..................................................................... 15 Figure 16. Thirty-seven months after construction. Poor light conditions. ................................ 15 Figure 17. Fifty months after construction. ................................................................................. 15
Figure 18. Sixty-two months after construction. ......................................................................... 15 Figure 19. MP 368.00 three months after construction. .............................................................. 16 Figure 20. Twenty-five months after construction. ..................................................................... 16
Figure 21. Thirty-seven months after construction. Poor light conditions. ................................ 16 Figure 22. Fifty months after construction. ................................................................................. 16 Figure 23. Sixty-two months after construction. ......................................................................... 16 Figure 24. MP 372.5 vicinity, pre-construction rating 2 on the left EB lane, 1 on the right
lane. The June 2015 ratings were 3 on the left, 2 on the right. ................................ 17
Figure 25. MP 372.0 pre-construction rating 2 on the left EB lane. June 2015 rating was 3 on the left lane. ....................................................................................................... 18
Figure 26. MP 371.5 pre-construction rating 2 on the left EB lane, 1 on the right WB lane. June 2015 ratings were 4 on the left lane, 2 on the right lane. .................................. 18
Figure 27. MP 371.25 pre-construction rating 2 on the left EB lane, 3 on the right WB lane. June 2015 ratings were 4 on both lanes. Severe raveling in the right lane. ............. 19

Experimental Feature Report
__________________________________________________________
September 2016 Page vi
Figure 28. MP 370.0 pre-construction rating 3 on the left EB lane, 4 on the right WB lane. June 2015 ratings were 4 on both lanes. .................................................................... 19
Figure 29. MP 369.0 pre-construction rating 4 on the right WB lane. June 2015 rating was 4 on the right lane. Left lane cannot be seen well enough to rate. ........................... 20
Figure 30. MP 368.0 pre-construction rating 3 on the left EB lane, 4 on the right WB lane. June 2015 rating was 4 on both lanes. ....................................................................... 20
Figure 31. MP 367.0, pre-construction rating 1 on the left EB lane, 2 on the right WB lane. June 2015 rating was 4 on both lanes. ....................................................................... 21
Figure 32. MP 366.7, pre-construction rating 1 on the left EB lane, 2 on the right WB lane. June 2015 rating was 4 on both lanes. ....................................................................... 21
Figure 33. MP 366.0, pre-construction rating 4 on both left EB and right WB lanes pre-construction. June 2015 rating was 4 on both lanes. .......................................... 22
Figure 34. MP 364.9, pre-construction rating 3 on both left EB and right WB lanes. June 2015 rating was 3 on both lanes. ....................................................................... 22
Figure 35. MP 364.3, pre-construction rating 3 on both left EB and right WB lanes. June 2015 rating was 4 on both lanes. ....................................................................... 23
Figure 36. MP 363.6, pre-construction rating 3 on the left EB lane, 1 on the right WB lane. June 2015 rating was 3 on the left lane 2 on the right lane. ...................................... 23
List of Tables Table 1. Double chip seal test section binder and aggregate application rates and percent
embedment of the aggregate. ........................................................................................ 6
Table 2. Double chip seal aggregate gradations. ......................................................................... 9 Table 3. Application rates from the contract documents. ............................................................ 9 Table 4. Roadway flushing rating system. ................................................................................. 10
Table 5. Flushing rating and application rates for first application of the double chip seal on west bound SR 20. ................................................................................................. 11
Table 6. Flushing rating and application rates for first application of the double chip seal on east bound SR 20. .................................................................................................. 12
Table 7. Friction numbers immediately after construction on September 16, 2010. ................. 14
Table 8. Pre-construction versus June 2015 flushing ratings. ................................................... 24 Table 9. Historical friction results. ............................................................................................ 25
Table 10. 2015 friction numbers less than 30. ............................................................................. 25 Table 11. Construction quality control 3/8 inch to U.S No. 4 gradation test results. .................. 38
Table 12. Construction quality control U.S No. 4 to 0 gradation test results. ............................. 38 Table 13. 2015 eastbound friction results. ................................................................................... 40 Table 14. 2015 westbound friction results. .................................................................................. 41

Experimental Feature Report
__________________________________________________________
September 2016 1
Introduction In 1999 WSDOT overlaid a section of SR-20 with hot-mix asphalt (HMA) to provide
additional pavement structure on the existing bituminous surface treatment (BST) roadway.
Soon after construction, the new HMA began to flush excessively (Figures 1 and 2).
Maintenance crews periodically rolled aggregate and sand into the flushed surface in order to
improve friction but the flushing persisted. The roadway was in good condition structurally, but
a surface treatment was needed to address the flushing, improve friction and preserve the
roadway surface. Placing a single chip seal on this pavement would likely result in flushing of
the newly placed chip seal due to the presence of the excess binder that would mitigate to the
surface of the seal and fill the aggregate void space. Therefore, other repair strategies were
investigated that would properly accounted for the excess binder during the design and
construction of the seal.
Figure 1. Flushing HMA on SR 20 soon after placement.
Figure 2. Condition of flushing pavement before placement of the double chip seal.
Limited information was found regarding the construction of a chip seal on an existing
flushed surface. A review of the literature indicated that both an inverted double chip seal and a
sandwich seal were capable of correcting flushing in an existing pavement. The drawback to the
information in the literature was that construction details and performance data for these types of
chip seals were not included. Although the inverted double chip seal and sandwich seal reported

Experimental Feature Report
__________________________________________________________
September 2016 2
in the literature are not conventional double chip seals, they both involve two applications of
aggregate and one or two applications of binder. This led to the decision to construct a double
chip seal as a method to address the section on SR 20.
A single chip seal consists of one application of aggregate over one application of asphalt
binder. A double chip seal is essentially two single chip seals, one placed on top of the other. In
a standard double chip seal the aggregate in the top layer usually has a finer gradation than the
aggregate in the bottom layer. The inverted double chip seal is the opposite of a conventional
double chip seal with the finer aggregate gradation placed in the bottom layer and the coarser
aggregate in the top layer. Double chip seals are more durable and seal the roadway against
water better than a single chip seal leading to their use in locations where there is high truck
traffic or on steep grades (Gransberg and James, 2005). The disadvantage of a double chip seal
is higher cost because of the two applications of binder and aggregate.
A double chip seal is a departure from the normal practice used by the Washington State
Department of Transportation (WSDOT). WSDOT uses single chip seals almost exclusively to
preserve low volume highways. If it can successfully address the flushing pavement on SR 20, a
double chip seal will provide an economical method of addressing flushing on chip seal
roadways in the future. In 2008 WSDOT constructed a half mile double chip seal test section on
a portion of the flushed section of SR 20 to evaluate the double chip seal’s effectiveness at
mitigating the flushing. The performance of the test section was promising resulting in the
decision to place the double chip seal on the remainder of the flushing pavement in 2010. This
report documents the design and construction of the double chip seal and its performance over a
5-year period.
Location The section of SR 20 that received the double chip seal was located approximately 15
miles east of Colville in Stevens County, between milepost 363.61 and 372.84. This section of
SR 20 is a rural minor arterial in rolling terrain with many curves. Forest lines most of the
roadside with interspersed open areas where farms or home sites are located along the route.
Traffic is light with Average Annual Daily Traffic (AADT) varying between 600 and 1,400

Experimental Feature Report
__________________________________________________________
September 2016 3
vehicles per day of which between 20 and 25 percent are trucks. The average high temperature
in July is 87°F and the average low in January is 18°F. Precipitation occurs throughout the year
with December being the wettest month with 2.26 inches and August the driest with 0.74 inches.
Annual precipitation is over 17 inches with an average of 42 inches of snowfall occurring during
the winter season.
Methods for Correcting a Flushed Pavement with a Chip Seal The available literature was reviewed to investigate methods that had the potential to
correct a flushed pavement using a chip seal. The following briefly describes four methods that
were identified and discusses their applicability to the flushed pavement on SR 20.
Adjust the Binder Application Rate
The simplest and most common method used to address a flushed existing pavement is to
adjust the binder application rate based on the condition of the existing pavement. Both the
McLeod and modified Kearby chip seal design methods use correction factors that reduce the
application rate for flushed surfaces. The McLeod design method recommends reducing the
binder application rate by up to 0.06 gal/yd2 for a flushed or bleeding surface (McLeod 1969).
The modified Kearby design method recommends the same reduction of 0.06 gal/yd2 (Gransberg
and James, 2005).
Reducing the binder application rate may be an effective way to construct a single chip
seal over a flushed pavement as long as the flushing is not too excessive. It is unlikely that the
binder application rate adjustments in the McLeod or modified Kearby methods were intended to
address the severity of the flushing on SR 20. WSDOT chose to reduce the binder application
rate as part of its strategy to correct the flushing pavement on SR 20, but it was believed that a
single chip seal with a correction to the binder application alone would not be sufficient to
correct the flushing.
Retexturing
Australia, New Zealand and the United Kingdom use retexturing to correct a flushing
surface (Gransberg and James 2005, Gransberg, Pidwerbesky and James 2005). Retexturing is a
Experimental Feature Report
__________________________________________________________
September 2016 4
process which uses high pressure water to remove flushed binder from the pavement surface and
to restore surface texture prior to placing a new chip seal (Gransberg and James 2005).
Retexturing can address flushing over the entire pavement surface by using full width water
blasting equipment or on small areas using a water cutting machine (Gransberg, Pidwerbesky
and James 2005).
Although retexturing appears promising, WSDOT does not have experience with this
process and did not consider it as a viable solution for the flushing problem on SR 20.
Inverted Double Chip Seal
An inverted double chip seal includes two applications of binder and two applications of
aggregate. Unlike a conventional double chip seal where the top layer of aggregate is finer than
the bottom, the finer aggregate gradation is on the bottom of an inverted double chip seal.
Inverted double chip seals have been used successfully on bleeding pavements with up to 30,000
Average Daily Traffic (ADT) in Australia (Gransberg and James 2005). Despite the reported
success, the literature review did not include information describing the design or construction of
projects where an inverted chip seal was used to correct flushed pavements.
Sandwich Seal
New Zealand uses sandwich seals to correct flushing pavements and Texas has used them
on a limited basis as a remedy for flushed or bleeding pavements (Gunderson 2008, Lawson and
Senadheera 2009). A sandwich seal consist of two layers of aggregate and one application of
binder. The first layer consists of coarse aggregate placed directly on the existing pavement
without a preceding application of binder. An application of binder followed by a second layer
of finer gradation aggregate placed on top of the coarse aggregate layer completes the sandwich
seal. It is essentially a double chip seal without the first application of binder. A sandwich seal
requires about 20% less binder than a comparable double chip seal (Gunderson 2008).
It was felt that a sandwich seal would be more appropriate on a freshly placed bleeding
chip seal as opposed to the 11 year old flushed HMA pavement on SR 20. The aged flushed
asphalt on SR 20 may not hold the aggregate without at least some new binder applied to the
existing pavement.

Experimental Feature Report
__________________________________________________________
September 2016 5
Instead of an inverted chip seal or sandwich seal, WSDOT elected to use a double chip
seal using the same aggregate gradation in both the top and bottom layers. It was felt that this
type of double chip seal should perform as well as an inverted chip seal at a lower cost.
Double Chip Seal Design The successful use of a double chip seal to correct a flushing pavement in Thurston
County Washington influenced WSDOT’s design. The double chip seal used in Thurston
County consisted of two applications of CRS-2P binder and two applications of 1/2 inch to U.S.
No. 4 aggregate with a reduced application rate of the binder for the first layer (Doolittle, 2007).
Test sections of double chip seal were placed on the SR 20 problem pavement in 2008 to test the
performance of variable application rates for both the binder and the aggregate.
Test Section Results
The test sections built in July of 2008 were placed in both lanes of a one half mile section
of SR 20 selected because of its relatively high rate of flushing and because its geometry was
representative of most of the remainder of the flushed roadway (Figure 3). The plan was to use
different application rates for both the aggregate and the CRS-2P binder. Actual binder
application rates varied from the planned rates resulting in the first application for Test Section 1
having an application rates very similar to Test Section 2 and the first application for Test
Sections 3 and 4 having the same binder application rates. Table 1 shows the actual application
rates for the first and second application of binder and aggregate and the percent embedment.
Complete details of the planned and actual application rates are included in Appendix A.
Figure 3. Location of test sections.

Experimental Feature Report
__________________________________________________________
September 2016 6
Table 1. Double chip seal test section binder and aggregate application rates and percent
embedment of the aggregate.
Test Section
Location (milepost)
First Application Second Application1 Percent
Embedment CRS-2P (gal/yd2)
3/8 inch – U.S. No 4 (lbs/yd2)
CRS-2P (gal/yd2)
3/8 inch – U.S. No 4 (lbs/yd2)
1 366.73 to 366.98 WB 0.27 20 0.35 22 80 2 366.98 to 367.23 WB 0.28 20 0.36 20 80 3 366.73 to 366.98 EB 0.20 20 0.40 20 70 4 366.99 to 367.23 EB 0.20 20 0.40 20 70
1 The second application also included 4 lbs/yd2 of U.S No 4 – 0 choke on all sections.
Checking embedment after the first applications of aggregate gave an indication of the
affect the flushing pavement would have on the chip seal (Table 1). Binder application rates
should be adjusted so that embedment is between 50 and 70 percent (Jackson, Jackson and
Mahoney). Higher embedment rates indicate too much binder and could result in flushing. As
expected, the embedment measurements for the first application were higher than they would be
if the existing pavement surface was not flushing. There were also some indications of bleeding
during construction especially in the sections with higher binder application rates (Figures 4-5).
Figure 4. Chip seal placement on Test Section 1 (on right) with 0.27 gal/yd2 showing slight flushing in the wheel path after the first application.
Figure 5. Test Section 1 (on left) with 0.27 gal/ yd2 shows flushing in the wheel path after construction while no flushing was present in Test Section 3 (on right) at 0.20 gal/ yd2.

Experimental Feature Report
__________________________________________________________
September 2016 7
Monitoring the test sections for two years after construction revealed wheel path flushing
had occurred in many locations. Test Sections 1 and 2, which had higher binder application rates
during the first application than Test Sections 3 and 4, appeared to have the more severe flushing
(Figures 6 through 9). Despite the overall lower flushing severity, Test Sections 3 and 4 still had
many severely flushed areas presumably where the flushing of the underlying pavement was
more severe. By 2009 the embedment was 100 percent in the flushed areas of lanes 1 and 2
(Figure 8) but was reported to be in the 70 percent range in Test Sections 3 and 4 which had the
lower binder application rates for the first application (Stephen Van De Bogert email, 2009).
The test sections showed that the lower application rates for the first application of CRS-2P seal
reduced the flushing and could produce an acceptable pavement. The test sections also showed
that the application rates for the first application of CRS-2P would need to be varied depending
on the flushing present on the existing surface.
Figure 6. West end of Test Section 1 (on left) with 0.27 gal/ yd2 and Test Section 3 (on right) with 0.20 gal/ yd2 for the first application one year after placement.
Figure 7. East end of Test Section 4 (on the left) with 0.20 gal/ yd2 and Test Section 2 (on the right) with 0.28 gal/ yd2 for the first application.

Experimental Feature Report
__________________________________________________________
September 2016 8
Figure 8. Test Section 4 (on left) with 0.20 gal/ yd2 shows minimal flushing while Test Section 2 (on right) with 0.28 gal/ yd2 shows flushing in wheel paths two years after construction.
Figure 9. Typical 100% embedment area in Test Sections 1 and 2, one year after construction.
Final Design
To simplify the design and use available materials, WSDOT selected a double chip seal
similar to the Thurston County design consisting of two applications of CRS-2P binder and two
applications of 3/8 inch to U.S. No. 4 aggregate (Table 2). An application of U.S. No. 4 to 0
choke (Table 2) placed after the second application of aggregate would fill surface voids and
lock in the second application of 3/8 inch to U.S. No. 4 aggregate. The binder application rates
used for Test Sections 3 and 4 were the basis for the final design included in the contract
documents (Table 1). The goal was to achieve an initial embedment of about 50 percent. The
CRS-2P target of 0.20 gal/yd2 for the first layer was about one half of the application rate
typically used by WSDOT on a single chip seal (Table 3). The remaining application rates for
the CRS-2P and aggregate for the second layer were within the normal range for a WSDOT
typical single chip seal. The complete double chip seal specification from the contract
documents is included in Appendix B.

Experimental Feature Report
__________________________________________________________
September 2016 9
Table 2. Double chip seal aggregate gradations.
Sieve 3/8” – U.S. No. 4 U.S. No. 4 – 0 1/2” Square 100 --- 3/8” Square 70 – 90 100 U.S. No. 4 0 – 5 76 – 100 U.S. No. 8 0 – 3 --- U.S. No. 10 --- 30 – 60 U.S. No. 200 0 – 1.5 0 – 10
Table 3. Application rates from the contract documents.
Application Asphalt (CRS-2P) gal./yd2 Gradation Aggregate
lbs./yd2 Bottom Layer 0.20 3/8 inch – U.S. No. 4 20
Top Layer 0.35 – 0.40 3/8 inch – U.S. No. 4 20 - 30
U.S. No. 4 – 0 4 - 6
Double Chip Seal Construction The double chip seal on SR 20 was part of a larger project to place over 300 lane miles of
single chip seal. The bottom layer of aggregate and binder for the double chip seal occurred on
July 27, 2010 and the top layer the day following. The weather was ideal for chip seal placement
with clear skies and high temperatures in the upper 90’s °F. The maximum surface temperature
measured during placement was 116°F. The Contractor, Central Washington Asphalt (CWA)
used conventional chip seal equipment and placement procedures. Overall the construction of
the double chip seal went well. Two issues that may affect performance were that the aggregate
gradations were outside of specifications limits and that the application rates of the No. 4 to 0
choke were inconsistent and lower than specified. The gradation testing results are covered
further under Construction Test Results.
The intent was that the application rates in the contract documents would be a starting
point and that field personnel would adjust the rates during placement to account for field
conditions. Prior to placing the double chip seal, WSDOT field personnel gave each section of
the roadway a 1 to 4 rating based on the extent of flushing visible with 1 being no flushing and 4
Experimental Feature Report
__________________________________________________________
September 2016 10
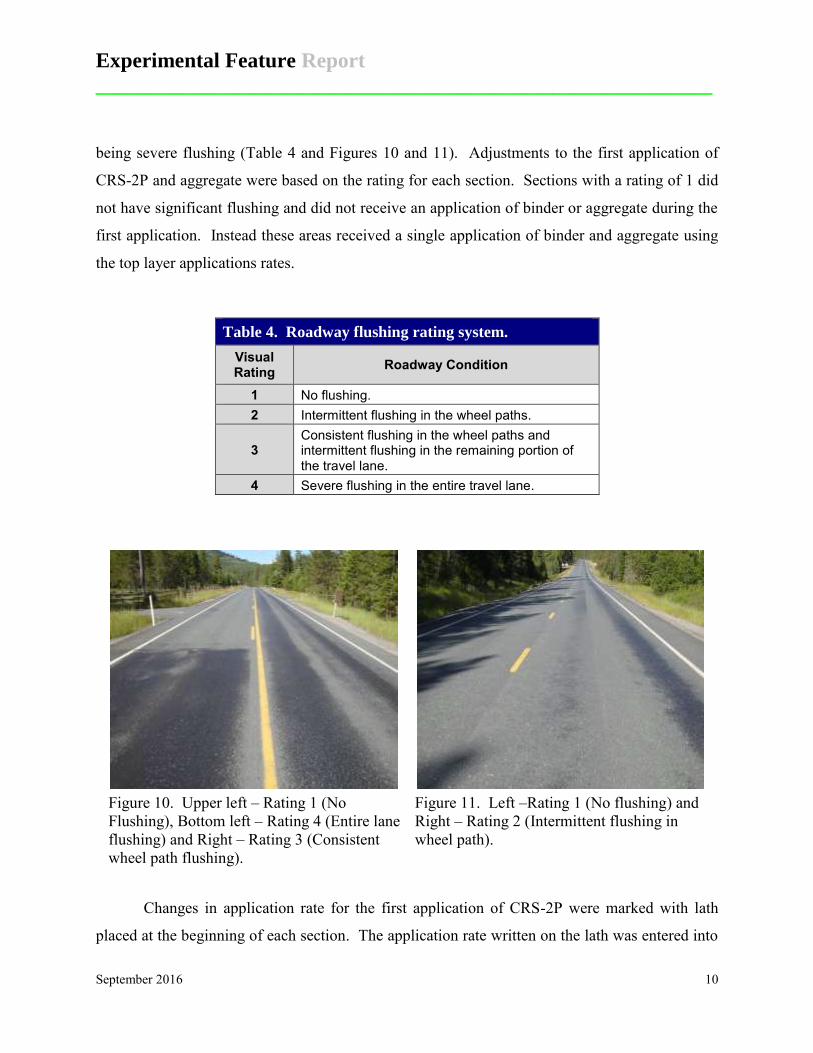
being severe flushing (Table 4 and Figures 10 and 11). Adjustments to the first application of
CRS-2P and aggregate were based on the rating for each section. Sections with a rating of 1 did
not have significant flushing and did not receive an application of binder or aggregate during the
first application. Instead these areas received a single application of binder and aggregate using
the top layer applications rates.
Table 4. Roadway flushing rating system.
Visual Rating Roadway Condition
1 No flushing. 2 Intermittent flushing in the wheel paths.
3 Consistent flushing in the wheel paths and intermittent flushing in the remaining portion of the travel lane.
4 Severe flushing in the entire travel lane.
Figure 10. Upper left – Rating 1 (No Flushing), Bottom left – Rating 4 (Entire lane flushing) and Right – Rating 3 (Consistent wheel path flushing).
Figure 11. Left –Rating 1 (No flushing) and Right – Rating 2 (Intermittent flushing in wheel path).
Changes in application rate for the first application of CRS-2P were marked with lath
placed at the beginning of each section. The application rate written on the lath was entered into
Experimental Feature Report
__________________________________________________________
September 2016 11
the computerized application rate control system on the distributor truck to ensure the proper
application of CRS-2P. WSDOT field personnel verified application rates by computing the
yield based on the area chip sealed and the gallons of CRS-2P used.
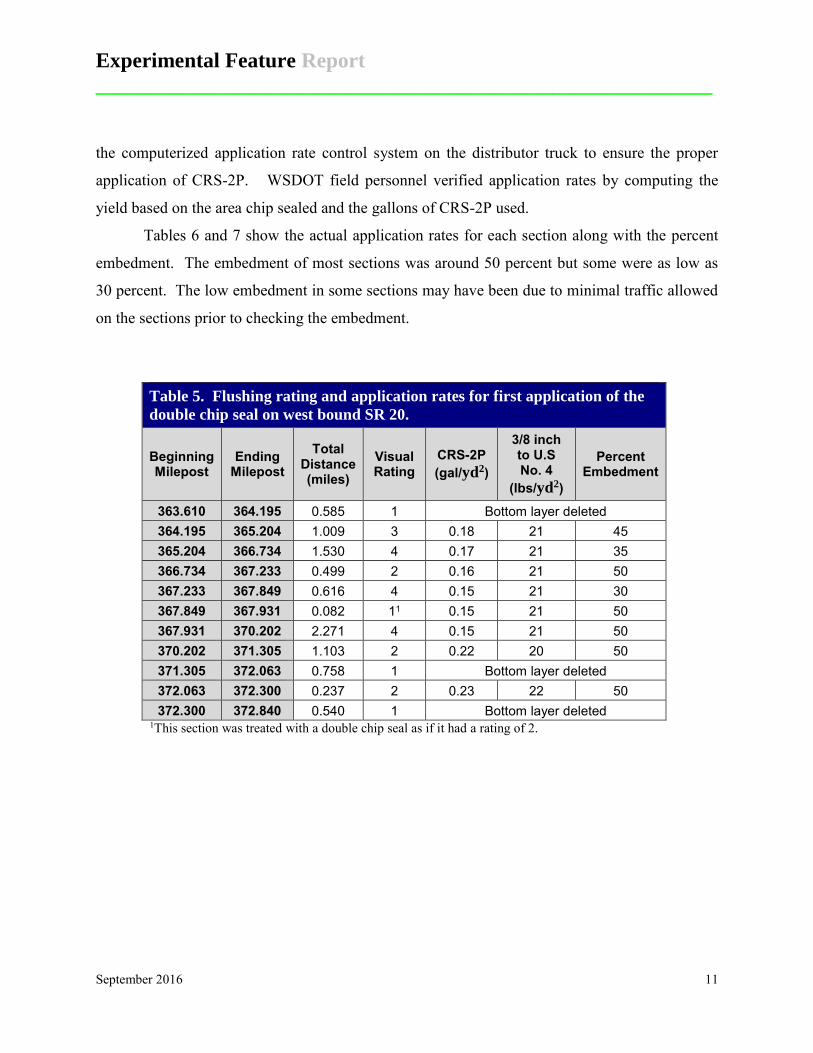
Tables 6 and 7 show the actual application rates for each section along with the percent
embedment. The embedment of most sections was around 50 percent but some were as low as
30 percent. The low embedment in some sections may have been due to minimal traffic allowed
on the sections prior to checking the embedment.
Table 5. Flushing rating and application rates for first application of the
double chip seal on west bound SR 20.
Beginning Milepost
Ending Milepost
Total Distance (miles)
Visual Rating
CRS-2P (gal/yd2)
3/8 inch to U.S No. 4
(lbs/yd2)
Percent Embedment
363.610 364.195 0.585 1 Bottom layer deleted 364.195 365.204 1.009 3 0.18 21 45 365.204 366.734 1.530 4 0.17 21 35 366.734 367.233 0.499 2 0.16 21 50 367.233 367.849 0.616 4 0.15 21 30 367.849 367.931 0.082 11 0.15 21 50 367.931 370.202 2.271 4 0.15 21 50 370.202 371.305 1.103 2 0.22 20 50 371.305 372.063 0.758 1 Bottom layer deleted 372.063 372.300 0.237 2 0.23 22 50 372.300 372.840 0.540 1 Bottom layer deleted
1This section was treated with a double chip seal as if it had a rating of 2.

Experimental Feature Report
__________________________________________________________
September 2016 12
Table 6. Flushing rating and application rates for first application of the
double chip seal on east bound SR 20.
Beginning Milepost
Ending Milepost
Total Distance (miles)
Visual Rating
CRS-2P (gal/yd2)
3/8 inch to U.S No. 4
(lbs/yd2)
Percent Embedment
363.610 365.204 1.594 3 0.15 21 50 365.204 366.734 1.530 4 0.16 21 35 366.734 367.233 0.499 1 Bottom layer deleted 367.233 367.594 0.361 4 0.14 21 50 367.594 371.340 3.746 3 0.18 21 50 371.340 372.063 0.723 2 0.21 20 50 372.063 372.300 0.237 3 0.19 22 40 372.300 372.840 0.540 2 0.23 22 50
The top layer of the double chip seal occurred following the completion of the first
application on the areas noted in Table 6 and 7. The top layer consisted of 0.34 to 0.39 gal/yd2
of CRS-2P binder and 24 lbs/yd2 of 3/8 inch to U.S. No. 4 aggregate with 2.3 lbs/yd2 of U.S. No.
4 to 0 choke on all areas regardless of the condition rating. This means that the application rates
for the areas that were deleted from the bottom layer were the same rates used on the top layer.
Construction Test Results
Testing of samples from the stockpiles revealed that the gradation of the 3/8 inch to U.S.
No. 4 aggregate was outside specification requirements for the percentage passing the U.S. No. 4
sieve and that the gradation of the U.S. No. 4 to 0 choke was outside the specification for the
percentage passing the U.S. No. 200 sieve. WSDOT uses a specification for statistical
acceptance of aggregates on this project. Although the aggregate gradations were outside
specification requirements for individual sieves, the overall quality level was such that the
specification allowed the aggregate to remain in place with a price reduction. The percentages
passing the remaining sieves were all within specification and the higher percentages passing the
two sieves should not affect the performance of the double chip seal. Appendix C includes the
results of the gradation testing.

Experimental Feature Report
__________________________________________________________
September 2016 13
Double Chip Seal Performance After three months in service the double chip seal appeared to be performing well with
only a few areas in the wheel paths where the embedment appeared to be near 100 percent
(Figures 12 and 13).
Figure 12. Appearance of the double chip seal three months after construction.
Figure 13. Area with embedment near 100 percent three months after construction.
WSDOT tested the friction of the double chip seal after construction with a ribbed tire
using a locked-wheel friction tester meeting ASTM E-274 requirements. As would be expected
for a chip seal, the friction numbers were good with a range in values from 57.5 to 68.0 and an
average of 62.1(Table 7).

Experimental Feature Report
__________________________________________________________
September 2016 14
Table 7. Friction numbers immediately after
construction on September 16, 2010.
Milepost Direction Friction Number (FN)
364.0 EB 63.5 365.0 EB 62.8 366.0 EB 63.1 367.0 EB 62.8 368.0 EB 62.8 369.0 EB 62.6 370.0 EB 62.0 371.0 EB 64.1 372.0 EB 61.9 372.5 WB 68.0 371.5 WB 64.1 370.5 WB 61.2 369.5 WB 57.5 368.5 WB 59.7 367.5 WB 60.9 366.5 WB 59.8 365.5 WB 59.4 364.5 WB 62.0
Average 62.1 Range 57.5 - 68.0
Long-Term Performance The performance of the double chip seal was monitored for five years by collecting
friction data and photos of the roadway. Beginning with the photos, the first two sets of photos
below illustrate the condition of the chip seal at two locations at intervals of 3, 25, 37, 50 and 62
months after construction.

Experimental Feature Report
__________________________________________________________
September 2016 15
Condition at MP 368.50
Figure 14. Three months after construction. Figure 15. Twenty-five months after
construction.
Figure 16. Thirty-seven months after construction. Poor light conditions.
Figure 17. Fifty months after construction.
Figure 18. Sixty-two months after construction.

Experimental Feature Report
__________________________________________________________
September 2016 16
Condition at MP 368.00
Figure 19. MP 368.00 three months after construction.
Figure 20. Twenty-five months after construction.
Figure 21. Thirty-seven months after construction. Poor light conditions.
Figure 22. Fifty months after construction.
Figure 23. Sixty-two months after construction.

Experimental Feature Report
__________________________________________________________
September 2016 17
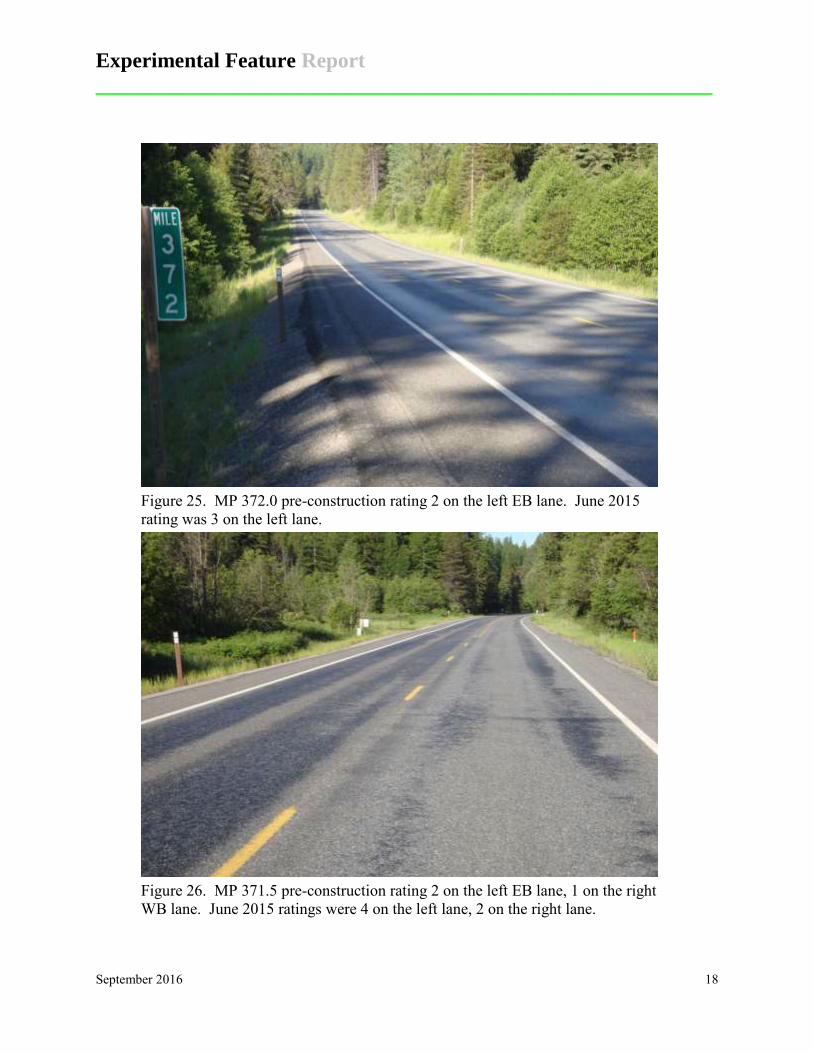
June 2015 photos (Figures 24-36) show the flushing condition of the pavement with the
captions indicate the pre-construction flushing conditions ratings from Tables 5 and 6 and the
ratings determined from the examination of these photos.
Figure 24. MP 372.5 vicinity, pre-construction rating 2 on the left EB lane, 1 on the right lane. The June 2015 ratings were 3 on the left, 2 on the right.
Rating System
1 = No flushing. 2 = Intermittent flushing in the wheel paths. 3 = Consistent flushing in the wheel paths and intermittent flushing in the remaining
portion of the travel lane. 4 = Severe flushing in the entire travel lane.
Experimental Feature Report
__________________________________________________________
September 2016 18
Figure 25. MP 372.0 pre-construction rating 2 on the left EB lane. June 2015 rating was 3 on the left lane.
Figure 26. MP 371.5 pre-construction rating 2 on the left EB lane, 1 on the right WB lane. June 2015 ratings were 4 on the left lane, 2 on the right lane.

Experimental Feature Report
__________________________________________________________
September 2016 19
Figure 27. MP 371.25 pre-construction rating 2 on the left EB lane, 3 on the right WB lane. June 2015 ratings were 4 on both lanes. Severe raveling in the right lane.
Figure 28. MP 370.0 pre-construction rating 3 on the left EB lane, 4 on the right WB lane. June 2015 ratings were 4 on both lanes.

Experimental Feature Report
__________________________________________________________
September 2016 20
Figure 29. MP 369.0 pre-construction rating 4 on the right WB lane. June 2015 rating was 4 on the right lane. Left lane cannot be seen well enough to rate.
Figure 30. MP 368.0 pre-construction rating 3 on the left EB lane, 4 on the right WB lane. June 2015 rating was 4 on both lanes.

Experimental Feature Report
__________________________________________________________
September 2016 21
Figure 31. MP 367.0, pre-construction rating 1 on the left EB lane, 2 on the right WB lane. June 2015 rating was 4 on both lanes.
Figure 32. MP 366.7, pre-construction rating 1 on the left EB lane, 2 on the right WB lane. June 2015 rating was 4 on both lanes.

Experimental Feature Report
__________________________________________________________
September 2016 22
Figure 33. MP 366.0, pre-construction rating 4 on both left EB and right WB lanes pre-construction. June 2015 rating was 4 on both lanes.
Figure 34. MP 364.9, pre-construction rating 3 on both left EB and right WB lanes. June 2015 rating was 3 on both lanes.

Experimental Feature Report
__________________________________________________________
September 2016 23
Figure 35. MP 364.3, pre-construction rating 3 on both left EB and right WB lanes. June 2015 rating was 4 on both lanes.
Figure 36. MP 363.6, pre-construction rating 3 on the left EB lane, 1 on the right WB lane. June 2015 rating was 3 on the left lane 2 on the right lane.

Experimental Feature Report
__________________________________________________________
September 2016 24
Table 8 lists the pre-construction flushing ratings and the ratings as determine from the
2015 photos. The amount of flushing June of 2015 is either the same or in most cases higher
than the amount noted prior to the application of the chip seal (Tables 5 and 6 on pages 11 and
12).
Table 8. Pre-construction versus June 2015 flushing
ratings.
Milepost Flushing Rating
Pre-Construction June 2015 372.5 2 1 3 2 372.0 2 - 3 - 371.5 2 1 4 2 371.3 2 3 4 4 370.0 3 4 4 4 369.0 - 4 - 4 368.0 3 4 4 4 367.0 1 2 4 4 366.7 1 2 4 4 366.0 4 4 4 4 364.9 3 3 3 3 364.3 3 3 4 4 363.6 3 1 3 2
Average 2.4 2.7 3.7 3.4
In summary, the amount of flushing is equal to the flushing observed on the existing
pavement prior to the construction of the double chip seal
Friction Resistance
The friction resistance results are another indicator of the amount and severity of the
flushing on the double chip seal. The range and average friction numbers from 2010 to 2015 are
listed in Table 9.

Experimental Feature Report
__________________________________________________________
September 2016 25
Table 9. Historical friction results.
Lane Friction Number (FN)
2010 2011 2012 2014 2015 Average 62.1 59.2 58.7 49.2 34.1 Range 57.5 - 68.0 40.8 - 64.3 47.6 – 66.9 26.9 – 62.0 16.9 – 58.7
The most recent results from 2015 included 103 tests. Table 10 list the number and percentage
of the 103 test below a friction number of 30. Roadways with values below 30 are of a concern
and trigger further action to determine if the roadway is a hazard as required by the WSDOT
Skid Accident Reduction Program (Appendix C). The low friction numbers indicate that
flushing is a problem on both eastbound and westbound lanes throughout the entire length of the
project. A tabulation of the 2015 friction numbers is found in Appendix D.
Table 10. 2015 friction numbers less than 30.
Direction Number of Tests
FNs Less Than 30
Percent Less Than 30
EB 41 13 32 WB 62 29 47
Totals 103 42 41
Discussion of Results WSDOT designed and constructed a double chip seal to correct the extreme flushing of
an HMA pavement on SR 20. Design of the double chip seal was straightforward and
construction was accomplished using conventional chip seal equipment and methods. The
application rates of the binder were adjusted to compensate for the amount of flushing of the
existing HMA. Initially the double seal looked good with little evidence of flushing. Within a
year after placement, flushing became evident but did not appear to be affecting performance.
By four years after construction flushing had progressed to the point where low friction needed

Experimental Feature Report
__________________________________________________________
September 2016 26
to be addressed. The photos and friction number data indicate that adjusting the amount of
binder did not result in a decrease in the degree of flushing of the double chip seal.
Conclusion The double chip seal was not successful in mitigating the extremely flushing conditions
of this section of SR 20. The binder in the underlying HMA eventually bled through the chip
seal resulting in flushing conditions that were equal to or worse than conditions prior to the
application of the double chip seal.
The Easter Region has scheduled a project that will remove the double seal and
underlying HMA pavement and replace them with a new HMA pavement.

Experimental Feature Report
__________________________________________________________
September 2016 27
References Doolittle, T. (2007), “The Inverted Seal”. Email to Jeff Uhlmeyer (WSDOT State Pavement Engineer), 11/1/2007. Gransberg, D.D., Pidwerbesky, B., James, D.M. (2005), “Analysis of New Zealand Chip Seal Design and Construction Practices”, Transportation Research Circular Number E-C078: Roadway Pavement Preservation 2005, Transportation Research Board, Washington DC Gransberg, D., James, D.M. (2005), “NCHRP Synthesis 342: Chip Seal Best Practices”, Transportation Research Board, Washington DC. Gundersen, B. (2008),”Chip Sealing Practice in New Zealand”, Presented at the 1st Sprayed Sealing Conference – Cost Effective High Performance Surfacings, Adelaide, Australia Jackson, D.C., Jackson, N.C., Mahoney, J.P. (1990), “Washington State Chip Seal Study”. Transportation Research Record 1259, Transportation Research Board, Washington DC Lawson, W.D., Senadheera, S. (2009), “Chip Seal Maintenance: Solutions for Bleeding and Flushed Pavement Surfaces”, Transportation Research Record 2108, Transportation Research Board, Washington DC McLeod, N. W., (1969), “A General Method of Design for Seal Coats and Surface Treatments”, Proceedings of the Association of Asphalt Pavement Technologists, Vol. 38, Minneapolis Minn. Texas Department of Transportation, (2010) Seal Coat and Surface Treatment Manual, TxDOT, Revised May 2010. Van De Bogert, S. (2009), “Double Chip Seal Test Section on Hwy 20”. Email to Jeff Uhlmeyer (WSDOT State Pavement Engineer), 1/28/2009

Experimental Feature Report
__________________________________________________________
September 2016 28
Appendix A Test Section Application Rates

Experimental Feature Report
__________________________________________________________
September 2016 29
MP
366
.94
Ord
ered
0.2
8
Sh
ot 0
.28
MP
366
.92
First Shot - 7/8/2008 (Started in westbound lane heading east, pulled back and shot the eastbound lane)
Westbou
nd
MP
366
.73
Ordered 0.24 gal/yd2 - Shot 0.28 (CRS-2P)Section
2
MP
367
.23
Ordered 0.28 gal/yd2 - Shot 0.27 (CRS-2P)Section
1
MP
366
.94
Ord
ered
0.2
8
Sh
ot 0
.28
MP
366
.92
Eastbo
und
MP
366
.99
Westbou
nd
MP
366
.73
Ordered 0.24 gal/yd2 - Shot 0.28 (CRS-2P)
20 lbs/yd2 (Agg - 3/8"-US No.4)
Section 2
Section 4
MP
367
.23
Centerline
Ordered 0.24 gal/yd2 - Shot 0.20 (CRS-2P)
Ordered 0.28 gal/yd2 - Shot 0.27 (CRS-2P)
20 lbs/yd2 (Agg - 3/8"-US No.4)
Section 1
Ordered 0.20 gal/yd2 - Shot 0.20 (CRS-2P)Section
3
70%
Westbound 50%
Eastbo
und
MP
366
.99
Eastbound
Embedment found on 7/9 after 7/8 application
Centerline
Westbou
nd
MP
366
.73
Second Shot - 7/9/2008
80%
MP
366
.73
Section 4
MP
367
.23
MP
367
.23
MP
366
.98
Ordered 0.24 gal/yd2 - Shot 0.20 (CRS-2P)
20 lbs/yd2 (Agg - 3/8"-US No.4)
70%
Ordered 0.20 gal/yd2 - Shot 0.20 (CRS-2P)
20 lbs/yd2 (Agg - 3/8"-US No.4)
Section 3
Ordered 0.35 gal/yd2 - Shot 0.36 (CRS-2P)Section
1-A
Ordered 0.35 gal/yd2 - Shot 0.36 (CRS-2P)Section
2-A
Ordered 0.40 gal/yd2 - Shot 0.40 (CRS-2P)
Eastbo
und
Westbou
nd
MP
366
.73
MP
367
.23
MP
366
.98
Centerline
Ordered 0.35 gal/yd2 - Shot 0.36 (CRS-2P)
4 lbs/yd2 (Agg - US No.4-0)
Section 1-A
Ordered 0.35 gal/yd2 - Shot 0.36 (CRS-2P)
20 lbs/yd2 (Agg - 3/8"-US No.4)
4 lbs/yd2 (Agg - US No.4-0)
Section 2-A22 lbs/yd2 (Agg - 3/8"-US No.4)
Section 4-A
Ordered 0.40 gal/yd2 - Shot 0.40 (CRS-2P)Section
3-A
Ordered 0.40 gal/yd2 - Shot 0.40 (CRS-2P)
20 lbs/yd2 (Agg - 3/8"-US No.4)
Eastbo
und
MP
366
.73
MP
367
.23
MP
366
.98
4 lbs/yd2 (Agg - US No.4-0)
Section 4-A
Ordered 0.40 gal/yd2 - Shot 0.40 (CRS-2P)
20 lbs/yd2 (Agg - 3/8"-US No.4)
4 lbs/yd2 (Agg - US No.4-0)
Section 3-A

Experimental Feature Report
__________________________________________________________
September 2016 30
Appendix B Double Chip Seal Construction Specification

Experimental Feature Report
__________________________________________________________
September 2016 31
(******) Double Seal The Contractor shall apply a Double Seal to Section 8 (MP 363.61 to MP 372.84) at the following rates: Undiluted Asphalt Emulsion Aggregate Aggregate (gal. per sq. yd.) (lbs.per sq. yd.) Applied Size Applied First Application: 3/8 to No. 4 0.20 3/8 to No.4 20 Second Application: 3/8 to No.4 0.35-0.40 3/8 to No.4 20 – 30 Choke Stone No. 4 to 0 4 - 6 (Target application rates are subject to charge as directed by the Engineer) The Contractor should anticipate changes to the asphalt emulsion and aggregate application rates throughout each day. The first application will consist of CRS-2P emulsion covered by 3/8 to No.4 aggregate. The second application will consist of CRS-2P emulsion covered by 3/8 to No.4 aggregate with an application rate of no. 4 to 0. The second application of bituminous surface treatment shall be applied as the first order of work the following morning when the brooming of the first bituminous surface treatment is completed.

Experimental Feature Report
__________________________________________________________
September 2016 32
Appendix C Skid Accident Reduction Program

Experimental Feature Report
__________________________________________________________
September 2016 33
Policy Statement Number: P 2035.00 Signature on file__________ May 18, 2011______________ J.C. Lenzi, P.E. Date Assistant Secretary of Engineering and Regional Operations
Skid Accident Reduction Program
I. Introduction
A. Purpose This Policy Statement provided guidance for the use of pavement friction tests collected by the Pavement Branch of the State Materials Laboratory in Tumwater.
B. Supersession This Policy Statement supersedes Interim Directive ID 55-77 Skid Accident Reduction Program dated September 29, 1994. All references to the superseded ID 55-77 now reference P 2035.00.
C. What Has Changed Direction is reworded to be more concise and clear. Direction to employees remains the same.
D. Background The October 5, 1992 amendment to the December 1991 federal aid Policy Guide Section 23 CFR 626.5 suggests that each state’s skid collision reduction program should include,”…a systematic process to identify, analyze and correct hazardous skid locations.”
In literature on pavement friction tests and skid collision location identification, there are limited studies that suggest correlation between wet weather collision rates and skid numbers below 26. No studies suggested a correlation between wet weather collision rates and skid numbers at or above 26. This information was considered in the current Skid Collision Reduction Program.
The literature maintains that collision histories are the best indicators of the cause of wet weather collisions. Wet weather collisions may be caused by complex interactions among roadway, vehicle, human, and environmental factors. Collisions may result from unpredictable factors and random variables.
____________________________________________________________________________________________
WSDOT Policy Statement P 2035.00 Page 1 of 4
Skid Collision Reduction Program

Experimental Feature Report
__________________________________________________________
September 2016 34
II. Policy Statement It is the policy of the Washington State Department of Transportation (WSDOT) to minimize the risk of wet weather skid collisions by using the Skid Collision Reduction Program as follows.
III. Information to Carry Out This Policy Statement The following rules and responsibilities are established.
A. Test Pavement Friction Every Two Years Pavement friction tests must be conducted on state routes every two years at one mile intervals to help identify potential skid collision locations.
1. Undivided roads are tested only in one direction.
2. Divided roads with fewer than three lanes are tested in both directions in the outer lane.
3. Divided roads with more than three lanes are tested in both directions in the second lance from the outside.
B. Identify and Rank Safety Needs Use these two primary sources t identify and rank statewide safety needs.
1. Crash history analyses.
2. Roadway geometric/condition modeling that uses skid number assessment. Skid numbers are considered in the development of appropriate solutions to address both collision history and potential collision locations.
C. Locations with Skid Numbers at or Below 30
Locations with skid numbers at or below 30 must be retested promptly. These retests must be completed within the same calendar year and reported to regional authorities. Corrective actions may be required depending on analyses and site inspections.
D. State Materials Laboratory The State Materials Laboratory is responsible for the following.
1. Test pavement friction on a systematic basis (ASTM E-274-Rib Tire) throughout the state highway system on a two year cycle.
2. Test newly constructed or overlaid pavement that is one lane mile or longer one month or more after completion and before the construction season ends, unless prevented by weather conditions.
3. Retest locations with skid number at or below 30 promptly.
_____________________________________________________________________________________________
Page 2 of 4 WSDOT Policy Statement P 2035.00
Skid Collision Reduction Program

Experimental Feature Report
__________________________________________________________
September 2016 35
a. Retests consist of at least five friction tests taken within one quarter mile of the point of the skid number at or below 30.
b. Retests report the original low number.
c. Retests report the average of the five retests.
4. Provide the pavement friction test results to the Regional Administrator.
E. Region Administrator The Region Administrator is responsible for the following.
1. Manage the Skid Reduction Program within the region to endure compliance with this Policy Statement.
2. Provide the pavement friction test results to the Region Operations Engineer.
3. In the absence of a Region Operations Engineer designate a position to carry out those responsibilities, and inform the Assistant Secretary.
F. Region Operations Engineer or Designee The Region Operations Engineer or designee is responsible for the following.
1. Review friction test results.
2. Compare prior pavement friction test results at or below 30 with current friction test results. Determine whether or not adverse collision history has developed at these locations. If so, check whether or not improvements have been scheduled or completed.
3. Review pavement friction test results with skid numbers at or below 30 with the Region Maintenance Engineer and Region Traffic Engineer.
4. When tests and reviews indicate if is needed coordinate construction improvements with the Region Maintenance Area Superintendent or with the Region Project Development Office.
G. Region Maintenance Area Superintendent The Region Maintenance Area Superintendent is responsible for the following.
1. Conduct joint field reviews with the Region Traffic Engineer at each site that has skid numbers are or below 30.
2. Schedule construction of the appropriate surface treatment to improve skid resistance.
a. Use state forces or contract.
b. Inform the Region Operations Engineer or designee.
3. Remove any “Slippery When Wet” signs installed and inform the Region Traffic Engineer.
___________________________________________________________________________________________
WSDOT Policy Statement P 2035.00 Page 3 of 4
Skid Collision Reduction Program

Experimental Feature Report
__________________________________________________________
September 2016 36
H. Region Traffic Engineer The Region Traffic Engineer is responsible for the following.
1. Conduct joint field reviews with the Region Maintenance Area Superintendent at each site that has skid numbers at or below 30.
2. Analyze traffic data records to determine high or potentially high risk of wet weather collision rates in those areas with skid numbers at or below 30.
3. At locations where crash rates or roadway/roadside modeling indicates that a problem exists, recommend solutions wither to the Region Operations Engineer or the Region Maintenance Area Superintendent for correction.
4. Direct installation of “Slippery When Wet” signs, when needed, at sites with average skid numbers at or below 30.
5. Direct other immediate corrective action as needed.
I. Region Program Management The Region Program Management Office is responsible to program suitable improvements at locations having a low skid number and a high collision rate, where maintenance has not yet made alterations.
IV. Contact for More Information For more information about this Policy Statement please contact the Pavement Branch of the State Materials Laboratory at 360-709-5485
V. Executive Review and Update Requirements When changes are necessary to update this Policy Statement please inform the Assistant Secretary of Engineering and Regional Operations. The Assistant Secretary of Engineering and Regional Operations periodically reviews and updates this Policy Statement.
Americans with Disabilities Act (ADA) information Materials can be provided in alternative formats by calling the ADA compliance Manager at 360-705-7097. Persons who are deaf or hard of hearing may contact that number via the Washington Relay Service at 7-1-1. _____________________________________________________________________________________________
WSDOT Policy Statement P 2035.00 Page 4 of 4
Skid Collision Reduction Program

Experimental Feature Report
__________________________________________________________
September 2016 37
Appendix D Gradation Test Results

Experimental Feature Report
__________________________________________________________
September 2016 38
Table 11. Construction quality control 3/8 inch to U.S No. 4 gradation test results.
Sieve Percent Passing
Specifications Test 1 Test 2 Test 3 ½” Square 100 100 100 100 ⅜” Square 70 – 90 84 87 82 U.S. No. 4 0 – 5 7 7 4 U.S. No. 8 0 – 3 2 2 2 U.S. No. 10 --- U.S. No. 200 0 – 1.5 1.2 1.0 1.1 % Fracture 90 99 100 100
Table 12. Construction quality control U.S No. 4 to 0 gradation test
results.
Sieve Percent Passing
Specifications Test 1 Test 2 ½” Square --- ⅜” Square 100 100 100 U.S. No. 4 76 – 100 88 86 U.S. No. 8 --- U.S. No. 10 30 – 60 54 51 U.S. No. 200 0 – 10 10.9 10.5 % Fracture 90 100 100

Experimental Feature Report
__________________________________________________________
September 2016 39
Appendix E 2015 Friction Testing Results

Experimental Feature Report
__________________________________________________________
September 2016 40
Table 13. 2015 eastbound friction results.
Milepost Direction Friction Number1 364.00 EB 33.5 364.29 EB 37.8 364.46 EB 52.3 364.50 EB 39.2 364.65 EB 25.5 364.71 EB 21.5 364.76 EB 25.2 364.95 EB 29.3 365.00 EB 32.3 365.21 EB 38.0 365.50 EB 55.3 365.81 EB 41.4 366.00 EB 39.3 366.35 EB 46.5 366.41 EB 49.2 366.50 EB 42.7 366.90 EB 18.0 366.96 EB 16.9 367.00 EB 24.3 367.05 EB 27.2 367.13 EB 37.3 367.24 EB 27.9 367.37 EB 46.5 367.49 EB 43.4 367.72 EB 30.9 368.00 EB 33.6 368.45 EB 58.0 368.50 EB 49.6 369.00 EB 57.7 369.43 EB 35.7 369.50 EB 57.3 370.00 EB 52.3 370.04 EB 22.9 370.18 EB 27.2 370.32 EB 24.8 370.50 EB 58.1 370.84 EB 31.1 371.00 EB 28.9 371.50 EB 44.4 372.00 EB 36.4 372.50 EB 58.7
1Based on a locked wheel friction tester with a ribbed tire meeting ASTM E-274 requirements.

Experimental Feature Report
__________________________________________________________
September 2016 41
Table 14. 2015 westbound friction results.
Milepost Direction Friction Number1 372.48 WB 56.3 371.98 WB 47.0 371.49 WB 40.8 371.28 WB 35.5 371.14 WB 36.9 370.99 WB 36.8 370.88 WB 39.3 370.48 WB 54.4 370.17 WB 31.1 369.99 WB 33.3 369.82 WB 34.6 369.67 WB 35.1 369.63 WB 38.0 369.55 WB 34.5 369.49 WB 34.3 369.43 WB 17.3 369.37 WB 20.2 369.32 WB 35.5 369.24 WB 27.0 369.08 WB 45.3 369.03 WB 25.0 368.99 WB 21.9 368.88 WB 28.8 368.78 WB 24.4 368.68 WB 31.1 368.58 WB 33.7 368.49 WB 23.2 368.40 WB 31.0 368.35 WB 30.9 368.18 WB 26.7 368.05 WB 25.1 367.98 WB 34.5 367.81 WB 27.9 367.72 WB 35.3 367.49 WB 38.6 367.16 WB 27.8 367.10 WB 28.4 366.99 WB 42.6 366.91 WB 27.8 366.74 WB 34.0 366.55 WB 34.3 366.49 WB 25.4 366.41 WB 31.8 366.28 WB 21.1 366.14 WB 19.0 366.09 WB 26.9 366.01 WB 29.2

Experimental Feature Report
__________________________________________________________
September 2016 42
Table 16. (continued).
Milepost Direction Friction Number1 365.90 WB 32.5 365.83 WB 29.4 365.76 WB 23.5 365.68 WB 19.7 365.64 WB 17.4 365.49 WB 40.6 365.50 WB 23.9 365.29 WB 26.7 365.12 WB 22.5 365.00 WB 40.1 364.48 WB 44.7 364.42 WB 20.1 364.29 WB 19.8 364.21 WB 17.4 363.99 WB 50.6
1Based on a locked wheel friction tester with a ribbed tire meeting ASTM E-274 requirements.

Experimental Feature Report
__________________________________________________________
September 2016 43
Appendix F Experimental Feature Work Plan

Experimental Feature Report
__________________________________________________________
September 2016 44
Washington State Department of Transportation
WORK PLAN
Double Chip Seal Evaluation
State Route 20
Contract 7914
Eastern Region Chip Seal 2010
Milepost 363.61 to Milepost 372.84
(Section 8)
Mark A. Russell Pavement Design Engineer
Washington State Department of Transportation
Kevin Littleton Eastern Region Materials Engineer
Washington State Department of Transportation

Experimental Feature Report
__________________________________________________________
September 2016 45
Introduction The section of SR 20 between milepost 363.61 and 372.84 is a bituminous surface
treatment route which was overlaid with HMA in 2000 to provide additional pavement structure.
Soon after construction, the new HMA began to flush excessively. Despite the flushing the
roadway is in good structural condition, but a surface treatment is needed to address the flushing
and friction. Placing a single chip seal on this pavement would likely result in the flushed
asphalt bleeding up through the new chip seal. In order to find a better solution WSDOT’s
Eastern Region constructed a half mile test section of double chip seal from MP 366.73 to 367.23
within this section of SR 20 in 2008 to evaluate its effectiveness at mitigating the flushing. The
results of the test section are promising resulting in the decision to place a double chip seal on
the rest of the flushing pavement. The application rates used will be those that showed the best
performance over the last two years (Table 1). This experimental feature will evaluate the
effectiveness of the double chip seal in mitigating a flushing section of HMA and preserving the
pavement on SR 20.
Table 1. Double seal application rates
Application Undiluted Asphalt Emulsion (gal/sy)
Aggregate Gradation (Std. Spec. 9-03.4)
Aggregate (lb/sy)
First (Bottom) 0.20 3/8 to No. 4 20
Second (Top) 0.35 – 0.40 3/8 to No. 4 No. 4 to 0
20 – 30 4 – 6
Scope Both lanes of SR 20 will be rehabilitated between milepost 363.61 and 372.84 using a
double chip seal. A single shot of BST will be placed over the 2008 test section to keep this
section of the highway on a coordinated schedule for treatment from MP 366.73 to 367.23.

Experimental Feature Report
__________________________________________________________
September 2016 46
Staffing This research project will be constructed as an Eastern Region programmed rehabilitation project
(the entire double seal section will be evaluated under this research study). Therefore, the
Region Project office will coordinate and manage all construction aspects. Representatives from
the WSDOT Materials Laboratory (1 – 3 people) and the Eastern Region Materials Laboratory
(1-2 people) will also be involved with the process.
Contacts and Report Authors Jeff Uhlmeyer State Pavement Engineer Washington State DOT (360) 709-5485 mailto:[email protected] Mark Russell Pavement Design Engineer Washington State DOT (360) 709-5479 [email protected] Kevin Littleton Eastern Region Materials Engineer Washington State DOT (509) 324-6170 mailto:[email protected]
Testing Pavement performance will be monitored by the following methods:
The pavement condition (structure, rutting and ride) will be surveyed annually
Friction testing will be conducted after construction then annually
The effectiveness of the double chip seal at mitigating the flushing will be evaluated
visually

Experimental Feature Report
__________________________________________________________
September 2016 47
Reporting A “Post Construction Report” will be written following completion of the double chip seal.
This report will include construction details, construction test results, actual oil and aggregate
application rates used, and other details concerning the overall process. Annual summaries will
also be conducted over the next five years. At the end of the five-year period, a final report will
be written which summarizes performance characteristics and recommendations for any future
use of this process.
Cost Estimate Construction Costs
No additional construction costs are required. This project will be constructed as a Region
pavement preservation (P1 program) project.
Testing Costs Condition surveys will be conducted as part of statewide annual survey so no additional
cost will be incurred.
Friction Testing - $2,500 post construction + $2,500 / year for 5 years = $15,000
Report Writing Costs Initial Report – 30 hours = $3,000
Annual Report – 4 hours (1 hour each) = $400
Final Report – 60 hours = $6,000
TOTAL COST = $24,400

Experimental Feature Report
__________________________________________________________
September 2016 48
Schedule Construction: June - August 2010
Date Condition
Survey (Annual)
End of Construction
Report
Annual Report
Final Report
Fall 2010 X Fall 2011 X X Fall 2012 X X Fall 2013 X X Fall 2014 X X Fall 2015 X X Spring 2016 X

Americans with Disabilities Act (ADA) Information: This material can be made available in an alternate format by emailing the Office of Equal Opportunity at [email protected] or by calling toll free, 855-362-4ADA(4232). Persons who are deaf or hard of hearing may make a request by calling the Washington State Relay at 711.
Title VI Statement to Public: It is the Washington State Department of Transportation’s (WSDOT) policy to assure that no person shall, on the grounds of race, color, national origin or sex, as provided by Title VI of the Civil Rights Act of 1964, be excluded from participation in, be denied the benefits of, or be otherwise discriminated against under any of its federally funded programs and activities. Any person who believes his/her Title VI protection has been violated, may file a complaint with WSDOT’s Office of Equal Opportunity (OEO). For additional information regarding Title VI complaint procedures and/or information regarding our non-discrimination obligations, please contact OEO’s Title VI Coordinator at (360) 705-7082.