use of automatic speech recognition in individual
TRANSCRIPT

https://doi.org/10.1177/0023830920911079
Language and Speech
Language and Speech2021, Vol. 64(1) 35 –51© The Author(s) 2020
Article reuse guidelines: sagepub.com/journals-permissionsDOI: 10.1177/0023830920911079
journals.sagepub.com/home/las
Vocabulary Size Influences Spontaneous Speech in Native Language Users: Validating the Use of Automatic Speech Recognition in Individual Differences Research
Suzanne R. JongmanMax Planck Institute for Psycholinguistics, Nijmegen, The Netherlands;Department of Psychology, University of Illinois, Urbana-Champaign, USA
Yung Han KhoeMax Planck Institute for Psycholinguistics, Nijmegen, The Netherlands;Radboud University, Nijmegen, The Netherlands
Florian HintzMax Planck Institute for Psycholinguistics, Nijmegen, The Netherlands
AbstractPrevious research has shown that vocabulary size affects performance on laboratory word production tasks. Individuals who know many words show faster lexical access and retrieve more words belonging to pre-specified categories than individuals who know fewer words. The present study examined the relationship between receptive vocabulary size and speaking skills as assessed in a natural sentence production task. We asked whether measures derived from spontaneous responses to everyday questions correlate with the size of participants’ vocabulary. Moreover, we assessed the suitability of automatic speech recognition (ASR) for the analysis of participants’ responses in complex language production data. We found that vocabulary size predicted indices of spontaneous speech: individuals with a larger vocabulary produced more words and had a higher speech-silence ratio compared to individuals with a smaller vocabulary. Importantly, these relationships were reliably identified using manual and automated transcription methods. Taken together, our results suggest that spontaneous speech elicitation is a useful method to investigate natural language production and that automatic speech recognition can alleviate the burden of labor-intensive speech transcription.
Corresponding author:Suzanne R. Jongman, Department of Psychology, University of Illinois at Urbana-Champaign, Psychology Building, 603 East Daniel Street, Champaign, Illinois 61820, USA. Email: [email protected]
911079 LAS0010.1177/0023830920911079Language and SpeechJongman et al.research-article2020
Article

36 Language and Speech 64(1)
Keywordsvocabulary size, spontaneous speech, individual differences, automatic speech recognition
1 Introduction
Psycholinguistic research on language production often focuses on tightly controlled elicited speech. This allows researchers to manipulate specific components of the production process, such as lexical access or phonological encoding, to study its effects. Word production is often studied using picture naming/description and verbal fluency tasks. In spite of the fact that these tasks test word production in an artificial setting that, arguably, does not have much in common with lan-guage production in real life, both tasks are still widely used and have led to major insights into the architecture and functionality of the production system. For example, one research program has led to the notion that there is a relationship between lexical processing abilities and an individual’s vocabulary size (Andringa et al., 2012; Mainz et al., 2017; Yap et al., 2012). When carrying out a verbal fluency task, individuals with large vocabularies were able to generate more items belong-ing to semantic categories, such as “animals,” or beginning with a given letter than individuals with small vocabularies (Unsworth et al., 2010). This advantage was also reflected in a faster onset latency for the first item participants produced in those tasks (Shao, et al., 2014).
These results fit well with the so-called entrenchment hypothesis that posits that—due to enhanced exposure to (written) language—individuals who know many words have sharper or “more entrenched” lexical representations than people with smaller vocabularies (Diependaele et al., 2013; Yap et al., 2009). On this account, access to lexical representations in large vocabularies is assumed to be facilitated such that word form information is readily available for language production and comprehension. Studies investigating the entrenchment hypothesis have focused predominantly on lexical access at the word level. In the present study, we were interested in test-ing the influence of entrenched lexical access on speaking ability at the sentence level. We asked the question: How does the size of one’s vocabulary affect language production at the sentence level? To the best of our knowledge, this question is largely unexplored.
One reason why researchers often shy away from running sentence production experiments, let alone using individual differences approaches, is that the data analysis (i.e., speech transcription) is time- and resource-consuming, involving many hours of manual labor. Moreover, for correla-tional data on the influence of vocabulary on sentence production, a task is required that yields sufficient variability among participants with regard to variables such as speech duration and choice of words. One class of tasks that might satisfy those requirements is the elicitation of spon-taneous speech. In spontaneous speech tasks, participants are provided with a cue, typically an open-ended question or a visual depiction of an event, and are instructed to answer the question or describe the event in their own words, and in their own speaking style.
Spontaneous speech elicitation has frequently been used to diagnose individuals with aphasia. Specifically, analyzing responses to open-ended questions (e.g., “Describe how your speech prob-lems started”), previous research has shown that different types of aphasia result in different dis-rupted language production patterns (Bastiaanse & Jonkers, 1998). Moreover, based on individual differences in their spontaneous speech, patients have been classified as suffering from different types of aphasia (frontotemporal lobar degeneration variants, Pakhomov et al., 2010; fluent vs. nonfluent aphasics, Wagenaar et al., 1975). Finally, the elicitation of spontaneous speech has proven useful to track treatment-associated changes in basic speech production parameters (e.g., percentage of words, mean length utterances) in aphasics receiving intensive language treatment (Grande et al., 2008).

Jongman et al. 37
A second common use of the spontaneous speech elicitation method has been to assess language proficiency in learners of a second language. For example, second language learners have been shown to speak less fluently and to be less successful in communicating their intended goal than native speakers (De Jong et al., 2007). Individual differences pertaining to communicative success (as rated by naive judges) within the group of non-native speakers were to a large extent driven by their knowledge of and processing skills in the second language (De Jong et al., 2012). To give a final example, the elicitation of spontaneous speech can also be used to identify an individual’s dominant language—even when they appear to be fully balanced bilinguals (Daller et al., 2003).
While the studies reviewed above focused on eliciting spontaneous speech in “special partici-pant populations,” there have only been a few reports describing spontaneous speech patterns in non-impaired native speakers. Those studies have predominantly investigated the relationship between age and spontaneous speech. One line of research has shown that older compared to younger adults exhibit higher lexical variability as expressed in larger diversity scores (Fergadiotis et al., 2011). Additionally, it has been reported that men but not women show age-related decline in spontaneous speech fluency (Ardila & Rosselli, 1996).
For the present purposes, the most relevant study investigating spontaneous speech in healthy native speakers was conducted by Mulder and Hulstijn (2011), who tested 98 Dutch speakers with diverse educational and professional backgrounds, aged between 18 and 76, on tests assessing lexi-cal knowledge (i.e., vocabulary size), lexical fluency, and lexical memory. The participants carried out four speaking tasks (2-minute monologues on a given topic) that varied in difficulty. Following manual transcription and linguistic analyses of participants’ speech, the recordings were evaluated by three independent raters, who assigned communicative adequacy scores to each monologue (see De Jong et al., 2012). Mulder and Hulstijn found that age did not substantially affect performance on the speaking tasks.1 Interestingly, communicative adequacy scores were predicted by all three lexical measures (knowledge, fluency, memory), with lexical knowledge making the largest con-tribution (15% of variance explained). Additionally, communicative adequacy scores were posi-tively affected by participants’ educational and professional background (for similar results see Ardila & Rosselli, 1996; Le Dorze & Bedard, 1998).
Similar to Mulder and Hulstijn (2011), one goal of the present study was to chart the variability in language abilities, including linguistic knowledge and speaking proficiency, in native adult speakers. Unlike Mulder and Hulstijn, we focused on younger participants, aged between 18 and 35 years of age. Our linguistic knowledge component of interest was vocabulary size. The moti-vation for this choice was twofold: on the one hand, we capitalized on the finding by Mulder and Hulstijn that lexical knowledge contributed most strongly to explaining variance in spontaneous speech performance (e.g., communicative adequacy scores); on the other hand, we aimed at fur-ther examining the so-called lexical entrenchment hypothesis (Diependaele et al., 2013; Yap et al., 2009). That is, given the evidence at the word level, we asked whether faster or more robust access to word form information leads to better production performance at the sentence level. Lastly, as pointed out above, language production data, in particular from spontaneous speech tasks, are very time-consuming to analyze. The final goal of the present study was therefore to assess the feasibility of using automatic speech recognition (ASR) for the analysis of language production experiments.
1.1 The present study
Inspired by Mulder and Hulstijn (2011), we recruited participants from diverse educational back-grounds. This was done to achieve sufficient variability in performance on vocabulary and sponta-neous speech tasks.

38 Language and Speech 64(1)
Our participants were provided with three questions, one at a time, and were given one minute to answer each one. Our choice for this particular type of spontaneous speech task was based on findings by Fergadiotis et al. (2011), who compared various elicitation methods and the extent to which these yielded lexically diverse responses. In their study, younger and older cognitively healthy adult participants completed four types of spontaneous speech tasks: procedure description (e.g., “Explain how to plant a tree”), picture description, storytelling, and recounts (i.e., open-ended questions, “What did you do last weekend?”). The results showed, as one might expect, that procedure and picture description resulted in a relatively restricted range of words being used. Instead, lexical diversity in both younger and older participants was strongest for open-ended ques-tions. As we aimed to assess the relationship between vocabulary size and performance on the spontaneous speech tasks, it was important to use a type of task that yields sufficient variability in participants’ responses for correlational analyses, and open-ended questions were most promising in that regard.
To assess their receptive vocabulary size, participants also completed the Peabody picture vocabulary test (PPVT). Our choice to opt for the PPVT (e.g., assessing receptive not productive vocabulary) had three reasons. First, when further investigating the so-called entrenchment hypoth-esis, we deemed it important to parallel the studies that provided the empirical basis for that account (e.g., Andringa et al., 2012; Mainz et al., 2017; Shao et al., 2014; Yap et al., 2012; in all of them, participants’ receptive rather than productive vocabulary size was assessed). Second, the PPVT is frequently used in studies assessing vocabulary size, suggesting it is well standardized, reliable, internationally recognized, and there is at least an English equivalent in case other researchers would like to replicate or extend the present results. Third, the empirical evidence suggests that receptive vocabulary size as measured using the PPVT predicted performance in both word pro-duction (e.g., Shao et al., 2014) and word comprehension tasks (e.g., Mainz et al., 2017). Thus, there was good reason to expect a correlation between receptive vocabulary size and speaking performance, which was a prerequisite for addressing our research question.
Based on the study by Mulder and Hulstijn (2011) and based on findings from verbal fluency tasks (Shao et al., 2014; Unsworth et al., 2010), we hypothesized that on the spontaneous speech tasks, individuals with larger vocabularies would produce more lexically diverse responses than individuals who know fewer words. Furthermore, given the word-level effects that led to the for-mulation of the entrenchment hypothesis (i.e., faster and more robust access to word form informa-tion; Diependaele et al, 2013; Yap et al., 2009), one might expect that a large vocabulary would be associated with superior speaking ability, where consistently fast access to word forms leads to overall more words being produced and possibly fewer pauses.
Given these predictions, we operationalized participants’ speaking ability as four measures extracted from their spontaneous speech responses (see Table 1 for an overview). Importantly, we used measures that could be calculated by both human transcribers and the ASR. Note for example that communicative adequacy as operationalized in Mulder and Hulstijn (2011) required insights about communicative goals that an ASR cannot attain. Similarly, measures capturing semantic or syntactic complexity of speech were not feasible, because the ASR used here returns a list of single words and does not provide information on phrase or sentence boundaries. Therefore, no informa-tion on utterance length or utterance complexity was available. Furthermore, the ASR used for the present analyses is not suited to transcribe hesitations, disfluencies, or speech errors. For instance, hesitations such as “ehm” the ASR will either try to match to existing words or transcribe as pauses. It is important to point out that it is not our intention to show that the particular ASR used here should be the gold standard for psycholinguistic research, rather we wish to show a proof-of-concept that computer-generated transcripts can reliably reveal individual differences in spontane-ous language production.

Jongman et al. 39
The first measure we extracted is called “moving-average type-token ratio” (MATTR, Covington & McFall, 2010) and is assumed to index the lexical diversity within individuals’ speech samples. A recent study compared four measures of lexical diversity (MATTR, type-token ratio, hypergeo-metric distribution, measure of textual lexical diversity) and showed that MATTR had the best construct validity and was the best indicator of lexical diversity (Kapantzoglou et al, 2019). The measure is calculated by moving a window of a given length through the text produced, calculating the type-token ratio (ratio between the number of unique words and the number of words in total) for each window, and subsequently computing the average type-token ratio over all windows. The advantage of MATTR over the conventional type-token ratio (calculated for the entire text) is that text length is taken into account. Higher MATTR values indicated more lexical diversity in an individual’s response. We hypothesized that individuals with larger vocabularies would produce more diverse responses than individuals with smaller vocabularies. Thus, we expected a positive correlation between PPVT scores and MATTR values, as one would expect given the previous finding that individuals with large vocabularies generate more items during word-level verbal flu-ency tasks (Unsworth et al., 2010).
Inspired by Mulder and Hulstijn (2011), the second measure we extracted was “number of words” (Nwords). Similar to these authors, we used Nwords as a broad measure for the amount of speech that participants produced in the time given, leaving aside lexical diversity or other word characteristics. Mulder and Hulstijn (2011; see also Ardila & Rosselli, 1996, for a similar finding) reported that par-ticipants with higher schooling had a larger vocabulary and produced more words in the spontaneous speech tasks. Here, we tested the relationship between vocabulary knowledge and number of words produced directly. In line with previous findings that led to the formulation of the entrenchment hypothesis (Diependaele et al, 2013; Yap et al., 2009), we predicted that individuals with large vocab-ularies (i.e., engaging sharpened lexical representations) access and produce words faster than indi-viduals with smaller vocabularies, leading to a larger number of overall words produced.
Finally, we extracted two measures that capture individuals’ speech fluency. As discussed previ-ously, the entrenchment hypothesis states that individuals with larger vocabularies have more robust or precise lexical representations, which arguably leads to quicker access. Experimental evidence for this claim comes from a study on word production demonstrating that having a larger vocabulary was associated with shorter onset latencies for the first item on verbal fluency tasks (Shao et al., 2014). We predicted that such a word-level benefit would percolate up to influence sentence-level performance. The first measure extracted to tap speech fluency was “speech-silence ratio” (SS ratio, sometimes referred to as “pause-to-word ratio,” Pakhomov et al., 2010; “phona-tion/time ratio,” Cucchiarini et al., 2002; De Jong et al., 2007), which is frequently used in studies on speaking abilities and which captures the extent to which participants were speaking and to which they were silent (e.g., pausing) during the recording. Given the reasoning above, individuals with larger vocabularies were predicted to have faster access to words and were thus predicted to pause less long in between words than individuals with a small vocabulary. A larger SS ratio reflected fewer pauses.
Table 1. Overview of spontaneous speech measures.
Measure Abbreviation
Moving-average type-token ratio MATTRNumber of words NwordsSpeech-silence ratio SS ratioNumber of syllables per second of speech Sylrate

40 Language and Speech 64(1)
The other measure tapping speaking fluency2 was articulation rate, as indexed by the number of syllables produced per second of speech. We refer to this measure as “syllable rate” (Sylrate). Among others, Sylrate has previously been used to assess speaking fluency in a foreign language (e.g., De Jong et al., 2007; Jacewicz et al., 2009; Wang & Narayanan, 2007). Here, we predicted that faster access to word form information, as associated with larger vocabularies (in line with the entrenchment hypothesis), would also affect syllabification and, eventually, articulation processes involved in producing a word (Levelt et al., 1999). More specifically, faster access to word form information should result in a higher speaking rate.
2 Method
2.1 Participants
A total of 132 participants (97 female, 35 male; mean age = 21 years, SD = 3, range 18 to 34) were tested, recruited from two participant pools. Eighty participants were taken from the participant database of the Max Planck Institute for Psycholinguistics (60 female, 20 male; mean age = 23 years, SD = 3, range 19 to 34). We selected students or recent graduates from Radboud University Nijmegen or the Hogeschool van Arnhem en Nijmegen (University of Applied Sciences). The remaining 52 participants were students at a vocational college in Amersfoort, for example training to become secretaries or carpenters (mean age = 19 years, SD = 1, range 18 to 21). All participants were native speakers of Dutch. Participants gave written informed consent to take part in the study and were paid for participation. Permission to conduct the study was provided by the Ethics Board of the Social Sciences Faculty of Radboud University. Data from four participants were removed as those participants demonstrated lack of motivation during testing. This left data from 128 participants.
2.2 General procedure
University students were tested individually on all tests in a quiet room at the Max Planck Institute. Vocational college students were tested at their school in a classroom. Each student was provided with a laptop and headphones. The vocabulary test was completed in groups ranging between 11 and 18 participants. The subsequent recordings for the spontaneous speech task were always done in solitude. Prior to the PPVT, all participants completed a new, adaptive test to assess receptive vocabulary size. Participants were presented with written test words and had to indicate whether they know the word or not. Depending on their response, the next word was either easier or more difficult. At the point of testing, this test was still under development and the data collected were used to refine its design and to determine its reliability. Thus, we do not report the results. The order of tasks was identical for all participants: the test under development, PPVT, and the sponta-neous speech task.
2.3 Peabody picture vocabulary test (PPVT)
To assess participants’ receptive vocabulary size, we used a digitized version of the Dutch Peabody picture vocabulary test (Dunn & Dunn, 1997; Dutch translation by Schlichting, 2005). On each trial, participants first previewed four numbered line drawings on their screen. When they were ready, they pressed the Return key on their keyboard to hear the probe. They had to indicate which of the pictures best corresponded to the meaning of the spoken word by typing the corresponding

Jongman et al. 41
number (1, 2, 3, or 4). Following the standard protocol for the test, items were presented in blocks of 12, with blocks increasing in difficulty. The starting level was 13, the highest level participants could attain was 17. The test ended when a participant made nine or more errors within one block. The experiment lasted 12 minutes on average. For each participant, a percentile score was calcu-lated based on Dutch norms, taking into account their raw score and age at the time of testing. Test reliability, operationalized as Cronbach’s alpha based on all items in blocks 13 through 17, was very high (α = .93).
2.4 Spontaneous speech task
2.4.1 Elicitation. Spontaneous speech was elicited by asking three open-ended questions (inspired by Kemper et al., 2005; Staiger & Ziegler, 2008). The questions were presented one at a time, and participants were given one minute to answer each. The first question asked what the participant did last weekend (Dutch: “Wat heb je afgelopen weekend gedaan?”). The second question asked the participant to describe the plot of a movie or book recently watched/read (Dutch: “Vertel de verhaallijn van een film die je recentelijk hebt gezien of van een boek dat je hebt gelezen”). Finally, they were asked to describe their perfect holiday (Dutch: “Vertel hoe jouw perfecte vakantie eruit zou zien”). Before the task, participants were encouraged to “make up stories” (e.g., about their last weekend) in case they did not want to share personal information. At the end of the experiment, the experimenter verbally explained that the study investigates individual differences in speaking freely and asked whether the participant felt comfortable answering the three questions. None of the participants mentioned during the debriefing that they felt uncomfortable about the questions’ level of intimacy. However, it cannot be ruled out that individual differences in willingness to share personal information or other personality traits, independent of one’s vocabulary size, such as creativity or extraversion contributed to the variance in participants’ spontaneous speech. Spe-cifically, one possibility is that more creative people could potentially conceptualize quicker what to respond to the questions than less creative people.
2.4.2 Human-generated transcripts. Seven research assistants manually transcribed the spontaneous speech recordings using Praat (Boersma & Weenink, 2012). They marked onsets and offsets of words and other vocalizations (ehms).
2.4.3 Computer-generated transcripts. To obtain computer-generated transcripts of the recordings, we used a deep neural network hidden Markov model ASR system for Dutch, developed by the Centre for Language and Speech Technology at Radboud University, Nijmegen (for more details see McLaren et al, 2018; Yılmaz et al., 2016). This ASR is available as a web service, such that users may upload the to-be-transcribed WAV files to the server. Following ASR transcription of the WAV files, the transcripts may be downloaded to disc.3
A total of 384 audio files (128 participants, 3 questions) were transcribed. For each WAV file, the ASR returned a text file containing the transcription of the recorded speech. In addition, an Extensible Markup Language (i.e., XML) file provided a confidence rating (ranging between 0.00 and 1.00), duration, and time for each word. The output returned by the ASR is essentially the same as that created by the human coders. Both files included the word transcriptions and the onset and offset time of each coded word. Pauses were calculated as the time from onset word n + 1 minus the offset of word n. The only difference between the two types of transcript was that the ASR did not transcribe hesitations or disfluencies, as these were either matched to existing words or tran-scribed as pauses.

42 Language and Speech 64(1)
2.4.4 Measures of speaking ability. For each participant, we extracted MATTR, Nwords, SS ratio, and Sylrate from computer- and human-generated transcripts. As explained above, MATTR was calculated by moving a window of a fixed length (here 26 tokens, the minimal length found in our sample) through the text, calculating the type-token ratio for each successive window, and subse-quently computing the average type-token ratio over all windows. Number of words was opera-tionalized as the total number of words identified by either the ASR or the human annotators. SS ratio was calculated by dividing the amount of speech by the amount of silence (both in seconds) in the recording. Syllable rate was calculated by linking our transcripts to the CELEX word forma-tion list (Baayen et al., 1996) and calculating the number of syllables per second of speech.
2.4.5 Analyses. For each participant, responses to questions were removed for which the mean ASR-internal confidence rating (calculated over all words recognized in a given response) was below 80% or where the participant spoke for less than 30 seconds as indicated by the ASR-based speech duration (offset last word minus onset first word; cf. Mulder & Hulstijn, 2011). These exclusion criteria ensured that the remaining trials contained both sufficient and clear speech mate-rial (Tables 2 and 3).
2.4.6 ASR accuracy. For evaluating the ASR’s accuracy in transcribing the speech recordings, we took the human-generated transcripts as the reference, against which we compared computer-generated transcripts. To that end, we used word error rate (WER), a common metric for computer translation systems, referring to the sum of word substitutions, deletions, and insertions required to transform the to-be-evaluated transcript into the reference. The resulting number is divided by the total number of words in the reference. A WER of 0 is the best possible value as it indicates the two transcripts are identical (no divergence from the reference). Values further away from 0 indicate greater deviation. Deviations of 20 to 25 are standard for transcriptions based on unrestricted sources, such as broadcast news (Gauvain et al., 2002) or lectures (Kato et al., 2000). Furthermore, transcripts with WER of 25 show good task success and score well on user satisfaction (Munteanu et al., 2006), whereas poor performance and unsatisfactory scores start to increase with WER exceeding 35 (Sanders et al., 2002). Thus, we accept recordings with a WER of 0 to 25 as good transcriptions, between 25 and 35 as adequate, and anything beyond 35 as unsatisfactory. For each participant and each question, we calculated WER separately. We tested whether questions differed in ASR accuracy using a repeated-measures ANOVA.
As a second measure of ASR transcription accuracy, we conducted two-tailed Pearson’s correla-tions between the MATTR, Nwords, SS ratio, and Sylrate measures extracted from the human-generated transcripts and those extracted from the computer-generated transcripts. Correlations were performed separately for each question. The strength of the correlations might be considered an index of how well a given measure, in the context of spontaneous speech elicitation, is suited to be transcribed by an ASR, or whether it may require manual coding. (For a similar correlational approach to evaluate transcription accuracy, see Ziman et al., 2018.) As we planned to carry out correlations for many measures of interest, we applied a Bonferroni correction (four measures and three questions resulted in a corrected alpha level of 0.05/12 = 0.004).
Finally, we also assessed the reliability of our measures by calculating Cronbach’s alpha between the three questions of each of our measures, separate for the human-generated and com-puter-generated transcripts. We take values over 0.70 to indicate acceptable reliability (Tavakol & Dennick, 2011).
2.4.7 Individual differences. We tested for the four measures (MATTR, Nwords, SS ratio, Sylrate) whether vocabulary scores substantially contributed to explaining variance in the measure in

Jongman et al. 43
question. We further tested whether—qualitatively speaking—the statistical contributions of par-ticipants’ vocabulary scores were the same in the measures extracted from human- and computer-generated transcripts.
To that end, we fitted separate linear-mixed effects models for each spontaneous speech meas-ure, using R (R Core Team, 2012) and the R packages lme4 (Bates et al., 2013) and languageR (Baayen, 2011). For each measure, values 2.5 standard deviations away from the group’s mean were removed. In each model, Question was included as a random effect. PPVT was added as a continuous predictor (centered) to the model. Whether PPVT performance statistically contributed to explaining variance in the dependent variable was assessed by comparing models with and with-out the predictor using likelihood ratio tests.
3 Results
Five trials (1.3%) were removed because ASR confidence ratings were below 80%, and 15 trials (3.9%) were excluded due to speech durations shorter than 30 seconds.
3.1 ASR accuracy
Table 2 shows the ASR-internal confidence score and WER statistics for each of the three ques-tions. Overall, accuracy for the computer-generated transcriptions was good as the average WER was 24.03. Moreover, WER did not differ across the three questions (F < 1).
The lowest correlation between computer-generated and human-generated transcripts (Table 3, for an overview) for any of the four measures and any of the three questions was r = 0.76, indicating
Table 2. ASR-internal confidence scores and word error rates (WERs) for each of the open-end questions.
Question ASR confidence WER
Mean SD Range Mean SD Range
Weekend 0.90 0.03 0.80 – 0.97 24.92 9.14 9.28 – 58.60Film/Book 0.90 0.03 0.80 – 0.96 23.56 9.95 7.52 – 74.44Holiday 0.90 0.03 0.80 – 0.97 23.64 8.84 5.26 – 54.55
Note: A WER of 0 is the best possible value indicating both transcripts are identical (no divergence from the reference). Values further away from 0 indicate greater deviation. Deviations of 20 to 25 are standard for transcriptions based on unrestricted sources.
Table 3. Pearson correlations between human-generated and computer-generated measures of interest, for each question separately.
Measure Weekend Film/Book Holiday
MATTR .77** .78** .85**Nwords .96** .93** .95**SS ratio .84** .76** .84**Sylrate .94** .90** .92**
*p-value smaller than corrected alpha level of 0.004.**p-value smaller than 0.001.

44 Language and Speech 64(1)
Table 4. Descriptive statistics for spontaneous speech measures (averaged across all questions). Reliability was operationalized as Cronbach’s alpha.
Measure Human-generated transcription ASR-generated transcription
Mean SD Range Reliability Mean SD Range Reliability
MATTR 0.82 0.07 0.48 – 1 .53 0.83 0.07 0.57 – 1 .59Nwords 139.58 33.70 13 – 234 .85 132.07 32.48 15 – 225 .83SS ratio 2.92 1.62 0.11 – 9.97 .92 1.76 0.88 0.07 – 6.63 .85Sylrate 3.53 0.69 0.72 – 5.39 .84 3.35 0.66 0.75 – 4.97 .80
Table 5. Model estimates for PPVT scores as a predictor of each of the spontaneous speech measures for human-generated and computer-generated transcripts.
Measure Human-generated transcripts Computer-generated transcripts
Estimate Standard error
t-value R-squared* Estimate Standard error
t-value R-squared*
MATTR 0.00 0.00 −0.27 − 0.00 0.00 1.87 −Nwords 0.15 0.07 2.06 3.5% 0.19 0.07 2.70 6.5%SS ratio 0.01 0.00 2.58 4.7% 0.01 0.00 3.20 6.7%Sylrate 0.00 0.00 1.32 − 0.00 0.00 1.64 −
*R-squared estimated for linear model with scores per participants averaged over questions. Vocabulary size did not explain significant amounts of variance in MATTR and Sylrate, hence no r-squared values are provided.
Table 6. Model comparisons.
Measure Human-generated transcripts Computer-generated transcripts
% trials removed Null versus PPVT % trials removed Null versus PPVT
MATTR 4.9 χ2(1) = 0.07, p = 0.78 3.8 χ2(1) = 3.50, p = 0.06Nwords 2.5 χ2(1) = 4.21, p = 0.04* 2.5 χ2(1) = 7.23, p = 0.007**SS ratio 3.0 χ2(1) = 6.61, p = 0.01* 2.5 χ2(1) = 10.11, p = 0.001**Sylrate 2.5 χ2(1) = 1.74, p = 0.19 2.5 χ2(1) = 2.69, p = 0.10
strong relationships overall. Descriptive statistics for the four measures, including reliability across questions (operationalized as Cronbach’s alpha), are shown in Table 4. It has to be noted that even though the correlations between computer- and human-generated transcripts for MATTR were strong, the measure had poor reliability (α = .53).
3.2 Vocabulary and spontaneous speech performance
For each spontaneous speech measure, we determined whether PPVT performance was a signifi-cant predictor. The best-fitting models are presented in Table 5, and the model comparisons are presented in Table 6. For two of the four measures, namely Nwords and SS ratio, models based on both human- and computer-generated transcripts showed an effect of vocabulary size as meas-ured with the PPVT. That is, individuals with a larger vocabulary produced more words overall

Jongman et al. 45
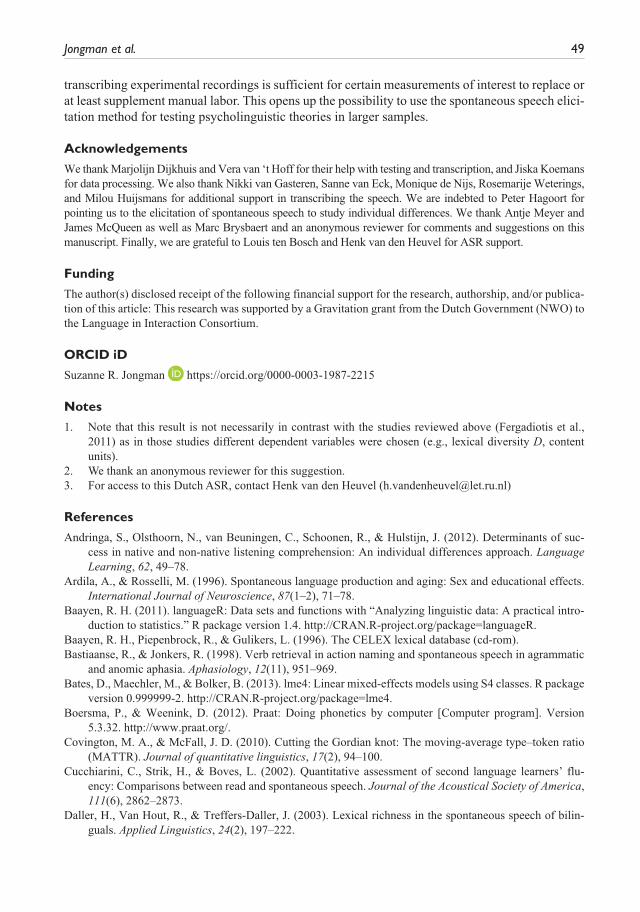
and spoke longer (compared to silent periods), relative to individuals with a smaller vocabulary. The lexical diversity in participants’ spontaneous speech responses, operationalized as “moving-average type-token ratio,” and their speaking fluency, operationalized as “syllables produced per second of speech,” were not influenced by the size of their receptive vocabulary. Figure 1 features scatterplots showing the relationship between PPVT and the speech measures. The two student groups, university students and vocational college students, are presented in different shades of grey to visually show that the relationship between PPVT and the speech measures is similar for the two groups, motivating our decision to analyze the two groups together as one homogeneous group.
4 Discussion
There is substantial variation in the way that people produce sentences. Some are fast talkers, oth-ers speak rather slowly. Some use a variety of words, others do not. Even though the notion of individual differences in language production is uncontroversial, not many studies have investi-gated the mechanisms underlying this variability.
Figure 1. Scatterplots showing relationship between PPVT scores and spontaneous speech measures (ASR).

46 Language and Speech 64(1)
4.1 Vocabulary size explains variation in spontaneous speech production
By administering a receptive vocabulary test and three open-ended questions to elicit spontaneous speech, we aimed to investigate one potential source for individual differences in the production of connected speech. That is, we tested if variation in spontaneous speech can be explained, in part, by individuals’ vocabulary size.
In line with previous research, we observed that two of our four speaking proficiency measures were influenced by vocabulary size. Individuals with a large vocabulary produced more words in the time given and had a larger speech-silence ratio—that is, spoke longer than they were silent—than individuals with a smaller vocabulary. This pattern resonates with previous results from verbal fluency tasks, where individuals with larger vocabularies generated more items (Unsworth et al., 2010) and initiated the first response earlier (Shao et al., 2014).
In general, these results tie in with a growing body of literature demonstrating a beneficial rela-tionship between language processing and the size of one’s vocabulary. Previous studies have shown that individuals with larger rather than smaller vocabularies responded faster and more accurately to words in lexical decision tasks (e.g., Andringa et al., 2012; Mainz et al., 2017; Yap et al., 2012). The fact that having a larger vocabulary is beneficial for production and comprehension is somewhat surprising. One could argue that retrieving an item from a large vocabulary, where many words compete for lexical selection (thereby slowing down the selection process, see also Milin et al., 2017), should delay rather than facilitate production or comprehension. It has been suggested that individuals with a larger vocabulary—in addition to knowing more words—have more entrenched lexical representations that could either be more robust or more precise in nature (Diependaele et al., 2013; Yap, et al., 2009). The hypothesis is that stronger lexical entrenchment results in quicker access to a representation, which would explain the word-level processing benefit.
How could more entrenched lexical representations be beneficial for spontaneous speech pro-duction at the sentence or discourse level? When addressing this question, one must consider the processes that underlie sentence processing. Most models of sentence production (e.g., Bock, 1995; Bock & Levelt, 1994; Ferreira & Slevc, 2007; Garrett, 1980, 1982, 1988) postulate three core components: (a) a message component (also: message encoding), encoding the message the speaker wants to convey; (b) a grammatical component (also: grammatical encoding), transform-ing the speaker’s thoughts into syntactic and lexical units and preparing the phonological spell-out; and (c) a phonological component (also: phonological and phonetic encoding), encoding sound and stress patterns of the to-be-produced utterance. Based on the present results, we cannot deter-mine the locus of the “large-vocabulary advantage” in spontaneous speech performance. Future research is needed to conduct targeted follow-up experiments and delineate its effect on the three main components.
However, given the pattern of the present results, we may speculate. Generalizing from the word-level findings, it is conceivable that individuals with large vocabularies benefitted from quick access to word forms and in turn were able to quickly complete the grammatical encoding stage during sentence production. Another possibility hinges on the previously reported positive correlation between vocabulary size and event knowledge. That is, individuals who know many words are also likely to have a multitude of detailed mental representations of events occurring in the real world. The importance of this type of knowledge for language processing is well docu-mented (e.g., Hare et al., 2009; Zwaan & Radvansky, 1998). It is conceivable that individuals with large vocabularies (leading to a rich set of event representations) are better at conceptualizing what to respond to the three questions and how to put their thoughts into sentences as they might rely on mental simulations of events, quickly making available objects and people participating in a given event.

Jongman et al. 47
All of these options can be explored in future studies, which we advise should make use of ASR for obtaining (spontaneous) speech transcriptions. Moreover, we also suggest to complement the set of vocabulary and spontaneous speech tasks with tasks that tap at least some of the individuals’ general cognitive abilities, such as non-verbal processing speed, non-verbal intelligence, or work-ing memory. For example, the results from these tasks could be used to address to what extent the high speech-silence ratios observed in individuals with large vocabularies in the present study were driven by them being “fast overall.”
We observed neither a relationship between participants’ vocabulary size and the lexical diver-sity in their responses, nor between vocabulary size and the number of syllables produced per second. Note, however, that the measure indexing lexical diversity (MATTR)—at least in our study—had poor reliability, which could be an explanation for why no effect of vocabulary size was observed. The poor reliability was a surprise given that MATTR was previously found to have good construct validity (Kapantzoglou et al., 2019). One post-hoc explanation could be that the poor reliability might have been due to our speech samples being too short to obtain reliable esti-mates. Future studies could consider to elicit fragments of speech lasting longer than one minute to see if this increases reliability and whether the absence of a correlation between vocabulary size and lexical diversity persists. The lack of an effect of vocabulary size on number of syllables pro-duced per second of speech, which had high reliability, suggests on the other hand that entrenched lexical access might not affect (or to a negligible degree) the lower-level processes (e.g., syllabifi-cation, articulation) involved in producing a word. Future research is needed to confirm this speculation.
4.2 Using spontaneous speech elicitation and ASR in individual differences research
As implied above, our results demonstrate that spontaneous speech—a more natural form of speech elicitation than verbal fluency or picture naming—is capable of capturing subtle differences in language production in a group of younger adults. Most previous studies have used spontaneous speech as a diagnostic tool and have successfully identified individual differences in patient groups (i.e., Bastiaanse & Jonkers, 1998), second language learners (i.e., Daller et al., 2003) or older adults (i.e., Ardila & Rosselli, 1998). We extend this literature and show that spontaneous speech can also make a useful contribution to research on healthy young native speakers.
Importantly, the fact that the measures taken from human- and computer-generated transcripts yielded very similar results opens up the possibility for large-scale individual differences studies using the spontaneous speech elicitation method. In fact, the correlations between human- and computer-generated transcripts were high for all four measures. The use of an ASR to transcribe speech recordings might thus save human resources and significantly speed up the analysis process.
It must be pointed out that high agreement between human- and computer-generated transcripts depends on the measure of interest. We purposefully decided not to investigate disfluencies such as “ehms” as it was obvious already at first glance that these were hardly, if ever, present in the ASR output. Instead of coding the disfluency, the ASR tried to match it to an existing word or mark it as a pause. Note that the poor performance on transcribing disfluencies and pauses is a specific limita-tion for the ASR used in the present study; other ASRs may be better suited for these two types of measure.
We used an ASR developed at the Radboud University, Nijmegen (for details see McLaren et al., 2018, Yılmaz et al., 2016). This speech recognizer is available upon request, and evidently is well equipped to transcribe Dutch spontaneous speech. It was not our goal, however, to critically

48 Language and Speech 64(1)
evaluate this specific ASR. Instead, we intend to provide a proof-of-concept that an ASR can be used to analyze certain aspects of spontaneous speech, allowing for large-scale use of natural speech for research ends. A similar approach has recently been taken by Ziman et al. (2018), who showed that an ASR can be used reliably to transcribe speech data from psychological experi-ments, in their case a verbal recall memory test. In their study, Ziman and colleagues provided the speech context to their speech-to-text engine. All the items on the word lists participants were required to remember were passed to the engine. This considerably alleviates the effort a speech recognizer is faced with. Our study shows that it is not necessary to provide a speech context to obtain reliable ASR results (at least for our measures of interest).
4.3 Limitations and future research
Pertaining to limitations of the present study, we must mention that the experimental setting was not identical for all participants as is typically the standard in studies on individual differences. Vocational college students carried out the vocabulary tests in a group setting, whereas the univer-sity students performed all tasks in isolation. We cannot exclude the possibility that the difference in vocabulary task administration affected vocational college students’ performance on those tests in one way or another. Even though we deem this possibility unlikely (three experimenters super-vised each test session and ensured a quiet and minimally distracting test environment), it is impor-tant to highlight that whatever the consequences of this difference, it appears to have influenced the linear relationship between PPVT scores and the spontaneous speech measures minimally. That is, the scatterplots in Figure 1—featuring university and vocational college students—mostly suggest a homogenous rather than bi-modal distribution of PPVT scores and spontaneous speech indices in both groups.
Second, we used only one vocabulary test. We assessed vocabulary size using a receptive task, where individuals matched a heard word to one of four pictures. In order to obtain a “purer” meas-ure of an individual’s vocabulary size or to explore potential differences across tests, one might consider administering a second receptive vocabulary test or a productive vocabulary test, where individuals are required to generate items after a given cue (i.e., in an antonym task the cue “hot” is given, and “cold” should be generated).
Third, we chose three open-ended questions to elicit spontaneous speech, which had previously been shown to yield lexically diverse responses (Fergadiotis et al., 2011). However, such uncon-strained responses may reflect not only linguistic differences between individuals, but also person-ality traits such as willingness to share personal information. None of the participants indicated to feel uncomfortable regarding the questions, but this may still have been the case. Other personal traits could have exerted an influence as well. For instance, it has been shown that differences in temporal aspects of speech are related to extraversion (Ramsay, 1968). When conducting a study that capitalizes on speech fluency (not speaking proficiency in general), we advise to use a more constrained elicitation method such as picture description.
5 Conclusion
All in all, the present study adds to a growing body of literature demonstrating a relationship between an individual’s vocabulary size and their language production abilities. We extend the so-called entrenchment hypothesis from the word level to the sentence level. Specifically, we pro-vided experimental evidence from a spontaneous speech task for the notion that individuals with larger vocabularies produced more words and had a higher speech-silence ratio compared to indi-viduals with a smaller vocabulary. Moreover, we have shown that the accuracy of ASRs in
Jongman et al. 49
transcribing experimental recordings is sufficient for certain measurements of interest to replace or at least supplement manual labor. This opens up the possibility to use the spontaneous speech elici-tation method for testing psycholinguistic theories in larger samples.
Acknowledgements
We thank Marjolijn Dijkhuis and Vera van ‘t Hoff for their help with testing and transcription, and Jiska Koemans for data processing. We also thank Nikki van Gasteren, Sanne van Eck, Monique de Nijs, Rosemarije Weterings, and Milou Huijsmans for additional support in transcribing the speech. We are indebted to Peter Hagoort for pointing us to the elicitation of spontaneous speech to study individual differences. We thank Antje Meyer and James McQueen as well as Marc Brysbaert and an anonymous reviewer for comments and suggestions on this manuscript. Finally, we are grateful to Louis ten Bosch and Henk van den Heuvel for ASR support.
Funding
The author(s) disclosed receipt of the following financial support for the research, authorship, and/or publica-tion of this article: This research was supported by a Gravitation grant from the Dutch Government (NWO) to the Language in Interaction Consortium.
ORCID iD
Suzanne R. Jongman https://orcid.org/0000-0003-1987-2215
Notes
1. Note that this result is not necessarily in contrast with the studies reviewed above (Fergadiotis et al., 2011) as in those studies different dependent variables were chosen (e.g., lexical diversity D, content units).
2. We thank an anonymous reviewer for this suggestion.3. For access to this Dutch ASR, contact Henk van den Heuvel ([email protected])
References
Andringa, S., Olsthoorn, N., van Beuningen, C., Schoonen, R., & Hulstijn, J. (2012). Determinants of suc-cess in native and non-native listening comprehension: An individual differences approach. Language Learning, 62, 49–78.
Ardila, A., & Rosselli, M. (1996). Spontaneous language production and aging: Sex and educational effects. International Journal of Neuroscience, 87(1–2), 71–78.
Baayen, R. H. (2011). languageR: Data sets and functions with “Analyzing linguistic data: A practical intro-duction to statistics.” R package version 1.4. http://CRAN.R-project.org/package=languageR.
Baayen, R. H., Piepenbrock, R., & Gulikers, L. (1996). The CELEX lexical database (cd-rom).Bastiaanse, R., & Jonkers, R. (1998). Verb retrieval in action naming and spontaneous speech in agrammatic
and anomic aphasia. Aphasiology, 12(11), 951–969.Bates, D., Maechler, M., & Bolker, B. (2013). lme4: Linear mixed-effects models using S4 classes. R package
version 0.999999-2. http://CRAN.R-project.org/package=lme4.Boersma, P., & Weenink, D. (2012). Praat: Doing phonetics by computer [Computer program]. Version
5.3.32. http://www.praat.org/.Covington, M. A., & McFall, J. D. (2010). Cutting the Gordian knot: The moving-average type–token ratio
(MATTR). Journal of quantitative linguistics, 17(2), 94–100.Cucchiarini, C., Strik, H., & Boves, L. (2002). Quantitative assessment of second language learners’ flu-
ency: Comparisons between read and spontaneous speech. Journal of the Acoustical Society of America, 111(6), 2862–2873.
Daller, H., Van Hout, R., & Treffers-Daller, J. (2003). Lexical richness in the spontaneous speech of bilin-guals. Applied Linguistics, 24(2), 197–222.

50 Language and Speech 64(1)
De Jong, N. H., Steinel, M., Florijn, A. F., Schoonen, R., & Hulstijn, J. H. (2007). The effect of task com-plexity on fluency and functional adequacy of speaking performance. In S. Van Daele, A. Housen, M., Pierrard, F. Kuiken, & I. Vedder (Eds), Complexity, accuracy and fluency in second language use, learning, and teaching (pp. 53–63). Brussels: Koninklijke Vlaamse Academie van België voor Wetenschappen en Kunsten.
De Jong, N. H., Steinel, M. P., Florijn, A. F., Schoonen, R., & Hulstijn, J. H. (2012). Facets of speaking pro-ficiency. Studies in Second Language Acquisition, 34(1), 5–34.
Diependaele, K., Lemhöfer, K., & Brysbaert, M. (2013). The word frequency effect in first-and second-language word recognition: A lexical entrenchment account. Quarterly Journal of Experimental Psychology, 66(5), 843–863.
Dunn, L., & Dunn, L. (1997). PPVT-III: Peabody picture vocabulary test: American Guidance Service.Fergadiotis, G., Wright, H. H., & Capilouto, G. J. (2011). Productive vocabulary across discourse types.
Aphasiology, 25(10), 1261–1278.Gauvain, J.-L., Lamel, L., & Adda, G. (2002). The LIMSI Broadcast News transcription system. Speech
Communication, 37(1), 89–108.Grande, M., Hussmann, K., Bay, E., Christoph, S., Piefke, M., Willmes, K., & Huber, W. (2008). Basic
parameters of spontaneous speech as a sensitive method for measuring change during the course of aphasia. International Journal of Language and Communication Disorders, 43(4), 408–426.
Hare, M., Jones, M., Thomson, C., Kelly, S., & McRae, K. (2009). Activating event knowledge. Cognition, 111(2), 151–167.
Jacewicz, E., Fox, R. A., O’Neill, C., & Salmons, J. (2009). Articulation rate across dialect, age, and gender. Language Variation and Change, 21(2), 233–256.
Kapantzoglou, M., Fergadiotis, G., & Auza Buenavides, A. (2019). Psychometric evaluation of lexical diver-sity indices in Spanish narrative samples from children with and without developmental language disor-der. Journal of Speech, Language, and Hearing Research, 62(1), 70–83.
Kato, K., Nanjo, H., & Kawahara, T. (2000, October 16–20). Automatic transcription of lecture speech using topic-independent language modeling. Paper presented at the Sixth International Conference on Spoken Language Processing. ICSLP-2000, Beijing, China.
Kemper, S., Herman, R. E., & Nartowicz, J. (2005). Different effects of dual task demands on the speech of young and older adults. Aging, Neuropsychology, and Cognition, 12(4), 340–358.
Le Dorze, G., & Bedard, C. (1998). Effects of age and education on the lexico-semantic content of connected speech in adults. Journal of Communication Disorders, 31(1), 53–71.
Levelt, W. J., Roelofs, A., & Meyer, A. S. (1999). A theory of lexical access in speech production. Behavioral and Brain Sciences, 22(1), 1–38.
Mainz, N., Shao, Z., Brysbaert, M., & Meyer, A. S. (2017). Vocabulary knowledge predicts lexical pro-cessing: Evidence from a group of participants with diverse educational backgrounds. Frontiers in Psychology, 8, 1164.
McLaren, M., Castan, D., Nandwana, M. K., Ferrer, L., & Yılmaz, E. (2018, June 26–29). How to train your speaker embeddings extractor. Paper presented at the Odyssey: The Speaker and Language Recognition Workshop, Les Sables d’Olonne, Odessey-2018, France.
Milin, P., Feldman, L. B., Ramscar, M., Hendrix, P., & Baayen, R. H. (2017) Discrimination in lexical deci-sion. PLoS One 12, no. 2: e0171935.
Mulder, K., & Hulstijn, J. H. (2011). Linguistic skills of adult native speakers, as a function of age and level of education. Applied Linguistics, 32(5), 475–494.
Munteanu, C., Baecker, R., Penn, G., Toms, E., & James, D. (2006, April 22–27). The effect of speech recognition accuracy rates on the usefulness and usability of webcast archives. Paper presented at the Proceedings of the SIGCHI Conference on Human Factors in Computing Systems. CHI-2006, Montréal, Canada.
Pakhomov, S. V., Smith, G. E., Chacon, D., Feliciano, Y., Graff-Radford, N., Caselli, R., & Knopman, D. S. (2010). Computerized analysis of speech and language to identify psycholinguistic correlates of fronto-temporal lobar degeneration. Cognitive and Behavioral Neurology, 23(3), 165.
Ramsay, R. W. (1968). Speech patterns and personality. Language and Speech, 11, 54–63.

Jongman et al. 51
R Core Team. (2012). R: A language and environment for statistical computing. R Foundation for Statistical Computing, Vienna, Austria. Retrieved from http://www.R-project.org/.
Sanders, G. A., Le, A. N., & Garofolo, J. S. (2002, September 16–20). Effects of word error rate in the DARPA Communicator data during 2000 and 2001. Paper presented at the Seventh International Conference on Spoken Language Processing. ICSLP-2002, Denver, USA.
Schlichting, L. (2005). Peabody picture vocabulary test-III-NL. Harcourt Assessment BV.Shao, Z., Janse, E., Visser, K., & Meyer, A. S. (2014). What do verbal fluency tasks measure? Predictors of
verbal fluency performance in older adults. Frontiers in Psychology, 5, 772.Staiger, A., & Ziegler, W. (2008). Syllable frequency and syllable structure in the spontaneous speech produc-
tion of patients with apraxia of speech. Aphasiology, 22(11), 1201–1215.Tavakol, M., & Dennick, R. (2011). Making sense of Cronbach’s alpha. International Journal of Medical
Education, 2, 53.Unsworth, N., Spillers, G. J., & Brewer, G. A. (2010). Variation in verbal fluency: A latent variable analysis
of clustering, switching, and overall performance. Quarterly Journal of Experimental Psychology, 64(3), 447–466.
Wagenaar, E., Snow, C., & Prins, R. (1975). Spontaneous speech of aphasic patients: A psycholinguistic analysis. Brain and Language, 2, 281–303.
Wang, D., & Narayanan, S. S. (2007). Robust speech rate estimation for spontaneous speech. IEEE Transactions on Audio, Speech, and Language Processing, 15(8), 2190–2201.
Yap, M. J., Balota, D. A., Sibley, D. E., & Ratcliff, R. (2012). Individual differences in visual word recogni-tion: Insights from the English Lexicon Project. Journal of Experimental Psychology: Human Perception and Performance, 38(1), 53.
Yap, M. J., Tse, C.-S., & Balota, D. A. (2009). Individual differences in the joint effects of semantic prim-ing and word frequency revealed by RT distributional analyses: The role of lexical integrity. Journal of Memory and Language, 61(3), 303–325.
Yılmaz, E., van den Heuvel, H., & van Leeuwen, D. (2016, December 13–16). Code-switching detection using multilingual DNNs. Paper presented at the Spoken Language Technology Workshop (SLT). Proc. SLT, IEEE, San Diego, USA.
Ziman, K., Heusser, A. C., Fitzpatrick, P. C., Field, C. E., & Manning, J. R. (2018). Is automatic speech-to-text transcription ready for use in psychological experiments? Behavior Research Methods, 50, 2597–2605.
Zwaan, R. A., & Radvansky, G. A. (1998). Situation models in language comprehension and memory. Psychological Bulletin, 123(2), 162.