use of compound-specific stable isotope analysis to ... mosley, sandra piettro, jim kelly, plus...
TRANSCRIPT
(ER-201025)
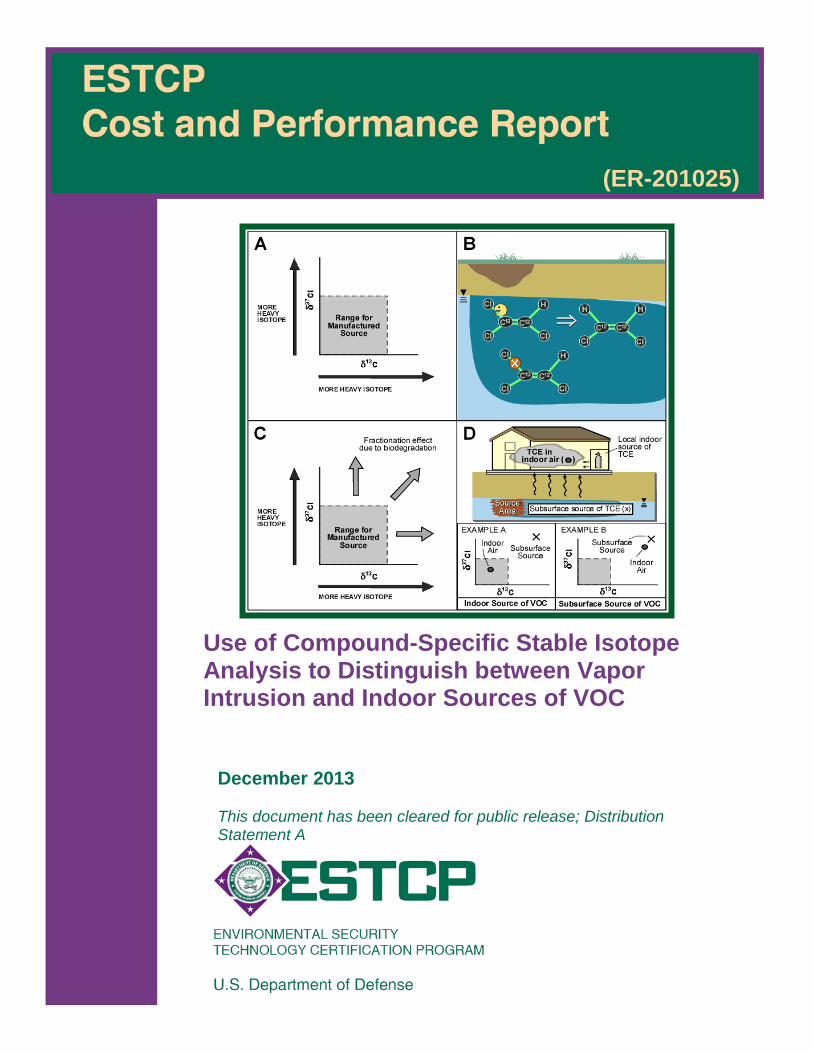
Use of Compound-Specific Stable Isotope Analysis to Distinguish between Vapor Intrusion and Indoor Sources of VOC
December 2013 This document has been cleared for public release; Distribution Statement A

i
COST & PERFORMANCE REPORT Project: ER-201025
TABLE OF CONTENTS
Page
EXECUTIVE SUMMARY ...................................................................................................... ES-1
1.0 INTRODUCTION .............................................................................................................. 1 1.1 BACKGROUND .................................................................................................... 1 1.2 OBJECTIVE OF THE DEMONSTRATION ......................................................... 1 1.3 REGULATORY DRIVERS ................................................................................... 2
2.0 TECHNOLOGY ................................................................................................................. 3 2.1 TECHNOLOGY DESCRIPTION .......................................................................... 3
2.1.1 Isotope Analysis .......................................................................................... 3 2.1.2 Isotope Ratio Analysis ................................................................................ 3 2.1.3 Application to Vapor Intrusion ................................................................... 4
2.2 TECHNOLOGY DEVELOPMENT ....................................................................... 6 2.3 ADVANTAGES AND LIMITATIONS OF THE TECHNOLOGY...................... 6
3.0 PERFORMANCE OBJECTIVES ...................................................................................... 7
4.0 SITE DESCRIPTION ......................................................................................................... 9 4.1 SITE LOCATION ................................................................................................... 9 4.2 SITE GEOLOGY, HYDROGEOLOGY, AND CONTAMINANT
DISTRIBUTION..................................................................................................... 9
5.0 TEST DESIGN ................................................................................................................. 11 5.1 CONCEPTUAL EXPERIMENTAL DESIGN ..................................................... 11 5.2 BASELINE CHARACTERIZATION .................................................................. 11 5.3 LABORATORY STUDY RESULTS .................................................................. 11 5.4 FIELD TESTING.................................................................................................. 11 5.5 SAMPLING AND ANALYSIS METHODS ....................................................... 12 5.6 SAMPLING RESULTS ........................................................................................ 12
5.6.1 Lines of Evidence for Conventional Approach ........................................ 14 5.6.2 VI Classification using the CSIA Protocol ............................................... 15 5.6.3 VI Classification using the On-Site Analysis Protocol ............................. 16
5.7 SUPPLEMENTAL DATA ................................................................................... 18
6.0 PERFORMANCE ASSESSMENT .................................................................................. 19 6.1 OBJECTIVE 1: COLLECTION OF DATA REPRESENTATIVE OF
SITE CONDITIONS ............................................................................................. 19 6.2 OBJECTIVE 2: VALIDATION OF DRAFT CSIA PROTOCOL TO
DISTINGUISH BETWEEN INDOOR SOURCES OF VOC AND VAPOR INTRUSION .......................................................................................... 19 6.2.1 Site-by-Site Analysis of Results: Building VI Classifications ................. 19
TABLE OF CONTENTS (continued)
Page
ii
6.2.2 Evaluation of Subsurface Sample Locations ............................................ 23 6.2.3 Evaluation of Performance Objective 2 .................................................... 24
6.3 OBJECTIVE 3: VALIDATION OF DRAFT PROTOCOL FOR IDENTIFICATION OF BOTH INDOOR AND SUBSURFACE SOURCES............................................................................................................. 25 6.3.1 Identification of both Indoor and Subsurface Sources .............................. 25 6.3.2 Evaluation of Performance Objective 3 .................................................... 26
6.4 OBJECTIVE 4: IMPLEMENTABILITY AND COST EFFECTIVENESS OF THE PROTOCOL........................................................................................... 26 6.4.1 Demonstration Findings ............................................................................ 26 6.4.2 Evaluation of Performance Objective 4 .................................................... 27 6.4.3 Modifications to the CSIA Protocol ......................................................... 27
7.0 COST ASSESSMENT ...................................................................................................... 29 7.1 COST MODEL FOR THE DEMONSTRATION ................................................ 29 7.2 COST DRIVERS .................................................................................................. 30 7.3 COST ANALYSIS................................................................................................ 30
8.0 IMPLEMENTATION ISSUES ........................................................................................ 31
9.0 REFERENCES ................................................................................................................. 33 APPENDIX A POINTS OF CONTACT......................................................................... A-1

iii
LIST OF FIGURES
Page Figure 1. Conceptual diagram of basis for use of CSIA to distinguish between indoor
and subsurface VOC sources. ................................................................................. 5 Figure 2. Building-specific field testing schedule. ............................................................... 11 Figure 3. Interpretation of CSIA results. .............................................................................. 16 Figure 4. Building with planted indoor TCE source. ........................................................... 21 Figure 5. Comparison of paired groundwater and sub-slab TCE isotope ratios. ................. 23 Figure 6. Lewis-McChord Building 9669 CSIA results....................................................... 23 Figure 7. Isotope variability in groundwater. ....................................................................... 24 Figure 8. Isotope ratios for indoor air with mixed VOC sources. ........................................ 26

iv
LIST OF TABLES
Page Table 1. Performance objectives. .......................................................................................... 7 Table 2. Demonstration buildings. ........................................................................................ 9 Table 3. Demonstration site geology/hydrogeology and key contaminants. ...................... 10 Table 4. Summary of demonstration program. ................................................................... 13 Table 5. Key analytical parameters. .................................................................................... 13 Table 6. Conventional program results. .............................................................................. 15 Table 7. CSIA protocol results. ........................................................................................... 16 Table 8. On-site analysis protocol results. .......................................................................... 17 Table 9. Isotope ratios for benzene in natural gas. .............................................................. 18 Table 10. VI classification based on investigation method. ................................................. 20 Table 11. Results from active versus passive sampling. ....................................................... 22 Table 12. Representative unit costs for CSIA demonstration. .............................................. 29
v
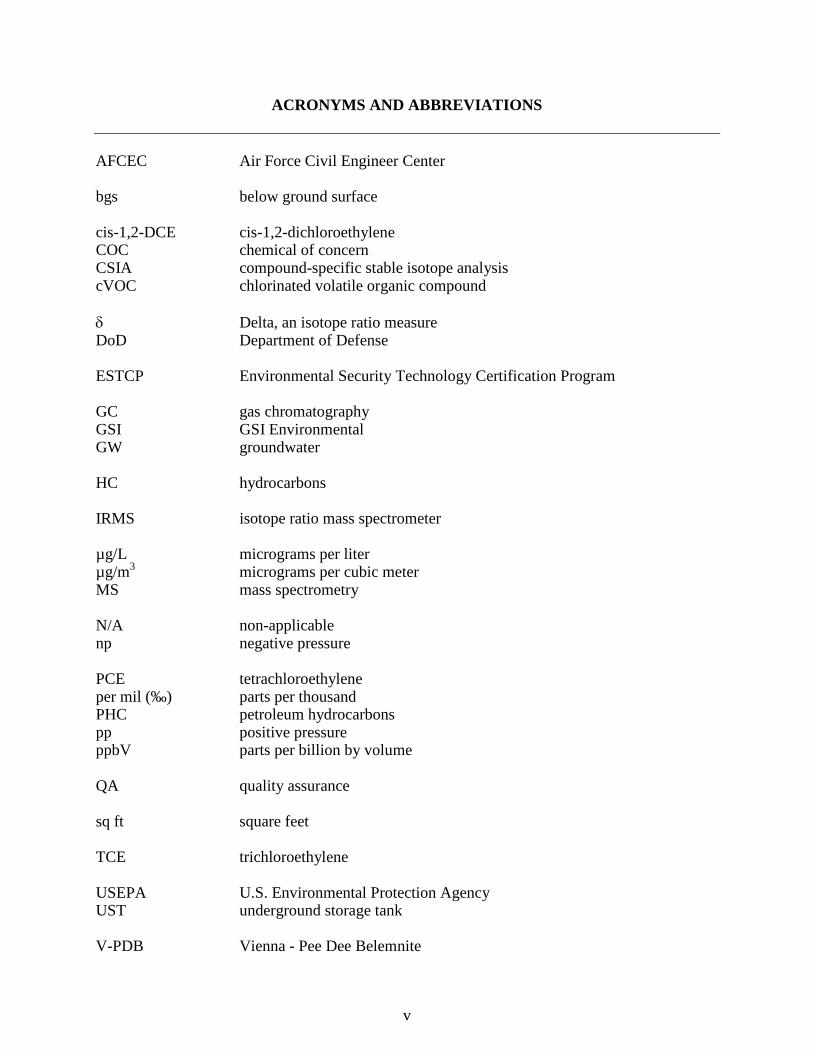
ACRONYMS AND ABBREVIATIONS AFCEC Air Force Civil Engineer Center bgs below ground surface cis-1,2-DCE cis-1,2-dichloroethylene COC chemical of concern CSIA compound-specific stable isotope analysis cVOC chlorinated volatile organic compound δ Delta, an isotope ratio measure DoD Department of Defense ESTCP Environmental Security Technology Certification Program GC gas chromatography GSI GSI Environmental GW groundwater HC hydrocarbons IRMS isotope ratio mass spectrometer µg/L micrograms per liter µg/m3 micrograms per cubic meter MS mass spectrometry N/A non-applicable np negative pressure PCE tetrachloroethylene per mil (‰) parts per thousand PHC petroleum hydrocarbons pp positive pressure ppbV parts per billion by volume QA quality assurance sq ft square feet TCE trichloroethylene USEPA U.S. Environmental Protection Agency UST underground storage tank V-PDB Vienna - Pee Dee Belemnite

ACRONYMS AND ABBREVIATIONS (continued)
vi
V-SMOW Vienna – Standard Mean Ocean Water VI vapor intrusion VOA volatile organic analysis VOC volatile organic compounds
Technical material contained in this report has been approved for public release. Mention of trade names or commercial products in this report is for informational purposes only;
no endorsement or recommendation is implied.
vii
ACKNOWLEDGEMENTS This project would not have been possible without the support and contribution of numerous individuals and organizations. The authors thank Samuel Brock and Mahalingam Ravichandran of the Air Force Civil Engineer Center (AFCEC) for support and oversight; Bill Myers, Jim Gillie, Tom Lynott, Mike Haley, Amanda Michels, Cheryl Neades, Andy Anders, Miguel Plaza, Brian Mosley, Sandra Piettro, Jim Kelly, plus numerous other site personnel for providing access to the demonstration sites and facilitating implementation of the project at these sites; the Environmental Security Technology Certification Program (ESTCP) technical review staff for helpful comments and suggestions; and Andrea Leeson and the ESTCP staff at HydroGeoLogic for invaluable project support.

This page left blank intentionally.

ES-1
EXECUTIVE SUMMARY
OBJECTIVES OF THE DEMONSTRATION
Indoor sources of volatile organic compounds (VOC) are ubiquitous, resulting in detectable concentrations in indoor air, often at levels exceeding regulatory screening criteria. At corrective actions sites with potential vapor intrusion concerns, the presence of indoor VOC sources significantly complicates the exposure pathway evaluation. Because of these indoor sources, the detection of a site-related VOC in a potentially affected building does not necessarily indicate a vapor intrusion impact. However, because conventional investigation methods often do not clearly identify the source of VOC, additional rounds of sampling are commonly required. The overall goal of this demonstration was to validate use of compound-specific stable isotope analysis (CSIA) to distinguish between vapor intrusion and indoor sources of VOC. As part of this project, a step-by-step protocol has been developed, which can be used to provide an independent line of evidence to determine whether or not buildings are impacted by vapor intrusion.
TECHNOLOGY DESCRIPTION
Many elements, such as carbon, occur as different isotope species, differing in the number of neutrons present in their nucleus. For example, 12C, with 6 neutrons, is the most abundant form of carbon. 13C, with 7 neutrons, makes up a small fraction (~1%) of the carbon in the environment. Isotopic ratios (13C/12C) of a specific compound (e.g., trichloroethylene [TCE]) can vary as a result of differences in their source material or compound synthesis or due to transformation in the environment (U.S. Environmental Protection Agency [USEPA], 2008). Differences in the isotopic ratio measured in organic contaminants present in environmental samples can be used to 1) distinguish between different sources of the contaminants, and 2) understand biodegradation and other transformation processes occurring in the environment. While CSIA has been applied to groundwater investigations, its applicability to vapor intrusion assessments has only recently been explored (e.g., McHugh et al., 2011). As part of this project, we have evaluated the applicability of CSIA for vapor intrusion and have developed a step-by-step protocol for investigations using CSIA. This protocol includes a decision matrix to guide users who may be unfamiliar with isotope analyses.
DEMONSTRATION RESULTS
The field investigation program included application of the CSIA protocol at four Department of Defense (DoD) sites. To evaluate the validity of this investigation approach, we also conducted investigations using conventional vapor intrusion and on-site gas chromatography (GC)/mass spectrometry (MS) analysis (Environmental Security Technology Certification Program [ESTCP] Project ER-201119, GSI Environmental [GSI], 2013a) at the same buildings. In two of four buildings, the CSIA approach yielded results consistent with the other investigation methods. A spray can was planted in a closet of the third building; the CSIA approach correctly identified an indoor source as being the source of VOC in indoor air. In the fourth building, the CSIA approach provided clear and strong evidence of an indoor source while the other methods
ES-2
yielded ambiguous results. Overall, the demonstration results validated the CSIA protocol as a useful tool for distinguishing between vapor intrusion and indoor sources of VOC.
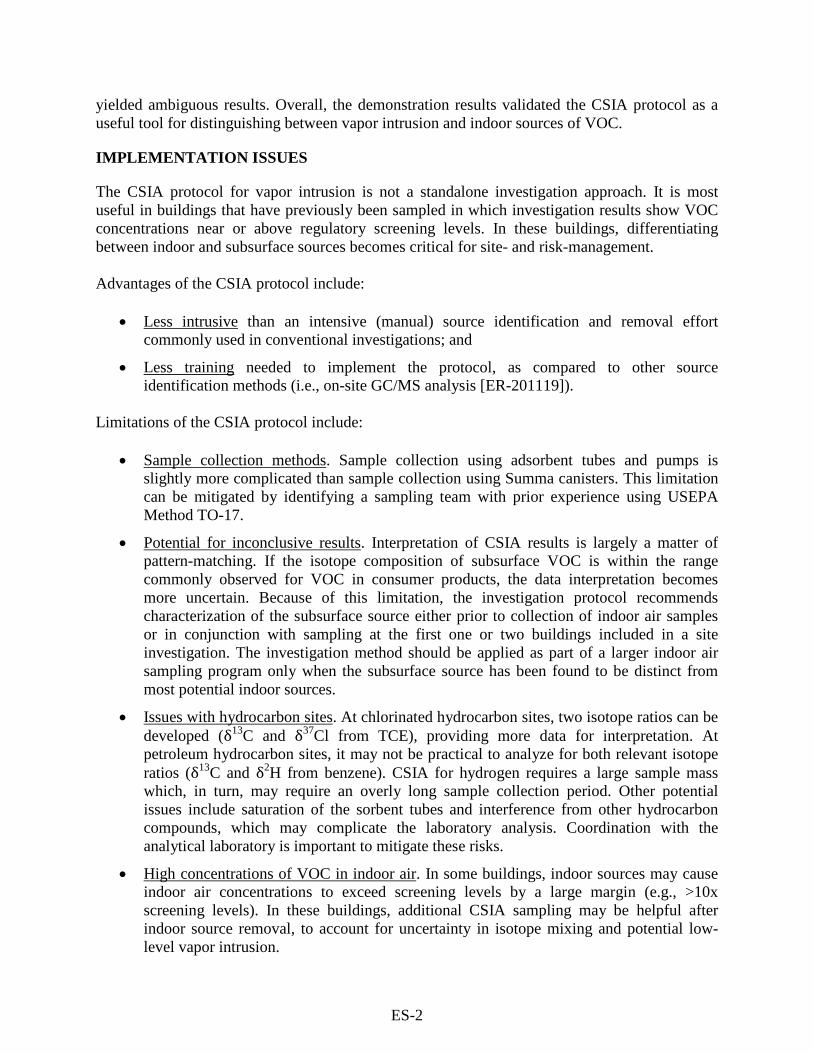
IMPLEMENTATION ISSUES
The CSIA protocol for vapor intrusion is not a standalone investigation approach. It is most useful in buildings that have previously been sampled in which investigation results show VOC concentrations near or above regulatory screening levels. In these buildings, differentiating between indoor and subsurface sources becomes critical for site- and risk-management. Advantages of the CSIA protocol include:
• Less intrusive than an intensive (manual) source identification and removal effort commonly used in conventional investigations; and
• Less training needed to implement the protocol, as compared to other source identification methods (i.e., on-site GC/MS analysis [ER-201119]).
Limitations of the CSIA protocol include:
• Sample collection methods. Sample collection using adsorbent tubes and pumps is slightly more complicated than sample collection using Summa canisters. This limitation can be mitigated by identifying a sampling team with prior experience using USEPA Method TO-17.
• Potential for inconclusive results. Interpretation of CSIA results is largely a matter of pattern-matching. If the isotope composition of subsurface VOC is within the range commonly observed for VOC in consumer products, the data interpretation becomes more uncertain. Because of this limitation, the investigation protocol recommends characterization of the subsurface source either prior to collection of indoor air samples or in conjunction with sampling at the first one or two buildings included in a site investigation. The investigation method should be applied as part of a larger indoor air sampling program only when the subsurface source has been found to be distinct from most potential indoor sources.
• Issues with hydrocarbon sites. At chlorinated hydrocarbon sites, two isotope ratios can be developed (δ13C and δ37Cl from TCE), providing more data for interpretation. At petroleum hydrocarbon sites, it may not be practical to analyze for both relevant isotope ratios (δ13C and δ2H from benzene). CSIA for hydrogen requires a large sample mass which, in turn, may require an overly long sample collection period. Other potential issues include saturation of the sorbent tubes and interference from other hydrocarbon compounds, which may complicate the laboratory analysis. Coordination with the analytical laboratory is important to mitigate these risks.
• High concentrations of VOC in indoor air. In some buildings, indoor sources may cause indoor air concentrations to exceed screening levels by a large margin (e.g., >10x screening levels). In these buildings, additional CSIA sampling may be helpful after indoor source removal, to account for uncertainty in isotope mixing and potential low-level vapor intrusion.
1
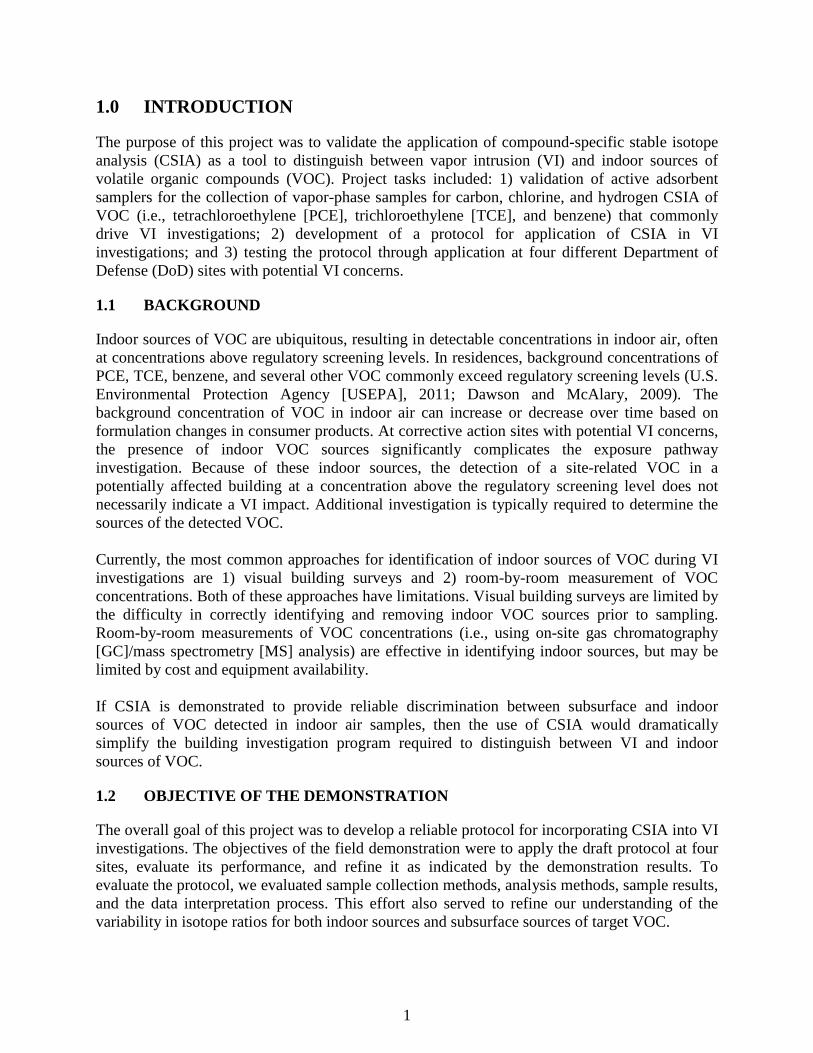
1.0 INTRODUCTION
The purpose of this project was to validate the application of compound-specific stable isotope analysis (CSIA) as a tool to distinguish between vapor intrusion (VI) and indoor sources of volatile organic compounds (VOC). Project tasks included: 1) validation of active adsorbent samplers for the collection of vapor-phase samples for carbon, chlorine, and hydrogen CSIA of VOC (i.e., tetrachloroethylene [PCE], trichloroethylene [TCE], and benzene) that commonly drive VI investigations; 2) development of a protocol for application of CSIA in VI investigations; and 3) testing the protocol through application at four different Department of Defense (DoD) sites with potential VI concerns.
1.1 BACKGROUND
Indoor sources of VOC are ubiquitous, resulting in detectable concentrations in indoor air, often at concentrations above regulatory screening levels. In residences, background concentrations of PCE, TCE, benzene, and several other VOC commonly exceed regulatory screening levels (U.S. Environmental Protection Agency [USEPA], 2011; Dawson and McAlary, 2009). The background concentration of VOC in indoor air can increase or decrease over time based on formulation changes in consumer products. At corrective action sites with potential VI concerns, the presence of indoor VOC sources significantly complicates the exposure pathway investigation. Because of these indoor sources, the detection of a site-related VOC in a potentially affected building at a concentration above the regulatory screening level does not necessarily indicate a VI impact. Additional investigation is typically required to determine the sources of the detected VOC. Currently, the most common approaches for identification of indoor sources of VOC during VI investigations are 1) visual building surveys and 2) room-by-room measurement of VOC concentrations. Both of these approaches have limitations. Visual building surveys are limited by the difficulty in correctly identifying and removing indoor VOC sources prior to sampling. Room-by-room measurements of VOC concentrations (i.e., using on-site gas chromatography [GC]/mass spectrometry [MS] analysis) are effective in identifying indoor sources, but may be limited by cost and equipment availability. If CSIA is demonstrated to provide reliable discrimination between subsurface and indoor sources of VOC detected in indoor air samples, then the use of CSIA would dramatically simplify the building investigation program required to distinguish between VI and indoor sources of VOC.
1.2 OBJECTIVE OF THE DEMONSTRATION
The overall goal of this project was to develop a reliable protocol for incorporating CSIA into VI investigations. The objectives of the field demonstration were to apply the draft protocol at four sites, evaluate its performance, and refine it as indicated by the demonstration results. To evaluate the protocol, we evaluated sample collection methods, analysis methods, sample results, and the data interpretation process. This effort also served to refine our understanding of the variability in isotope ratios for both indoor sources and subsurface sources of target VOC.

2
1.3 REGULATORY DRIVERS
To address the VI concern, the USEPA has issued the “Draft Guidance for Evaluating the Vapor Intrusion to Indoor Air Pathway from Groundwater and Soils,” (USEPA, 2002), providing conservative screening criteria for various VOC in groundwater and soil gas. These conservative screening values eliminate few sites and, as a result, a majority of sites with VOC in groundwater require field investigation of the VI pathway. We expect that updated USEPA VI guidance due in 2014 will include increased requirements for testing of indoor air during VI investigations. When implementing these new requirements, accurate methods to distinguish VI from indoor sources of VOC will be important to facilitate efficient investigations and reduced investigation costs. Indoor air testing may be conducted using either traditional investigation methods (i.e., collection of sub-slab and indoor air samples using Summa canisters), advanced investigation methods such as CSIA or on-site GC/MS analysis (e.g., ESTCP Project ER-201119), or a combination of methods. The likelihood that the traditional investigation method will provide definitive results depends on a number of factors including: 1) the conservatism of the data evaluation (the more conservative the approach, the more likely it is that a traditional investigation will not yield a definitive result); 2) the prevalence of indoor and ambient sources of the chemicals of concern (COCs) (if the site investigation includes COC with common indoor sources such that background indoor air concentrations commonly exceed applicable screening levels, then it is more likely that a traditional investigation method will not yield a definitive result).
3
2.0 TECHNOLOGY
2.1 TECHNOLOGY DESCRIPTION
2.1.1 Isotope Analysis
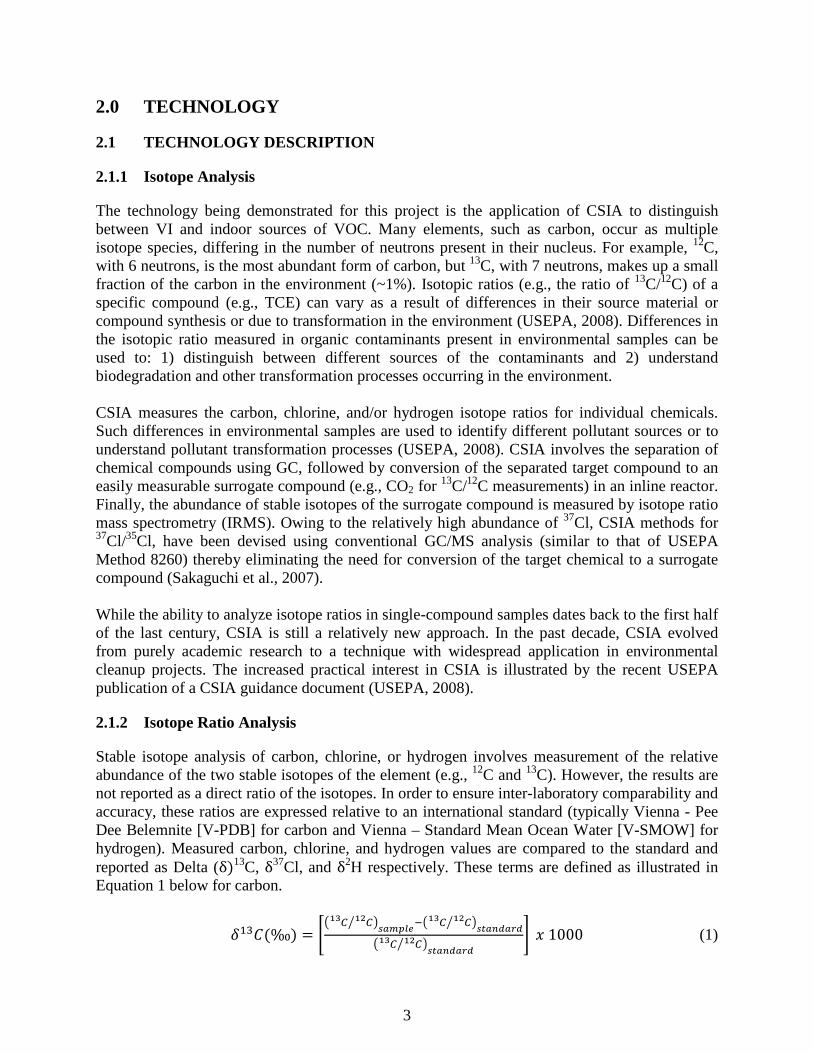
The technology being demonstrated for this project is the application of CSIA to distinguish between VI and indoor sources of VOC. Many elements, such as carbon, occur as multiple isotope species, differing in the number of neutrons present in their nucleus. For example, 12C, with 6 neutrons, is the most abundant form of carbon, but 13C, with 7 neutrons, makes up a small fraction of the carbon in the environment (~1%). Isotopic ratios (e.g., the ratio of 13C/12C) of a specific compound (e.g., TCE) can vary as a result of differences in their source material or compound synthesis or due to transformation in the environment (USEPA, 2008). Differences in the isotopic ratio measured in organic contaminants present in environmental samples can be used to: 1) distinguish between different sources of the contaminants and 2) understand biodegradation and other transformation processes occurring in the environment. CSIA measures the carbon, chlorine, and/or hydrogen isotope ratios for individual chemicals. Such differences in environmental samples are used to identify different pollutant sources or to understand pollutant transformation processes (USEPA, 2008). CSIA involves the separation of chemical compounds using GC, followed by conversion of the separated target compound to an easily measurable surrogate compound (e.g., CO2 for 13C/12C measurements) in an inline reactor. Finally, the abundance of stable isotopes of the surrogate compound is measured by isotope ratio mass spectrometry (IRMS). Owing to the relatively high abundance of 37Cl, CSIA methods for 37Cl/35Cl, have been devised using conventional GC/MS analysis (similar to that of USEPA Method 8260) thereby eliminating the need for conversion of the target chemical to a surrogate compound (Sakaguchi et al., 2007). While the ability to analyze isotope ratios in single-compound samples dates back to the first half of the last century, CSIA is still a relatively new approach. In the past decade, CSIA evolved from purely academic research to a technique with widespread application in environmental cleanup projects. The increased practical interest in CSIA is illustrated by the recent USEPA publication of a CSIA guidance document (USEPA, 2008).
2.1.2 Isotope Ratio Analysis
Stable isotope analysis of carbon, chlorine, or hydrogen involves measurement of the relative abundance of the two stable isotopes of the element (e.g., 12C and 13C). However, the results are not reported as a direct ratio of the isotopes. In order to ensure inter-laboratory comparability and accuracy, these ratios are expressed relative to an international standard (typically Vienna - Pee Dee Belemnite [V-PDB] for carbon and Vienna – Standard Mean Ocean Water [V-SMOW] for hydrogen). Measured carbon, chlorine, and hydrogen values are compared to the standard and reported as Delta (δ)13C, δ37Cl, and δ2H respectively. These terms are defined as illustrated in Equation 1 below for carbon.
𝛿13𝐶(‰) = �� 𝐶13 𝐶12� �𝑠𝑎𝑚𝑝𝑙𝑒−� 𝐶13 𝐶12� �𝑠𝑡𝑎𝑛𝑑𝑎𝑟𝑑
� 𝐶13 𝐶12� �𝑠𝑡𝑎𝑛𝑑𝑎𝑟𝑑
� 𝑥 1000 (1)
4
For manufactured products (i.e., potential indoor sources), the correction for the international standard typically results in negative values for the reported isotope ratios. Fractionation effects that result in enrichment of the lighter isotope (e.g., 12C) in the sample result in δ13C isotope ratio values that are more negative (i.e., larger negative values). Fractionation effects that result in enrichment in the heavier isotope (e.g., 13C) result in isotope ratio values that are less negative (or even positive).
2.1.3 Application to Vapor Intrusion
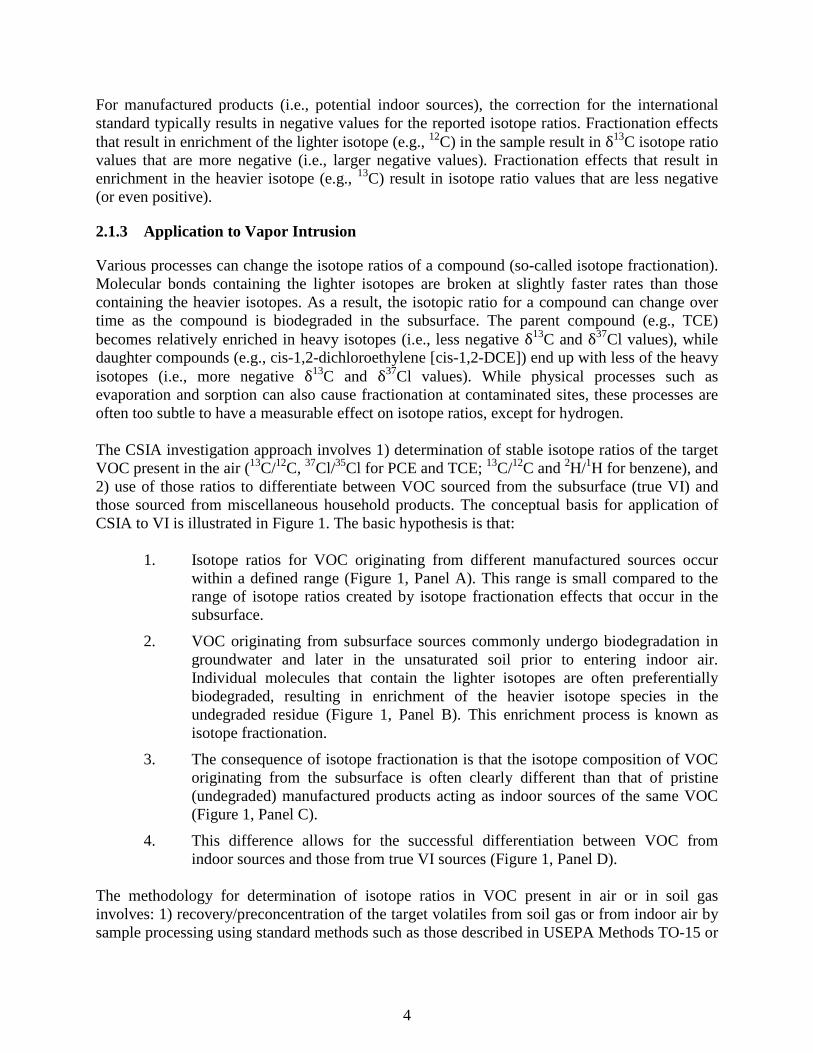
Various processes can change the isotope ratios of a compound (so-called isotope fractionation). Molecular bonds containing the lighter isotopes are broken at slightly faster rates than those containing the heavier isotopes. As a result, the isotopic ratio for a compound can change over time as the compound is biodegraded in the subsurface. The parent compound (e.g., TCE) becomes relatively enriched in heavy isotopes (i.e., less negative δ13C and δ37Cl values), while daughter compounds (e.g., cis-1,2-dichloroethylene [cis-1,2-DCE]) end up with less of the heavy isotopes (i.e., more negative δ13C and δ37Cl values). While physical processes such as evaporation and sorption can also cause fractionation at contaminated sites, these processes are often too subtle to have a measurable effect on isotope ratios, except for hydrogen. The CSIA investigation approach involves 1) determination of stable isotope ratios of the target VOC present in the air (13C/12C, 37Cl/35Cl for PCE and TCE; 13C/12C and 2H/1H for benzene), and 2) use of those ratios to differentiate between VOC sourced from the subsurface (true VI) and those sourced from miscellaneous household products. The conceptual basis for application of CSIA to VI is illustrated in Figure 1. The basic hypothesis is that:
1. Isotope ratios for VOC originating from different manufactured sources occur within a defined range (Figure 1, Panel A). This range is small compared to the range of isotope ratios created by isotope fractionation effects that occur in the subsurface.
2. VOC originating from subsurface sources commonly undergo biodegradation in groundwater and later in the unsaturated soil prior to entering indoor air. Individual molecules that contain the lighter isotopes are often preferentially biodegraded, resulting in enrichment of the heavier isotope species in the undegraded residue (Figure 1, Panel B). This enrichment process is known as isotope fractionation.
3. The consequence of isotope fractionation is that the isotope composition of VOC originating from the subsurface is often clearly different than that of pristine (undegraded) manufactured products acting as indoor sources of the same VOC (Figure 1, Panel C).
4. This difference allows for the successful differentiation between VOC from indoor sources and those from true VI sources (Figure 1, Panel D).
The methodology for determination of isotope ratios in VOC present in air or in soil gas involves: 1) recovery/preconcentration of the target volatiles from soil gas or from indoor air by sample processing using standard methods such as those described in USEPA Methods TO-15 or
5
TO-17 (USEPA, 1999a; USEPA, 1999b), and 2) analysis of the collected samples for their isotope ratios, using CSIA adapted from the protocols used for analysis of the same VOC present in groundwater samples (USEPA, 2008).
Figure 1. Conceptual diagram of basis for use of CSIA to distinguish between indoor and subsurface VOC sources.
Interpretation of the origin of VOC in indoor air based on CSIA results is relatively straightforward in comparison to traditional VI investigation methods. The isotope ratios from VOC in indoor air are directly compared to those from the subsurface source and those measured in a variety of available consumer products. Isotope ratios dissimilar from the subsurface source but similar to the values characteristic of, for example, TCE present in household products is a strong indication that the latter is responsible for the indoor air contamination (see Figure 1, Panel D, Example A). On the other hand, the isotope ratios of TCE in indoor air can be similar to the subsurface sources and different from indoor sources, confirming the impact of VI (Figure 1, Panel D, Example B).
6
2.2 TECHNOLOGY DEVELOPMENT
CSIA has been used in many groundwater studies. This technology demonstration project extends the application of CSIA techniques to vapor-phase samples to provide an effective tool for distinguishing between VI and indoor sources of VOC. For this application, the isotopic signatures of individual VOC in an indoor air sample will be compared to the isotopic signatures from indoor and subsurface sources of the same VOC. A match between the isotopic signature of the indoor air sample and either the indoor or the subsurface source is expected to provide a clear identification of the primary source of the VOC in the indoor air sample. Key components for application of CSIA to VI have been validated through early work completed for this ESTCP project including: 1) validation of active sorbent sample collection and analysis methods (Kuder et al., 2012); 2) characterization of typical ranges of carbon and chlorine isotope ratios for PCE and TCE sources and carbon and hydrogen isotope ratios for benzene sources (GSI Environmental [GSI], 2012a); and 3) development of a CSIA investigation protocol (GSI, 2012a).
2.3 ADVANTAGES AND LIMITATIONS OF THE TECHNOLOGY
As illustrated in Figure 1, CSIA can be used to identify the source of a chemical (i.e., indoor source versus VI) present in indoor air based on the measured isotope ratio. This analysis is independent of other common lines of evidence used to identify VOC sources such as attenuation factors and concentration ratios. In most cases, CSIA will be able to provide evidence of the source of a VOC based on the analysis of as few as one subsurface sample (e.g., groundwater) and one indoor air sample. As a result, CSIA is a cost-effective VI investigation method that can be used as the primary line of evidence for source identification or in conjunction with other lines of evidence. The main limitation of the CSIA approach is the sample collection method required for indoor air samples. In order to obtain sufficient sample mass for analysis, the sample must be collected using an adsorbent tube and pump, such as that specified by USEPA Method TO-17. Although this equipment is readily available, the use is slightly more complicated than Summa canisters and some field personnel may not be familiar with its operation. This limitation can be mitigated by identifying a sampling team with prior experience in sample collection using USEPA Method TO-17. A second limitation is the potential for inconclusive results. If the isotope composition of subsurface VOC is within the range commonly observed for VOC in consumer products, then CSIA is likely to yield inconclusive results (i.e., the isotope ratio measured for the target VOC in indoor air may match both the subsurface source and potential indoor sources). This limitation may apply at up to 50% of candidate sites (GSI, 2012a). Because of this limitation, the investigation protocol recommends characterization of the subsurface source either prior to collection of indoor air samples or in conjunction with sampling at the first one or two buildings included in a site investigation. The investigation method should be applied as part of a larger indoor air sampling program only when the subsurface source has been found to be distinct from most potential indoor sources.
7
3.0 PERFORMANCE OBJECTIVES
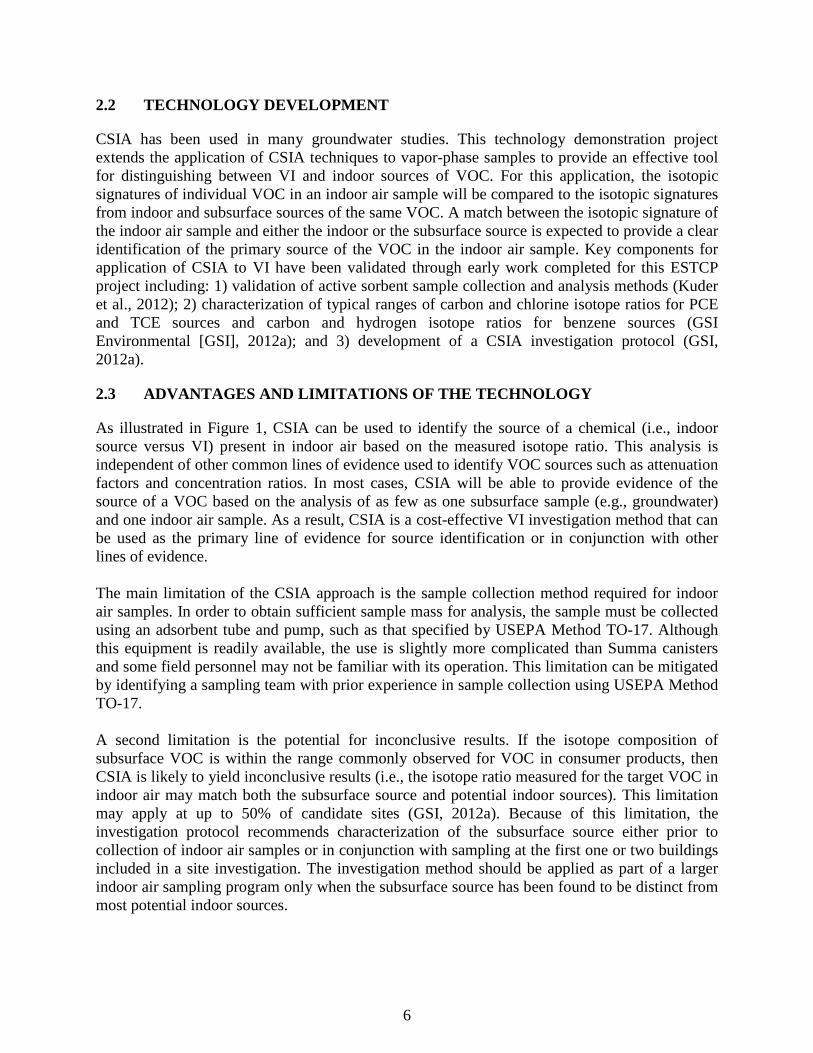
The overall objective of the demonstration was to validate the draft protocol for the application of CSIA to distinguish between VI and indoor sources of VOC. The demonstration was done in the field at “full-scale,” that is, in typical buildings subject to VI investigations. Specific performance objectives are summarized in Table 1.
Table 1. Performance objectives.
Performance Objective/Data Requirements Success Criteria Quantitative Performance Objectives 1) Collection of data representative of site
conditions. • Subsurface samples (groundwater samples
collected in VOA vials or soil gas samples collected on sorbent tubes or in Summa canisters) and analytical results.
• Indoor air samples collected on sorbent tubes, and associated analytical results.
Precision, Accuracy, Completeness, Representativeness, and Comparability as defined in the quality assurance project plan.
Result: Data met overall quality assurance (QA) goals.
Qualitative Performance Objectives 2) Validation of the draft protocol for the use of
CSIA to distinguish between indoor sources of VOC and VI. • Determination of VOC sources using
results from: 1) application of the protocol; 2) conventional sampling approach; and 3) on-site GC/MS analysis (per ER-201119).
Success will be achieved if: 1) The three investigation methods all yield definitive
and consistent determinations regarding the primary source of VOC in indoor air, or
2) If one or more of the methods yields ambiguous results regarding the primary source, attainment of a definitive determination using the CSIA method that is consistent with a definitive determination from one of the two alternate methods (if available).
Result: Performance objective met. CSIA results were consistent with overall weight of evidence at demonstration sites. CSIA protocol correctly identified a building with a planted source. CSIA protocol provided strong evidence of indoor source for a building for which the other methods yielded more ambiguous results.
3) Validation of draft protocol for identification of both indoor and subsurface sources. • Application of the draft protocol for at least
one site with VOC originating from a subsurface source and at least one site with VOC originating from an indoor source.
Attainment of the validation success criteria at both types of sites (i.e., subsurface source sites and indoor source sites).
Result: Performance objective met. VI was indicated in One of four demonstration buildings. Indoor sources were the primary sources of VOC in three of four demonstration buildings. Calculations were completed to evaluate the impact of mixed indoor/subsurface sources.
4) Implementability of the draft protocol for the use of CSIA to evaluate VI. • Field experience implementing the protocol
and interpreting the results.
Determination that the protocol is implementable and cost effective.
Result: The protocol is usable and cost effective. Refinements based on demonstration findings have been incorporated into a revised protocol (GSI, 2013b).

This page left blank intentionally.
9
4.0 SITE DESCRIPTION
4.1 SITE LOCATION
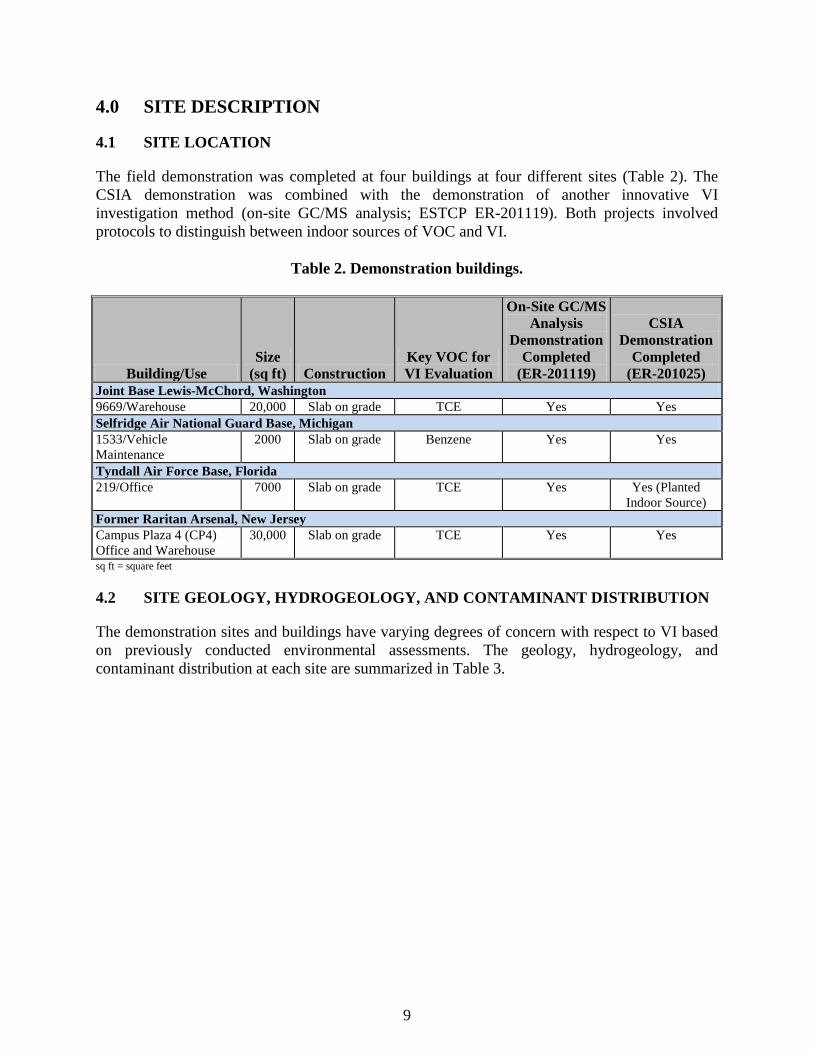
The field demonstration was completed at four buildings at four different sites (Table 2). The CSIA demonstration was combined with the demonstration of another innovative VI investigation method (on-site GC/MS analysis; ESTCP ER-201119). Both projects involved protocols to distinguish between indoor sources of VOC and VI.
Table 2. Demonstration buildings.
Building/Use Size
(sq ft) Construction Key VOC for VI Evaluation
On-Site GC/MS Analysis
Demonstration Completed
(ER-201119)
CSIA Demonstration
Completed (ER-201025)
Joint Base Lewis-McChord, Washington 9669/Warehouse 20,000 Slab on grade TCE Yes Yes Selfridge Air National Guard Base, Michigan 1533/Vehicle Maintenance
2000 Slab on grade Benzene Yes Yes
Tyndall Air Force Base, Florida 219/Office 7000 Slab on grade TCE Yes Yes (Planted
Indoor Source) Former Raritan Arsenal, New Jersey Campus Plaza 4 (CP4) Office and Warehouse
30,000 Slab on grade TCE Yes Yes
sq ft = square feet
4.2 SITE GEOLOGY, HYDROGEOLOGY, AND CONTAMINANT DISTRIBUTION
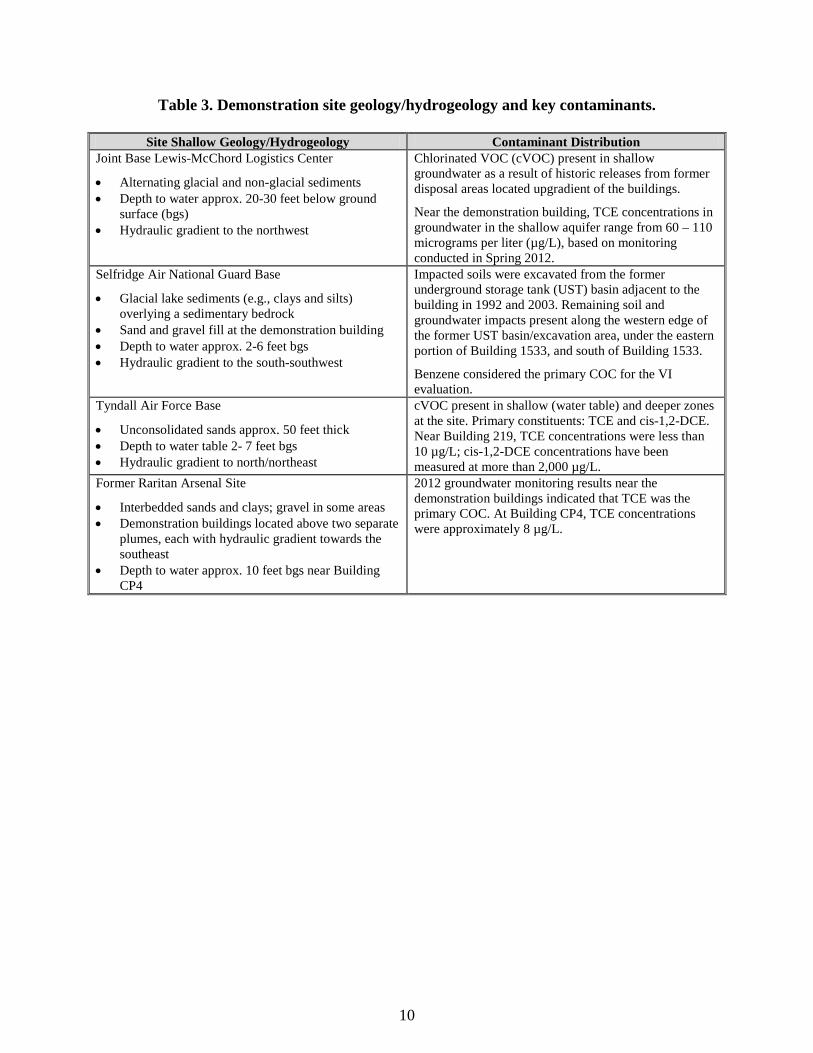
The demonstration sites and buildings have varying degrees of concern with respect to VI based on previously conducted environmental assessments. The geology, hydrogeology, and contaminant distribution at each site are summarized in Table 3.
10
Table 3. Demonstration site geology/hydrogeology and key contaminants.
Site Shallow Geology/Hydrogeology Contaminant Distribution Joint Base Lewis-McChord Logistics Center
• Alternating glacial and non-glacial sediments • Depth to water approx. 20-30 feet below ground
surface (bgs) • Hydraulic gradient to the northwest
Chlorinated VOC (cVOC) present in shallow groundwater as a result of historic releases from former disposal areas located upgradient of the buildings.
Near the demonstration building, TCE concentrations in groundwater in the shallow aquifer range from 60 – 110 micrograms per liter (µg/L), based on monitoring conducted in Spring 2012.
Selfridge Air National Guard Base
• Glacial lake sediments (e.g., clays and silts) overlying a sedimentary bedrock
• Sand and gravel fill at the demonstration building • Depth to water approx. 2-6 feet bgs • Hydraulic gradient to the south-southwest
Impacted soils were excavated from the former underground storage tank (UST) basin adjacent to the building in 1992 and 2003. Remaining soil and groundwater impacts present along the western edge of the former UST basin/excavation area, under the eastern portion of Building 1533, and south of Building 1533.
Benzene considered the primary COC for the VI evaluation.
Tyndall Air Force Base
• Unconsolidated sands approx. 50 feet thick • Depth to water table 2- 7 feet bgs • Hydraulic gradient to north/northeast
cVOC present in shallow (water table) and deeper zones at the site. Primary constituents: TCE and cis-1,2-DCE. Near Building 219, TCE concentrations were less than 10 µg/L; cis-1,2-DCE concentrations have been measured at more than 2,000 µg/L.
Former Raritan Arsenal Site
• Interbedded sands and clays; gravel in some areas • Demonstration buildings located above two separate
plumes, each with hydraulic gradient towards the southeast
• Depth to water approx. 10 feet bgs near Building CP4
2012 groundwater monitoring results near the demonstration buildings indicated that TCE was the primary COC. At Building CP4, TCE concentrations were approximately 8 µg/L.
11
5.0 TEST DESIGN
5.1 CONCEPTUAL EXPERIMENTAL DESIGN
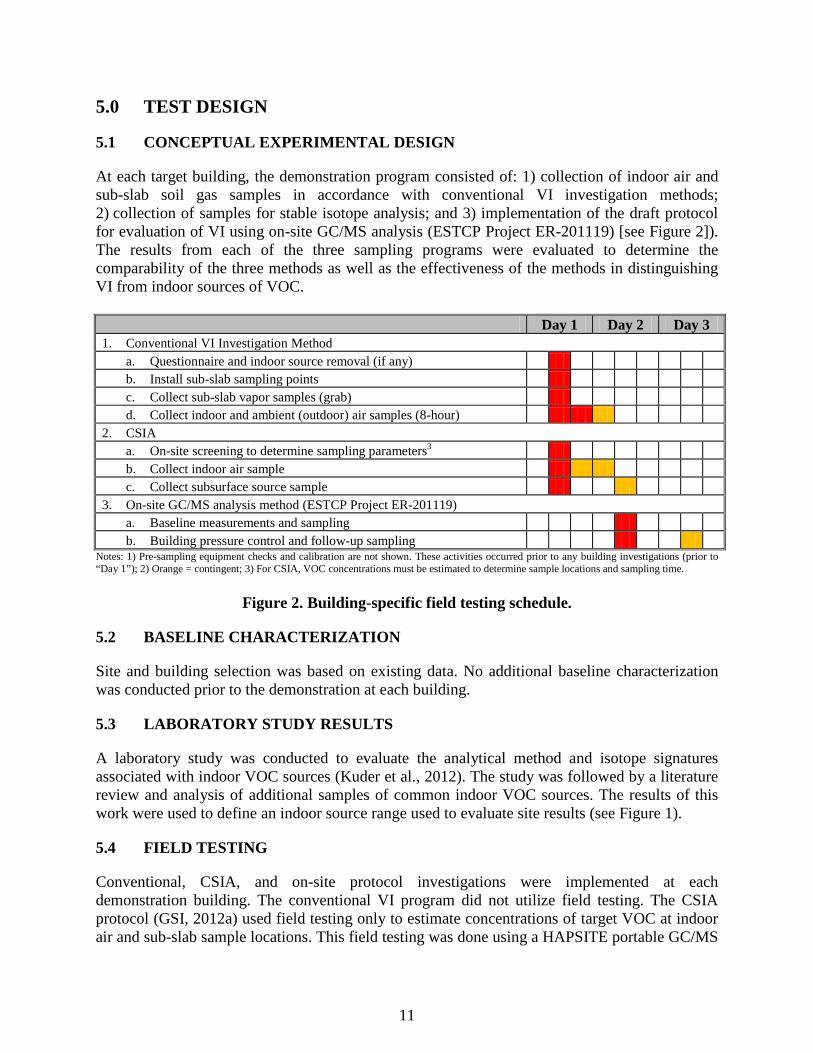
At each target building, the demonstration program consisted of: 1) collection of indoor air and sub-slab soil gas samples in accordance with conventional VI investigation methods; 2) collection of samples for stable isotope analysis; and 3) implementation of the draft protocol for evaluation of VI using on-site GC/MS analysis (ESTCP Project ER-201119) [see Figure 2]). The results from each of the three sampling programs were evaluated to determine the comparability of the three methods as well as the effectiveness of the methods in distinguishing VI from indoor sources of VOC.
Day 1 Day 2 Day 3 1. Conventional VI Investigation Method
a. Questionnaire and indoor source removal (if any) b. Install sub-slab sampling points c. Collect sub-slab vapor samples (grab) d. Collect indoor and ambient (outdoor) air samples (8-hour)
2. CSIA a. On-site screening to determine sampling parameters3 b. Collect indoor air sample c. Collect subsurface source sample
3. On-site GC/MS analysis method (ESTCP Project ER-201119) a. Baseline measurements and sampling b. Building pressure control and follow-up sampling
Notes: 1) Pre-sampling equipment checks and calibration are not shown. These activities occurred prior to any building investigations (prior to “Day 1”); 2) Orange = contingent; 3) For CSIA, VOC concentrations must be estimated to determine sample locations and sampling time.
Figure 2. Building-specific field testing schedule.
5.2 BASELINE CHARACTERIZATION
Site and building selection was based on existing data. No additional baseline characterization was conducted prior to the demonstration at each building.
5.3 LABORATORY STUDY RESULTS
A laboratory study was conducted to evaluate the analytical method and isotope signatures associated with indoor VOC sources (Kuder et al., 2012). The study was followed by a literature review and analysis of additional samples of common indoor VOC sources. The results of this work were used to define an indoor source range used to evaluate site results (see Figure 1).
5.4 FIELD TESTING
Conventional, CSIA, and on-site protocol investigations were implemented at each demonstration building. The conventional VI program did not utilize field testing. The CSIA protocol (GSI, 2012a) used field testing only to estimate concentrations of target VOC at indoor air and sub-slab sample locations. This field testing was done using a HAPSITE portable GC/MS
12
to determine CSIA sample collection parameters (e.g., sampling duration). The testing was also done to identify indoor and sub-slab locations with highest target VOC concentrations to sample for isotope analysis. The on-site analysis protocol includes field testing, or measurements, of 1) VOC concentrations in indoor air and 2) pressure differences between indoors and outdoors. VOC concentration measurements are done in a step-wise manner, with the specific number of analyses based on the building layout and results from the previous step (GSI, 2013a).
5.5 SAMPLING AND ANALYSIS METHODS
As described above, three different VI investigation methods were employed during the demonstration. Each method included specific sampling procedures and analysis of samples at an off-site laboratory. The primary types of analyses are described below: Conventional VI Samples: The conventional sampling program consisted of indoor air, ambient (outdoor) air, and sub-slab soil gas sample collection for VOC analysis. At each test building, indoor and outdoor air samples were collected using 8-hour flow controllers. Two to three sub-slab samples were collected at each building after sampling point integrity was checked using helium leak tracer tests and shut-in tests. Sub-slab samples were collected as grab samples (i.e., without flow controllers). All samples were collected in individually certified, 6-L Summa canisters. Samples were analyzed for VOC by USEPA Method TO-15 or TO-15 SIM at ALS Laboratory in Simi Valley, California. CSIA Samples: Three types of locations were selected for sampling: 1) groundwater (to evaluate the subsurface source); 2) sub-slab (to evaluate the soil gas beneath the building); and 3) indoor air (GSI, 2012b). Groundwater samples were collected in 60 milliliter (mL) VOA vials using standard groundwater sample collection methods. Sub-slab and indoor air samples were collected using active sorbent tube methods. Specific sample locations were chosen based on initial vapor/air screening results from on-site GC/MS analysis. Sub-slab samples were collected from sub-slab probe points installed for the conventional VI program. All analyses were conducted at the University of Oklahoma contract laboratory. Samples to Support the On-Site Analysis Protocol: The majority of samples collected for this protocol are indoor air samples analyzed on-site. However, at the end of each phase of the protocol (i.e., baseline building characterization, characterization of depressurized building conditions, etc.), a sample is collected for off-site laboratory analysis. These samples are used 1) to confirm the accuracy of the on-site analysis results; and 2) to provide fully validated documentation of VOC concentrations in indoor air at the conclusion of the on-site testing program. Samples for off-site laboratory analysis were collected in individually certified, 6-liter (L) Summa canisters and were analyzed by USEPA Method TO-15 or TO-15 SIM. These samples were collected as grab samples and were paired with a final sample analyzed using the HAPSITE. Laboratory analysis was conducted at ALS Laboratory in Simi Valley, California.
5.6 SAMPLING RESULTS
Tables 4 and 5 summarize the demonstration program and key analytes considered for each demonstration building.
13
Table 4. Summary of demonstration program.
Site/Building
Conv. VI Program CSIA On-Site Analysis
Sub-
slab
Sa
mpl
e L
ocat
ions
Indo
or A
ir
Sam
ple
Loc
atio
ns
Out
door
Air
Sa
mpl
e L
ocat
ions
Sour
ce (G
W)
Sam
ple
Loc
atio
ns
Sub-
slab
Sa
mpl
e L
ocat
ions
In
door
Air
Sa
mpl
e L
ocat
ions
O
n-Si
te
GC
/MS
Indo
or A
ir
Sam
ples
O
n-Si
te
Surv
eys
Pres
sure
C
ondi
tions
T
este
d
Joint Base Lewis-McChord, Washington Building 9669 3 2 1 3 1 1 35 3 BL, NP, PP Selfridge Air National Guard Base, Michigan Building 1533 3 1 1 1 2 1 28 6 BL, NP, PP Tyndall Air Force Base, Florida Building 219 3 2 1 1 1 1 9 0 BL Former Raritan Arsenal Site, New Jersey Campus Plaza 4 2 2 1 2 1 2 56 0 BL, NP Note: GW = groundwater; BL = baseline (normal) operating conditions; NP = induced negative pressure; PP = induced positive pressure
Table 5. Key analytical parameters.
Site/Building
Conv. VI and On-Site Analysis Program CSIA TO-15
(Key Analyte1) On-Site Analysis (Key Analyte1) Compound Isotope 1 Isotope 2
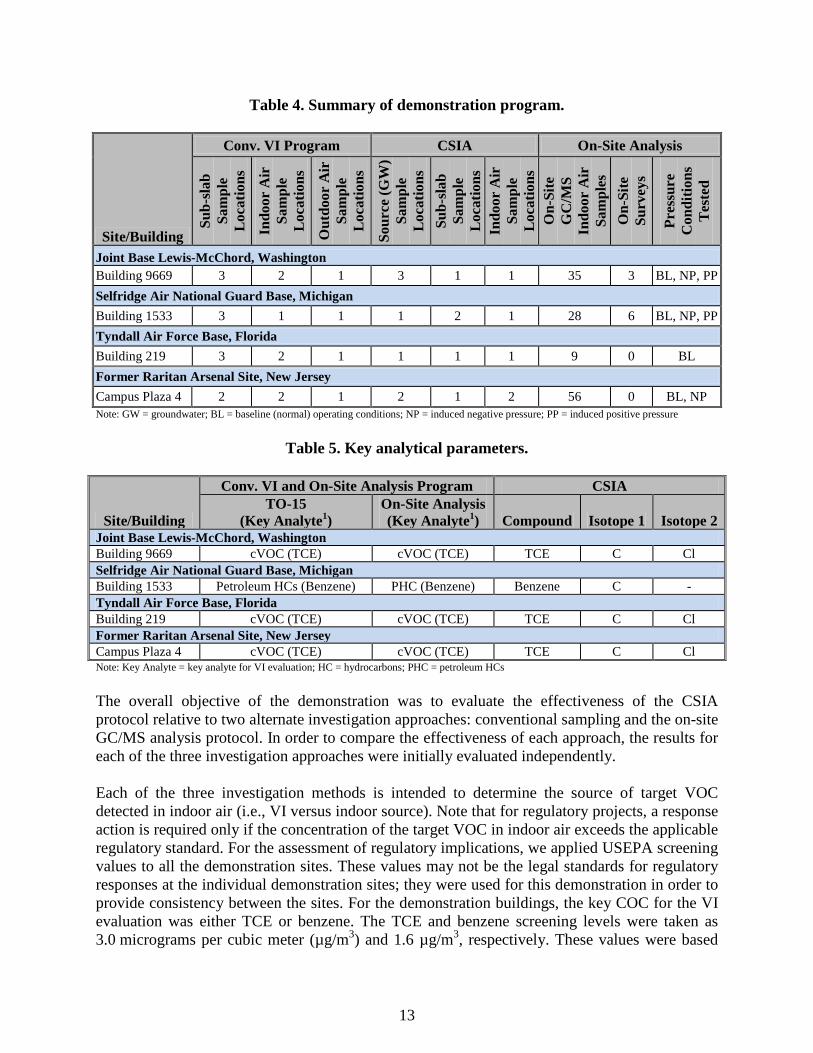
Joint Base Lewis-McChord, Washington Building 9669 cVOC (TCE) cVOC (TCE) TCE C Cl Selfridge Air National Guard Base, Michigan Building 1533 Petroleum HCs (Benzene) PHC (Benzene) Benzene C - Tyndall Air Force Base, Florida Building 219 cVOC (TCE) cVOC (TCE) TCE C Cl Former Raritan Arsenal Site, New Jersey Campus Plaza 4 cVOC (TCE) cVOC (TCE) TCE C Cl Note: Key Analyte = key analyte for VI evaluation; HC = hydrocarbons; PHC = petroleum HCs The overall objective of the demonstration was to evaluate the effectiveness of the CSIA protocol relative to two alternate investigation approaches: conventional sampling and the on-site GC/MS analysis protocol. In order to compare the effectiveness of each approach, the results for each of the three investigation approaches were initially evaluated independently. Each of the three investigation methods is intended to determine the source of target VOC detected in indoor air (i.e., VI versus indoor source). Note that for regulatory projects, a response action is required only if the concentration of the target VOC in indoor air exceeds the applicable regulatory standard. For the assessment of regulatory implications, we applied USEPA screening values to all the demonstration sites. These values may not be the legal standards for regulatory responses at the individual demonstration sites; they were used for this demonstration in order to provide consistency between the sites. For the demonstration buildings, the key COC for the VI evaluation was either TCE or benzene. The TCE and benzene screening levels were taken as 3.0 micrograms per cubic meter (µg/m3) and 1.6 µg/m3, respectively. These values were based
14
on the commercial/industrial USEPA regional screening levels, assuming 10-6 target risk and hazard quotient of 1.0 (USEPA, 2013). Evaluation of both the conventional and on-site analysis protocol results utilized a multiple lines-of-evidence approach. For each of these two methods, the concordance among the lines of evidence was used to determine the overall VI classification and degree of confidence in the classification. The regulatory implication was based on comparison of the results to the screening level. It is important to recognize that, when VOC concentrations are very low, it is more likely that the source identification will not be definitive. However, if VOC concentrations are below the regulatory standard, then no response action is required regardless of the source (although further monitoring may be required in some cases to evaluate temporal variability). The CSIA protocol is not a standalone investigation method. The protocol would be used if target VOC are detected in indoor air at levels approaching or greater than screening (regulatory) levels. The conventional and on-site analysis protocols can be used as standalone methods, and both of these approaches yield indoor air concentration data. Because the CSIA approach requires advance knowledge of indoor air concentrations, it would not be used in the absence of other evidence that VOC concentrations are high enough to be of concern.
5.6.1 Lines of Evidence for Conventional Approach
The results from the conventional sampling program were evaluated using a lines-of-evidence approach, which included the following questions:
1. Comparison of key COC concentrations in indoor air to ambient (outdoor) air: Do indoor concentrations of the key COC exceed outdoor concentrations? To be conservative, a “Yes” response was considered consistent with VI.
2. Sub-slab to indoor air attenuation factors: Are concentrations of the key COC below the building significantly (e.g., >10x) higher than in indoor air?
3. Sub-slab to indoor air ratios: Are other VOC found beneath the slab, and are sub-slab to indoor air concentration ratios similar?
4. Composition of COCs (e.g., concentration ratios) present in indoor air compared to composition of COCs present in groundwater: Are ratios in indoor air consistent with a subsurface source?
Based on the lines of evidence evaluation (Questions 1 – 4), each building was classified with respect to VI and the applicability of the CSIA approach (Table 6).
15
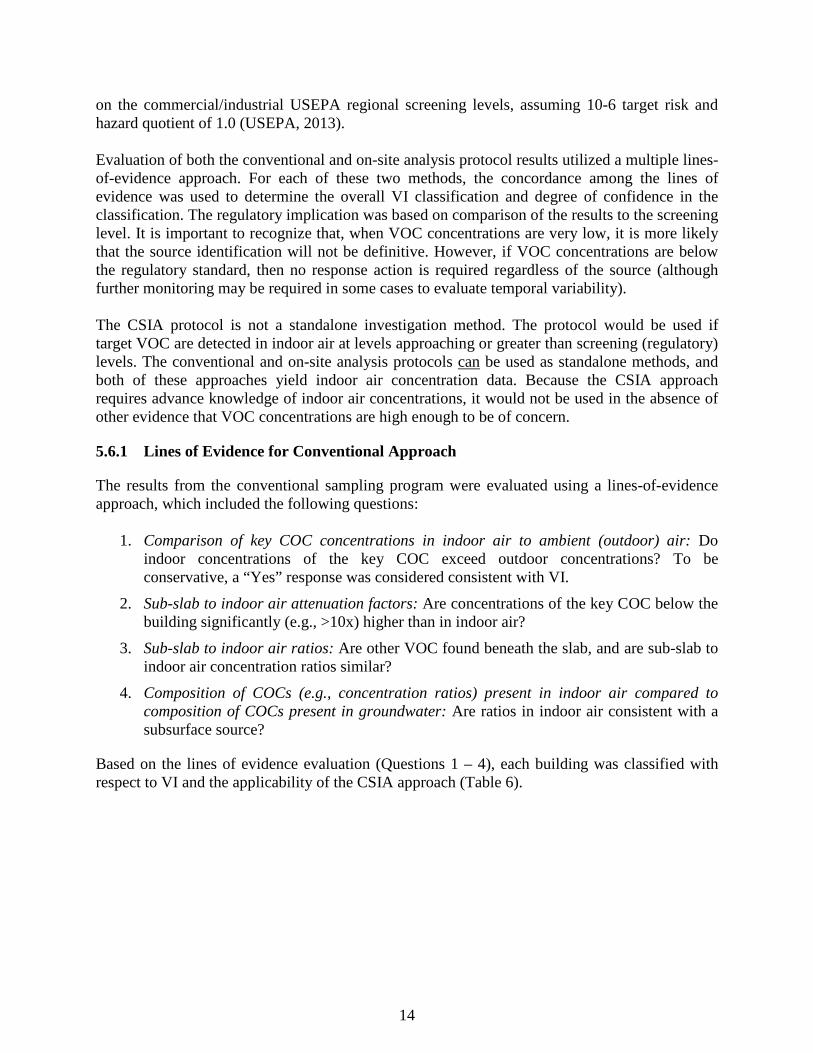
Table 6. Conventional program results.
Building Finding Based on Conventional Approach Lewis-McChord Building 9669
FINDING: Supporting evidence of current VI
IMPLICATION: Indoor air concentration (1.5 µg/m3) is below USEPA screening level (3 µg/m3); however, monitoring may be appropriate to characterize temporal variability.
Based on the indoor air results, this building would be a candidate for CSIA. Selfridge Building 1533
FINDING: Inconclusive, can't distinguish between VI and indoor sources.
IMPLICATION: (1) Indoor benzene concentration greater than USEPA screening level (1.6 µg/m3); (2) Further study needed to determine source.
Based on the indoor air results, this building would be a candidate for CSIA. Tyndall Building 219 (Planted Indoor Source)
Not applicable. No VI concern due to low TCE concentration. CSIA protocol was tested using a planted indoor source.
Raritan Building CP4
FINDING: Supporting evidence of current VI
IMPLICATION: Indoor air TCE concentration is within 50% of USEPA screening level (3 µg/m3). Monitoring may be needed to characterize temporal variability.
Based on the indoor air results, this building would be a candidate for CSIA. Note: Findings and implications above are based on the conventional program only.
5.6.2 VI Classification using the CSIA Protocol
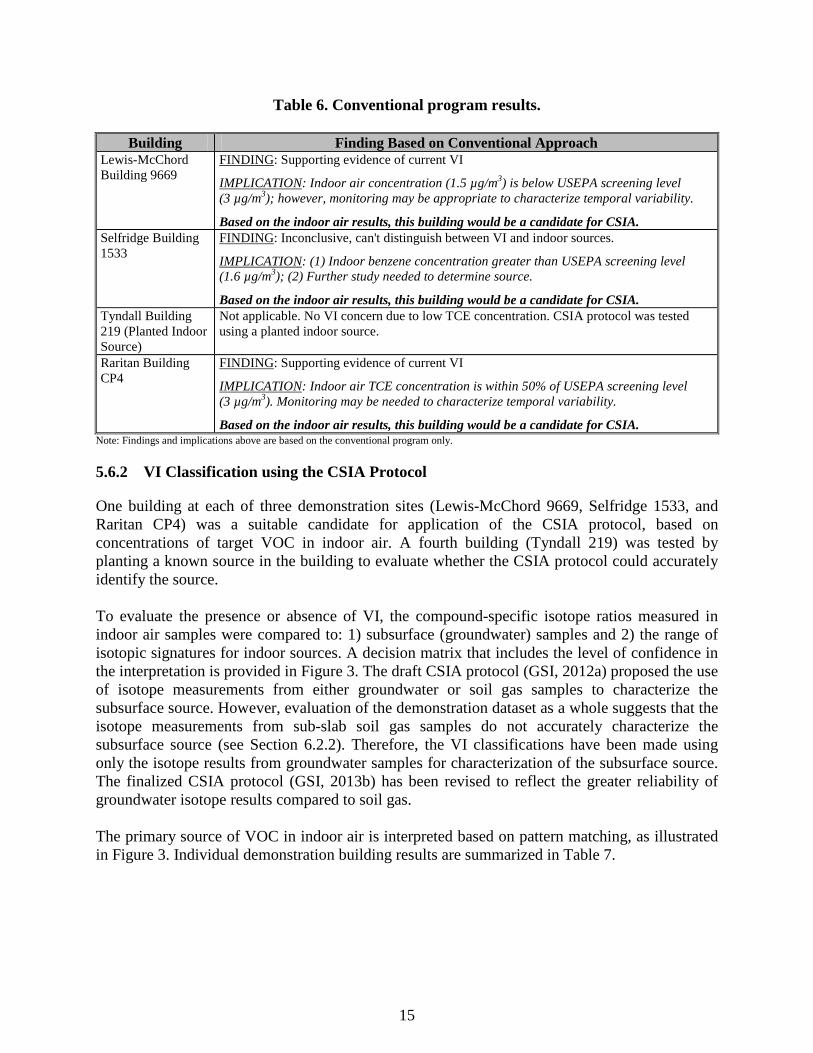
One building at each of three demonstration sites (Lewis-McChord 9669, Selfridge 1533, and Raritan CP4) was a suitable candidate for application of the CSIA protocol, based on concentrations of target VOC in indoor air. A fourth building (Tyndall 219) was tested by planting a known source in the building to evaluate whether the CSIA protocol could accurately identify the source. To evaluate the presence or absence of VI, the compound-specific isotope ratios measured in indoor air samples were compared to: 1) subsurface (groundwater) samples and 2) the range of isotopic signatures for indoor sources. A decision matrix that includes the level of confidence in the interpretation is provided in Figure 3. The draft CSIA protocol (GSI, 2012a) proposed the use of isotope measurements from either groundwater or soil gas samples to characterize the subsurface source. However, evaluation of the demonstration dataset as a whole suggests that the isotope measurements from sub-slab soil gas samples do not accurately characterize the subsurface source (see Section 6.2.2). Therefore, the VI classifications have been made using only the isotope results from groundwater samples for characterization of the subsurface source. The finalized CSIA protocol (GSI, 2013b) has been revised to reflect the greater reliability of groundwater isotope results compared to soil gas. The primary source of VOC in indoor air is interpreted based on pattern matching, as illustrated in Figure 3. Individual demonstration building results are summarized in Table 7.
16
Figure 3. Interpretation of CSIA results.
Table 7. CSIA protocol results.
Building Finding based on CSIA Protocol Lewis-McChord Building 9669 Supporting evidence of current VI Selfridge Building 1533 Supporting evidence of NO current VI Tyndall Building 219 (Planted Indoor Source) Strong evidence of an indoor source Raritan Building CP4 Strong evidence of an indoor source, not VI Note: Findings and implications above are based on the CSIA protocol only. See Section 6.2 for an evaluation of the full dataset (e.g., results from conventional, CSIA, and on-site analysis approaches).
5.6.3 VI Classification using the On-Site Analysis Protocol
In general terms, the on-site analysis protocol involves characterizing the VOC concentrations in a building under normal operating conditions (i.e., “baseline” conditions). Multiple indoor air samples are analyzed in order to find and follow concentration gradients to the source. Building pressure is measured and may be manipulated to get a better understanding of the source of VOC in indoor air. Key lines of evidence for the baseline building characterization include:
1. Comparison of target VOC concentrations in indoor air to ambient (outdoor) air: Do indoor concentrations of the key COC exceed outdoor concentrations? A “Yes” response is conservatively considered to be consistent with VI. This line of evidence is not

17
definitive with respect to VI, however, because of potential contributions from indoor sources.
2. No indoor sources: Were known indoor sources of target VOC removed prior to the end of the baseline period such that no (known) indoor sources remain in the building? If “Yes,” then the source of target VOC may be consistent with VI. If “No,” known indoor sources remain, and these indoor sources may be the primary source(s) of VOC in indoor air. This question does not apply if the on-site results for the target VOC are below detection limits.
3. Baseline building pressure: Is baseline building pressure negative (i.e., building depressurized relative to outdoors [ambient])? A “No” provides evidence of an indoor source because a positive building pressure does not support the flow of soil gas into the building. A “Yes” response is conservatively considered to be consistent with VI. However, this line of evidence alone is not definitive with respect to VI because a negative building pressure does not eliminate the possibility of an indoor source.
4. Vapor entry point: Were vapor entry points found? If “Yes,” then VI could contribute to target VOC in indoor air.
Building pressure may also be manipulated to get a better understanding of the source of VOC in indoor air. Lines of evidence for the optional pressure control evaluation focus on change in target VOC concentrations relative to baseline, and relative to the building pressure condition.
1. Building pressurization: Are target VOC concentrations suppressed by building pressurization? A “Yes” response is consistent with VI.
2. Building depressurization: Are target VOC concentrations enhanced by depressurization? A “Yes” response is consistent with VI.
Refer to the final report for ER-201119 (GSI, 2013a) for additional details regarding the on-site analysis protocol and data interpretation methods. The VI classifications for the demonstration buildings based on the on-site analysis approach are summarized in Table 8. Note that the regulatory implication is based on the generic screening level used to standardize data interpretations for this report. Actual needs or requirements may be different, and will depend on each site’s particular circumstances.
Table 8. On-site analysis protocol results.
Building Results Based on On-Site Analysis Protocol Lewis-McChord Building 9669
OVERALL FINDING: Evidence of current VI
IMPLICATION: Indoor air concentration (2 µg/m3) is below USEPA screening level (3 µg/m3). Pressure control evaluation increases confidence in result, and decreases concern with temporal variability.
Selfridge Building 1533
OVERALL FINDING: No evidence of current/potential VI
IMPLICATION: Primary sources of benzene are indoors. Indoor air benzene concentration greater than USEPA screening level due to indoor sources. No additional evaluation warranted under current building use.

18
Table 8. On-site analysis protocol results (continued).
Building Results Based on On-Site Analysis Protocol Tyndall Building 219 (Planted indoor source)
Not applicable. VI not likely based on on-site analysis protocol. No VI concern due to low TCE concentration. CSIA protocol was tested using a planted indoor source.
Raritan Building CP4
OVERALL FINDING: Office Area: Supporting evidence of VI. Warehouse: Suggestive of VI.
IMPLICATION: Indoor air concentration (0.43 µg/m3 in warehouse) is below USEPA screening level (3 µg/m3). Controlled depressurization did not enhance VI reducing concern regarding temporal variability.
Note: Findings and implications above are based on the on-site analysis protocol only. See Section 6.2 for an evaluation of the full dataset (e.g., results from conventional, CSIA, and on-site analysis approaches).
5.7 SUPPLEMENTAL DATA
During an early phase of this project, we characterized the stable isotope signatures for common indoor sources of PCE, TCE, and benzene by compiling data available in the literature and analyzing samples of indoor sources (GSI, 2012a). For benzene, we sampled gasoline, cigarette smoke, and natural gas, which are common indoor sources with sufficient benzene for isotope testing. During the CSIA demonstration (Task 3 of ER-201025), we collected two additional natural gas samples for isotope analysis. The results were consistent with previous findings. As shown in Table 9, the natural gas signature is distinct from that of gasoline and cigarette smoke.
Table 9. Isotope ratios for benzene in natural gas.
Source Carbon Isotope Ratio
(per mL) Hydrogen Isotope Ratio
(per mil) Natural Gas (GSI, 2012a) -23.3 -92 Austin, TX Natural Gas (this study) -22.2 -84 Houston, TX Natural Gas (this study) -22.0 -77.5 [-75 to -80] Other Benzene Sources (mean [range] of measured values) Gasoline (GSI, 2012a) -27.7 [-28.9 to -26.6] -55 [-37 to -82] Cigarette Smoke (GSI, 2012a) -32.0 Not determined Finding: Because of the distinct ranges, CSIA may be useful in distinguishing between types of indoor benzene sources.
19
6.0 PERFORMANCE ASSESSMENT
This section summarizes the data analysis completed to assess the performance objectives described in Section 3. Details are provided in the Final Report (GSI, 2013b).
6.1 OBJECTIVE 1: COLLECTION OF DATA REPRESENTATIVE OF SITE CONDITIONS
This performance objective was evaluated through review of field procedures, instrument calibration records, and QA sample results. Although there were minor deviations typical of any field program, the data quality exceptions did not limit the usability of the results. The most significant area of concern with respect to data quality was the holding time. 68% (42 of 62) of the CSIA analyses were completed outside of the 2 week holding time validated during the laboratory study for this ESTCP project (Kuder et al., 2012). Therefore, additional analyses of 12 samples were done to determine the effect of an extended holding time on the results. Each sample consisted of four sorbent tubes that were refrigerated (4°C) or frozen (-10°C) during storage prior to analysis. The tubes were re-analyzed at different times ranging from 21 days to 9 months after sample collection. The results of re-analysis were within the expected accuracy/precision range for all but two samples. Based on this testing, we determined that holding times of up to 4 weeks for samples stored at 4°C (i.e., refrigerated samples) are acceptable and do not adversely impact results. Samples analyzed after 6 months in a freezer (-10°C) are also not adversely impacted. Finding: The data quality is acceptable and suitable for evaluation of demonstration performance.
6.2 OBJECTIVE 2: VALIDATION OF DRAFT CSIA PROTOCOL TO DISTINGUISH BETWEEN INDOOR SOURCES OF VOC AND VAPOR INTRUSION
The VI classification of each demonstration building was evaluated separately, in accordance with criteria established for each approach (see Sections 5.6.1 – 5.6.3). This section compares the results of the full dataset.
6.2.1 Site-by-Site Analysis of Results: Building VI Classifications
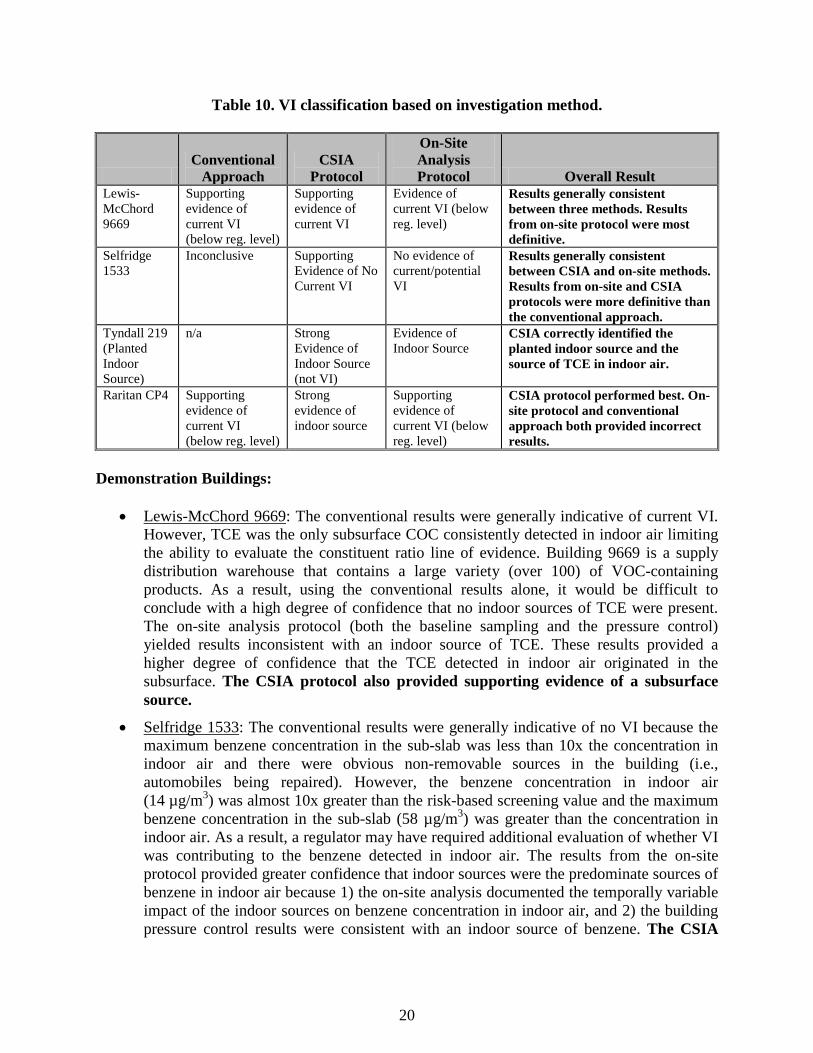
Comparison of VI Classifications from the Different Investigation Methods: A conventional and two innovative VI investigation methods were applied at four demonstration sites. The VI classifications were compared to determine method performance. When the classification was the same, the methods were determined to have performed equally. When one method resulted in a more definitive classification than another (e.g., supporting evidence versus results not definitive), that method was determined to have performed better. The results for each of the four buildings are discussed below and summarized in Table 10.
20
Table 10. VI classification based on investigation method.
Conventional
Approach CSIA
Protocol
On-Site Analysis Protocol Overall Result
Lewis-McChord 9669
Supporting evidence of current VI (below reg. level)
Supporting evidence of current VI
Evidence of current VI (below reg. level)
Results generally consistent between three methods. Results from on-site protocol were most definitive.
Selfridge 1533
Inconclusive Supporting Evidence of No Current VI
No evidence of current/potential VI
Results generally consistent between CSIA and on-site methods. Results from on-site and CSIA protocols were more definitive than the conventional approach.
Tyndall 219 (Planted Indoor Source)
n/a Strong Evidence of Indoor Source (not VI)
Evidence of Indoor Source
CSIA correctly identified the planted indoor source and the source of TCE in indoor air.
Raritan CP4 Supporting evidence of current VI (below reg. level)
Strong evidence of indoor source
Supporting evidence of current VI (below reg. level)
CSIA protocol performed best. On-site protocol and conventional approach both provided incorrect results.
Demonstration Buildings:
• Lewis-McChord 9669: The conventional results were generally indicative of current VI. However, TCE was the only subsurface COC consistently detected in indoor air limiting the ability to evaluate the constituent ratio line of evidence. Building 9669 is a supply distribution warehouse that contains a large variety (over 100) of VOC-containing products. As a result, using the conventional results alone, it would be difficult to conclude with a high degree of confidence that no indoor sources of TCE were present. The on-site analysis protocol (both the baseline sampling and the pressure control) yielded results inconsistent with an indoor source of TCE. These results provided a higher degree of confidence that the TCE detected in indoor air originated in the subsurface. The CSIA protocol also provided supporting evidence of a subsurface source.
• Selfridge 1533: The conventional results were generally indicative of no VI because the maximum benzene concentration in the sub-slab was less than 10x the concentration in indoor air and there were obvious non-removable sources in the building (i.e., automobiles being repaired). However, the benzene concentration in indoor air (14 µg/m3) was almost 10x greater than the risk-based screening value and the maximum benzene concentration in the sub-slab (58 µg/m3) was greater than the concentration in indoor air. As a result, a regulator may have required additional evaluation of whether VI was contributing to the benzene detected in indoor air. The results from the on-site protocol provided greater confidence that indoor sources were the predominate sources of benzene in indoor air because 1) the on-site analysis documented the temporally variable impact of the indoor sources on benzene concentration in indoor air, and 2) the building pressure control results were consistent with an indoor source of benzene. The CSIA
21
protocol provided supporting evidence of NO current VI, consistent with the on-site protocol.
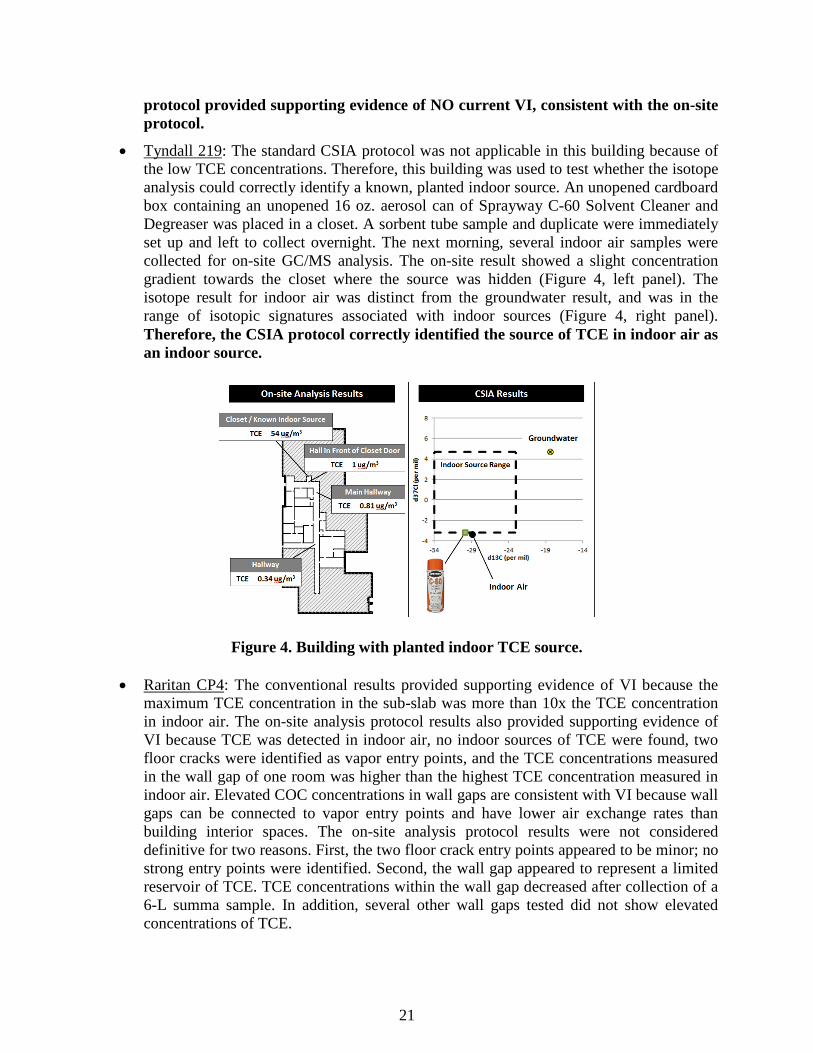
• Tyndall 219: The standard CSIA protocol was not applicable in this building because of the low TCE concentrations. Therefore, this building was used to test whether the isotope analysis could correctly identify a known, planted indoor source. An unopened cardboard box containing an unopened 16 oz. aerosol can of Sprayway C-60 Solvent Cleaner and Degreaser was placed in a closet. A sorbent tube sample and duplicate were immediately set up and left to collect overnight. The next morning, several indoor air samples were collected for on-site GC/MS analysis. The on-site result showed a slight concentration gradient towards the closet where the source was hidden (Figure 4, left panel). The isotope result for indoor air was distinct from the groundwater result, and was in the range of isotopic signatures associated with indoor sources (Figure 4, right panel). Therefore, the CSIA protocol correctly identified the source of TCE in indoor air as an indoor source.
Figure 4. Building with planted indoor TCE source.
• Raritan CP4: The conventional results provided supporting evidence of VI because the maximum TCE concentration in the sub-slab was more than 10x the TCE concentration in indoor air. The on-site analysis protocol results also provided supporting evidence of VI because TCE was detected in indoor air, no indoor sources of TCE were found, two floor cracks were identified as vapor entry points, and the TCE concentrations measured in the wall gap of one room was higher than the highest TCE concentration measured in indoor air. Elevated COC concentrations in wall gaps are consistent with VI because wall gaps can be connected to vapor entry points and have lower air exchange rates than building interior spaces. The on-site analysis protocol results were not considered definitive for two reasons. First, the two floor crack entry points appeared to be minor; no strong entry points were identified. Second, the wall gap appeared to represent a limited reservoir of TCE. TCE concentrations within the wall gap decreased after collection of a 6-L summa sample. In addition, several other wall gaps tested did not show elevated concentrations of TCE.
22
In contrast to the conventional and on-site analysis results, the CSIA results provided strong evidence that indoor sources were the primary sources of TCE in indoor air. Based on the CSIA results, both the conventional and the on-site analysis protocol results appear to have provided an incorrect indication of VI as the source of the TCE in indoor air.
Further support of the CSIA results comes from passive sorbent samplers provided by Geosyntec Consultants. At the end of the demonstration, GSI deployed six passive samplers in the same main room sampled for this study. Geosyntec retrieved the samplers 3 weeks later. The samplers were split, with three submitted to the University of Oklahoma and three submitted to the University of Waterloo for analysis. The results from the active and passive sampling were consistent (Table 11). These preliminary results suggest that, with additional validation, passive sorbent samples may serve as an alternative sample collection device for CSIA for indoor air.
Table 11. Results from active versus passive sampling.
Sampling Method: Active Sampling
(this study) Passive Sampling
Laboratory: University of
Oklahoma University of
Oklahoma University of
Waterloo δ13C (per mil) -30.7 -31.1 -29.2 δ37Cl (per mil) -0.2 Note 2 0.7
The CSIA results for Raritan CP4 provided strong evidence of an indoor source because the TCE in groundwater was enriched in both 13C and 37Cl, consistent with the kinetic isotope effect of biodegradation, while the TCE in indoor air had lower levels of 13C and 37Cl, consistent untransformed TCE. Although no indoor source of TCE was identified during the site visit, the building manager reported that the building’s cleaning service had used a TCE-based spot remover in the past. Although she had requested that they not use chlorinated solvents in the building, she indicated that it was possible that they were still using them during some cleaning events. Although the combined results from the conventional and on-site analysis investigations of Raritan CP4 did not support definitive source identification, the most likely explanation is the recent use of a TCE-containing spot remover. Based on the on-site analysis results, the highest TCE concentrations were found within a cluster of conference rooms that were the only carpeted spaces within the building. TCE concentrations within this cluster of rooms decreased from approximately 6 µg/m3 on the first day of the demonstration to approximately 2 µg/m3 on the fourth day. Although there is some uncertainty because a specific indoor source was not identified, the elevated concentration of TCE in the wall gap would be consistent with recent use of TCE in the building because elevated TCE concentrations would persist longer in the wall gap than in the more ventilated room space.
23
6.2.2 Evaluation of Subsurface Sample Locations
Groundwater vs. Sub-Slab Soil Gas
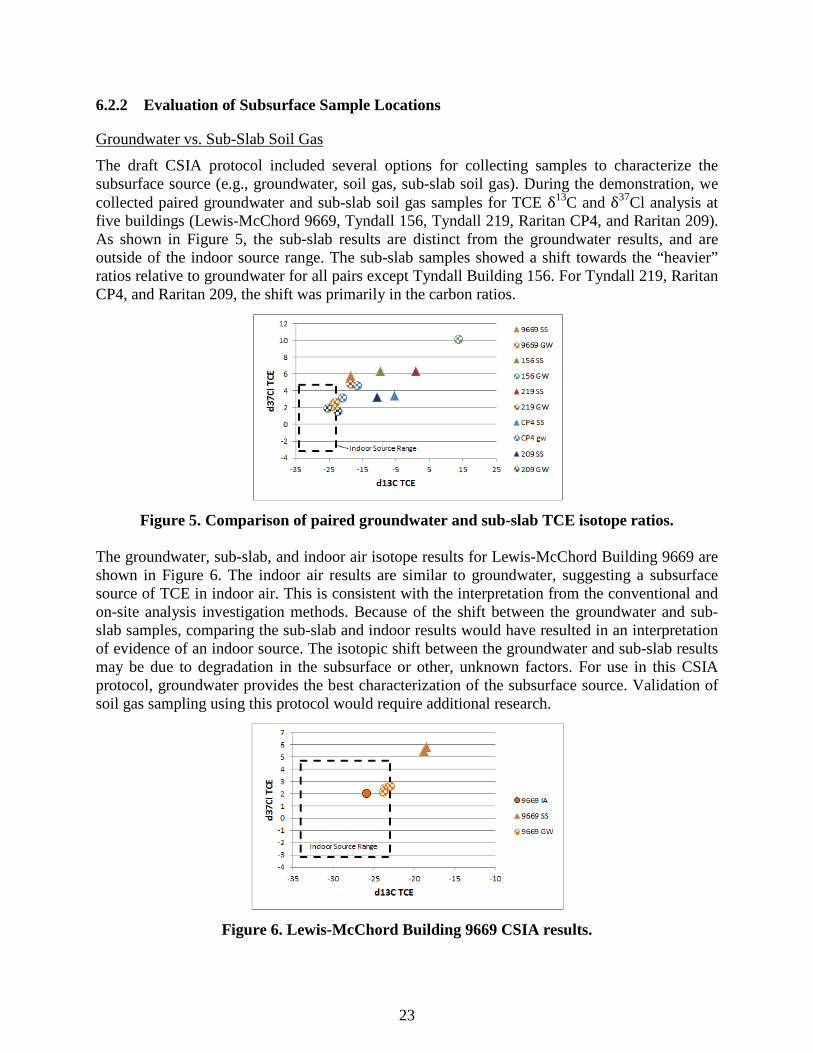
The draft CSIA protocol included several options for collecting samples to characterize the subsurface source (e.g., groundwater, soil gas, sub-slab soil gas). During the demonstration, we collected paired groundwater and sub-slab soil gas samples for TCE δ13C and δ37Cl analysis at five buildings (Lewis-McChord 9669, Tyndall 156, Tyndall 219, Raritan CP4, and Raritan 209). As shown in Figure 5, the sub-slab results are distinct from the groundwater results, and are outside of the indoor source range. The sub-slab samples showed a shift towards the “heavier” ratios relative to groundwater for all pairs except Tyndall Building 156. For Tyndall 219, Raritan CP4, and Raritan 209, the shift was primarily in the carbon ratios.
Figure 5. Comparison of paired groundwater and sub-slab TCE isotope ratios.
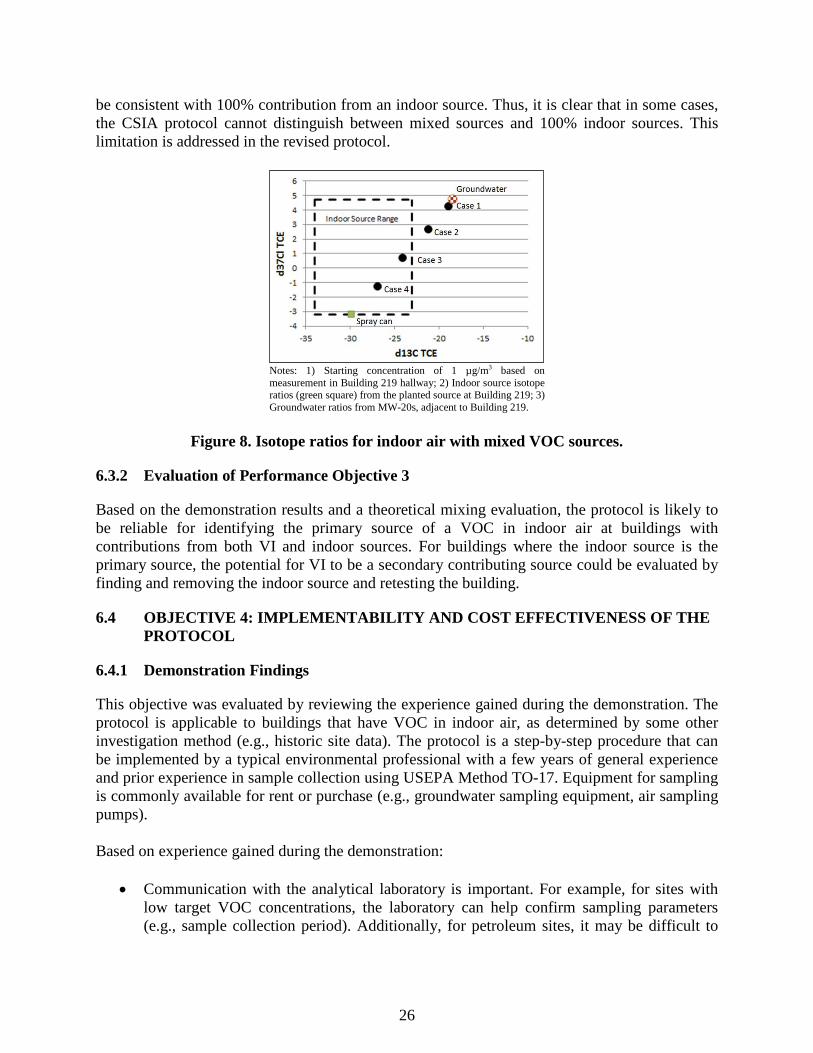
The groundwater, sub-slab, and indoor air isotope results for Lewis-McChord Building 9669 are shown in Figure 6. The indoor air results are similar to groundwater, suggesting a subsurface source of TCE in indoor air. This is consistent with the interpretation from the conventional and on-site analysis investigation methods. Because of the shift between the groundwater and sub-slab samples, comparing the sub-slab and indoor results would have resulted in an interpretation of evidence of an indoor source. The isotopic shift between the groundwater and sub-slab results may be due to degradation in the subsurface or other, unknown factors. For use in this CSIA protocol, groundwater provides the best characterization of the subsurface source. Validation of soil gas sampling using this protocol would require additional research.
Figure 6. Lewis-McChord Building 9669 CSIA results.

24
Finding: Comparisons of groundwater and indoor air results provided the clearest, most conservative interpretations that were also most consistent with the weight of evidence regarding VI. Location of Groundwater Monitoring Wells
As discussed above, results from groundwater samples appeared to be most useful for characterizing the subsurface source. Three demonstration buildings, Lewis-McChord 9669, Raritan CP4, and Raritan 209, provided the opportunity to evaluate the variability within the groundwater source (Figure 7). At these buildings, more than one shallow zone monitoring well was available for sampling during the demonstration. At Lewis-McChord (Figure 7, left panel), results from different locations in the plume were within ±1‰ for δ13C and δ37Cl, which is on the order of analytical variability. At Raritan (Figure 7, right panel), the differences between plume locations were up to about 4‰. The CSIA protocol was only applicable at Building CP4 in which TCE was found in indoor air. The isotope variability observed between monitoring wells made no material difference because, at this building, the indoor air isotope signature was well within the indoor source range and distinct from the groundwater range. Thus, at both of the sites where isotope ratios were measured in samples from multiple wells, the overall interpretation of the results would have been the same using the results from any one of the individual wells. Finding: Sampling locations near, and upgradient of, the buildings of interest best characterize the subsurface source. The demonstration results suggest that a sample from one monitoring well located close to the building of interest will often be sufficient to characterize the isotope ratio of the subsurface source. However, sampling two or more wells may increase the confidence in the results.
Figure 7. Isotope variability in groundwater.
6.2.3 Evaluation of Performance Objective 2
The field demonstration has resulted in validation of the CSIA protocol (provided that groundwater samples are used to characterize the subsurface source). For three of four (Lewis-McChord 9669, Selfridge 1533, Tyndall 219) buildings where the CSIA protocol was applied, the source identification provided by the isotope results (i.e., VI versus indoor source) was

25
consistent with the overall determination of the source based on the evaluation of all available information. For one building (Raritan CP4), the VI classification from the CSIA protocol was different from the preliminary classification based on the other two investigation methods (Table 10). However, based on the evaluation of all available information from all three investigation methods combined, the CSIA protocol performed the best. Additionally:
• The CSIA protocol correctly identified the planted source in Tyndall Building 219.
• The CSIA protocol provided a strong evidence of indoor sources in Raritan Building CP4, where the other two investigation methods yielded more tentative and opposite results (“supporting evidence of VI”).
These results demonstrate that CSIA is a useful supplement to VI investigations for sites where the source of the primary COC in indoor air is not clear. Findings from the demonstration were used to refine the draft protocol. The revised protocol is provided in Appendix E of the Final Report (GSI, 2013b).
6.3 OBJECTIVE 3: VALIDATION OF DRAFT PROTOCOL FOR IDENTIFICATION OF BOTH INDOOR AND SUBSURFACE SOURCES
6.3.1 Identification of both Indoor and Subsurface Sources
The draft protocol was applied at three buildings with indoor sources (Selfridge 1533, Tyndall 219 [planted indoor source], and Raritan CP4) and one building with subsurface sources of VOC (Lewis-McChord 9669). During the course of the demonstration, we were not able to identify a building where indoor air was being impacted by a target VOC originating from both VI and an indoor source. Therefore, the resulting demonstration dataset did not allow direct evaluation of the utility of CSIA in buildings with both indoor and subsurface sources. However, based on the well-established theoretical understanding of the impact of mixed sources on isotope ratios, it is clear that the protocol could yield misleading results in some buildings with mixed sources. To evaluate the impact of mixed sources on the isotope ratios of indoor air samples, we calculated expected isotope ratios in indoor air impacted by both the potential subsurface source at Tyndall Building 219 (as characterized by the groundwater sample from MW-20s) and the planted indoor source. That is, assuming that the total indoor air TCE concentration is 1 µg/m3 (0.2 parts per billion by volume [ppbV]), we calculated indoor air isotope ratios assuming concentrations of 1) 95% of the chemical from groundwater and 5% from the indoor source (Case 1); 2) 75% of the chemical from groundwater and 25% from the indoor source (Case 2); 3) 50% from groundwater and 50% from the indoor source (Case 3); and 4) 25% from groundwater and 75% from the indoor source (Case 4; Figure 8). For Case 1, the CSIA protocol would correctly indicate that the subsurface source is the only significant source of TCE in indoor air (i.e., Scenario B in Figure 3). For Case 2, the CSIA protocol would correctly identify mixed subsurface and indoor sources (i.e., Scenario C in Figure 3). For Cases 3 and 4, the CSIA protocol would identify the indoor source as the “primary source” of TCE in indoor air (i.e., Scenario A in Figure 3), however, the protocol would not provide any indication of the contribution from the subsurface source because the results would
26
be consistent with 100% contribution from an indoor source. Thus, it is clear that in some cases, the CSIA protocol cannot distinguish between mixed sources and 100% indoor sources. This limitation is addressed in the revised protocol.
Notes: 1) Starting concentration of 1 µg/m3 based on measurement in Building 219 hallway; 2) Indoor source isotope ratios (green square) from the planted source at Building 219; 3) Groundwater ratios from MW-20s, adjacent to Building 219.
Figure 8. Isotope ratios for indoor air with mixed VOC sources.
6.3.2 Evaluation of Performance Objective 3
Based on the demonstration results and a theoretical mixing evaluation, the protocol is likely to be reliable for identifying the primary source of a VOC in indoor air at buildings with contributions from both VI and indoor sources. For buildings where the indoor source is the primary source, the potential for VI to be a secondary contributing source could be evaluated by finding and removing the indoor source and retesting the building.
6.4 OBJECTIVE 4: IMPLEMENTABILITY AND COST EFFECTIVENESS OF THE PROTOCOL
6.4.1 Demonstration Findings
This objective was evaluated by reviewing the experience gained during the demonstration. The protocol is applicable to buildings that have VOC in indoor air, as determined by some other investigation method (e.g., historic site data). The protocol is a step-by-step procedure that can be implemented by a typical environmental professional with a few years of general experience and prior experience in sample collection using USEPA Method TO-17. Equipment for sampling is commonly available for rent or purchase (e.g., groundwater sampling equipment, air sampling pumps). Based on experience gained during the demonstration:
• Communication with the analytical laboratory is important. For example, for sites with low target VOC concentrations, the laboratory can help confirm sampling parameters (e.g., sample collection period). Additionally, for petroleum sites, it may be difficult to

27
obtain clean peaks from the analytical method because of potential high concentrations and interfering compounds.
• At petroleum sites, it may only be practical to analyze for carbon isotope ratios. For hydrogen, collecting enough sample mass may require extended sampling times. Problems with saturating the sorbents may also be encountered.
6.4.2 Evaluation of Performance Objective 4
Based on the results of the investigation, the CSIA protocol is implementable as a separate line of evidence to distinguish between indoor and subsurface sources of VOC in indoor air. The protocol is not a standalone investigation technique. Pre-existing data must indicate that target VOC are present in indoor air prior to making the decision to use the CSIA protocol for the purpose of source identification. The protocol is cost-effective; a detailed cost analysis is presented in Section 7.
6.4.3 Modifications to the CSIA Protocol
Based on the experience gained during the demonstration, we recommend the following modifications to the protocol. These recommendations have been incorporated into the protocol instructions provided in Appendix E of the Final Report (GSI, 2013b).
• Extended holding time: Additional analyses were completed to evaluate the effect of extended holding time on sample results. Based on these analyses, refrigerated tubes can be stored for at least 4 weeks prior to analysis. It is recommended that tubes be frozen for holding time longer than 4 weeks. No isotope fractionation was observed in tubes kept in a freezer for more than 6 months prior to analysis.
• Use of groundwater samples to characterize the subsurface source: Based on experience gained during the demonstration, groundwater samples are not only easier to collect, they are more useful for data interpretation, as compared to soil gas samples.
• Mixed Sources: In cases where the protocol identifies an indoor source as the primary source, additional evaluation may be required in some cases to confirm that VI is not a secondary source.

This page left blank intentionally.

29
7.0 COST ASSESSMENT
The cost of implementing the field demonstration program was tracked and used to estimate the expected cost of implementing the CSIA protocol. The following sections summarize the cost for the field demonstrations included in this ESTCP project. It is important to note that the field demonstrations included additional tasks and associated costs in order to validate the protocol, including implementation of a conventional and on-site analysis investigation concurrent with the CSIA investigation. These costs would not be incurred during standard application of the procedure. Therefore, Section 7.1 describes the cost model associated with the demonstration, while Section 7.2 and 7.3 focus on cost considerations for routine application of the procedure.
7.1 COST MODEL FOR THE DEMONSTRATION
The demonstration included three different site characterization methods, each implemented at four DoD sites. Key cost elements included 1) project planning and preparation; 2) field implementation; and 3) data evaluation and reporting. For project planning and preparation and data evaluation and reporting, the primary costs were associated with labor. The time required for planning varied widely, depending on effort needed to gain access, review site data, and test equipment (e.g., senior project scientist/engineer: 10-15 hours per site; project scientist/engineer: 25-35 hours per site). For data evaluation and reporting, key activities include data review and validation, documentation of results, and interpretation and documentation of overall findings (e.g., senior project scientist/engineer: 2-4 hours per site; project scientist/engineer: 8-12 hours per site). Costs for field implementation of the CSIA demonstration are summarized in Table 12.
Table 12. Representative unit costs for CSIA demonstration.
Cost Element Sub Category Representative Unit
Cost Representative Unit
CSIA Field Program
Labor hours: Senior Project Scientist/Engineer 2-4 Hours per building
Labor hours: Project Scientist/Engineer 2-4 Hours per building
Equipment Purchase or Rental (e.g., air sampling pumps, sorbent tube holders; pumps/supplies for groundwater sampling)
$1251 Dollars per day
Sample Analysis $350-400 Dollars per single isotope per sample
Note: General costs such as travel and shipping are not included. Per-sample costs for isotope analysis are based on the sample matrix and the isotopes desired. For example, if TCE is the key COC in a groundwater sample, analyses may be done for carbon and/or chlorine isotope ratios. If both are needed, then the analytical cost would be $750 (TCE C $350 + TCE Cl $400) for that sample. If only chlorine is needed, then the analytical cost would be $400.

30
7.2 COST DRIVERS
The CSIA protocol does not require collection of a large number of samples or a time-intensive field effort. Therefore, the cost for implementation of the CSIA protocol is not expected to vary significantly based on specific site characteristics. Instead, key cost drivers relate to mobilization and the number of buildings to be evaluated at the site.
7.3 COST ANALYSIS
Routine implementation of the CSIA protocol will cost less than implementation during the field demonstration because of the additional tasks needed during the demonstration to validate the protocol. The CSIA protocol is not used as a standalone investigation method. The protocol is appropriate when previously collected data indicate that the concentration of target VOC in indoor air are near or above risk-based (i.e., regulatory) screening levels and the source (i.e., VI versus indoor source) has not been determined. Application of the CSIA protocol is not likely to directly substitute for conventional sampling; rather, it will primarily be considered at sites where conventional sampling has failed to yield definitive source identification.
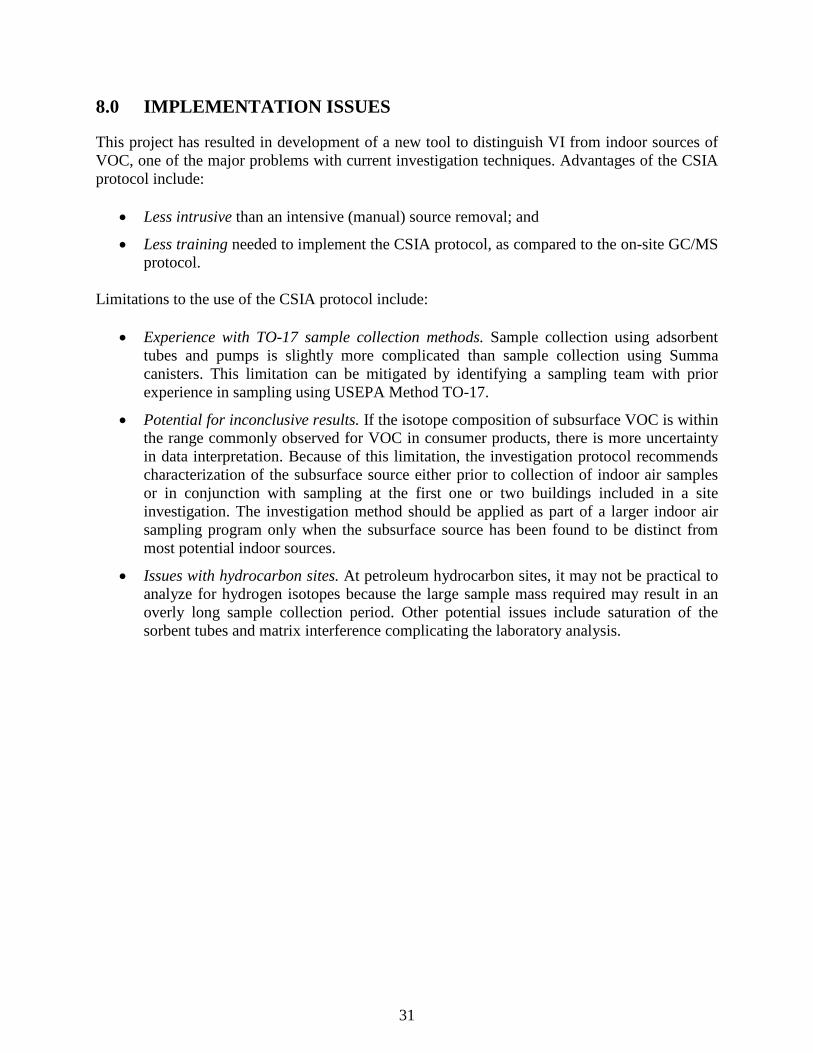
31
8.0 IMPLEMENTATION ISSUES
This project has resulted in development of a new tool to distinguish VI from indoor sources of VOC, one of the major problems with current investigation techniques. Advantages of the CSIA protocol include:
• Less intrusive than an intensive (manual) source removal; and
• Less training needed to implement the CSIA protocol, as compared to the on-site GC/MS protocol.
Limitations to the use of the CSIA protocol include:
• Experience with TO-17 sample collection methods. Sample collection using adsorbent tubes and pumps is slightly more complicated than sample collection using Summa canisters. This limitation can be mitigated by identifying a sampling team with prior experience in sampling using USEPA Method TO-17.
• Potential for inconclusive results. If the isotope composition of subsurface VOC is within the range commonly observed for VOC in consumer products, there is more uncertainty in data interpretation. Because of this limitation, the investigation protocol recommends characterization of the subsurface source either prior to collection of indoor air samples or in conjunction with sampling at the first one or two buildings included in a site investigation. The investigation method should be applied as part of a larger indoor air sampling program only when the subsurface source has been found to be distinct from most potential indoor sources.
• Issues with hydrocarbon sites. At petroleum hydrocarbon sites, it may not be practical to analyze for hydrogen isotopes because the large sample mass required may result in an overly long sample collection period. Other potential issues include saturation of the sorbent tubes and matrix interference complicating the laboratory analysis.

This page left blank intentionally.
33
9.0 REFERENCES
Dawson, H. E., and T. McAlary, 2009. A compilation of statistics for VOC from post-1990 indoor air concentration studies in North American residences unaffected by subsurface vapor intrusion, Ground Water Monitoring and Remediation, Vol. 29, No. 1, pp. 60-69.
GSI Environmental (GSI), 2012a. ER-201025 Task 2 Report: Characterization of Sources and
Investigation Protocol, Use of Compound-Specific Stable Isotope Analysis to Distinguish between Vapor Intrusion and Indoor Sources of VOC (McHugh, Kuder, Philp), Version 2, May 2012.
GSI, 2012b. ER-201025 Demonstration Plan, Use of Compound-Specific Isotope Analysis to
Distinguish between Vapor Intrusion and Indoor Sources of VOC (McHugh, Kuder, Philp), Version 2, June 2012.
GSI, 2013a. ER-201119 Final Report, Use of On-Site GC/MS Analysis to Distinguish between
Vapor Intrusion and Indoor Sources of VOC (Beckley, McHugh, Gorder, Dettenmaier, Rivera-Duarte), Version 2, November 2013.
GSI, 2013b. ER-201025 Final Report, Use of Compound-Specific Stable Isotope Analysis to
Distinguish between Vapor Intrusion and Indoor Sources of VOC (Beckley, McHugh, Kuder, Philp), Version 2, November 2013.
Kuder, T., M. Klisch, R.P. Philp, and T. McHugh, 2012. ER-201025, Laboratory Study Report,
Use of Compound-Specific Stable Isotope Analysis to Distinguish between Vapor Intrusion and Indoor Sources of VOC, Version 2, 24 January 2012.
McHugh T., T. Kuder, S. Fiorenza, K. Gorder, E. Dettenmaier, and P. Philp, 2011. Application of
CSIA to Distinguish Between Vapor Intrusion and Indoor Sources of VOC. Environmental Science and Technology, July 15, 2011, Vol. 45, No. 14, pp. 5952-5958.
Sakaguchi-Soder, K., J. Jager, H. Grund, F. Matthaus, and C. Schuth, 2007. Monitoring and
evaluation of dechlorination processes using compound-specific chlorine isotope analysis, Rapid Commun. Mass Spectrom., Vol. 21, pp. 3077-3084.
U.S. Environmental Protection Agency (USEPA), 1999a. Compendium Method TO-15,
Determination of Volatile Organic Compounds (VOC) in Air Collected in Specially-Prepared Canisters and Analyzed by Gas Chromatography/Mass Spectrometry (GC/MS), EPA/625/R-96/010b, January 1999.
USEPA, 1999b. Compendium Method TO-17, Determination of Volatile Organic Compounds
(VOC) in Ambient Air Using Active Sampling Onto Sorbent Tubes, EPA/625/R-96/010b, January 1999.
34
USEPA, 2002. Draft Guidance for Evaluating the Vapor Intrusion to Indoor Air Pathway from Groundwater and Soils (Subsurface Vapor Intrusion Guidance), 2002, Available at http://www.epa.gov/epaoswer/hazwaste/ca/eis/vapor.htm.
USEPA, 2008. A Guide for Assessing Biodegradation and Source Identification of Organic
Groundwater Contaminants using Compound Specific Isotope Analysis (CSIA), Office of Research and Development, EPA 600/R-08/148, December 2008.
USEPA, 2011. Background Indoor Air Concentrations of Volatile Organic Compounds in North
American Residences (1990-2009), U.S. Environmental Protection Agency Office of Solid Waste and Emergency Response, EPA 530-R-10-001, June 2011.
USEPA, 2013. Regional Screening Table (May 2013), Available at
http://www.epa.gov/reg3hwmd/risk/human/rb-concentration_Table/index.htm. Accessed 6/22/2013.

A-1
APPENDIX A
POINTS OF CONTACT
Point of Contact Organization
Phone Fax
E-Mail Role In Project
Tom McHugh GSI Environmental Inc. 2211 Norfolk Street, Suite 1000 Houston, TX 77098
E-Mail: [email protected] Principal Investigator (PI)
Lila Beckley GSI Environmental Inc. 9600 Great Hills Trail, Suite 350E Austin, TX 78759
Phone: 512-346-4474 Fax: 512-346-4476 E-mail: [email protected]
Project Team Member
Tomasz Kuder School of Geology and Geophysics University of Oklahoma 100 E. Boyd Street, Room # A-119 Norman, OK 73019
E-mail: [email protected] Project Team Member
R. Paul Philp School of Geology and Geophysics University of Oklahoma 100 E. Boyd Street, Room # A-119 Norman, OK 73019
E-mail: [email protected] Project Team Member
Dr. Sam Brock
AFCEC 3300 Sidney Brooks Brooks City-Base, TX 78235
Phone: 210-536-4329 Fax: 210-536-4330 E-mail: [email protected]
Contracting Officer’s Rep.
William Myers
Environmental Restoration Bldg 2012 Liggett Avenue Room 313 Box 339500, MS-17 JBLM, WA 98433-9500
Phone: 253-477-3742 E-mail: [email protected]
Site Project Manager (Demonstration Site #1)
Cheryl Neades Environmental Division, IMMI-PWE U.S. Army Garrison Detroit Arsenal, MI 48092
Phone: 586-282-8345 E-mail: [email protected]
Site Project Manager (Demonstration Site #2)
Miguel Plaza Environmental Restoration Flight 325 CES/PMO 119 Alabama Avenue Tyndall AFB, FL 32403
Phone: 850-283-2398 E-mail: [email protected]
Site Project Manager (Demonstration Site #3)
Sandra Piettro Environmental Branch U.S. Army Corps of Engineers NY District Jacob K. Javits Federal Building 26 Federal Plaza Room 1811 New York, NY 10278-0098
Phone: 917-790-8487 E-mail: [email protected]
Site Project Manager (Demonstration Site #4)
Andrea Leeson
ESTCP Office 4800 Mark Center Drive, Suite 17D08 Alexandria, VA 22350
Phone: 571.372.6398 E-mail: [email protected]
Environmental Restoration Program Manager

This page left blank intentionally.