use of electronic medical records by ambulatory care providers
TRANSCRIPT

Number 22 n April 30, 2010
Use of Electronic Medical Records by Ambulatory Care Providers: United States, 2006
by Esther Hing, M.P.H.; Margaret J. Hall, Ph.D.; and Jill J. Ashman, Ph.D. Division of Health Care Statistics
Abstract Objectives—This report presents 2006 information on adoption of electronic
medical records (EMRs) in five ambulatory care settings. Use of EMR systems within these settings is presented by selected provider characteristics.
Methods—Nationally representative estimates are from 2006 provider-based surveys, including the National Ambulatory Medical Care Survey (NAMCS), the National Hospital Ambulatory Medical Care Survey (NHAMCS), and the National Survey of Ambulatory Surgery (NSAS).
Results—In 2006, 62.4 percent of hospital-based ambulatory surgery centers (ASCs) reported using EMR systems, almost triple the percentage reported by freestanding ASCs (22.3 percent). EMR use by hospital emergency departments (EDs) was 46.2 percent, followed by hospital outpatient departments (OPDs) (29.4 percent) and office-based physicians (29.2 percent). Based on items collected in the 2006 NAMCS, NHAMCS, and NSAS, 18.6 percent of hospital-based ASCs, 14.0 percent of hospital EDs, and 10.5 percent of office-based physicians had systems with similar features of a basic system, but only 1.7 percent of hospital EDs and 3.1 percent of office-based physicians had systems with similar features of a fully functional system. Fully functional systems are a subset of basic systems. Physicians in practices with 11 or more physicians were most likely to use EMRs (46.5 percent), whereas physicians in solo practices were least likely to use EMRs (24.0 percent). Use of EMR systems was higher among physicians located in the West (42.3 percent) than in other regions of the country (23.5 percent to 29.3 percent). EMR use did not vary by neighborhood poverty level for any of the ambulatory providers studied. From 2001 through 2005, EMR systems in hospital EDs increased by 47.2 percent. Use of EMRs among office-based physicians increased by 60.4 percent from 2001 through 2006. If those without EMR systems in 2006 with definite plans to install a system actually do so, 85.4 percent of hospital-based ASCs, 72.2 percent of EDs, 62.6 percent of OPDs, 47.3 percent of freestanding ASCs, and 47.0 percent of physicians will be using EMR systems in 2009.
Keywords: physicians c emergency departments c outpatient departments c ambulatory surgery centers
U.S. DEPARTMENT OF HEALTH AND HUMAN SECenters for Disease Control and Prevent
National Center for Health Statistics
Introduction Policymakers’ interest in the
progress of health information technology (HIT) adoption by health care providers has increased since 2004, when the federal government set the goal that most Americans would have electronic health records (EHRs) by 2014 (1). The American Recovery and Reinvestment Act (ARRA) of 2009 may accelerate the pace of EHR adoption by health care providers, because it includes funding to promote the adoption and use of EHR systems (2). Starting in 2011, physicians who can demonstrate meaningful use of interoperable systems may receive extra Medicare payments over 5 years (2).
This report presents data on the use of electronic medical record (EMR) systems in 2006 from five types of ambulatory health care providers: office-based physicians, hospital outpatient departments (OPDs), hospital emergency departments (EDs), and for the first time, hospital-based and freestanding ambulatory surgery centers (ASCs). The report includes data on the number and characteristics of providers that used any EMR (all or partially electronic) system and the features contained within those systems. The National Ambulatory Medical Care
RVICES ion
Page 2 National Health Statistics Reports n Number 22 n April 30, 2010
Survey (NAMCS) and the National Hospital Ambulatory Medical Care Survey (NHAMCS) have collected data on EMR systems since 2001 (3–6). The report includes trend data on EMR systems in these settings. The report also provides estimates of providers with plans to adopt EMR systems within the next 3 years.
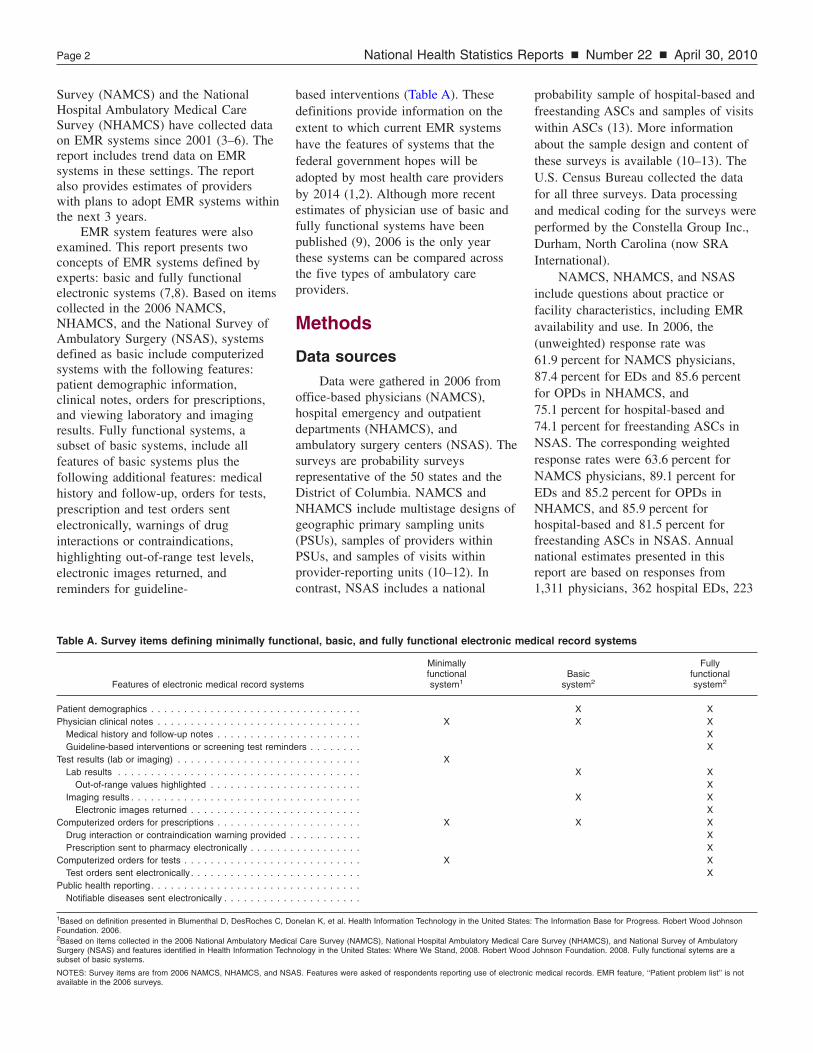
EMR system features were also examined. This report presents two concepts of EMR systems defined by experts: basic and fully functional electronic systems (7,8). Based on items collected in the 2006 NAMCS, NHAMCS, and the National Survey of Ambulatory Surgery (NSAS), systems defined as basic include computerized systems with the following features: patient demographic information, clinical notes, orders for prescriptions, and viewing laboratory and imaging results. Fully functional systems, a subset of basic systems, include all features of basic systems plus the following additional features: medical history and follow-up, orders for tests, prescription and test orders sent electronically, warnings of drug interactions or contraindications, highlighting out-of-range test levels, electronic images returned, and reminders for guideline-
Table A. Survey items defining minimally funct
Features of electronic medical record syste
Patient demographics . . . . . . . . . . . . . . . . . . . . . .Physician clinical notes . . . . . . . . . . . . . . . . . . . . .
Medical history and follow-up notes . . . . . . . . . . . .Guideline-based interventions or screening test remind
Test results (lab or imaging) . . . . . . . . . . . . . . . . . .Lab results . . . . . . . . . . . . . . . . . . . . . . . . . . .
Out-of-range values highlighted . . . . . . . . . . . . .Imaging results . . . . . . . . . . . . . . . . . . . . . . . . .
Electronic images returned . . . . . . . . . . . . . . . .Computerized orders for prescriptions . . . . . . . . . . . .
Drug interaction or contraindication warning provided .Prescription sent to pharmacy electronically . . . . . . .
Computerized orders for tests . . . . . . . . . . . . . . . . .Test orders sent electronically . . . . . . . . . . . . . . . .
Public health reporting. . . . . . . . . . . . . . . . . . . . . .Notifiable diseases sent electronically . . . . . . . . . . .
1Based on definition presented in Blumenthal D, DesRoches C, DoFoundation. 2006. 2Based on items collected in the 2006 National Ambulatory MedicaSurgery (NSAS) and features identified in Health Information Techsubset of basic systems.
NOTES: Survey items are from 2006 NAMCS, NHAMCS, and NSAavailable in the 2006 surveys.
based interventions (Table A). These definitions provide information on the extent to which current EMR systems have the features of systems that the federal government hopes will be adopted by most health care providers by 2014 (1,2). Although more recent estimates of physician use of basic and fully functional systems have been published (9), 2006 is the only year these systems can be compared across the five types of ambulatory care providers.
Methods
Data sources
Data were gathered in 2006 from office-based physicians (NAMCS), hospital emergency and outpatient departments (NHAMCS), and ambulatory surgery centers (NSAS). The surveys are probability surveys representative of the 50 states and the District of Columbia. NAMCS and NHAMCS include multistage designs of geographic primary sampling units (PSUs), samples of providers within PSUs, and samples of visits within provider-reporting units (10–12). In contrast, NSAS includes a national
ional, basic, and fully functional electronic med
Minimally functional
ms system1
. . . . . . . . . .
. . . . . . . . . . X
. . . . . . . . . . ers . . . . . . . . . . . . . . . . . . X . . . . . . . . . . . . . . . . . . . . . . . . . . . . . . . . . . . . . . . . . . . . . . . . . . X . . . . . . . . . . . . . . . . . . . . . . . . . . . . . . X . . . . . . . . . . . . . . . . . . . . . . . . . . . . . .
nelan K, et al. Health Information Technology in the United States:
l Care Survey (NAMCS), National Hospital Ambulatory Medical Canology in the United States: Where We Stand, 2008. Robert Wood
S. Features were asked of respondents reporting use of electronic
probability sample of hospital-based and freestanding ASCs and samples of visits within ASCs (13). More information about the sample design and content of these surveys is available (10–13). The U.S. Census Bureau collected the data for all three surveys. Data processing and medical coding for the surveys were performed by the Constella Group Inc., Durham, North Carolina (now SRA International).
NAMCS, NHAMCS, and NSAS include questions about practice or facility characteristics, including EMR availability and use. In 2006, the (unweighted) response rate was 61.9 percent for NAMCS physicians, 87.4 percent for EDs and 85.6 percent for OPDs in NHAMCS, and 75.1 percent for hospital-based and 74.1 percent for freestanding ASCs in NSAS. The corresponding weighted response rates were 63.6 percent for NAMCS physicians, 89.1 percent for EDs and 85.2 percent for OPDs in NHAMCS, and 85.9 percent for hospital-based and 81.5 percent for freestanding ASCs in NSAS. Annual national estimates presented in this report are based on responses from 1,311 physicians, 362 hospital EDs, 223
ical record systems
Fully Basic functional
system2 system2
X X X X
X X
X X X
X X X
X X X X X X
The Information Base for Progress. Robert Wood Johnson
re Survey (NHAMCS), and National Survey of Ambulatory Johnson Foundation. 2008. Fully functional sytems are a
medical records. EMR feature, ‘‘Patient problem list’’ is not

National Health Statistics Reports n Number 22 n April 30, 2010 Page 3
hospital OPDs, and 143 hospital-based and 295 freestanding ASCs.
This report includes several measures of EMR use or availability based on 2006 induction interview responses by NAMCS, NHAMCS, and NSAS respondents. This report covers use of any EMR system, future plans to install an EMR system within the next 3 years, and availability of EMR systems that include the features of basic and fully functional EHR systems among ambulatory care providers (7,8,14,15).
Any EMR use for NAMCS, NHAMCS, and NSAS is based on the question, ‘‘Does your [practice/ED/OPD/ this facility/hospital] use electronic medical records (not including billing records)?’’
In this report, a ‘‘yes’’ response to either all electronic or partially electronic (part paper and part electronic) medical records by ambulatory providers is described as using any EMR system (see Figures I–III in the ‘‘Technical Notes’’ section for the actual questions used in the 2006 surveys). Note that in 2001, 2002, and 2005, the NHAMCS EMR question asked about EMR availability rather than use: ‘‘Does your [ED/OPD] have electronic medical records (EMR)?’’ In 2006, the NHAMCS question was changed (‘‘Does your [ED/OPD] use electronic medical records?’’) in order to match the question asked of NAMCS physicians since 2001. The change in NHAMCS question wording affects 2006 EMR estimates for EDs and OPDs when compared with those from earlier years, because potentially more EDs and OPDs could have EMRs available, but not actually use them (see Figure IV in the ‘‘Technical Notes’’ section for 2005 NHAMCS questions).
Respondents in 2006 who reported using any EMR system were asked additional questions about whether their EMR systems included specific features, such as computerized orders for tests or prescriptions (see the ‘‘Technical Notes’’ section for the actual questions used in the 2006 and 2005 surveys). Using similar definitions developed by HIT experts, these detailed questions make it possible to categorize EMR systems as basic or fully functional (7,8,14,15).
Basic and fully functional systems are subsets of EMR systems; fully functional systems are a subset of basic systems. The categories of basic and fully functional have superseded the category of minimally functional (Table A). Minimally functional systems are not discussed in this report, but for comparison with previous reports, estimates of these systems for EDs, OPDs, and ASCs are included in the table in the ‘‘Technical Notes’’ section. This report presents estimates of any EMR use, as well as use of basic and fully functional systems.
This report discusses basic and fully functional EMR systems in terms of availability to providers in 2006 rather than actual use by these providers. Based on the question wording, ‘‘Does your [practice’s/ED’s/OPD’s/facility’s/ hospital’s] electronic medical record include’’ specific features, it is not known whether the features defining basic and fully functional systems were actually used, although they were available. Estimates of basic and fully functional systems also assume that any feature reported as available but turned off was a feature of the facility’s EMR system, because a feature was there and available for use. In 2006, one or more features were turned off for 2.3 percent of physicians, 9.4 percent of hospital EDs, 5.2 percent of hospital OPDs, and 12.1 percent of freestanding and 9.7 percent of hospital-based ASCs.
Data on EMR system use were missing for fewer than 2 percent of each provider type (1.8 percent of physicians, 0.7 percent of hospital EDs, 1.2 percent of hospital OPDs, 1.3 percent of freestanding ASCs, 1.0 percent of hospital-based ASCs). For this analysis, providers that had missing data on EMR use were assumed to not have an EMR system. If missing cases were randomly distributed, this approach might underestimate the incidence of EMR adoption.
The report also presents projections of EMR availability in 3 years, based on questions about future plans to upgrade or install a new EMR system within 3 years. For this projection, estimates of future use include current EMR users and providers without an EMR system
in 2006 who reported having plans to install a new EMR system.
In this report, EMR measures are examined by characteristics of providers. Physician practice size was defined for the location where the physician saw most patients during the sampled week of practice. For the 0.9 percent of physicians missing this information, practice size was imputed by randomly assigning a value from a physician with similar characteristics (employment setting, physician specialty, and geographic region). Neighborhood poverty level, defined as the percentage of the county population with income below the poverty level, was obtained from the Area Resource File (16) and matched to the counties of providers participating in NSAS, NAMCS, and NHAMCS. The county percentages were then divided into tertiles. The first tertile included counties with the lowest level of poverty, that is, those in which under 10 percent of the population was below the poverty level. The second tertile included those with 10 percent– 13.4 percent of the population below the poverty level and the last one included those counties having more than 13.4 percent of the population below the poverty level.
For NAMCS, NHAMCS, and NSAS, the sampling weights used to derive national estimates (10–13) and to calculate the corresponding sampling errors (17) take into account the complex sampling design. Statements of differences in estimates are based on statistical tests (e.g., chi-square tests of independence, students-t, or weighted linear regression) with significance at the p < 0.05 level for NAMCS and NHAMCS and the p < 0.01 level for NSAS.
In this report, estimates that do not meet standards of reliability or precision are flagged. The relative standard error (RSE) of an estimate is obtained by dividing the standard error by the estimate itself. The result is then expressed as a percentage of the estimate. Estimates based on 30 or more cases include an asterisk if the RSE of the estimate exceeds 30 percent. Estimates are not presented if they are based on fewer than 20 cases in the
70
60
Hospital outpatient
departments
22.3
29.2 29.4
46.2
62.4
50
Per
cent
of p
rovi
ders
40
30
20
10
0 Freestanding ambulatory
surgery centers
Physicians’ offices
Hospital emergency
departments
Hospital-based ambulatory
surgery centers
Setting
NOTE: Any EMR is a medical record system that is either all or partially electronic (excluding systems solely for billing). Basic and fully functional systems are subsets of EMR systems. SOURCES: CDC/NCHS, National Ambulatory Medical Care Survey, National Hospital Ambulatory Medical Care Survey, and National Survey of Ambulatory Surgery.
0
4
8
16
20 Basic system Fully functional system
Freestanding Physicians’ Hospital Hospital-based ambulatory offices emergency ambulatory
surgery centers departments surgery centers
Hospital outpatient
departments
*3.2
10.5
*6.0
14.0
18.6
*0.5
3.1
*0.8 1.7
*3.9
Setting * Figure does not meet standards of reliability or precision. NOTES: Basic and fully functional systems are subsets of EMR systems. The components of a basic and fully functional system are listed in Table A. SOURCES: CDC/NCHS, National Ambulatory Medical Care Survey, National Hospital Ambulatory Medical Care Survey, and National Survey of Ambulatory Surgery.
Per
cent
of p
rovi
ders
12
Page 4 National Health Statistics Reports n Number 22 n April 30, 2010
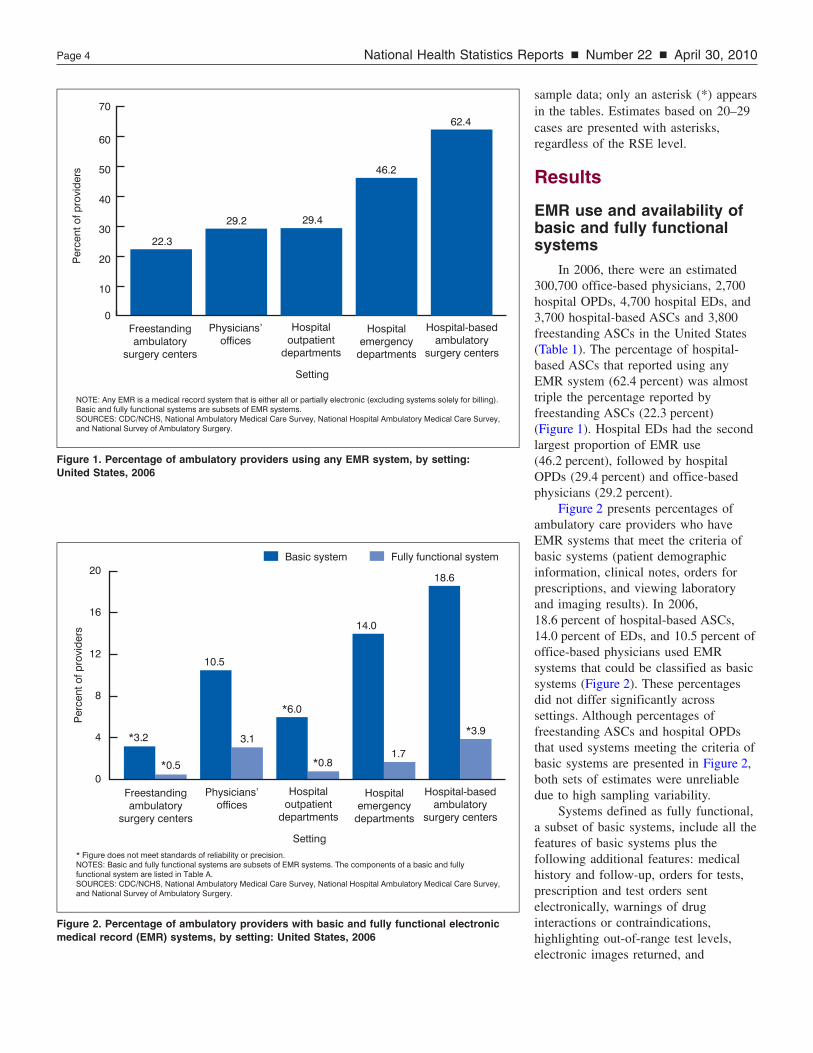
Figure 1. Percentage of ambulatory providers using any EMR system, by setting: United States, 2006
Figure 2. Percentage of ambulatory providers with basic and fully functional electronic medical record (EMR) systems, by setting: United States, 2006
sample data; only an asterisk (*) appears in the tables. Estimates based on 20–29
regardless of the RSE level. cases are presented with asterisks,
Results
EMR use and availability of basic and fully functional systems
In 2006, there were an estimated 300,700 office-based physicians, 2,700 hospital OPDs, 4,700 hospital EDs, and 3,700 hospital-based ASCs and 3,800 freestanding ASCs in the United States (Table 1). The percentage of hospital-based ASCs that reported using any EMR system (62.4 percent) was almost triple the percentage reported by freestanding ASCs (22.3 percent) (Figure 1). Hospital EDs had the second largest proportion of EMR use (46.2 percent), followed by hospital OPDs (29.4 percent) and office-based physicians (29.2 percent).
Figure 2 presents percentages of ambulatory care providers who have EMR systems that meet the criteria of basic systems (patient demographic information, clinical notes, orders for prescriptions, and viewing laboratory and imaging results). In 2006, 18.6 percent of hospital-based ASCs, 14.0 percent of EDs, and 10.5 percent of office-based physicians used EMR systems that could be classified as basic systems (Figure 2). These percentages did not differ significantly across settings. Although percentages of freestanding ASCs and hospital OPDs that used systems meeting the criteria of basic systems are presented in Figure 2, both sets of estimates were unreliable due to high sampling variability.
Systems defined as fully functional, a subset of basic systems, include all the features of basic systems plus the following additional features: medical history and follow-up, orders for tests, prescription and test orders sent electronically, warnings of drug interactions or contraindications, highlighting out-of-range test levels, electronic images returned, and

80
90
Office-based physicians Hospital emergency departments
Per
cent
of p
hysi
cian
s
Per
cent
of e
mer
genc
y de
part
men
ts
0
10
20
30
40
50
60
70
80
24.0 28.0
30.0 30.9
46.5
0
10
20
30
40
50
27.7
59.2
68.8
Solo 2 3–5 6–10 11 or more Under 100 100–199 200 or more
Number of physicians Number of hospital beds
80
26.9
77.8
33.1
44.7
26.1
74.3
Nonprofit Government Proprietary
Hospital ownership
Per
cent
of e
mer
genc
y de
part
men
ts
70
60
50
40
30
20
10
70
60
50
40
30
20
10
0
Per
cent
of p
hysi
cian
s
0 Physician or Health maintenance Other ownership
physician group organization
Practice ownership
NOTES: Any EMR is a medical record system that is either all or partially electronic (excluding systems solely for billing). Office-based physicians include nonfederal, office-based physicians who see patients in an office setting. Excludes radiologists, anesthesiologists, and pathologists. SOURCES: CDC/NCHS, National Ambulatory Medical Care Survey and National Hospital Ambulatory Medical Care Survey.
National Health Statistics Reports n Number 22 n April 30, 2010 Page 5
Figure 3. Percentage of office-based physicians and hospital emergency departments using any EMR system, by size and ownership: United States, 2006
reminders for guideline-based interventions (Table A). In 2006, only a small percentage of ambulatory care providers had an EMR system with features of a fully functional system; 3.1 percent of office-based physicians and 1.7 percent of hospital EDs had such a system (Figure 2). National estimates of hospital OPDs and ASCs (both hospital-based and freestanding)
using EMR systems meeting these criteria were unreliable due to small cell sizes.
Variation in use of EMR systems
Consistent with findings from previous studies, the larger the practice size, the more likely physicians were to
use any EMR (4–6). Physicians in practices with 11 or more physicians were most likely to use EMRs (46.5 percent), whereas physicians in solo practices were least likely to use EMRs (24.0 percent) (Figure 3). Similarly, EMR use by EDs in large hospitals with 200 or more beds (68.8 percent) was more likely than in small hospitals with fewer than 100
Page 6 National Health Statistics Reports n Number 22 n April 30, 2010
beds (27.7 percent). However, in hospital-based ASCs and OPDs, EMR use did not vary by hospital size (Table 2). Comparable information on the size of freestanding ASCs was not collected, so it was not possible to examine EMR use by size for these providers.
EMR use varied by ownership status. Among office-based physicians, EMR use was highest in HMO-owned practices (Figure 3). EMR use in hospital EDs varied by hospital ownership. EDs in government-owned hospitals were less likely to use EMR systems than EDs in both proprietary and nonprofit hospitals. Use of EMR systems was unrelated to hospital ownership among hospital OPDs and hospital-based ASCs. Information on ownership of freestanding ASCs was not collected.
EMR use also varied by geographic region. Use of EMR systems was higher among physicians located in the West (42.3 percent) than in other regions of the country (23.5 percent–29.3 percent) (Table 2). Office-based physicians and EDs located in metropolitan statistical areas (MSAs) had significantly more EMR usage. The relationship between MSA status and EMR usage appears to follow a similar pattern for hospital OPDs and ASCs (freestanding and hospital-based), but differences were not statistically significant because estimates were either unreliable or had high sampling variability. EMR use did not vary by neighborhood poverty level for any of the ambulatory providers studied.
Variation in use of basic systems
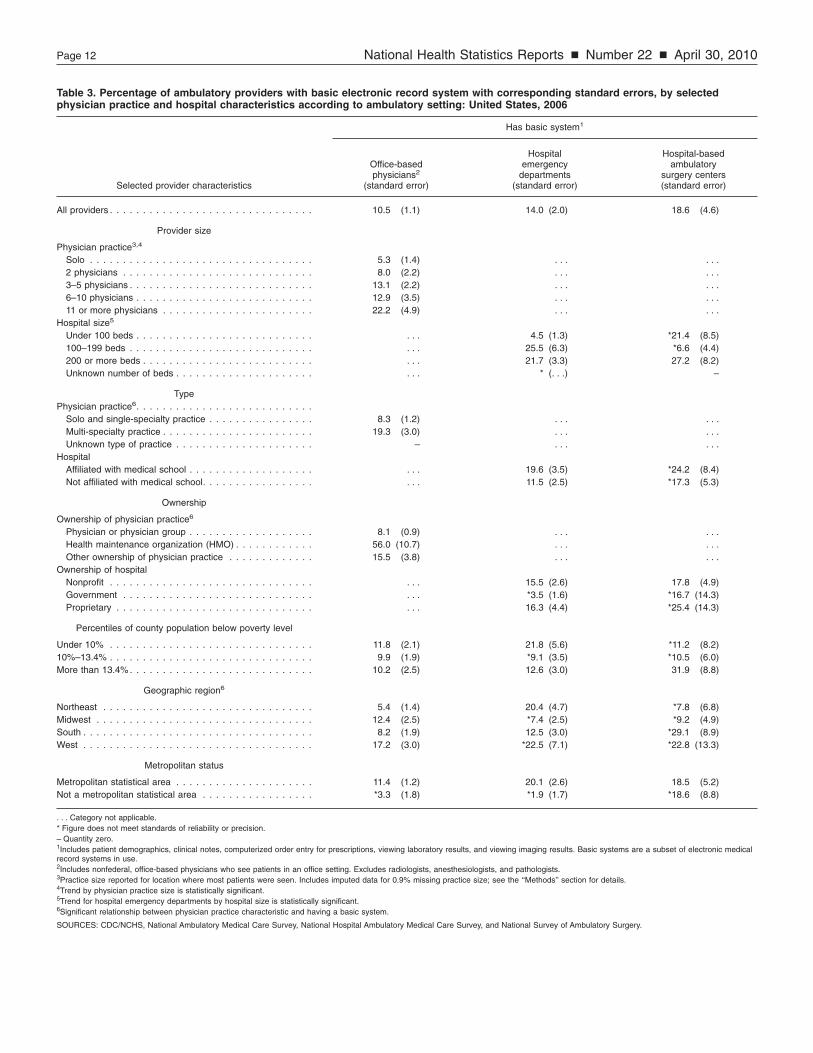
Table 3 presents characteristics of office-based physicians, hospital EDs, and hospital-based ASCs whose EMR systems had features meeting the criteria of a basic system. The observed associations between office-based physicians’ characteristics and their use of basic systems were the same as the previously discussed associations found between physicians’ characteristics and any EMR use. That is, their use of basic systems was positively associated with
practice size, highest among HMO-owned practices compared with other practices, and higher among physicians located in MSAs than physicians practicing outside of MSAs. Physicians in multi-specialty practices were more likely than physicians in solo or single-specialty practices to use basic systems, and physicians in the West were more likely to use basic systems than physicians in the Northeast. EDs in proprietary hospitals were more likely to use basic EMR systems than EDs in nonprofit hospitals. The high variability of this measure among the remaining provider settings limited other comparisons.
Variation in use of fully functional systems
Nationally, 3.1 percent of office-based physicians and 1.7 percent of hospital EDs used EMR systems with the features of fully functional systems, while the percentages of hospital OPDs and ASCs (both hospital-based and freestanding) using such systems were unreliable (Figure 2). Due to small cell sizes of physicians and EDs using fully functional systems, few physician estimates by practice characteristics and few ED estimates by hospital characteristics were reliable. In 2006, 7.3 percent of physicians in the West used systems that met the criteria of fully functional systems, but estimates of physicians using such systems in the remaining geographic regions were unreliable (data not shown).
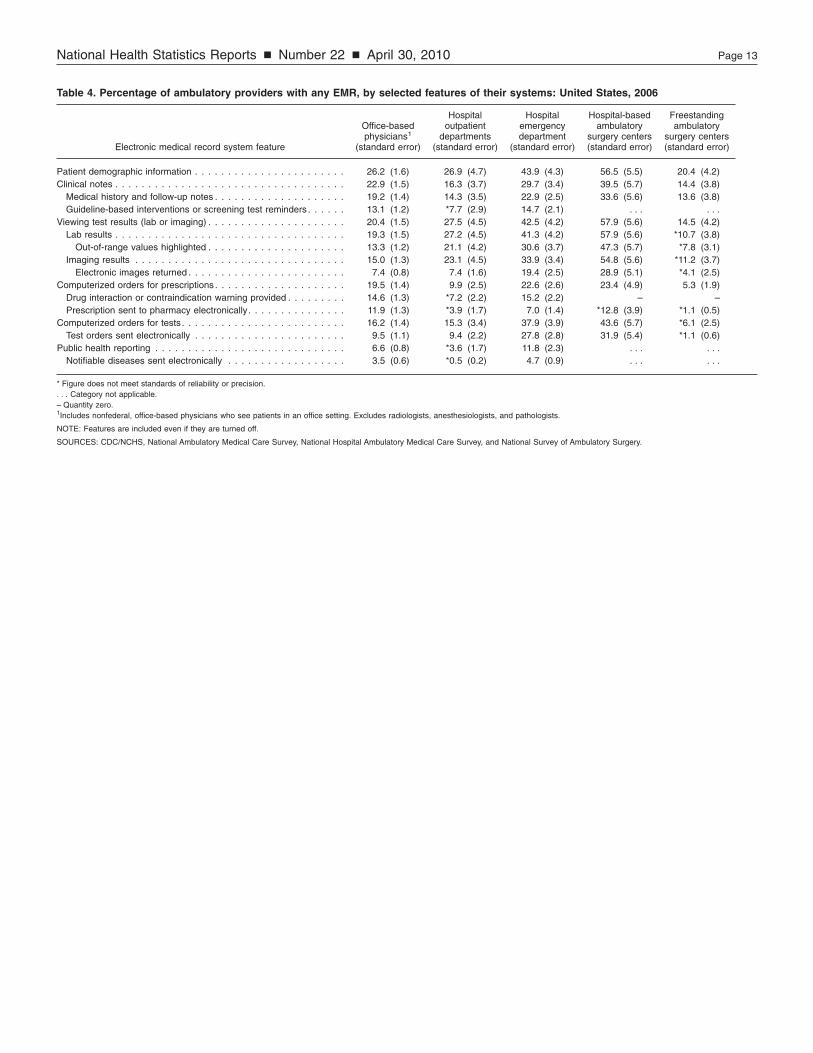
Features of EMR systems
Table 4 presents EMR system features by type of ambulatory provider. Among these settings, computerized prescription order entry was more likely to be available in EMR systems used by hospital-based ASCs (23.4 percent), EDs (22.6 percent), and physicians’ offices (19.5 percent), compared with OPDs (9.9 percent). Computerized test order entry was more likely to be available in hospital-based ASCs (43.6 percent) and hospital EDs (37.9 percent) than in OPDs (15.3 percent) or physicians’
offices (16.2 percent). Ability to view test results (lab or imaging) was also more likely in hospital-based ASCs (57.9 percent) and hospital EDs (42.5 percent) than in the remaining ambulatory settings. A number of estimates for EMR system features in freestanding ASCs were unreliable and could not be compared with those of the other settings.
Similar to other studies, the data show that many EMR systems lack important features such as warnings for drug interactions or contraindications and sending prescriptions to the pharmacy electronically (18,19). Overall, 19.5 percent of office-based physicians reported that their EMR systems included computerized prescription order entry, but only 14.6 percent reported that their EMR systems provided warnings for drug interactions or contraindications, and 11.9 percent reported that their systems sent prescriptions to the pharmacy electronically (Table 4). No ASC reported that its EMR system provided warnings for drug interactions or contraindications. Because few freestanding ambulatory surgery centers had EMR systems, many of the estimates of EMR system features from this setting were unreliable.
EMR trends
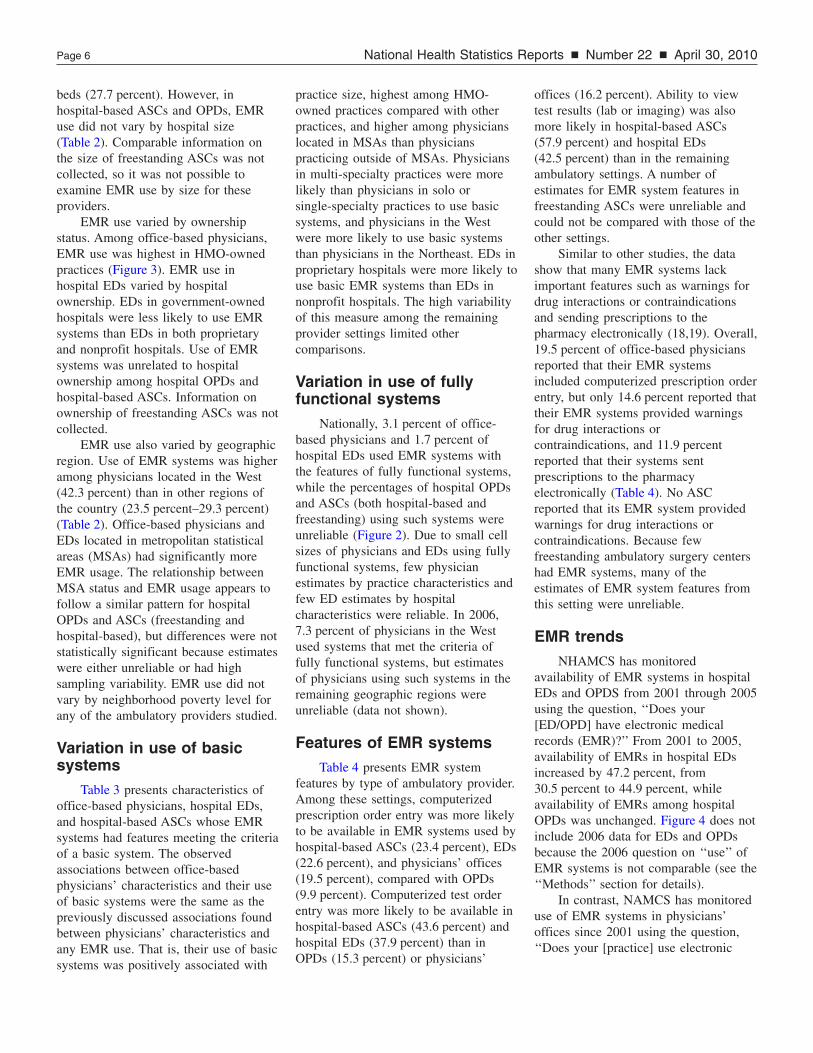
NHAMCS has monitored availability of EMR systems in hospital EDs and OPDS from 2001 through 2005 using the question, ‘‘Does your [ED/OPD] have electronic medical records (EMR)?’’ From 2001 to 2005, availability of EMRs in hospital EDs increased by 47.2 percent, from 30.5 percent to 44.9 percent, while availability of EMRs among hospital OPDs was unchanged. Figure 4 does not include 2006 data for EDs and OPDs because the 2006 question on ‘‘use’’ of EMR systems is not comparable (see the ‘‘Methods’’ section for details).
In contrast, NAMCS has monitored use of EMR systems in physicians’ offices since 2001 using the question, ‘‘Does your [practice] use electronic
50
18.2
29.3
33.1 30.8
30.5
17.3
34.8
44.9
17.3
20.8 23.9
29.2
Emergency departments
Outpatient departments
Physicians’ offices
40
Per
cent
of p
rovi
ders
30
20
10
0 2001 2002 2003 2004 2005 2006
Year NOTES: EMR is electronic medical record. Any EMR is a medical record system that is either all or partially electronic (excluding systems solely for billing). Dashed lines for 2003–2004 indicate the items were not collected. Basic and fully functional systems are subsets of EMR systems; fully functional systems are a subset of basic systems. Physician, 2006 emergency department (ED), and 2006 outpatient department (OPD) estimates are based on the question indicating the provider “uses” EMR. Prior to 2006, ED and OPD estimates are based on the question indicating the provider “has” EMR. SOURCES: CDC/NCHS, National Ambulatory Medical Care Survey and National Hospital Ambulatory Medical Care Survey.
National Health Statistics Reports n Number 22 n April 30, 2010 Page 7
Figure 4. Percentage of ambulatory care providers that have or use any EMR system, by setting: United States, 2001–2006
medical records?’’ (3). From 2001 to 2006, EMR use among office-based physicians increased by 60.4 percent; from 18.2 percent to 29.2 percent (Figure 4).
100
47.0
59.5
29.2 22.
47.
63.
Per
cent
of p
rovi
ders
80
60
40
20
0 Physicians’ Freestanding
offices ambulatory surgery centers
NOTES: Estimates to the right of the bars show use in 2006 Minimum estimate of use by 2009 includes 2006 EMR usersincludes 2006 EMR users plus respondents with “Yes” and “partially electronic (excluding systems solely for billing). SOURCES: CDC/NCHS, National Ambulatory Medical Care
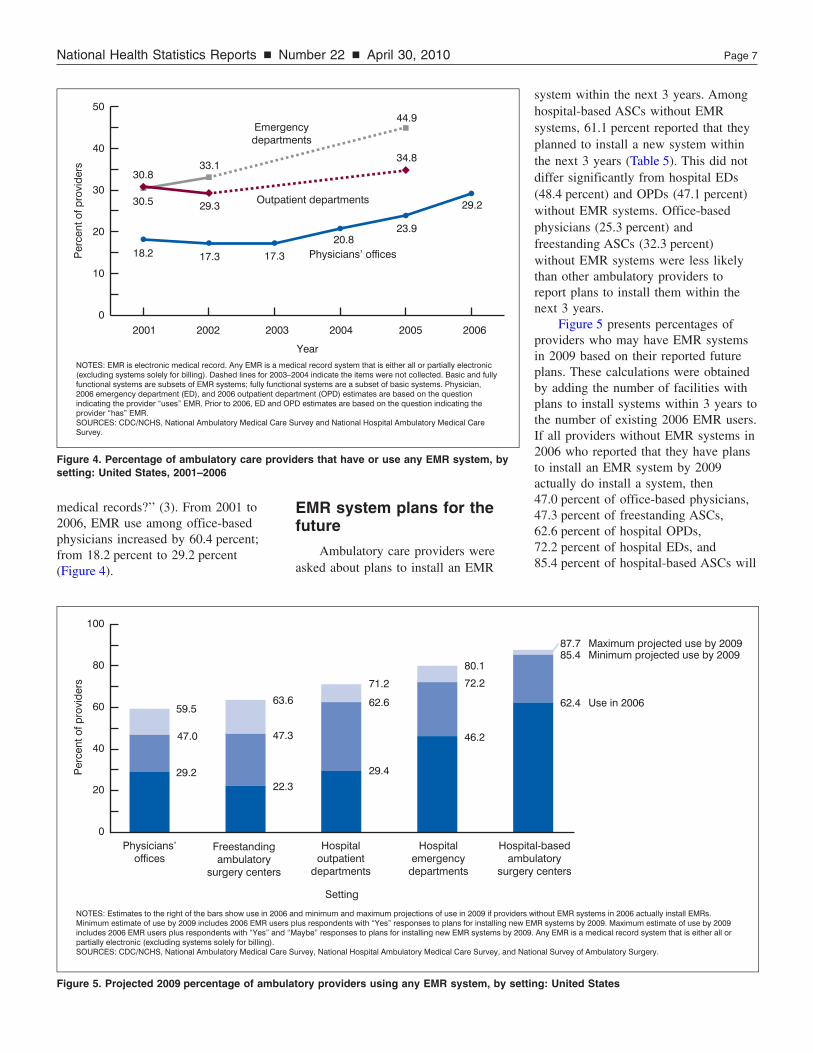
Figure 5. Projected 2009 percentage of ambul
EMR system plans for the future
Ambulatory care providers were asked about plans to install an EMR
80.1
3
3
6 62.6
29.4
71.2
46.2
72.2
Hospital Hospital Hospitoutpatient emergency amb
departments departments surgery
Setting
and minimum and maximum projections of use in 2009 if providers plus respondents with “Yes” responses to plans for installing new EMaybe” responses to plans for installing new EMR systems by 2009
Survey, National Hospital Ambulatory Medical Care Survey, and Nat
atory providers using any EMR system, by setti
system within the next 3 years. Among hospital-based ASCs without EMR systems, 61.1 percent reported that they planned to install a new system within the next 3 years (Table 5). This did not differ significantly from hospital EDs (48.4 percent) and OPDs (47.1 percent) without EMR systems. Office-based physicians (25.3 percent) and freestanding ASCs (32.3 percent) without EMR systems were less likely than other ambulatory providers to report plans to install them within the next 3 years.
Figure 5 presents percentages of providers who may have EMR systems in 2009 based on their reported future plans. These calculations were obtained by adding the number of facilities with plans to install systems within 3 years to the number of existing 2006 EMR users. If all providers without EMR systems in 2006 who reported that they have plans to install an EMR system by 2009 actually do install a system, then 47.0 percent of office-based physicians, 47.3 percent of freestanding ASCs, 62.6 percent of hospital OPDs, 72.2 percent of hospital EDs, and 85.4 percent of hospital-based ASCs will
87.7 85.4
62.4
Maximum projected use by 2009 Minimum projected use by 2009
Use in 2006
al-based ulatory centers
without EMR systems in 2006 actually install EMRs. MR systems by 2009. Maximum estimate of use by 2009 . Any EMR is a medical record system that is either all or
ional Survey of Ambulatory Surgery.
ng: United States
Page 8 National Health Statistics Reports n Number 22 n April 30, 2010
be using EMR systems (minimum estimates). In addition, if providers who reported that they might install new EMR systems by 2009 actually do so, then 87.7 percent of hospital-based ASCs, 80.1 percent of EDs, 71.2 percent of OPDs, 63.6 percent of freestanding ASCs, and 59.5 percent of office-based physicians will be using EMR systems by 2009 (maximum estimates).
Discussion This report is the first to examine
use of EMR systems across five ambulatory care settings: physicians’ offices, hospital OPDs and EDs, and hospital-based and freestanding ASCs. In 2006, higher percentages of hospital-based ASCs (62.4 percent) and hospital EDs (46.2 percent) reported using any EMR system compared with office-based physicians’ offices (29.2 percent), hospital OPDs (29.4 percent), and freestanding ASCs (22.3 percent). Features of EMR systems varied considerably by provider setting (Table 4). Consistent with previous research, this study found much higher EMR system use in hospital EDs than other parts of the hospital (20,21).
From 2001 through 2005, availability of EMR systems in hospital EDs increased by 47.2 percent, but was stable in OPDs. Starting in 2006, NHAMCS began collecting information on use of EMR systems in hospital EDs and OPDs. Since 2001, use of EMR systems among office-based physicians increased by 60.4 percent.
Estimates presented in this report of 2006 EMR use by hospital-based ASCs provide a first look at adoption of EMRs by these providers, and may also serve as a baseline against which data on future use can be compared. Hospital-based ASCs were added to the 2009 NHAMCS, and freestanding ASCs were added to the 2010 NHAMCS (22).
This report also presents minimum and maximum calculations of future EMR use in 2009, based on providers’ plans in 2006 to definitely (‘‘Yes’’) or possibly (‘‘Maybe’’) install EMR systems within the next 3 years. If these providers’ plans come to fruition, at a maximum, use of any EMR system will
have increased to 59.5 percent of physicians, 63.6 percent of freestanding ASCs, 71.2 percent of hospital OPDs, 80.1 percent of hospital EDs, and 87.7 percent of hospital-based ASCs by the end of 2009.
This report presents NAMCS, NHAMCS, and NSAS estimates of EMR systems with similar criteria to basic and fully functional systems (7,8). In 2006, only 18.6 percent of hospital-based ASCs, 14.0 percent of EDs, and 10.5 percent of office-based physicians used EMR systems that met the criteria of basic systems. The subset of providers with basic systems that also met the criteria of fully functional systems was much smaller; 3.1 percent of office-based physicians and 1.7 percent of hospital EDs used systems with these criteria. Estimates of fully functional systems used by hospital OPDs, hospital-based ASCs, and freestanding ASCs were all unreliable; their characteristics were not examined due to small sample sizes.
The 2006 estimates of hospital-based ASCs (18.6 percent) and hospital EDs (14.0 percent) with basic system features are somewhat higher than a previous estimate that 9.1 percent of acute care hospitals in 2007 had a basic system in at least one clinical unit (23). The survey estimates vary primarily because the definition of a basic system in the other study (demographic characteristics of patients, physician notes, nursing assessments, problem lists, medication lists, discharge summaries, laboratory reports, radiologic reports, diagnostic-test results, and computerized provider-order entry for medications) is more stringent than the criteria for basic systems used in this study (23). That study’s definition of a comprehensive system (all of the features listed above and advance directives; radiologic images; diagnostic-test images; consultant reports; computerized provider-order entry for laboratory tests, radiologic tests, consultant requests, and nursing orders; and decision support for clinical guidelines, clinical reminders, drug-allergy alerts, drug-drug interaction alerts, and drug-dose support) includes more features than included in this
study’s definition of a fully functional system (a subset of basic systems). In spite of this, the 2006 estimate of hospital EDs with systems meeting the criteria of a fully functional system (1.7 percent) is similar to the other study’s estimate (1.5 percent) of hospitals with a comprehensive system present in all clinical units (23).
Based on estimates of providers using EMR systems that meet the criteria of basic systems, it appears likely that widespread adoption of EMR systems with these features by ambulatory care providers will take many years. However, the financial incentives for ‘‘meaningful use’’ of ‘‘interoperable’’ EHR systems included in the 2009 ARRA may accelerate the growth of electronic systems. The definition of ‘‘meaningful’’ is not yet finalized, but may include a number of the EMR features examined here. Interoperable systems are those that communicate or exchange health information across provider settings (24). Although it is presently believed that few systems now include interoperability (14), all EHR systems certified by the Certification Commission for Healthcare Information Technology (CCHIT) are interoperable (2). Starting in 2009, NAMCS and NHAMCS began to collect information on whether EMR/EHR systems in use are certified by CCHIT. Adoption of interoperable systems is expected to improve coordination of patient care services across health care settings, as well as improve overall health care quality and efficiency (14,15,25). Given the sizable public investment to expand EHR use, tracking EMR/EHR adoption by health care providers will continue to be an important research topic.
References 1. White House. Executive Order:
Incentives for the use of health information technology and establishing the position of the National Health Information Technology Coordinator. Available from: http://nodis3.gsfc.nasa.gov/ displayEO.cfm?id=EO_13335_. 2004.
2. Blumenthal D. Stimulating the adoption of health information
National Health Statistics Reports n Number 22 n April 30, 2010 Page 9
2
2
2
technology. N Engl J Med 360(15):1477–9. 2009.
3. Burt CW, Hing E. Use of computerized clinical support systems in medical settings: United States, 2001–03. Advance data from vital and health statistics; no 353. Hyattsville, Maryland: National Center for Health Statistics. 2005.
4. Burt CW, Sisk JE. Which physicians and practices are using electronic medical records? Health Aff 24(5):1334–43, 2005.
5. Burt CW, Hing E, Woodwell DA. Electronic medical record use by office-based physicians: United States, 2005. Available from: http://www.cdc.gov/nchs/data/hestat/ electronic/electronic.htm [Accessed 08/29/06]. 2006.
6. Hing E, Burt CW, Woodwell DA. Electronic medical record use by office-based physicians and their practices: United States, 2006. Advance data from vital and health statistics; no 393. Hyattsville, Maryland: National Center for Health Statistics. 2007.
7. Robert Wood Johnson Foundation. Health information technology in the United States: Where we stand, 2008. Available from: http://www.rwjf.org/ files/research/062508.hit.exsummary. pdf. 2008.
8. DesRoches CM, Campbell EG, Rao SR, Donelan K, Ferris TG, Jha A, et al. Electronic health records in ambulatory care–A national survey of physicians. N Eng J Med 359(1):50– 60. 2008.
9. Hsiao CJ, Beatty PC, Hing E. Electronic Medical Record/Electronic Health Record Use by Office-based Physicians: United States, 2008 and Preliminary 2009. National Center for Health Statistics. Health E-Stat. Available from: http://www.cdc.gov/ nchs/data/hestat/emr_ehr/emr_ehr. htm. 2009.
10. Cherry DK, Hing E, Woodwell DA, Rechtsteiner EA. National Ambulatory Medical Care Survey: 2006 summary. National health statistics reports; no 3. Hyattsville, MD: National Center for Health Statistics. 2008.
11. Hing E, Hall MJ, Xu J. National Hospital Ambulatory Medical Care Survey: 2006 outpatient department summary. National health statistics reports; no 4. Hyattsville, MD:
National Center for Health Statistics. 2008.
12. Pitts SR, Niska RW, Xu J, Burt CW. National Hospital Ambulatory Medical Care Survey: 2006 emergency department summary. National health statistics reports; no 7. Hyattsville, MD: National Center for Health Statistics. 2008.
13. Cullen KA, Hall MJ, Golosinskiy A. Ambulatory surgery in the United States, 2006. National health statistics reports; no 11. Revised. Hyattsville, MD: National Center for Health Statistics. 2009.
14. Blumenthal D, DesRoches C, Donelan K, et al. Health information technology in the United States: The information base for progress. Robert Wood Johnson Foundation. Available from: http://www.rwjf.org/files/ publications/other/EHRReport 0609.pdf. 2006.
15. Jha AK, Ferris TG, Donelan K, DesRoches C, Shields A, Rosenbaum S, Blumenthal D. How common are electronic health records in the United States? A summary of the evidence. Health Aff 25(6):w496– 507. 2006.
16. HRSA. User documentation for the area resource file (ARF): February 2005 release.
17. Research Triangle Institute. SUDAAN user’s manual, release 9.0. Research Triangle Park, NC: Research Triangle Institute. 2004.
18. Simon SR, Kaushal R, Cleary P, Jenter CA, Volk LA, Orav EJ, et al. Physicians and electronic health records: A statewide survey. Arch Intern Med 167(5):507–12. 2007.
19. Grossman JM, Gerland A, Reed MC, Fahlman C. Physicians’ experiences using commercial e-prescribing systems. Health Aff 26(3):w393–404. 2007.
20. American Hospital Association. Forward momentum: Hospital use of information technology. Washington, DC: American Hospital Association. Available from: http://www.aha.org/ aha/content/2005/pdf/FINALNon EmbITSurvey105.pdf. 2005.
21. Grossman JM, Bodenheimer TS, McKenzie K. Hospital-physician portals: The role of competition in driving clinical data exchange. Health Aff 25(6):1629–36. 2006.
22. Hing E, McCaig LF, Hall MJ. New information for policymakers: National Ambulatory Medical Care
Survey and National Hospital Ambulatory Medical Care Survey. In: 2009 proceedings of the section on survey research methods, American Statistical Association. Alexandria, VA: American Statistical Association.
3. Jha AK, DesRoches CM, Campbell EG, Donelan K, Rao SR, Ferris TG, et al. Use of electronic health records in U.S. hospitals. N Engl J Med 360(16):1628–38. 2009.
4. The National Alliance for Health Information Technology. Report to the Office of the National Coordinator for Health Information Technology on defining key health information technology terms. Available from: http://healthit. hhs.gov/portal/server.pt/gateway/ PTARGS_0_10741_848133_0_0_18/ 10_2_hit_terms.pdf [Accessed 02/26/10]. 2008.
5. Chaudhry B, Wang J, Wu S, Maglione M, Mojica W, Roth E, et al. Systematic review: Impact of health information technology on quality, efficiency, and costs of medical care. Ann Intern Med 144(10):742–52. 2006.

Page 10 National Health Statistics Reports n Number 22 n April 30, 2010
Table 1. Number of ambulatory providers and percent distribution of ambulatory providers, by selected provider characteristics according to ambulatory setting: United States, 2006
Office- Hospital Hospital Hospital-based Freestanding based outpatient emergency ambulatory ambulatory
Selected provider characteristics physicians1 departments departments surgery centers surgery centers
Number of providers (N) . . . . . . . . . . . . . . . . . . . . . . . 300,700 2,700 4,700 3,700 3,800
Percent distribution
Total. . . . . . . . . . . . . . . . . . . . . . . . . . . . . . . . . . . . 100.0 100.0 100.0 100.0 100.0
Provider size
Physician practice2
Solo . . . . . . . . . . . . . . . . . . . . . . . . . . . . . . . . . . 34.1 . . . . . . . . . . . . 2 physicians . . . . . . . . . . . . . . . . . . . . . . . . . . . . . 12.3 . . . . . . . . . . . . 3–5 physicians . . . . . . . . . . . . . . . . . . . . . . . . . . . . 29.8 . . . . . . . . . . . . 6–10 physicians . . . . . . . . . . . . . . . . . . . . . . . . . . . 15.3 . . . . . . . . . . . . 11 or more physicians . . . . . . . . . . . . . . . . . . . . . . . 8.4 . . . . . . . . . . . .
Hospital size Under 100 beds . . . . . . . . . . . . . . . . . . . . . . . . . . . . . . 37.5 48.4 41.5 . . . 100–199 beds . . . . . . . . . . . . . . . . . . . . . . . . . . . . . . . 17.4 19.9 30.2 . . . 200 or more beds . . . . . . . . . . . . . . . . . . . . . . . . . . . . . 36.0 30.2 28.2 . . . Unknown number of beds . . . . . . . . . . . . . . . . . . . . . . . . *9.1 * – . . .
Type
Physician practice Solo and single-specialty practice . . . . . . . . . . . . . . . . 78.6 . . . . . . . . . . . . Multi-specialty practice . . . . . . . . . . . . . . . . . . . . . . . 20.9 . . . . . . . . . . . . Unknown type of practice . . . . . . . . . . . . . . . . . . . . . 0.5 . . . . . . . . . . . .
Hospital Affiliated with medical school . . . . . . . . . . . . . . . . . . . . . . 39.5 30.5 19.0 . . . Not affiliated with medical school. . . . . . . . . . . . . . . . . . . . 60.5 69.5 81.0 . . .
Ownership
Ownership of physician practice Physician or physician group . . . . . . . . . . . . . . . . . . . 81.6 . . . . . . . . . . . . Health maintenance organization (HMO) . . . . . . . . . . . . 2.7 . . . . . . . . . . . . Other ownership of physician practice . . . . . . . . . . . . . 15.7 . . . . . . . . . . . .
Ownership of hospital Nonprofit . . . . . . . . . . . . . . . . . . . . . . . . . . . . . . . . . . 75.2 73.1 71.9 . . . Government . . . . . . . . . . . . . . . . . . . . . . . . . . . . . . . . 12.2 13.6 16.0 . . . Proprietary . . . . . . . . . . . . . . . . . . . . . . . . . . . . . . . . . 12.6 13.3 12.1 . . .
Percentiles of county population below poverty level
Under 10% . . . . . . . . . . . . . . . . . . . . . . . . . . . . . . . 26.9 19.9 33.2 26.9 33.0 10%–13.4% . . . . . . . . . . . . . . . . . . . . . . . . . . . . . . . 33.9 32.8 35.6 36.3 35.2 More than 13.4% . . . . . . . . . . . . . . . . . . . . . . . . . . . . 39.2 47.3 31.1 36.8 31.8
Geographic region
Northeast . . . . . . . . . . . . . . . . . . . . . . . . . . . . . . . . 20.6 20.8 13.9 13.1 9.6 Midwest . . . . . . . . . . . . . . . . . . . . . . . . . . . . . . . . . 20.0 28.0 28.7 33.1 19.4 South . . . . . . . . . . . . . . . . . . . . . . . . . . . . . . . . . . . 36.5 36.0 38.9 35.6 39.0 West . . . . . . . . . . . . . . . . . . . . . . . . . . . . . . . . . . . 22.8 15.2 18.5 18.2 32.1
Metropolitan status
Metropolitan statistical area . . . . . . . . . . . . . . . . . . . . . 89.0 63.9 66.4 65.2 89.7 Not a metropolitan statistical area . . . . . . . . . . . . . . . . . 11.0 36.1 33.6 34.8 *10.3
. . . Category not applicable. * Figure does not meet standards of reliability or precision. – Quantity zero. 1Includes nonfederal, office-based physicians who see patients in an office setting. Excludes radiologists, anesthesiologists, and pathologists. 2Practice size reported for location where most patients were seen. Includes imputed data for 0.9% missing practice size; see the ‘‘Methods’’ section for details.
SOURCES: CDC/NCHS, National Ambulatory Medical Care Survey, National Hospital Ambulatory Medical Care Survey, and National Survey of Ambulatory Surgery.

National Health Statistics Reports n Number 22 n April 30, 2010 Page 11
Table 2. Percentage of ambulatory providers using any EMR system with corresponding standard errors, by selected practice and hospital characteristics according to ambulatory setting: United States, 2006
Uses any EMR1
Hospital Hospital Hospital-based Freestanding Office-based outpatient emergency ambulatory surgery ambulatory physicians2 departments departments centers surgery centers
Selected provider characteristic (standard error) (standard error) (standard error) (standard error) (standard error)
All providers . . . . . . . . . . . . . . . . . . . . . . . . . . . . . . . 29.2 (1.7) 29.4 (4.7) 46.2 (4.3) 62.4 (5.5) 22.3 (4.6)
Provider size
Physician practice3,4
Solo . . . . . . . . . . . . . . . . . . . . . . . . . . . . . . . . . . 24.0 (2.8) . . . . . . . . . . . . 2 physicians . . . . . . . . . . . . . . . . . . . . . . . . . . . . . 28.0 (4.3) . . . . . . . . . . . . 3–5 physicians . . . . . . . . . . . . . . . . . . . . . . . . . . . . 30.0 (3.0) . . . . . . . . . . . . 6–10 physicians . . . . . . . . . . . . . . . . . . . . . . . . . . . 30.9 (4.2) . . . . . . . . . . . . 11 or more physicians . . . . . . . . . . . . . . . . . . . . . . . 46.5 (6.4) . . . . . . . . . . . .
Hospital size5
Under 100 beds . . . . . . . . . . . . . . . . . . . . . . . . . . . . . . *19.5 (8.8) 27.7 (6.3) 67.5 (9.2) . . . 100–199 beds . . . . . . . . . . . . . . . . . . . . . . . . . . . . . . . *31.0 (9.4) 59.2 (7.8) 54.9 (10.2) . . . 200 or more beds . . . . . . . . . . . . . . . . . . . . . . . . . . . . . 44.6 (7.4) 68.8 (3.6) 62.8 (7.6) . . . Unknown number of beds . . . . . . . . . . . . . . . . . . . . . . . . * (. . .) * (. . .) . . . . . .
Type Physician practice
Solo and single-specialty practice . . . . . . . . . . . . . . . . 28.0 (2.0) . . . . . . . . . . . . Multi-specialty practice . . . . . . . . . . . . . . . . . . . . . . . 34.5 (3.5) . . . . . . . . . . . . Unknown type of practice . . . . . . . . . . . . . . . . . . . . . - . . . . . . . . . . . .
Hospital Affiliated with medical school . . . . . . . . . . . . . . . . . . . . . . 34.4 (7.1) 54.7 (5.2) 70.5 (7.9) . . . Not affiliated with medical school. . . . . . . . . . . . . . . . . . . . 26.2 (6.4) 42.4 (5.7) 60.5 (6.5) . . .
Ownership
Ownership of physician practice6
Physician or physician group . . . . . . . . . . . . . . . . . . . 26.9 (1.7) . . . . . . . . . . . . Health maintenance organization (HMO) . . . . . . . . . . . . 77.8 (8.4) . . . . . . . . . . . . Other ownership of physician practice . . . . . . . . . . . . . 33.1 (4.7) . . . . . . . . . . . .
Ownership of hospital7
Nonprofit . . . . . . . . . . . . . . . . . . . . . . . . . . . . . . . . . . 28.8 (5.3) 44.7 (5.0) 57.0 (6.5) . . . Government . . . . . . . . . . . . . . . . . . . . . . . . . . . . . . . . *40.9 (14.1) 26.1 (7.6) 83.8 (14.3) . . . Proprietary . . . . . . . . . . . . . . . . . . . . . . . . . . . . . . . . . *22.4 (9.4) 74.3 (6.1) 66.0 (13.8) . . .
Percentiles of county population below poverty level
Under 10% . . . . . . . . . . . . . . . . . . . . . . . . . . . . . . . 29.2 (3.6) 37.4 (9.3) 49.5 (9.6) 52.2 (11.3) *24.2 (8.9) 10%–13.4% . . . . . . . . . . . . . . . . . . . . . . . . . . . . . . . 29.8 (2.8) 35.2 (9.4) 48.3 (8.9) 59.2 (9.0) 31.5 (8.7) More than 13.4% . . . . . . . . . . . . . . . . . . . . . . . . . . . . 28.9 (3.4) 22.1 (5.9) 43.0 (5.5) *72.9 (9.0) *10.1 (3.1)
Geographic region6
Northeast . . . . . . . . . . . . . . . . . . . . . . . . . . . . . . . . 23.5 (2.7) 34.5 (8.9) 59.0 (4.7) *46.7 (17.6) *28.5 (14.2) Midwest . . . . . . . . . . . . . . . . . . . . . . . . . . . . . . . . . 29.3 (3.2) *40.0 (12.2) 38.0 (9.2) 49.0 (9.9) *24.4 (9.6) South . . . . . . . . . . . . . . . . . . . . . . . . . . . . . . . . . . . 24.2 (3.0) 16.0 (4.8) 39.1 (6.3) 77.0 (7.3) *20.3 (7.5) West . . . . . . . . . . . . . . . . . . . . . . . . . . . . . . . . . . . 42.3 (4.3) 35.1 (10.0) 64.0 (11.1) 69.4 (12.8) 21.6 (8.3)
Metropolitan status6,7
Metropolitan statistical area . . . . . . . . . . . . . . . . . . . . . 30.3 (1.9) 36.0 (5.4) 57.0 (4.0) 63.9 (6.2) 23.7 (5.0) Not a metropolitan statistical area . . . . . . . . . . . . . . . . . 20.2 (3.0) *17.9 (7.9) 24.8 (7.6) 59.4 (10.8) *9.9 (5.4)
. . . Category not applicable. * Figure does not meet standards of reliability or precision. –Quantity zero. 1EMR is electronic medical record. Any EMR system refers to providers reporting that their medical records are either all or partially electronic; excludes electronic billing records. Basic and fully functional systems are subsets of EMR systems in use; fully functional systems are a subset of basic systems. 2Includes nonfederal, office-based physicians who see patients in an office setting. Excludes radiologists, anesthesiologists, and pathologists. 3Practice size reported for location where most patients were seen. Includes imputed data for 0.9% missing practice size; see the ‘‘Methods’’ section for details. 4Trend by physician practice size is statistically significant. 5Trend for hospital emergency departments by hospital size is statistically significant. 6Significant relationship between use of any EMR system and physican practice characteristic. 7Significant relationship between use of any EMR system by emergency department and hospital characteristic.
SOURCES: CDC/NCHS, National Ambulatory Medical Care Survey, National Hospital Ambulatory Medical Care Survey, and National Survey of Ambulatory Surgery.
Page 12 National Health Statistics Reports n Number 22 n April 30, 2010
Table 3. Percentage of ambulatory providers with basic electronic record system with corresponding standard errors, by selected physician practice and hospital characteristics according to ambulatory setting: United States, 2006
Has basic system1
Hospital Hospital-based Office-based emergency ambulatory physicians2 departments surgery centers
Selected provider characteristics (standard error) (standard error) (standard error)
All providers . . . . . . . . . . . . . . . . . . . . . . . . . . . . . . . 10.5 (1.1) 14.0 (2.0) 18.6 (4.6)
Provider size
Physician practice3,4
Solo . . . . . . . . . . . . . . . . . . . . . . . . . . . . . . . . . . 5.3 (1.4) . . . . . . 2 physicians . . . . . . . . . . . . . . . . . . . . . . . . . . . . . 8.0 (2.2) . . . . . . 3–5 physicians . . . . . . . . . . . . . . . . . . . . . . . . . . . . 13.1 (2.2) . . . . . . 6–10 physicians . . . . . . . . . . . . . . . . . . . . . . . . . . . 12.9 (3.5) . . . . . . 11 or more physicians . . . . . . . . . . . . . . . . . . . . . . . 22.2 (4.9) . . . . . .
Hospital size5
Under 100 beds . . . . . . . . . . . . . . . . . . . . . . . . . . . . . . 4.5 (1.3) *21.4 (8.5) 100–199 beds . . . . . . . . . . . . . . . . . . . . . . . . . . . . . . . 25.5 (6.3) *6.6 (4.4) 200 or more beds . . . . . . . . . . . . . . . . . . . . . . . . . . . . . 21.7 (3.3) 27.2 (8.2) Unknown number of beds . . . . . . . . . . . . . . . . . . . . . . . . * (. . .) –
Type Physician practice6. . . . . . . . . . . . . . . . . . . . . . . . . . .
Solo and single-specialty practice . . . . . . . . . . . . . . . . 8.3 (1.2) . . . . . . Multi-specialty practice . . . . . . . . . . . . . . . . . . . . . . . 19.3 (3.0) . . . . . . Unknown type of practice . . . . . . . . . . . . . . . . . . . . . – . . . . . .
Hospital Affiliated with medical school . . . . . . . . . . . . . . . . . . . . . . 19.6 (3.5) *24.2 (8.4) Not affiliated with medical school. . . . . . . . . . . . . . . . . . . . 11.5 (2.5) *17.3 (5.3)
Ownership
Ownership of physician practice6
Physician or physician group . . . . . . . . . . . . . . . . . . . 8.1 (0.9) . . . . . . Health maintenance organization (HMO) . . . . . . . . . . . . 56.0 (10.7) . . . . . . Other ownership of physician practice . . . . . . . . . . . . . 15.5 (3.8) . . . . . .
Ownership of hospital Nonprofit . . . . . . . . . . . . . . . . . . . . . . . . . . . . . . . . . . 15.5 (2.6) 17.8 (4.9) Government . . . . . . . . . . . . . . . . . . . . . . . . . . . . . . . . *3.5 (1.6) *16.7 (14.3) Proprietary . . . . . . . . . . . . . . . . . . . . . . . . . . . . . . . . . 16.3 (4.4) *25.4 (14.3)
Percentiles of county population below poverty level
Under 10% . . . . . . . . . . . . . . . . . . . . . . . . . . . . . . . 11.8 (2.1) 21.8 (5.6) *11.2 (8.2) 10%–13.4% . . . . . . . . . . . . . . . . . . . . . . . . . . . . . . . 9.9 (1.9) *9.1 (3.5) *10.5 (6.0) More than 13.4% . . . . . . . . . . . . . . . . . . . . . . . . . . . . 10.2 (2.5) 12.6 (3.0) 31.9 (8.8)
Geographic region6
Northeast . . . . . . . . . . . . . . . . . . . . . . . . . . . . . . . . 5.4 (1.4) 20.4 (4.7) *7.8 (6.8) Midwest . . . . . . . . . . . . . . . . . . . . . . . . . . . . . . . . . 12.4 (2.5) *7.4 (2.5) *9.2 (4.9) South . . . . . . . . . . . . . . . . . . . . . . . . . . . . . . . . . . . 8.2 (1.9) 12.5 (3.0) *29.1 (8.9) West . . . . . . . . . . . . . . . . . . . . . . . . . . . . . . . . . . . 17.2 (3.0) *22.5 (7.1) *22.8 (13.3)
Metropolitan status
Metropolitan statistical area . . . . . . . . . . . . . . . . . . . . . 11.4 (1.2) 20.1 (2.6) 18.5 (5.2) Not a metropolitan statistical area . . . . . . . . . . . . . . . . . *3.3 (1.8) *1.9 (1.7) *18.6 (8.8)
. . . Category not applicable. * Figure does not meet standards of reliability or precision. – Quantity zero. 1Includes patient demographics, clinical notes, computerized order entry for prescriptions, viewing laboratory results, and viewing imaging results. Basic systems are a subset of electronic medical record systems in use. 2Includes nonfederal, office-based physicians who see patients in an office setting. Excludes radiologists, anesthesiologists, and pathologists. 3Practice size reported for location where most patients were seen. Includes imputed data for 0.9% missing practice size; see the ‘‘Methods’’ section for details. 4Trend by physician practice size is statistically significant. 5Trend for hospital emergency departments by hospital size is statistically significant. 6Significant relationship between physician practice characteristic and having a basic system.
SOURCES: CDC/NCHS, National Ambulatory Medical Care Survey, National Hospital Ambulatory Medical Care Survey, and National Survey of Ambulatory Surgery.
National Health Statistics Reports n Number 22 n April 30, 2010 Page 13
Table 4. Percentage of ambulatory providers with any EMR, by selected features of their systems: United States, 2006
Hospital Hospital Hospital-based Freestanding Office-based outpatient emergency ambulatory ambulatory physicians1 departments department surgery centers surgery centers
Electronic medical record system feature (standard error) (standard error) (standard error) (standard error) (standard error)
Patient demographic information . . . . . . . . . . . . . . . . . . . . . . . 26.2 (1.6) 26.9 (4.7) 43.9 (4.3) 56.5 (5.5) 20.4 (4.2) Clinical notes . . . . . . . . . . . . . . . . . . . . . . . . . . . . . . . . . . . 22.9 (1.5) 16.3 (3.7) 29.7 (3.4) 39.5 (5.7) 14.4 (3.8)
Medical history and follow-up notes . . . . . . . . . . . . . . . . . . . . 19.2 (1.4) 14.3 (3.5) 22.9 (2.5) 33.6 (5.6) 13.6 (3.8) Guideline-based interventions or screening test reminders . . . . . . 13.1 (1.2) *7.7 (2.9) 14.7 (2.1) . . . . . .
Viewing test results (lab or imaging) . . . . . . . . . . . . . . . . . . . . . 20.4 (1.5) 27.5 (4.5) 42.5 (4.2) 57.9 (5.6) 14.5 (4.2) Lab results . . . . . . . . . . . . . . . . . . . . . . . . . . . . . . . . . . . 19.3 (1.5) 27.2 (4.5) 41.3 (4.2) 57.9 (5.6) *10.7 (3.8)
Out-of-range values highlighted . . . . . . . . . . . . . . . . . . . . . 13.3 (1.2) 21.1 (4.2) 30.6 (3.7) 47.3 (5.7) *7.8 (3.1) Imaging results . . . . . . . . . . . . . . . . . . . . . . . . . . . . . . . . 15.0 (1.3) 23.1 (4.5) 33.9 (3.4) 54.8 (5.6) *11.2 (3.7)
Electronic images returned . . . . . . . . . . . . . . . . . . . . . . . . 7.4 (0.8) 7.4 (1.6) 19.4 (2.5) 28.9 (5.1) *4.1 (2.5) Computerized orders for prescriptions . . . . . . . . . . . . . . . . . . . . 19.5 (1.4) 9.9 (2.5) 22.6 (2.6) 23.4 (4.9) 5.3 (1.9)
Drug interaction or contraindication warning provided . . . . . . . . . 14.6 (1.3) *7.2 (2.2) 15.2 (2.2) – – Prescription sent to pharmacy electronically. . . . . . . . . . . . . . . 11.9 (1.3) *3.9 (1.7) 7.0 (1.4) *12.8 (3.9) *1.1 (0.5)
Computerized orders for tests . . . . . . . . . . . . . . . . . . . . . . . . . 16.2 (1.4) 15.3 (3.4) 37.9 (3.9) 43.6 (5.7) *6.1 (2.5) Test orders sent electronically . . . . . . . . . . . . . . . . . . . . . . . 9.5 (1.1) 9.4 (2.2) 27.8 (2.8) 31.9 (5.4) *1.1 (0.6)
Public health reporting . . . . . . . . . . . . . . . . . . . . . . . . . . . . . 6.6 (0.8) *3.6 (1.7) 11.8 (2.3) . . . . . . Notifiable diseases sent electronically . . . . . . . . . . . . . . . . . . 3.5 (0.6) *0.5 (0.2) 4.7 (0.9) . . . . . .
* Figure does not meet standards of reliability or precision. . . . Category not applicable. – Quantity zero. 1Includes nonfederal, office-based physicians who see patients in an office setting. Excludes radiologists, anesthesiologists, and pathologists.
NOTE: Features are included even if they are turned off.
SOURCES: CDC/NCHS, National Ambulatory Medical Care Survey, National Hospital Ambulatory Medical Care Survey, and National Survey of Ambulatory Surgery.

Page 14 National Health Statistics Reports n Number 22 n April 30, 2010
Table 5. Number of ambulatory providers without electronic medical record (EMR) systems and percent distribution, by whether they plan to install EMR systems within 3 years, with corresponding standard errors, according to ambulatory setting: United States, 2006
Hospital Hospital Hospital-based Freestanding Number of providers without EMR systems and Office-based outpatient emergency ambulatory ambulatory
percent with and without plans to install physicians1 departments departments surgery centers surgery centers an EMR system within 3 years (standard error) (standard error) (standard error) (standard error) (standard error)
Number of providers without EMR systems. . . . . . . . . . . . 212,700 (8,200) 1,900 (200) 2,500 (300) 1,400 (200) 3,000 (300)
Percent distribution of providers. . . . . . . . . . . . . . . . . . . 100.0 100.0 100.0 100.0 100.0 Yes, plan to install EMR system . . . . . . . . . . . . . . . . . 25.3 (2.0) 47.1 (6.6) 48.4 (5.4) 61.1 (9.1) 32.3 (5.7) May install EMR system . . . . . . . . . . . . . . . . . . . . . . 17.7 (1.7) 12.2 (3.1) 14.8 (3.7) *6.2 (3.8) 20.9 (4.7) No, do not plan to install EMR system . . . . . . . . . . . . . 44.1 (2.2) 18.6 (4.4) 20.4 (4.7) 1.9 (1.7) 26.4 (4.7) Unknown . . . . . . . . . . . . . . . . . . . . . . . . . . . . . . . 12.9 (1.4) 22.1 (4.6) 16.4 (3.8) 30.8 (8.7) 20.4 (5.4)
1Includes nonfederal, office-based physicians who see patients in an office setting. Excludes radiologists, anesthesiologists, and pathologists.
NOTE: Providers without EMR systems are those reporting not using an EMR. Respondents missing information on EMR use were excluded. Data on EMR system use were missing for fewer than 2 percent of each provider type (1.8 percent of physicians, 0.7 percent of hospital EDs, 1.2 percent of hospital OPDs, 1.3 percent of freestanding ASCs, and 1.0 percent of hospital-based ASCs). EMR systems are all or partially electronic systems, and exclude electronic billing records.
SOURCES: CDC/NCHS, National Ambulatory Medical Care Survey, National Hospital Ambulatory Medical Care Survey, and National Survey of Ambulatory Surgery.

National Health Statistics Reports n Number 22 n April 30, 2010 Page 15
Technical Notes
Table. Percentage of ambulatory providers with minimally functional systems with corresponding standard errors, by selected physician practice and hospital characteristics according to ambulatory setting: United States, 2006
Has minimally functional system1
Hospital Hospital Hospital-based Freestanding Office-based outpatient emergency ambulatory ambulatory physicians2 departments departments surgery centers surgery centers
Selected provider characteristics (standard error) (standard error) (standard error) (standard error) (standard error)
All providers . . . . . . . . . . . . . . . . . . . . . . . . . . . . . . . 12.4 (1.3) 6.7 (2.0) 15.7 (2.3) 18.9 (4.6) *3.2 (1.7)
Provider size
Physician practice3
Solo . . . . . . . . . . . . . . . . . . . . . . . . . . . . . . . . . . 7.1 (1.7) . . . . . . . . . . . . 2 physicians . . . . . . . . . . . . . . . . . . . . . . . . . . . . . 9.7 (2.6) . . . . . . . . . . . . 3–5 physicians . . . . . . . . . . . . . . . . . . . . . . . . . . . . 13.4 (2.1) . . . . . . . . . . . . 6–10 physicians . . . . . . . . . . . . . . . . . . . . . . . . . . . 16.6 (3.6) . . . . . . . . . . . . 11 or more physicians . . . . . . . . . . . . . . . . . . . . . . . 26.6 (5.3) . . . . . . . . . . . .
Hospital size Under 100 beds . . . . . . . . . . . . . . . . . . . . . . . . . . . . . . *0.6 (0.6) *5.7 (1.8) 21.4 (8.5) . . . 100–199 beds . . . . . . . . . . . . . . . . . . . . . . . . . . . . . . . 8.8 (4.1) *24.7 (7.5) 6.6 (4.4) . . . 200 or more beds . . . . . . . . . . . . . . . . . . . . . . . . . . . . . *13.8 (4.8) 26.0 (3.7) 28.4 (8.2) . . . Unknown number of beds . . . . . . . . . . . . . . . . . . . . . . . . – * (. . .) – . . .
Type
Physician practice Solo and single-specialty practice . . . . . . . . . . . . . . . . 10.4 (1.4) . . . . . . . . . . . . Multi-specialty practice . . . . . . . . . . . . . . . . . . . . . . . 20.5 (3.3) . . . . . . . . . . . . Unknown type of practice . . . . . . . . . . . . . . . . . . . . . – . . . . . . . . . . . . Hospital . . . . . . . . . . . . . . . . . . . . . . . . . . . . . . . . Affiliated with medical school . . . . . . . . . . . . . . . . . . . . . . 7.9 (2.7) 22.1 (3.9) 24.2 (8.4) . . . Not affiliated with medical school. . . . . . . . . . . . . . . . . . . . 6.0 (2.9) 13.1 (2.8) 17.7 (5.3) . . .
Ownership
Ownership of physician practice Physician or physician group . . . . . . . . . . . . . . . . . . . 9.9 (1.1) . . . . . . . . . . . . Health maintenance organization (HMO) . . . . . . . . . . . . 60.4 (10.3) . . . . . . . . . . . . Other ownership of physician practice . . . . . . . . . . . . . *20.1 (12.2) . . . . . . . . . . . .
Ownership of hospital Nonprofit . . . . . . . . . . . . . . . . . . . . . . . . . . . . . . . . . . 7.1 (2.6) 16.6 (2.8) 18.3 (4.9) . . . Government . . . . . . . . . . . . . . . . . . . . . . . . . . . . . . . . *5.2 (3.3) *4.6 (2.0) 16.7 (14.3) . . . Proprietary . . . . . . . . . . . . . . . . . . . . . . . . . . . . . . . . . *6.0 (3.9) 22.5 (5.6) 25.4 (14.3) . . .
Percentiles of population below poverty level
Under 10% . . . . . . . . . . . . . . . . . . . . . . . . . . . . . . . 13.6 (2.4) 11.3 (5.1) 18.2 (4.0) 12.4 (8.2) 0.2 (0.2) 10%–13.4% . . . . . . . . . . . . . . . . . . . . . . . . . . . . . . . 12.1 (2.3) 5.4 (4.4) 16.0 (4.4) 10.5 (6.0) 5.1 (4.4) More than 13.4% . . . . . . . . . . . . . . . . . . . . . . . . . . . . 11.9 (2.5) 5.7 (2.1) 13.1 (3.0) 31.9 (8.8) 4.3 (2.1)
Geographic region
Northeast . . . . . . . . . . . . . . . . . . . . . . . . . . . . . . . . 7.6 (1.6) *6.1 (3.3) 20.5 (4.7) 89.8 (7.4) 16.4 (14.3) Midwest . . . . . . . . . . . . . . . . . . . . . . . . . . . . . . . . . 14.1 (2.7) *2.0 (1.7) *8.9 (2.9) 9.2 (4.9) 1.1 (0.9) South . . . . . . . . . . . . . . . . . . . . . . . . . . . . . . . . . . . 8.7 (1.9) *5.2 (2.6) 16.0 (3.6) 29.1 (8.9) 2.4 (1.3) West . . . . . . . . . . . . . . . . . . . . . . . . . . . . . . . . . . . 21.1 (3.5) *15.8 (9.5) *22.3 (7.6) 22.8 (13.3) 1.6 (1.2)
Metropolitan status
Metropolitan statistical area . . . . . . . . . . . . . . . . . . . . . 13.0 (1.3) *9.6 (3.0) 22.8 (3.0) 19.0 (5.3) 3.6 (1.9) Not a metropolitan statistical area . . . . . . . . . . . . . . . . . *7.7 (2.5) – *1.9 (1.7) 18.6 (8.8) –
* Figure does not meet standards of reliability or precision. . . . Category not applicable. – Quantity zero. 1Minimally functional sytems are subsets of electronic medical record systems in use. Minimally functional sytems include computerized prescription order entry, computerized test order entry, test results (lab or imaging), and clinical notes. 2Includes nonfederal, office-based physicians who see patients in an office setting. Excludes radiologists, anesthesiologists, and pathologists. 3Practice size reported for location where most patients were seen. Includes imputed data for 0.9% missing practice size; see the ‘‘Methods’’ section for details.
SOURCES: CDC/NCHS, National Ambulatory Medical Care Survey, National Hospital Ambulatory Medical Care Survey, and National Survey of Ambulatory Surgery.

–
Page 16 National Health Statistics Reports n Number 22 n April 30, 2010
Section II INDUCTION INTERVIEW – Continued
Does your practice use electronic MEDICALRECORDS (not including billing records)?
22a. 1
2
3
4
Yes, all electronic
No Don’t know
� � �
SKIP to item 24
Yes, part paper and part electronic
b. Does your practice’s electronic medicalrecord system include – (1) Patient demographic information? . . . . . . . . . . . . . . . .
Yes No Unknown Turned off
1 2 3 4
(2) Computerized orders for prescriptions? . . . . . . . . . . . .
(a) Are there warnings of drug interactions or
(b) Are prescriptions sent electronically to the pharmacy?
If Yes, ask – contraindications provided?
1 2 3 4
1 2 3 4
1 2 3 4
(3) Computerized orders for tests? . . . . . . . . . . . . . . . . . .
Are orders sent electronically?If Yes, ask –
1 2 3 4
1 2 3 4
(4) Lab results? . . . . . . . . . . . . . . . . . . . . . . . . . . . . . . . .
Are out of range levels highlighted?If Yes, ask –
1 2 3 4
1 2 3 4
(5) Imaging results? . . . . . . . . . . . . . . . . . . . . . . . . . . . . .
Are electronic images returned?If Yes, ask –
1 2 3 4
1 2 3 4
(6) Clini l . . . . . . . . . . . . . . . . . . . . . . . . . . . . . .
(a) Do they include medical history and
(b) Do they include reminders for
and/or screening tests?
If Yes, ask –
ca notes?
follow-up notes?
guideline-based interventions
1 2 3 4
1 2 3 4
1 2 3 4
(7)
Are notifiable diseases sent electronically?If Yes, ask –
Public health reporting? . . . . . . . . . . . . . . . . . . . . . . . . 1 2 3 4
1 2 3 4
23. Are there any of the above features of your systemthat you do NOT use or have turned off?
Yes – Please specify 1
FR NOTE – Indicate in item 22b, last column, any component(s) turned off. No Unknown
2
3
24. Are there plans for installing a new EMR system orreplacing the current system within the next 3years?
Yes No Maybe Unknown
1
2
3
4
Figure I. Selected questions from the National Ambulatory Medical Care Survey, 2006

National Health Statistics Reports n Number 22 n April 30, 2010 Page 17
Section VI – MEDICAL RECORD INFORMATION
Does this facility (hospital) use electronicmedical records (not including billingrecords) for ambulatory (outpatient)surgical care?
27a. Yes, all electronic Yes, part paper and part electronic No Don’t know
1
2
3
4
} }
Ask item 27b
Skip to item 27e on next page
b. Does your facility’s (hospital’s) electronicmedical record system include —
(1) Patient demographic information? . . . . . . . . .
Computerized orders for prescriptions? . . . . .(2a)
(b) Are warnings of drug interactions orcontraindications provided? . . . . . . . . . . . . . . .
(c) Are prescriptions sent electronically to thepharmacy? . . . . . . . . . . . . . . . . . . . . . . . . . . . . . .
(3a) Computerized orders for tests? . . . . . . . . . . . .
(b) Are orders sent electronically? . . . . . . . . . . . . .
(4a) Lab results? . . . . . . . . . . . . . . . . . . . . . . . . . . . . .
(b) Are out of range levels highlighted? . . . . . . . .
Imaging or radiology results? . . . . . . . . . . . . . .
Are electronic images returned? . . . . . . . . . . .
(5a)
Clinical notes? . . . . . . . . . . . . . . . . . . . . . . . . . . .
Do they include medical history andfollow-up notes? . . . . . . . . . . . . . . . . . . . . . . . . . .
(6a) (b)
(b)
Yes No Unknown Turned off
1 2 3 4
1 –Ask (2b) and (2c)
2 –Ask (3a) 3 –Ask (3a) 4
1 2 3 4
1 2 3 4
1 –Ask (3b) 2 –Ask (4a) 3 –Ask (4a) 4
1 2 3 4
1 –Ask (4b) 2 –Ask (5a) 3 –Ask (5a) 4
1 2 3 4
1 –Ask (5b) 2 –Ask (6a) 3 –Ask (6a) 4
1 2 3 4
1 –Ask (6b) 2 –Ask (27c) 3 –Ask (27c) 4
1 2 3 4
c. Are there any of the above features of yoursystem that you do NOT use or have turnedoff?
Yes – Please specify 1
No Unknown
2
3
FR NOTE: Mark (X) in item 27b, last column, any component(s) turned off.
d. Are there plans for upgrading your currentelectronic medical record system withinthe next 3 years?
Yes No Maybe Unknown
1
2
3
4 } Ask item 28
e. Are there plans for installing an electronicmedical record system within the next 3years?
Yes No Maybe Unknown
1
2
3
4 } END interview.
Figure II. Selected questions from the National Survey of Ambulatory Surgery, 2006

Section III – EMERGENCY DEPARTMEN
Now I would like to ask you somequestions about your ED.
T DESCRIPTION – Continued
14a. Does your ED use electronic MEDICAL 1 RECORDS (not including billing records)? 2
Yes, all electronic Yes, part paper and part electronic
3 No } SKIP to 1item 4d 4 Unknown
Yes No Unknown Turned offb. Does your ED’s electronic medical recordsystem include –
1 2 3 4 (1) Patient demographic information?
1 2 3 4(2) Computerized orders for prescriptions?
If Yes, ask – (a) Are there warnings of drug interactions or contraindications provided? 1 2 3 4
(b) Are prescriptions sent electronically to the pharmacy? 1 2 3 4
1 2 3 4(3) Computerized orders for tests?
If Yes, ask – Are orders sent electronically? 1 2 3 4
1 2 3 4(4) Lab results? If Yes, ask – Are out of range levels
highlighted? 1 2 3 4
1 2 3 4(5) Imaging results?
If Yes, ask – Are electronic images returned? 1 2 3 4
1 2 (6) Clinical notes? 3 4
If Yes, ask – (a) Do they include medical 1 2 3 history and follow-up notes? 4
(b) Do they include reminders for guideline-based interventions and/or screening tests? 1 2 3 4
1 2 3 4(7) Public health reporting? If Yes, ask – Are notifiable diseases sent
electronically? 1 2 3 4
c. Are there any of the above features of your 1 Yes – Please specifysystem that your ED does NOT use or hasturned off?
FR NOTE – Indicate in item 14b, last column, any components turned off.
2 No 3
d. Are there plans for installing a new EMR 1 system or replacing the current system 2 within the next 3 years?
3
Unknown
Yes No Maybe
4 Unknown
Page 18 National Health Statistics Reports n Number 22 n April 30, 2010
Figure III. Selected questions from the National Hospital Ambulatory Medical Care Survey, 2006

Section IV – OUTPATIENT DEPARTMENT DESCRIPTION – Continued
Now I would like to ask you somequestions about your OPD.
14n. Does your OPD use electronic MEDICAL 1 Yes, all electronic RECORDS (not including billing records)? 2 Yes, part paper and part electronic
3 No, } SKIP to item 14q 4 Unknown
Yes No Unknown Turned offo. Does your OPD’s electronic medical recordsystem include –
1 2 3 4 (1) Patient demographic information?
1 2 3 4 (2) Computerized orders for prescriptions?
If Yes, ask – (a) Are there warnings of drug interactions or contraindications provided? 1 2 3 4
(b) Are prescriptions sent electronically to the pharmacy? 1 2 3 4
1 2 3 4 (3) Computerized orders for tests?
If Yes, ask – Are orders sent electronically? 1 2 3 4
1 2 3 4 (4) Lab results? If Yes, ask – Are out of range levels
highlighted? 1 2 3 4
1 2 3 4 (5) Imaging results?
If Yes, ask – Are electronic images returned? 1 2 3 4
1 2 3 4 (6) Clinical notes?
If Yes, ask – (a) Do they include medical 1 2 3 4history and follow-up notes?
(b) Do they include reminders for guideline-based interventions and/or screening tests? 1 2 3 4
1 2 3 4 (7) Public health reporting? If Yes, ask – Are notifiable diseases sent
electronically? 1 2 3 3
p. Are there any of the above features of your 1 Yes – Please specifysystem that your OPD does NOT use or hasturned off?
FR NOTE – Indicate in item 14o, last column, any components turned off.
2 No 3 Unknown
q. Are there plans for installing a new EMR 1 Yes system or replacing the current system 2 No within the next 3 years?
3 Maybe 4 Unknown
National Health Statistics Reports n Number 22 n April 30, 2010 Page 19

Page 20 National Health Statistics Reports n Number 22 n April 30, 2010
Section III – EMERGENCY DEPARTMENT DESCRIPTION – Continued
Now I would like to ask you somequestions about your ED.
14a. Does your ED have electronic patientmedical records?
1
2
3
4
Yes, all electronic Yes, part paper and part electronic No } SKIP to 14c Unknown
b. Does your ED’s electronic medical recordsystem include –
Y es No Unknown
(1) patient demographic information? 1 2 3
(2) computerized orders for prescriptions? 1 2 3
(3) computerized orders for tests? 1 2 3
(4) test results? 1 2 3
(5) nurses’ notes? 1 2 3
(6) physicians’ notes? 1 2 3
(7) reminders for guideline-based interventions and/or screening tests? 1 2 3
(8) public health reporting? 1 2 3
NOTES
Figure IV. Selected questions from the National Hospital Ambulatory Medical Care Survey, 2005

National Health Statistics Reports n Number 22 n April 30, 2010 Page 21
Section IV – OUTPATIENT DEPARTMENT
14l. Does your OPD have electronic patient1 medical records? 2
3
4
m. Does your OPD’s electronic medical recordsystem include –
DESCRIPTION – Continued
Yes, all electronicYes, part paper and part electronic No } SKIP to Section V, DISPOSITION Unknown AND SUMMARY on page 18
Yes No Unknown
(1) patient demographic information?
(2) computerized orders for prescriptions?
(3) computerized orders for tests?
(4) test results?
(5) nurses’ notes?
(6) physicians’ notes?
(7) reminders for guideline-based interventions and/or screening tests?
(8) public health reporting?
1 2 3
1 2 3
1 2 3
1 2 3
1 2 3
1 2 3
1 2 3
1 2 3
NOTES

Page 24 National Health Statistics Reports n Number 22 n April 30, 2010
Suggested citation
Hing E, Hall MJ, Ashman JJ. Use of electronic medical records by ambulatory care providers: United States, 2006. National health statistics reports; no 22. Hyattsville, MD: National Center for Health Statistics. 2010.
Copyright information
All material appearing in this report is in the public domain and may be reproduced or copied without permission; citation as to source, however, is appreciated.
National Center for Health Statistics
Edward J. Sondik, Ph.D., Director Jennifer H. Madans, Ph.D., Associate Director
for Science
Division of Health Care Statistics Jane E. Sisk, Ph.D., Director
U.S. DEPARTMENT OF HEALTH & HUMAN SERVICES
Centers for Disease Control and Prevention National Center for Health Statistics 3311 Toledo Road Hyattsville, MD 20782
FIRST CLASS POSTAGE & FEES PAID
CDC/NCHS PERMIT NO. G-284
OFFICIAL BUSINESS PENALTY FOR PRIVATE USE, $300
To receive this publication regularly, contact the National Center for Health Statistics by calling 1–800–232–4636 E-mail: [email protected] Internet: http://www.cdc.gov/nchs
DHHS Publication No. (PHS) 2010–1250 CS209790 T36090 (04/2010)