use of isocyte™-hts as a high throughput platform for ......the wells selected for method mi...

1
Cell-based assays that determine the health of cells and quantitate the number of cells in specific stages of the cell cycle are increasingly important in drug screening environments. Molecular Devices has developed a powerful new screening platform, the IsoCyte™, as a high throughput platform for multiparametric screening of cells in multi-well plates using laser scatter and fluorescence measurements. Here we report on the use of the IsoCyte™-HTS for automated screening of cells for cytotoxicity, mitotic index, and cell cycle analysis. The automated instrument is integrated with a Twister II™ plate handler and acquires a fluorescence image of each well allowing true full well or plate inspection at throughputs of 5 minutes/plate, and at a resolution of 5 microns regardless of the plate well density. Cytotoxicity of the model toxic agent saponin was evaluated with the ToxCount™ Cell Viability Assay Kit (Active Motif), a simple homogeneous 2-color assay used to determine the viability of cells. The percentage of cells in mitosis (mitotic index) was used to evaluate the effect of paclitaxel (Taxol™) as a model drug compound resulting in a late G2/M block. Mitotic cells were identified by the immunofluorescent detection of phosphorylated histone H3 and DNA content. Mitotic cells were designated as those with 4N DNA content and staining for phospho-histone H3. The IsoCyte™-HTS platform enables high throughput multiplexed assays and automated data processing important for therapeutic discovery and development environments. BBI has developed a platform with integrated image acquisition and analysis modules with the flexibility important for developing running, and validating image analysis procedures to enable high throughput assays. The first validated assay co- developed with Active Motif (Carlsbad, CA) was the ToxCount™ Cell Viability Assay kit; a homogeneous cytotoxicity assay. The second validated assay identifies mitotic cells by the immunofluorescent detection of phosphorylated histone H3 and DNA content. The Twister II Microplate Handler integration provides automation to the IsoCyte™. The base configuration, with one three-rack pod, provides plate capacity of up to 80 microplates and can be expanded with additional pods to handle up to 320 plates. The handler arm provides five axes of motion with an arm extension of 8.5" and wrist rotation of 270° to accommodate any source/destination configuration. Scanning and loading/unloading speeds allow total cycle times of 3-4 minutes per plate at 10 micron sampling regardless of well density. The IsoCyte-HTS has a small footprint which fits on standard lab benches. Cells and Culture Conditions. HeLa cells were cultured in MEM supplemented with 10% FCS. HeLa cells were plated in 96-well, black walled, clear-bottomed polystyrene plates at a density of 2,500 cells/well in 50 μl of growth medium and incubated overnight at 37 o C in a 5% CO 2 incubator. The growth medium was removed and the cells were treated with various concentrations of saponin or paclitaxel in 50 μl of complete medium. Autorun: Powerful Features and Easy to Use Interface Using IsoCyte™ with a Twister II Microplate Handler enables the user to choose Autorun to set up the IsoCyte™for automated plate handling. The Setup/Run menu option allows simple set up (Figure 1). Upon opening the window for Setup/Run, the available stations appear in green. Nest” refers to the IsoCyte™ instrument (plate nest), the barcode reader station, if present for scanning a microplate is referred to as “Barcode”, and the de-lidding area is called “Lid”. The number of configured racks on Twister II will also be green. No. of cycles allows each plate to be scanned up to 41 times. If a number greater than 1 is specified, you must choose the amount of time to delay between each scan. Individual delays between scans may be entered between 1 and 4,096 minutes (68 hours). Selecting Abort on Error will stop the Autorun program if a fatal error occurs during the run. The Error will be recorded into an Autorun log file of the run and all plate activity will halt until a user intervenes to restart the program. . If a barcode reader is detected on the system, enabling Use Barcodes results in each plate being scanned by the barcode reader before being placed into the IsoCyte™ plate tray. Figure 1. AutoRun Control Screen allows simple configuration of automated runs with result file destination, event logging and error notification. System status and control are also displayed. Summary In this report we have shown how the IsoCyte™ laser scanning platform with its unique optics and electronics has enabled a high throughput 2-color assay for MI quantitation. Each 96-well plate is scanned in 4 minutes at 5 x 5 micron sampling or 2 minutes at 10 x 10 sampling. Significant features of this platform are: Designed to run existing cytotoxicity and MI assays in a simple high throughput fashion Collection optics with a confined detection region that reduces fluorescence background for homogeneous non-wash assay development Whole well and cell-by-cell analysis normalizes measurement to total cell count and compensates for drug-induced loss of cells DNA content is measured at the same time allowing for cell-cycle analysis The platform is available with Autorun software and an integrated plate handler (Twister II) for walk-away operation (up to 320 plates) Detection of Mitotic cells. After paclitaxel treatment, the cells were fixed, permeabilized and immunostained with a mitotic marker antibody directed against the phosphorylation of Ser28 of histone H3 (phospho-H3). The rat anti-phospho histone H3 antibody was from Active Motif. The primary antibody was detected with a secondary antibody labeled with Alexa Fluor-488 (AF488; Invitrogen;Carlsbad, CA) or labeled with Chromeon 488 (Ch488; Active Motif). Propidium iodide (PI) and RNase A was used to identify all nuclei. Whole well images were analyzed on a cell- by-cell basis by identifying cells in the red channel and using the background corrected integrated fluorescence intensity for the green and red channels. The IsoCyte™laser scanning platform (Figure 1) was setup for 2-channel acquisition with the following band pass filters: Ch1: 510-540nm (green) and Ch3: 600nm long pass (red). The image acquisition was done at 5 x 5 micron sampling. 17 h Paclitaxel Treatment and Cell Cycle Histograms Histograms of the fluorescence distribution of the PI stained cells using the Ch3 (PI) integrated intensity were generated using an Excel macro developed by BBI. Results for PI staining of cells treated for 17 hours with the indicated concentrations of paclitaxel are shown below in Figure 4. 0 20 40 60 80 100 120 140 0 100 200 300 DNA Content Events 0 1 2 4 8 Paclitaxel (nM) G1 G2 + M Abstract Introduction Materials and Methods t t n o c s t l u s e R d t n o c s t l u s e R s t l u s e R Use of IsoCyte™-HTS as a High Throughput Platform for Cytotoxicity, Mitotic Index, and Cell Cycle Analysis Use of IsoCyte™-HTS as a High Throughput Platform for Cytotoxicity, Mitotic Index, and Cell Cycle Analysis Steven C. Miller, Jayne A. Hesley, Paul B. Comita, Chris B. Shumate, Paul Tam, and Evan F. Cromwell Blueshift Biotechnologies Inc., Sunnyvale, CA Steven C. Miller, Jayne A. Hesley, Paul B. Comita, Chris B. Shumate, Paul Tam, and Evan F. Cromwell Blueshift Biotechnologies Inc., Sunnyvale, CA Detection of Cytotoxicity. Whole well images analyzed on a cell-by-cell basis by identifying cells in the red channel and using the background corrected integrated fluorescence intensity for the green and red channels has been described previously in Application Note No. 1 “Homogeneous Cytotoxicity Assay”.The IsoCyte™ laser scanning platform was setup for 2-channel acquisition with the following band pass filters: Ch1: 510-540nm (green) and Ch3: 600nm long pass (red). The image acquisition was done at 5 x 5 micron sampling. Setup Rack Options No. of Plates is selected for the number of plates to be automatically run or the box Do All can be checked and all plates in the rack will be scanned and delivered to the destination rack (Figure 2). Restack can be enabled to return the plates to the source rack in their original order after scanning on IsoCyte™. One of the Racks must always be left empty to receive finished plates before restacking. If Restack is checked, after all the plates in the rack that have been configured to run are read, and stacked in the destination rack, the plates will subsequently be restacked in the source rack. Remove Lids will be active if a de-lidding station is detected. By checking Remove Lids, plates will be uncovered before loading into IsoCyte™. Method file(s) allows you to browse and as shown in Figure 2 select up to four Methods for scanning, analyzing, and saving data from each plate. Figure 2. Plate and Setup Rack Options Screens with selection of up to four Methods shown. The screen on the left shows the wells selected for Method MI AF488-10 and Method MI AF488-5 for image acquisition from rows A-D of a 96-well plate at 10 x 10 or 5 x 5 micron sampling, respectively. The Method MI Ch488-10 and Method MI Chr488-5 define the image acquisition from rows E-H of a 96-well plate at 10 x 10 or 5 x 5 micron sampling, respectively. 0.0% 1.0% 2.0% 3.0% 4.0% 5.0% 6.0% 7.0% 8.0% 9.0% 10.0% 0 . 0 0 0 1 2 . 1 3 0 Paclitaxel (nM) % Mitotic AF488 10 um Ch488 10 um AF488 5 um Ch488 5 um Figure 3. Mitotic Index results of comparison of secondary antibodies labeled with AF488 or CH488 and 10 vs 5 micron scan sampling. The results from Method MI AF488-10 and Method MI AF488-5 for image acquisition from rows A-D of a 96-well plate at 10 x 10 or 5 x 5 micron sampling, respectively or from Method MI Ch488-10 and Method MI Chr488-5 for image acquisition from rows E-H of a 96-well plate at 10 x 10 or 5 x 5 micron sampling, respectively. To demonstrate Autorun, paclitaxel treated (6 hr) HeLa cells in a 96-well plate were fixed, permeabilized and immunostained with a mitotic marker antibody directed against the phosphorylation of Ser28 of histone H3 (Active Motif; Carlsbad, CA). The primary antibody against phospho histone H3 was detected with a secondary antibody labeled with Alexa Fluor-488 (AF488; Invitrogen;Carlsbad, CA) in the plate top half showing rows A-D selected (the selected wells show blue outline in Figure 2). In rows E-H the secondary antibody was labeled with Chromeon 488 (Ch488; Active Motif). Figure 2 shows the use of four IsoCyte™ Methods with Autorun. The wells selected for Method MI AF488-10 and Method MI AF488-5 for two-color image acquisition from rows A- D (selected wells shown with blue outline in Figure 2) of a 96-well plate at 10 x 10 or 5 x 5 micron sampling, respectively. The Method MI Ch488-10 and Method MI Chr488-5 acquires images from rows E-H of a 96-well plate at 10 x 10 or 5 x 5 micron sampling, respectively. Image analysis occurs concurrently with scanning and the results are automatically saved as a list file (.csv) enumerating cell-by-cell data for each well and as a summary text file showing the percent mitotic cells in a plate layout format. Image acquisition and automatic MI cell quantification has been described previously in Application Note No. 10” High-Throughput Two-Color Mitotic Index Assay”. Figure 3 shows the results. Molecular Devices, Inc. invites you to contact us to discuss your specific applications for the IsoCyte™ platform. Figure 4. Paclitaxel treatment for 17 hours results in a concentration-dependent increase in the number of mitotic cells and decrease in the number of G1 cells. The DNA content measurement was normalized by setting the G1 peak at approximately 100.

Upload: others

Post on 23-May-2020

2 views

Category:

Documents


0 download

TRANSCRIPT

Cell-based assays that determine the health of cells and quantitate the number of cells in specific stages of the cell cycle are increasingly important in drug screening environments. Molecular Devices has developed a powerful new screening platform, the IsoCyte™, as a high throughput platform for multiparametric screening of cells in multi-well plates using laser scatter and fluorescence measurements. Here we report on the use of the IsoCyte™-HTS for automated screening of cells for cytotoxicity, mitotic index, and cell cycle analysis. The automated instrument is integrated with a Twister II™ plate handler and acquires a fluorescence image of each well allowing true full well or plate inspection at throughputs of 5 minutes/plate, and at a resolution of 5 microns regardless of the plate well density. Cytotoxicity of the model toxic agent saponin was evaluated with the ToxCount™ Cell Viability Assay Kit (Active Motif), a simple homogeneous 2-color assay used to determine the viability of cells. The percentage of cells in mitosis (mitotic index) was used to evaluate the effect of paclitaxel (Taxol™) as a model drug compound resulting in a late G2/M block. Mitotic cells were identified by the immunofluorescent detection of phosphorylated histone H3 and DNA content. Mitotic cells were designated as those with 4N DNA content and staining for phospho-histone H3. The IsoCyte™-HTS platform enables high throughput multiplexed assays and automated data processing important for therapeutic discovery and development environments.

BBI has developed a platform with integrated image acquisition and analysis modules with the flexibility important for developing running, and validating image analysis procedures to enable high throughput assays. The first validated assay co-developed with Active Motif (Carlsbad, CA) was the ToxCount™ Cell Viability Assay kit; a homogeneous cytotoxicity assay. The second validated assay identifies mitotic cells by the immunofluorescent detection of phosphorylated histone H3 and DNA content. The Twister II Microplate Handler integration provides automation to the IsoCyte™. The base configuration, with one three-rack pod, provides plate capacity of up to 80 microplates and can be expanded with additional pods to handle up to 320 plates. The handler arm provides five axes of motion with an arm extension of 8.5" and wrist rotation of 270° to accommodate any source/destination configuration. Scanning and loading/unloading speeds allow total cycle times of 3-4 minutes per plate at 10 micron sampling regardless of well density. The IsoCyte-HTS has a small footprint which fits on standard lab benches.

Cells and Culture Conditions. HeLa cells were cultured in MEM supplemented with 10% FCS. HeLa cells were plated in 96-well, black walled, clear-bottomedpolystyrene plates at a density of 2,500 cells/well in 50 µl of growth medium and incubated overnight at 37oC in a 5% CO2 incubator. The growth medium was removed and the cells were treated with various concentrations of saponin orpaclitaxel in 50 µl of complete medium.

Autorun: Powerful Features and Easy to Use InterfaceUsing IsoCyte™ with a Twister II Microplate Handler enables the user to chooseAutorun to set up the IsoCyte™ for automated plate handling. The Setup/Runmenu option allows simple set up (Figure 1).

Upon opening the window for Setup/Run, the available stations appear in green. “Nest” refers to the IsoCyte™ instrument (plate nest), the barcode reader station, if present for scanning a microplate is referred to as “Barcode”, and the de-lidding area is called “Lid”. The number of configured racks on Twister II will also be green.

No. of cycles allows each plate to be scanned up to 41 times. If a number greater than 1 is specified, you must choose the amount of time to delay between each scan. Individual delays between scans may be entered between 1 and 4,096 minutes (68 hours).

Selecting Abort on Error will stop the Autorun program if a fatal error occurs during the run. The Error will be recorded into an Autorun log file of the run and all plate activity will halt until a user intervenes to restart the program. .

If a barcode reader is detected on the system, enabling Use Barcodes results in each plate being scanned by the barcode reader before being placed into the IsoCyte™ plate tray.

Figure 1. AutoRun Control Screen allows simple configuration of automated runs with result file destination, event logging and error notification. System status and control are also displayed.

Summary

In this report we have shown how the IsoCyte™ laser scanning platform with its unique optics and electronics has enabled a high throughput 2-color assay for MI quantitation. Each 96-well plate is scanned in 4 minutes at 5 x 5 micron sampling or 2 minutes at 10 x 10 sampling. Significant features of this platform are:

Designed to run existing cytotoxicity and MI assays in a simple high throughput fashion

Collection optics with a confined detection region that reduces fluorescence background for homogeneous non-wash assay development

Whole well and cell-by-cell analysis normalizes measurement to total cell count and compensates for drug-induced loss of cells

DNA content is measured at the same time allowing for cell-cycle analysis

The platform is available with Autorun software and an integrated plate handler (Twister II) for walk-away operation (up to 320 plates)

Detection of Mitotic cells. After paclitaxel treatment, the cells were fixed, permeabilized and immunostained with a mitotic marker antibody directed against the phosphorylation of Ser28 of histone H3 (phospho-H3). The rat anti-phospho histone H3 antibody was from Active Motif. The primary antibody was detected with a secondary antibody labeled with Alexa Fluor-488 (AF488; Invitrogen;Carlsbad, CA) or labeled with Chromeon 488 (Ch488; Active Motif). Propidium iodide (PI) and RNase A was used to identify all nuclei. Whole well images were analyzed on a cell-by-cell basis by identifying cells in the red channel and using the background corrected integrated fluorescence intensity for the green and red channels. The IsoCyte™ laser scanning platform (Figure 1) was setup for 2-channel acquisition with the following band pass filters: Ch1: 510-540nm (green) and Ch3: 600nm long pass (red). The image acquisition was done at 5 x 5 micron sampling.

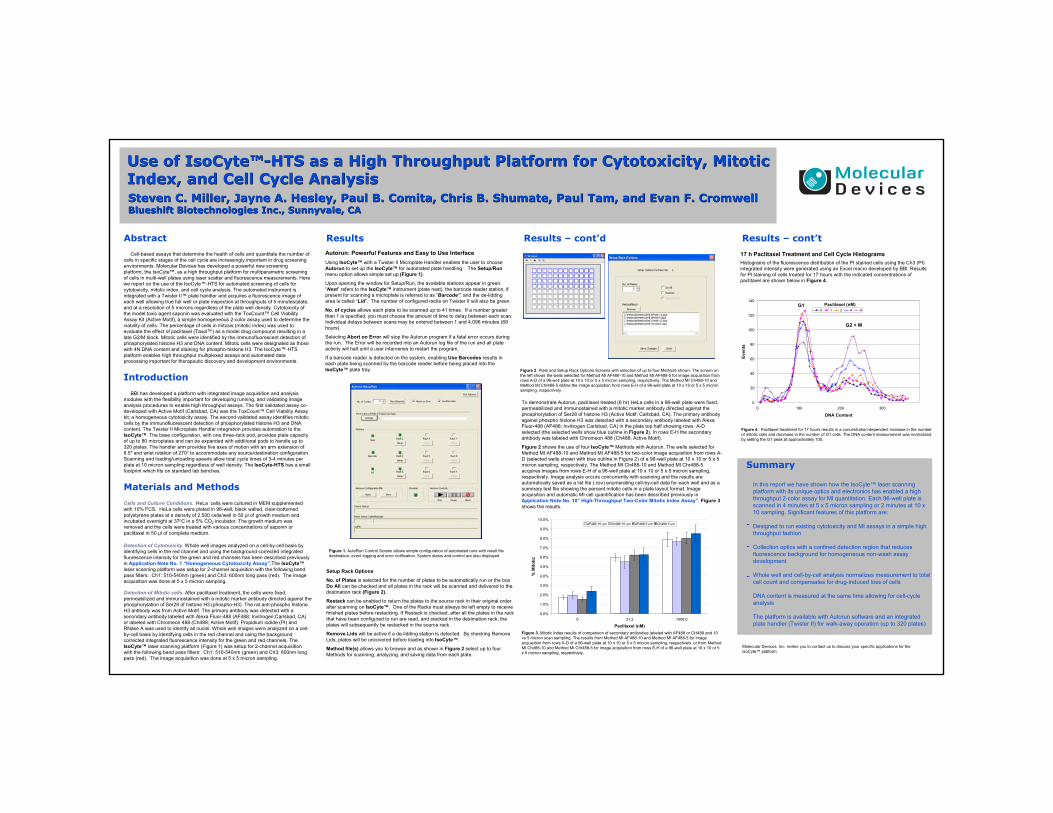
17 h Paclitaxel Treatment and Cell Cycle HistogramsHistograms of the fluorescence distribution of the PI stained cells using the Ch3 (PI) integrated intensity were generated using an Excel macro developed by BBI. Results for PI staining of cells treated for 17 hours with the indicated concentrations of paclitaxel are shown below in Figure 4.

0

20

40

60

80

100

120

140

0 100 200 300

DNA Content

Even

ts

0 1 2 4 8Paclitaxel (nM)G1

G2 + M

Abstract

Introduction

Materials and Methods

t’tnoc– stluseRd’tnoc– stluseRstluseR

Use of IsoCyte™-HTS as a High Throughput Platform for Cytotoxicity, Mitotic Index, and Cell Cycle AnalysisUse of IsoCyte™-HTS as a High Throughput Platform for Cytotoxicity, Mitotic Index, and Cell Cycle AnalysisSteven C. Miller, Jayne A. Hesley, Paul B. Comita, Chris B. Shumate, Paul Tam, and Evan F. Cromwell Blueshift Biotechnologies Inc., Sunnyvale, CASteven C. Miller, Jayne A. Hesley, Paul B. Comita, Chris B. Shumate, Paul Tam, and Evan F. Cromwell Blueshift Biotechnologies Inc., Sunnyvale, CA

Detection of Cytotoxicity. Whole well images analyzed on a cell-by-cell basis by identifying cells in the red channel and using the background corrected integrated fluorescence intensity for the green and red channels has been described previously in Application Note No. 1 “Homogeneous Cytotoxicity Assay”.The IsoCyte™laser scanning platform was setup for 2-channel acquisition with the following band pass filters: Ch1: 510-540nm (green) and Ch3: 600nm long pass (red). The image acquisition was done at 5 x 5 micron sampling.

Setup Rack Options

No. of Plates is selected for the number of plates to be automatically run or the box Do All can be checked and all plates in the rack will be scanned and delivered to the destination rack (Figure 2).

Restack can be enabled to return the plates to the source rack in their original order after scanning on IsoCyte™. One of the Racks must always be left empty to receive finished plates before restacking. If Restack is checked, after all the plates in the rack that have been configured to run are read, and stacked in the destination rack, the plates will subsequently be restacked in the source rack.

Remove Lids will be active if a de-lidding station is detected. By checking Remove Lids, plates will be uncovered before loading into IsoCyte™.

Method file(s) allows you to browse and as shown in Figure 2 select up to four Methods for scanning, analyzing, and saving data from each plate.

Figure 2. Plate and Setup Rack Options Screens with selection of up to four Methods shown. The screen on the left shows the wells selected for Method MI AF488-10 and Method MI AF488-5 for image acquisition from rows A-D of a 96-well plate at 10 x 10 or 5 x 5 micron sampling, respectively. The Method MI Ch488-10 and Method MI Chr488-5 define the image acquisition from rows E-H of a 96-well plate at 10 x 10 or 5 x 5 micron sampling, respectively.

0.0%

1.0%

2.0%

3.0%

4.0%

5.0%

6.0%

7.0%

8.0%

9.0%

10.0%

0.00012.130

Paclitaxel (nM)

% M

itotic

AF488 10 um Ch488 10 um AF488 5 um Ch488 5 um

Figure 3. Mitotic Index results of comparison of secondary antibodies labeled with AF488 or CH488 and 10 vs 5 micron scan sampling. The results from Method MI AF488-10 and Method MI AF488-5 for image acquisition from rows A-D of a 96-well plate at 10 x 10 or 5 x 5 micron sampling, respectively or from Method MI Ch488-10 and Method MI Chr488-5 for image acquisition from rows E-H of a 96-well plate at 10 x 10 or 5 x 5 micron sampling, respectively.

To demonstrate Autorun, paclitaxel treated (6 hr) HeLa cells in a 96-well plate were fixed, permeabilized and immunostained with a mitotic marker antibody directed against the phosphorylation of Ser28 of histone H3 (Active Motif; Carlsbad, CA). The primary antibody against phospho histone H3 was detected with a secondary antibody labeled with Alexa Fluor-488 (AF488; Invitrogen;Carlsbad, CA) in the plate top half showing rows A-D selected (the selected wells show blue outline in Figure 2). In rows E-H the secondary antibody was labeled with Chromeon 488 (Ch488; Active Motif).

Figure 2 shows the use of four IsoCyte™ Methods with Autorun. The wells selected for Method MI AF488-10 and Method MI AF488-5 for two-color image acquisition from rows A-D (selected wells shown with blue outline in Figure 2) of a 96-well plate at 10 x 10 or 5 x 5 micron sampling, respectively. The Method MI Ch488-10 and Method MI Chr488-5 acquires images from rows E-H of a 96-well plate at 10 x 10 or 5 x 5 micron sampling, respectively. Image analysis occurs concurrently with scanning and the results are automatically saved as a list file (.csv) enumerating cell-by-cell data for each well and as a summary text file showing the percent mitotic cells in a plate layout format. Image acquisition and automatic MI cell quantification has been described previously in Application Note No. 10” High-Throughput Two-Color Mitotic Index Assay”. Figure 3shows the results.

Molecular Devices, Inc. invites you to contact us to discuss your specific applications for the IsoCyte™ platform.

Figure 4. Paclitaxel treatment for 17 hours results in a concentration-dependent increase in the number of mitotic cells and decrease in the number of G1 cells. The DNA content measurement was normalized by setting the G1 peak at approximately 100.