use of medicaid data to inform lead screening policy
DESCRIPTION
CHEAR Unit, Division of General Pediatrics, University of Michigan. Use of Medicaid Data to Inform Lead Screening Policy. Alex R. Kemper, MD, MPH, MS June 25, 2005. Collaborators / Support. CHEAR Unit Kathryn Fant, MPH Lisa Cohn, MS Kevin Dombkowski, DrPH Sarah Clark, MPH - PowerPoint PPT PresentationTRANSCRIPT

Use of Medicaid Data to Inform Lead Screening Policy
Alex R. Kemper, MD, MPH, MS
June 25, 2005
CHEAR Unit, Division of General Pediatrics, University of Michigan

Collaborators / Support• CHEAR Unit
– Kathryn Fant, MPH– Lisa Cohn, MS– Kevin Dombkowski, DrPH– Sarah Clark, MPH
• Michigan Department of Community Health– Sharon Hudson, RN, MSN, CNM
• Research supported by the Michigan Department of Community Health

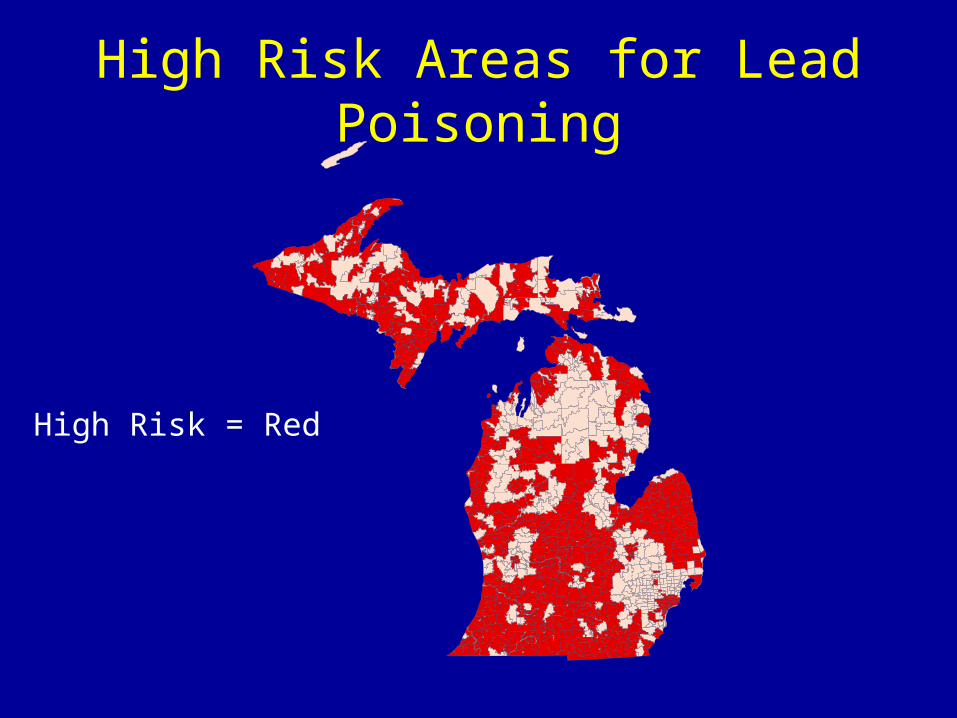
High Risk Areas for Lead Poisoning
0 40 80 120 16020Miles
High Risk = Red

State Action – 2003• Series of policy responses to combat lead
poisoning, including:– Funding for lead abatement– Penalizing rental agencies who fail to
remediate– Mandating that 80% of Medicaid-enrolled
children ≤ 5 years receive testing
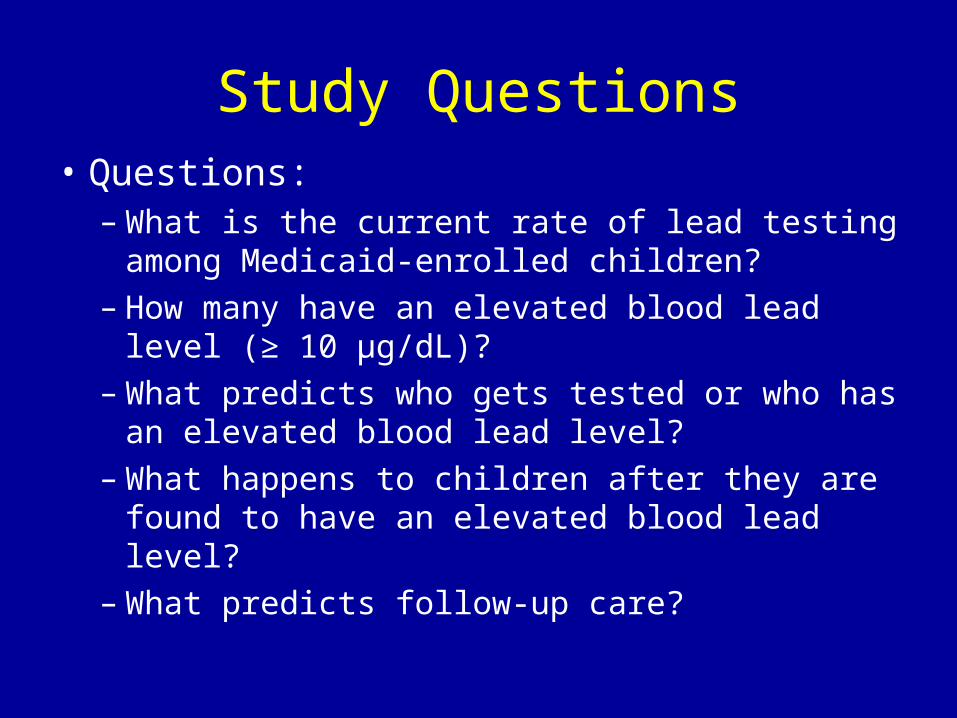
Study Questions• Questions:
– What is the current rate of lead testing among Medicaid-enrolled children?
– How many have an elevated blood lead level (≥ 10 μg/dL)?
– What predicts who gets tested or who has an elevated blood lead level?
– What happens to children after they are found to have an elevated blood lead level?
– What predicts follow-up care?

Data Sources
• Data Sources– Medicaid enrollment files – Medicaid claims data– Reports of blood lead levels

Testing Rates
• Methods– Retrospective analysis of children ≤ 5 years
continuously enrolled in Medicaid in 2002
Testing Rates
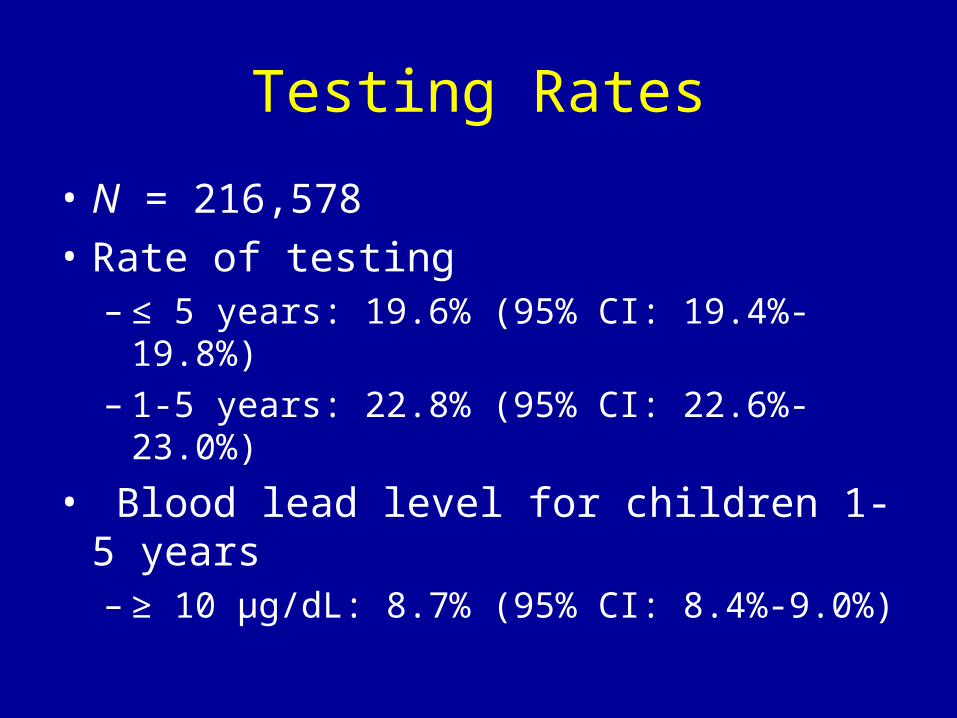
• N = 216,578
• Rate of testing– ≤ 5 years: 19.6% (95% CI: 19.4%-19.8%)– 1-5 years: 22.8% (95% CI: 22.6%-23.0%)
• Blood lead level for children 1-5 years– ≥ 10 μg/dL: 8.7% (95% CI: 8.4%-9.0%)

Testing Rates
• Associations with testing or elevated blood lead level– Age– Gender – Race/ethnicity– Residence– Urban/rural status– Medicaid enrollment type– Blood sampling method

Testing Rates Testing
OR (95% CI)
Elevated blood lead level
OR (95% CI)
Age (y)
< 1 0.20 (0.16-0.24) 0.29 (0.26-0.31)
1 1 (Reference) 1 (Reference)
2 0.60 (0.52-0.69) 1.31 (1.29-1.34)
3 0.81 (0.75-0.87) 1.03 (1.03-1.03)
4 0.89 (0.82-0.97) 0.94 (0.94-0.94)
5 0.17 (0.13-0.21) 0.96 (0.96-0.97)
Gender
Female 1 (Reference) 1 (Reference)
Male 1.01 (1.00-1.02) 1.16 (1.15-1.16)
Race/Ethnicity
Non-Hispanic white 1 (Reference) 1 (Reference)
Hispanic or non-white 2.42 (2.12-2.77) 3.07 (2.82-3.35)
Cont’d

Testing Rates Testing Elevated blood lead level
Risk of Lead Exposure
Low-risk 1 (Reference) 1 (Reference)
High-risk 1.51 (1.48-1.54) 3.38 (2.81-4.05)
Residence
Rural 1 (Reference) 1 (Reference)
Urban 1.17 (1.04-1.31) 2.92 (2.82-3.03)
Medicaid enrollment
Mostly fee-for-service 1 (Reference) 1 (Reference)
Mixed fee-for-service/managed care 1.35 (1.00-1.82) 0.86 (0.73-1.00)
Mostly managed care 1.98 (1.46-2.68) 1.13 (0.98-1.31)
Blood sampling method
Capillary -- 1 (Reference)
Venous -- 0.96 (0.95-0.97)
Cont’d

Conclusions: Testing
• The rate of testing is low.
• Testing appears geared to perceived risk.
• Managed care programs doing better than fee-for-service
Follow-up Testing
• Follow-up testing is the cornerstone of management– Confirmatory testing– Repeat testing
Follow-up Testing
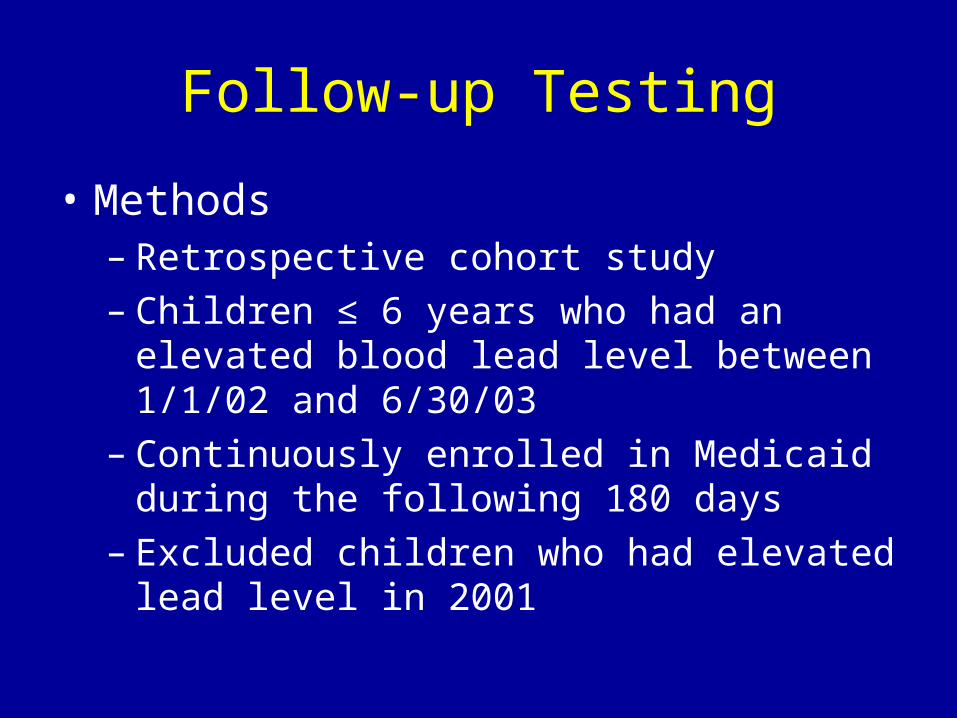
• Methods– Retrospective cohort study– Children ≤ 6 years who had an elevated blood
lead level between 1/1/02 and 6/30/03– Continuously enrolled in Medicaid during the
following 180 days– Excluded children who had elevated lead
level in 2001

Follow-up Testing
• Methods– For each child, we identified any other lead
testing in the 180 days following the first elevated blood lead level
– For those without repeat testing, we used claims data to assess for missed opportunities (outpatient office visits)

Follow-up Testing
• N=3,682• Follow-up testing received by 53.9% within 180
days• More than half (56.2%) of those who did not have
follow-up testing had a missed opportunity.
• What are the factors associated with follow-up testing? For this, we also considered the effect of local health department catchment area.
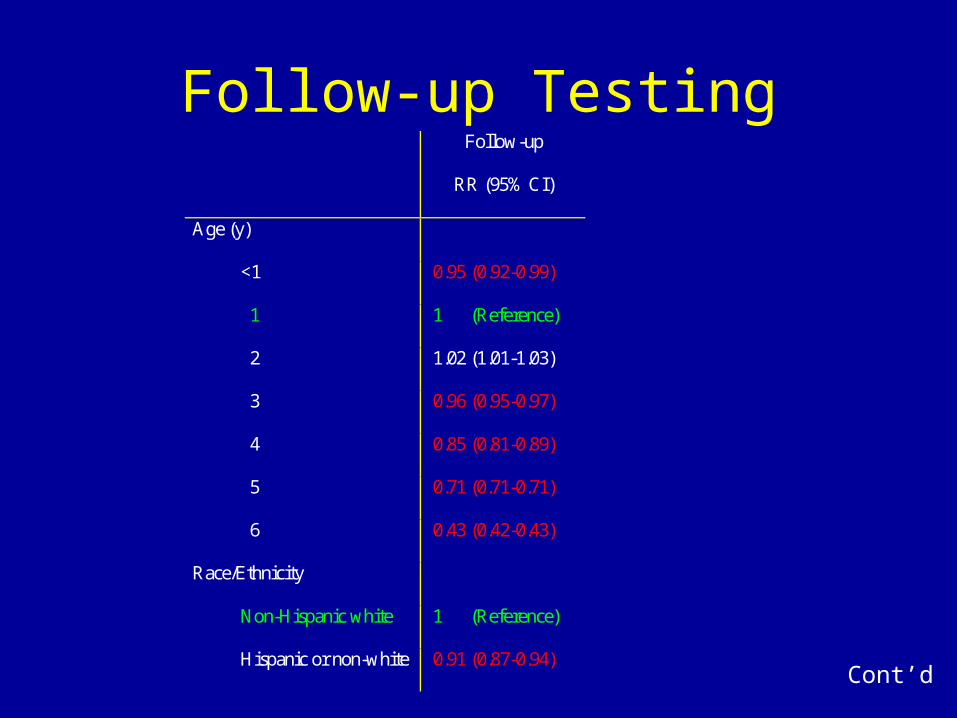
Follow-up Testing Follow-up
RR (95% CI)
Age (y)
<1 0.95 (0.92-0.99)
1 1 (Reference)
2 1.02 (1.01-1.03)
3 0.96 (0.95-0.97)
4 0.85 (0.81-0.89)
5 0.71 (0.71-0.71)
6 0.43 (0.42-0.43)
Race/Ethnicity
Non-Hispanic white 1 (Reference)
Hispanic or non-white 0.91 (0.87-0.94)
Cont’d

Follow-up Testing Follow-up
Residence
Rural 1 (Reference)
Urban 0.92 (0.89-0.96)
Lead Exposure Risk
Low 1 (Reference)
High 0.94 (0.92-0.96)
Health Department Area
LHD #1 0.88 (0.86-0.89)
LHD #2 1.20 (1.17-1.22)
All Others 1 (Reference)
Cont’d
Cont’d

Follow-up Testing Follow-up
Initial Blood Sample Type
Venous 1 (Reference)
Capillary 1.11 (1.05-1.16)
Initial Blood Lead Level (μg/dL)
10-19 1 (Reference)
20-44 1.36 (1.34-1.39)
≥45 1.82 (1.81-1.82)
Cont’d
Conclusions: Follow-up
• Many children do not have follow-up testing.
• Those with the greatest initial risk of having lead poisoning have the lowest likelihood of follow-up testing.

Implications
• Defining the role of primary care providers vs. public health– Who should be responsible for testing and
follow-up?– How should information be shared – lead
registry?
• Lessons from managed care
Future Research
• Understand barriers– Perspective
• Health Care Providers• Families
• Define available resources and relationship at the local level between public health departments and private health care providers
• Designing interventions that can be prospectively evaluated

Ongoing Efforts
• Quality Improvement
• Learning from Managed Care plans
• Ongoing Challenges