use of phillips’s five level training evaluation …/67531/metadc3996/m2... · 2018-07-31 ·...
TRANSCRIPT
APPROVED: Jerry Wircenski, Major Professor Mark Davis, Minor Professor Jeff Allen, Committee Member Jack J. Phillips, Committee Member Robin Henson, Interim Chair of the Department of
Technology and Cognition M. Jean Keller, Dean of the College of Education Sandra L. Terrell, Dean of the Robert B. Toulouse
School of Graduate Studies
USE OF PHILLIPS’S FIVE LEVEL TRAINING EVALUATION AND RETURN ON
INVESTMENT FRAMEWORK IN THE U. S. NON-PROFIT SECTOR
Travis K. Brewer, A.S., B.S., M.Ed.
Dissertation Prepared for the Degree of
DOCTOR OF PHILOSOPHY
UNIVERSITY OF NORTH TEXAS
August 2007

Brewer, Travis K. Use of Phillips’s five level training evaluation and ROI framework in
the U.S. nonprofit sector. Doctor of Philosophy (Applied Technology and Performance
Improvement), August 2007, 163 pp., 29 tables, references, 100 references.
This study examined training evaluation practices in U.S. nonprofit sector organizations.
It offered a framework for evaluating employee training in the nonprofit sector and suggested
solutions to overcome the barriers to evaluation. A mail survey was sent to 879 individuals who
were members of, or had expressed an interest in, the American Society for Training and
Development. The membership list consisted of individuals who indicated association/nonprofit
or interfaith as an area of interest.
Data from the survey show that training in the nonprofit sector is evaluated primarily at
Level 1 (reaction) and Level 2 (learning). It also shows decreasing use from Level 3 (application)
through Level 5 (ROI). Reaction questionnaires are the primary method for collecting Level 1
data. Facilitator assessment and self-assessment were listed as the primary method for evaluating
Level 2. A significant mean rank difference was found between Level 2 (learning) and the
existence of an evaluation policy. Spearman rho correlation revealed a statistically significant
relationship between Level 4 (results) and the reasons training programs are offered.
The Kruskal-Wallis H test revealed a statistically significant mean rank difference
between “academic preparation” of managers with Level 3 evaluation. The Mann-Whitney U test
was used post hoc and revealed that master’s degree had a higher mean rank compared to
bachelor’s degree and doctorate.
The Mann-Whitney U test revealed that there were statistically significant mean rank
differences on Level 1, Level 2, Level 3, and Level 5 evaluation use with the barriers “little

perceived value to the organization,” “lack of training or experience using this form of
evaluation,” and “not required by the organization.”
Research findings are consistent with previous research conducted in the public sector,
business and industry, healthcare, and finance. Nonprofit sector organizations evaluate primarily
at Level 1 and Level 2. The existence of a written policy increases the use of Level 2 evaluation.
Training evaluation is also an important part of the training process in nonprofit organizations.
Selecting programs to evaluate at Level 5 is reserved for courses which are linked to
organizational outcomes and have the interest of top management.

ii
Copyright 2007
by
Travis K. Brewer

iii
ACKNOWLEDGEMENTS
As a long journey comes to a close, I would like to acknowledge the following
people and organizations for their love, support, sacrifice, and assistance as I pursued my
doctoral degree.
To my committee, professors Jerry Wircenski, Jeff Allen, and Mark Davis, I
thank you for your support and encouragement. And to committee member Jack Phillips,
thank you for agreeing to sit on my committee. I appreciate your devotion and expertise
to training evaluation and ROI.
To my partner, Dirk, for supporting and encouraging me when times were tough.
Your deep devotion and undying love kept me going when I really wanted to quit. I
would not be where I am today without your support.
To my parents, Jerry and Sherlene Brewer, I thank you for your love and support.
Mom, I admire you for the obstacles you have overcome in life. I get my strength and
perseverance from you. Dad, thank you for helping me to understand that in school I
would “learn how to learn.”
To my mentor and friend, Diane Culwell, I would like to thank you for your
wisdom, guidance and support of me during my journey. You allowed me to develop and
grow as a person and as a trainer.
I would also like to acknowledge Patti Phillips and the ROI Institute. Patti, thank
you for giving me advice and direction during my journey, which kept me focused on
training evaluation. Every time I bugged you with questions, you were more than happy
to give me answers. I also appreciate the ROI Institute for the generous grant to support
my study and for the work they do with training evaluation and ROI.

iv
TABLE OF CONTENTS
Page
LIST OF TABLES...........................................................................................................vi
Chapter
1. INTRODUCTION .........................................................................................1
Theoretical Framework Significance of the Study Purpose of the Study Research Questions and Hypotheses Limitations Delimitations Definition of Terms Summary
2. REVIEW OF RELATED LITERATURE.....................................................13
Introduction Employer-Sponsored Training Definition Need for Training Training in Nonprofit Sector Training Evaluation Definition of Training Evaluation Frameworks of Evaluation Phillips’s Five-Level Training Evaluation Framework Use of Phillips’s Framework Findings on Use Barriers to Use
3. METHODOLOGY ........................................................................................35
Introduction Research Design Population Sample Instrumentation Variables Validity Reliability Data Collection Procedures

v
Data Analysis Procedures Summary
4. FINDINGS.....................................................................................................47
Overview Demographics Research Questions Analysis Hypotheses Analysis General Comments Summary of Findings
5. SUMMARY, CONCLUSIONS, AND RECOMMENDATIONS.................80
Overview Summary of Findings Discussion of Findings Limitations of the Results Conclusions Recommendations
APPENDICES .................................................................................................................101
REFERENCES ................................................................................................................154
vi
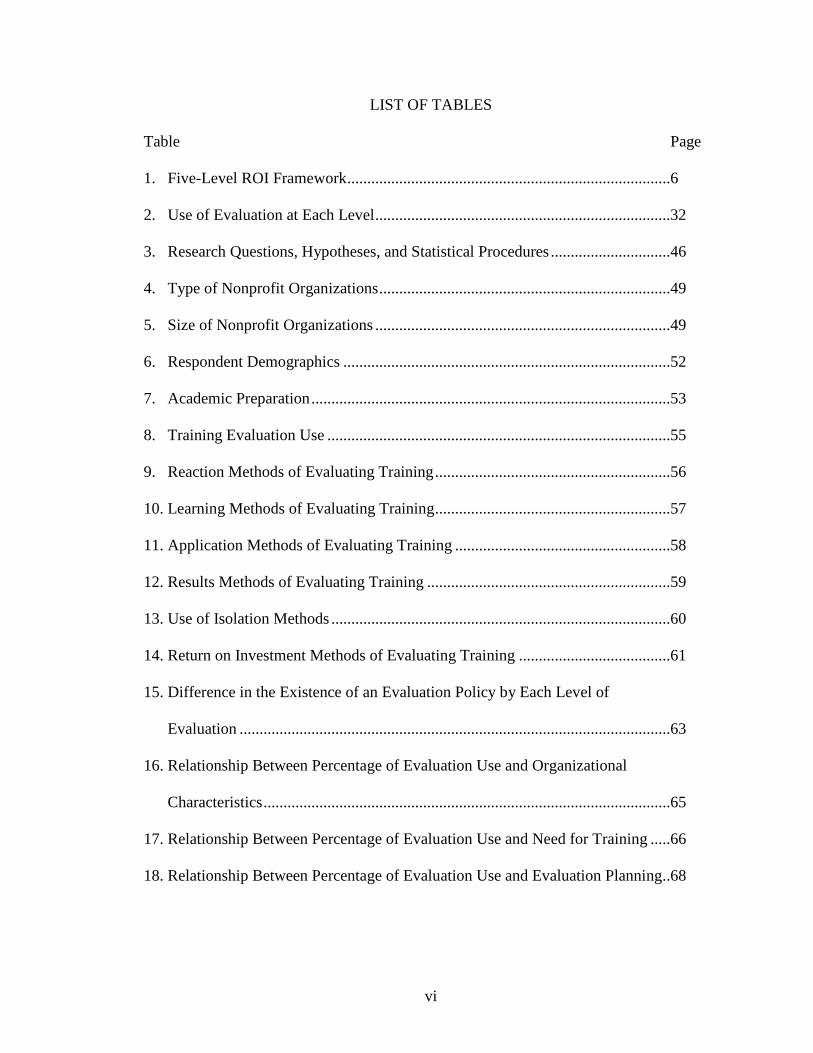
LIST OF TABLES
Table Page
1. Five-Level ROI Framework.................................................................................6
2. Use of Evaluation at Each Level..........................................................................32
3. Research Questions, Hypotheses, and Statistical Procedures..............................46
4. Type of Nonprofit Organizations.........................................................................49
5. Size of Nonprofit Organizations ..........................................................................49
6. Respondent Demographics ..................................................................................52
7. Academic Preparation..........................................................................................53
8. Training Evaluation Use ......................................................................................55
9. Reaction Methods of Evaluating Training...........................................................56
10. Learning Methods of Evaluating Training...........................................................57
11. Application Methods of Evaluating Training ......................................................58
12. Results Methods of Evaluating Training .............................................................59
13. Use of Isolation Methods .....................................................................................60
14. Return on Investment Methods of Evaluating Training......................................61
15. Difference in the Existence of an Evaluation Policy by Each Level of
Evaluation ............................................................................................................63
16. Relationship Between Percentage of Evaluation Use and Organizational
Characteristics......................................................................................................65
17. Relationship Between Percentage of Evaluation Use and Need for Training .....66
18. Relationship Between Percentage of Evaluation Use and Evaluation Planning..68

vii
19. Relationship Between Percentage of Evaluation Use and Reporting of
Evaluation ............................................................................................................69
20. Relationship Between Percentage of Evaluation Use and Training Staff
Involved in Evaluation.........................................................................................69
21. Criteria for Selecting Programs to Evaluate at Level 5, ROI ..............................70
22. Criteria for Selecting Methods to Evaluate at Level 5, ROI................................71
23. Differences in Evaluation Use and Academic Preparation..................................73
24. Barriers to Training Evaluation ...........................................................................75
25. Differences with the Barriers to Evaluation at Level 1........................................76
26. Differences with the Barriers to Evaluation at Level 2........................................77
27. Differences with the Barriers to Evaluation at Level 3........................................78
28. Differences with the Barriers to Evaluation at Level 5, ROI...............................78
29. Comparison of Nonprofit Sector Use of Training Evaluation.............................82

1
CHAPTER 1
INTRODUCTION
As the world changes, Human Resource Development (HRD) is taking on a
greater role in increasing effectiveness and efficiency in organizations (Gilley, Quatro, &
Lynham, 2003; J.J. Phillips, 1997a, 1997b). Nadler (1990) defined HRD as “organized
learning experiences in a definite time period to increase the possibility of improving job
performance [and] growth” (p. 1.3). Learning and job performance are aspects of HRD
that have been around since the beginning of time. Cavemen drew pictures on the walls
of caves to illustrate how to hunt and fish, and these drawings were useful in teaching
future generations how to gather food. Apprenticeships and individual teaching gave way
to group learning as the Unites States experienced the Industrial Revolution of the early
19th century (Miller, 1996; Nadler, 1990).
During the 1940s, in response to the growing field of HRD, the American Society
for Training Directors (later renamed the American Society for Training and
Development) was established to support workplace learning. The 1960s through the
1980s was a period of great technological advances. During the 1980s, the desktop
computer was introduced to Americans. The technological advances brought about a need
for a new and different type of training, and also created a need for rapid training.
Workers were required to learn at a much faster pace. The 1990s through the present day
have seen rapid global expansion and competition. Global competition has put HRD in
the spotlight as a driver of organizational learning and change (Miller, 1996; Nadler,
1990).

2
Human Resource Development is focused on improving the job performance and
growth of the employee. Training, education, and development are the three areas of
learning in HRD (Nadler, 1990). Each has a distinct purpose in improving performance
and expanding the growth of employees. Training is learning activity to enhance an
employee’s current skills for his or her present job. As technology changes, training is
necessary to keep pace with these changes. Education prepares an individual for a future
job that has been identified, and it enables an employee to gain skills for a future job
and/or promotion within the company. Development of an employee refers to individual
growth for the employee but is not tied to any specific current or future job (Laird, 1985;
Nadler, 1990). Personal growth and development is important for employees.
Development opportunities allow employees to continually learn, which prepares them
for the changes that they will face in the organization.
Training is one of the most important HRD activities in organizations today. Each
year in the United States, more than 50 million employees receive some type of
employer-sponsored training (J.J. Phillips, 1997b). The 2004 Industry Report (23rd
annual) from Training reported that $51.4 billion was spent on training in 2004
(Training, 2004). This figure was up slightly from the $51.3 billion spent on training in
2003. In 2005, a total of $51.1 billion was budgeted for training (Training, 2005). A
study conducted by Rutgers University estimated that companies waste between $5.6 and
$16.8 billion each year on training programs that are ineffective (Armour, 1998). J.J.
Phillips (1997c) pointed out that because organizations are spending large amounts of
their budget on training, executives are demanding to know the return on the investment
for the company. Bottom line results are important to these executives.
3
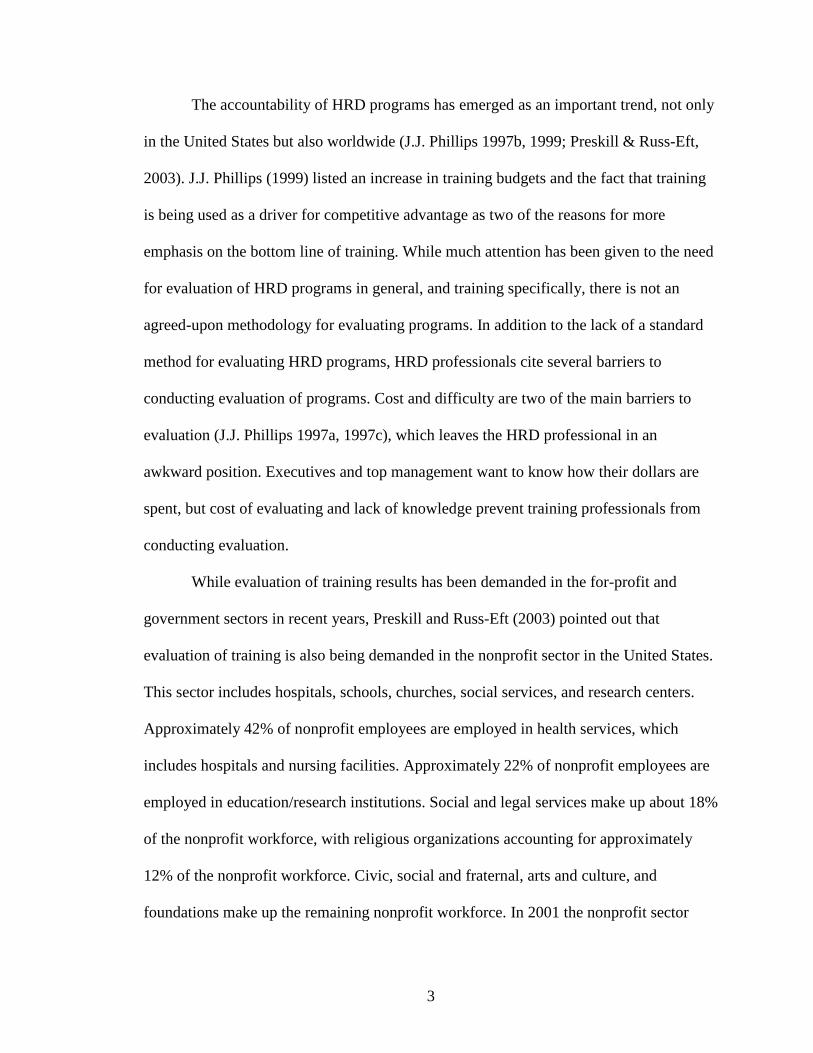
The accountability of HRD programs has emerged as an important trend, not only
in the United States but also worldwide (J.J. Phillips 1997b, 1999; Preskill & Russ-Eft,
2003). J.J. Phillips (1999) listed an increase in training budgets and the fact that training
is being used as a driver for competitive advantage as two of the reasons for more
emphasis on the bottom line of training. While much attention has been given to the need
for evaluation of HRD programs in general, and training specifically, there is not an
agreed-upon methodology for evaluating programs. In addition to the lack of a standard
method for evaluating HRD programs, HRD professionals cite several barriers to
conducting evaluation of programs. Cost and difficulty are two of the main barriers to
evaluation (J.J. Phillips 1997a, 1997c), which leaves the HRD professional in an
awkward position. Executives and top management want to know how their dollars are
spent, but cost of evaluating and lack of knowledge prevent training professionals from
conducting evaluation.
While evaluation of training results has been demanded in the for-profit and
government sectors in recent years, Preskill and Russ-Eft (2003) pointed out that
evaluation of training is also being demanded in the nonprofit sector in the United States.
This sector includes hospitals, schools, churches, social services, and research centers.
Approximately 42% of nonprofit employees are employed in health services, which
includes hospitals and nursing facilities. Approximately 22% of nonprofit employees are
employed in education/research institutions. Social and legal services make up about 18%
of the nonprofit workforce, with religious organizations accounting for approximately
12% of the nonprofit workforce. Civic, social and fraternal, arts and culture, and
foundations make up the remaining nonprofit workforce. In 2001 the nonprofit sector

4
included 12.5 million employees, and from 1997-2001, the nonprofit sector had
employment growth of 2.5%. During this same period, the business sector had only a
1.8% growth in employment while the government sector had only a 1.6% growth
(Weitzman, Jalandoni, Lampkin, & Dolak, 2002).
Accountability is crucial to the nonprofit sector. Charitable organizations provide
valuable services to American society. Funding for these services comes from private and
corporate donations and from government grants, and donors want to know how their
money is being used. As a result of the corporate scandals in the United States, media
outlets began to look at the practices of the nonprofit sector in 2002. The investigations
found several practices that were illegal or not typical of the nonprofit sector. In 2004 the
leaders of the Senate Finance Committee encouraged the independent sector to convene a
panel of leaders from the charitable sector to come up with recommendations to
strengthen the governance, transparency, and accountability of the nonprofit sector
(Independent Sector, 2005).
The panel convened several hearings across the United States and came up with
15 recommendations to improve accountability of the nonprofit sector. Two of the
recommendations are worth noting. First, the panel recommended that the government
provide more resources for the Internal Revenue Service (IRS) so that it can enforce the
reporting requirements of the nonprofit sector. The panel also recommended that the
information that nonprofit organizations’ reports to the IRS become available to the
general public. This move for more transparency will allow the public to gain more
knowledge of the operations of nonprofit organizations, which will allow the public to

5
make better informed decisions about charitable contributions (Independent Sector,
2005).
Another recommendation the panel made was for more disclosure of performance
data. The panel noted that “every charitable organization should, as a recommended
practice, provide detailed information about its programs, including methods it uses to
evaluate the outcomes of programs, and other statements available to the public through
its annual report, website, and other means” (Independent Sector, 2005, p. 37). The panel
encouraged charitable organizations to share more detailed information about its
programs in an annual report. Because of the size and budget of many charitable
organizations, the panel was careful not to recommend too many changes that would
require government regulations or put undue burden on charitable organizations.
Theoretical Framework
The theoretical framework for this study is based on J.J. Phillips’s (1997a) Five-
Level Return on Investment (ROI) Framework. The Five-Level Framework adds a fifth
level to Kirkpatrick’s (1994, 1998) four levels of evaluation. Phillips expanded
Kirkpatrick’s framework by adding a fifth level (see Table 1).

6
Table 1
Five-Level ROI Framework
Level Brief description
1 Reaction & Planned Action Measures participant’s reaction to the program and out-lines specific plans for implementation.
2 Learning Measures skills, knowledge, or attitude changes.
3 Job Applications Measures change in behavior on the job and specific application of the training material.
4 Business Results Measures business impact of the program.
5 Return on Investment Measures the monetary value of the results and costs for the program, usually expressed as a percentage.
Note. From Handbook of Training Evaluation and Measurement Methods (3rd ed.), by J.
J. Phillips, 1997a, (p. 43). Boston: Butterworth-Heinemann. Copyright 1997 by Elsevier.
Reprinted with permission.
Level 1, Reaction and Planned Action, program participants’ satisfaction is
measured along with a written plan for implementing what they have learned. This level
varies from Kirkpatrick’s with the addition of an action plan. Almost all organizations
use a questionnaire or smile sheet to evaluate training at Level 1. A favorable evaluation
at this level does not indicate that participants have learned new knowledge or skills (J.J.
Phillips, 1997a).
Level 2, Learning, focuses on assessing the skills and knowledge that the
participants learned during training. Tests, role-plays, simulations, group evaluations, and
skills practice are some of the tools used to assess learning. It is important to assess
learning to ensure that participants have absorbed the material and know how to use it. A
positive assessment at Level 2 does not indicate that participants will apply what they
have learned once they are back on the job (J.J. Phillips, 1997a).

7
Level 3, Job Applications, measures changes in the behavior of the participant
once back on the job. Various assessment tools for Level 3 include observation,
subordinate or supervisor interview, sending a questionnaire to the supervisor or
subordinates of the trainee, and participant self-assessment by means of a questionnaire
or focus group. Even though participants are applying what they have learned once back
on the job, this does not guarantee positive business results (J.J. Phillips, 1997a).
Level 4, Business Results, measurement focuses on actual business results
achieved after participants are sent through training. Level 4 measures include output,
quality, time, costs, and customer satisfaction. If the training program does produce
measurable business results, the cost to conduct the program may outweigh the benefit
received (J.J. Phillips, 1997a).
Level 5, Return on Investment, assessment takes Level 4 a step further.
Measurement at this level compares the monetary benefits from the program with the
fully loaded cost to conduct the program. ROI is usually expressed as a cost/benefit ratio
or a percentage. Conducting an impact study of a training program requires completing
all five steps in the framework (J.J. Phillips, 1997a).
Significance of the Study
Pressure on all business sectors to show accountability includes the nonprofit
sector, which operates with private donations and government and private grants. With
little research on training evaluation and ROI in the nonprofit sector in the United States,
this study is designed to show the current state of training evaluation in this sector. This
study will contribute to the existing literature on training evaluation and also test the

8
validity of previous research (Gomez, 2003; Hill, 1999; P.P. Phillips, 2003; Twitchell,
1997).
Purpose of the Study
The purpose of this study is to examine how nonprofit sector organizations in the
United States evaluate employer-sponsored training using Phillips’s five-level evaluation
framework. This research builds on existing knowledge on how training is evaluated at
the reaction (Level 1), learning (Level 2), application (Level 3), impact (Level 4), and
ROI (Level 5) levels. Previous research conducted in business and industry (Twitchell,
1997), healthcare organizations (Hill, 1999), financial services industry (Gomez, 2003),
and public sector organizations (P.P. Phillips, 2003) serves as the basis for the present
study.
Research Questions and Hypotheses
Based on research and current literature on training evaluation use in
organizations, the following two research questions and four hypotheses are tested:
1. What are the predominant levels of training evaluation conducted in the U.S.
nonprofit sector organizations?
2. What standard methods of evaluating training are being used in nonprofit
sector organizations?
H01A: There is no statistically significant difference between the percentage of
evaluation conducted at each of the five levels of evaluation and nonprofit
sector organizational characteristics.

9
H01B: There is no statistically significant relationship between the percentage of
evaluation conducted at each of the five levels of evaluation and nonprofit
sector organizational characteristics.
H02: There is no statistically significant relationship between the percentage of
evaluation conducted at each of the five levels of evaluation and nonprofit
sector training practices.
H03A: There is no statistically significant difference between the percentage of
evaluation conducted at each of the five levels of evaluation and manager
experience.
H03B: There is no statistically significant relationship between the percentage of
evaluation conducted at each of the five levels of evaluation and manager
experience.
H04: There is no statistically significant difference between the barriers to training
evaluation in nonprofit sector organizations and each level of training
evaluation conducted.
Limitations
The sample for the current study came from members of the America Society for
Training and Development (ASTD) who indicated Association/Nonprofit and Interfaith
as areas of interest. Seventy-four useable surveys were returned as useable, for a 9%
return rate. Thus, the ability to generalize this study’s findings is limited.
Membership in ASTD may indicate a potentially higher interest in performance
improvement and training evaluation issues. This may limit the generalizability of the
study’s findings to the larger population of nonprofit training professionals.

10
An incentive was offered to the first 200 respondents of the survey in order to
increase the response rate. Incentives are often offered to respondents for this purpose
(Alreck & Settle, 2004; Dillman, 2000; J.J. Phillips, 1997a). A structured data collection
methodology was followed that provided all potential respondents the opportunity to
complete and return the survey instrument as outlined by Dillman. A structured data
collection methodology helps enhance response rate.
Delimitations
The data for the present study came from members of the American Society for
Training and Development who indicated Association/Nonprofit and Interfaith forums as
areas of interest. The researcher omitted surveying members who identified themselves as
training professionals for nonprofit academic institutions, which should be considered as
a separate study (P.P. Phillips, 2003). Consultants, consulting companies, vendors of
training materials, and international companies were also omitted from the final
population. The study focused on training and human resource professionals who work
for U.S. nonprofit organizations and support workplace learning. To be consistent with
previous studies, the researcher omitted nonprofit organizations based outside the United
States.
Definition of Terms
American Society for Training and Development (ASTD): the leading HRD
association with 70,000 members from more than 100 countries. Members come from
small, medium, and large businesses; academia; consulting; public sector; and product
and service suppliers.

11
Development: individual growth for the employee but is not tied to any specific
current or future job (Laird, 1985; Nadler, 1990).
Education: prepares an individual for a specific future job that has been identified
(Laird, 1985; Nadler, 1990).
Employer-sponsored training: consists of activities with specific learning
objectives developed and delivered either within an organization by employees or
through contracting with outside training suppliers. These activities are designed to
produce changes in participants’ skills, knowledge, or attitudes that directly impact
present job performance or job performance required to enter a new position (Hill, 1999,
P.P. Phillips, 2003; Twitchell, 1997).
Human Resource Development (HRD): refers to the training, development, and
education of an organization’s employees (Nadler, 1990).
Nonprofit sector: encompasses the charitable, social welfare, and faith-based
portions of the nonprofit sector, specifically organizations under 501(c)(3) and 501(c)(4)
of the tax code and religious organizations (Weitzman et al., 2002)
Return on Investment (ROI): the simplest form of measurement of the profitability
of projects. It combines in one number the earnings (net benefits) compared to the
investment (costs) of a program or project and is typically expressed in a ration
(Horngren, 1982; J.J. Phillips, 1997a).
Stakeholder: is a person or group with an interest in seeing something succeed
and without whose support it would fail (Nickols, 2005).
Training: is the activity to enhance an employee’s current skills for his or her
present job (Laird, 1985; Nadler, 1990).

12
Training evaluation: a systematic process to determine the worth, value, or
meaning of a training program or process and how it has affected the organization (J.J.
Phillips, 1997a).
Summary
This chapter provided an overview of the field of training. Previous studies have
provided a basis for training evaluation in business and industry, healthcare, government,
and financial services. This chapter addressed the need for data on training evaluation in
the nonprofit sector. Chapter 2 focuses on a comprehensive review of the training
evaluation literature.

13
CHAPTER 2
REVIEW OF RELATED LITERATURE
Introduction
The first section of the literature review addresses the definition of employer-
sponsored training, the need for training, and training in the nonprofit sector. The next
section looks at the definition of training evaluation, use of evaluation, and models of
evaluation. The final section of the review focuses on the use of the Phillips Five-Level
Framework of training evaluation and ROI, findings on the use of evaluation, and barriers
to the use of training evaluation.
Employer-Sponsored Training
Definition
As the field of HRD continues to grow, it is important to point out the different
pieces that make up Human Resource Development. HRD is focused on improving job
performance and growth of the employee. Training, education, and development are three
distinct components of Human Resource Development (Nadler, 1990). Many HRD
professionals use these terms interchangeably, but each has a distinct purpose in
improving performance and expanding the growth of employees.
Training is the activity to enhance an employee’s current skills for his or her
present job. As technology changes, training is necessary to keep pace with these
changes. Education prepares an individual for a future job and enables an employee to
gain skills for a future job and/or promotion within the company. Development of an
employee refers to individual growth for the employee but is not tied to any specific
current or future job (Laird, 1985; Nadler, 1990).

14
Training is one of the most important HRD activities in organizations today. The
traditional role of training has evolved over the years. With the emergence of technology
and global competition, the traditional role of HR has changed. Training has shifted from
what people must learn to what they must do or how they perform on the job (Robinson
& Robinson, 1995). Ulrich (1998) suggested that HR should be defined by what it
delivers to the organization and its stakeholders rather than by what it does. HRD is
moving from the standpoint of supporting strategy to helping shape organizational
strategy (Torraco & Swanson, 1995).
Need for Training
Upgrading skills. The 1960s, 1970s, and 1980s saw great leaps in new
technology, and with this new technology came a need for more HRD programs. The fast
pace of the development of new technology required that workers learn at a much faster
rate (Miller, 1996; Nadler, 1990). The 1990s through the present day have seen the
growth of global expansion and competition. As businesses expanded in the United States
and overseas, the need for HRD became even more apparent (Nadler, 1990).
The level of knowledge required by today’s workers is changing every day, and as
a result, the number of jobs requiring specific skills is increasing. Skilled workers are
constantly being trained and retrained to meet the demands of the job. Nonprofit
organizations are facing the same changes and challenges as for-profit organizations. To
meet these challenges, both types of organizations must become learning organizations to
compete in today’s competitive world (Marquardt, 1996; Senge, 1990; Watkins &
Marsick, 1993, 1996). Learning organizations promote continual learning that supports
performance. Because nonprofit organizations are labor intensive, the employees in these

15
learning organizations must continually learn and upgrade skills in order to remain
competitive. Without additional training, these workers will miss out on higher paying,
higher skilled jobs (Jamieson & O’Mara, 1991).
The American Management Association (2001) reported that companies that
increased training were three times more likely to report increased profits and shareholder
value than the companies that cut back on training. Companies are being urged to hire for
attitude and train for skill (Brannick, 2001). Employees also want to work for a company
that encourages and supports the acquisition of new skills and provides opportunities to
change, learn, and grow on the job (Stum, 2001).
Competing for talent. Nonprofit organizations are competing for top talent the
same as for-profit organizations. With a shrinking labor pool, retaining good employees
and competing for talent have become major trends for organizations. Training and
education programs are more effective in retaining employees than increased salary and
benefits (Arthur, 2001). Specifically, programs that improve work skills and future career
growth are effective in keeping top talent.
Many nonprofit organizations have cut their budgets in recent years because of
the limited availability of funding. More of these organizations are competing for
charitable donations, and government funding has been cut. Some organizations in the
nonprofit sector have been forced to freeze salaries and lay off staff, causing a decrease in
the number of talented individuals. These individuals are choosing to go back to work in
the for-profit sector. One solution to a talented workforce is to recruit creative individuals
and provide staff training (“Quality Service,” 1996). Training should be focused on skill
building as well as emphasize philosophical commitment to the nonprofit organization.

16
Training in Nonprofit Sector
Defining nonprofit. The nonprofit sector is a large and diverse group of
organizations including hospitals, churches, universities, environmental advocacy, and
civic groups. Almost 6% of all organizations in the United States belong to the nonprofit
sector (Weitzman et al., 2002). Of that number, 4.4% belong specifically to the
independent sector, which includes the charitable, social welfare, and faith-based portions
of the nonprofit sector under 501(c)(3) and 501(c)(4) of the tax code and religious
congregations. According to Weitzman et al., 25 types of organizations are exempted
from federal income taxation. Information about nonprofit organizations remains sparse
despite the efforts of researchers over the past few years (Salamon & Sokolowski, 2005).
Charitable organizations, 501(c)(3), are the only tax-exempt groups that can
receive tax-deductible donations from individuals (Independent Sector & Urban Institute,
2002). This group includes organizations that serve educational, religious, charitable,
scientific, and literary purposes. Unlike businesses, charitable organizations cannot
distribute any excess revenue to individuals or other stakeholders. Charitable
organizations are also limited with regard to legislative lobbying.
Social welfare organizations, 501(c)(4), also work for the benefit of the public.
There are no restrictions on the lobbying efforts of social welfare organizations. Civic
and social welfare groups and local associations make up the majority of this tax-exempt
group (Weitzman et al., 2002).
In 2001 there were approximately 12.5 million workers employed in the nonprofit
sector. The independent sector made up 11.7 million of the 12.5 million workers. This
constitutes 9% of the total working population in the United States. The remaining

17
800,000 workers were employed in other nonprofit organizations (Weitzman et al.,
2002). In 1998 the number of Americans volunteering for service in the nonprofit sector
was 109.4 million. The value of volunteer time was an estimated $225.9 billion. In that
same year, the independent sector’s estimated share of the national income was 6.1% or
about $443.6 billion. The entire nonprofit’s share of the national income was 6.7% or
$485.5 billion.
The total revenue for the independent sector in 1997 was estimated at $665
billion. Revenue for nonprofit organizations comes from several sources. Private pay
represents 38%; government grants represent 31%; private contributions, 20%; and 11%,
other contracts and grants (Weitzman et al., 2002). Health Services and Education &
Research combined for 67% of the total revenue. Health Services constitutes the largest
revenue, at 49% of revenue for the independent sector. It also has the highest number of
employees and the largest wages. Education and Research constitutes 18% of the
revenue. Social & Legal Services, Religious Organizations, and Arts & Culture share the
remaining revenue.
Nonprofit versus for-profit training. Even though the nonprofit sector is a large
employer in the United States and rivals the federal government in terms of budget
dollars, there is little information about the training practices of this sector. Not all
nonprofit organizations are required to complete and file a Form 990 with the Internal
Revenue Service; for example, religious congregations are not required to file a Form 990
with the Internal Revenue Service. The form does not capture much detailed information
about the nonprofit organization beyond basic financial information (Independent Sector,
2005). The Panel on the Nonprofit Sector has recommended that all nonprofit
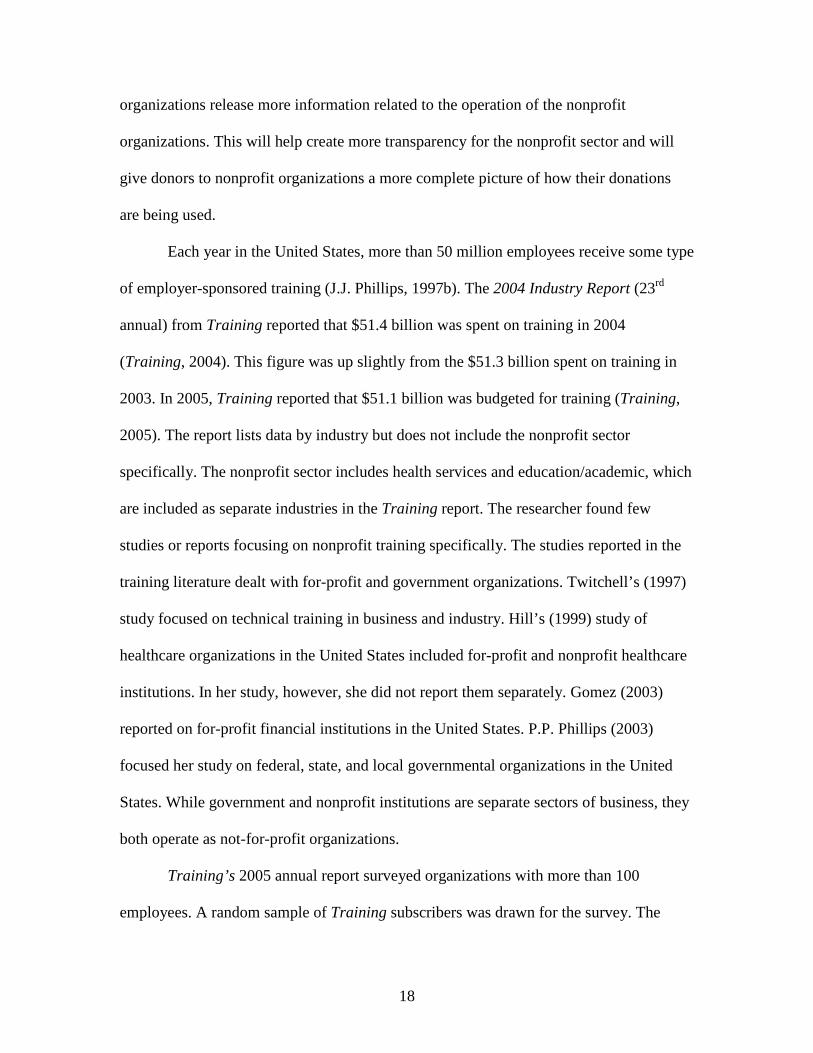
18
organizations release more information related to the operation of the nonprofit
organizations. This will help create more transparency for the nonprofit sector and will
give donors to nonprofit organizations a more complete picture of how their donations
are being used.
Each year in the United States, more than 50 million employees receive some type
of employer-sponsored training (J.J. Phillips, 1997b). The 2004 Industry Report (23rd
annual) from Training reported that $51.4 billion was spent on training in 2004
(Training, 2004). This figure was up slightly from the $51.3 billion spent on training in
2003. In 2005, Training reported that $51.1 billion was budgeted for training (Training,
2005). The report lists data by industry but does not include the nonprofit sector
specifically. The nonprofit sector includes health services and education/academic, which
are included as separate industries in the Training report. The researcher found few
studies or reports focusing on nonprofit training specifically. The studies reported in the
training literature dealt with for-profit and government organizations. Twitchell’s (1997)
study focused on technical training in business and industry. Hill’s (1999) study of
healthcare organizations in the United States included for-profit and nonprofit healthcare
institutions. In her study, however, she did not report them separately. Gomez (2003)
reported on for-profit financial institutions in the United States. P.P. Phillips (2003)
focused her study on federal, state, and local governmental organizations in the United
States. While government and nonprofit institutions are separate sectors of business, they
both operate as not-for-profit organizations.
Training’s 2005 annual report surveyed organizations with more than 100
employees. A random sample of Training subscribers was drawn for the survey. The

19
organizations were asked about the amount of training that executives, exempt
(managers), exempt (non-managers), and non-exempt employees receive. Non-exempt
employees receive the majority of training in each of the industries reporting, ranging
from 31% to 50% of the training provided for traditional and technical training. Exempt
non-managers and exempt managers receive the next highest percentage of training, with
executives receiving the least of the groups.
ASTD’s State of the Industry Report (Sugrue & Rivera, 2005) reported data from
three samples (Benchmarking Survey, Benchmarking Forum Organizations, and BEST
Award Winners) that can be used by training professionals as benchmarks for workplace
learning and performance. The Benchmarking Survey (BMS) is the largest of the three
sources and includes the broadest range of organizations in terms of size and industry.
The BMS can be thought of as the norm for U.S. organizations.
The average amount spent per employee on training by BMS organizations was
$955 in 2004. This was up from $820 per employee the previous 2 years. BMS
organizations also reported providing each employee an average of 32 hours in 2004.
This figure was up from the 2003 amount of 27 hours per employee. Overall, average
expenditure for training in the United States increased from previous years. Global
competition and increased focus on organizational growth drove up expenditures for
2004 (Sugrue & Rivera, 2005).
There are few studies reporting on the training activities in the nonprofit sector.
McMullen and Schnellenberg (2003) reported on skills and training in the Canadian
nonprofit sector. The authors reviewed data from Canada’s 1999 Workplace and
Employee Survey (WES), which collected workplace data from a representative sample

20
of Canadian workplaces, including nonprofit organizations. The WES includes only
organizations with one or more paid employees. Some nonprofit organizations are run
exclusively by volunteers, so those organizations were excluded from the study. The
survey also excluded religious organizations, which do not fit into the same type of
business strategy as other nonprofit and for-profit businesses. Organizations were
grouped into three broad sectors based on self-identification: (a) the nonprofit sector; (b)
the quango sector; and (c) the for-profit sector. Quangos are nonprofit organizations in
public organizations such as elementary/secondary schools, colleges/universities,
hospitals, and public infrastructure. These organizations are nonprofit organizations, but
because of heavy governmental regulations, they resemble government organizations.
Over half of the nonprofit employees believed that a postsecondary education was
necessary to do their job, whereas only 36% of the for-profit employees felt that a
postsecondary education was important. In all sectors, employees noted increases in
overall skill requirements since beginning their jobs. In all three sectors, over 70%
reported that increasing skills was important to the overall organizational strategy. In the
nonprofit sector, almost all the organizations with 20 or more employees reported that
increasing employee skills was important to their overall strategy, whereas only 30% of
organizations with fewer than 20 employees reported that increasing skills was important
(McMullen & Schnellenberg, 2003).
Almost half the employees in the nonprofit and quango sectors reported receiving
training in the previous year, compared with only one third of the for-profit employees
reporting that they had received training. In all three sectors, those employees with a
college degree were more likely to have received training than other groups. The rate of

21
women in the nonprofit sector participating in training was higher than in the for-profit
sector in every occupational and educational group. About 36% of the nonprofit
employees and 38% of the employees in the quango sector reported that they did not
receive enough training to meet the demands of the job. Only 27% of the for-profit
employees reported that their training fell short of the demands of their job (McMullen &
Schnellenberg, 2003).
Training in the nonprofit sector in the United States takes place but is not reported
on a regular basis. A search of books on nonprofit organizations revealed information on
how to run a nonprofit or how to manage a nonprofit organization. Some books and
articles focused on the skills necessary to lead a nonprofit organization. In recent years,
authors, management experts, and educators have advocated creating learning
organizations (Marquardt, 1996; Senge, 1990). Learning organizations focus on the
learning process, which prepares them for performance and change. Nonprofit as well as
for-profit organizations must become learning organizations, but nonprofits experience
difficulty with this shift because of scrutiny by the public, an increasing complexity of
social issues, increasing costs and decreased funding, and competition from other
nonprofits and for-profit businesses (Dees, 1998; Hammack & Young, 1993;
Hodgkinson, Weitzman, Abrahams, Crutchfield, & Stevenson, 1996; Young & Salamon,
2002).

22
Training Evaluation
Definition of Training Evaluation
Evaluation has been defined in many ways over the years. Tyler (1942) saw
evaluation as a determination of whether program objectives had been achieved, looking
at actual outcomes versus intended outcomes. In a broad sense, evaluation research
includes all efforts to place value on things, people, events, or processes (Rossi, Lipsey,
& Freeman, 2004). From an instructional viewpoint, evaluation may be defined as “the
determination of the merit or worth of a curriculum (or portion of that curriculum). This
includes gathering information for use in judging the merit of the curriculum, program, or
curriculum materials” (Finch & Crunkilton, 1989, p. 273). Others have seen evaluation as
a comparison of initial objectives with real program outcomes using both qualitative and
quantitative methods to assess the results (J.J. Phillips, 1997a; Stufflebeam, 1971).
Brinkerhoff (1981) extended the definition of evaluation to encompass “the systematic
inquiry into training contexts, needs, plans, operation and effects” (p. 66).
Basarab and Root (1992) offered a comprehensive definition of evaluation as “a
systematic process of converting pertinent data into information for measuring the effects
of training, helping in decision making, documenting results to be used in program
improvement, and providing a method for determining the quality of training” (p.2).
Stakeholder perspectives also result in the provision of information to senior
management, which places the perspective on training as an investment rather than an
expense. Basarab and Root argued that “the process assesses the total value of a training
system and the actual training or program with respect to the needs of the participants, the
cost/benefits to the corporation, and the requirements of the stakeholders” (p. 2). The
23
focus in most training evaluations is on measuring a program’s effect on (a) the
participants, (b) the participant’s work, and (c) the organization (Brinkerhoff, 1991;
Broad & Newstrom, 1992; Dixon, 1990; Kirkpatrick, 1994; J.J. Phillips, 1991).
The lack of a standard definition of evaluation or training evaluation contributes
to a misunderstanding of how and what to evaluate (Scriven, 1999). The terms value and
judgment are often used when defining evaluation. These terms have different meanings
to different people. Scriven suggested that evaluation has focused on at least three
questions regarding an intervention: (a) Is it worth it? (b) Is there a better way to do it?
(c) Did it have the desired impact? Although various methods are used for evaluation, the
information collected allows one to make a judgment about the value of the results
(Shrock & Geis, 1999).
Frameworks of Evaluation
Eight models of evaluation are presented in this section. These models or
frameworks were cited in numerous articles and books on evaluation. They use levels or
categories or a mix of measures to present the findings of evaluation.
Cost-benefit analysis. This model is probably the oldest process used to evaluate
the feasibility of expenditures on all programs. It is based on the theoretical frameworks
of economics and finance. The purpose of cost-benefit analysis is to ensure that society
maintains an optimum level of efficiency in allocating resources (Mishan, 1960;
Musgrave, 1969; Nas, 1996). Cost-benefit analysis can be traced back to London in 1667.
In the United States it began to be used, with frequency, after the passage of the River
and Harbor Act of 1902 and the Flood Control Act of 1936 (Prest & Turvey, 1965;
Thompson, 1980). The cost-benefit ratio is one of the earliest methods for evaluating
24
training investments (Marrelli, 1993). This process compares the training program’s cost
with the benefits by dividing the program benefits by the cost of the program.
Kirkpatrick’s four-level framework. The most widely used and best-known
framework for evaluation is the Kirkpatrick model (Bramley & Kitson, 1994; Kaufman &
Keller, 1994; Kirkpatrick, 1994; J.J. Phillips, 1997a). In recent years, Kirkpatrick’s model
of evaluation has been criticized (Holton, 1996; Swanson & Holton, 1999). Holton
argued that the model is not really a model but rather a taxonomy of possible intervention
outcomes in need of further research to fully develop the theory. Holton also indicated
that the causal linkages between the levels are weak. Research on the Kirkpatrick
evaluation model indicates that the levels are not hierarchical (Alliger & Janak, 1989;
Clement, 1978), suggesting that a trainee’s reaction (Level 1) does not need to be positive
in order to experience a gain in knowledge (Level 2). A change in behavior (Level 3) in
the workplace, after attendance in a training program, could be a result of something
other than the learning (Level 2) from the program. Other research has been conducted on
Kirkpatrick’s four-level framework, and in some cases relationships have been found
between the different levels. Warr, Allen, and Birdi (1999) found strong associations
among reaction (Level 1) measures of enjoyment, perceived usefulness, and motivation
to transfer and learning (Level 2), with weaker associations found between reaction and
job behavior and between learning outcomes and job behavior. Warr and Bunce (1995)
indicated that a strong association exists between learning and job performance (Level 2
and Level 3), and Bledsoe (1999) found weak associations among reaction and results
and behavior and results.

25
During the late 1950s, while at the University of Wisconsin, Kirkpatrick wrote a
series of four articles called “Techniques for Evaluating Training Programs,” which were
published in the American Society for Training and Development journal, Training and
Development. His reason for developing his framework was to “clarify the elusive term
‘evaluation’” (Kirkpatrick, 1994, p. xiii). Kirkpatrick’s four levels have been referred to
as “stages, criteria, types, categories of measures, and most commonly, levels of
evaluation” (p. 10).
Kirkpatrick’s (1994) framework consists of four levels of evaluation. The levels
of evaluation are Level 1, reaction; Level 2, learning; Level 3, job behavior; and Level 4,
results. Reaction (Level 1) is a measure of how participants react to the training program.
It is a measure of customer satisfaction. Learning (Level 2) is concerned with measuring
the knowledge gained during the program. Job behavior (Level 3) is concerned with
measuring how well the participant applies the new knowledge or skills back on the job.
This level of evaluation is important in that it addresses the issue of training transfer.
Level 3 evaluations often show that even though learning took place (Level 2), the skills
are seldom fully applied back on the job (Robinson & Robinson, 1998; Ulrich, 1997).
Conducting a Level 3 evaluation can help uncover the reasons that participants do not
apply the new skills on the job. Results (Level 4) reflects the evaluation of training’s
impact on the organization’s business results. At this level of evaluation, questions
regarding improvement in organizational effectiveness are answered.
Kaufman’s five levels of evaluation. Other evaluators have expanded
Kirkpatrick’s original four-level framework. Kaufman and Keller (1994) expanded the
original four-level framework to include a fifth level, arguing that Kirkpatrick’s model

26
was intended to evaluate training and that organizations are now seeking to evaluate other
types of development events. Kaufman expanded the definition of Level 1, adding a fifth
level that addresses societal issues. This level moves evaluation beyond the organization
to look at how society is affected by the intervention and how the program impacts the
environment around the organization.
Phillips’s five-level ROI framework. Return on investment (ROI) has been used in
business as a means of determining the value of an investment in financial terms.
Phillips’s framework is comparable to Kirkpatrick’s, but Phillips expanded Kirkpatrick’s
four-level framework by adding a fifth level, ROI. Return on investment is calculated in
order to show value, in financial terms, of a training investment (J.J. Phillips, 1991). The
levels of Phillips’s framework are (1) reaction and planned action; (2) learning; (3) job
application; (4) business results; and (5) return on investment. Level 1, reaction and
planned action, is similar to Kirkpatrick’s Level 1 but also includes a plan of what
participants intend to apply from the program. Some researchers have argued that ROI is
contained in Kirkpatrick’s fourth level, results, and that a fifth level is not needed
(Lanigan, 1997). The fifth level adds the cost-benefit analysis that is essential to calculate
ROI, requiring that any change in Level 4, results, be converted into monetary value and
compared to the costs of the program (J.J. Phillips, 1996a; P.P. Phillips, 2002).
Another component of Phillips’s five-level framework is the step to isolate the
effects of training (J.J. Phillips, 1996b). Other influences or factors may contribute to
improved performance (Davidove, 1993). Some researchers have argued that if a control
group cannot be used, the step to isolate the effects of training will be invalid and should
not be used (Benson & Tran, 2002; Spitzer & Conway, 2002). Other methods are

27
available to determine the cause and effect relationship, which will provide a credible
ROI calculation. Omitting this step in the process will result in an incorrect, invalid, and
inappropriate ROI calculation (J.J. Phillips, 1997c). The five-level framework also
provides a way to present intangible data that were not converted to monetary value.
Advocates for financial evaluation of training may differ on the approach to use, but
agree that it is possible (Noonan, 1993; Parry, 1996, 1997; J.J. Phillips, 1997a, 1997b,
1997c; Shelton & Alliger, 1993).
CIRO. Warr, Bird, and Rackham (1970) presented another four-level framework.
CIRO stands for the four levels Context, Input, Reaction, and Outcome. They believe that
before assessing reactions and outcome, there needs to be an analysis of the context and
inputs. Context evaluation involves looking at the current operational situation to help
determine the training needs and objectives. Input is information about possible training
methods or techniques that can be used to select the best choice of training intervention,
and reaction looks at gathering participant views and suggestions about the training
program. This level is similar to Kirkpatrick’s reaction level, but with greater emphasis
on suggestions to help change the training program. Outcome evaluation looks at the
results of training at an immediate, intermediate, and ultimate level.
CIPP. The CIPP model of evaluation was developed by Stufflebeam (1983) and
presents a framework around the program objectives, the training content and facilitation,
program implementation, and program outcomes. CIPP stands for context, input, process,
and product evaluation. Context evaluation helps in planning and developing the program
objectives. This evaluation looks at the acceptability of the objectives to the
organization/societal culture and their relevance. Input evaluation helps determine the

28
design by examining the capability, resources, and different stages of program
development. Process is concerned with the implementation of the program and
providing feedback about the materials, facilitator, and presentation of the program.
Product evaluation refers to the outcomes of the program, which helps to judge and react
to the program attainments in terms of outputs and outcomes.
Indiana University’s business impact ISD model. Molenda, Pershing, and
Reigeluth (1996) developed an evaluation taxonomy based on six strata, which were not
intended to be a hierarchy of importance. The first and last strata are additions to
Kirkpatrick’s four-level framework. Stratum 1, activity accounting, examines training
volume and the number of participants in the program. Stratum 2, participant reactions,
measures the participant’s satisfaction with the program. Stratum 3, participant learning,
measures the extent to which the participants exhibit knowledge and skills taught during
the program. Stratum 4, transfer of learning, measures the transfer of the training, and
looks at the extent to which participants are using what they learned back on the job.
Stratum 5, business impact, examines the extent to which employee performance has
improved and whether this improvement affects profitability. Stratum 6, social impact,
attempts to measure the effect the changed performance in the organization has on
society. The sixth stratum is similar to Kaufman and Keller’s (1994) societal impact.
Success case evaluation. Success case evaluation (Brinkerhoff & Dressler, 2002)
uses purposive sampling rather than random sampling. The success case study process
has two fundamental parts. The first part focuses on participants who were the most
successful and participants who were the least successful at applying the knowledge and
skills from the training program. The second part of the process involves drawing a
29
sample from the most and least successful. The most successful are interviewed to
determine the exact nature and extent of their success. The random sample of the least
successful is interviewed to determine why they were unable or unsuccessful in applying
the new knowledge and skills.
Phillips’s Five-Level Training Evaluation Framework
“Almost every discussion of training and development evaluation begins by
mentioning Donald Kirkpatrick’s well-known four-levels of evaluation” (Medsker &
Roberts, 1992, p. 1). Almost 50 years after publishing his articles of the four steps of
evaluation, Kirkpatrick’s framework is still popular among practitioners. In recent years,
Phillips’s five-level framework (an expansion of Kirkpatrick’s four-levels) has gained in
popularity. This section presents findings from seven studies on the use of the four-level
and five-level frameworks.
Use of Phillips’s Framework
Twitchell (1997) conducted a study of U.S. business and industry organizations
providing technical and skills training. He drew his sample from ASTD’s Technical and
Skills Training professional practice. He collected data using a survey that he authored
jointly with Jack Phillips (an expert in the field of evaluation) and Dr. Ed Holton III
(Associate Professor in Human Resource Development). Twitchell’s sample population
was 348 organizations. The number of usable surveys returned was 112, resulting in a
35% response rate. Respondents indicated they evaluate 72.74% of their programs at
Level 1; 47.05% at Level 2; 30.54% at Level 3; and 20.82% at Level 4. Twitchell
included ROI with Level 4 in his study.

30
A study of the healthcare industry (Hill, 1999) showed that 80.58% of
respondents evaluated their programs at Level 1; 52.59% at Level 2; 30.77% at Level 3;
16.70% at Level 4; and 3.73% at Level 5. Hill based her study on Twitchell’s (1997)
study. She used Twitchell’s survey instrument, Evaluation: Present Practices in Business
and Industry: Technical Training. Hill expanded the original survey instrument to include
questions regarding criteria for an effective ROI method and selection of programs for
evaluation at the ROI level. Hill surveyed members of ASTD’s Healthcare Forum,
receiving 277 surveys from a total mailing of 1,078.
A study of Canadian companies was conducted to determine the extent to which
organizations were evaluating programs (Blanchard, Thacker, & Way, 2000). The
majority of organizations responding (71%) were Canadian-owned companies. Of the
remaining 29%, more than 71% indicated they were subsidiaries of American-owned
companies with offices in Canada. Information about evaluation of management and non-
management programs was included in the survey. Of the management programs, 71%
evaluated at Level 1; 17.2% at Level 2; 37.2% at Level 3; and 42.8% at Level 4. For the
non-management programs, 68.3% evaluated at Level 1; 31.0% at Level 2; 46.9% at
Level 3; and 35.9% at Level 4.
Gomez (2003) surveyed members of the financial services industry affiliated with
DALBAR, Inc., which is an independent financial services research and rating company.
It develops standards for, and provides research, ratings, and rankings of intangible
factors to the mutual fund, broker/dealer, discount brokerage, life insurance, and banking
industries. Gomez used the survey instrument developed by Twitchell (1997) and adapted
by Hill (1999). It was sent to individuals who represented 112 DALBAR-affiliated firms

31
in the financial services industry. A total of 52 surveys were returned for an overall
response rate of 50%. Programs were evaluated 87.29% at Level 1; 54.43% at Level 2;
26.45% at Level 3; 4% at Level 4; and 10.04% at Level 5, ROI.
Each year the American Society for Training and Development surveys
businesses across the United States to look at trends in training and development. The
results of the survey are presented in the annual State of the Industry report. The report is
a good indicator of what is taking place in the workplace learning and performance field.
It also provides organizations data by which to benchmark their own learning and
training practices. Three samples provide data for the report. Benchmarking Service
Organizations (BMS) includes the broadest range of organizations in the United States in
terms of size and industry and should be considered the U.S. norm. Benchmarking Forum
Organizations (BMF) represent very large and mostly global organizations, most of
which are headquartered in the United States. BEST organizations are those organizations
that have won ASTD BEST awards, given to organizations that demonstrate a link
between learning and performance (Sugrue & Kim, 2004; Sugrue & Rivera, 2005).
In 2003, BMS organizations reported evaluating training programs 74% at Level
1; 31% at Level 2; 14% at Level 3; and 8% at Level 4. Level 5, ROI, data were not
reported for 2003 (Sugrue & Kim, 2004). In 2005 evaluation methods were not collected
for BMS organizations for 2004; instead, a special survey on evaluation methods for
BMF organizations was conducted. In 2004 organizations reported evaluating programs
91.3% at Level 1; 53.9% at Level 2; 22.9% at Level 3; 7.6% at Level 4; and 2.1% at
Level 5, ROI (Sugrue & Rivera, 2005). Table 1 summarizes the use of training
evaluation.

32
Table 2
Use of Evaluation at Each Level
Twitchell
(1997)
Hill
(1999)
Blanchard, Thacker, & Way
(2000)
Gomez (2003)
Phillips (2003)
Sugrue & Kim
(2004)
Sugrue & Rivera (2005)
Mgt. Non-Mgt.
Level 1, Reaction
72.7% 80.6% 71.0% 68.3% 87.3% 72.2% 74.0% 91.3%
Level 2, Learning
47.1% 52.6% 17.2% 31.0% 54.4% 31.7% 31.0% 53.9%
Level 3, Application
30.5% 30.8% 37.2% 46.9% 26.5% 20.4% 14.0% 22.9%
Level 4, Impact
20.8% 16.7% 42.8% 35.9% 14.0% 12.2% 8.0% 7.6%
Level 5, ROI
3.7% 10.0% 5.3% 2.1%
Note. The Twitchell study included ROI in Level 4.
Findings on Use
The studies on training evaluation represent a wide range of organization size and
characteristics. The BMS in the 2004 State of the Industry (Segrue & Kim, 2004) report
represents organizations in the United States with an average of 6,866 employees
compared with the BMF organizations in the 2005 report (Segrue & Rivera, 2005), with
an average of 57,868 employees. P.P. Phillips’s (2003) study of public sector
organizations indicated that 74% of the organizations have 3,000 employees or fewer.
Only 5% had over 20,000 employees. Gomez’s (2003) study of financial services
organizations shows that 80% of the responses came from organizations with over 2,500
employees.

33
Hill’s (1999) study represented for-profit, nonprofit, privately owned,
government-owned, and university-owned healthcare facilities. Fifty-two percent of the
organizations in Hill’s study had fewer than 3,000 employees; 34% had 3,000-10,000
employees; and 14% had more than 10,000 employees. Twitchell’s (1997) study includes
private sector organizations. Fifty-two percent of the organizations in Twitchell’s study
have fewer than 3,000 employees. There was an average of 4,500 employees in the
organizations in his study. The Blanchard et al. (2000) study included private sector and
public sector organizations in Canada.
Use of each level of training evaluation varies depending on a variety of variables.
Research in technical training (Twitchell, 1997) healthcare (Hill, 1999), and financial
services (Gomez, 2003) found low positive correlations between programs delivered to
change performance or outcomes and the level of evaluation used. Gomez found the
highest correlations between Level 4 evaluation and organizational outcomes. Hill found
significant relationships between reasons for training programs and the use of Levels 1, 2,
3, and 4.
There were significant relationships between manager experience and the
percentage of evaluation conducted at each of the evaluation levels (P.P. Phillips, 2003).
Twitchell (1997) found a low, positive correlation between Level 3 and a technical
manager’s training experience. Stakeholder perspective is often viewed as the proponent
for evaluating training programs at the various levels (Michalski & Cousins, 2001; J.J.
Phillips, 1997a). Twitchell found a low positive relationship between managers’
perceptions of the value of Levels 1, 2, 3, and 4 in improving training and the percentage
of evaluations conducted at each level.

34
Relationships were found between the existence of an evaluation policy and
evaluation at each of the levels (P.P. Phillips, 2003). Significantly higher levels of
evaluation are conducted at all five levels when an evaluation policy is in place in the
organization. Significant correlations exist between the extent to which evaluation
planning occurs during the training process and Levels 1, 2, 3, 4, and 5 as well as the
routine reporting of evaluation results to executive management and Levels 2, 3, 4, and 5
(Hill, 1999). Evaluation planning occurs prior to program development for Levels 1, 2,
and 5 and as the first step in program development for Levels 3 and 4 evaluations (P.P.
Phillips, 2003). Gomez (2003) found positive correlations between program evaluation at
most levels and prior program planning. A significant relationship exists between Level 5
evaluation and evaluation planning as the first step in the process. Gomez also found a
significant relationship between Level 3 evaluation and evaluation planning prior to
program development.
Barriers to Use
A number of barriers exist that prevent organizations from evaluating at various
levels. The most often cited reasons for not evaluating at the five levels include (a) not
required by the organization; (b) cost; (c) lack of training or experience; and (d) little
perceived value to the organization (Gomez, 2003; Hill, 1999; P.P. Phillips, 2003;
Twitchell, 1997). Other barriers found in these studies include a policy prohibiting
evaluation by training and union opposition. There is a significant association between
the barriers at Level 1 and the existence of an evaluation policy. There is also a
significant relationship between Levels 4 and 5 and cost in person-hours and/or capital
and the type of organization (P.P. Phillips, 2003).
35
CHAPTER 3
METHODOLOGY
Introduction
The purpose of this study was to examine how nonprofit sector organizations in
the United States evaluate employer-sponsored training using Phillips’s five-level
evaluation framework. Research questions guiding this study are the following: (a) How
is formal, employer-sponsored training evaluated in the nonprofit sector in the United
States? (b) How do existing patterns, trends, methods, and/or models of training
evaluation vary according to organizational characteristics? (c) What barriers to training
evaluation exist in nonprofit sector organizations?
Research Design
This study used survey research methodology, a cost-effective and dependable
method for gathering data (Alreck & Settle, 2004). Survey data may be collected via
mail, telephone, and in-person surveys (Rea & Parker, 1997). Survey research is used
widely used in education as well as in other research areas (McMillan, 2004). According
to McMillan, survey research is popular because it is versatile and efficient and the
results are generalizable. Mail surveys can address a wide variety of issues and concerns.
Although email and Web-based surveys are gaining in popularity, the mail survey is still
the best method to collect data from a large sample (Dillman, 2000). Because email
addresses were not available to the researcher for use with an e-based survey, the
researcher chose a mail survey as the method of data collection for this research.

36
Population
The population for this study came from training and human resource
development professionals who joined ASTD or indicated an interest in ASTD. The
population selected nonprofit/association or interfaith as an area of interest when joining
or inquiring about ASTD. The ASTD mailing list was obtained from Chessie Lists, a
third-party servicing organization for association membership lists.
ASTD is a professional organization for training and development practitioners
and is the largest organization in the world dedicated to training and development. Its
membership is more than 70,000 and consists of training directors, trainers, consultants,
academia, government, and training vendors. Within ASTD, each member selects a
professional interest forum. Two forums that support nonprofit issues are the interfaith
and association/nonprofit interest groups. These were used in the current study. The
ASTD forum members should represent organizations whose training professionals have
an interest in and knowledge of industry practices (Twitchell, 1997). The ASTD mailing
list was cleaned up by eliminating consultants, training suppliers, professors, incomplete
addresses, and members whose organizational relationship could not be determined. After
data cleanup, there were 1,068 names between the two groups.
The purpose of using two forum lists from ASTD was to broaden the
representation of nonprofit sector training professionals. Interfaith organizations are not
classified by the Internal Revenue Service as 501(c)(3) or 501(c)(4) organizations, but
they are considered nonprofit organizations. Also, by soliciting feedback from two lists, a
broader stakeholder perspective (Michalski & Cousins, 2001; Nickols, 2005) could be
examined. The results of the study are reported as a group rather than reporting individual

37
results for each group of potential respondents. The total number of potential respondents
for the current study is 1,068.
Sample
The study utilized a random sample taken from the ASTD mailing lists. With the
target population scattered throughout the United States, random sampling makes
economical sense (Alreck & Settle, 2004). In order to generalize the results to the ASTD
Interfaith and Association/Nonprofit sector training population at the .05 level of
significance, 285 responses were required (Krejcie & Morgan, 1970). This number
represents approximately 25% of the total potential respondents. Similar studies have
reported response rates between 24 and 35% (Hill, 1999; P.P. Phillips, 2003; Twitchell,
1997). To account for nonresponse rate, the number of potential respondents was
increased by 15%, for a total random sample size of 330. Due to the low response rate
from the random sample, the researcher made the decision to send surveys to the
remaining 738 potential respondents in the study population.
Instrumentation
The survey instrument for this research project is based on P.P. Phillips’s (2003)
Training Evaluation in Public Sector Organizations survey. Hill (1999) based her survey
on a previous survey, Evaluation: Present Practices in U.S. Business and Industry:
Technical Training (Twitchell, 1997). The surveys by Twitchell and Hill both represent
Kirkpatrick’s four-level evaluation framework. Hill expanded her survey to include
questions to isolate ROI (Level 5) from the other four levels of measurement, and
Twitchell included ROI in Kirkpatrick’s Level 4 questions. Phillips modified the survey
Training Evaluation in Public Sector Organizations in several ways:

38
A new Section E was added to further isolate ROI (Level 5) from the other four
levels of measurement. Question E13 includes the terminology Level 5 next to
Return on Investment (ROI) to distinguish ROI from the other levels of
measurement. Demographic information in Section F was modified slightly to
reflect public sector titles and organization characteristics. Question F1 was
eliminated due to its inappropriateness for this research study. Question F2 was
reworded to reflect the public sector organization types. Question 7 includes titles
representative of public sector organizations. Question F8 was changed to include
job function titles representative of public sector organizations. A new question
was added to Section A, B, C, D, and the new Section E to determine the
stakeholder perspective of the importance of the various levels of
measurement….Terminology was modified to reflect the appropriate terminology
used within public sector organizations. (p.51)
The survey instrument for the present study, Survey of Training Evaluation in the
Nonprofit Sector, closely represents P.P. Phillips’s (2003) survey, with only minor
modifications. Question G1 was changed to reflect the various types of nonprofit sector
organizations. Question G6 was modified to reflect job titles in nonprofit organizations
(see Appendix A for the survey instrument).
Variables
Hill (1999) and Twitchell (1997) found a number of variables that
significantly influenced the application of the different levels of evaluation. In both
research studies, six independent variables were identified: organization characteristics,
training manager experience, training process, need for training, barriers to evaluation,
39
and criteria for selecting programs. Michalski and Cousins (2001) and Nickols (2005)
suggested that a stakeholder perspective is important and an influencer of evaluation. In
her study, P.P. Phillips (2003) added stakeholder perspective as a seventh category of
variables that influence training evaluation. For the current study, each independent
variable was tested to determine whether a positive or negative relationship existed
between it and each level of evaluation. The categories for the independent variables are
as follows: (a) Organization Characteristics (Survey Questions G1, G2, F10, G4, G8); (b)
Manager Experience (Survey Questions G6, G7, G9, G12); (c) Training Process (Survey
Questions F1, F15, F5); (d) Need for Training (Survey Question F2); (e) Barriers to
Evaluation (Survey Question E4); and (f) Criteria for Selecting Programs (Survey
Question F13).
The dependent variables represent the five levels of evaluation (Survey Questions
A1, B1, C1, D1, E1) described by J.J. Phillips (1997a). Phillips’s five-level ROI
framework is an extension of Kirkpatrick’s original four-level evaluation framework. The
Phillips five-level ROI framework is as follows: (a) Reaction and Planned Action (Level
1); (b) Learning (Level 2); (c) Job Applications (Level 3); (d) Business Results (Level 4);
and (e) Return on Investment (Level 5).
Validity
Validity refers to the “appropriateness, meaningfulness, and usefulness of the
specific inferences made from test scores” (American Educational Research Association,
American Psychological Association, and National Council on Measurement in
Education, 1985, p. 9). The test questions are neither valid nor invalid, but rather the

40
inferences made from the scores are considered valid or invalid. Three types of evidence
to establish validity are content, criterion, and construct validity (Litwin, 1995).
Content Validity
Content validity involves a review of the instrument by those who have
knowledge of the subject matter. Content validity is established by a group of trained
individuals without the use of quantifiable statistics (Litwin, 1995). Because the proposed
survey instrument has been used in previous research (Gomez, 2003; Hill, 1999; P.P.
Phillips, 2003; Twitchell, 1997), some level of content validity exists. Twitchell made
every effort to use common terms to increase the level of clarity of the respondents. The
survey was also reviewed by a group of experts including members of a graduate research
class, training managers, training specialists, academic researchers, and two business and
industry experts on training evaluation (Twitchell, 1997).
Hill (1999) adapted the original survey instrument for her study on the healthcare
industry. Five experienced training professionals reviewed the instrument for content
validity. These professionals were asked to assess each question as it related to the
research question, and their assessment established support that the survey questions were
related to the research questions.
P.P. Phillips (2003) asked eight public sector employees to review the survey
instrument and rank the questions based on their relevance. Five employees submitted
suggestions for improvement. The suggestions included eliminating a duplicate question,
clarifying the definitions of the measures of evaluation, and clarifying instructions for
answering the questions. These respondents indicated a clear understanding of the survey
questions.

41
The researcher asked four nonprofit training professionals to review the survey
instrument for understanding of the questions. They were also asked to give feedback on
questions G1, type of nonprofit organization, and G6, job titles in nonprofit
organizations. Three of the four responded with additional suggestions for job titles. The
three respondents indicated an understanding of the questions asked in the survey.
Criterion Validity
Criterion validity examines how one instrument compares to a similar instrument.
Criterion validity may be broken down into concurrent validity and predictive validity.
Concurrent validity judges the instrument against other instruments in the literature that
are considered the standard for assessing the same variable. Predictive validity refers to
an instrument’s ability to predict future behavior or outcome. Both concurrent and
predictive validity are calculated as correlation coefficients between the test and a
secondary outcome (Litwin, 1995).
Construct Validity
Construct validity is a theoretical measure of a survey instrument’s
meaningfulness in practical use. This type of validity is the most difficult to assess
because of the timeframe required (Litwin, 1995). Previous studies (Gomez, 2003; Hill,
1999; P.P. Phillips, 2003; Twitchell, 1997) did not report construct validity.
Reliability
Reliability of an instrument is concerned with the replication of the data or
outcomes (Litwin, 1995). In survey research, researchers are concerned with random
error and measurement error. Random error is unpredictable error that occurs in all
research. To reduce error, a larger sample can be drawn. Measurement error refers to how

42
well an instrument performs in the population of study. It is a major threat to establishing
reliability of an instrument (American Educational Research Association et al., 1985),
reducing the reliability of an instrument and affecting the generalizability of the
outcomes. Because no instrument is perfect, a researcher should expect some
measurement error. To minimize measurement error and improve the precision of the
instrument in the current study, respondents were drawn from two databases rather than
one. Previous studies (Gomez, 2003; Hill, 1999; P.P. Phillips, 2003; Twitchell, 1997) did
not report reliability measures.
Data Collection Procedures
A survey instrument was mailed to 330 members of ASTD who indicated
Association/Nonprofit as an area of interest within their respective professional
associations. Because the data collection method has a greater affect on response rates
than the survey instrument itself, the tailored design method by Dillman (2000) was used
as the basis for data collection. A pre-notice letter printed on the University of North
Texas (UNT) Department of Technology and Cognition letterhead was mailed to all
potential respondents in a standard No. 10 envelope with the researcher’s return mailing
address. The pre-notice letter alerted the respondents that they would be receiving a
request for help with an important study. P.P. Phillips (2003) noted that she received
positive feedback from respondents on the use of the pre-notice letter. Some indicated
that they responded because they knew the survey was coming and also knew the purpose
of the survey (see Appendix B for a copy of the pre-notice letter).
The survey and a detailed cover letter explaining why a response is important
were mailed 5 days after the pre-notice letter. The cover letter was printed on UNT-

43
Department of Technology and Cognition letterhead. The survey was printed in booklet
format and contained an identifying number that was used to determine who had and had
not returned a survey. The identifying number was not used to identify respondents with
any answers on the questionnaire. The accompanying cover letter emphasized the
confidentiality of the survey and explained the identifying number on the survey. The
questionnaire was sent by first class mail in a 9.5 x 12.5 envelope. A stamped, self-
addressed return envelope was included in the survey packet. According to Dillman
(2000), past research indicates a higher response rate when an actual first-class stamp is
used as opposed to bulk mailing or third-class postage (see Appendix C for a copy of the
cover letter).
The questionnaire mailing was followed by a thank-you postcard sent
approximately 1 week after the questionnaire. The postcard expressed appreciation for
completing the survey and reminded those who had not responded that it was hoped that
they would return the completed questionnaire soon. The postcard reminder was an
attempt to distinguish it from the previous mailings. Dillman (2000) uses a different type
of correspondence with each mailing to distinguish it from previous mailings (see
Appendix D for a copy of the postcard).
A replacement questionnaire was mailed approximately 4 weeks after the initial
questionnaire to those who had not returned a completed survey. The cover letter
indicated that the respondent’s survey had not been received and urged the recipient to
respond. The replacement questionnaire was sent by first-class mail and contained a
stamped, self-addressed envelope for returning the completed survey. Dillman (2000)

44
recommended adding a postscript to the cover letter inviting the participants to call or
email with questions or concerns. The replacement cover letter is shown in Appendix E.
Due to the low response rate to the first two mailings (5% of the total population),
a final replacement questionnaire was not sent to those who had not responded to either
of the previous mailings. The researcher made the decision to send the remaining 738
potential respondents a copy of the survey, accompanied by a cover letter, to boost the
response rate. The survey was sent by first-class mail and included a cover letter and a
stamped, self-addressed envelope. The cover letter for the survey is shown in Appendix
C.
Data Analysis Procedures
Descriptive and inferential statistics were used in the study. Data analysis was
performed using the Statistical Package for the Social Sciences (SPSS) version 13.0 for
Windows to test the questions and hypotheses. Statistical procedures included descriptive
statistics, correlations, the Mann-Whitney U test and the Kruskal-Wallis H test. Table 3
lists the research questions and hypotheses with the associated analysis for each. Based
on research and current literature on training evaluation use in organizations, the
following two research questions and four hypotheses were tested:
1. What are the predominant levels of training evaluation conducted in the
United States nonprofit sector organizations?
2. What standard methods of evaluating training are being used in nonprofit
sector organizations?
Research questions 1 and 2 were answered using frequencies and mean averages.
Frequencies are displayed for the number of organizations evaluating at each level. Mean

45
averages are reported based on the extent to which organizations evaluate programs at
each level.
H01A: There is no statistically significant difference between the percentage of
evaluation conducted at each of the five levels of evaluation and nonprofit
sector organizational characteristics.
H01B: There is no statistically significant relationship between the percentage of
evaluation conducted at each of the five levels of evaluation and nonprofit
sector organizational characteristics.
H02: There is no statistically significant relationship between the percentage of
evaluation conducted at each of the five levels of evaluation and nonprofit
sector training practices.
H03A: There is no statistically significant difference between the percentage of
evaluation conducted at each of the five levels of evaluation and manager
experience.
H03B: There is no statistically significant relationship between the percentage of
evaluation conducted at each of the five levels of evaluation and manager
experience.
H04: There is no statistically significant difference between the barriers to training
evaluation in nonprofit sector organizations and each level of training
evaluation conducted.

46
Table 3
Research Questions, Hypotheses, and Statistical Procedures
Questions/hypotheses Survey questions Procedures
Research question 1
A1, B1, C1, D1, E1 Mean Average, Frequency
Research question 2
A2, B2, C2, D2, E2 Frequency
H01A and H01B
IV: F10, G1, G2, G3, G4, G8
DV: A1, B1, C1, D1, E1
Mann Whitney U test/Kruskal Wallis H test/Pearson Correlation/Spearman Rho Correlation
H02
IV: F1, F3, F15 DV: A1, B1, C1, D1, E1 IV: F2 DV: A1, B1, C1, D1, E1
Point Biserial Correlation/Spearman Rho Correlation Spearman Rho Correlation
H03A and H03B
IV: G6, G12 DV: A1, B1, C1, D1, E1 IV: G9, G10 DV: A1, B1, C1, D1, E1
Kruskal Wallis H test Spearman Rho Correlation
H04
IV: A4, B4, C4, D4, E4 DV: A1, B1, C1, D1, E1
Mann Whitney U test
Summary
This chapter discussed the research design, population, and sample. Data
collection procedures and data analysis were also outlined and discussed. Chapter 4
contains the findings of the study.

47
CHAPTER 4
FINDINGS
Overview
This chapter presents the findings of the study and includes the following
sections: (a) Demographics, (b) Research Questions Analysis, (c) Hypotheses Analysis,
(d) General Comments, and (e) Summary. The demographic section discusses the target
population, sample, and response rate. The Research Questions and Hypotheses Analysis
sections contain the results of the descriptive statistics for the research questions and
hypotheses. The Hypotheses Analysis also discusses the results of the statistical tests and
the reject or fail-to-reject findings for each. The General Comments section discusses
participant comments related to the study.
Demographics
The target population for this study was training professionals working in
nonprofit organizations in the United States. The population was taken from the ASTD
membership list. The list includes members in nonprofit organizations as well as religious
organizations who have direct or indirect responsibilities for training. Consultants,
professors, and members whose organization type could not be determined were excluded
from the study. After cleaning the data, 1,068 individuals were identified for the study.
Surveys were sent to a random sample of 330 potential respondents. In order to
generalize to the population of 1,068 at the .05 level of significance, 285 responses were
needed. The researcher increased the number of surveys sent to 330 to account for
nonrespondents. Forty surveys were returned by the United States Postal Service as
undeliverable due to incorrect addresses or respondent no longer at the current address.

48
Six organizations did not want to participate. The sample was reduced to 284 by
removing the surveys that were returned as undeliverable and removing the organizations
that did not want to participate in the study. By following a modified version of
Dillman’s (2000) data collection process described in chapter 3, fifty-four usable surveys
were returned. This represents a response rate of 19% of the sample.
As a result of the low response rate, the researcher made the decision to send
surveys to the remaining population of 738. Of the 738 surveys sent, 143 surveys were
returned as undeliverable due to incorrect address or no longer at current address. Two
organizations did not want to participate. This reduced the remaining population to 593
potential respondents for the second mailing. Twenty usable surveys were returned for a
4% response rate.
Surveys were sent to a total of 1,068 organizations, with 183 surveys returned as
undeliverable. This reduced the total population to 885. Six organizations did not want to
participate in the study, thus reducing the total population to 879 potential respondents.
The number of usable surveys received for the current study was 74. This represents a
total return rate of approximately 9%.
Demographic data were collected from each respondent. For the type of
organizations responding, health services represents 16.2%, education/research represents
13.5%, and social and legal services represents 12.2% of respondents. The “Other”
category represents 43.2% of respondents and includes financial and trade associations.
Table 4 lists the type of nonprofit organizations and the percentage for each.

49
Table 4
Type of Nonprofit Organizations
Type Number (n=74) Percent
Health Services 12 16.2
Education/Research 10 13.5
Social and Legal 9 12.2
Foundations 1 1.4
Civic, Social and Fraternal 3 4.1
Religious 7 9.5
Other 32 43.2
The majority of respondents (66.2%) represented small nonprofit organizations
with fewer than 500 employees. Only 4 respondents (5.4%) represented nonprofit
organizations over 10,000 employees. Table 5 lists the number of respondents and
percentages for each category. There were no respondents for the category 5,001-10,000.
Table 5
Size of Nonprofit Organizations
Type Number (n=74) Percent
1-500 49 66.2
501-1,000 10 13.5
1,001-3,000 9 12.2
3,001-5,000 2 2.7
10,001-20,000 1 1.4
Over 20,000 3 4.1

50
Of those responding, 20.3% had been in a training function 1-5 years; 24.3%, 6-
10 years; and 55.4%, 11 or more years. Of the survey respondents, 1.4% had an
associate’s degree; 31%, a bachelor’s degree; 49.3%, a master’s degree; 15.5%, a
doctorate; and 2.8%, other education. Approximately 48% of the respondents indicated
Training, Training and Development, or Training and Education as the job function
indicated in their job title.
The budget for employee training in nonprofit organizations varies from $0 to
$710,000 annually. The average investment in training is $385,052.59. However, the
median budget for training in nonprofit organizations as reported by survey respondents
(n=70) was much lower, at $44,500 annually.
Respondents were asked to provide their job title, job function, the number of
years they had worked for their organization, the number of years they had been involved
in training, and gender. Table 5 summarizes these data by presenting the number and
percentage of frequency for each category. Over half the respondents had director or
manager in their job title. The category of other job title was the next most cited and was
tied with manager for percentage (18.9%) of those reporting. Executive Director and
Coordinator followed the other category. A list of the other job titles can be found in
Appendix F.
Respondents were also asked to list their job function as indicated by their job
title. Identification of the job function would give a better understanding of the
responsibilities of the respondents. Almost half (48.7%) of the respondents identified
Training, Training and Development, or Training and Education as their job function.

51
Twenty-three percent of respondents listed other as their job function. A list of other job
functions can be found in Appendix G.
Identifying years in the organization and number of years in training indicates a
familiarity with the organization as well as the training process. As shown in Table 6, the
number of years in the organization is divided evenly among the three categories. A
slight edge (36.5%) went to those working in their organization 6 to 10 years. The
number of years in training was slightly different from the number of years in the
organization. As Table 5 shows, 55.4% of those responding had been in the training field
11 or more years. Table 6 also shows that females outnumber the males in the study by a
62.2% to 37.8% margin.

52
Table 6
Respondent Demographics
Title Number (n=74) Percent
Executive Director 6 8.1
Director 31 41.9
Manager 14 18.9
Coordinator 6 8.1
Specialist 2 2.7
Analyst 1 1.4
Other 14 18.9
Job Function Number (n=74) Percent
Employee Development 2 2.7
Staff Development 2 2.7
Training 13 17.6
Education 1 1.4 Training and Development 14 18.9
Training and Education 9 12.2
Programs 6 8.1
HRD 1 1.4
HRM 4 5.4
HR 5 6.8 Other 17 23.0
Years in Organization Number (n=74) Percent
1-5 21 28.4 6-10 27 36.5 11 or more 26 35.1
Years Involved in Training Number (n=74) Percent
1-5 15 20.3
6-10 18 24.3
11 or more 41 55.4
Gender Number (n=74) Percent
Male 28 37.8
Female 46 62.2
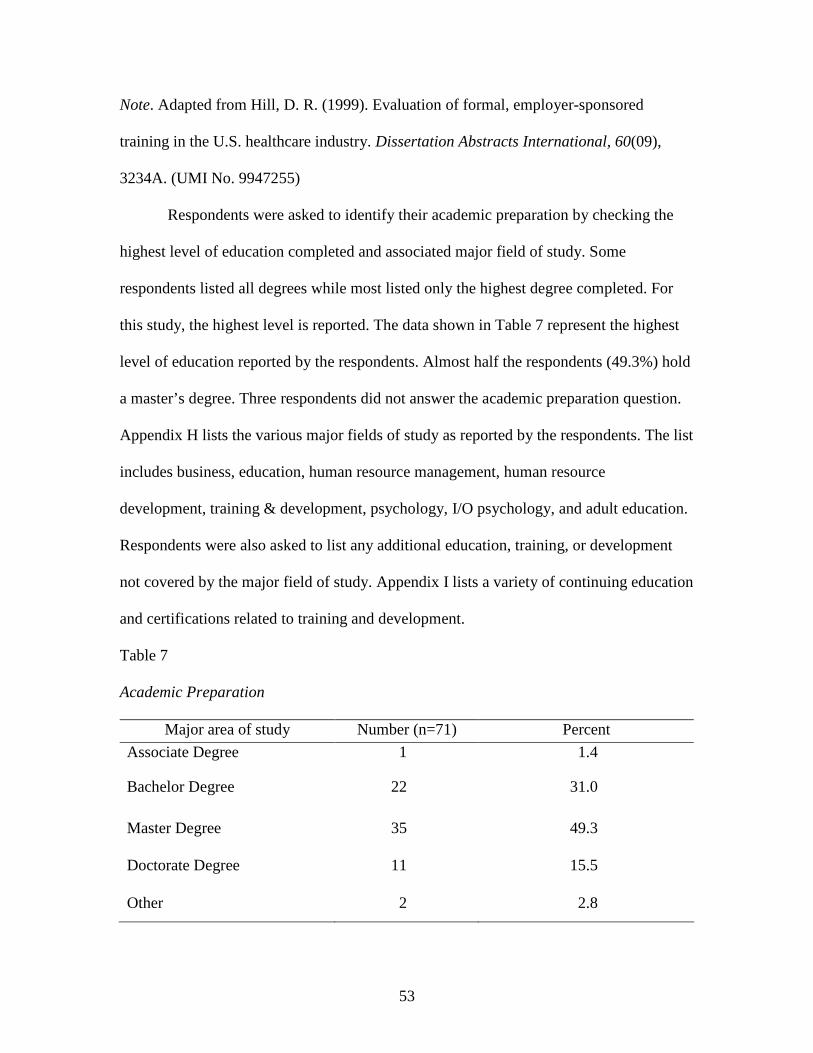
53
Note. Adapted from Hill, D. R. (1999). Evaluation of formal, employer-sponsored
training in the U.S. healthcare industry. Dissertation Abstracts International, 60(09),
3234A. (UMI No. 9947255)
Respondents were asked to identify their academic preparation by checking the
highest level of education completed and associated major field of study. Some
respondents listed all degrees while most listed only the highest degree completed. For
this study, the highest level is reported. The data shown in Table 7 represent the highest
level of education reported by the respondents. Almost half the respondents (49.3%) hold
a master’s degree. Three respondents did not answer the academic preparation question.
Appendix H lists the various major fields of study as reported by the respondents. The list
includes business, education, human resource management, human resource
development, training & development, psychology, I/O psychology, and adult education.
Respondents were also asked to list any additional education, training, or development
not covered by the major field of study. Appendix I lists a variety of continuing education
and certifications related to training and development.
Table 7
Academic Preparation
Major area of study Number (n=71) Percent
Associate Degree 1 1.4
Bachelor Degree 22 31.0
Master Degree 35 49.3
Doctorate Degree 11 15.5
Other 2 2.8

54
Research Questions Analysis
Research question 1 asked how employer-sponsored training in the U.S. nonprofit
sector is evaluated. Frequencies and descriptive statistics are used to describe training
evaluation use. The evidence in the literature suggests that training evaluation is
predominantly conducted at Level 1, participant reaction, and Level 2, learning. Research
question 2 asked what standard methods are used to evaluate training in the U.S.
nonprofit sector. Frequencies are used to describe the standard methods used to evaluate
training in U.S. nonprofit sector organizations. Past research (Gomez, 2003; Hill, 1999;
P.P. Phillips, 2003; Twitchell, 1997) has suggested that there is no standard method to
evaluate return on investment in training (Level 5).
Research Question 1
1. What are the predominant levels of training evaluation conducted in the
United States nonprofit sector organizations?
Using frequencies and descriptive statistics, questions A1, B1, C1, D1, and E1
were analyzed. Table 8 shows that nonprofit organizations evaluate training
predominantly at Level 1. Respondents indicated that on average, 71.96% of their
programs are evaluated at Level 1. Respondents also indicated that 42.31% of their
programs are evaluated at Level 2; 24.26% of programs are evaluated at Level 3; 15.27%
at Level 4; and 6.89% at Level 5. Standard deviations for each level range from 36.71 at
Level 1 to 21.29 at Level 5. Responses ranged from 0% to 100% at all five levels of
training evaluation.

55
Table 8
Training Evaluation Use
Level of evaluation Mean SD
Level 1 71.96 36.71
Level 2 42.31 36.99
Level 3 24.26 31.63
Level 4 15.27 27.77 Level 5 6.89 21.29
Research Question 2
2. What standard methods of evaluating training are being used in nonprofit
sector organizations?
Respondents were asked to estimate the percentage of currently active programs
evaluated using various methods. Descriptive statistics were used to analyze survey
question A2, B2, C2, D2, and E2. The options of percentages for survey respondents
included (a) 0%, (b) 1-19%, (c) 20-39%, (d) 40-59%, (e) 60-79%, and (f) 80-100%. If
participants answered 0% of current programs evaluated at any level (questions A1, B1,
C1, D1, or E1), they were instructed to skip to A4, B4, C4, D4, or E4, respectively.
Respondents were given a choice of two methods used to evaluate reaction. Two
blank spaces were provided for respondents to indicate any other method used to evaluate
reaction. There were missing values for this question. Missing values were also present in
previous studies (Hill, 1999; P.P. Phillips, 2003; Twitchell, 1997). In those studies,
missing values were treated as a response of 0%. To make comparisons between the
current study and the previous studies, the researcher used this procedure to manage
missing data for questions A2, B2, C2, D2, and E2. As shown in Table 9, reaction

56
questionnaire is the primary method used to evaluate training at Level 1 (reaction). Other
methods of evaluating training at Level 1 included group reflection, verbal feedback,
follow-up phone call, employee survey, posttest, and post-event interview. Posttest is
typically used to evaluate Level 2, learning.
Table 9 Reaction Methods of Evaluating Training
1 2 3 4 5 6 Method (n=66)
0% 1-19% 20-39% 40-59% 60-79% 80-100%
Reaction Questionnaires 1 5 2 3 5 50
Action Plans 31 20 8 5 0 2
Other 49 6 3 5 1 2
Respondents indicated that self-assessment and facilitator/instructor assessment
were the top two methods used to evaluate Level 2 (learning) in 80-100% of their
programs. As shown in Table 10, simulation and work examples were not used by any of
the respondents in 80-100% of their programs. Four respondents indicated other methods
to evaluate learning. Other methods used to evaluate learning can be found in Appendix
K.

57
Table 10 Learning Methods of Evaluating Training
1 2 3 4 5 6 Method (n=60)
0% 1-19% 20-39% 40-59% 60-79% 80-100%
Written Pre/Post-Test 21 21 8 5 2 3
Written Post-Test Only 23 16 4 9 5 3
Simulation 24 17 10 6 3 0
Work Samples 36 13 3 5 3 0
Skill Demonstrations 15 11 17 8 6 3
On-The-Job Demonstration
26 9 7 3 12 3
Self-Assessment 21 12 4 9 8 6
Team Assessment 32 14 8 1 3 2
Facilitator/Instructor Assessment
16 11 9 11 8 5
Other 56 1 1 1 1 0
Survey respondents indicated they evaluate 24.26% of their programs at Level 3
(application). Table 11 shows that the top three methods used to evaluate Level 3 80-
100% of the time are performance appraisals, assessment by trainee’s supervisor, and
observation. The least used methods for Level 3 evaluation are follow-up assignment and
action plans. Four respondents indicated some other methods of evaluating Level 3. Other
methods can be found in Appendix L.

58
Table 11 Application Methods of Evaluating Training
1 2 3 4 5 6 Method (n=42)
0% 1-19% 20-39% 40-59% 60-79% 80-100%
Anecdotal Information 12 14 7 3 3 3
Observation 9 7 8 5 5 8
Performance Appraisal 9 6 11 3 3 10
Existing Records 22 10 3 2 2 3
Records Produced for Evaluation Purposes
18 9 4 5 3 3
Assessment by Trainee’s Subordinate
31 6 1 1 0 3
Self-Assessment 19 8 2 4 3 6
Peer Assessment 30 5 3 0 2 2
Assessment by Trainee’s Supervisor
13 5 4 6 5 9
Focus Groups 30 7 2 0 2 1
Follow-Up Assignments 29 5 3 3 3 0
Action Plans 19 8 2 8 5 0
Performance Contract With Supervisor
28 4 2 2 4 1
Other 38 2 0 2 0 0
Improved quality, compliance with regulations, and customer satisfaction are the
three main methods nonprofit organizations use to evaluate the results of training 80-
100% of the time. Table 12 shows that 10 respondents listed improved quality as the
primary method used to evaluate results of training. The least used methods are anecdotal
information and methods used to isolate the effects of the program. Three respondents
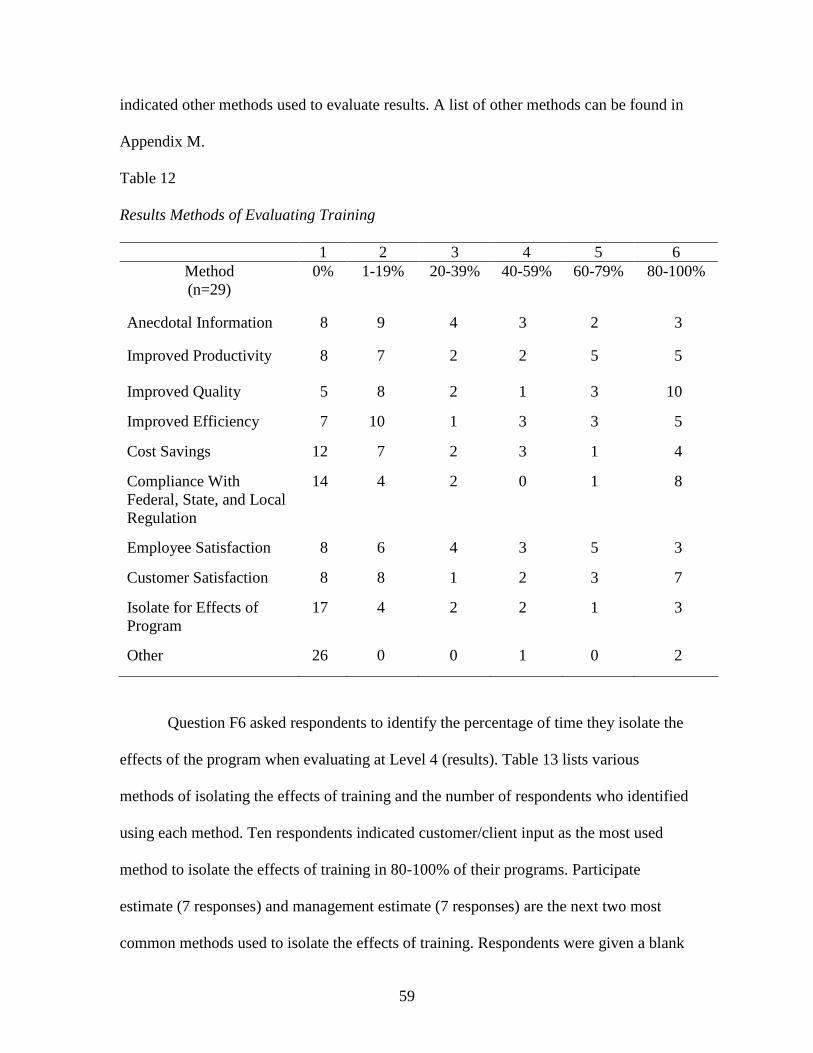
59
indicated other methods used to evaluate results. A list of other methods can be found in
Appendix M.
Table 12 Results Methods of Evaluating Training
1 2 3 4 5 6 Method (n=29)
0% 1-19% 20-39% 40-59% 60-79% 80-100%
Anecdotal Information 8 9 4 3 2 3
Improved Productivity 8 7 2 2 5 5
Improved Quality 5 8 2 1 3 10
Improved Efficiency 7 10 1 3 3 5
Cost Savings 12 7 2 3 1 4
Compliance With Federal, State, and Local Regulation
14 4 2 0 1 8
Employee Satisfaction 8 6 4 3 5 3
Customer Satisfaction 8 8 1 2 3 7
Isolate for Effects of Program
17 4 2 2 1 3
Other 26 0 0 1 0 2
Question F6 asked respondents to identify the percentage of time they isolate the
effects of the program when evaluating at Level 4 (results). Table 13 lists various
methods of isolating the effects of training and the number of respondents who identified
using each method. Ten respondents indicated customer/client input as the most used
method to isolate the effects of training in 80-100% of their programs. Participate
estimate (7 responses) and management estimate (7 responses) are the next two most
common methods used to isolate the effects of training. Respondents were given a blank
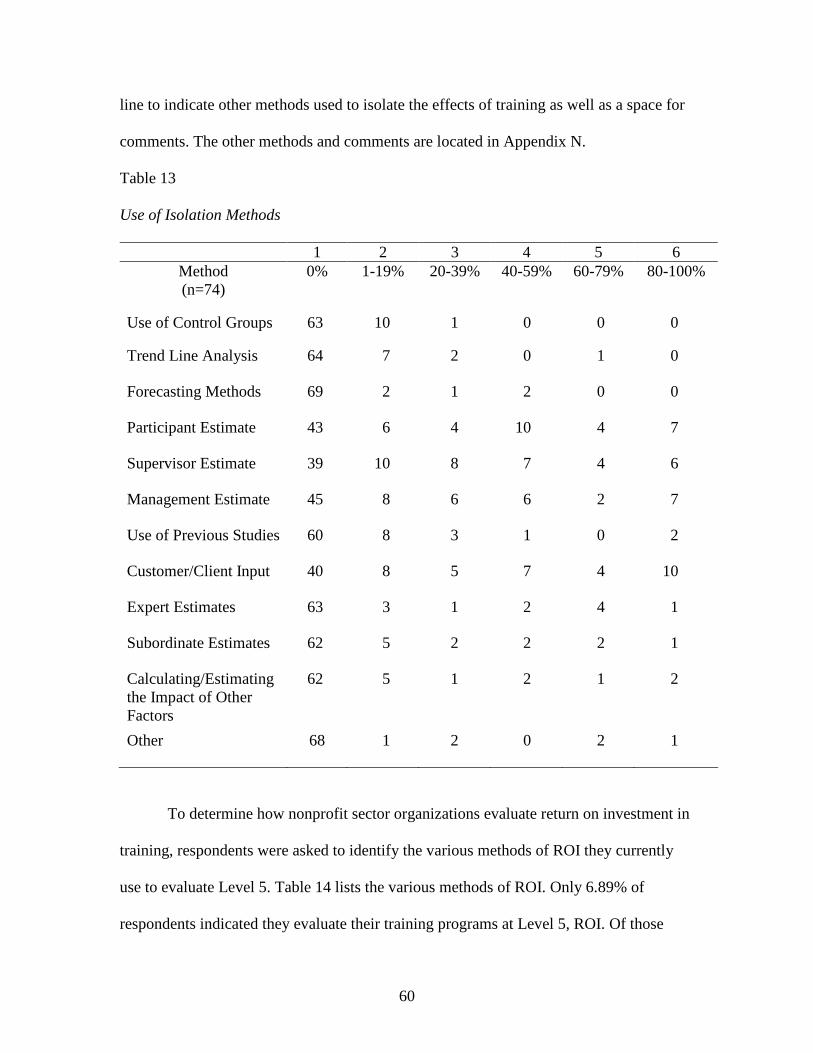
60
line to indicate other methods used to isolate the effects of training as well as a space for
comments. The other methods and comments are located in Appendix N.
Table 13 Use of Isolation Methods
1 2 3 4 5 6 Method (n=74)
0% 1-19% 20-39% 40-59% 60-79% 80-100%
Use of Control Groups 63 10 1 0 0 0
Trend Line Analysis 64 7 2 0 1 0
Forecasting Methods 69 2 1 2 0 0
Participant Estimate 43 6 4 10 4 7
Supervisor Estimate 39 10 8 7 4 6
Management Estimate 45 8 6 6 2 7
Use of Previous Studies 60 8 3 1 0 2
Customer/Client Input 40 8 5 7 4 10
Expert Estimates 63 3 1 2 4 1
Subordinate Estimates 62 5 2 2 2 1
Calculating/Estimating the Impact of Other Factors
62 5 1 2 1 2
Other 68 1 2 0 2 1
To determine how nonprofit sector organizations evaluate return on investment in
training, respondents were asked to identify the various methods of ROI they currently
use to evaluate Level 5. Table 14 lists the various methods of ROI. Only 6.89% of
respondents indicated they evaluate their training programs at Level 5, ROI. Of those

61
responding, 3 use traditional ROI methods to evaluate training and 3 respondents use
cost-benefit analysis in 80-100% of their programs. One respondent indicated use of
other methods of evaluating ROI. The other method listed is total market value.
Table 14 Return on Investment Methods of Evaluating Training
1 2 3 4 5 6 Method (n=15)
0% 1-19% 20-39% 40-59% 60-79% 80-100%
Traditional ROI 5 2 1 3 1 3
Cost Benefit Analysis 5 2 1 4 0 3
Payback Period 9 1 3 1 0 1
Net Present Value 14 0 1 0 0 0
Internal Rate of Return 14 0 1 0 0 0
Utility Analysis 13 0 0 1 0 1
Balanced Scorecard 8 3 4 0 0 0
Consequences of Not Training
10 3 0 1 0 1
Other 14 0 0 0 0 1
Hypotheses Analysis
Preliminary analysis, a one-sample K-S test, revealed that the dependant
variables, percentage of evaluation conducted at each of the five levels (A1, B1, C1, D1
and E1), were not normally distributed. Logarithmic and square root transformations
were conducted, but the variables did not lend favorably to transformations. Because of
the violations of normality, nonparametric equivalents were used in place of ANOVAs
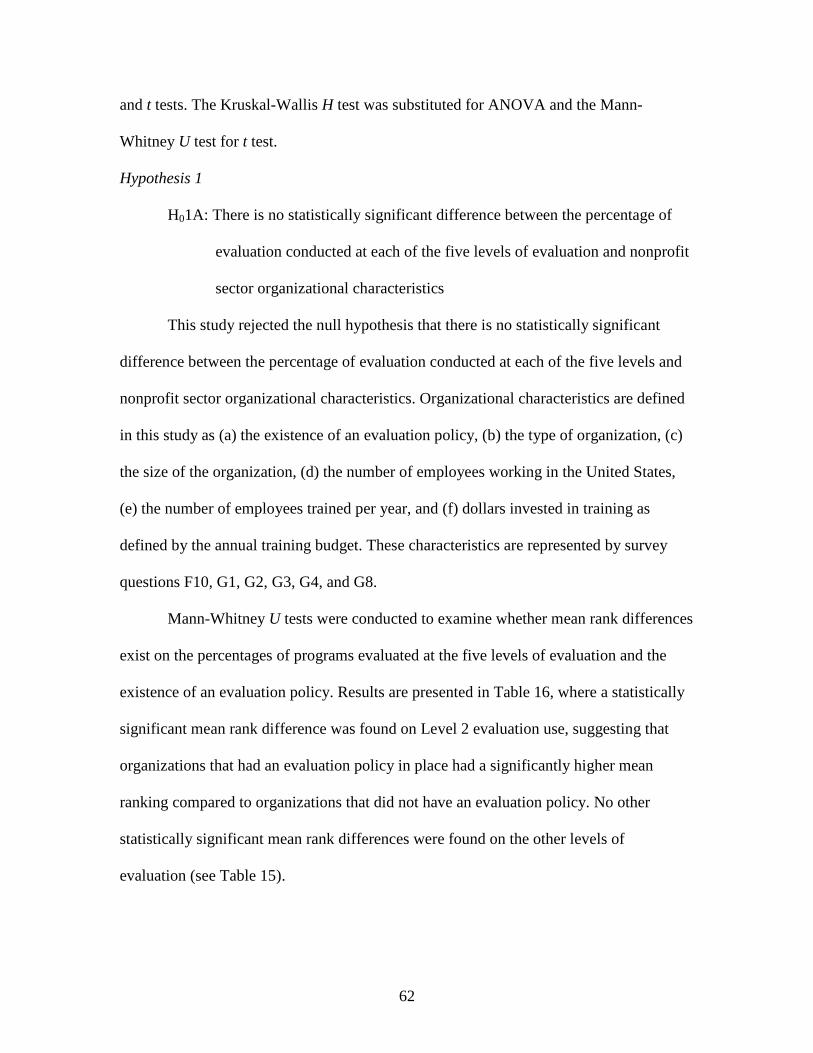
62
and t tests. The Kruskal-Wallis H test was substituted for ANOVA and the Mann-
Whitney U test for t test.
Hypothesis 1
H01A: There is no statistically significant difference between the percentage of
evaluation conducted at each of the five levels of evaluation and nonprofit
sector organizational characteristics
This study rejected the null hypothesis that there is no statistically significant
difference between the percentage of evaluation conducted at each of the five levels and
nonprofit sector organizational characteristics. Organizational characteristics are defined
in this study as (a) the existence of an evaluation policy, (b) the type of organization, (c)
the size of the organization, (d) the number of employees working in the United States,
(e) the number of employees trained per year, and (f) dollars invested in training as
defined by the annual training budget. These characteristics are represented by survey
questions F10, G1, G2, G3, G4, and G8.
Mann-Whitney U tests were conducted to examine whether mean rank differences
exist on the percentages of programs evaluated at the five levels of evaluation and the
existence of an evaluation policy. Results are presented in Table 16, where a statistically
significant mean rank difference was found on Level 2 evaluation use, suggesting that
organizations that had an evaluation policy in place had a significantly higher mean
ranking compared to organizations that did not have an evaluation policy. No other
statistically significant mean rank differences were found on the other levels of
evaluation (see Table 15).

63
Table 15
Difference in the Existence of an Evaluation Policy by Each Level of Evaluation
Evaluation Policy
No Yes
Levels U Sig. N Mean Rank
Sum of Ranks
N Mean Rank
Sum of Ranks
Level 1 321.00 .129 57 34.63 1974.00 15 43.60 654.00
Level 2 233.50** .007 57 33.10 1886.50 15 49.43 741.50
Level 3 335.00 .181 57 34.88 1988.00 15 42.67 640.00
Level 4 395.00 .611 57 35.93 2048.00 15 38.67 580.00
Level 5 390.50 .470 57 35.85 2043.50 15 38.97 584.50
Note. * p < .05, p < .01.
Five Kruskal-Wallis H tests were conducted to examine whether mean rank
differences existed on the use of each of the five levels of evaluation (A1, B1, C1, D1,
and E1) by Type of Organization (Health Services vs. Education/Research vs. Social and
Legal vs. Foundations vs. Civic, Social and Fraternal vs. Religious vs. Other). No
significant mean rank differences were found on the Five Levels of Evaluation by Type
of Organization.
H01B: There is no statistically significant relationship between the percentage of
evaluation conducted at each of the five levels of evaluation and nonprofit
sector organizational characteristics
This study rejected the null hypothesis that there is no statistically significant
relationship between the percentage of evaluation conducted at each of the five levels and

64
nonprofit sector organizational characteristics. Pearson correlations were conducted to
examine whether statistically significant relationships existed between the use of
evaluation at each level with the number of employees working in the United States, the
number of U.S. employees participating in training last year, and the annual training
budget. The results revealed that no statistically significant relationships existed between
the five levels of evaluation with number of employees working in the United States, the
number of U.S. employees participating in training last year, or the annual training
budget.
Spearman rho correlations were conducted to examine whether statistically
significant relationships existed between the five levels of evaluation with the written
evaluation policy guiding the evaluation process (F11) and the size of the organization
(G2). The results reveal that a statistically significant positive relationship exists on Level
2 evaluation use and the extent to which a written evaluation policy guides the evaluation
process (see Table 16), suggesting that the use of Level 2 evaluation increases when a
written evaluation policy is in place in the organization. No other statistically significant
relationships were found.
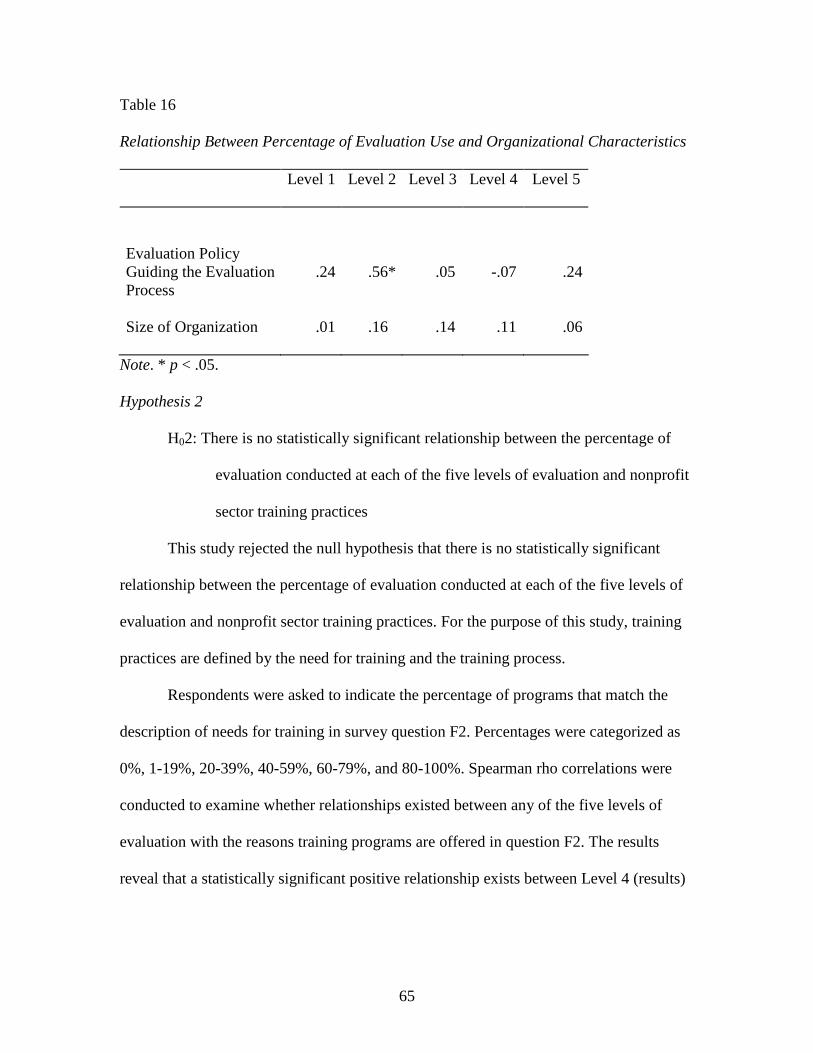
65
Table 16
Relationship Between Percentage of Evaluation Use and Organizational Characteristics
Level 1 Level 2 Level 3 Level 4 Level 5
Evaluation Policy Guiding the Evaluation Process
.24 .56* .05 -.07 .24
Size of Organization .01 .16 .14 .11 .06
Note. * p < .05.
Hypothesis 2
H02: There is no statistically significant relationship between the percentage of
evaluation conducted at each of the five levels of evaluation and nonprofit
sector training practices
This study rejected the null hypothesis that there is no statistically significant
relationship between the percentage of evaluation conducted at each of the five levels of
evaluation and nonprofit sector training practices. For the purpose of this study, training
practices are defined by the need for training and the training process.
Respondents were asked to indicate the percentage of programs that match the
description of needs for training in survey question F2. Percentages were categorized as
0%, 1-19%, 20-39%, 40-59%, 60-79%, and 80-100%. Spearman rho correlations were
conducted to examine whether relationships existed between any of the five levels of
evaluation with the reasons training programs are offered in question F2. The results
reveal that a statistically significant positive relationship exists between Level 4 (results)

66
and participants will be able to perform at a set level (rs = .25, p<.05) and a change in
organizational outcomes will result from the program (rs = .25, p<.05) (see Table 17).
Table 17
Relationship Between Percentage of Evaluation Use and Need for Training
Level 1 Level 2 Level 3 Level 4 Level 5
Employees attend as a reward .04 .13 -.01 -.08 -.11
Employees attend as a part of a group activity
.08 -.05 .08 .08 -.18
Employees attend to acquire new skills
-.12 -.05 .13 .20 -.05
Employees attend in order to perform at a set level
-.02 -.03 .12 .25* -.08
Change in organizational out- comes is expected
-.08 -.05 .07 .25* .01
Note. * p < .05.
The training process is defined as timing of evaluation planning, evaluation
reporting, and percentage of employees responsible for evaluating training. In order to
understand whether an association exists between the five levels of evaluation and the
extent to which evaluation planning occurs, respondents were asked to indicate the
percentage of programs in which planning evaluation begins prior to program
development, during program development, after program completion, when training
program results must be documented, and when evaluations are not implemented
(question F1). Spearman rho correlations were conducted to examine the relationships.
As shown in Table 18, statistically significant relationships exist between percentage of
evaluation conducted at Levels 1 through 4 and most of the planning categories. There
67
were no statistically significant relationships between when results are to be documented
and Levels 1 through 4. There was no statistically significant relationship between any of
the planning categories and Level 5.
Percentage of use of Level 1 evaluation was associated with the timing of
evaluation planning with the exception of as the first step in program development and
when results are to be documented. A negative relationship existed between the
percentage of Level 1 evaluation use and when evaluations are not implemented (rs = -
.31, p<.01). Level 2 percentage of evaluation use was associated with all categories of
planning with the exception of after program completion and when results are to be
documented. The strongest associations are with prior to program development (rs = .42,
p<.01) and as first step in program development (rs = .42, p<.01). A negative relationship
existed between the percentage of Level 2 evaluation use and when evaluations are not
implemented (rs = -.31, p<.01). Percentage of evaluation use at Level 3 had a positive
relationship with prior to program development (rs = .49, p<.01) and as the first step in
program development (rs = .29, p<.05). Percentage of use of Level 4 evaluation was
associated with prior to program development (rs = .23, p<.05), as the first step in
program development (rs = .27, p<.05), and during program development (rs = .29,
p<.05).
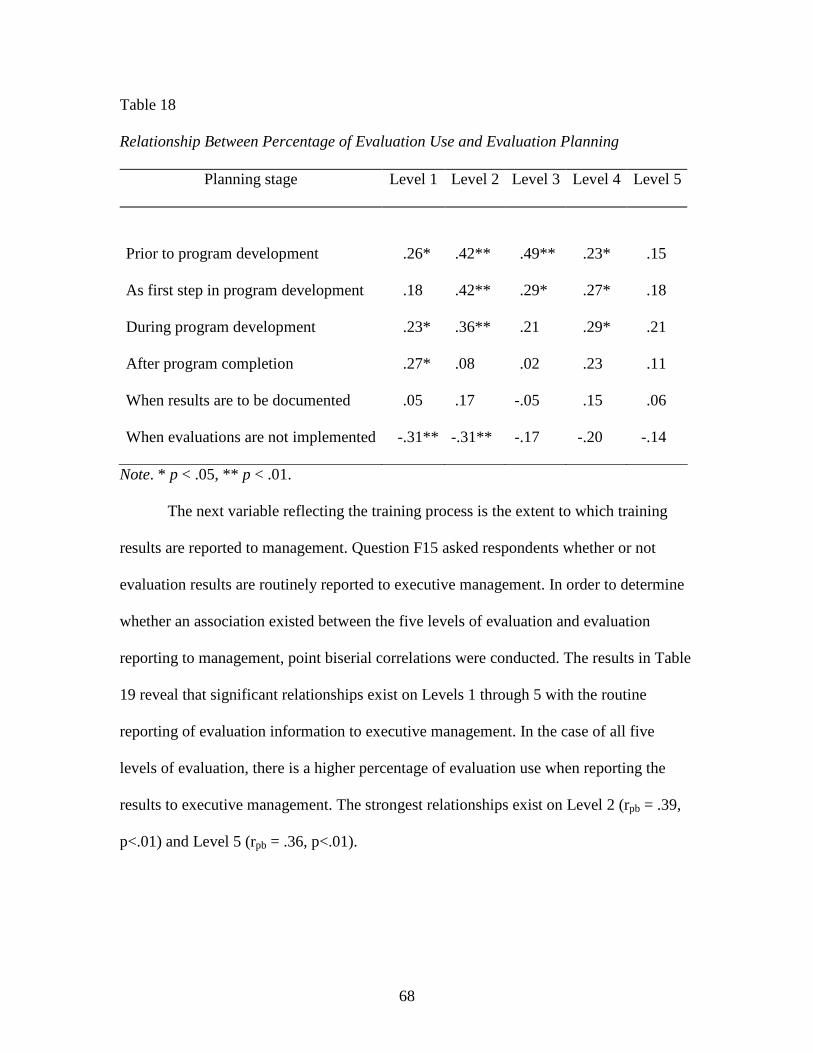
68
Table 18
Relationship Between Percentage of Evaluation Use and Evaluation Planning
Planning stage Level 1 Level 2 Level 3 Level 4 Level 5
Prior to program development .26* .42** .49** .23* .15
As first step in program development .18 .42** .29* .27* .18
During program development .23* .36** .21 .29* .21
After program completion .27* .08 .02 .23 .11
When results are to be documented .05 .17 -.05 .15 .06
When evaluations are not implemented -.31** -.31** -.17 -.20 -.14
Note. * p < .05, ** p < .01.
The next variable reflecting the training process is the extent to which training
results are reported to management. Question F15 asked respondents whether or not
evaluation results are routinely reported to executive management. In order to determine
whether an association existed between the five levels of evaluation and evaluation
reporting to management, point biserial correlations were conducted. The results in Table
19 reveal that significant relationships exist on Levels 1 through 5 with the routine
reporting of evaluation information to executive management. In the case of all five
levels of evaluation, there is a higher percentage of evaluation use when reporting the
results to executive management. The strongest relationships exist on Level 2 (rpb = .39,
p<.01) and Level 5 (rpb = .36, p<.01).
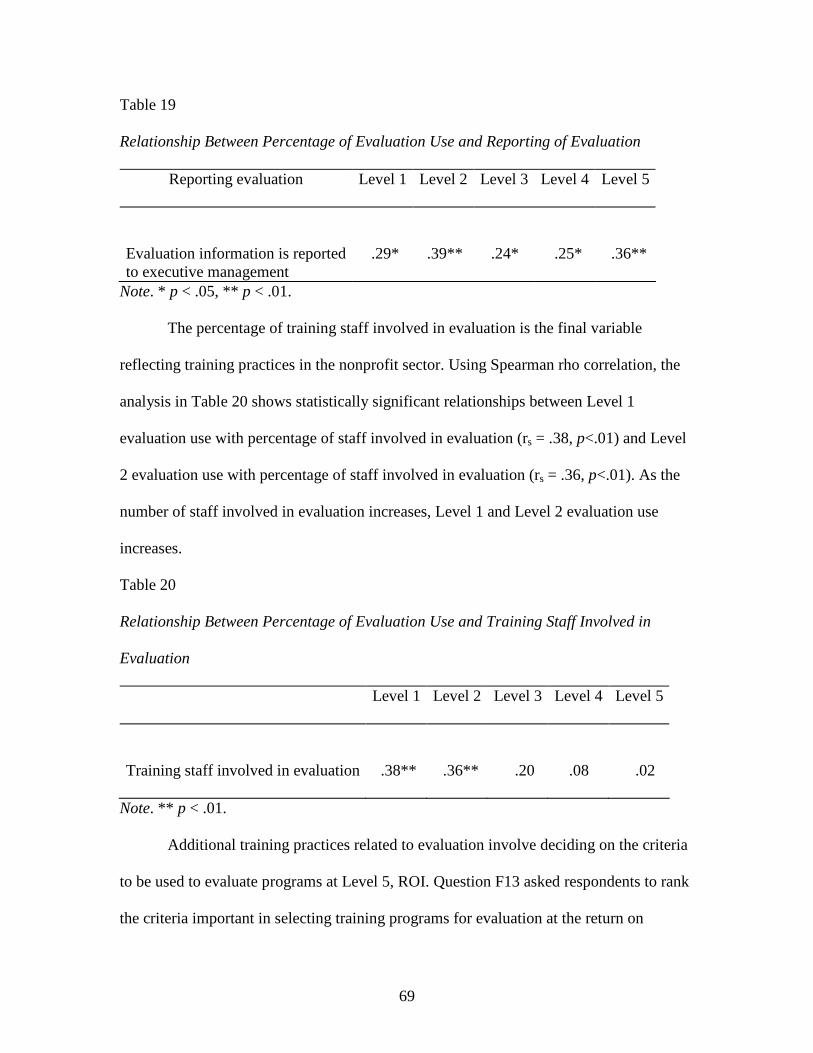
69
Table 19
Relationship Between Percentage of Evaluation Use and Reporting of Evaluation
Reporting evaluation Level 1 Level 2 Level 3 Level 4 Level 5
Evaluation information is reported to executive management
.29* .39** .24* .25* .36**
Note. * p < .05, ** p < .01.
The percentage of training staff involved in evaluation is the final variable
reflecting training practices in the nonprofit sector. Using Spearman rho correlation, the
analysis in Table 20 shows statistically significant relationships between Level 1
evaluation use with percentage of staff involved in evaluation (rs = .38, p<.01) and Level
2 evaluation use with percentage of staff involved in evaluation (rs = .36, p<.01). As the
number of staff involved in evaluation increases, Level 1 and Level 2 evaluation use
increases.
Table 20
Relationship Between Percentage of Evaluation Use and Training Staff Involved in
Evaluation
Level 1 Level 2 Level 3 Level 4 Level 5
Training staff involved in evaluation .38** .36** .20 .08 .02
Note. ** p < .01.
Additional training practices related to evaluation involve deciding on the criteria
to be used to evaluate programs at Level 5, ROI. Question F13 asked respondents to rank
the criteria important in selecting training programs for evaluation at the return on
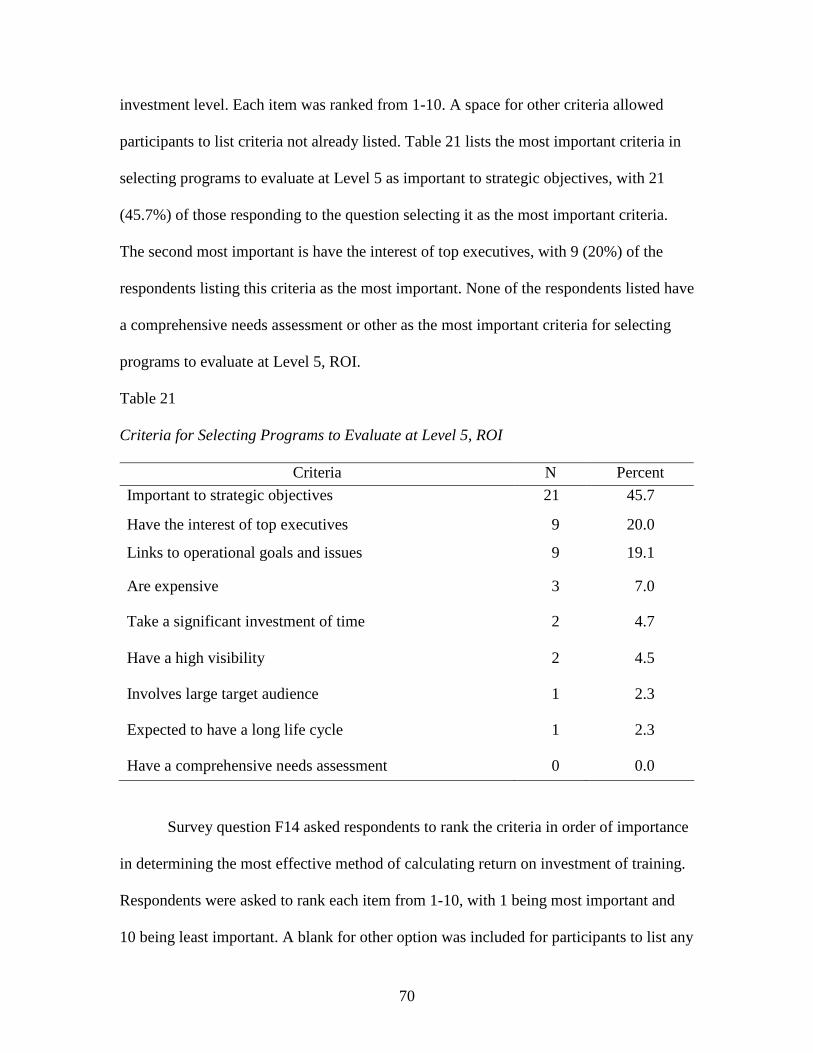
70
investment level. Each item was ranked from 1-10. A space for other criteria allowed
participants to list criteria not already listed. Table 21 lists the most important criteria in
selecting programs to evaluate at Level 5 as important to strategic objectives, with 21
(45.7%) of those responding to the question selecting it as the most important criteria.
The second most important is have the interest of top executives, with 9 (20%) of the
respondents listing this criteria as the most important. None of the respondents listed have
a comprehensive needs assessment or other as the most important criteria for selecting
programs to evaluate at Level 5, ROI.
Table 21
Criteria for Selecting Programs to Evaluate at Level 5, ROI
Criteria N Percent
Important to strategic objectives 21 45.7
Have the interest of top executives 9 20.0
Links to operational goals and issues 9 19.1
Are expensive 3 7.0
Take a significant investment of time 2 4.7
Have a high visibility 2 4.5
Involves large target audience 1 2.3
Expected to have a long life cycle 1 2.3
Have a comprehensive needs assessment 0 0.0
Survey question F14 asked respondents to rank the criteria in order of importance
in determining the most effective method of calculating return on investment of training.
Respondents were asked to rank each item from 1-10, with 1 being most important and
10 being least important. A blank for other option was included for participants to list any

71
other criteria not already listed. Table 22 shows that credibility is the most important
factor in selecting a method to evaluate programs at Level 5, ROI, with 13 (24.1%) of the
respondents selecting credible as the most important. The second most important criterion
is simple, with 12 (22.6%) of the respondents selecting this as the most important
method. The least important criterion is account for all program costs with only 2 (3.9%)
of respondents selecting it as the most important criterion. None of the respondents
selected other as the most important criterion in selecting methods to evaluate programs
at Level 5, ROI.
Table 22
Criteria for Selecting Methods to Evaluate at Level 5, ROI
Criteria N Percent
Credible 13 24.1
Simple 12 22.6
Economical 7 12.7
Account for other factors 5 9.8
Have successful track record 5 9.6
Be appropriate for a variety of programs 5 9.4
Theoretically sound 4 7.7
Be applicable with all types of data 2 3.9
Account for all program costs 2 3.9
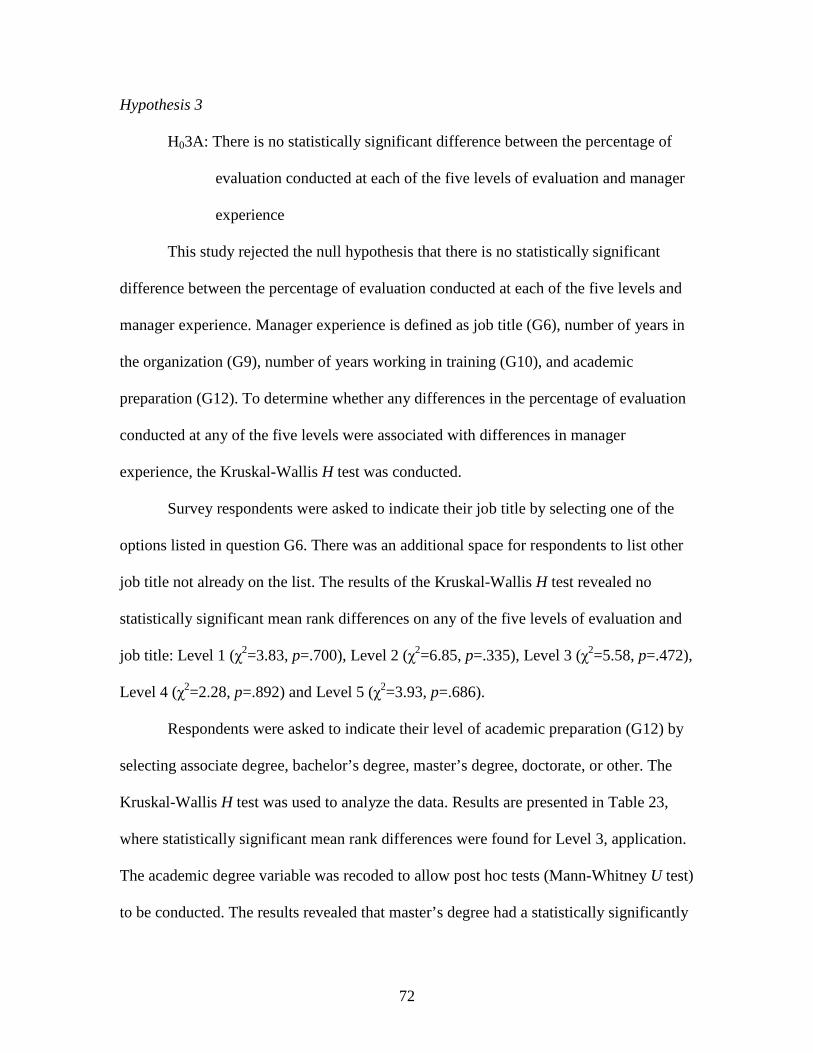
72
Hypothesis 3
H03A: There is no statistically significant difference between the percentage of
evaluation conducted at each of the five levels of evaluation and manager
experience
This study rejected the null hypothesis that there is no statistically significant
difference between the percentage of evaluation conducted at each of the five levels and
manager experience. Manager experience is defined as job title (G6), number of years in
the organization (G9), number of years working in training (G10), and academic
preparation (G12). To determine whether any differences in the percentage of evaluation
conducted at any of the five levels were associated with differences in manager
experience, the Kruskal-Wallis H test was conducted.
Survey respondents were asked to indicate their job title by selecting one of the
options listed in question G6. There was an additional space for respondents to list other
job title not already on the list. The results of the Kruskal-Wallis H test revealed no
statistically significant mean rank differences on any of the five levels of evaluation and
job title: Level 1 (χ2=3.83, p=.700), Level 2 (χ2=6.85, p=.335), Level 3 (χ2=5.58, p=.472),
Level 4 (χ2=2.28, p=.892) and Level 5 (χ2=3.93, p=.686).
Respondents were asked to indicate their level of academic preparation (G12) by
selecting associate degree, bachelor’s degree, master’s degree, doctorate, or other. The
Kruskal-Wallis H test was used to analyze the data. Results are presented in Table 23,
where statistically significant mean rank differences were found for Level 3, application.
The academic degree variable was recoded to allow post hoc tests (Mann-Whitney U test)
to be conducted. The results revealed that master’s degree had a statistically significantly
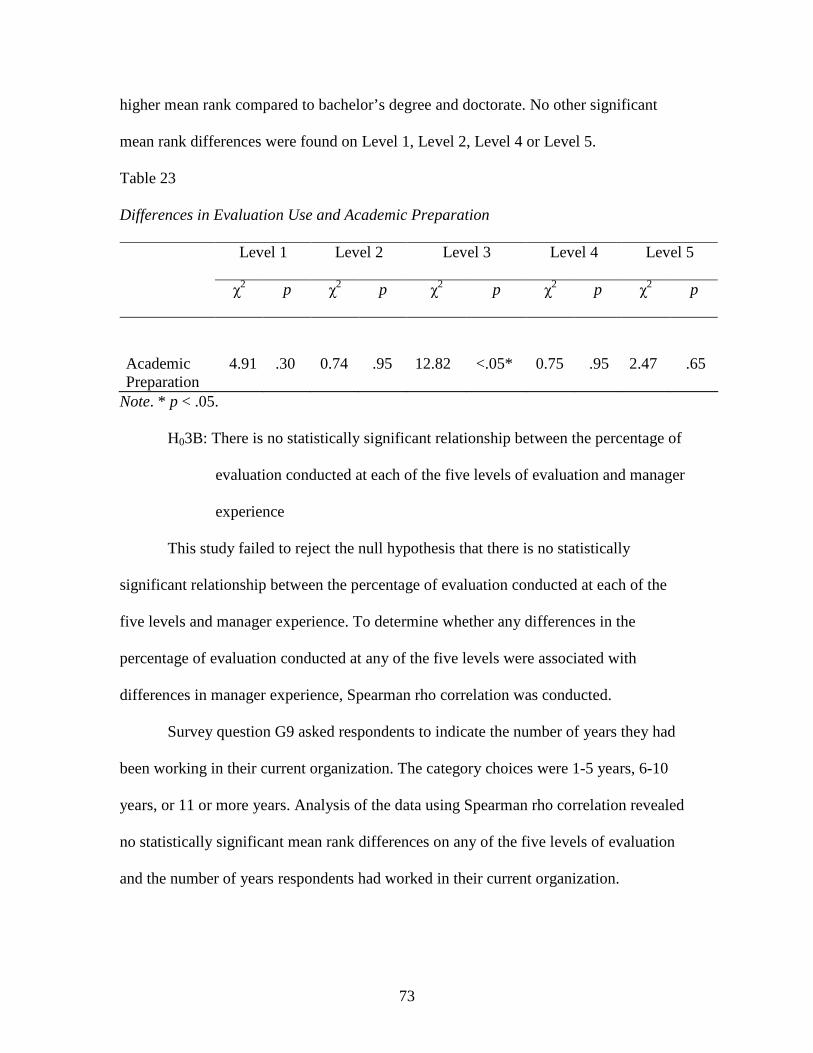
73
higher mean rank compared to bachelor’s degree and doctorate. No other significant
mean rank differences were found on Level 1, Level 2, Level 4 or Level 5.
Table 23
Differences in Evaluation Use and Academic Preparation
Level 1 Level 2 Level 3 Level 4 Level 5
χ2 p χ
2 p χ2 p χ
2 p χ2 p
Academic Preparation
4.91 .30 0.74 .95 12.82 <.05* 0.75 .95 2.47 .65
Note. * p < .05.
H03B: There is no statistically significant relationship between the percentage of
evaluation conducted at each of the five levels of evaluation and manager
experience
This study failed to reject the null hypothesis that there is no statistically
significant relationship between the percentage of evaluation conducted at each of the
five levels and manager experience. To determine whether any differences in the
percentage of evaluation conducted at any of the five levels were associated with
differences in manager experience, Spearman rho correlation was conducted.
Survey question G9 asked respondents to indicate the number of years they had
been working in their current organization. The category choices were 1-5 years, 6-10
years, or 11 or more years. Analysis of the data using Spearman rho correlation revealed
no statistically significant mean rank differences on any of the five levels of evaluation
and the number of years respondents had worked in their current organization.
74
Respondents were asked to indicate the number of years they had personally been
involved in a training function in any organization (G10). The category choices were 1-5
years, 6-10 years, or 11 or more years. Analysis of the data using Spearman rho
correlation revealed no significant mean rank differences on any of the five levels of
evaluation and number of years the respondents have been involved in a training function
in any organization.
Hypothesis 4
H04: There is no statistically significant difference between the barriers to training
evaluation in nonprofit sector organizations and each level of training
evaluation conducted
This study rejected the null hypothesis that there is no statistically significant
difference between the barriers to evaluation and each of the five levels of training
evaluation use. In questions A4, B4, C4, D4, and E4, participants were asked to indicate
all the reasons they do not evaluate at each of the five levels. Using frequencies, the top
three reasons for not evaluating at Level 1 are not required by organization, other, and
training is done only to meet legal requirements. The top three reasons for not evaluating
at Level 2 are not required by organization, lack of training or experience using this form
of evaluation, and cost in person-hours and/or capital. The top three reasons for not
evaluating at Level 3 are not required by organization, cost in person-hours and/or
capital, and lack of training or experience using this form of evaluation. The top three
reasons for not evaluating at Levels 4 and 5 are not required by organization, lack of
training or experience using this form of evaluation, and cost in person-hours and/or
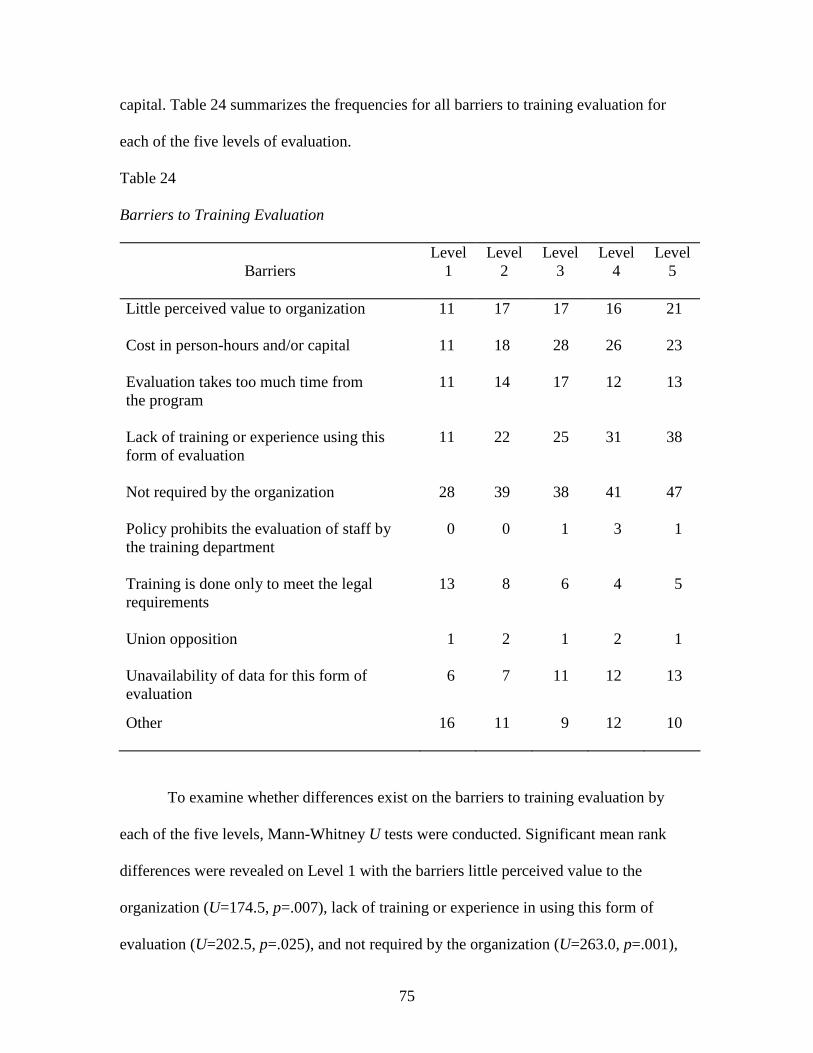
75
capital. Table 24 summarizes the frequencies for all barriers to training evaluation for
each of the five levels of evaluation.
Table 24
Barriers to Training Evaluation
Barriers Level
1
Level 2
Level 3
Level 4
Level 5
Little perceived value to organization 11 17 17 16 21
Cost in person-hours and/or capital 11 18 28 26 23
Evaluation takes too much time from the program
11 14 17 12 13
Lack of training or experience using this form of evaluation
11 22 25 31 38
Not required by the organization 28 39 38 41 47
Policy prohibits the evaluation of staff by the training department
0 0 1 3 1
Training is done only to meet the legal requirements
13 8 6 4 5
Union opposition 1 2 1 2 1
Unavailability of data for this form of evaluation
6 7 11 12 13
Other 16 11 9 12 10
To examine whether differences exist on the barriers to training evaluation by
each of the five levels, Mann-Whitney U tests were conducted. Significant mean rank
differences were revealed on Level 1 with the barriers little perceived value to the
organization (U=174.5, p=.007), lack of training or experience in using this form of
evaluation (U=202.5, p=.025), and not required by the organization (U=263.0, p=.001),
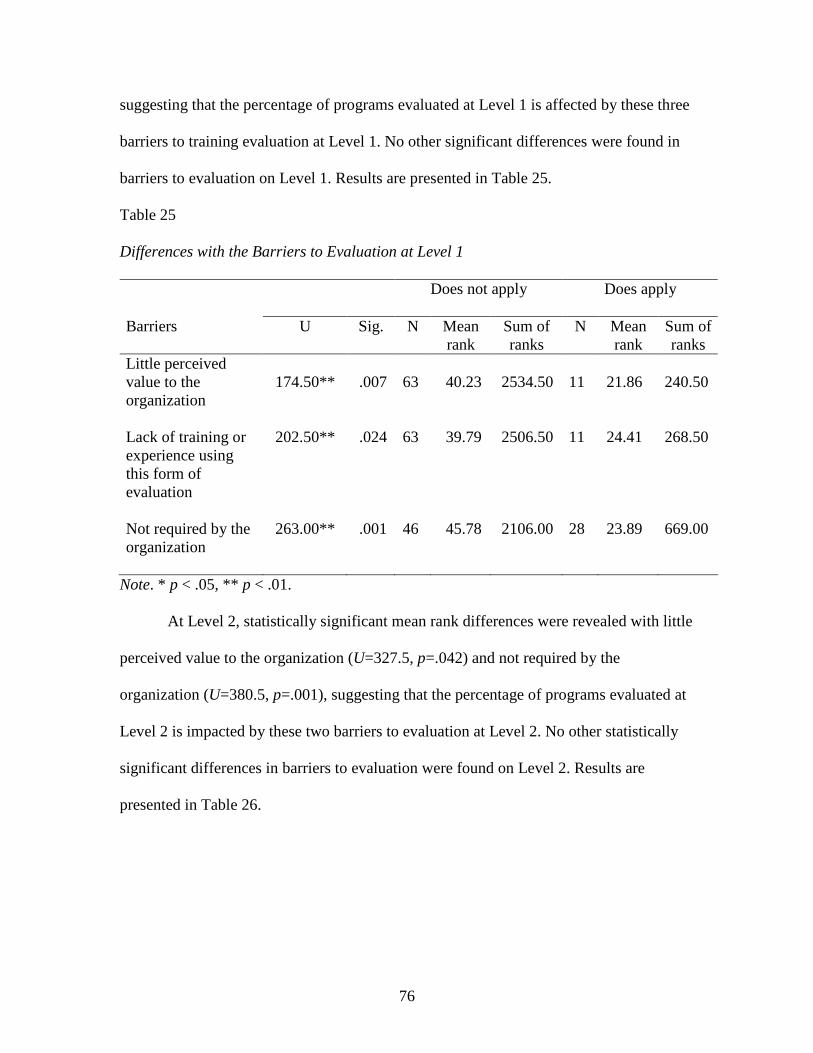
76
suggesting that the percentage of programs evaluated at Level 1 is affected by these three
barriers to training evaluation at Level 1. No other significant differences were found in
barriers to evaluation on Level 1. Results are presented in Table 25.
Table 25
Differences with the Barriers to Evaluation at Level 1
Does not apply Does apply
Barriers U Sig. N
Mean rank
Sum of ranks
N
Mean rank
Sum of ranks
Little perceived value to the organization
174.50** .007 63 40.23 2534.50 11 21.86 240.50
Lack of training or experience using this form of evaluation
202.50** .024 63 39.79 2506.50 11 24.41 268.50
Not required by the organization
263.00** .001 46 45.78 2106.00 28 23.89 669.00
Note. * p < .05, ** p < .01.
At Level 2, statistically significant mean rank differences were revealed with little
perceived value to the organization (U=327.5, p=.042) and not required by the
organization (U=380.5, p=.001), suggesting that the percentage of programs evaluated at
Level 2 is impacted by these two barriers to evaluation at Level 2. No other statistically
significant differences in barriers to evaluation were found on Level 2. Results are
presented in Table 26.

77
Table 26
Differences with the Barriers to Evaluation at Level 2
Does not apply Does apply
Barriers U Sig. N
Mean rank
Sum of ranks
N
Mean rank
Sum of ranks
Little perceived value to the organization
335.50* .049 57 40.11 2286.50 17 28.74 488.50
Not required by the organization
380.50** .001 35 46.13 1614.50 39 29.76 1160.50
Note. * p < .05, ** p < .01.
A statistically significant mean rank difference was found at Level 3 with the
barriers evaluation takes too much time from the program (U=303.0, p=.015) and not
required by the organization (U=505.5, p=.044), suggesting that the percentage of
programs evaluated at Level 3 is impacted by these two barriers to evaluating training at
Level 3. No other statistically significant differences in barriers to evaluation were found
on Level 3. Results are presented in Table 27. No statistically significant mean rank
differences were found on Level 4 evaluation use with any of the barriers to evaluation at
Level 4 (question D4).

78
Table 27
Differences with the Barriers to Evaluation at Level 3
Does not apply Does apply
Barriers U Sig. N
Mean rank
Sum of ranks
N
Mean rank
Sum of ranks
Takes too much time from the program
303.00* .015 57 34.32 1956.00 17 48.18 819.00
Not required by the organization
505.50* .044 36 42.46 1528.50 38 32.80 1246.50
Note. * p < .05.
Statistically significant mean rank differences were found on Level 5, ROI,
evaluation with the barriers little perceived value to the organization (U=434.0, p=.036)
and not required by the organization (U=497.5, p=028), suggesting that the percentage of
programs evaluated at Level 5 is impacted by these two barriers to evaluating training at
Level 5. No other statistically significant differences in barriers to evaluation were found
on Level 5. Results are presented in Table 28.
Table 28
Differences with the Barriers to Evaluation at Level 5, ROI
Does not apply Does apply
Barriers U Sig. N
Mean rank
Sum of ranks
N
Mean rank
Sum of ranks
Little perceived value to the organization
434.00* .036 53 39.81 2110.00 21 31.67 665.00
Not required by the organization
497.50* .028 27 42.57 1149.50 47 34.59 1625.50
Note. * p < .05.

79
General Comments
Respondents were asked to provide any general thoughts or comments regarding
this research study and/or any specific items of interest not included in the survey. A full
list of comments is presented in Appendix R. Although there were only a few comments,
overall the comments were supportive of the research study, and respondents indicated an
interest in the results.
Summary
This chapter reported the study findings including demographic data and
descriptive statistics that were used to answer the research questions. Means and
frequencies were used to answer research questions 1 and 2. Statistical tests were used to
test the four research hypotheses. The statistical tests used in this study included Mann-
Whitney U test, Kruskal-Wallis H test, Pearson correlation, Spearman rho correlation,
and point biserial correlation. Post hoc tests were also utilized. All four null hypotheses
were rejected by the researcher. Post hoc Mann-Whitney U tests were conducted on
hypothesis 3. Chapter 5 presents a summary of the study’s findings, conclusions, and
recommendations.

80
CHAPTER 5
SUMMARY OF FINDINGS, CONCLUSIONS,
AND RECOMMENDATIONS
Overview
This chapter includes five sections: (a) Summary of Findings, (b) Discussion of
Findings, (c) Limitations of the Results, (d) Conclusions, and (e) Recommendations. In
the Summary of Findings, the researcher provides an overview of the research
methodology and results. The Discussion of Findings section provides a discussion of the
findings for the two research questions and four hypotheses. Limitations of the Results
discusses the limitations in interpretation of the results. The Conclusion section discusses
inferences drawn from the results. The Recommendations section provides
recommendations for practice and for further research.
Summary of Findings
The purpose of this study was to examine training evaluation practices in the
United States nonprofit sector organizations. The study provides a framework for training
evaluation in nonprofit sector organizations and recommendations for overcoming
barriers to implementing training evaluation and ROI.
The pool of potential respondents was comprised of 879 nonprofit sector
individuals who are members of, or expressed an interest in membership in, the American
Society for Training and Development. Using Dillman’s (2000) tailored design method, a
mail questionnaire was sent to the potential respondents. Seventy-four (9%) useable
surveys were returned. Survey data were entered into SPSS by the researcher. The data
for research questions 1 and 2 were analyzed using frequencies and mean averages. Data

81
for hypotheses 1 through 4 were analyzed using Pearson correlation, Spearman rho
correlation, point biserial correlation, the Mann-Whitney U test, and the Kruskal-Wallis
H test. As a result of the analyses, the researcher rejected null hypotheses 1 through 4. A
post hoc analysis was conducted on hypothesis 3 (academic degree) and the percentage of
evaluation conducted at Level 3. The results revealed that respondents with a master’s
degree had a significantly larger mean rank compared to those with a bachelor’s degree
and doctorate degree.
Discussion of Findings
Research Questions
1. What are the predominant levels of training evaluation conducted in the
United States nonprofit sector organizations?
The results of the study show that nonprofit sector employer-sponsored training is
evaluated predominantly at Level 1 and Level 2. This supports the findings of P.P.
Phillips’s (2003) study in public sector organizations, as well as Twitchell (1997), Hill
(1999), Blanchard et al. (2000), Gomez (2003), Sugure and Kim (2004), and Sugrue and
Rivera (2005). Phillips’s study showed that 72.18% evaluate at Level 1; 31.65% evaluate
at Level 2; 20.42% evaluate training at Level 3; 12.21% evaluate at Level 4; and 5.26%
evaluate training at Level 5. Other studies (Gomez, 2003; Hill, 1999; Twitchell, 1997) on
training evaluation use also showed a decreasing use of training evaluation from Level 1,
the highest reported use, to Level 5, the least reported level of evaluation. Twitchell’s
study of U.S. business and industry organizations included Level 5, ROI, in Level 4.
Table 29 compares the use of training evaluation in nonprofit sector organizations versus
private and public organizations.
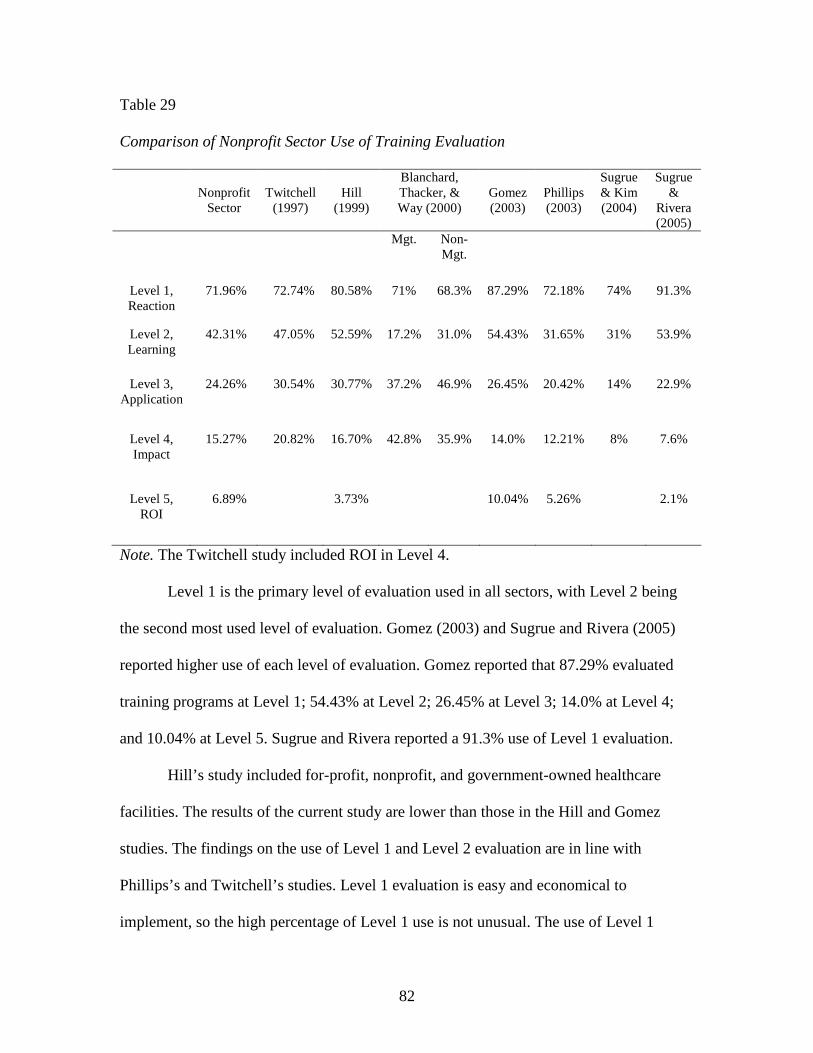
82
Table 29 Comparison of Nonprofit Sector Use of Training Evaluation
Nonprofit
Sector
Twitchell
(1997)
Hill
(1999)
Blanchard, Thacker, & Way (2000)
Gomez (2003)
Phillips (2003)
Sugrue & Kim (2004)
Sugrue &
Rivera (2005)
Mgt. Non-Mgt.
Level 1, Reaction
71.96% 72.74% 80.58% 71% 68.3% 87.29% 72.18% 74% 91.3%
Level 2, Learning
42.31% 47.05% 52.59% 17.2% 31.0% 54.43% 31.65% 31% 53.9%
Level 3, Application
24.26% 30.54% 30.77% 37.2% 46.9% 26.45% 20.42% 14% 22.9%
Level 4, Impact
15.27% 20.82% 16.70% 42.8% 35.9% 14.0% 12.21% 8% 7.6%
Level 5, ROI
6.89% 3.73% 10.04% 5.26% 2.1%
Note. The Twitchell study included ROI in Level 4.
Level 1 is the primary level of evaluation used in all sectors, with Level 2 being
the second most used level of evaluation. Gomez (2003) and Sugrue and Rivera (2005)
reported higher use of each level of evaluation. Gomez reported that 87.29% evaluated
training programs at Level 1; 54.43% at Level 2; 26.45% at Level 3; 14.0% at Level 4;
and 10.04% at Level 5. Sugrue and Rivera reported a 91.3% use of Level 1 evaluation.
Hill’s study included for-profit, nonprofit, and government-owned healthcare
facilities. The results of the current study are lower than those in the Hill and Gomez
studies. The findings on the use of Level 1 and Level 2 evaluation are in line with
Phillips’s and Twitchell’s studies. Level 1 evaluation is easy and economical to
implement, so the high percentage of Level 1 use is not unusual. The use of Level 1
83
evaluation has come under criticism by researchers. Kirkpatrick’s (1975) early work
focused on Level 1 evaluation as a tool to determine how well the participants liked the
program. Since that time, researchers have attempted to show correlation between Level
1 and the other levels of evaluation. The results of those studies (Bledose, 1999; Warr et
al., 1999; Warr & Bunce, 1995) have shown weak or no relationship between Level 1 and
the other measures of evaluation.
2. What standard methods of evaluating training are being used in nonprofit
sector organizations?
Level 1 evaluation is typically conducted using a questionnaire at the end of the
training program. Fifty respondents indicated they use reaction questionnaires to evaluate
training 80-100% of the time. Reaction questionnaires are a popular method to evaluate
training at the end of the training program. Only 2 respondents indicated using action
plans to evaluate Level 1, reaction, in 80-100% of their programs. While action plans can
be used to evaluate training at Level 1, they are better used to assess Level 3, application,
Level 4, results, and Level 5, ROI (J.J. Phillips & P.P. Phillips, 2003).
At Level 2, nonprofit sector organizations use a variety of methods to evaluate
training. The top two methods used 80-100% of the time were self-assessment and
facilitator/instructor assessment. Facilitator/instructor assessment was the most frequently
used method of evaluating at Level 2 in Hill’s (1999) healthcare study and P.P. Phillips’s
(2003) public sector study. Gomez’s (2003) study of financial organizations and
Twitchell’s (1997) study of business and industry reported more frequent use of skill
demonstrations. Even though written tests are a more objective method of evaluating
training at Level 2, nonprofit organizations leaned toward more subjective measures.

84
Three respondents indicated using written pre/post-test and three respondents indicated
using written post-test only as methods of evaluating 80-100% of their programs at Level
2.
Performance appraisals (10 responses), assessment by the trainee’s supervisor (9
responses), and observation (8 responses) are the top three methods used by nonprofit
organizations to evaluate Level 3, on-the-job application 80-100% of the time. The same
three methods were listed as the top methods in Gomez’s (2003) financial services study,
Hill’s (1999) healthcare study, and P.P. Phillips’s (2003) public sector study. Observation
and performance appraisals were the most frequently used methods as reported by
Twitchell’s (1997) business and industry study. Although performance appraisals,
assessment by trainee’s supervisor, and observation are the top three methods of
evaluating Level 3, each method represents less than 10% of survey respondents in the
current study. Many of the methods reflected a high number of 0% (non-use).
Performance appraisals are typically used by organizations to assess performance
on an annual or semi-annual basis rather than as a means to evaluate behavior change
related to training. However, performance appraisals may include information that came
from observing behavior change and assessing the application of new skills related to
training. This may be the reason performance appraisals are listed as one of the top three
methods for evaluating application of training for the previous studies and current
research study.
Improved quality is the method predominantly used by nonprofit organizations in
the study to evaluate organizational outcomes. Ten respondents indicated they use this
method of evaluation 80-100% of the time. Compliance with federal, state, and local
85
regulations (8 responses) and customer satisfaction (7 responses) are the next two most
frequently used methods to evaluate Level 4 80-100% of the time. Since nonprofit
organizations are service organizations and often operate with federal, state or local
grants, it is not surprising to see these three methods as the most often used methods to
evaluate organizational outcomes. In P.P. Phillips’s (2003) public sector study and Hill’s
(1999) healthcare study, compliance with regulations was also at the top of the list of
Level 4 methods of evaluation. Both groups are highly regulated by local, state, and
federal regulations. Gomez’s (2003) financial services study and Twitchell’s (1997)
business and industry study both indicated productivity estimates as the top method used
to evaluate Level 4, organizational outcomes. The focus on productivity measures makes
sense for the target audience since both studies focused on for-profit business and
industry organizations.
Only 3 respondents out of the 29 survey respondents who evaluate at Level 4
isolate the effects of the program when evaluating organizational outcomes. Isolating the
effects of the program is a critical step in the evaluation process (J.J. Phillips, 1997a).
When participants do isolate the effects of the program, they use customer/client input
(10 responses) 80-100% of the time. Seven respondents use participant estimates and 7
reported using management estimates 80-100% of the time. Customer/client input,
participant estimates, and management estimates are subjective measures. Adjusting the
estimates for the participant’s confidence ensures a more conservative approach (J.J.
Phillips, 1996b). More scientific approaches to isolating the effects of the program such
as use of control groups, trend line analysis, and forecasting methods are not used by any
of the respondents 80-100% of the time. From this researcher’s experience, these
86
methods take additional time, resources, and training to understand the methods and how
to implement the techniques.
Fifteen respondents (6.89%) indicated that they evaluate their training at Level 5,
ROI. Only 6 respondents indicated that they evaluate their programs 80-100% of the time
by choosing various methods. Six of those responding in the 80-100% category selected
traditional ROI methods or cost-benefit analysis as the methods most often used to
evaluate at Level 5. Cost-benefit analysis does incorporate financial measures as does the
traditional ROI method. Cost-benefit analysis was cited as the most often used method in
Hill’s (1999) study as well as P.P. Phillips’s (2003) study. While fewer than 3% of the
respondents in Gomez’s (2003) study reported using any return on investment method to
evaluate Level 5, the method used most often 80-100% of the time was also cost-benefit
analysis.
Respondents identified specific criteria for selecting programs to evaluate at Level
5. The top criterion identified for selecting programs to evaluate at Level 5 was important
to strategic objectives of the organization, with 21 (45.7%) of the respondents choosing
this as the most important criteria. The second most important criteria were have the
interest of top executives (9 responses) and links to operational goals and issues (9
responses). Important to strategic objectives and links to operational goals and issues are
aligned with the top two criteria found in Hill’s (1999) study and P.P. Phillips’s (2003)
study. Both criteria suggest that these programs are important to the overall strategy of
the organization. This suggests that resources should be set aside to evaluate the
investment of these programs to ensure that the programs are targeting the goals of the
organization.

87
Respondents were also asked to indicate the most important criteria for selecting
methods to evaluate Level 5. The top criterion in the study is credible with 13 (24.1%) of
those responding selecting this method. The second most important criterion selected was
simple with 12 (22.6%) of those responding selecting this criteria. These two criteria are
also the top two criteria identified in both Hill’s (1999) study and P.P. Phillips’s (2003)
study. Time was listed as a barrier to conducting evaluation. If the evaluation process is
too complicated and takes too long to conduct, training professionals will either not
attempt the evaluation or will become frustrated and abandon the evaluation process.
Trainers want a simple and pragmatic process to use to evaluate training.
H01A: There is no statistically significant difference between the percentage of
evaluation conducted at each of the five levels of evaluation and nonprofit
sector organizational characteristics
Use of the five levels of evaluation is associated with nonprofit sector
organizational characteristics. Organizational characteristics are defined as the existence
of an evaluation policy, the type of organization, the size of the organization, the number
of employees working in the United States, the number of employees trained per year,
and the total dollars invested in training as defined by the annual training budget. A
higher percentage of evaluation is conducted at Level 2 when an evaluation policy is in
place (U=233.5, p=.007). No other statistically significant differences were found on the
other levels of evaluation. Phillips (2003) found that significantly higher levels of
evaluation are conducted at all levels when an evaluation policy is in place.
88
H01B: There is no statistically significant relationship between the percentage of
evaluation conducted at each of the five levels of evaluation and nonprofit
sector organizational characteristics
The study found no statistically significant relationship between the five levels of
evaluation use and the number of employees working in the United States, the number of
U.S. employees participating in training last year, or the annual training budget. P.P.
Phillips (2003) found a weak relationship (r=.172) between the annual training budget
and Level 2 evaluation. No other levels of evaluation were associated with the annual
training budget in her study. No differences were found on any of the five levels of
evaluation with the type of nonprofit sector organization. Results show no mean rank
differences on the use of each of the five levels by the type of nonprofit sector
organization.
No association existed between any of the five levels of evaluation and the size of
the nonprofit sector organization. Hill’s (1999) study showed that in healthcare
organizations, there was a significantly higher use of Level 1 evaluation by organizations
with 3,000-4,999 employees and those organizations with over 20,000 employees than
with organizations with 1-500 employees. P.P. Phillips’s (2003) public sector study also
found similar differences in the use of Level 1 evaluation. In public sector organizations,
there was a significantly higher use of Level 1 evaluation by all of the larger
organizations than by those with 1-500 employees. Phillips also found significantly
higher use of Level 2 evaluation by organizations with 10,001-20,000 employees than
those with 1-500 employees. Organizations in the public sector study with over 20,000
employees had a significantly higher use of Level 4 evaluation than those with 1-500
89
employees. Over half (66%) of the organizations in the current study have 1-500
employees. Ninety-one percent of the nonprofit organizations in the current study have
fewer than 3,000 employees. In Hill’s study, 52% of the organizations reported fewer
than 3,000 employees; 52% of the organizations in Twitchell’s (1997) study reported
fewer than 3,000 employees; and in Phillips’s study, 74% of the organizations reported
fewer than 3,000 employees.
H02: There is no statistically significant difference between the percentage of
evaluation conducted at each of the five levels of evaluation and nonprofit
sector training practices
The use of the five levels of evaluation is associated with nonprofit sector training
practices, which are defined as the need for training and the training process. The training
process includes the timing of evaluation planning, evaluation reporting, and the
percentage of employees responsible for evaluating training. Respondents were asked to
indicate why participants are sent to training. Use of Level 4 evaluation is associated with
employees attend in order to perform at a set level (rs=.25) and change in organizational
outcomes is expected (rs=.25). P.P. Phillips (2003) found associations between each level
of evaluation and the need for training. Gomez (2003) found relationships at Level 3
(r=.439) and Level 4 (r=.481) with change in organizational outcomes will result.
The training process includes the timing of evaluation planning, evaluation
reporting, and the percentage of employees responsible for training. Levels 1 through 4
are associated with most of the steps in the evaluation process. There is no association at
Level 5 and any of the steps in evaluation planning. There was no relationship at any of
the levels and when results are to be documented. The strongest relationship exists
90
between Level 3 evaluation and planning evaluation prior to program development
(rs=.49). Planning evaluation is associated with Levels 1 through 4, indicating that
evaluation use is higher when planning evaluation prior to program development. The
relationship between Levels 1 through 4 with planning evaluation prior to or during
program development suggests that nonprofit sector organizations are giving some
thought to the evaluation process early in the program development stage. Phillips (2003)
also found associations between the five levels of evaluation and the timing of evaluation
planning. The public sector study found the strongest associations between Level 3 and as
the first step in program development and prior to program development, and Level 4 and
as the first step in program development. Hill’s (1999) study found that planning occurs
most frequently during program development.
The current study found that higher levels of evaluation use were reported when
the evaluation information was reported to executive management. The strongest
relationships exist between Level 3 (rpb=.39) and Level 5 (rpb=.36) when evaluation
information is reported to executive management. P.P. Phillips (2003) found higher use
of each level of evaluation when participants did report evaluation information to
management. Gomez (2003) found no difference in the use of evaluation at each level
when participants did or did not report findings to management.
To examine other training practices in nonprofit sector organizations, respondents
were asked to indicate the percentage of staff involved in training evaluation. Level 1
(rs=.38) and Level 2 (rs=.36) evaluation use were associated with the number of training
staff involved in evaluation. Higher levels of evaluation use are noted when the number
of training staff involved in the evaluation process increases. Phillips (2003) noted a

91
significant relationship between all levels of evaluation and percentage of training staff
involved in training.
Training practices in organizations also includes deciding on the criteria to use to
evaluate at Level 5. It also includes deciding on the criteria for selecting the ROI methods
to be used. The top criteria for selecting programs to be evaluated at Level 5 are linked to
strategic objectives and operational goals. Phillips (2003) found similar results in the
public sector study. Since public sector organizations and nonprofit sector organizations
do not operate for a profit, aligning training to strategic goals and objectives is important
to overall success. As in the Phillips study, the current study found that training
professionals look for credible yet simple methods to use to evaluate at Level 5, ROI.
H03A: There is no statistically significant difference between the percentage of
evaluation conducted at each of the five levels of evaluation and manager
experience
The use of the five levels of evaluation is associated with the experience of the
HRD manager. In this study, manager experience is defined as the title of the respondent,
the number of years he or she has been in the organization, the number of years working
in training, and the academic preparation of the respondent. The analysis showed no
statistically significant differences with any of the five levels of evaluation and the
respondent’s job title. This suggests that the job title of the respondents does not
influence the use of any of the five levels of evaluation. Phillips (2003) found differences
at Level 1 and Level 4 with the title of public sector respondents.
Survey question G12 asked respondents to indicate their level of academic
preparation by selecting associate degree, bachelor’s degree, master’s degree, doctoral
92
degree, or other academic preparation. The results of the Kruskal-Wallis ANOVA H test
indicated a statistically significant mean rank difference on Level 3 and academic
preparation. The post hoc test indicated that the master’s degree (χ2=12.82, p<.05) had a
significantly higher mean rank compared to bachelor’s degree or doctorate. Those with a
master’s degree reported a higher Level 3 evaluation use than those with other academic
preparations. Phillips (2003) found an association with Level 5 evaluation use and
academic preparation (F=4.113, p<.007).
H03B: There is no statistically significant relationship between the percentage of
evaluation conducted at each of the five levels of evaluation and manager
experience
The number of years respondents have been working in their current organization
and the number of years they have been involved in a training function are also indicators
of manager experience. No statistically significant relationships were found between the
number of years in the organization and any of the five levels of evaluation use. Phillips
(2003) found no significant relationships between number of years in the organization
and any of the five levels of evaluation use. The current study also found no statistically
significant relationship between the number of years in a training function and any of the
five levels of evaluation use. Phillips, however, found a statistically significant
association between the percentage of evaluation conducted at Level 4 and the years in
the training function (F=3.086, p<.027).
H04: There is no statistically significant difference between the barriers to training
evaluation in nonprofit sector organizations and each level of training
evaluation conducted
93
Nonprofit sector organizations report using the five levels of evaluation, but
increased use could result if barriers to training evaluation are removed. The top reason
for not evaluating at all five levels of evaluation is not required by the organization. Hill’s
(1999) healthcare study and P.P. Phillips’s (2003) public sector study both included not
required by the organization as one of the top reasons for not evaluating training. Lack of
training or experience using this form of evaluation and cost in person-hours and/or
capital also top the list of reasons nonprofit sector organizations do not evaluate at the
various levels of evaluation. This supports the findings by Hill and Phillips in previous
studies.
To examine whether differences exist on the barriers to training evaluation by any
of the five levels, Mann-Whitney U tests were conducted. At Level 1, reaction and
planned action, there are significant differences with little perceived value to the
organization, lack of training or experience using this form of evaluation, and not
required by the organization. The percentage of programs evaluated at Level 1 is
impacted by these barriers. Those respondents who experience these barriers are less
likely to evaluate at Level 1. Phillips (2003) found cost, training is done only to meet
legal requirements, and not required by the organization associated with Level 1
evaluation use.
At Level 2, the barriers little perceived value to the organization and not required
by the organization were statistically significantly different from the other barriers. These
barriers go hand-in-hand and send the message that this level of evaluation is not
important. Phillips (2003) found cost, lack of training or experience, and not required by
the organization associated with Level 2 evaluation. Level 3 evaluation is impacted by
94
the barriers evaluation takes too much time and not required by the organization. Phillips
found that not required by the organization as well as cost and lack of training or
experience impact the use of Level 3 evaluation in the public sector. No statistically
significant differences in barriers were found on Level 4 evaluation use. Phillips,
however, found significant differences in the barriers cost, lack of training or experience
in using this form of evaluation, and not required by the organization with Level 4
evaluation use. At Level 5, the current study found differences with the barriers little
perceived value and not required by the organization suggesting that respondents do not
evaluate at Level 5 when they do not see any real value and are not required by anyone to
show return on investment. The only difference Phillips found at Level 5 was with the
barrier cost in person-hours and/or capital.
Limitations of the Results
Caution should be taken in the conclusions drawn from the findings of the current
study. The study was limited by the low response rate (n=74) for the size of the study
population (N=879). The low response rate affected the results and generalizability of the
study.
Another limitation of the study was the use of nonparametric statistics. With the
exception of the Mann-Whitney U test, nonparametric statistics are less powerful than
their parametric analyses equivalent. Parametric statistics have greater power to detect
significant differences. The Mann-Whitney U test and its parametric equivalent t test are
both powerful tests.
Conclusions
95
Based on four previous studies conducted on training evaluation practices in
financial services, healthcare, public sector, and business and industry (Gomez, 2003;
Hill, 1999; P.P. Phillips, 2003; Twitchell, 1997), and training evaluation literature, a
conceptual framework for training evaluation was examined. The framework suggests
that if (a) organizations meet similar characteristics as previous organizations studied; (b)
stakeholders see evaluation as adding value; (c) managers responsible for training are
experienced in training and training evaluation; (d) the training process incorporates
training evaluation as an important component; (e) the evaluation process is considered at
the time the need for the program is determined; (f) barriers to evaluation do not exist,
and (g) organizations follow a specific set of rules and criteria for determining the level at
which programs are evaluated, then organizations will practice a balanced approach to
training evaluation. Comparing the results of this study to the previous studies in
financial services, healthcare, public sector, and business and industry will help support
the evaluation framework.
Research Questions 1 and 2
Nonprofit sector organizations evaluate training predominantly at Level 1,
reaction and planned action, and Level 2, learning. The methods used to evaluate at these
levels are reaction questionnaires (Level 1) and self-assessment and facilitator/instructor
assessment (Level 2). Level 1 and Level 2 evaluations are easier to conduct because
typically these are done before participants leave the classroom. These generally do not
require additional resources and are easy to administer. Level 1 and Level 2 evaluations
are usually conducted for the benefit of the trainer and the training department rather than
for the benefit of the client. Nonprofit sector organizations tend to use more subjective
96
methods of evaluation. Although most reaction questionnaires contain rating scales, the
assessment is a more subjective method and can be based on factors other than the worth
of the class. There is some use of Levels 3, 4, and 5 in the nonprofit sector. When
respondents do evaluate at Level 4, they tend to use subjective measures to isolate the
effects of training. Customer/client input, participant estimates, and management
estimates top the list of methods participants use to isolate the effects of training.
Hypothesis 1
The existence of a written evaluation policy is an important organizational
characteristic in regard to Level 2 evaluation. Nonprofit sector organizations report a
higher use of Level 2 evaluation when a written policy exists that guides the evaluation
process. A written policy might have a greater impact on evaluation use at Levels 3 and 4
in nonprofit sector organizations. The significance between a written policy and Level 2
is encouraging.
Hypothesis 2
Training evaluation is an important part of the training process. The training
process is defined as the timing of evaluation planning, evaluation reporting, and
percentage of employees responsible for evaluating training. The results of this study
show that evaluation planning for Levels 1, 2, 3, and 4 begins prior to program
development. Planning evaluation prior to developing the training program can save time
and resources later. With limited resources such as money and people, nonprofit
organizations must maximize the effectiveness of their training programs. Planning prior
to the program development can also help ensure that the program materials are tied to
the objectives of the program. Another aspect of the training process addresses whether
97
the results of evaluation are reported to executive management. It is reassuring to find a
positive relationship between each level of evaluation and the fact that evaluation results
are reported to management. The results also show that there is a positive relationship in
the number of staff involved in training with Levels 1 and 2. Since Levels 1 and 2 have a
high percentage of use and are easy to conduct, the significant relationship is not a
surprise.
Selecting programs to evaluate at Level 5 is reserved for select programs.
Training programs should be important to strategic objectives, have the interest of top
management, and linked to operational goals and issues before being considered for
Level 5 evaluation. Nonprofit organizations should target programs for Level 5
evaluation that are visible and can impact the strategy of the organization. Nonprofit
training professionals should also choose Level 5 evaluation methods that are not only
credible but also simple. Training professionals in any industry or sector are more likely
to use evaluation methods that are easy to use. With limited time and resources,
evaluation methods must be pragmatic and easily understood.
Hypothesis 3
The academic preparation of managers in nonprofit organizations is important
with regard to Level 3 evaluation. Understanding how to assess behavior change in
training participants once they return to work is an important catalyst to conducting
evaluation at higher levels. An advanced degree may help nonprofit training professionals
understand Level 3 evaluation. It may also have given the training professionals exposure
to training evaluation projects through graduate coursework.
Hypothesis 4

98
If barriers to conducting training evaluation exist, training professionals may have
a hard time conducting evaluations or may choose to skip them. The most significant
barriers to training evaluation in the nonprofit sector are not required by the organization
and lack of training or experience using this form of evaluation. This goes back to the
existence of a written evaluation policy. If an evaluation policy exists in the organization,
training evaluation will be required. If training evaluation is required in the organization,
training staff will be encouraged and supported to learn how to conduct training
evaluation. With limited budget and resources in the nonprofit sector, effort is not given
to training evaluation. If evaluation is supported and encouraged by management,
evidence can be shown that a program is contributing to the strategic goals and objectives
of the organization.
Recommendations
Based on the findings and conclusions of this research study on training
evaluation in the nonprofit sector, the following recommendations for practice are
presented in order of importance.
Recommendations for Practice
Develop an evaluation policy. Although Level 2 was the only level of evaluation
that was associated with the existence of an evaluation policy, the existence of a policy
would encourage several other factors related to evaluation. The existence of an
evaluation policy would involve executive management, which will help them understand
evaluation and the reasons it is important. With their involvement, more effort will be put
into training the staff on evaluation. The written policy will also spell out which

99
programs should be evaluated and at which levels. Not all programs should be evaluated
at all five levels.
Encourage participation in evaluation seminars. Lack of training evaluation
experience was identified as a barrier to training evaluation. ASTD and The America
Evaluation Association provide valuable resources on their respective Web sites. They
also provide regional and international learning seminars and Webinars on evaluation.
The ASTD ROI Network is available to all ASTD members in the nonprofit and for-
profit sectors. The ROI Institute is also a valuable resource for training evaluation and
ROI.
Expand Level 1 evaluation. The traditional Level 1 evaluation questionnaire can
be expanded to include planned action. Participants can be given the opportunity to
identify how they will apply the training to their work, which can be an easy way to
capture data for Level 3 and possible Level 4 evaluation. This takes the reaction
questionnaire beyond how well the participants like the program. With subjective
measures in the traditional questionnaire, the added utility measures add a little more
credibility and objectivity to the Level 1 evaluation process.
Recommendations for Further Research
The objective of this research project was to describe training evaluation practices
in the U.S. nonprofit sector. This study attempted to further validate the framework for
evaluation based on previous research (Gomez, 2003; Hill, 1999; P.P. Phillips, 2003;
Twitchell, 1997). The study also provided a glimpse of nonprofit organizational
evaluation practices. The findings in this study lend themselves to further research. The
recommendations for further research are presented in no particular order.

100
Evaluation of international nonprofit organization. The current study focused on
evaluation practices in the U.S. nonprofit sector. Will the evaluation framework for U.S.
nonprofit sector organizations hold true for international nonprofit organizations? A look
at nonprofit sector organizations outside the United States may provide a look at best
practices that can be applied to U.S. organizations. With the growth of ASTD and ISPI
outside the United States, evaluation has become a topic of interest around the world.
Stakeholder perspective on training evaluation. Michalski and Cousins (2001)
provided an introduction to stakeholder perspective in training evaluation. P.P. Phillips
(2003) included stakeholder perspective as a variable in the public sector study. While
she found no association between stakeholder perspective and any of the five levels of
evaluation, it would be important to study in the nonprofit sector. Nonprofit sector
organizations operate with donations or grant money, and these providers of funds want
to know how their money is being spent. Including them in the study could give valuable
insight into nonprofit sector training practices.
Training evaluation in academics. Higher education institutions may be for-profit,
nonprofit, or state government affiliated. Educational institutions are in the business of
educating. Are they evaluating their own programs? Are they evaluating any employee
training? Academic institutions are also facing budget constraints much like the nonprofit
sector. Money for higher education is donated, granted, or given by state and federal
governments for operation, which creates accountability issues in higher education.

101
APPENDIX A
SURVEY OF TRAINING
EVALUATION IN THE NONPROFIT SECTOR
102
SURVEY OF TRAINING EVALUATION
IN THE NONPROFIT SECTOR
Thank you for participating in this survey research project. This survey gathers data on training evaluation in nonprofit sector organizations and is adapted from a survey developed by Dr. Patricia Phillips in Training Evaluation in the Public Sector. It will take you approximately 30 minutes to complete the survey. Herein, “training” includes any employer-sponsored education/training that addresses knowledge and skills needed for nonprofit sector employee development. This includes both employer-delivered and contractor-provided training. Sections A-E respectively address reaction, learning, on-the-job application, organizational outcomes, and return on investment. Section F addresses general evaluation practices within the organization. Section G gathers general and demographic data. If your duties include education/training outside the United States, please respond based only on education/training that occurs in the United States. Participation in this research is completely voluntary and participation may be discontinued at any time without penalty or prejudice. This study does not involve any reasonably foreseeable risks. The Survey Form # listed at the top of the survey form is used to secure sampling adequacy, facilitate follow-up on unreturned surveys, and to ensure that the first 200 respondents receive a copy of Return on Investment Basics (2005). All respondents will receive a summary copy of the results. To maintain confidentiality, the survey # will be removed from the survey. The survey # and the list that matches your name to the Survey Form # will be destroyed after responses are coded and a mailing list is compiled for survey results. No individual response information will be released to anyone before or after this list is destroyed. After completion of the research project, the individual responses will be destroyed and only summary information will retained. This project has been reviewed and approved by the University of North Texas Institutional Review Board (IRB), which ensures that research projects involving human subjects follow federal regulations. Any questions or concerns about your rights as a research participant should be directed to the UNT IRB, P.O. Box 305250, Denton, TX 76203-5250, (940) 565-3940.
If you have questions regarding this research project, please contact: Travis K. Brewer PO Box 190136
Dallas, TX 75219-0136 Telephone: 214-207-3652
E-mail: [email protected]

103
A1. What percentage of your organization’s currently active training programs use participant reaction forms or other methods to gain information on participants’ post- training thoughts or feelings about various aspects of a program such as content, instruction, facilities, materials, or usefulness?
__________% If you entered 0% for question A1, please skip to question A4. A2. Please estimate the percentage of programs in which your organization uses each of the various methods listed on the left to evaluate reaction. Please circle the number corresponding to the percentage of use of each method listed. If you do not use a method, please circle 1. 0% 1-19 20-39 40-59 60-79 80-100% Reaction questionnaires 1 2 3 4 5 6 Action plans 1 2 3 4 5 6 In the space below, please write in any additional methods used and circle the number corresponding to the percent of use. 0% 1-19 20-39 40-59 60-79 80-100% __________________________ 1 2 3 4 5 6 __________________________ 1 2 3 4 5 6 A3. Please score the following on a 1 to 5 scale by checking the appropriate box.
1 = Extremely Unimportant; 5 = Extremely Important. How important are measures of participant reaction in: 1 2 3 4 5 Improving processes to track participant progression with skills
� � � � �
Building stronger commitment to training by key stakeholders
� � � � �
Improving facilitator performance � � � � � Improving programs � � � � � Eliminating unsuccessful programs � � � � � Making investment decisions � � � � � Demonstrating value � � � � � Boosting program credibility � � � � �
Section A: Measures of Reaction
Section A relates to the use of participant reaction forms to measure participants’ post-training reaction and satisfaction with course content, instructors, facilities, audio-visual equipment and, in some cases, how the participants plan to use the information from the program.

104
A4. When you do not evaluate participant reaction to a training program, what are the reasons? Check all that apply. � Little perceived value to the organization � Not required by the organization � The cost in person-hours and/or capital � Policy prohibits the evaluation of
organization staff by the training department � Evaluation takes too much time from the
program � Training is done only to meet legal
requirements � Lack of training or experience in using this
form of evaluation � Union opposition
� Unavailability of data needed for this form of evaluation
Other reasons: ________________________________________________________________________ Comments: ________________________________________________________________________ B1. What percentage of your organization’s currently active training programs use evaluation to measure learning resulting from training?
__________%
If you entered 0% for question B1 above, please skip to question B4. B2. Please estimate the percentage of programs in which your organization uses each of the various methods listed below to evaluate learning. Please circle the number corresponding to the percentage of use. 0% 1-19 20-39 40-59 60-79 80-100% Written pre-test/post-test 1 2 3 4 5 6 Written post-test only 1 2 3 4 5 6 Simulation 1 2 3 4 5 6 Work samples 1 2 3 4 5 6 Skill demonstrations 1 2 3 4 5 6 On-the-job demonstration 1 2 3 4 5 6 Self assessment 1 2 3 4 5 6 Team assessment 1 2 3 4 5 6 Facilitator/instructor assessment 1 2 3 4 5 6
Section B: Measures of Learning
Section B relates to evaluation methods that measure learning resulting from a training program.
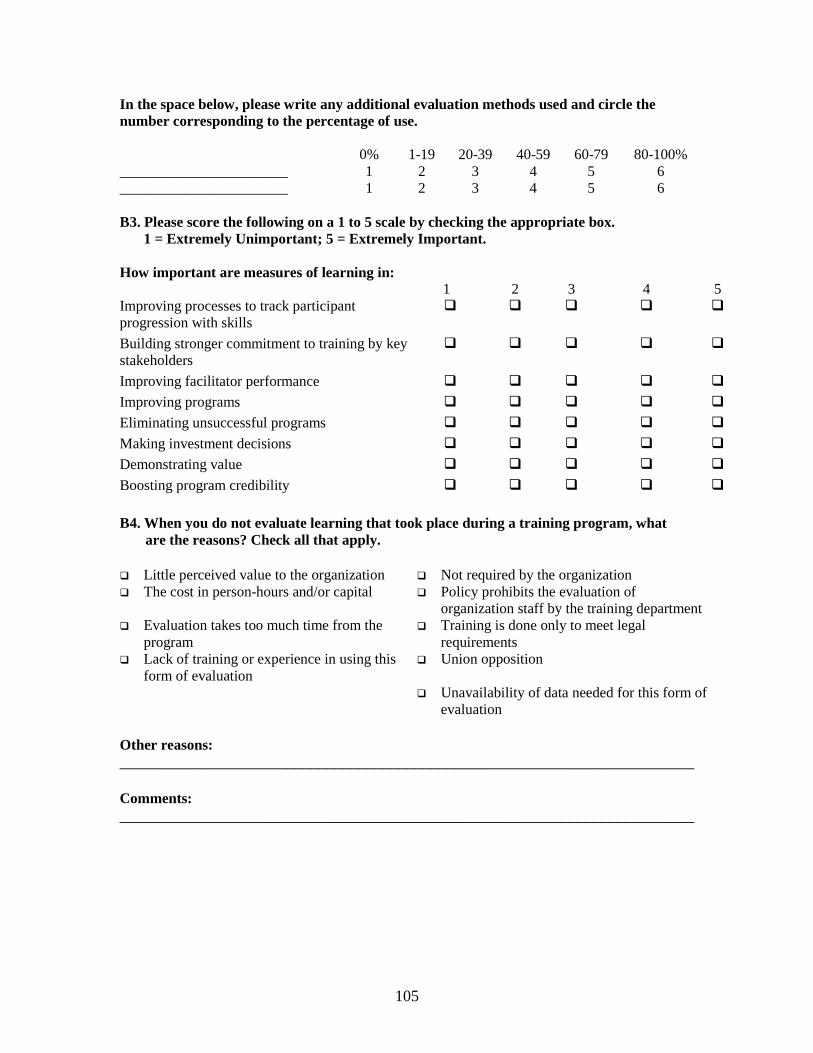
105
In the space below, please write any additional evaluation methods used and circle the number corresponding to the percentage of use. 0% 1-19 20-39 40-59 60-79 80-100% _______________________ 1 2 3 4 5 6 _______________________ 1 2 3 4 5 6 B3. Please score the following on a 1 to 5 scale by checking the appropriate box.
1 = Extremely Unimportant; 5 = Extremely Important. How important are measures of learning in: 1 2 3 4 5 Improving processes to track participant progression with skills
� � � � �
Building stronger commitment to training by key stakeholders
� � � � �
Improving facilitator performance � � � � � Improving programs � � � � � Eliminating unsuccessful programs � � � � � Making investment decisions � � � � � Demonstrating value � � � � � Boosting program credibility � � � � � B4. When you do not evaluate learning that took place during a training program, what are the reasons? Check all that apply. � Little perceived value to the organization � Not required by the organization � The cost in person-hours and/or capital � Policy prohibits the evaluation of
organization staff by the training department � Evaluation takes too much time from the
program � Training is done only to meet legal
requirements � Lack of training or experience in using this
form of evaluation � Union opposition
� Unavailability of data needed for this form of evaluation
Other reasons: ________________________________________________________________________ Comments: ________________________________________________________________________

106
C1. What percentage of your organization’s currently active training programs use evaluation methods that measure the amount of learning transferred to the job?
__________% If you entered 0% to question C1 above, please skip to question C4. C2. Please estimate the percentage of programs for which your organization uses each of the various methods listed below to evaluate the use of learning on the job. Please circle the number corresponding to the percentage of use. 0% 1-19 20-39 40-59 60-79 80-100% Anecdotal information 1 2 3 4 5 6 Observation 1 2 3 4 5 6 Performance appraisal 1 2 3 4 5 6 Existing records other than performance appraisal
1 2 3 4 5 6
Records produced specifically for evaluation purposes
1 2 3 4 5 6
Assessment by trainee’s subordinate 1 2 3 4 5 6 Self-assessment 1 2 3 4 5 6 Peer assessment 1 2 3 4 5 6 Assessment by trainee’s supervisor 1 2 3 4 5 6 Focus groups 1 2 3 4 5 6 Follow-up assignments 1 2 3 4 5 6 Action plans 1 2 3 4 5 6 Performance contracts with supervisor
1 2 3 4 5 6
In the space below, please write any additional evaluation methods used and circle the number corresponding to the percentage of use. 0% 1-19 20-39 40-59 60-79 80-100% _______________________ 1 2 3 4 5 6 _______________________ 1 2 3 4 5 6
Section C: Measures of On-the-Job Application
Section C relates to evaluation methods that measure the transfer of learning to the job. These measures typically take place several weeks or months after a training program and measure actual use or the knowledge or skills gained during the training program.

107
C3. Please score the following on a 1 to 5 scale by checking the appropriate box. 1 = Extremely Unimportant; 5 = Extremely Important. How important are measures of on-the-job application in: 1 2 3 4 5 Improving processes to track participant progression with skills
� � � � �
Building stronger commitment to training by key stakeholders
� � � � �
Improving facilitator performance � � � � � Improving programs � � � � � Eliminating unsuccessful programs � � � � � Making investment decisions � � � � � Demonstrating value � � � � � Boosting program credibility � � � � � C4. When you do not evaluate transfer of learning to the job after a training program, what are the reasons? Check all that apply. � Little perceived value to the organization � Not required by the organization � The cost in person-hours and/or capital � Policy prohibits the evaluation of
organization staff by the training department � Evaluation takes too much time from the
program � Training is done only to meet legal
requirements � Lack of training or experience in using this
form of evaluation � Union opposition
� Unavailability of data for this form of evaluation
Other reasons: ________________________________________________________________________ Comments: ________________________________________________________________________ D1. What percentage of your organization’s currently active training programs use evaluation methods that measure organizational outcomes that occur after a training program?
__________%
Section D: Measures of Organizational Outcomes
Section D relates to evaluation methods that measure organizational change (outcomes) due to a change in performance as a result of learning that occurred in the training program. These measures usually compare conditions prior to training to conditions after training has been completed and link the change to the training program.

108
If you entered 0% to question D1 above, please skip to question D4. D2. Please estimate the percentage of programs in which your organization uses each of the various methods listed below to evaluate organizational outcomes. Please circle the number corresponding to the percentage of use. 0% 1-19 20-39 40-59 60-79 80-100% Anecdotal information 1 2 3 4 5 6 Improved productivity 1 2 3 4 5 6 Improved quality 1 2 3 4 5 6 Improved efficiency 1 2 3 4 5 6 Cost savings 1 2 3 4 5 6 Compliance with federal, state, and local regulations
1 2 3 4 5 6
Employee satisfaction 1 2 3 4 5 6 Customer satisfaction 1 2 3 4 5 6 Isolate for effects of program 1 2 3 4 5 6 In the space below, please write any additional evaluation methods used and circle the number corresponding to the percentage of use. 0% 1-19 20-39 40-59 60-79 80-100% _______________________ 1 2 3 4 5 6 _______________________ 1 2 3 4 5 6 D3. Please score the following on a 1 to 5 scale by checking the appropriate box. 1 = Extremely Unimportant; 5 = Extremely Important. How important are measures of organizational outcomes in: 1 2 3 4 5 Improving processes to track participant progression with skills
� � � � �
Building stronger commitment to training by key stakeholders
� � � � �
Improving facilitator performance � � � � � Improving programs � � � � � Eliminating unsuccessful programs � � � � � Making investment decisions � � � � � Demonstrating value � � � � � Boosting program credibility � � � � �

109
D4. When you do not evaluate organizational outcomes resulting from a training program, what are the reasons? Check all that apply. � Little perceived value to the organization � Not required by the organization � The cost in person-hours and/or capital � Policy prohibits the evaluation of
organization staff by the training department � Evaluation takes too much time from the
program � Training is done only to meet legal
requirements � Lack of training or experience in using this
form of evaluation � Union opposition
� Unavailability of data for this form of evaluation
Other reasons: ________________________________________________________________________ Comments: ________________________________________________________________________ E1. What percentage of your organization’s currently active training programs use evaluation methods that measure return on investment (ROI)?
__________% If you entered 0% above in question E1, please skip to question E4. E2. Please estimate the percentage of currently active programs in which your organization uses each of the various methods listed below to evaluate return on investment. Please circle the number corresponding to the percentage of use (following the definitions). Definition: Traditional Return on Investment Calculation (ROI): Return on Investment (ROI) is a financial analysis method that is used to determine if resources are being used profitably. A common formula for ROI is ROI% = Net Program Benefits/Program Costs x 100. Cost Benefit Analysis: The relationship between the program benefits (returns) and program costs (associated with the investment) is often expressed as a ratio BCR = Program Benefits/Program Costs. Payback Period: Payback period represents the length of time required to recover an original amount invested through the investment’s cash flow and is expressed by the following formula: Payback Period = Initial Investment/Cash Flow Per Year.
Section E: Measures of Return on Investment
Section E relates to methods of calculating return on investment in training programs. These measures compare the monetary returns compared to the costs of investing in a training program.
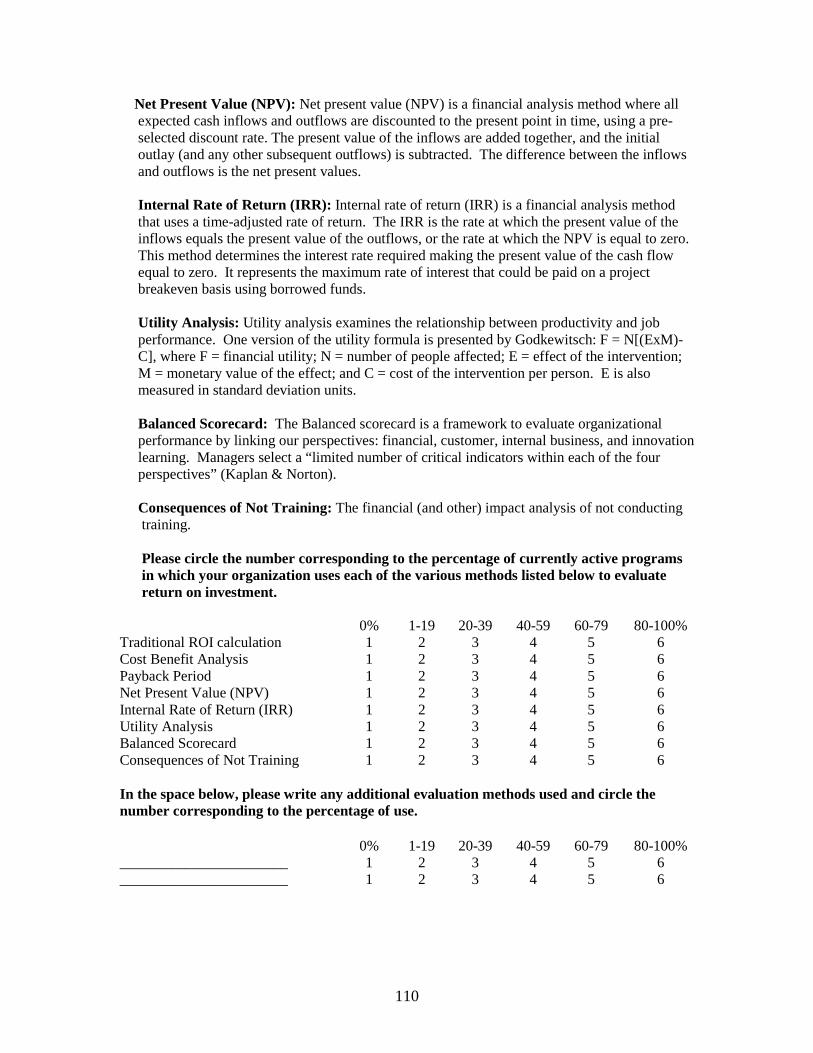
110
Net Present Value (NPV): Net present value (NPV) is a financial analysis method where all expected cash inflows and outflows are discounted to the present point in time, using a pre- selected discount rate. The present value of the inflows are added together, and the initial outlay (and any other subsequent outflows) is subtracted. The difference between the inflows and outflows is the net present values. Internal Rate of Return (IRR): Internal rate of return (IRR) is a financial analysis method that uses a time-adjusted rate of return. The IRR is the rate at which the present value of the inflows equals the present value of the outflows, or the rate at which the NPV is equal to zero. This method determines the interest rate required making the present value of the cash flow equal to zero. It represents the maximum rate of interest that could be paid on a project breakeven basis using borrowed funds. Utility Analysis: Utility analysis examines the relationship between productivity and job performance. One version of the utility formula is presented by Godkewitsch: F = N[(ExM)- C], where F = financial utility; N = number of people affected; E = effect of the intervention; M = monetary value of the effect; and C = cost of the intervention per person. E is also measured in standard deviation units. Balanced Scorecard: The Balanced scorecard is a framework to evaluate organizational performance by linking our perspectives: financial, customer, internal business, and innovation learning. Managers select a “limited number of critical indicators within each of the four perspectives” (Kaplan & Norton). Consequences of Not Training: The financial (and other) impact analysis of not conducting training. Please circle the number corresponding to the percentage of currently active programs in which your organization uses each of the various methods listed below to evaluate return on investment. 0% 1-19 20-39 40-59 60-79 80-100% Traditional ROI calculation 1 2 3 4 5 6 Cost Benefit Analysis 1 2 3 4 5 6 Payback Period 1 2 3 4 5 6 Net Present Value (NPV) 1 2 3 4 5 6 Internal Rate of Return (IRR) 1 2 3 4 5 6 Utility Analysis 1 2 3 4 5 6 Balanced Scorecard 1 2 3 4 5 6 Consequences of Not Training 1 2 3 4 5 6 In the space below, please write any additional evaluation methods used and circle the number corresponding to the percentage of use. 0% 1-19 20-39 40-59 60-79 80-100% _______________________ 1 2 3 4 5 6 _______________________ 1 2 3 4 5 6

111
E3. Please score the following on a 1 to 5 scale by checking the appropriate box. 1 = Extremely Unimportant; 5 = Extremely Important. How important are measures of return on investment: 1 2 3 4 5 Improving processes to track participant progression with skills
� � � � �
Building stronger commitment to training by key stakeholders
� � � � �
Improving facilitator performance � � � � � Improving programs � � � � � Eliminating unsuccessful programs � � � � � Making investment decisions � � � � � Demonstrating value � � � � � Boosting program credibility � � � � � E4. When you do not evaluate training at the ROI level, what are the reasons? Check all that apply. � Little perceived value to the organization � Not required by the organization � The cost in person-hours and/or capital � Policy prohibits the evaluation of organization
staff by the training department � Evaluation takes too much time from the
program � Training is done only to meet legal
requirements � Lack of training or experience in using this
form of evaluation � Union opposition
� Unavailability of data for this form of evaluation
Other reasons: ________________________________________________________________________ Comments: ________________________________________________________________________

112
F1. Please indicate the percentage of currently active programs in which your organization starts planning the evaluation process at each of the stages listed below. Please circle the number corresponding to the appropriate percentage. 0% 1-19 20-39 40-59 60-79 80-100% Prior to program development 1 2 3 4 5 6 As the first step in program development
1 2 3 4 5 6
During program development 1 2 3 4 5 6 After program completion 1 2 3 4 5 6 When training program results must be documented
1 2 3 4 5 6
Evaluations are not implemented 1 2 3 4 5 6 F2. Employee development programs are delivered for a variety of reasons and have different levels of participation. Please indicate to the right the percentage of your currently active programs that match the descriptions listed. Please circle the number corresponding to the appropriate percentage. Respond to all reasons that apply. 0% 1-19 20-39 40-59 60-79 80-100% Employees are sent to the program as a reward
1 2 3 4 5 6
All employees involved in an activity or specific group attend the program
1 2 3 4 5 6
Participants will acquire new attitudes by attending the program
1 2 3 4 5 6
Participants in the program will be able to perform at a set level
1 2 3 4 5 6
A change in organizational outcomes will result from the program
1 2 3 4 5 6
F3. Approximately what percentage of the employee training staff is involved in evaluation? Please circle the number corresponding to the appropriate percentage. 0% 1-19 20-39 40-59 60-79 80-100% 1 2 3 4 5 6 F4. Approximately what percentage of employee training budget is applied to the evaluation? Please circle the number corresponding to the appropriate percentage. 0% 1-19 20-39 40-59 60-79 80-100% 1 2 3 4 5 6
Section F: Training and Evaluation in the Organization

113
F5. Approximately what percentage of the employee training staff has formal preparation in evaluation? Please circle the number corresponding to the appropriate percentage. 0% 1-19 20-39 40-59 60-79 80-100% 1 2 3 4 5 6 F6. What percentage of the time do you isolate the effects of a training program using the following methods? Please circle the number corresponding to the appropriate percentage. 0% 1-19 20-39 40-59 60-79 80-100% Use of control groups 1 2 3 4 5 6 Trend line analysis 1 2 3 4 5 6 Forecasting methods 1 2 3 4 5 6 Participant estimate 1 2 3 4 5 6 Supervisor estimate 1 2 3 4 5 6 Management estimates 1 2 3 4 5 6 Use of previous studies 1 2 3 4 5 6 Customer/client input 1 2 3 4 5 6 Expert estimates 1 2 3 4 5 6 Subordinate estimates 1 2 3 4 5 6 Calculating/estimating the impact of other factors
1 2 3 4 5 6
Other methods used to isolate the effects of the program: 0% 1-19 20-39 40-59 60-79 80-100% ___________________________ 1 2 3 4 5 6 ___________________________ 1 2 3 4 5 6 Comments: ______________________________________________________________________________
______________________________________________________________________________
F7. Circle the percentage of currently active training programs that must be evaluated in order to receive continued funding. 0% 1-19 20-39 40-59 60-79 80-100% 1 2 3 4 5 6 F8. Financial expertise is available to support training evaluation if requested from sources within the organization (example: assistance with acquisition of outcome data such as turnover, unit costs, etc.) Yes _____ No _____ If yes, do you routinely use this financial expertise to support training evaluation? Yes _____ No _____

114
F9. How is employee development funded in your organization? Check only one. � Separate training budget � Administrative budget and no chargeback
for program attendance � Separate training budget and separate profit
center � Other: __________________________
� Administrative budget and some form of chargeback for program attendance
F10. Is a written training evaluation policy in place in your organization? Yes _____ No _____ If “No”, skip to question F13. F11. To what extent does your written evaluation policy guide the evaluation process? Please circle the number corresponding to the percent of use. 0% 1-19 20-39 40-59 60-79 80-100% 1 2 3 4 5 6 F12. Which levels of evaluation are covered by the written policy? Check all that apply. � Level 1 (reaction) � Level 4 (organizational outcomes) � Level 2 (learning) � Level 5 (ROI) � Learning 3 (on-the-job application) � Other: __________________________ F13. Which criteria are important in selecting training programs for evaluation at the return-on-investment level (Level 5)? Rank the following ten items (including your specified “other” item) in order of importance: 1 is most important; 10 is least important. Please designate a ranking score only one time (e.g. only one item should be ranked a 1, 2, 3, etc.). ___ Involves large target audience ___ Take a significant investment of time
___ Expected to have a long life cycle ___ Have high visibility ___ Important to strategic objectives ___ Have a comprehensive needs assessment ___ Links to operational goals and issues ___ Have the interest of top executives ___ Are expensive ___ Other: _________________________ F14. Which criteria would be most important in determining the most effective method of calculating return on investment (ROI) of training? Rank the following ten items (including your specified “other” item) in order of importance. 1 is most important; 10 is least important. Please designate a ranking score only one time (e.g. only one item should be ranked a 1, 2, 3, etc.) ___ simple ___ be appropriate for a variety of programs
___ economical ___ be applicable with all types of data ___ credible ___ account for all program costs ___ theoretically sound ___ have successful track record ___ account for other factors (e.g., isolate variables other than training)
___ Other: _________________________

115
F15. Training program evaluation information is routinely reported to executive management in my organization. Yes _____ No _____ Please provide the following information about your entire organization (not just the training division): G1. Type of nonprofit sector organization � Health Services � Civic, Social and Fraternal � Education/Research � Arts and Culture � Social and Legal Services � Religious � Foundations � Other: ____________________________ G2. Size of organization (include fulltime, part-time, and contract employees) � 1 - 500 � 5,001 – 10,000 � 501 – 1,000 � 10,001 – 20,000 � 1,001 – 3,000 � Over 20,000 � 3,001 – 5,000 G3. Number of employees working in the United States __________ G4. Number of U.S. employees participating in training last year __________ G5. Number of years your organization has been providing training __________ G6. Your title � Executive Director � Supervisor � Deputy Director � Coordinator � Director � Specialist � Manager � Analyst � Chief Administrator � Other: ____________________________ � Administrator G7. Your job function as indicated in your job title: � Employee Development � Programs � Staff Development � HRD (Human Resource Development) � Training � Personnel � Education � HRM (Human Resource Management) � Training and Development � HR (Human Resources) � Training and Education � Other: ______________________________ G8. What is your total training budget? $ ___________
Section G: Demographic Information

116
G9. Number of years you have been working in this organization � 1 - 5 years � 6 – 10 years � 11 or more years G10. Number of years you personally have been involved in a training function in this or any other position (in any organization) � 1 - 5 years � 6 – 10 years � 11 or more years G11. Gender � Male � Female G12. Academic preparation (check highest level completed and major field of study) � Associate degree Major: __________________________________
� Bachelor’s degree Major: __________________________________
� Master’s degree Major: __________________________________
� Doctorate degree Major: __________________________________
Other education, training, or development not covered by above categories (type or subject/field of study): _________________________________ _______________________________________ G13. Do you have general comments regarding this research and/or specific items of interest not covered by this survey?
______________________________________________________________________________
______________________________________________________________________________
______________________________________________________________________________
______________________________________________________________________________
______________________________________________________________________________
______________________________________________________________________________
117
Thank you for completing this questionnaire. Please use the enclosed stamped, self-addressed envelope to return this survey by May 31, 2006 to:
Travis K. Brewer P.O. Box 190136
Dallas, TX 75219-0136
If you are among the first 200 respondents, you will receive a copy of the book listed below. All respondents will receive a summary of the results of the study. Return on Investment Basics (2005). Alexandria, VA: American Society for Training and Development.

118
APPENDIX B
PRE-NOTICE LETTER
119
May 20, 2006 [Letterhead] The University of North Texas Applied Technology and Performance Improvement
Denton, TX
John Doe Training Director XYZ Services 1234 Nonprofit Way Dallas, TX 75235 A few days from now you will receive in the mail a request to complete a questionnaire for a doctoral dissertation research project. This project is a requirement for me to complete a Ph.D. in Applied Technology and Performance Improvement from the University of North Texas. The questionnaire addresses current practices in training evaluation in nonprofit organizations. It will take you approximately 30 minutes to complete the questionnaire. I am writing in advance because many people like to know ahead of time that they will be contacted to participate in research such as this. The study is an important one that will contribute to the growing literature on training evaluation. Your participation in this research project is completely voluntary and may be discontinued at any time without penalty or prejudice. Confidentiality of your responses will be maintained. This research project has been reviewed and approved by the UNT Institutional Review Board. Contact the UNT IRB, (940) 565-3940, with any questions regarding your rights as a research subject. Thank you for your time and consideration. It is only with the generous help of people like you that our research can be successful. If you have questions regarding this research project, please call me at (214) 358-0778 or email me at [email protected]. Sincerely, Travis K. Brewer Doctoral Candidate, University of North Texas Research Supervised By: Dr. Jerry Wircenski Applied Technology and Performance Improvement College of Education University of North Texas (940) 565-2714

120
APPENDIX C
COVER LETTER

121
February 28, 2006 [Letterhead] The University of North Texas Applied Technology and Performance Improvement
Denton, TX
John Doe Training Director XYZ Services 1234 Nonprofit Way Dallas, TX 75235 As you know, there is increasing pressure for nonprofit organizations to strengthen transparency, governance, and accountability in all operations. The Panel on the Nonprofit Sector recommended Disclosure of Performance Data as a step toward accountability. This is true for employer-sponsored training as well as other programs. For this reason, I am conducting research in training evaluation methods in nonprofit sector organizations. By surveying nonprofit sector organizations, I hope to identify effective evaluation methods, thereby, providing information to organizations such as yours that might enhance the quality of training. As a member of <ASTD/ISPI>, you are uniquely positioned to contribute to this research and to the broader effort to expand and share nonprofit sector training evaluation experience. Thus, your completing the enclosed survey and returning it in the postage-paid envelope by March 22, 2006, will be greatly appreciated. The entire survey process should take no more than 30 minutes. Your answers are completely confidential and will be released only as summaries in which no individual’s answers can be identified. The first 200 respondents will receive a copy of Measuring ROI in the Public Sector (2002). Also, all respondents will receive a research results summary. This research is being conducted according to the guidelines set forth by UNT’s Institutional Review Board, which ensures that research projects involving human subjects follow federal regulations. Any questions or concerns about rights as a research subject should be directed to the Chair of the Institutional Review Board, The University of North Texas, P.O. Box 305250, Denton, TX 76203-5250, (940) 565-3940. If you have any questions or comments about this study, please contact me via phone at (214) 358-0778 or via email at [email protected]. Thank you for helping me with this research project. Sincerely, Travis K. Brewer Doctoral Candidate, University of North Texas Research Supervised By: Dr. Jerry Wircenski Applied Technology and Performance Improvement College of Education University of North Texas

122
Enclosures: Research Questionnaire and Postage-Paid Response Envelope

123
APPENDIX D
POSTCARD

124
February 28, 2006 Last week, a questionnaire seeking your information about your use of training evaluation was mailed to you. You name was selected from the <ASTD/ISPI> membership list. If you have already completed and returned the questionnaire, please accept my sincere thanks. If not, please do so today. I am especially grateful for your help because it is only by asking people like you to share your experiences with training evaluation in the nonprofit sector that I can understand best practices and any barriers to evaluation. If you did not receive a questionnaire, or if it was misplaced, please call me at 214-358-0778 and I will get another one in the mail to you today. Travis K. Brewer Doctoral Candidate, University of North Texas

125
APPENDIX E
REPLACEMENT COVER LETTER

126
March 8, 2006 [Letterhead] The University of North Texas Applied Technology and Performance Improvement
Denton, TX
John Doe Training Director XYZ Services 1234 Nonprofit Way Dallas, TX 75235 About five weeks ago you should have received a questionnaire that asked for input in training evaluation practices in nonprofit sector organizations. To the best of my knowledge it has not yet been returned. I am writing again because of the importance of your questionnaire in achieving accurate results. Although we sent questionnaires to members of <ASTD/ISPI> representing nonprofit sector organizations across the U.S., it is only by hearing from nearly everyone in the sample that we can be sure the results are truly representative. If you are no longer in a position to comment on training evaluation practices within your organization, please indicate so on the cover letter and return the cover letter in the postage-paid envelope. This will allow me to delete your name from the mailing list. A questionnaire identification number is printed at the top of the questionnaire so that we can check your name off the mailing list when it is returned. The list of names will be used to distribute research summary results only. Your individual responses to the questionnaire will not be made available to anyone before or after the research is concluded. Please keep in mind that your participation in this research is completely voluntary and may be discontinued at any time without penalty or prejudice. The entire survey process should take no more than 30 minutes. This research is being conducted according to the guidelines set forth by UNT’s Institutional Review Board, which ensures that research projects involving human subjects follow federal regulations. Any questions or concerns about rights as a research subject should be directed to the Chair of the Institutional Review Board, The University of North Texas, P.O. Box 305250, Denton, TX 76203-5250, (940) 565-3940. If you have any questions or comments about this study, please contact me via phone at (214) 358-0778 or via email at [email protected]. Sincerely, Travis K. Brewer Doctoral Candidate, University of North Texas Research Supervised By: Dr. Jerry Wircenski Applied Technology and Performance Improvement College of Education University of North Texas

127
Enclosures: Research Questionnaire and Postage-Paid Response Envelope

128
APPENDIX F
OTHER JOB TITLES

129
Responses to Other Job Titles
Survey Item G6
Assistant Manager AVP Training and Development Chief Learning Officer Director of Leadership and Management Development Facilitator HR Team Lead Professional Development Coordinator Program Leader Senior Director Technical Support Specialist Vice President Vice President – Operations Vice President People Development

130
APPENDIX G
OTHER JOB FUNCTION

131
Responses to Other Job Function
Survey Item G7
Administrator Communications Consulting Services Continuing Education Executive and Volunteer Leadership Development General Administration Information Technology Leadership Development Marketing Operations Organization Development PI Coordinator Quality Quality Management

132
APPENDIX H
ACADEMIC PREPARATION AND MAJOR

133
Responses to Academic Preparation and Major
Survey Item G12
Associate Marketing
Bachelor Degree
Administrative Management Business Administration Communications Computer Information Systems Economics Education English Finance
Food Technology Human Resource Management Math/Engineering Occupational Education Psychology Public Policy/Sociology Training and Development
Master Degree
Adult and Continuing Education American Studies Business Commercial Banking Community Mental Health Counseling Counseling and Guidance/Psychology Counseling Psychology Divinity Education Educational Psychology English Humanities – Literature Human Resource Development
Human Resource Management Human Resources I/O Psychology Industrial Personnel Psychology Instructional Design International Business and HR Library and Information Sciences MBA Nonprofit Administration Organizational Communication Philosophy Psychology Zoology
Doctorate Degree
Adult Education Adult Non-Formal Education Educational Administration I/O Psychology Management
Organizational Development Organization & Leadership Psychology of Organization Special Education Wildlife Biology

134
APPENDIX I
OTHER EDUCATION
TRAINING OR DEVELOPMENT

135
Responses to Other Education, Training, or Development
Survey Item G12
Accounting Accredited Residential Manager ASTD Train-The-Trainer Certification Business Management Certificate CA Certified Residential Manager CDA Certified IRA Professional – BISYS Computer-Based Trainer CPLP Executive Development Family Therapy
Graduate Certificate – Instructional Design Graduate Management Coursework LPC Marketing Mediation PHR Certification Safety Safety Management Theology Training Skills

136
APPENDIX J
OTHER METHODS TO
EVALUATE PARTICIPANT REACTION

137
Responses to Other Methods to Evaluate Participant Reaction
Survey Item A2
Annual Self-Evaluation/Interview Employee Surveys Follow-Up Phone Calls Group Reflection – Discussion Group Verbal Questions Informal Assessment – Discussion Internal Form Needs Assessment Online Surveys
On-The-Job Measurement With Behavior Change Oral Group Feedback Post-Event Interview Post-Test Pre-Test/Post-Test Surveys Verbal Feedback

138
APPENDIX K
OTHER METHODS
TO EVALUATE LEARNING

139
Responses to Other Methods to Evaluate Learning
Survey Item B2
Action Plan Completion Activities Case Studies Online Surveys Role Play Secret Shoppers

140
APPENDIX L
OTHER METHODS TO
EVALUATE ON-THE-JOB APPLICATION

141
Responses to Other Methods to Evaluate On-The-Job Application
Survey Item C2
Follow-Up Coaching In-Depth Interviews Peer Coaching Post-Training Interviews and Surveys Questionnaires Standardized Scales (Normed)

142
APPENDIX M
OTHER METHODS TO EVALUATE
ORGANIZATIONAL OUTCOMES/RESULTS
143
Responses to Other Methods to Evaluate Organizational Outcomes/Results
Survey Item D2
Action Plan Completion Normed Scale for Comparison Purposes Qualitative – Focus Group Interviews Quantitative Survey

144
APPENDIX N
OTHER METHODS TO
ISOLATE THE EFFECTS OF THE PROGRAM

145
Responses to Other Methods to Isolate the Effects of the Program and Comments Concerning Isolation
Survey Item F6
Other Methods to Isolate the Effects of the Program
Anecdotal Reports Feedback from the Federal Government Frequency Hierarchical/Multiple Regression Secret Shoppers Surveys
Comments Concerning Isolation
Recently hired an analyst to help with this area. We don’t isolate effects of training at all.

146
APPENDIX O
OTHER TYPE OF ORGANIZATION

147
Responses to Other Type of Organization
Survey Item G1
Affordable Housing Association Business Standards Credit Union Conservation and Environment Federal Contractor Financial Humanitarian/Disaster Response Human Services Human Support Services Library Consortium Manufacturing
Nonprofit Management Support Organization Professional Association Public Health State Fish & Wildlife Agencies Association Telecommunications Trade Association Utility Youth and Community Youth Organization Zoo/Aquarium

148
APPENDIX P
OTHER CRITERIA FOR
SELECTING ROI METHODS

149
Responses to Other Criteria for Selecting ROI Methods
Survey Item F14
Account for Increase in Learning and Development Easily Implemented Easily Understood

150
APPENDIX Q
GENERAL COMMENTS

151
General Comments
Survey Item G13
• Thanks! It made me think.
• We don’t do much past Level 1.
• Looking forward to the result.
• Evaluation of education in a religious setting is markedly different from other types of training.
• The greatest mistake companies
make relative to training is that they view it as an expense rather than an investment.
• I am extremely interested in the
research.
• It would be great to have a package of evaluation solutions, an off-the-shelf program for Management Support Organizations.
• Our company does a good job of
training staff but at most we ask for feedback at the end.
• The area of G8 – total training
budget is confusing/vague! Does this include staff salaries/consultants/conferences & associate cost?

152
APPENDIX R
HUMAN SUBJECTS REVIEW
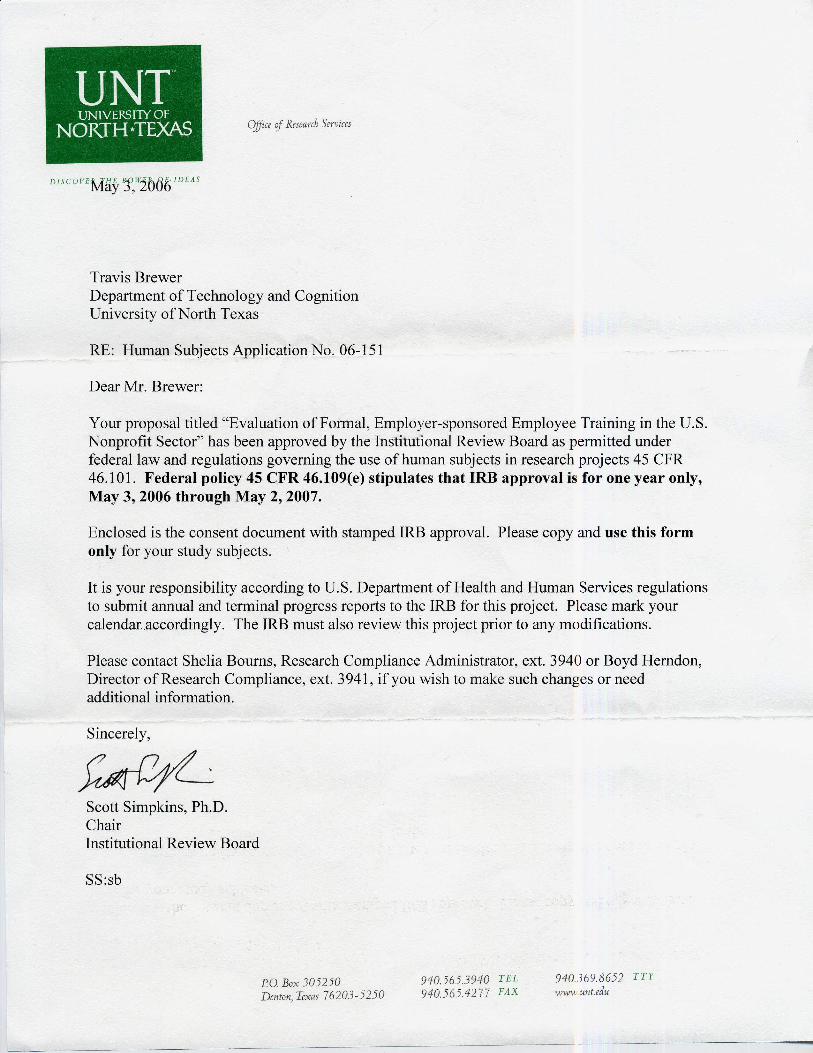
153

154
REFERENCES
Aliger, G. M., & Janak, E. A. (1989). Kirkpatrick’s levels of training criteria: Thirty
years later. Personnel Psychology, 42(3), 331-342.
Alreck, P. L., & Settle, R. B. (2004). The survey research handbook (3rd ed.). New York:
McGraw-Hill.
American Educational Research Association, American Psychological Association, &
National Council on Measurement in Education. (1985). The standards for
educational and psychological testing. Washington, DC: American Psychological
Association.
American Management Association. (2001). Survey 2001staffing survey. Retrieved
October 17, 2002, from http://www.amanet.org/research/summ.htm
Armour, S. (1998, October 7). Big lesson: Billions wasted on job-skills training. USA
Today, p. B1.
Arthur, D. (2001). The employee recruitment and retention handbook. New York:
AMACOM.
Basarab, D. J., & Root, D. K. (1992). The training evaluation process: A practical
approach to evaluating corporate training programs. Boston: Kluwer Academic
Publishers.
Benson, D. K., & Tran, V. P. (2002). Workforce development ROI. In P. P. Phillips
(Ed.), Measuring ROI in the public sector (pp. 173-197). Alexandria, VA:
American Society for Training and Development.

155
Blanchard, P. N., Thacker, J. W., & Way, S. A. (2000). Training evaluation: Perspectives
and evidence from Canada. International Journal of Training and Development,
4(4), 295-304.
Bledsoe, M. D. (1999). Correlations in Kirkpatrick’s training evaluation model.
Dissertation Abstracts International, 60 (07), 2322A. (UMI No. 9937553)
Bramley, P., & Kitson, B. (1994). Evaluating training against business criteria. Journal of
European Industrial Training, 18(1), 10-14.
Brannick, J. (2001). Seven strategies for retaining top talent. Journal of Business
Strategy, 22(4), 28-31.
Brinkerhoff, R. O. (1981). Making evaluation more useful. Training & Development
Journal, 35(12), 66-70.
Brinkerhoff, R. O. (1991). Achieving results from training. San Francisco: Jossey-Bass.
Brinkerhoff, R. O., & Dressler, D. (2002). Using evaluation to build organizational
performance and learning capability: A strategy and a method. Performance
Improvement, 41(6), 14-21.
Broad, M. L., & Newstrom, J. W. (1992). Transfer of training. New York: Addison-
Wesley.
Clement, R. W. (1978). An empirical test of hierarchy theory of training evaluation.
Dissertation Abstracts International, 39 (10), 6214A. (UMI No. 7907317)
Davidove, E. A. (1993). Evaluating the return on investment of training. Performance &
Instruction, 32(1), 1-8.
Dees, J. G. (1998). Enterprising nonprofits. The Grantsmanship Center Magazine, 35, 23-
30.

156
Dillman, D. A. (2000). Mail and internet surveys: The tailored design method (2nd ed.).
New York: Wiley.
Dixon, N. M. (1990). Evaluation: A tool for improving HRD quality. San Diego:
University Associates and Alexandria, VA: ASTD.
Finch, C. R., & Crunkilton, J. R. (1989). Curriculum development in vocational and
technical education: Planning, content, and information. Boston: Allyn and
Bacon.
Gilley, J. W., Quatro, S. A., & Lynham, S. A. (2003). Strategic HRD and its
transformation. In A. M. Gilley, J. L. Callahan, & L. L. Bierema, (Eds.), Critical
issues in HRD: A new agenda for the twenty-first century (pp.23-48). New York:
Basic Books.
Gomez, A. K. (2003). An analysis of the evaluation practices of employer-sponsored
training in the financial services industry (Doctoral dissertation, Texas A&M
University, 2003). Dissertation Abstracts International, 64, 2382A.
Hammack, D. C., & Young, D. R. (Eds.). (1993). Nonprofit organizations in a market
economy. San Francisco: Jossey-Bass.
Hill, D. R. (1999). Evaluation of formal, employer-sponsored training in the U.S.
healthcare industry. Dissertation Abstracts International, 60(09), 3234A. (UMI
No. 9947255)
Hodgkinson, V., Weitzman, M., Abrahams, J., Crutchfield, E., & Stevenson, D. (1996).
Nonprofit almanac 1996-1997: Dimensions of the independent sector. San
Francisco: Jossey-Bass.

157
Holton, E. F. (1996). The flawed four-level evaluation model. Human Resource
Development Quarterly, 7(1), 5-21.
Horngren, C. T. (1982). Cost accounting. Englewood Cliffs, NJ: Prentice Hall.
Independent Sector, (2005, June 22). Panel on the nonprofit sector. Retrieved February
19, 2005, from http://www.nonprofitpanel.org/final/Panel_Final_Report.pdf
Independent Sector & Urban Institute. (2002). The new nonprofit almanac and desk
reference: The essential facts and figures for managers, researchers, and
volunteers. San Francisco: Jossey-Bass.
Jamieson, D, & O’Mara, J. (1991). Managing workforce 2000. San Francisco: Jossey-
Bass.
Kaufman, R., & Keller, J. M. (1994). Levels of evaluation: Beyond Kirkpatrick. HRD
Quarterly, 5(4), 371-380.
Kirkpatrick, D. L. (1975). Techniques for evaluating training programs. In D. L.
Kirkpatrick (Ed.), Evaluating training programs (pp. 1-17). Madison, WI: ASTD.
Kirkpatrick, D. L. (1994). Evaluating training programs: The four levels. San Francisco:
Berrett-Koehler.
Kirkpatrick, D. L. (1998). Evaluating training programs: The four levels (2nd ed.). San
Francisco: Berrett-Koehler.
Krejcie, R. V., & Morgan, D. W. (1970). Determining sample size for research activities.
Educational and Psychological Measurement, 30, 607-610.
Laird, D. (1985). Approaches to training and development (Rev. 2nd ed.). Reading, MA:
Addison-Wesley.
158
Lanigan, M. L. (1997). Applying the theories of reasoned action and planned behavior to
training evaluation levels. Dissertation Abstracts International, 58 (03), 778A.
(UMI No. 9727948)
Litwin, M. S. (1995). How to measure survey reliability and validity. Thousand Oaks,
CA: Sage.
Marquardt, M. J. (1996). Building the learning organizations: A systems approach to
quantum improvement and global success. New York: McGraw-Hill.
Marrelli, A. F. (1993). Determining training costs, benefits, and results. Technical &
Skills Training, 5, 8-14.
McMillan, J. H. (2004). Educational research: Fundamentals for the consumer (4th ed.).
Boston: Allyn and Bacon.
McMullen, K., & Schnellenberg, G. (2003, March). Skills and training in the nonprofit
sector (No-3). Ottawa, Ontario: Canadian Policy Research Networks.
Medsker, K. L., & Roberts, D. G. (Eds.). (1992). Trainer’s toolkit: Evaluating the results
of training. Alexandria, VA: American Society for Training and Development.
Michalski, G. V., & Cousins, J. B. (2001). Multiple perspectives on training evaluation:
Probing stakeholder perceptions in a global telecommunications network.
American Journal of Evaluation, 22(1), 37-48.
Miller, V. A. (1996). The history of training. In R. L. Craig (Ed.), The ASTD training
&development handbook (pp. 3-18). New York: McGraw-Hill.
Mishan, E. J. (1960). A survey of welfare economics, 1939-1959. The Economic Journal,
70(278), 197-265.
159
Molenda, M., Pershing, J. A., & Reigeluth, C. M. (1996). Designing instructional
systems. In R. L. Craig (Ed.), The ASTD training & development handbook (pp.
266-293). New York: McGraw-Hill.
Musgrave, R. A. (1969). Cost-benefit analysis and the theory of public finance. Journal
of Economic Literature, 7(3), 797-806.
Nadler, L. (1990). Human resource development. In L. Nadler, & Z. Nadler (Eds.), The
handbook of human resource development (2nd ed., pp. 1.1-1.47). New York:
Wiley.
Nas, T. F. (1996). Cost-benefit analysis. Thousand Oaks, CA: Sage.
Nickols, F. W. (2005). Why a stakeholder approach to training evaluation. Advances in
Developing Human Resources, 7(1), 121-134.
Noonan, J. V. (1993). How to escape corporate America’s basement. Training, 30(12),
39-42.
Parry, S. B. (1996). Measuring training’s ROI. Training & Development, 50(5), 72-77.
Parry, S. B. (1997). Evaluating the impact of training: A collection of tools and
techniques. Alexandria, VA: ASTD.
Phillips, J. J. (1991). Handbook of training evaluation and measurement methods (2nd
ed.). Boston: Butterworth-Heinemann.
Phillips, J. J. (1996a). How much is the training worth? Training and Development,
50(4), 20-24.
Phillips, J. J. (1996b). Was it the training? Training and Development 50(3), 28-32.
Phillips, J. J. (1997a). Handbook of training evaluation and measurement methods (3rd
ed.). Boston: Butterworth-Heinemann.
160
Phillips, J. J. (Ed.). (1997b). Measuring return on investment (Vol. 2). Alexandria, VA:
American Society for Training and Development.
Phillips, J. J. (1997c). Return on investment in training and performance improvement
programs. Boston, MA: Butterworth-Heinemann.
Phillips, J. J. (1999). HRD Trends worldwide: Shared solutions to compete in a global
economy. Boston: Butterworth-Heinemann.
Phillips, J. J. & Phillips, P. P. (2003, January) Using action plans to measure ROI: A case
study. Performance Improvement, 42(1), pp. 22-31.
Phillips, P. P. (2002). The bottomline on ROI. Atlanta, GA: Center for Effective
Performance.
Phillips, P. P. (2003). Training evaluation in the public sector. Dissertation Abstracts
International, 64 (09), 3162A. (UMI No. 313677)
Preskill, H., & Russ-Eft, D. (2003). A framework for reframing HRD evaluation,
practice, and research. In A. M. Gilley, J. L. Callahan, & L. L. Bierema (Eds.),
Critical issues in HRD: A new agenda for the twenty-first century (pp. 199-213).
New York: Basic Books.
Prest, A. R., & Turvey, R. (1965). Cost-benefit analysis: A survey. The Economic
Journal, 75(300), 683-735.
Quality service: Your staff holds the key. (1996). Nonprofit World, 14(2), 36-39.
Rea, L. M., & Parker, R. A. (1997). Designing and conducting survey research: A
comprehensive guide (2nd ed.). San Francisco: Jossey-Bass.
Robinson, D. G., & Robinson, J. C. (1995). Performance consulting: Moving beyond
training. San Francisco: Berrett-Koehler.
161
Robinson, D. G., & Robinson, J. C. (1998). Moving from training to performance: A
practical guidebook. Alexandria, VA: American Society for Training and
Development.
Rossi, P. H., Lipsey, M. W., & Freeman, H. E. (2004). Evaluation: A systematic
approach (7th ed.). Thousand Oaks, CA: Sage.
Salamon, L. M., & Sokolowksi, S. W. (2005). Nonprofit organizations: New insights
from QCEW data. Monthly Labor Review, 128(9), 19-26.
Scriven, M. (1999). The nature of evaluation part ii: Training. Practical Assessment,
Research & Evaluation, 6(12), 1998-1999.
Senge, P. M. (1990). The fifth discipline: The art & practice of the learning organization.
New York: Currency Doubleday.
Shelton, S., & Alliger, G. (1993). Who’s afraid of level four evaluation? Training &
Development, 47(6), 43-46.
Shrock, S. A., & Geis, G. L. (1999). Evaluation. In H. D. Stolovitch & E. J. Keeps (Eds.),
Handbook of human performance technology (2nd ed., pp. 185-209). San
Francisco: Jossey-Bass.
Spitzer, D., & Conway, M. (2002). Link training to your bottom line (0201). Infoline
(Available from the ASTD Fulfillment, PO Box 1443, Alexandria, VA 22313-
2043).
Stufflebeam, D. L. (1971). The relevance of the CIPP evaluation model for educational
accountability. Journal of Research & Development in Education, 5(1), 19-25.

162
Stufflebeam, D. L. (1983). The CIPP model for program evaluation. In G. Madeus, M.
Scriven, & D. Stufflebeam (Eds.), Evaluation models: Viewpoints on educational
and human service evaluation (pp. 117-142). Boston: Klewer Nijhoff.
Stum, D. L. (2001). Maslow revisited: Building the employee commitment pyramid.
Strategy & Leadership, 29(4), 4-9.
Sugrue, B., & Kim, K. (2004). State of the industry: ASTD’s annual review of trends in
workplace learning and performance. Alexandria, VA: ASTD.
Sugrue, B., & Rivera, R. J. (2005). State of the industry: ASTD’s annual review of trends
in workplace learning and performance. Alexandria, VA: ASTD.
Swanson, R., & Holton, E. (1999). Results: How to assess performance, learning and
perceptions in organizations. San Francisco: Berrett-Koehler.
Thompson, M. S. (1980). Benefit-cost analysis for program evaluation. Thousand Oaks,
CA: Sage.
Torraco, R. J., & Swanson, R. A. (1995). The strategic role of human resource
development. Human Resource Planning, 18(4), 10-21.
Training. (2004, October). Training Magazine’s 23rd annual comprehensive analysis of
employer-sponsored training in the United States. Retrieved November 28, 2005,
from http://www.trainingmag.com/training/images/pdf/0410_IndustryReport.pdf
Training. (2005, December). 2005 Industry report. Retrieved February 1, 2005, from
http://www.trainingmag.com/training/images/pdf/IndustryReport.pdf
Twitchell, S. (1997). Technical training program evaluation: Present practices in United
States’ business and industry. Dissertation Abstracts International, 58, (09),
3284A. (UMI No. 9810840)

163
Tyler, R. W. (1942). General statement on evaluation. Journal of Educational Research,
37(7), 492-501.
Ulrich, D. (1997). Human resource champions: The new agenda for adding value and
delivering results. Boston: Harvard Business School Press.
Ulrich, D. (1998). A new mandate for human resources. Harvard Business Review, 76(1),
124-134.
Warr, P., Allan, C., & Birdi, K. (1999). Predicting three levels of training outcome.
Journal of Occupational and Organizational Psychology, 72, 351-375.
Warr, P., Bird, M., & Rackham, N. (1970). Evaluation of management training. London,
England: Gower Press.
Warr, P. B., & Bunce, D. (1995). Trainee characteristics and the outcomes of open
learning. Personnel Psychology, 48, 347-375.
Watkins, K., & Marsick, V. (1993). Sculpting the learning organization. San Francisco:
Jossey-Bass.
Watkins, K., & Marsick, V. (Eds.) (1996). In action: Creating the learning organization.
Alexandria, VA: ASTD.
Weitzman, M. S., Jalandoni, N. T., Lampkin, L. M., & Dolak, T. H. (2002). The new
nonprofit almanac and desk reference. San Francisco: Jossey-Bass.
Young, D. R., & Salamon, L. M. (2002). Commercialization, social ventures, and for-
profit competition. In L. M. Salamon (Ed.), The state of nonprofit America (pp.
423-446).Washington, DC: Brookings Institutional Press.