use of the 3-d scanner in mapping
TRANSCRIPT

HESSD8, 6907–6937, 2011
Use of the 3-Dscanner in MAPPING
G. Romanescu et al.
Title Page
Abstract Introduction
Conclusions References
Tables Figures
J I
J I
Back Close
Full Screen / Esc
Printer-friendly Version
Interactive Discussion
Discussion
Paper
|D
iscussionP
aper|
Discussion
Paper
|D
iscussionP
aper|
Hydrol. Earth Syst. Sci. Discuss., 8, 6907–6937, 2011www.hydrol-earth-syst-sci-discuss.net/8/6907/2011/doi:10.5194/hessd-8-6907-2011© Author(s) 2011. CC Attribution 3.0 License.
Hydrology andEarth System
SciencesDiscussions
This discussion paper is/has been under review for the journal Hydrology and EarthSystem Sciences (HESS). Please refer to the corresponding final paper in HESSif available.
Use of the 3-D scanner in mapping andmonitoring the dynamic degradation ofsoils. Case study of the Cucuteni-BaiceniGully on the Moldavian Plateau(Romania).G. Romanescu1, B. Venedict2, V. Cotiuga2, and A. Asandulesei2
1University of Iasi, Faculty of Geography and Geology, Department of Geography, Bd.Carol I,20A, 700505, Iasi, Romania2University of Iasi, ARHEOINVEST Laboratory, Bd. Carol I, 11, 700506, Iasi, Romania
Received: 10 July 2011 – Accepted: 12 July 2011 – Published: 14 July 2011
Correspondence to: G. Romanescu ([email protected])
Published by Copernicus Publications on behalf of the European Geosciences Union.
6907

HESSD8, 6907–6937, 2011
Use of the 3-Dscanner in MAPPING
G. Romanescu et al.
Title Page
Abstract Introduction
Conclusions References
Tables Figures
J I
J I
Back Close
Full Screen / Esc
Printer-friendly Version
Interactive Discussion
Discussion
Paper
|D
iscussionP
aper|
Discussion
Paper
|D
iscussionP
aper|
Abstract
The 3-D Scanner, a rapid and precise means of monitoring the dynamics of erosiveprocesses, was used, first of all nationally (Romania), as a new technique of cartog-raphy and monitoring the dynamics of soil degradation processes in the MoldavianPlateau. Three sets of measurements took place: in 2008, in 2009 and in 2010, at5
intervals of exactly one year for the first and six months for the second part. Qualitativeand quantitative differences were highlighted. The data obtained were corroboratedwith precipitation in the area studied. The 3-D scanner has a measurement accuracyof 6 mm. The map highlights the dynamics of gullies developed and may form the basisfor the prediction of soil degradation phenomena. The dynamics of the gully and the10
type of land use show that the phenomenon of erosion of the Moldova Plateau will con-tinue to accelerate. In this case the gully attacked and destroyed an archaeological siteof national importance. The rate of advance of the Cucuteni-Baiceni gully is extremelyhigh (10 m/1.6 yr). There are no measures at all to reduce or fight the process of thegully advance. Maximum erosion occurred at the beginning of spring after a winter rich15
in rainfall, which made the terrain subject to the process of subsidence.
1 Introduction
To analyze the morphological and dynamic geomorphological slope process, a varietyof modern methods have been used so far. They have not, however, been used fre-quently, and have not been very accurate. In most studies rough traditional methods20
have been used, based on wood or metal markers. In this study, for the first time inRomania, and also on a global scale, a 3-D scanner was used in the mapping of gul-lies. The dynamics of the geomorphological processes of soil erosion were followedin detail. Specialized institutions closely followed the geomorphological processes thatactively show the whole of the Moldova Plateau but, unfortunately, inadequate instru-25
ments were used and the results were not satisfactory. By using a 3-D scanner many
6908

HESSD8, 6907–6937, 2011
Use of the 3-Dscanner in MAPPING
G. Romanescu et al.
Title Page
Abstract Introduction
Conclusions References
Tables Figures
J I
J I
Back Close
Full Screen / Esc
Printer-friendly Version
Interactive Discussion
Discussion
Paper
|D
iscussionP
aper|
Discussion
Paper
|D
iscussionP
aper|
of the expected responses will provide accurate, dynamic geomorphology and a much-improved database.
It will develop a study on the dynamics of gullies of the Moldavian Plateau, and de-velop a specific methodology and 3-D scanner to obtain accurate data, in millimetersor centimeters, about the changes that may occur in very short periods of time. Cor-5
relation of 3-D scanner data with those obtained via traditional methods will certainlyimprove the methods of preventing and combating the risk of geomorphological phe-nomena. At the same time, it seeks to use the technique to be implemented in as manyareas of investigation as possible: geomorphology, archeology, agronomy, protectionof the environment, land management, etc.10
The study of the gully is of particular importance because it is extremely active, andits development will affect the Cucuteni archaeological site from the Neolithic period,which is very important in the proof of an ancient habitation on the territory in the north-eastern part of Moldova. For a good correlation with data previously obtained and afull analysis of morphological traits (morphography and morphometry) in specific gul-15
lies, wide-ranging international and national sources have been consulted: Bacauanu,1968; Barnoals et al., 2010; Blong et al., 1982; Bohler and Marbs, 2006; Bornaz andRinaudo, 2004; Bradford et al., 1978; Bretar et al., 2009; Bull and Kirkby, 1997; Casaset al., 2010; De Oliveira, 1990; Ernst et al., 2010; Harvey, 1992; Heede, 1976; Ionita,2006; James et al., 2007; Kern, 2002; Lane, 2008; Leica HDS3000 data sheet, 2006;20
Milan et al., 2007; Phillips, 2006; Radoane et al., 1995, 1999, 2009; Vandaele et al.,1996.
2 Regional setting
The Moldavian Plateau is the largest and most representative of Romania’s plateaus.It occupies the eastern part of the country, ranging from Bukovina, the Moldavian Sub-25
Carpathians, the northeastern Romanian Plain, the Prut valley and the river Danube(Fig. 1).
6909

HESSD8, 6907–6937, 2011
Use of the 3-Dscanner in MAPPING
G. Romanescu et al.
Title Page
Abstract Introduction
Conclusions References
Tables Figures
J I
J I
Back Close
Full Screen / Esc
Printer-friendly Version
Interactive Discussion
Discussion
Paper
|D
iscussionP
aper|
Discussion
Paper
|D
iscussionP
aper|
A landscape including the Carpathians and the Danube characterizes part of thegreat stage of hilly lands (Romanescu et al., 2008). It has a total area of 25 000 km2,over 10 % of the territory (Romanescu, 2009; Romanescu and Nistor, 2011; Ro-manescu et al., 2011a, b).
The gully scanned in 2008, 2009 and 2010 is located in the south western Plains of5
Moldavia, a subdivision of the Moldavian Plateau relief. It cuts off the right side of theCucuteni brook (13 km2 catchment area and 11 km long), left tributary of the Bahluiet(551 km2 catchment area and 41 km long).
The Moldavian Plateau, or the Moldavian Plain default, is a large relief unit affectedby land degradation processes, especially surface erosion, deep erosion and land-10
slides. Across the Moldavian Plateau there are two important areas of expansion ofgullies: Plain southern half of Moldavia Plateau (Jijia middle basin, the upper basin ofBahluiet) and the southern half of Barlad (Falciu Hills, Tutovei hills, Covurluiului) (Ionita,2006). The lower density of the Central Moldavian gullies is due to the presence ofsandstone and limestone plate and a high level of afforestation.15
3 Materials and methods
For measurements of the morphometrical parameters of the Cucuteni-Baiceni gullies,the Leica 3-D scanner was used in the first place. Up to now, this device had beenused in architecture, archeology, etc. As a result of its performance, it can be usedsuccessfully to assess the state of the environment, especially in land mapping and20
measuring the rate of erosion in some land surfaces with limited extension. A fixedsatellite aimed at settling the mathematical coordinates of the 3-D scanner, becausesuccessive following measurements must cover the same points. For the scan to be ex-tremely precise, nine locations must be chosen. In this case we were able to measurethe entire surface of gullying, although morphological and hydro-geo-morphological25
conditions were extremely poor. For a better mapping of the contours of gullies, aLeica 1201 total station and GPS were used.
6910

HESSD8, 6907–6937, 2011
Use of the 3-Dscanner in MAPPING
G. Romanescu et al.
Title Page
Abstract Introduction
Conclusions References
Tables Figures
J I
J I
Back Close
Full Screen / Esc
Printer-friendly Version
Interactive Discussion
Discussion
Paper
|D
iscussionP
aper|
Discussion
Paper
|D
iscussionP
aper|
The Cucuteni-Baiceni gully was selected for the present research because it is veryactive. There is no forest vegetation on its surface that could prevent partial volumetricmeasurement parameters. Shrub vegetation, although rare, had to be removed usingthe techniques allowed by the software. The choice was due to the fact that erosionhas affected a very interesting archaeological site dating back to 5000 BP, from the5
Cucuteni or the Precucuteni period. This makes it easier to assess the rate of erosionover a period of great extremes.
The 3-D scanner has a measurement accuracy of 6 mm. During a measurementwith a laser scanner, thousands or millions of points are measured and saved.
Three consecutive measurements were performed at relatively equal intervals in10
2008, 2009 and 2010. The last measurement was made in spring 2010 after a solidwinter precipitation and high rainfall in spring.
For the historical evolution of gullies, topographic maps and military plans of theRomanian Army were consulted. During the Second World War the Army had placed abattery of guns in the area of the unit studied. Unfortunately, it has only been possible15
to make use of land-use maps since 1950. Those developed before this year are notaccurate and they are often for orientation only, with a high degree of generalization.
Meteorological data on precipitation, daily and monthly, were provided by the Me-teorological Centre, Iasi, Moldavia. They were focussed on Cotnari MeteorologicalStation, located near the Cucuteni-Baiceni gullies. The most important stations were20
rather uniformly distributed on Moldavian territory (Eastern Romania).
4 Results and discussions
Erosion gullies are deep, cut from loose rocks. They consist of a channel with steepbanks and talweg thresholds (with a cross-section greater than 1000 cm2), a thresholdof spring water that often flows ephemerally and a longitudinal profile as a powerful25
curved parabol (De Oliveira, 1990). The Cucuteni-Baiceni gully is representative from amorphological and dynamic point of view. Selected for a prolonged monitoring from the
6911

HESSD8, 6907–6937, 2011
Use of the 3-Dscanner in MAPPING
G. Romanescu et al.
Title Page
Abstract Introduction
Conclusions References
Tables Figures
J I
J I
Back Close
Full Screen / Esc
Printer-friendly Version
Interactive Discussion
Discussion
Paper
|D
iscussionP
aper|
Discussion
Paper
|D
iscussionP
aper|
beginning of 2008 it is located near the most important chalcolithic archaeological siteon the territory of the Moldavian plateau, and affects its integrity. Citadel Hill remains ofthe Cucuteni culture were discovered, unique in Europe (Boghean, 2004; Ursulescu,2006; Cotiuga and Cotoi, 2006).
From the geomorphological point of view it is found within the following typology: a5
longitudinal profile form: continuous, as the plan configuration (two points of origin) orfront (the bank); after locating in the basin: the slope; by form of cross-section: theshape of “V”; after the development cycle: perennial (with banks).
On the territory of the Moldavian Plateau 9000 ravines have been inventoried. Mi-croform relief leads to significant losses of soil and causes mal gravitational processes10
(Radoane et al., 1999). Gullying processes triggering causes are found primarily inthe nature of the geological substratum of the landscape, climate change, pollutionphenomena and anthropogenic interventions (Blong et al., 1982).
The gullies of the Moldavian Plateau made a strong debut whose date was deter-mined to be 1828, when deforestation corresponded to the centre of these massive15
relief units. It seems that the afforestation rate in 1832 was across the entire plateau ofover 47 %. In 1893 it amounted to 21.9 % (Poghirc, 1972).The development of forestsin the nineteenth century was strongly influenced by land laws in the years 1828, 1842,1864, 1877 and 1881. Stepping gullies in recent years has been due to poor roadinfrastructure and inadequate agricultural techniques. To these must be added the20
Land Law of 18/1991 which led to a strong fragmentation of arable land properties,and whose effect was almost entirely oriented towards the hill-valley direction.
Specific linear erosion of the gullies occurs when surface flow is concentrated ina context of increasing kinetic energy of liquid flow resistance and a decrease of thesubstrate or protective coating plant (Ionita, 2000). In the Moldovian Plateau the critical25
season for gullying was set for March 15 to 20 and July 15 to 20 (Ionita, 2000). Thisrole took it to the cold season (57 %), while forming 43 % of the hot season. In fact,the material was prepared by the winter freeze-thaw phenomena. This case is dueto the strong brittle substrate of the gully (loess, clay, sand, sandstone, etc.) slope
6912

HESSD8, 6907–6937, 2011
Use of the 3-Dscanner in MAPPING
G. Romanescu et al.
Title Page
Abstract Introduction
Conclusions References
Tables Figures
J I
J I
Back Close
Full Screen / Esc
Printer-friendly Version
Interactive Discussion
Discussion
Paper
|D
iscussionP
aper|
Discussion
Paper
|D
iscussionP
aper|
and special hydroclimatic conditions (Bacauanu et al., 1980; Branzila, 1999). Recentyears have seen increasingly more frequent and torrential spring rains, with amountsthat sometimes exceed those of the summer. At the same time strong erosion of thespring coincides with a field devoid of vegetation, and at the same time ploughed, inpreparation for sowing.5
The Moldavian Plateau, with its extra-Carpathian position is temperate continentalwith some excessive nuances. For W and NW a moderate continental climate charac-teristic of western continental interferes (Pantazica, 1974). The most characteristic ofthe Eastern European influences are the imprinted predominance of cold air massesduring the winters and hot and dry summers. Annual average temperatures have val-10
ues of 7.5–10 ◦C, with variations increasing in the N-S direction. Rainfall is between500–700 mm, with lower values in the lower, southern sectors.
Climatic nuances are caused by latitude and altitude of the mountain chain shelter.Suceava Plateau has a colder climate, rich in moisture in NW Europe due to cyclonicinfluences. On the Barlad plateau continental influences are felt to generate large15
thermal contrasts. Cold winters, dry summers and snow storms with torrential rain arecharacteristic of the invasion of continental air in the Moldavian Plain (Erhan, 2001).
Between 1 October 2008 and 31 October 2009, the first measurements were taken.The amount of precipitation which fell at Cotnari station was 569.4 mm. The max-imum amount of precipitation which fell within the range observed is relatively low.20
For erosive phenomena in the gullies, torrential rains, always present in this area,are very important. The largest amounts of precipitation were recorded on 12 Febru-ary 2009 (21.8 mm), 3 August 2009 (16.7 mm), 6 March 2009 (30.8 mm), 25 June 2009(24.2 mm), 29 June 2009 (41.4 mm), 13 July 2009 (18.8 mm), 13 October 2009(16.8 mm). Quantities exceeding 20 mm in 24 h occurred during the summer (June–25
July) when the vegetation is relatively dry and soil will be eroded easily. Under normalprecipitation, with averages of about 600 mm year−1, the gully shows reduced dynam-ics. In the first year of monitoring, rainfall was below the annual average of the location.In this case, the changes were minor. In the remaining six months of monitoring, the
6913
HESSD8, 6907–6937, 2011
Use of the 3-Dscanner in MAPPING
G. Romanescu et al.
Title Page
Abstract Introduction
Conclusions References
Tables Figures
J I
J I
Back Close
Full Screen / Esc
Printer-friendly Version
Interactive Discussion
Discussion
Paper
|D
iscussionP
aper|
Discussion
Paper
|D
iscussionP
aper|
quantity of precipitation amounted to 263.9 mm (November 2009–April 2010). An im-portant factor was that this amount of water was stored in its entirety as a layer ofsnow, favoured by very low winter temperatures. Melting of snow and the large amountof precipitation that fell in April 2010 (65.9 mm) made dynamic gullies react extremelyrapidly. For this reason the measurement was made as number three, immediately5
after the collapse of the large central wall of gullies.Deforestation and the felling of the forest led to important changes in the characteris-
tics of the general climate in eastern Romania (Siret and Prut river basins), especially,increasing the tendency of torrential rains as well as growing aridity. Rainfall frequencyvalues of more than 100 mm/24 h increased from 1.7 before 1900 to 47.9 in the pe-10
riod 1981–2000. After homogenization of the data (adjusted values as a result of theincreased number of hydrometric posts) percentages have changed: by 7.7 before1900 to 35.9 between 1981–2000 (Fig. 2). After 2000 there were common values of200 mm/24 h, especially during the floods of 2004, 2005, 2006, 2008 and 2010 (Ple-soianu and Olariu, 2010). However, deforestation was required and therefore the need15
for land suitable for grazing animals.In the gullies, geomorphological processes are dominant in the vegetation (col-
lapses, landslides, surface runoff, muddy surface run-off, bad-land-measures, etc.) aswell as longitudinal transport. The peaks are the most dynamic sections of the entiretyof the gullies. Typically, the ratio between the bank and the processes of longitudi-20
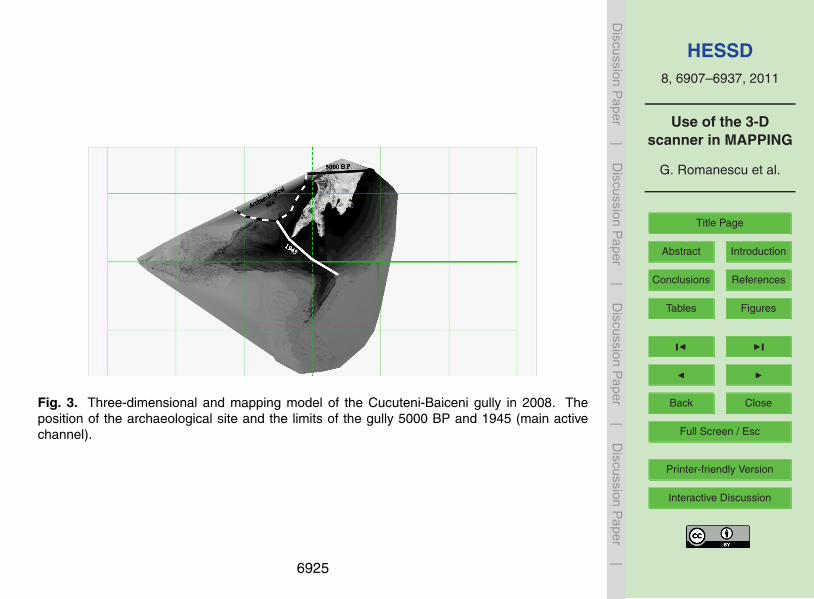
nal transport ranges from 0.1 to 10 (between 1–10 in excess of 50 %). Overall, theprocesses which contribute to shore erosion gullies are 1–5 times more than the pro-cesses of deepending. The average rate of advancement of gullies in the MoldavianPlateau, from the empirical data analyzed, indicates a value of 1.5 m yr−1 (Radoane etal., 1995). In the case of the Cucuteni-Baiceni ravines two empirical evaluations can25
be made. According to military plans made in the course of the Second World War,the central cornice, between the two branches of the ravines, was located about 40 moutside (Fig. 3). For a period of 65 yr, this resulted in an average rate of erosion of0.61 m per year. If gullies relate to the main peak, the central cornice lay at a distance
6914

HESSD8, 6907–6937, 2011
Use of the 3-Dscanner in MAPPING
G. Romanescu et al.
Title Page
Abstract Introduction
Conclusions References
Tables Figures
J I
J I
Back Close
Full Screen / Esc
Printer-friendly Version
Interactive Discussion
Discussion
Paper
|D
iscussionP
aper|
Discussion
Paper
|D
iscussionP
aper|
of about 200 m. In this case the average erosion rate was 3 m per year (with refer-ence to the main active channel) or 6.48 m per year (with reference to the secondarychannel). The second assessment related to a period of more than 5000 yr, when thesettlement was located on the outskirts of the Cucuteni forested slope in the form ofgullying. At this scale, the erosion rate was 0.07 m per year (340.15 m) or 0.11 m per5
year (561.80 m). This figure may not be relevant because we do not have the neces-sary data to indicate times of deforestation and the changing use of land. However,deforestation was required in view of the need for land suitable for grazing animals.
Eastern Romania (or the region of Moldavia as it is known), under the influence of acontinental climate with excessive nuances, soil erosion has high values. Of the mul-10
tiple causes, two are crucial: torrential rains and massive deforestation occurring in1990 (the year which coincides with land disposal to former owners). For this reasonlinear erosion was not uniform or rhythmic, but created phenomena related to the pro-duction of high-risk disaster. Values of the erosion of 5–10 m per year were registeredwith the phenomena of powerful thunderstorms. In normal years in terms of rainfall,15
with rain falling throughout the year in a relatively uniform fashion, erosion is reduced.Between 2008 and the measurements of the 2010 bank, radical changes occurred
between the two branches of the gullies, the position of the riverbed and the length ofthe two branches (Figs. 4, 5).
Talweg gullies extended along the main route by about 7 m due to regressive ero-20
sion. The equilibrium profile was altered by drawing convex curves. Talweg gullieswith 7.68 m sides were shortened by reducing the drifting index. The junction point isrelatively stable because the material was deposited as a result of erosion occurringwithin gullies. In this case the talweg joint remained at a value of 78.61 m.
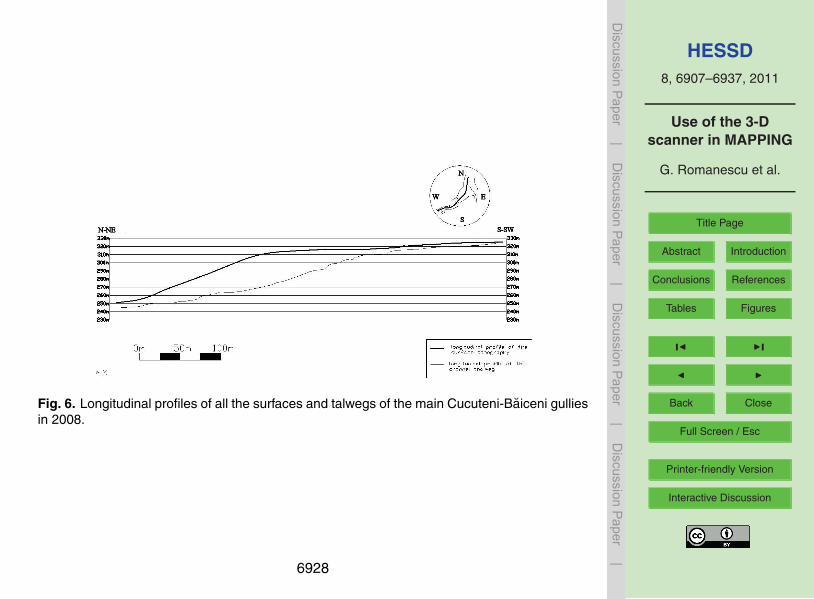
In the main gully, significant changes in the longitudinal profile took place through25
erosion or the deposit of brittle material (Figs. 6, 7). A strong reduction of thresholdsand increased convexity can be observed. The phenomenon is due to erosion, giventhe prominence of the areas and the deposit of material on the gentle slope.
Altitude, gully, and outlet head remain, in principle, at the same rate.
6915

HESSD8, 6907–6937, 2011
Use of the 3-Dscanner in MAPPING
G. Romanescu et al.
Title Page
Abstract Introduction
Conclusions References
Tables Figures
J I
J I
Back Close
Full Screen / Esc
Printer-friendly Version
Interactive Discussion
Discussion
Paper
|D
iscussionP
aper|
Discussion
Paper
|D
iscussionP
aper|
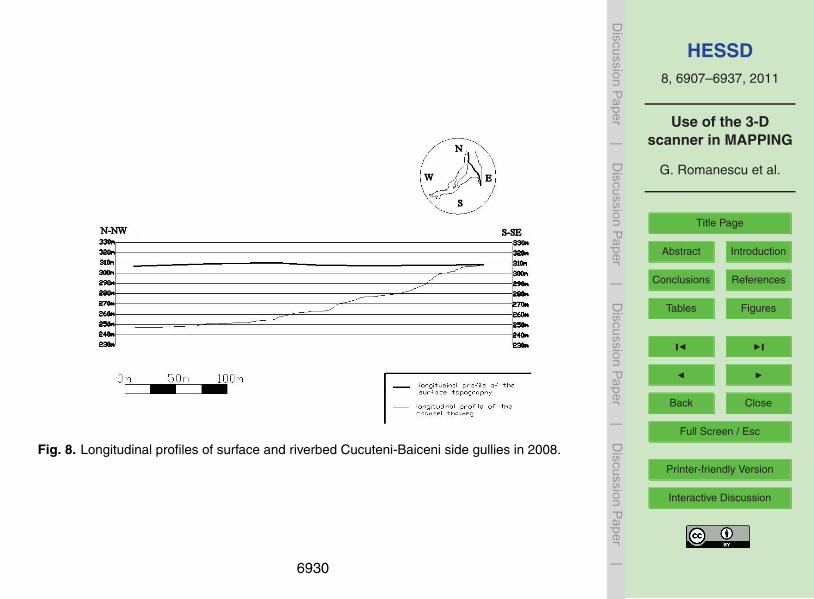
The changes were produced in the longitudinal profile of the weaker side gullies forprecedence, but were important for their relatively small size (Figs. 8, 9).
Altitude, head left-side gullies, took place, in principle, at the same rate. However, theoutlet is located at a higher rate because the amount of material transported, followinga pronounced slope, is high.5
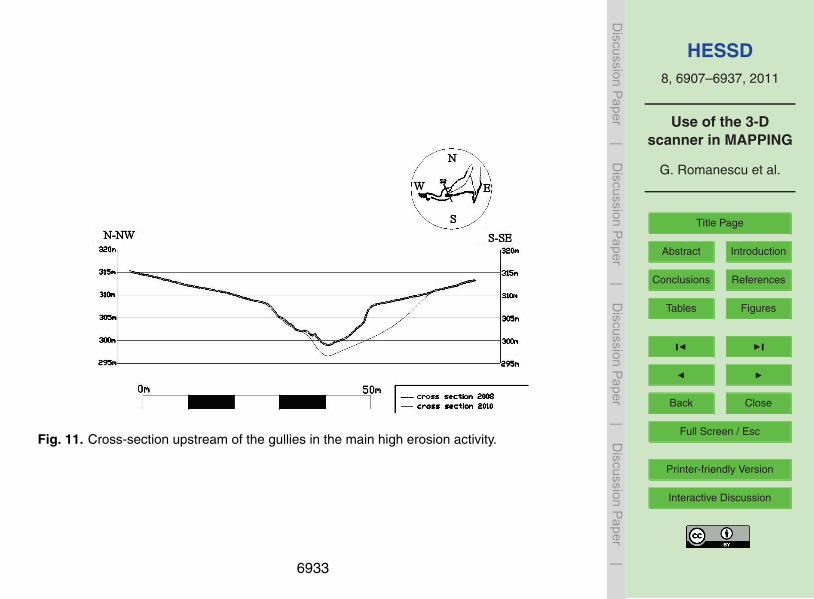
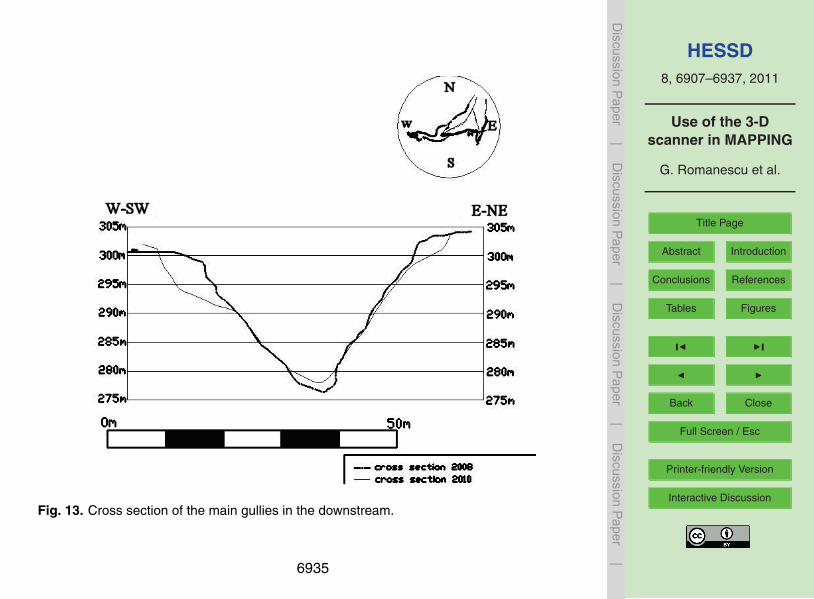
Obvious changes are seen in the transverse profiles, especially at the points thresh-old (Figs. 10, 11, 12, 13, 14). In areas upstream at the end of the two gullies (primaryand secondary) there are relatively minor changes to the common outlet. The slightwidening of the heads of gullies is noted, while the mouth shows minor lifting.
The strongest erosion occurs on the right bank of the main gullies at the junction10
with secondary gully, where the slope is steep. In this case the withdrawal is about10 m. The average of 7.5 m per year is explained by the high friability of the rock, highslope and large amount of precipitation during the winter of 2009–2010. In 2008–2009,when precipitation was within the normal intervals, erosion gullies amounted to valuesbelow 1 m per year. As the average values were exceeded, especially during increased15
frequency and intensity of rainfall values over 20–50 mm/24 h, erosion increased expo-nentially. Therefore, the average represents a long reality with complex phenomena.Sequential, erosive situations are totally different.
In the bottom of the main gullies occurs due to a strong phenomenon an attractivelyhigh quantity of material moved, but not removed within gullies (Fig. 14). For secondary20
gullies significant changes are noted on the slopes, in the thalweg. Dislodged materialis found, for the most part, within its own valley.
The Cucuteni-Baiceni sector outlet of gullies provide a relatively stable area, becauseof the loose material deposited inside the valley. It will be able to be freed when thethreshold of accumulated material is diminished by the outlet of materials deposited25
behind it.
6916

HESSD8, 6907–6937, 2011
Use of the 3-Dscanner in MAPPING
G. Romanescu et al.
Title Page
Abstract Introduction
Conclusions References
Tables Figures
J I
J I
Back Close
Full Screen / Esc
Printer-friendly Version
Interactive Discussion
Discussion
Paper
|D
iscussionP
aper|
Discussion
Paper
|D
iscussionP
aper|
The three-dimensional model and maps are made using a highly accurate 3-D scan-ner (6 mm/6 mm fidelity) and can be executed at the desired scale, depending on therequirement. To implement equidistant contour maps at 1m, parasites also appearwhich represent vegetation or bodies placed there by Man. They can be removed bycomputer and data-processing. In this case, they may have a higher accuracy. The5
measurement carried out using the 3-D scanner is more accurate and faster than any-thing carried out using Total Station or other tools. The most important issue is relatedto the georeferenced points, which were surveyed in their dynamics, especially due tothe intense activity of the gully. Measurements must be repeated frequently to monitorreality more closely.10
It can be noticed that among the three measurements taken at an interval of exactlyone year, and then six months, that the strongest erosion occurred at the end cornicesbetween the side gullies (Fig. 15). Lateral erosion occurs predominantly on the “minorbed” sides of gullying on the slopes which are themselves very low, and now coveredwith herbaceous vegetation. The collapse occurred in the largest sector of the two15
branches of the gullies, where the bank is steep and lacking support. Fouling occursdirectly in the bed of the gullying which therefore abruptly changed its position. Theoutlet of the gullies was practically alluvial and the loose material inside stagnated.Sedimentation of the riverbed is specific between the two side arms. Extending up-stream in two arms different attractive outlets are visible, with values ranging between20
20–25 cm and 1m. This is due to the heavy rains in the period analyzed. They wereappropriately strong and fell during summer. This area is conducive to high erosion.
Withdrawal from the cornice by the stronger of the two branches of the gully wasdue to the collapse of the slopes. Accumulation of material was based on the bank, onthe interfluve. The withdrawal amount was well above average and the forecast for the25
large gullies of the Moldavian Plateau indicates a permanent withdrawal on the samealignment.
The Cucuteni-Baiceni gullies show an increased degree of dynamism, due to a com-bination of factors, among which the high slope of the slope, brittle material that forms
6917
HESSD8, 6907–6937, 2011
Use of the 3-Dscanner in MAPPING
G. Romanescu et al.
Title Page
Abstract Introduction
Conclusions References
Tables Figures
J I
J I
Back Close
Full Screen / Esc
Printer-friendly Version
Interactive Discussion
Discussion
Paper
|D
iscussionP
aper|
Discussion
Paper
|D
iscussionP
aper|
the substrate, the lack of forest and intensive agricultural use of the adjacent shelf, thetorrential rainfall, etc., are prominent.
The volume of the Cucuteni-Baiceni gullies was calculated for each measurementperiod, but it remains constant as a result of the eroded materials deposited throughoutthe interior valley. In the period under review, the material was not set in motion by the5
enclosure gullies. Unfortunately, in this gully, like many others across the MoldavianPlateau, quick action will not bring about protection because they do not affect a humansettlement, but an archaeological site. The history and culture of the Romanian peopledo not feature on the current agenda of the Romanian government.
5 Conclusions10
Taking measurements is a new speciality in the Romanian literature and therefore somedifficulties were encountered in accurately estimating the rate of erosion and its accu-mulation, in calculating the volume of displaced material, etc. Finally they were re-solved. Using 3-D scanner is extremely easy, and accurate data obtained were verygood.15
From this point of view the geomorphology field will have basic support in using thistool. By using a 3-D scanner, morphometric measurements were made to prepare atopographical map as well as a detailed and accurate three-dimensional model (accu-racy 6 mm), including dynamic gullies. This is a typical form of relief which contributesto soil degradation and the measures required to stabilize a process of this kind.20
For a period of 1.6 yr the Cucuteni gully has moved quickly and experienced a degreeof warping at an accelerated rate in its drainage. This is the case of strong gullies,given the specific eastern Europe hydroclimatic conditions, substrate and slope. Theaverage regression of the Cucuteni-Baiceni gullies is a much higher (10 m/1.6 yr, thatis 7.5 m yr−1) average in the content of the Moldavian Plateau (1.5 m yr−1). At a pace25
of this kind, in less than 20 yr the whole archaeological site near the gullies will beaffected. On a historical scale, over a period for 5000 yr, the erosion rate is relatively
6918

HESSD8, 6907–6937, 2011
Use of the 3-Dscanner in MAPPING
G. Romanescu et al.
Title Page
Abstract Introduction
Conclusions References
Tables Figures
J I
J I
Back Close
Full Screen / Esc
Printer-friendly Version
Interactive Discussion
Discussion
Paper
|D
iscussionP
aper|
Discussion
Paper
|D
iscussionP
aper|
reduced (0.07 or 0.11 m per year). From the end of the Second World War until thepresent date, the average rate of erosion of the Cucuteni-Biceni gullies was 0.61 m peryear. An important reason for the acceleration of erosion in recent years has beenthe intensity of torrential rains. Their growth has been notable, especially in EasternRomania, where the continental climate experiences significant nuances.5
Urgent measures of protection are required to stop farming in the area and hencealso the archaeological site of the gullies. There should be emergency afforestation inthe related basin slopes, a grazing ban, etc. The 3-D scanner can be used in variousfields of physical geography, especially geomorphology, hydrology, cartography, etc.For the moment, appropriate methodology is being developed using these tools for the10
entire range of processes that contribute to shaping the current landscape.
Acknowledgements. We extend our thanks to the Geo-archaeology Laboratory within the Fac-ulty of Geography and Geology, Alexandru Ioan Cuza University, Iasi, which provided the in-struments and carried out the data-processing.
References15
Bacauanu, V.: Campia Moldovei, Studiu geomorphologic, Editura Academiei Romane, Bu-curesti, 222 pp., 1968.
Bacauanu, V., Barbu, N., Pantazica, M., Ungureanu, A., and Chiriac, D.: Podisul Moldovei.Natura, om, economie, Editura Stiintifica si Enciclopedica, Bucuresti, 347 pp., 1980.
Barnolas, M., Rigo, T., and Llasat, M. C.: Characteristics of 2-D convective structures in Catalo-20
nia (NE Spain): an analysis using radar data and GIS, Hydrol. Earth Syst. Sci., 14, 129–139,doi:10.5194/hess-14-129-2010, 2010.
Blong, R. J., Graham, O. P., and Veness, J. A.: The role of side wall processes in gully de-velopment; some N.S.W. examples, Earth Surface Processes and Landforms, 7, 381–385,1982.25
Boghean, D.: Comunitatile cucuteniene din bazinul Bahlui, Editura Universitatii Stefan cel Mare,Suceava, 248 pp., 2004.
6919

HESSD8, 6907–6937, 2011
Use of the 3-Dscanner in MAPPING
G. Romanescu et al.
Title Page
Abstract Introduction
Conclusions References
Tables Figures
J I
J I
Back Close
Full Screen / Esc
Printer-friendly Version
Interactive Discussion
Discussion
Paper
|D
iscussionP
aper|
Discussion
Paper
|D
iscussionP
aper|
Bohler, W. and Marbs, A.: 3-D Scanning Instruments. CIPA, Heritage Documentation – In-ternational Workshop on Scanning for Cultural Heritage Recording, available on-line: http://www.i3mainz.fh-mainz.de, 2006.
Bornaz, L. and Rinaudo, F.: Terrestrial laser scanner data processing. XXth ISPRS Congress,Turkey, available on-line: http://www.isprs.org/istanbul2004, 2004.5
Bradford, J. M., Piest, R. F., and Spomer, R. G.: Failure sequence of gully headwalls in WesternIowa, Soil Sci. Soc. Am. J., 42(2), 323–328, 1978.
Branzila, M.: Geologia partii sudice a Campiei Moldovei, Editura Corson, Iasi, 221 pp., 1999.Bretar, F., Chauve, A., Bailly, J.-S., Mallet, C., and Jacome, A.: Terrain surfaces and 3-D land-
cover classification from small footprint full-waveform lidar data: application to badlands,10
Hydrol. Earth Syst. Sci., 13, 1531–1544, doi:10.5194/hess-13-1531-2009, 2009.Bull, L. J. and Kirkby, M. J.: Gully processes and modeling, Prog. Phys. Geog., 21(3), 354–374,
1997.Casas, A., Lane, S. N., Yu, D., and Benito, G.: A method for parameterising roughness and
topographic sub-grid scale effects in hydraulic modelling from LiDAR data, Hydrol. Earth15
Syst. Sci., 14, 1567–1579, doi:10.5194/hess-14-1567-2010, 2010.Cotiuga, V. and Cotoi, O.: Parcul arheologic experimental de la Cucuteni, Cucuteni-Cetatuie –
Monografie arheologica, Piatra Neamt, 337–351, 2004.De Oliveira, M. A. T.: Slope geometry and gully erosion development: Bananal, Sao Paulo,
Brazil, Zeitschrift fur Geomorphology N.F., 34(4), 423–434, 1990.20
Erhan, E.: Consideratii privind resursele climatice ale Moldovei, Lucrarile Seminarului Ge-ografic “Dimitrie Cantemir”, 19–20, 50–57, 2001.
Ernst, J., Dewals, B. J., Detrembleur, S., Archambeau, P., Erpicum, S., and Pirotton, M.: Mi-croscale flood risk analysis based on detailed 2D hydraulic modeling and high resolutiongeographic data, Natural Hazards, 55(2), 181–209, doi:10.1007/s11069-010-9520-y, 2010.25
Harvey, A. M.: Process interactions, temporal scales and the development of hillslope gullysystem: Howgill Fells, northwest England, Geomorphology, 5(3–5), 323–344, 1992.
Heede, B. H.: Gully development and Control: The Status of our Knowledge, U.S. Departmentof Agriculture, Forest Service Research Paper RM-169, 40 pp., 1976.
Ionita, I.: Geomorfologie aplicata, Editura Universitatii Alexandru Ioan Cuza, Iasi, 250 pp.,30
2000.Ionita, I.: Gully development in the Moldavian Plateau of Romania, Catena, 68(2–3), 133–140,
2006.
6920

HESSD8, 6907–6937, 2011
Use of the 3-Dscanner in MAPPING
G. Romanescu et al.
Title Page
Abstract Introduction
Conclusions References
Tables Figures
J I
J I
Back Close
Full Screen / Esc
Printer-friendly Version
Interactive Discussion
Discussion
Paper
|D
iscussionP
aper|
Discussion
Paper
|D
iscussionP
aper|
James, T. D., Carbonneau, P. E., and Lane, S. N.: Investigating the effects of DEM error inscaling analysis, Photogrammetric engineering and remote sensing, 73(1), 67–78, 2007.
Kern, F.: Precise Determination of Volume with Terrestrial 3-D-Laser scanner, in: Geodesy forGeotechnical and Structural Engineering II, edited by: Kahmen, H., Niemeier, W., Retscher,G., Berlin, 531–534, 2002.5
Lane, S. N.: Living with hazard and risk, Geography, 93 (Part 2), 66–68, 2008.Leica HDS3000 data sheet: available online: http://www.leica-geosystems.com/hds/en/lgs
5574.htm, 2006.Milan, D. G., Heritage, G. L., and Hetherington, D.: Application of a 3-Dlaser scanner in the
assessment of erosion and deposition volumes and channel change in a proglacial river,10
Earth Surf. Proc. Land., 32, 1657–1674, 2007.Pantazica, M.: Hidrografia Campiei Moldove, Editura Junimea, Iasi, 317 pp. 1974.Phillips, J. D.: Evolutionary geomorphology: thresholds and nonlinearity in landform response
to environmental change, Hydrol. Earth Syst. Sci., 10, 731–742, doi:10.5194/hess-10-731-2006, 2006.15
Plesoianu, D. and Olariu, P.: Cateva observatii privind inundatiile produse in anul 2008 in baz-inul Siretului, Analele Universitatii “Stefan cel Mare” Suceava, Sectiunea Geografie, 19, 69–80, 2010.
Poghirc, P.: Satul din Colinele Tutovei, Editura Stiintifica, Bucuresti, 240 pp., 1972.Radoane, M., Ichim, I., and Radoane, N.: Gully distribution and development in Moldavia,20
Romania, Catena, 24, 127–146, 1995.Radoane, M., Radoane, N., Ichim, I., and Surdeanu, V.: Ravenele. Forme, procese, evolutie,
Editura Presa Universitara Clujeana, Cluj-Napoca, 268 pp., 1999.Radoane, M., Radoane, N., Cristea, I., Popescu, L., Barnoaia, I., Budui, V., and Chiriloaiei, F.:
Monitorizarea evolutiei ravenelor test din Podisul Moldovei in perioada 1986–2008, Analele25
Universitatii Stefan cel Mare, Suceava, serie Geografie, 17, 7–19, 2009.Romanescu, G., Romanescu, G. T., Stoleriu, C., and Ursu, A.: Inventarierea si tipologia zonelor
umede si apelor adanci din Podisul Moldovei, Editura Terra Nostra, Iasi, 244 pp., 2008.Romanescu, G.: Siret river basin planning (Romania) and the role of wetlands in dimin-
ishing the floods, WIT Transaction on Ecology and the Environment, 125, 439–453,30
doi:10.2495/WRM090391, 2009.Romanescu, G. and Nistor, I.: The effect of the July 2005 catastrophic inundations in the Siret
River’s Lower Watershed, Romania, Natural Hazards, 57(2), 345–368, doi:10.1007/s11069-
6921

HESSD8, 6907–6937, 2011
Use of the 3-Dscanner in MAPPING
G. Romanescu et al.
Title Page
Abstract Introduction
Conclusions References
Tables Figures
J I
J I
Back Close
Full Screen / Esc
Printer-friendly Version
Interactive Discussion
Discussion
Paper
|D
iscussionP
aper|
Discussion
Paper
|D
iscussionP
aper|
010-9617-3, 2011.Romanescu, G., Jora, I., and Stoleriu, C.: The most important high floods in Vaslui river basin
– causes and consequences, Carpath. J. Earth Env., 6(1), 119–132, 2011a.Romanescu, G., Stoleriu, C., and Romanescu, A.M.: Water reservoirs and the risk of acci-
dental flood occurrence. Case study: Stanca–Costesti reservoir and the historical floods of5
the Prut river in the period July–August 2008, Romania, Hydrol. Process., 25, 2056–2070,doi:10.1002/hyp.7957, 2011b.
Ursulescu, N.: Donees recentes concernant l’histoire des communautes eneolithique de lacivilisation Cucuteni, Acta Terrae Septemcastrensis Journal, 5, 79–113, 2006.
Vandaele, K., Poesen, J., Govers, G., and Wesenael, van B.: Geomorphic threshold con-10
ditions for ephemeral gully incision, Geomorphology, 16(2), 161–173, doi:10.1016/0169-555x(95)00141-Q, 1996.
6922

HESSD8, 6907–6937, 2011
Use of the 3-Dscanner in MAPPING
G. Romanescu et al.
Title Page
Abstract Introduction
Conclusions References
Tables Figures
J I
J I
Back Close
Full Screen / Esc
Printer-friendly Version
Interactive Discussion
Discussion
Paper
|D
iscussionP
aper|
Discussion
Paper
|D
iscussionP
aper|
12
Fig. 1. The geographical location of the Cucuteni-Baiceni gullies and plateau in Romania and
Moldova
Fig. 1. The geographical location of the Cucuteni-Baiceni gullies and plateau in Romania andMoldova.
6923

HESSD8, 6907–6937, 2011
Use of the 3-Dscanner in MAPPING
G. Romanescu et al.
Title Page
Abstract Introduction
Conclusions References
Tables Figures
J I
J I
Back Close
Full Screen / Esc
Printer-friendly Version
Interactive Discussion
Discussion
Paper
|D
iscussionP
aper|
Discussion
Paper
|D
iscussionP
aper|
13
Fig. 2. The frequency of maximum precipitation above 100mm registred in 24 hours
Fig. 2. The frequency of maximum precipitation above 100 mm registred in 24 h.
6924
HESSD8, 6907–6937, 2011
Use of the 3-Dscanner in MAPPING
G. Romanescu et al.
Title Page
Abstract Introduction
Conclusions References
Tables Figures
J I
J I
Back Close
Full Screen / Esc
Printer-friendly Version
Interactive Discussion
Discussion
Paper
|D
iscussionP
aper|
Discussion
Paper
|D
iscussionP
aper|
14
Fig. 3. Three-dimensional and mapping model of the Cucuteni-Baiceni gully in 2008. The
position of the archaeological site and the limits of the gully 5000 B.P. and 1945 (main active
channel)
Fig. 3. Three-dimensional and mapping model of the Cucuteni-Baiceni gully in 2008. Theposition of the archaeological site and the limits of the gully 5000 BP and 1945 (main activechannel).
6925

HESSD8, 6907–6937, 2011
Use of the 3-Dscanner in MAPPING
G. Romanescu et al.
Title Page
Abstract Introduction
Conclusions References
Tables Figures
J I
J I
Back Close
Full Screen / Esc
Printer-friendly Version
Interactive Discussion
Discussion
Paper
|D
iscussionP
aper|
Discussion
Paper
|D
iscussionP
aper|
15
Fig. 4. Longitudinal profiles of surface and principal gullies on the Cucuteni-Baiceni side gullies
in 2008
Fig. 4. Longitudinal profiles of surface and principal gullies on the Cucuteni-Baiceni side gulliesin 2008.
6926

HESSD8, 6907–6937, 2011
Use of the 3-Dscanner in MAPPING
G. Romanescu et al.
Title Page
Abstract Introduction
Conclusions References
Tables Figures
J I
J I
Back Close
Full Screen / Esc
Printer-friendly Version
Interactive Discussion
Discussion
Paper
|D
iscussionP
aper|
Discussion
Paper
|D
iscussionP
aper|
16
Fig. 5. Morphometry of the Cucuteni-Baiceni gullies in 2010
Fig. 5. Morphometry of the Cucuteni-Baiceni gullies in 2010.
6927
HESSD8, 6907–6937, 2011
Use of the 3-Dscanner in MAPPING
G. Romanescu et al.
Title Page
Abstract Introduction
Conclusions References
Tables Figures
J I
J I
Back Close
Full Screen / Esc
Printer-friendly Version
Interactive Discussion
Discussion
Paper
|D
iscussionP
aper|
Discussion
Paper
|D
iscussionP
aper|
17
Fig. 6. Longitudinal profiles of all the surfaces and talwegs of the main Cucuteni-Băiceni gullies
in 2008
Fig. 6. Longitudinal profiles of all the surfaces and talwegs of the main Cucuteni-Baiceni gulliesin 2008.
6928

HESSD8, 6907–6937, 2011
Use of the 3-Dscanner in MAPPING
G. Romanescu et al.
Title Page
Abstract Introduction
Conclusions References
Tables Figures
J I
J I
Back Close
Full Screen / Esc
Printer-friendly Version
Interactive Discussion
Discussion
Paper
|D
iscussionP
aper|
Discussion
Paper
|D
iscussionP
aper|
18
Fig. 7. Longitudinal profiles of surface and riverbed of the main Cucuteni-Baiceni gullies 2010
Fig. 7. Longitudinal profiles of surface and riverbed of the main Cucuteni-Baiceni gullies 2010.
6929
HESSD8, 6907–6937, 2011
Use of the 3-Dscanner in MAPPING
G. Romanescu et al.
Title Page
Abstract Introduction
Conclusions References
Tables Figures
J I
J I
Back Close
Full Screen / Esc
Printer-friendly Version
Interactive Discussion
Discussion
Paper
|D
iscussionP
aper|
Discussion
Paper
|D
iscussionP
aper|
19
Fig. 8. Longitudinal profiles of surface and riverbed Cucuteni-Baiceni side gullies in 2008
Fig. 8. Longitudinal profiles of surface and riverbed Cucuteni-Baiceni side gullies in 2008.
6930

HESSD8, 6907–6937, 2011
Use of the 3-Dscanner in MAPPING
G. Romanescu et al.
Title Page
Abstract Introduction
Conclusions References
Tables Figures
J I
J I
Back Close
Full Screen / Esc
Printer-friendly Version
Interactive Discussion
Discussion
Paper
|D
iscussionP
aper|
Discussion
Paper
|D
iscussionP
aper|
20
Fig. 9. Longitudinal profiles of the surface and river bed Cucuteni-Baiceni side gullies in 2010
Fig. 9. Longitudinal profiles of the surface and riverbed Cucuteni-Baiceni side gullies in 2010.
6931

HESSD8, 6907–6937, 2011
Use of the 3-Dscanner in MAPPING
G. Romanescu et al.
Title Page
Abstract Introduction
Conclusions References
Tables Figures
J I
J I
Back Close
Full Screen / Esc
Printer-friendly Version
Interactive Discussion
Discussion
Paper
|D
iscussionP
aper|
Discussion
Paper
|D
iscussionP
aper|
21
Fig. 10. Cross-section in the upstream of the main gullies
Fig. 10. Cross-section in the upstream of the main gullies.
6932
HESSD8, 6907–6937, 2011
Use of the 3-Dscanner in MAPPING
G. Romanescu et al.
Title Page
Abstract Introduction
Conclusions References
Tables Figures
J I
J I
Back Close
Full Screen / Esc
Printer-friendly Version
Interactive Discussion
Discussion
Paper
|D
iscussionP
aper|
Discussion
Paper
|D
iscussionP
aper|
22
Fig. 11. Cross-section upstream of the gullies in the main high erosion activity
Fig. 11. Cross-section upstream of the gullies in the main high erosion activity.
6933

HESSD8, 6907–6937, 2011
Use of the 3-Dscanner in MAPPING
G. Romanescu et al.
Title Page
Abstract Introduction
Conclusions References
Tables Figures
J I
J I
Back Close
Full Screen / Esc
Printer-friendly Version
Interactive Discussion
Discussion
Paper
|D
iscussionP
aper|
Discussion
Paper
|D
iscussionP
aper|
23
Fig. 12. Cross-section of the main gullies in the downstream
Fig. 12. Cross-section of the main gullies in the downstream.
6934
HESSD8, 6907–6937, 2011
Use of the 3-Dscanner in MAPPING
G. Romanescu et al.
Title Page
Abstract Introduction
Conclusions References
Tables Figures
J I
J I
Back Close
Full Screen / Esc
Printer-friendly Version
Interactive Discussion
Discussion
Paper
|D
iscussionP
aper|
Discussion
Paper
|D
iscussionP
aper|
24
Fig. 13. Cross section of the main gullies in the downstream
Fig. 13. Cross section of the main gullies in the downstream.
6935

HESSD8, 6907–6937, 2011
Use of the 3-Dscanner in MAPPING
G. Romanescu et al.
Title Page
Abstract Introduction
Conclusions References
Tables Figures
J I
J I
Back Close
Full Screen / Esc
Printer-friendly Version
Interactive Discussion
Discussion
Paper
|D
iscussionP
aper|
Discussion
Paper
|D
iscussionP
aper|
25
Fig. 14. Cross section of the Cucuteni-Baiceni outlet gullies
Fig. 14. Cross-section of the Cucuteni-Baiceni outlet gullies.
6936

HESSD8, 6907–6937, 2011
Use of the 3-Dscanner in MAPPING
G. Romanescu et al.
Title Page
Abstract Introduction
Conclusions References
Tables Figures
J I
J I
Back Close
Full Screen / Esc
Printer-friendly Version
Interactive Discussion
Discussion
Paper
|D
iscussionP
aper|
Discussion
Paper
|D
iscussionP
aper|
26
Fig. 15. The areas of separation and change in the Cucuteni-Baiceni riverbed in the gully (2008-
2010)
Fig. 15. The areas of separation and change in the Cucuteni-Baiceni riverbed in the gully(2008–2010).
6937