use of the bayley scales of infant and toddler development
TRANSCRIPT
Research ArticleUse of the Bayley Scales of Infant and Toddler Development,Third Edition, to Assess Developmental Outcome in Infants andYoung Children in an Urban Setting in South Africa
Daynia E. Ballot,1 Tanusha Ramdin,1 David Rakotsoane,1 Faustine Agaba,1
Victor A. Davies,1 Tobias Chirwa,2 and Peter A. Cooper1
1Division of Neonatology, Department of Paediatrics and Child Health, University of the Witwatersrand,Private Bag X 39, Johannesburg 2000, South Africa2Division of Epidemiology and Biostatistics, School of Public Health, University of the Witwatersrand, Johannesburg, South Africa
Correspondence should be addressed to Daynia E. Ballot; [email protected]
Received 3 April 2017; Accepted 28 June 2017; Published 1 August 2017
Academic Editor: Mohamed Saad Zaghloul
Copyright © 2017 Daynia E. Ballot et al.This is an open access article distributed under theCreative CommonsAttribution License,which permits unrestricted use, distribution, and reproduction in any medium, provided the original work is properly cited.
Background. The Bayley Scales of Infant and Toddler Development (III) is a tool developed in a Western setting. Aim. To evaluatethe development of a group of inner city children in South Africa with no neonatal risk factors using the Bayley Scales of Infant andToddler Development (III), to determine an appropriate cut-off to define developmental delay, and to establish variation in scoresdone in the same children before and after one year of age. Methods. Cohort follow-up study. Results. 74 children had at least oneBayley III assessment at a mean age of 19.4 months (95% CI 18.4 to 20.4). The mean composite cognitive score was 92.2 (95% CI89.4 to 95.0), the mean composite language score was 94.8 (95% CI 92.5 to 97.1), and mean composite motor score was 98.8 (95%CI 96.8 to 101.0). No child had developmental delay using a cut-off score of 70. In paired assessments above and below one year ofage, the cognitive score remained unchanged, the language score decreased significantly (𝑝 = 0.001), and motor score increasedsignificantly (𝑝 = 0.004) between the two ages. Conclusion. The Bayley Scales of Infant and Toddler Development (III) is a suitabletool for assessing development in urban children in southern Africa.
1. Background
Developmental assessment of infants is a difficult and time-consuming task. Standardized tools such as the BayleyScales of Infant and Toddler Development provide a wayof assessing a young child’s development and comparingthis to a standardized norm [1]. The Bayley Scales of Infantand Toddler Development, third edition (Bayley III), waspublished in 2006 and is a well-accepted tool that assessesdevelopment of children between the ages of 1 month and 42months [1].The Bayley III is an updated version of the BayleyScales of Infant and Toddler Development, second edition(Bayley II). The Bayley II reports two scores of the mentaldevelopment index (MDI) and the psychomotor index (PDI)[2]. In the Bayley III, cognitive development, expressive andreceptive language, and fine and gross motor developmentare all evaluated. Composite scores are derived for cognitive,
language, and motor development and scaled to a metric,with a mean of 100, standard deviation of 15, and rangeof 40 to 160. Results can also be expressed as percentileranks relative to the standardization sample, with a meanand median of 50 and range from 1 to 99 [1]. The BayleyIII normative population was a Western population whosemother tongue was English.
Developmental assessment of young children in low andmiddle income countries (LMICS) is a challenge due tosocioeconomic, cultural, and language differences in thepopulations being tested. The Bayley III has been used toassess developmental outcome of children in South Africa;however there is very little published data on the performanceof normal children. Much of the work done using the BayleyIII in southern Africa was in assessing the development ofHIV infected children where the group of HIV exposed butuninfected (HEU) was used as a control [3, 4]. Springer et al.
HindawiInternational Scholarly Research NoticesVolume 2017, Article ID 1631760, 5 pageshttps://doi.org/10.1155/2017/1631760

2 International Scholarly Research Notices
have recently published a small study suggesting that thereis no difference in neurodevelopmental outcome betweenHEU children and HIV unexposed uninfected children [5].There is, however, increasing evidence that HEU children area vulnerable group themselves [6]. Rademeyer and Jacklinpublished a study evaluating the use of the Bayley III ininfants in South Africa [7]. Although this study investigatedan important question, therewere several important deficien-cies; the sample size was small, half the infants were underthe age of six months, and the results were compared to thenormative Western Bayley population. Another study usingthe Bayley III showed that the developmental outcome ofvery low birthweight (VLBW) children in South Africa haddevelopmental outcome within the normal range; howeverthis study did not have a control group [8].
African children from a low socioeconomic backgroundmay perform poorly on the Bayley III for several reasons.There may be lack of an enabling environment at homedue to a poor maternal level of education and poverty;poor children are not routinely exposed to educational toysand books which form a major part of the Bayley III tool.South Africa has eleven official languages; many childrenare exposed to more than one language at home. Someresearchers have developed their own assessment tools totry and compensate for these differences, for example, theMalawi Development Assessment Tool [9]. Unfortunately,there are large differences between populations of childrenwithinAfrica, including discrepancies in geographic location,socioeconomic status, and home language. It is thereforelikely that an African based developmental assessment toolwill be confounded by similar problems to the Bayley III.
Another question regarding the Bayley III relates tothe most appropriate cut-off for defining developmentaldelay. A composite score of 70 seems to be too low andthere are reports from studies using the Bayley III in highincome countries which raise the concern that the Bayley IIIunderestimates the number of children with developmentaldelay in comparison to Bayley II [2, 10]. A cut-off of 85 on thecomposite scores may be more appropriate in the Bayley III.
Loss to follow-up is a big problem in long-term follow-upstudies in LMICS, including Africa. It is also much quickerto do a Bayley III assessment in an infant under the ageof one year than in an older child. The question thereforearises as to whether the findings on a Bayley III assessmentdone under the age of one year remain the same at an olderage. Springer et al. report a 67% follow-up rate after oneyear for infants recruited at birth [5]. An important questionis whether early developmental assessment during infancyis sufficiently reliable to identify children with handicap.Although this question did not form part of their formalresearch, Rademeyer and Jacklin made the observation thatchildren tested between two and six months of age tended tohave higher scores on the Bayley III than those tested betweenseven and twelve months [7].
Many of the concerns outlined above can be addressed bythe use of a control group from the same population whendoing neurodevelopmental assessment studies in Africansettings. The control group provides a benchmark for com-parison for the group of interest and shows the performance
of normal children using a developmental assessment tool,such as the Bayley III.
The current study aims to describe the performance of agroup of normal inner city children in South Africa using theBayley III as compared to the Bayley normative population.Secondary objectives include evaluation of a cut-off of 70or 85 to define handicap and to determine the variability inBayley III scores done at different ages in the same child.
2. Methods
A group of well term neonates born between July 2013and October 2013 who were discharged home with theirmothers within 48 hours of birth was recruited. Childrenwith obvious abnormalities, such as trisomy 21, likely toaffect neurodevelopment were excluded. Mothers who haddelivered in hospital were informed of the follow-up studyand invited to attend a research newborn follow-up clinic.Children were enrolled into the follow-up study at the firstnewborn follow-up visit. Childrenwere seen at threemonthlyintervals. Owing to an anticipated high study fallout rate after1 year of age, Bayley III assessments were done at 9 to 12months of age and again at 15 to 20 months of age. If a childdefaulted, themotherwas contacted viamobile telephone andrebooked at the clinic; the Bayley III was done at the nextfollow-up visit that was attended, regardless of age.
The Bayley III assessments were done by an appropriatelytrained physiotherapist or paediatrician. Cronbach’s alphaintraclass correlation between different observers was 0.89.Intertest variation was evaluated comparing assessmentsdone before and after twelve months of age in the samepatients.
Measures taken to ensure a reasonable rate of follow-up included Short Message Service appointment reminders,refund of transport costs, tracing, and rebooking of default-ers. Children with developmental problems identified duringthe developmental assessment were referred to the appropri-ate paediatric or allied medical unit for therapy.
2.1. Statistical Analysis. Data were entered into a neonataldatabase, using Research Electronic Data Capture (RED-CAP) software, hosted by theUniversity of theWitwatersrand[11]. Data was exported into IBM SPSS 23 for statisticalanalysis. The Bayley III results were reported as the com-posite cognitive, language, and motor scores. All data werecontinuous variables with a normal distribution, so data weredescribed usingmean and 95%confidence intervals (95%CI).For the purposes of the primary aim, in children who hadmore than one assessment, the latest Bayley III assessmentresults were used. Paired 𝑡-tests were then used to comparethe first and second Bayley III assessments done on the samechildren at different ages. Significance was considered at alevel of 0.05.
Developmental delay was classified “at risk” if a Bayley IIIscore was below 85 on any of the language, cognitive, ormotor scales and as a “delayed” if a Bayley III score was below70 on any of the subscales [8]. The mean (standard devi-ation) of the original normative Bayley population was 100[1].The original normative population data had a bell-shaped

International Scholarly Research Notices 3
90 children enrolled
15 lost to follow-up 27 one Bayley IIIassessment
47 two Bayley IIIassessments
One trisomy 21
Figure 1: Enrolment of children for Bayley III assessment.
distribution; hence 15.86% of the original population hadscores below 85 and 2.27% of the original population hadscores below 70.
Sociodemographic factors were compared between chil-dren with normal versus delayed development. There weresmall numbers in this subanalysis, so categorical variableswere compared using Chi square analysis and continuousvariables using the Mann–Whitney 𝑈 test.
2.2. Ethics. The study was approved by the Human ResearchEthics Committee of the University of the Witwatersrand.Written informed consent was obtained from each parentprior to the child’s enrolment in the study.
3. Results
A total of 90 control children were enrolled for the follow-up study. One infant was diagnosed with trisomy 21 at thesecond follow-up visit and was excluded from the study. Ofthe remaining 89 children, 15 were lost to follow-up and 74had at least one Bayley III assessment done giving a follow-up rate of 83.14%. There was a high drop-out rate at the9- to 12-month visit; 27 (36.4%) children were successfullytraced and rebooked. These 27 children only had one BayleyIII assessment done after 12 months of age. The remaining47 children (63.5%) had two Bayley III assessments (seeFigure 1).
The mean birth weight of the children was 2674 grams(95% CI 2555–2803 grams).Themeanmaternal age was 27.67years (95% CI 24.55–30.72 years). Gender distribution wasequal between male and female. The majority (58/74 78.37%)of children were born by vaginal delivery. Almost one-thirdof the children wereHIV exposed (22/74 29.72%), but all HIVPCR tests were negative. There were nine children (12.1%)whohad an intercurrent hospital admission at some timedur-ing the follow-up. More than one-third of the mothers (26/7435.13%) were not South African but came from surroundingAfrican countries. Other sociodemographic information wasavailable on 65/74 (87.8%) children (see Table 1).
A total of 74 children had at least one Bayley III assess-ment at a mean age of 19.4 months (95% CI 18.4–20.4). Themean cognitive score was 92.2 (95% CI 89.4–95.0), meanlanguage score was 94.8 (95% CI 92.5–97.1), and mean motorscore was 98.8 (95% CI 96.8–101.0). At the time of Bayley IIIassessment, the mean 𝑍 score for weight was 0.02 (95% CI
Table 1: Sociodemographic factors of children undergoing a BayleyIII assessment.
Variable 𝑛 (%)Mother’s education 65
Primary school 15 (23)Grade 10 27 (41.5)Matric 17 (26.1)Tertiary education 6 (9.2)
Mother’s employmentUnemployed 42 (64.6)Part time employment 13 (20.0)Full time employment 9 (13.8)
HousingHouse 18 (27.6)Apartment 35 (53.8)Shack 12 (18.5)
Household amenitiesElectricity 61 (93.8)Running water 60 (92.3)Sanitation 59 (90.7)Family car 16 (24.6)
−0.2 to 0.2), the mean 𝑍 score for height was −0.5 (95% CI−0.7 to −0.3), and the mean 𝑍 score for skull circumferencewas 0.5 (95% CI 0.2 to 0.7).
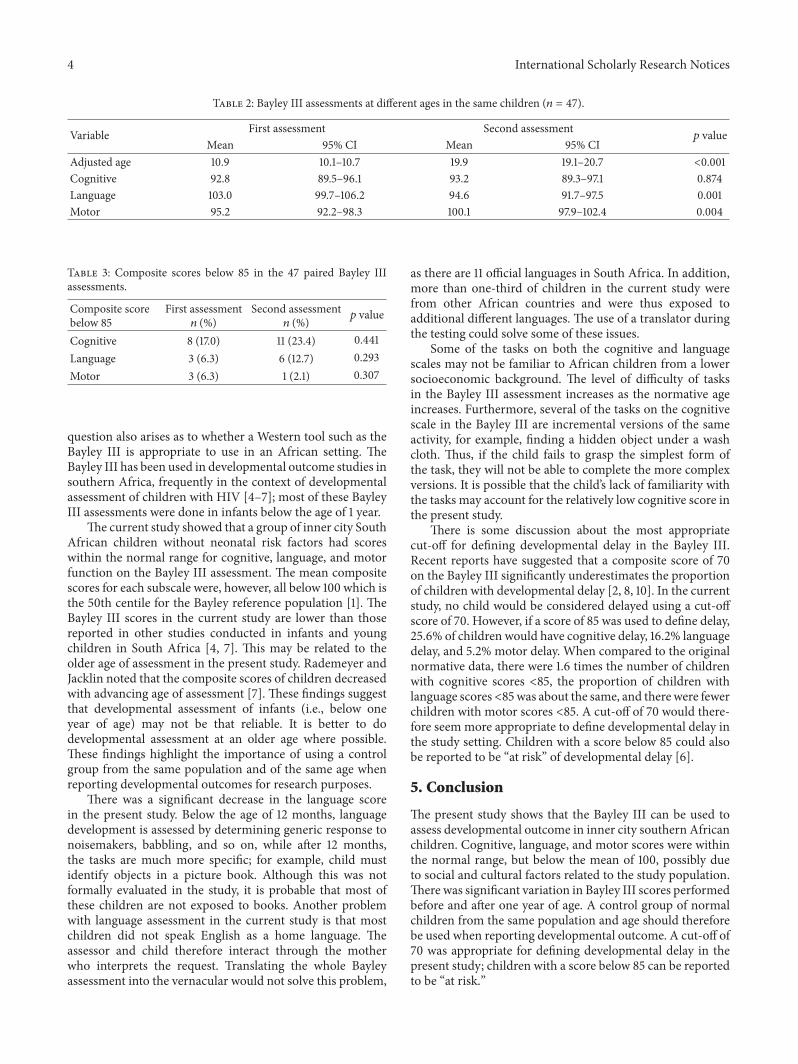
Two Bayley III assessments were done in the same 47children at different ages. The results of these paired BayleyIII assessments are compared in Table 2. The cognitive scoreremained unchanged, while the language score decreased andthe motor score increased.
3.1. Developmental Delay. No children had a composite scorebelow 70 for any of the subscales tested on any of the BayleyIII assessments. Using a cut-off of 85, however, 19/74 (25.6%)of children had cognitive delay, which was approximately1.6 times the normative data. There were 12/74 (16.2%) withlanguage delay, which was more or less the same as thenormative data. There were 4/74 (5.2%) with motor delay,which was less than expected from the normative data.
There was no difference in the number of children with acomposite score below 85 in the first and second assessmentsin the 47 children with paired Bayley III tests (see Table 3).
There was no statistically significant difference in the𝑍 score for weight, height, or skull circumference betweenchildren with normal and delayed development. Motor,cognitive, and language delay was not associated with gender,maternal age, maternal level of education, maternal employ-ment, or place of abode.
4. Discussion
Developmental testing of infants and young children is adifficult and time-consuming task. The child’s performancecan be affected by factors such as intercurrent illness, adistracting environment, and the assessment tool used. The
4 International Scholarly Research Notices
Table 2: Bayley III assessments at different ages in the same children (𝑛 = 47).
Variable First assessment Second assessment𝑝 value
Mean 95% CI Mean 95% CIAdjusted age 10.9 10.1–10.7 19.9 19.1–20.7 <0.001Cognitive 92.8 89.5–96.1 93.2 89.3–97.1 0.874Language 103.0 99.7–106.2 94.6 91.7–97.5 0.001Motor 95.2 92.2–98.3 100.1 97.9–102.4 0.004
Table 3: Composite scores below 85 in the 47 paired Bayley IIIassessments.
Composite scorebelow 85
First assessment𝑛 (%)
Second assessment𝑛 (%) 𝑝 value
Cognitive 8 (17.0) 11 (23.4) 0.441Language 3 (6.3) 6 (12.7) 0.293Motor 3 (6.3) 1 (2.1) 0.307
question also arises as to whether a Western tool such as theBayley III is appropriate to use in an African setting. TheBayley III has been used in developmental outcome studies insouthern Africa, frequently in the context of developmentalassessment of children with HIV [4–7]; most of these BayleyIII assessments were done in infants below the age of 1 year.
The current study showed that a group of inner city SouthAfrican children without neonatal risk factors had scoreswithin the normal range for cognitive, language, and motorfunction on the Bayley III assessment. The mean compositescores for each subscale were, however, all below 100 which isthe 50th centile for the Bayley reference population [1]. TheBayley III scores in the current study are lower than thosereported in other studies conducted in infants and youngchildren in South Africa [4, 7]. This may be related to theolder age of assessment in the present study. Rademeyer andJacklin noted that the composite scores of children decreasedwith advancing age of assessment [7]. These findings suggestthat developmental assessment of infants (i.e., below oneyear of age) may not be that reliable. It is better to dodevelopmental assessment at an older age where possible.These findings highlight the importance of using a controlgroup from the same population and of the same age whenreporting developmental outcomes for research purposes.
There was a significant decrease in the language scorein the present study. Below the age of 12 months, languagedevelopment is assessed by determining generic response tonoisemakers, babbling, and so on, while after 12 months,the tasks are much more specific; for example, child mustidentify objects in a picture book. Although this was notformally evaluated in the study, it is probable that most ofthese children are not exposed to books. Another problemwith language assessment in the current study is that mostchildren did not speak English as a home language. Theassessor and child therefore interact through the motherwho interprets the request. Translating the whole Bayleyassessment into the vernacular would not solve this problem,
as there are 11 official languages in South Africa. In addition,more than one-third of children in the current study werefrom other African countries and were thus exposed toadditional different languages. The use of a translator duringthe testing could solve some of these issues.
Some of the tasks on both the cognitive and languagescales may not be familiar to African children from a lowersocioeconomic background. The level of difficulty of tasksin the Bayley III assessment increases as the normative ageincreases. Furthermore, several of the tasks on the cognitivescale in the Bayley III are incremental versions of the sameactivity, for example, finding a hidden object under a washcloth. Thus, if the child fails to grasp the simplest form ofthe task, they will not be able to complete the more complexversions. It is possible that the child’s lack of familiarity withthe tasks may account for the relatively low cognitive score inthe present study.
There is some discussion about the most appropriatecut-off for defining developmental delay in the Bayley III.Recent reports have suggested that a composite score of 70on the Bayley III significantly underestimates the proportionof children with developmental delay [2, 8, 10]. In the currentstudy, no child would be considered delayed using a cut-offscore of 70. However, if a score of 85 was used to define delay,25.6% of children would have cognitive delay, 16.2% languagedelay, and 5.2% motor delay. When compared to the originalnormative data, there were 1.6 times the number of childrenwith cognitive scores <85, the proportion of children withlanguage scores<85was about the same, and there were fewerchildren with motor scores <85. A cut-off of 70 would there-fore seem more appropriate to define developmental delay inthe study setting. Children with a score below 85 could alsobe reported to be “at risk” of developmental delay [6].
5. Conclusion
The present study shows that the Bayley III can be used toassess developmental outcome in inner city southern Africanchildren. Cognitive, language, and motor scores were withinthe normal range, but below the mean of 100, possibly dueto social and cultural factors related to the study population.There was significant variation in Bayley III scores performedbefore and after one year of age. A control group of normalchildren from the same population and age should thereforebe used when reporting developmental outcome. A cut-off of70 was appropriate for defining developmental delay in thepresent study; children with a score below 85 can be reportedto be “at risk.”
International Scholarly Research Notices 5
Additional Points
Limitations of the Study. There was a drop-out rate of 16.8%in the current study, despite sending appointment remindersand refunding transport costs. Many of the children werefrom other provinces or countries and the children are senthome when they reach one year of age. Once parents returnto work, they are more reluctant to bring well children tothe hospital for follow-up. The sample size was relativelysmall, so the effect of sociodemographic factors on childhooddevelopment could not be fully evaluated.
Conflicts of Interest
The authors declare no conflicts of interest.
Authors’ Contributions
D. E. Ballot conceptualized the research, designed the study,collected and analysed the data, wrote up the drafts, andsubmitted the paper. T. Ramdin, D. Rakotsoane, and F. Agabaassisted with data collection and data management, revieweddrafts, and approved the final version. V. A. Davies advised onstudy design, reviewed drafts, and approved the final version.T.Chirwa advised on study design anddata analysis, revieweddrafts, and approved the final version. P. A. Cooper revieweddrafts and approved the final version.
Acknowledgments
The authors gratefully acknowledge the assistance of Mr. L.Rapola, Mr. M. Reineke, Dr. M. Ally, Dr. P. Chirwa, Dr.E. Barnes-Wald, Ms. J. Hutchings, and Sr. P. Hanrahan inthe research project. This research was funded by a self-initiated research (SIR) grant from the SouthAfricanMedicalResearch Council.
References
[1] N. Bayley, Bayley Scales of Infant and Toddler Development:Administration Manual, Psychorp, United States of America,3rd edition, 2006.
[2] B. V. Acton,W. S. G. Biggs, D. E. Creighton et al., “Overestimat-ing neurodevelopment using the Bayley-III after early complexcardiac surgery,” Pediatrics, vol. 128, no. 4, pp. e794–e800, 2011.
[3] N. Whitehead, J. Potterton, and A. Coovadia, “The neurodevel-opment of HIV-infected infants on HAART compared to HIV-exposed but uninfected infants,” AIDS Care, vol. 26, no. 4, pp.497–504, 2014.
[4] J. Hutchings and J. Potterton, “Developmental delay in HIV-exposed infants in Harare, Zimbabwe,”Vulnerable Children andYouth Studies, vol. 9, no. 1, pp. 43–55, 2014.
[5] P. Springer, J. Harvey, and M. Esser, “Neurodevelopmentalstatus of HIV-exposed but uninfected children: a pilot study,”South African Journal of Child Health, vol. 6, no. 2, 2012.
[6] C. Evans, C. E. Jones, and A. J. Prendergast, “HIV-exposed,uninfected infants: new global challenges in the era of paediatricHIV elimination,” The Lancet Infectious Diseases, vol. 16, no. 6,pp. e92–e107, 2016.
[7] V. Rademeyer and L. Jacklin, “A study to evaluate the perfor-mance of black south african urban infants on the bayley scalesof infant development III,” SAJCH South African Journal ofChild Health, vol. 7, no. 2, pp. 54–59, 2013.
[8] D. E. Ballot, J. Potterton, T. Chirwa, N. Hilburn, and P. A. Coo-per, “Developmental outcome of very low birth weight infantsin a developing country,” BMC Pediatrics, vol. 12, article no. 11,2012.
[9] M. Gladstone, G. A. Lancaster, E. Umar et al., “The Malawidevelopmental assessment tool (MDAT): the creation, valida-tion, and reliability of a tool to assess child development in ruralAfrican settings,” PLoS Medicine, vol. 7, no. 5, article e1000273,2010.
[10] S. Jary, A. Whitelaw, L. Walløe, and M.Thoresen, “Comparisonof bayley-2 and bayley-3 scores at 18 months in term infants fol-lowing neonatal encephalopathy and therapeutic hypothermia,”Developmental Medicine and Child Neurology, vol. 55, no. 11, pp.1053–1059, 2013.
[11] P. A. Harris, R. Taylor, R. Thielke, J. Payne, N. Gonzalez,and J. G. Conde, “Research electronic data capture (REDCap):a metadata-driven methodology and workflow process forproviding translational research informatics support,” Journalof Biomedical Informatics, vol. 42, no. 2, pp. 377–381, 2009.

Submit your manuscripts athttps://www.hindawi.com
Stem CellsInternational
Hindawi Publishing Corporationhttp://www.hindawi.com Volume 2014
Hindawi Publishing Corporationhttp://www.hindawi.com Volume 2014
MEDIATORSINFLAMMATION
of
Hindawi Publishing Corporationhttp://www.hindawi.com Volume 2014
Behavioural Neurology
EndocrinologyInternational Journal of
Hindawi Publishing Corporationhttp://www.hindawi.com Volume 2014
Hindawi Publishing Corporationhttp://www.hindawi.com Volume 2014
Disease Markers
Hindawi Publishing Corporationhttp://www.hindawi.com Volume 2014
BioMed Research International
OncologyJournal of
Hindawi Publishing Corporationhttp://www.hindawi.com Volume 2014
Hindawi Publishing Corporationhttp://www.hindawi.com Volume 2014
Oxidative Medicine and Cellular Longevity
Hindawi Publishing Corporationhttp://www.hindawi.com Volume 2014
PPAR Research
The Scientific World JournalHindawi Publishing Corporation http://www.hindawi.com Volume 2014
Immunology ResearchHindawi Publishing Corporationhttp://www.hindawi.com Volume 2014
Journal of
ObesityJournal of
Hindawi Publishing Corporationhttp://www.hindawi.com Volume 2014
Hindawi Publishing Corporationhttp://www.hindawi.com Volume 2014
Computational and Mathematical Methods in Medicine
OphthalmologyJournal of
Hindawi Publishing Corporationhttp://www.hindawi.com Volume 2014
Diabetes ResearchJournal of
Hindawi Publishing Corporationhttp://www.hindawi.com Volume 2014
Hindawi Publishing Corporationhttp://www.hindawi.com Volume 2014
Research and TreatmentAIDS
Hindawi Publishing Corporationhttp://www.hindawi.com Volume 2014
Gastroenterology Research and Practice
Hindawi Publishing Corporationhttp://www.hindawi.com Volume 2014
Parkinson’s Disease
Evidence-Based Complementary and Alternative Medicine
Volume 2014Hindawi Publishing Corporationhttp://www.hindawi.com