use of various surveying technologies to …maajournal.com/issues/2017/vol17-3/hatzopoulos et al....
TRANSCRIPT

Mediterranean Archaeology and Archaeometry, Vol. 17 No 3, (2017), pp. 311-336 Copyright © 2017MAA
Open Access. Printed in Greece. All rights reserved.
DOI: 10.5281/zenodo.1048937
USE OF VARIOUS SURVEYING TECHNOLOGIES TO 3D DIGITAL MAPPING AND MODELLING OF CULTURAL HERITAGE STRUCTURES FOR MAINTENANCE AND RESTORATION PURPOSES: THE THOLOS IN DELPHI,
GREECE
John N. Hatzopoulos1, Dimitrios Stefanakis1, Andreas Georgopoulos2, Sevasti Tapinaki2, Volonakis Pantelis3, Ioannis Liritzis3
1University of the Aegean Dept of the Environment, Laboratory of Remote Sensing and GIS, University Hill, Mytilene, 81100, Greece.
2National Technical University of Athens School of Rural and Surveying Engineering, Dept of Topography Laboratory of Photogrammetry, 9 Iroon Polytechneiou Str, 15780, Zographos, Greece.
3University of the Aegean, Dept of Mediterranean Studies, Lab of Archaeometry & Lab of Environmental Archaeology, 1 Demokratias Str, Rhodes 85132, Greece.
Received: 08/11/2017 Accepted: 10/12/2017 Corresponding author: J. Hatzopoulos ([email protected])
ABSTRACT
This work was developed to train graduate students as part of the Delphi4Delphi project dealing with the digital reconstruction of the archaeological site of Delphi. In this part of the project, various technologies were used for 3-d digital mapping cultural heritage structures for maintenance and restoration purposes. The use of various surveying technologies such as UAS, Total station, digital camera, Lidar scanner and GPS to map in 3d the remaining of the monument Tholos and the surrounding area in Delphi Greece and based on such mapping to restore the entire structure is covered in detail. The remains of such monuments are a few columns standing up joined with original elements on top. In this part of the project GPS was used to establish the reference system, total station was used to measure a number of control points for UAS, close range photogrammetry and Lidar scanner, UAS was used to map precisely the surrounding area together with the structure, close range photogrammetry and Lidar scanner were used to map the vertical surfaces of the structure. Processing of above data from all surveying technologies created enough point cloud to map precisely the remains of the structure and expand their architectural design to precisely restore the entire Tholos monument. Also all digital data are used by software for the construction of 3D terrain and 3D models which when inserted into Game Engines software aim at the creation of educational scenarios.
KEYWORDS: surveying, photogrammetry, UAS, laser scanner, monument mapping, restoration, education, game engines

312 J. HATZOPOULOS et al.
Mediterranean Archaeology and Archaeometry, Vol. 17, No 4, (2017), pp. 311-336
1. INTRODUCTION
Our era could be named as the cyber era or digital era. The New information and signal processing technologies alter our lives and the way in which we perceive it outwith the imaginable. This further ulte-rior over is the point in space-time in which coalition of science, technology and art openly combined for the 3rd Cultural Revolution, and for environmental-ly sustainable abundance. However, this time, the “Outwith” not only explores the dynamic 3D screen, it moves on from the bits to the atoms and incorpo-rates 3D-printing and digital cloud-distribution, which combined to relevant scanning or photo-graphic technologies create a virtual reconstruction environment as a real world. We are entering the central source for current and emerging trends in cultural heritage informatics with new disciplines, sub-disciplines and terminology to emerge. Virtual, cyber-archaeology (Forte, 2005) and cultural heritage to cyber-archaeometry, (Liritzis et al, 2015) are mat-ters that are tackled. The restoration, reconstruction and virtual archaeology case studies, over the World, as a result of advanced technology emerging from computer sciences, however, stress the natural-istic methodology, challenges digital reconstructions and serious games. There may provoke also harass-ment and emergence of fundamental hermeneutical questions which serve as the basis of a synoptic and synthetic philosophy that combines art and science corresponding to classical techne, logos and ethos. In 1999, about nine years after the invention and public domain of the World Wide Web project Tom Levy
and his team made a commitment to “go digital” by recording all field measurements on excavations in Jordan related to the role of ancient metallurgy on social evolution. That was the start of a growing field of 3D visualization. This first application was re-ferred to as on-site digital archaeology (OSDA) 1.0 (Levy et al., 2001) with a summary of the most im-portant new developments in OSDA 3.0 (Levy et al., 2010) that make it a much more versatile system. In our present work the OSDA takes the form of Fig. 1 for restoration and maintenance and takes ad-vantage of both off-the-shelf technologies and also includes new computer programs and hardware de-veloped specifically to solve archaeological/cultural heritage problems that face researchers working around the world today. The Digital archaeology appears together with The Project that was the first public available information website to connect and share documents on personal computers via the in-ternet (published by Tim Berners-Lee at CERN in 1991 who used HTML 1.0. Its first web address was http://info.cern.ch/hypertext/WWW/TheProject.html, which described the World Wide Web project). The web turns 24 this year, and while national librar-ies, archives, universities, and other cultural heritage institutions have been archiving the web since the late 1990s, the early web, the first website from World Wide Web co-inventor Sir Tim Berners-Lee, created in 1991. The website featured at Digital Ar-chaeology is believed to be the earliest available copy, from 1992. (Liritzis et al., 2015).
Figure 1. Diagram for restoration and maintenance.
VARIOUS TECHNOLOGIES TO 3D DIGITAL MAPPING AND MODELLING OF THOLOS IN DELPHI, GREECE 313
Mediterranean Archaeology and Archaeometry, Vol. 17, No 4, (2017), pp. 311-336
The CD-ROM of course use of digital record in arts and humanities has been initiated earlier (e.g. the Perseus Project, Perseus Digital Library planed by 1995 at Tufts and issued in 1992 by Yale Universi-ty Press, TLG). More digital publications in CD or online have been developed since then, that have contributed a great deal in the investigations of hu-manities, the cultural heritage being a major issue (Sabharwal, 2015).
In the present article we focus on a case study or a tutorial training that combines new digital technolo-gies, methods and instrumentation, focused on the well-known Tholos monument in Delphi Greece that provides an example of Hi-Tech friendly used and taught to the apprentice on a Masters level and un-folds the rationale of potential relevant studies of tangible cultural heritage.
This described interdisciplinary work to train graduate students as part of an ongoing large enter-prise Project (Delphi4Delphi) deals with the digital reconstruction of the archaeological site of Delphi. The technologies were used for 3D digital mapping, use of various surveying technologies such as Un-manned Aerial Survey (UAS) (Stefanakis et al., 2013), Total station, digital camera, Lidar scanner and GPS (Hatzopoulos, 2008) for the monument and the contextual area. UAS was used on a supplemen-tary GPS and a photogrammetric survey and inter-connected manner with close range photogrammetry and Lidar scanner, while processing of all data creat-ed enough point cloud to map precisely the remains of the structure and expand their architectural de-sign to precisely restore the entire Tholos monument (http://www.danielgm.net/cc/), (Autodesk - Au-toCAD 2015), (Altuntas et al 2017; Salama et al., 2017).
1.1. Tholos history
Within the sacred archaeological site of Delphi is the sanctuary of Athena Pronaia or Marmaria (see below Figs.6, 11 etc), which is located to the south-east of the sanctuary of Apollo (Pedley 2005,151), and its importance relates to those appealing to Apollo via priestess Pythia for an oracle (Luyster, 1965, 148, Liritzis and Castro, 2013). The narrow long level paved area includes altars, temples, treasuries and the tholos. The Archaic temple of Athena con-tains several altars, the oldest dates to the 7th centu-ry B.C.E. The tholos structure was constructed some-time between 400-375 BCE by architect, Theodorus from Phokaia in Asia (Lawrence 1957, 184), has a circular base of 13.50m in diameter, encircled by twenty Doric columns on the outer circle and ten Corinthian columns on the inner circle (Valavanis 2004, 232). The doorway to the cella is a triple open-ing formed by two Ionic half columns which are en-
gaged directly on top of piers and set between posts or pillars called antae. The building was decorated with moldings and relief metopes in the diorama of the peristyle and wall. The function of the tholos is not completely clear with some prevailed theories (Valavanis 2004, 232; Marmaria 1997; Michaud 1973; Lawrence 1957, 184). All three ancient Greek archi-tectural orders were involved in this construction. In 373 BC a major earthquake caused stones from the Phaidriades rocks to fall, destroying the temples and reconstruction began in 370 BC but ceased after a series of sacred wars. The tholos structure has been partially reconstructed; three columns have been restored along with partial cornices, pieces of the guttering, metopes, and triglyphs. Featured on the exterior friezes were images of the battle between the Amazons and the Centaurs. The gutter of the exteri-or Doric entablature was ornamented with lion head spouts. The blocks of the tholos are joined together carefully, and the joints coincide with the central points of the triglyphs and metopes. The blocks were stippled except for polished bands at the margins. Also done in the Athenian Propylaea, this method emphasizes the joints more than other smooth mar-ble architecture of Athens.
1.2. Project design
Design specifications (Hatzopoulos et all, 2006) are analyzed as follows:
The reference system for this project is to be the EGSA-87 Greek reference system (EPSG:2100 - GGRS87 / Greek Grid). Such reference system is to be established by GPS with an accuracy compatible to Google map.
Topographic mapping of the wider area is to have a horizontal and vertical accuracy of ±5 cm. The final product will be an orthophoto as a horizontal map with corresponding digital elevation model -DEM. Topographic mapping will be performed by UAS technology.
Close range photogrammetry and laser scanner will be used to survey the vertical surfaces of the Tholos structure. In addition, close range photo-grammetry will be used for a vertical wall to map the building blocks of stones. The accuracy expected from close range photogrammetry and laser scanner is ±1 cm.
Control points for UAS, close range photogram-metry and laser scanner will be surveyed by total station with an accuracy of ±5 mm. Restoration model of tholos will have a horizontal accuracy of ±1.0 cm and a vertical accuracy of ±1.0 cm. Gaming data will use the orthophoto and DEM of accuracy ±5cm as it will be produced by UAS technology, and the restoration model.

314 J. HATZOPOULOS et al.
Mediterranean Archaeology and Archaeometry, Vol. 17, No 4, (2017), pp. 311-336
2. REFERENCE SYSTEM AND TOTAL STATION SURVEYS
The reference system was created by using two points A and B measured by a hand held GPS. Point A was used as the first station to be occupied by the total station, while point B was used to compute a backsight azimuth. The measured quantities for point A and B are given in Table 1 and the last row
in the Table 1 shows the computed azimuth and dis-tance. The azimuth and the distance was computed by an in house developed educational software (Hatzopoulos, 2008) as shown in Fig. 2.
Table 1. Measured and computed quantities
No. X Y Z
A 369730 4259870 484 B 369650 4259876 482
Az 304.7657 Distance 80.225
Figure 2. The output of the computation of azimuth and distance.
The GPS receiver was adjusted to the EGSA-87
Greek reference system (EPSG:2100 - GGRS87 / Greek Grid) and the accuracy of the hand held GPS was sufficient for compatibility to the Google map in this project.
Consequently, the total station was used to meas-ure a number of control points for UAS, Laser Scan-ner and close range photogrammetry as shown in Table 2.
Table 2. List of the measured control points by total station
UAS Control Points Scanner Control Points Photogrammetry Control Points
P X Y Z P X Y Z P X Y Z
0 369730.000 4259870.000 484.000 14 369689.231 4259867.476 483.448 23 369701.690 4259878.672 483.428
1 369721.904 4259868.521 483.545 15 369692.112 4259883.194 488.780 24 369701.645 4259878.650 484.756
2 369706.827 4259868.982 483.558 16 369701.292 4259882.061 489.956 25 369703.728 4259878.260 484.276
3 369697.587 4259875.502 483.315 17 369711.733 4259856.077 482.831 26 369705.281 4259878.029 483.488
4 369676.330 4259877.470 483.380 18 369713.503 4259847.780 482.367 27 369705.247 4259877.842 484.842
5 369671.880 4259863.326 482.603 19 369719.481 4259850.811 483.505 28 369705.404 4259857.635 489.002
6 369684.661 4259858.626 483.565
29 369705.362 4259857.423 484.338
8 369717.667 4259842.973 482.223 30 369705.324 4259857.430 487.937
9 369710.760 4259859.858 483.056 31 369706.466 4259858.980 484.285
10 369757.318 4259851.656 483.281 32 369706.395 4259858.882 486.398
12 369695.888 4259851.478 482.189 33 369706.392 4259858.937 487.636
22 369710.752 4259859.873 482.081 34 369706.990 4259860.789 484.234
35 369706.979 4259860.844 485.157
36 369706.949 4259860.880 487.703
The accuracy of theodolite measurements was tested on check points and it was estimated ±5mm.

VARIOUS TECHNOLOGIES TO 3D DIGITAL MAPPING AND MODELLING OF THOLOS IN DELPHI, GREECE 315
Mediterranean Archaeology and Archaeometry, Vol. 17, No 4, (2017), pp. 311-336
(a) for UAS/scanner (b) on the wall (c) on the columns
Figure 3. Location of control points
The location of the control points is shown in Fig-ure 3, (a) within the wider area for the UAS and the scanner, (b) on the wall for close range photogram-metry and (c) on the columns for also close range photogrammetry.
All field surveys were performed between 9:00 am and 1:30 pm. During the survey time the 36 students who were attending the field performance were subdivided into three groups to be able to attend all survey sections and participate in the operations with the instruments starting with close range pho-togrammetry and rotating to laser scanner and total station. The operation of the UAS was attended by all students.
3. CLOSE RANGE PHOTOGRAMMETRY SURVEYS
Although nowadays Photogrammetry has been automated with the help of computer vision algo-rithms, there is still need for young emerging profes-sionals to get acquainted with “traditional” photo-grammetric practice in order to understand the pit-
falls usually appearing when applying the automat-ed processes.
Hence the 36 students were exposed to both stere-oscopic and single image Photogrammetry. The main problem of extracting 3D metric information from 2D images is that the third dimension is hidden in the form of perspective distortions. Hence for ex-tracting it we need at least a second image, just like our eyes and brain do to perceive depth. However, when there is not third dimension in the object, i.e. when it is planar, this extraction may be performed with a single image. Both these photogrammetric processes were implemented during the workshop in Delphi.
For the stereoscopic photography the student were asked to plan the image sequence according to the lenses available for the particular camera. Then a rough photography plan was devised, so as to en-sure: (1) at least 70% overlap, (2) almost parallel camera axes, (3) almost the same image scale, i.e. by keeping the same distance from the object, and, (4) ensuring similar illumination conditions in all imag-es. A sample stereopair is shown in Fig. 4.
Figure 4. A sample stereopair of the Tholos

316 J. HATZOPOULOS et al.
Mediterranean Archaeology and Archaeometry, Vol. 17, No 4, (2017), pp. 311-336
For the orientations and especially for georefer-encing and scaling the stereoscopic model, ground control points in the form of targets were put on the object. The minimum required number is 3, but 7-8 were measured, including some detail points higher up the monument (see, Table 2). These GCP‟s were measured geodetically and their coordinates were later used for absolutely orienting the stereoscopic model.
For that purpose, the Digital Photogrammetric Workstation PhotoMod by Racurs (www.racurs.ru) was used, as it is offered as a lite/trial edition with some limitations by the manufacturers. The students were able to observe the stereo pair stereoscopically and became familiar with conventional photogram-metric restitution. As this is a highly time-consuming process, the restitution was not finalized in Delphi.
On the other hand, single image Photogrammetry was also demonstrated using as object a vertical
supporting wall, close to the Tholos. The process of producing an orthogonal projection of an image of a planar object is called image rectification and it actu-ally is a projective transformation of the original im-age. For calculating the 8 parameters of this trans-formation, at least four points are needed on the pla-nar object. Usually more points are used in order to ensure the desired accuracy. In this case five points were used and can be seen in Figs. 5a and 5b.
For the digital rectification the freeware software RDF of the University of Venice was employed. It is very simple in operation and the rectification was performed successfully (Fig. 5a). For demonstration and educational purposes additional images were taken with high axis inclination (Fig. 5b). These were also rectified by the same software, with some blur-ring effects in the parts where the original image scale is very small, very small, i.e. the part of the ob-ject far from the camera.
Figure 5a. The original image to be rectified with the five targets on the wall (left). The rectified image (right.
Figure 5b. A second oblique image for the same object rectification
VARIOUS TECHNOLOGIES TO 3D DIGITAL MAPPING AND MODELLING OF THOLOS IN DELPHI, GREECE 317
Mediterranean Archaeology and Archaeometry, Vol. 17, No 4, (2017), pp. 311-336
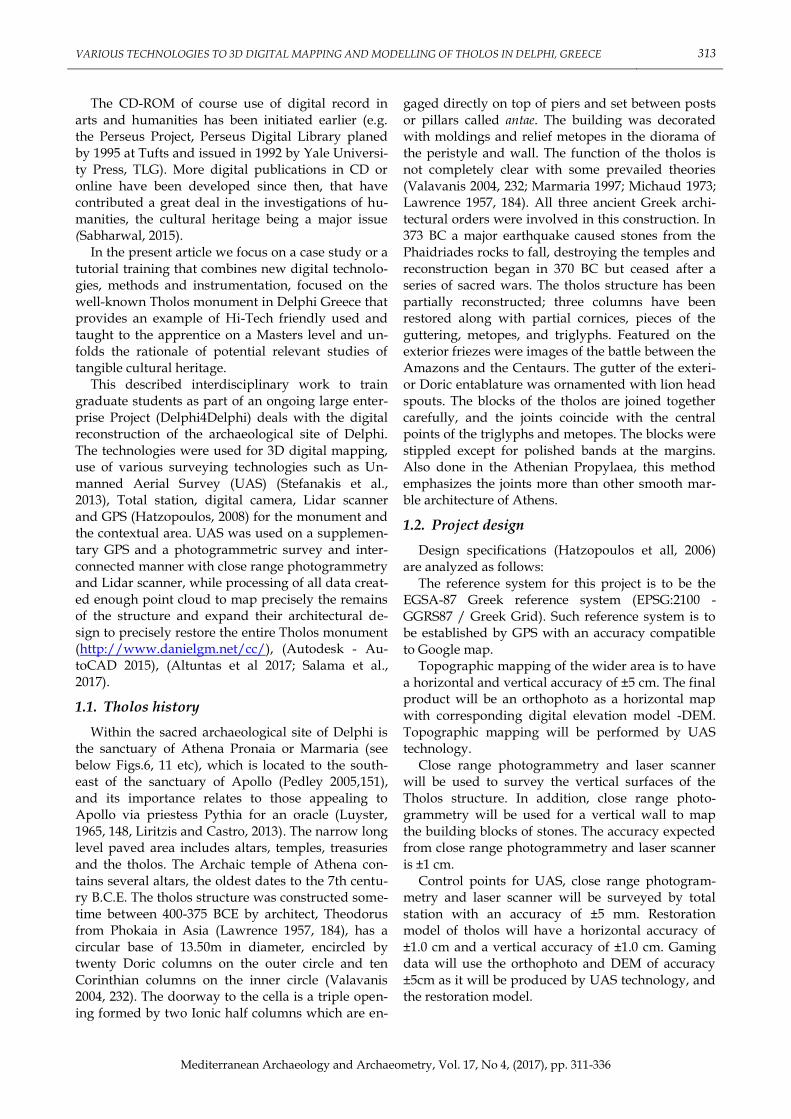
Figure 6. A panoramic image of the site. For that purpose the RICOH Theta S 360 deg camera was used.
A modern tendency nowadays is to investigate the possibilities of metrically exploiting panoramic images (Fig. 6). As demonstration such panoramic images were also taken in situ, without performing any processing. For that purpose the RICOH Theta S 360 deg camera was used.
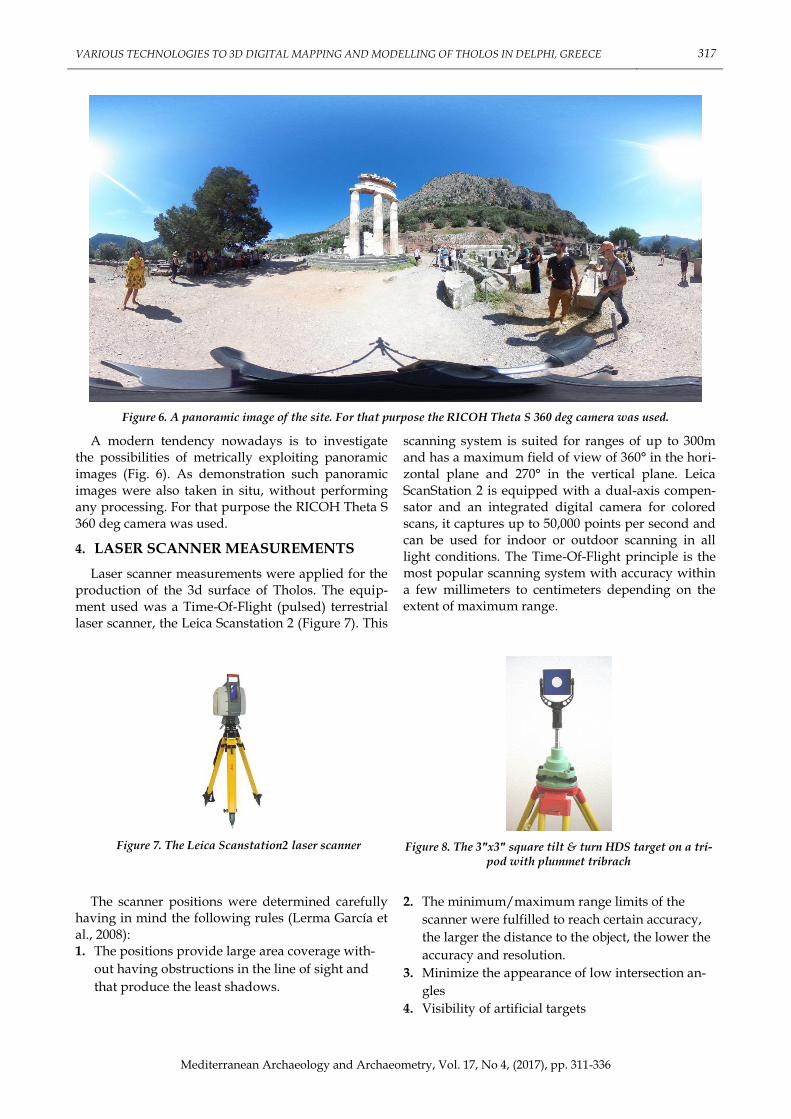
4. LASER SCANNER MEASUREMENTS
Laser scanner measurements were applied for the production of the 3d surface of Tholos. The equip-ment used was a Time-Of-Flight (pulsed) terrestrial laser scanner, the Leica Scanstation 2 (Figure 7). This
scanning system is suited for ranges of up to 300m and has a maximum field of view of 360° in the hori-zontal plane and 270° in the vertical plane. Leica ScanStation 2 is equipped with a dual-axis compen-sator and an integrated digital camera for colored scans, it captures up to 50,000 points per second and can be used for indoor or outdoor scanning in all light conditions. The Time-Of-Flight principle is the most popular scanning system with accuracy within a few millimeters to centimeters depending on the extent of maximum range.
Figure 7. The Leica Scanstation2 laser scanner
Figure 8. The 3″x3″ square tilt & turn HDS target on a tri-pod with plummet tribrach
The scanner positions were determined carefully
having in mind the following rules (Lerma García et al., 2008): 1. The positions provide large area coverage with-
out having obstructions in the line of sight and
that produce the least shadows.
2. The minimum/maximum range limits of the
scanner were fulfilled to reach certain accuracy,
the larger the distance to the object, the lower the
accuracy and resolution.
3. Minimize the appearance of low intersection an-
gles
4. Visibility of artificial targets

318 J. HATZOPOULOS et al.
Mediterranean Archaeology and Archaeometry, Vol. 17, No 4, (2017), pp. 311-336
Figure 9. The Point Clouds after registration
The resolution of each point cloud was 0.005 m, in order to represent all the details of the object.
Special reflective targets (3″x3″ square tilt & turn targets) were placed before scanning in such a way that at least four of them to be visible from each scanner position. The targets were measured with the total station and the 3D coordinates (X, Y, Z) were calculated for the geo-referencing of scans to the reference system and the accurate registration of multiple scans to each other with the target-to-target registration method. The targets were placed, using tripods and plummet tribraches (Fig.8), around Tho-los and not on it because it was not allowed. Their position was carefully selected so that they didn‟t obscure important details of the subject. Part of the final point clouds after the registration is shown in Figure 9.
5. UAS SURVEYS
Unmanned Aerial System based photogrammetry have a multiple role in the reconstruction and educa-tional process (Stefanakis et al, 2013):
provide a wider area digital base-map/orthophoto for various related tasks
Obtain a high detailed Digital Surface Model (DSM), to be used for terrain analysis, survey measurements or photorealistic modelling background.
Provide significant detailed 3D Point cloud for the study area and especially for regions that are difficult or unattainable with laser scan-ning
Capture scenery and artifact texture in desired detail, to provide color information for laser scanning or unattainable places with close range photogrammetry.
Immerse Students to modern technologies and methods, emphasizing bottom-up approach in Concept of operations
5.1 Concept of Operations (CONOPS)
UAS Survey starts with the Concept of operations procedure (Pratt et al., 2009), in which students de-cided the desired spatial resolution, radiometric ca-pabilities and spectrum of captured data (see Figure 10). Consequently, they incorporated into the pro-cess the mentioned in Sections 1.2 and 2, affecting the specifications of sensor type, weight and attrib-utes.

VARIOUS TECHNOLOGIES TO 3D DIGITAL MAPPING AND MODELLING OF THOLOS IN DELPHI, GREECE 319
Mediterranean Archaeology and Archaeometry, Vol. 17, No 4, (2017), pp. 311-336
Figure 10. Concept of Operations (CONOPS)
Combining the study area requirements like scale, constrains and restrictions with the above-mentioned sensor, students concluded to the most appropriate unmanned aerial platform (Valavanis et al., 2014a) needed to carry the sensor and perform the acquisition flights.
5.2 Flight Planning & Mission execution
5.1.1 Flight Planning
Flight Planning procedures, validate CONOPS outcomes and helps to delve into the Study area and environment requirements. In essence, instead of
calculating & setting parameters for each subsystem, students used a UAS Specific Software to obtain eve-ry single aspect of captured data, as we can see in the following picture from an open source UAS Ground Station software (mission planner, http://planner.ardupilot.com).
Figure 11. Ground Control Station (GCS) Software Automated Aerial survey menu, red bullets and red lines indicate the extend of the area to be covered, yellow lines are the flight lines and green bullets are the turning points of UAS.
In the survey menu (see Fig. 11), of most ground control station (GCS) Software, students can easily and efficiently calculate -given the parameters of the chosen sensor UAV physical properties, capture re-quirements and limitations- every flight path com-mand to be executed by the UAS and expected de-liverable, such us but not limited to:
Ground Sample Distance
Number of Captions
Flight time
Covered area
Camera Trigger commands and Geolocation storing method
Flight Speed and minimum Shutter Speed
Sidelap and overlap
The final UAS and deliverable Specifications were calculated as shown in Table 3 below:

320 J. HATZOPOULOS et al.
Mediterranean Archaeology and Archaeometry, Vol. 17, No 4, (2017), pp. 311-336
Table 3. UAS and deliverable Specifications
UAS Specific UAS Airframe Type Multicopter / octa-copter
Avionics - Autopilot Opensource Hardware Software PIXHAWK 2.1
GPS Type Dual Ublox NEO-M8P High Precision GNSS Modules
Payload Capacity 2 kg
Flight Time @ maximum payload and Cruise speed 19 minutes
Cruise Speed 5 m/s
Max Speed 16 m/s
Ground Station and UAS Category A2, Line of Sight (LOS) With waypoint control
Radio Communications Amateur License 433 band radio telemetry, 2.4GHz Control
Payload Sensor Sensor Type 42MP Full-Frame Exmor R BSI CMOS RGB
Image Width/Height [Pixels] 7952 x 5304
Sensor Width/Height [mm] 35.814 x 23.876
Lens Focal Length 28 mm
Flight Plan and Derivatives Flight Time 5 minutes (2‟30‟‟ excluding Take-off & Landing)
Area 8000 m2
Sidelap/Overlap 75%
Number of Captions 52
Min. Shutter speed 1/1249
Flight Altitude 50m
Ground Sample Distance 0,8cm
Triggering and Geotagging method Sony-Multi port USB Trigger event via PWM and logging
Attribute logging Active IMU and GPS logging (400Hz, 10Hz respectively)
5.2.2 Mission execution
Following CONOPS and Flight planning that took place in the previous class, students had to execute the automated mission at optimal conditions, com-bining a series of check lists arising from Remote Sensing Sciences (Mozas-Calvache, et al., 2012), Leg-islation and Operation manual/Risk assessment that briefly included:
UAS Operation Manual Check list
Optimal Weather Conditions
Optimal Solar radiation and Shadows
Hellenic Civil Aviation Authority Flight-plan Submission/Approval
ICAO and Hellenic specific legislation guid-ance‟s regarding Drone Operations
Local Antiquity‟s authorities guidance and permissions
Ground Station Software (http://planner.ardupilot.com) and Mobile internet made possible to comply with the above-mentioned procedures at real time, combining direct communi-cation between the UAV and Ground station, while connected to the online system of the corresponding authorities (Puttock et al., 2015) as shown in Figs. 12 and 13 below.
Figure 12. Mission planer Provides information regarding the UAS Status and gathers flight data from ADS-B Equipped aircraft in the area

VARIOUS TECHNOLOGIES TO 3D DIGITAL MAPPING AND MODELLING OF THOLOS IN DELPHI, GREECE 321
Mediterranean Archaeology and Archaeometry, Vol. 17, No 4, (2017), pp. 311-336
Figure 13. Drone Aware HCAA Online System was responsible to provide the necessary information regarding permis-sions and restrictions as well as weather data and mission approval(https://dagr.hcaa.gr/)
5.2 UAS Data Processing
UAS Data processing includes the raw captured data manipulation, log analysis, aero-triangulation and geo-referencing, as well as providing the first basic derivatives.
5.2.1 Image Geotagging and attribute matching
Most UAS based photogrammetry software, differ dramatically with their traditional ancestors and close range photogrammetry siblings, mostly be-cause of the vast number of collected data and there-fore the multiple aero-triangulated key/tie points. For that reason, aiding the computational routines
providing information about pair selection it is con-sidered mandate, especially in demanding projects (Valerio Baiocchi et al., 2013).
For that purposes students used the logging capa-bilities of the Avionics equipment along with GCS Software to match the appropriate information needed along with the Exchangeable image file for-mat data (Exif), such as:
Position (x, y, z)
Exterior orientation (omega, phi, kappa), (Hatzopoulos, 2008)
Sensor type and size
Lens information
Figure 14. Resulted geo-tagged images and posi-tion error estimates.
Figure 15. Mission Planner Geotagging tool interface
GCS Software takes into consideration the abun-dant Inertial Measurement Unit information to spa-
tially interpolate GPS discrepancies to enhance accu-racies, in an otherwise time-consuming process.

322 J. HATZOPOULOS et al.
Mediterranean Archaeology and Archaeometry, Vol. 17, No 4, (2017), pp. 311-336
5.2.2 Aerotriangulation
For the aerotriangulation process we incited stu-dents to use modern UAS oriented software empha-sizing the rapid growth of open source, while been able to balance between their current individual workflow and interoperability. Agisoft Photoscan
Professional licenses were donated to the Post Grad-uate Program and it was used for data processing.
Students inserted to the photogrammetry soft-ware the acquired images, all information mentioned at 5.3.1 and ground control points (GCP‟s) measured with the total station, as shown in the following Figs. 16 and 17 (Chiabrando et al., 2011).
Figure 16. Loading Images, GCP's and image position/orientation to photogrammetry software. Note the difference of reference system between GCP and Images
Figure 17. Control point (GCP) and its target.
Figure 18. Sparse Point cloud generation and GCP’S (303.436 Points).
Figure 19. Dense Cloud Generation (5.417.319 Points)
VARIOUS TECHNOLOGIES TO 3D DIGITAL MAPPING AND MODELLING OF THOLOS IN DELPHI, GREECE 323
Mediterranean Archaeology and Archaeometry, Vol. 17, No 4, (2017), pp. 311-336
Every GCP, was carefully chosen upon every im-age. The process was enhanced by the estimated po-sitions and made easier to select and group images by GCP, even without the alignment process.
The next step, was to align images and generate the dense point cloud. Every photogrammetric soft-ware, offers unique enhancements and refining tools to optimize these two processes. Furthermore, each software vendor differently approaches the alloca-tion and usage of computational resources, like mul-ti-core threating, CUDA or other GPU based pro-cessing, cluster architecture support etc. Whatsoever, all of them share the same core of equations needed
to complete the above-mentioned tasks, so we will not go in a further depth.
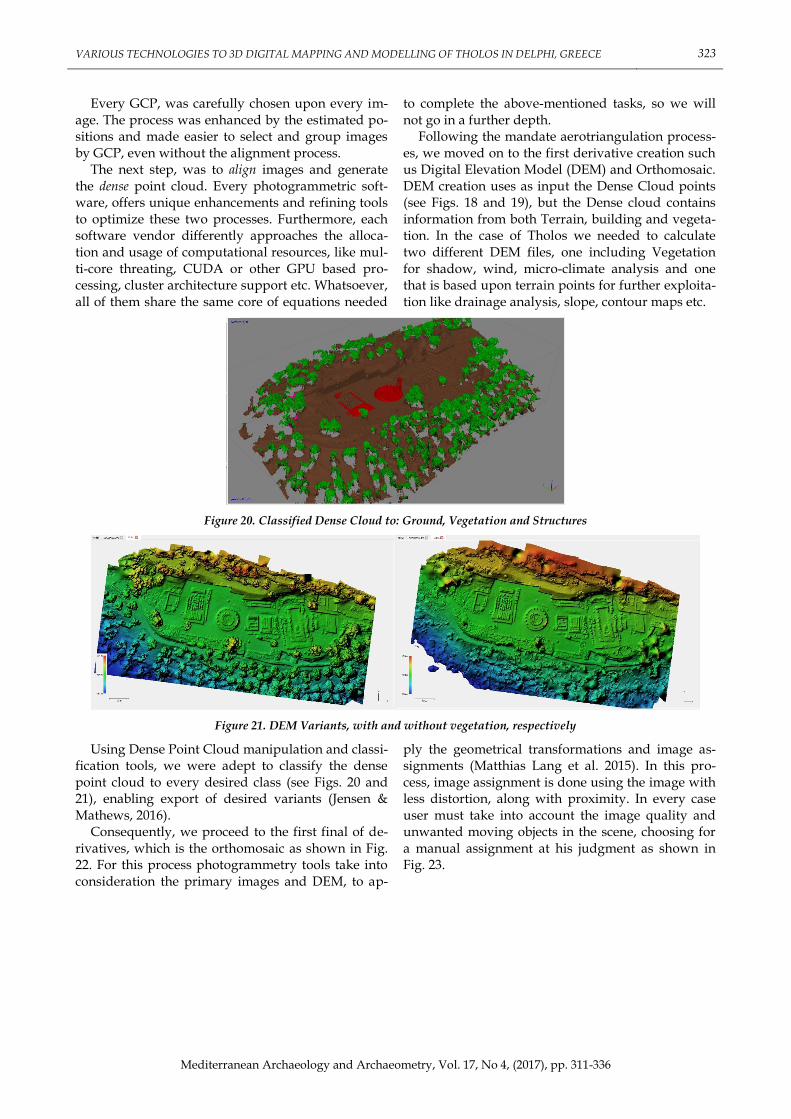
Following the mandate aerotriangulation process-es, we moved on to the first derivative creation such us Digital Elevation Model (DEM) and Orthomosaic. DEM creation uses as input the Dense Cloud points (see Figs. 18 and 19), but the Dense cloud contains information from both Terrain, building and vegeta-tion. In the case of Tholos we needed to calculate two different DEM files, one including Vegetation for shadow, wind, micro-climate analysis and one that is based upon terrain points for further exploita-tion like drainage analysis, slope, contour maps etc.
Figure 20. Classified Dense Cloud to: Ground, Vegetation and Structures
Figure 21. DEM Variants, with and without vegetation, respectively
Using Dense Point Cloud manipulation and classi-fication tools, we were adept to classify the dense point cloud to every desired class (see Figs. 20 and 21), enabling export of desired variants (Jensen & Mathews, 2016).
Consequently, we proceed to the first final of de-rivatives, which is the orthomosaic as shown in Fig. 22. For this process photogrammetry tools take into consideration the primary images and DEM, to ap-
ply the geometrical transformations and image as-signments (Matthias Lang et al. 2015). In this pro-cess, image assignment is done using the image with less distortion, along with proximity. In every case user must take into account the image quality and unwanted moving objects in the scene, choosing for a manual assignment at his judgment as shown in Fig. 23.

324 J. HATZOPOULOS et al.
Mediterranean Archaeology and Archaeometry, Vol. 17, No 4, (2017), pp. 311-336
Figure22. Study area orthomosaic and seamlines of assigned imagery
Figure 23. Manual image assignment to the orthomosaic process, to remove unwanted moving figures
As mentioned in previous chapters, every soft-ware vendor uses a variety of enhancing technics and automation tools. Though, all of them are sub-ject to the same geometry principles and thus not mentioned in detail.
Finalizing the UAS Survey processes to dissemi-nate as much as possible useful outcomes to the rest of the working group, a series of derivative products had to be exported. These derivatives included mesh and dense point cloud in various formats and ver-sions, to maintain multi-disciplinarily and interoper-ability within the working group such as:
Mesh files, with and without texture
Mesh files, including or excluding vegeta-tion and structures
Dense Point Cloud in various formats (LAS, PLY, TXT), with point normals and colors
Several aiding materials (3D Google earth, 3D PDF etc.)
6. RESTORATION/MAINTENANCE PROCESS
The approach this chapter regarding the restora-tion-protection of the monument will be as follows:
Use UAS Derivatives to:
Merge data and other information for restora-tion
calculate drainage and recommend appropri-ate actions
calculate Solar Radiation, sunlight and shad-ow casting to improve/optimize siting, like visitor signage, security posts etc.
mention, that in the unlike event of natu-ral/human disaster, a detailed 3D survey could act as reference for restorations
Study micro climate conditions in conjunction with Landscape architecture, in order to pro-vide better visibility to visitors and at the same time keep constant wind levels within the monument site.
6.1 Merge Data-Information
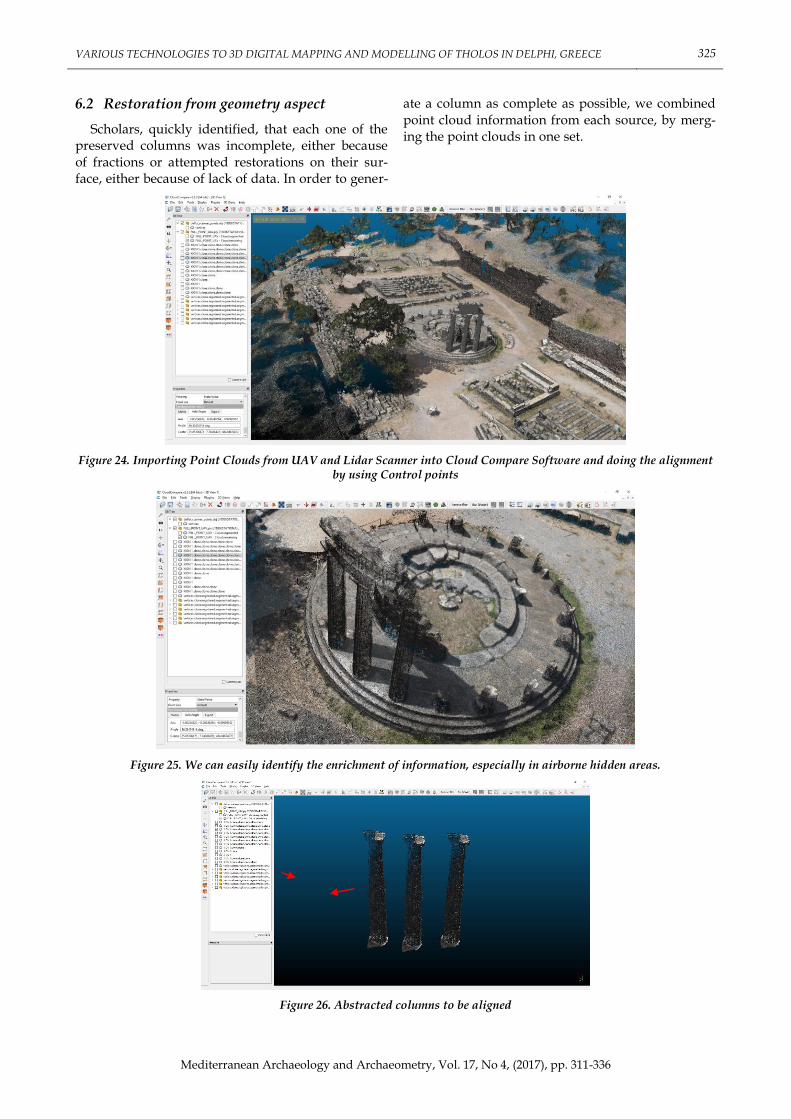
In order to fill areas with less information, point clouds taken from different source (vantage points), must be aligned. In Cloud Compare Software (http://www.danielgm.net/cc/), which is an open source software for point cloud manipulation, we aligned the two point clouds the one from laser scanner as shown in Figure 9 and the other one from UAS using common tie points. It must be noted that this combination was necessary because UAS was programmed to take vertical photography, which does not cover completely vertical surfaces, while the laser scanner was scanning accurately the verti-cal surfaces. The combination of these clouds is shown in Figs. 24 and 25.
VARIOUS TECHNOLOGIES TO 3D DIGITAL MAPPING AND MODELLING OF THOLOS IN DELPHI, GREECE 325
Mediterranean Archaeology and Archaeometry, Vol. 17, No 4, (2017), pp. 311-336
6.2 Restoration from geometry aspect
Scholars, quickly identified, that each one of the preserved columns was incomplete, either because of fractions or attempted restorations on their sur-face, either because of lack of data. In order to gener-
ate a column as complete as possible, we combined point cloud information from each source, by merg-ing the point clouds in one set.
Figure 24. Importing Point Clouds from UAV and Lidar Scanner into Cloud Compare Software and doing the alignment by using Control points
Figure 25. We can easily identify the enrichment of information, especially in airborne hidden areas.
Figure 26. Abstracted columns to be aligned

326 J. HATZOPOULOS et al.
Mediterranean Archaeology and Archaeometry, Vol. 17, No 4, (2017), pp. 311-336
Figure 27. Column restoration process
The resulted column gained information from each assessed angle, provide us with a more accurate column model to continue with the restoration as shown in Fig. 26. The remains of the rest columns, as well as the columns capital orientation, helped us to establish the final placement as shown in Fig. 27.
Restoring the pediment is labor intensive proce-dure, because it involves non-reiterative objects like the relief sculpture. In order to study the edifice, we recreated the pediment, disregarding the relief sculptures by repeating the above-mentioned pro-cess (see Fig. 28).
Figure 28. Pediment reconstruction
In order to correctly place the replicated pediment parts and identify the missing ones, students used CAD Software to extract the pediments section and revolve them along the monuments radius. This pro-cedure involved three steps as shown in the Figs. 29
and 30 below. The exact use of the detailed plan of Tholos is not known and only suggestive alterna-tives at the moment have been presented (https://www.coastal.edu/intranet/ashes2art/delphi2/marmaria/tholos_temple.html).

VARIOUS TECHNOLOGIES TO 3D DIGITAL MAPPING AND MODELLING OF THOLOS IN DELPHI, GREECE 327
Mediterranean Archaeology and Archaeometry, Vol. 17, No 4, (2017), pp. 311-336
Figure 29. Export cross-section to CAD(eg DXF). Identify Radius and Arc. Revolve Cross Section (Autodesk - AutoCAD 2015)
Figure 30. Finalized Columns and Pediment Structures
6.3 Protection and maintenance processes
Several, worth mentioning technics regarding pro-tection were showcased in class such us:
6.3.1 Drainage calculation
One of the most common work in the annual maintenance schedule of an archaeological site, is to ensure proper drainage, rendering the site accessible
to public, while protecting the monument. Usually these practices are carried out using empirical obser-vations, or measuring the flow direction in critical places. In the Post-process class, students used the DEM file of Tholos site and GIS Software to effec-tively calculate Flow accumulation, direction (Fig. 31), sink areas and visualize the most probable stream network (Tomanis et al., 2017).
Figure 31. DEM of tholos in GIS Software and calculated Flow Direction

328 J. HATZOPOULOS et al.
Mediterranean Archaeology and Archaeometry, Vol. 17, No 4, (2017), pp. 311-336
The exported DEM from UAS Photogrammetry had a spatial resolution of 6 cm and was imported in ArcGIS/ArcMap 10.3 Software for further analysis.
Using the Hydrology tools provided in the Spatial Analyst Toolset, students followed the Fig. 32 to de-rive runoff characteristics.
Figure 32. Hydrological modelling (Curtesy of ESRI ArcMap tools)
The provided DEM was adequate to provide suf-ficient resolution to identify even the smallest
streams obtaining a useful tool cross referencing with existing drainage network (Fig. 33).
Figure 33. Stream network layered on Orthomosaic (Feature attributes include Stream link, order and length)
6.3.2 Shade calculations
A simple yet important task, is the ability to calcu-late shadow casts within the site. This calculation provides the archaeological site authorities with the required information to properly place:
Signage, information stands unreadable under
direct sun light
Benches or rest areas and take advantage of
natural shade
Best observation angles/routes
With this scope DEM once again further exploited in GIS Software to calculate shades using as parame-ters the working hours and months of the site. In class the task was carried out using ArcMap 10.3 Hillshade Tool provided in the Surface/ Spatial Analyst Toolset (Fig. 34).
VARIOUS TECHNOLOGIES TO 3D DIGITAL MAPPING AND MODELLING OF THOLOS IN DELPHI, GREECE 329
Mediterranean Archaeology and Archaeometry, Vol. 17, No 4, (2017), pp. 311-336
Figure 34. Hill shade relief with shadows visible form the beginning (light grey) to end (dark grey) of Sites working hour.
The resulted map, confirms what we witnessed on site, which the majority of visitors choose the south-ern route strafing on North-NorthWest avoiding the sun. This natural self-preserving instinct is responsi-ble to make them to protect their eyes, yet most of them missed some important information signs at the Northern Route and could easily avoided with this simple derivative.
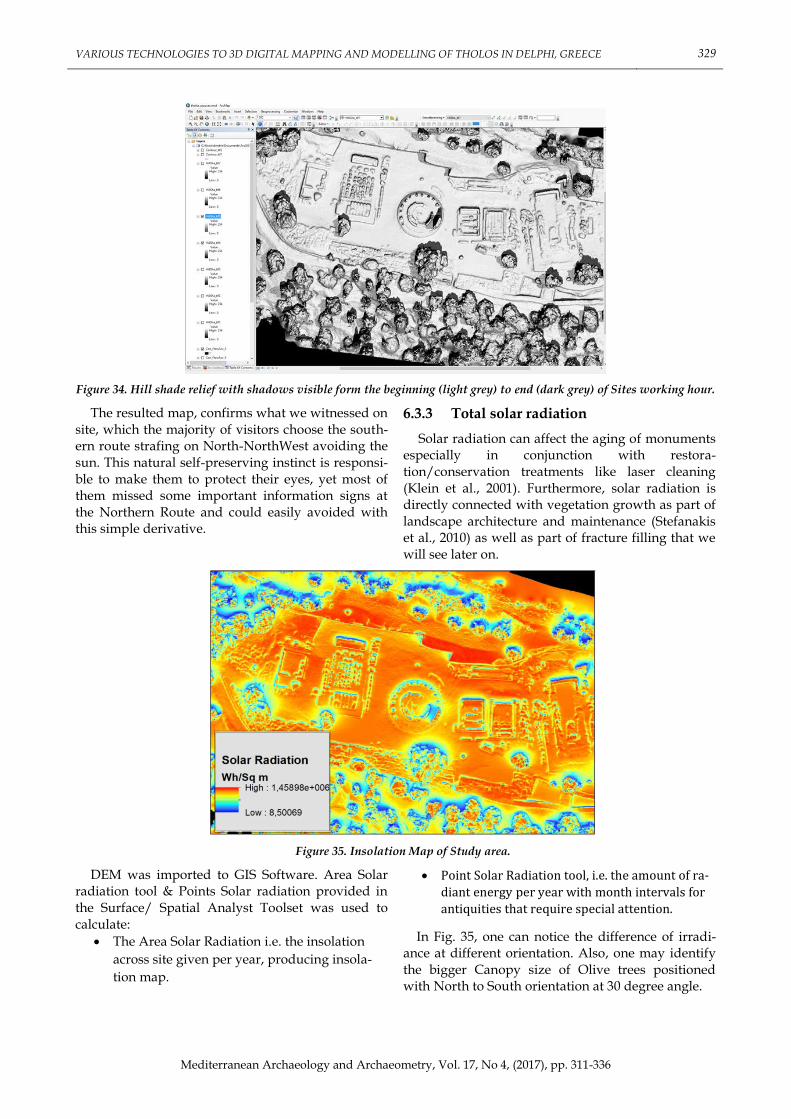
6.3.3 Total solar radiation
Solar radiation can affect the aging of monuments especially in conjunction with restora-tion/conservation treatments like laser cleaning (Klein et al., 2001). Furthermore, solar radiation is directly connected with vegetation growth as part of landscape architecture and maintenance (Stefanakis et al., 2010) as well as part of fracture filling that we will see later on.
Figure 35. Insolation Map of Study area.
DEM was imported to GIS Software. Area Solar radiation tool & Points Solar radiation provided in the Surface/ Spatial Analyst Toolset was used to calculate:
The Area Solar Radiation i.e. the insolation
across site given per year, producing insola-
tion map.
Point Solar Radiation tool, i.e. the amount of ra-
diant energy per year with month intervals for
antiquities that require special attention.
In Fig. 35, one can notice the difference of irradi-ance at different orientation. Also, one may identify the bigger Canopy size of Olive trees positioned with North to South orientation at 30 degree angle.

330 J. HATZOPOULOS et al.
Mediterranean Archaeology and Archaeometry, Vol. 17, No 4, (2017), pp. 311-336
Point Solar radiation tool, was helpful to visual-ize the irradiance difference among specific artifacts as well as understand the amount of variation dur-ing the year calculating month intervals. The spatial
accuracy of given data along with the calculated fig-ures, can be used as input to calibrate treatment in-struments as mentioned, or used as reference in dis-coloration or other surface anomalies (Fig. 36).
Figure 36. Selected Points and calculated solar radiation intervals, stored as attributes. Graphed values testify the dif-ference of irradiance within the year.
6.3.4 Calculate retaining wall or rock discontinuities
Accentuating Multi-disciplinary, instructors gave an example of disseminating collected data for digit-ization purposes to other scholars. This example in-
volves the usage of dense point cloud from geologist and rock mechanics engineers to enhance disconti-nuities studies used to analyze rock stability (Dewez et al., 2016).
Figure 37. Calculated facets and Cell Fusion Parameters used in Cloud Compare software
For these purposes, merged UAS & Lidar Dense cloud imported to an open source software(Cloud Compare) for further analysis with the Facets plugin created and financed by Thomas Dewez, BRGM to Extract planar facets with a kd-tree (Fig. 37).
To quickly identify the principal facets orienta-tions by geologist, a stereogram was calculated using the stereogram tool (Fig. 38). Data can be exported to GIS for further classification.

VARIOUS TECHNOLOGIES TO 3D DIGITAL MAPPING AND MODELLING OF THOLOS IN DELPHI, GREECE 331
Mediterranean Archaeology and Archaeometry, Vol. 17, No 4, (2017), pp. 311-336
Figure 39. Facet SHP File, imported to GIS Software (QGIS 2.1) Courtesy of CloudCompare.org
Figure 38. Stereogram of Facet orientations
The resulting SHP file will be composed of 2D polygons (Fig. 39). The attribute table contain various piec-es of information for each facet:
Index
Center (X,Y,Z)
Normal (X,Y,Z)
retro-projection error (RMS)
horizontal extension
vertical extension
surface of the bounding rectangle
Surface
Dip direction
Dip
Family index
Sub-family index
6.3.5 GIS Multi-criteria analysis (Adding attributes to assessed information)
In each chapter students addressed a common task and undertaken it combining classical methods and modern tools effectively and efficiently. Digiti-zation processes that used to be time consuming ful-filled in matter of minutes when data exploited in GIS environment. But still it was crucial to under-stand that the combination of all available technolo-gies and their knowledge, when analyzed in time and space can produce a powerful decision tool support system, involving the integration of spatial-
ly referenced data in a problem solving environment (Malczewski, 2006; Liritzis & Vassiliou, 2006).
For this purpose we used digitized information of the study area (Fig. 40), adding literature quantita-tive and qualitative information in their attribute table using joining table method. Afterwards, using Geostatistical analysis, students were able to carry out an example of identifying connections e.g. be-tween monument‟s azimuth and age, though azi-muth is also related to celebrating deity at a particu-lar date of the year.

332 J. HATZOPOULOS et al.
Mediterranean Archaeology and Archaeometry, Vol. 17, No 4, (2017), pp. 311-336
Figure 40. Digitized artifacts and attribute table containing Azimuth and Age information in ArcMap GIS Software
Figure 41. Calculated Surface model of Azimuth measurements and numbers that are extracted and Labeled Chronologi-cal data as spatially related with certain criteria to the azimuth.
In GIS Software, students used spatial interpola-
tion tools under Geostatistical analysis toolset (ArcMap 10.3) to interpolate Azimuths (Fig. 41). Fur-thermore, using identity tool, they were able to ex-tract and label age information as spatially related with certain criteria to the azimuth, thus enable them
to identify regions of the study area from different eras. Noticeably from Fig. 41, we can identify a pat-tern regarding age of construction, though further analysis can be accomplished to join azimuths and chronological estimation as performed in archaeoas-tronomy science. This was performed as an exercise
VARIOUS TECHNOLOGIES TO 3D DIGITAL MAPPING AND MODELLING OF THOLOS IN DELPHI, GREECE 333
Mediterranean Archaeology and Archaeometry, Vol. 17, No 4, (2017), pp. 311-336
having in mind that similar azimuths do not neces-sarily imply same age, but it is important to get through azimuth the orientation of the monument and angular altitude of skyshine for archaeoastro-
nomical orientation purposes (Liritzis & Vassiliou, 2002). Azimuths are determined by digitizing any
two points along the orientation of a monument. Angular altitude is also determined by digitizing two specific points along the orientation of the mon-ument the one being at the monument and the other at a distance of such a ground elevation as to maxim-ize the altitude angle.
7. EDUCATIONAL PRODUCTS FOR GAME ENGINES
In our days with the proper use of digital technol-ogies, the specific objectives of communication and promotion of cultural content has been systematical-ly studied. This scientific area is called Digital / Vir-tual Heritage (Addison, 2000). According to Addison (2000) there are three major domains in virtual heritage: • 3D Documentation: everything from site survey
to epigraphy • 3D Representation: from historic reconstruction
to visualization • 3D Dissemination: from immersive networked
worlds to „in-situ‟ augmented reality.
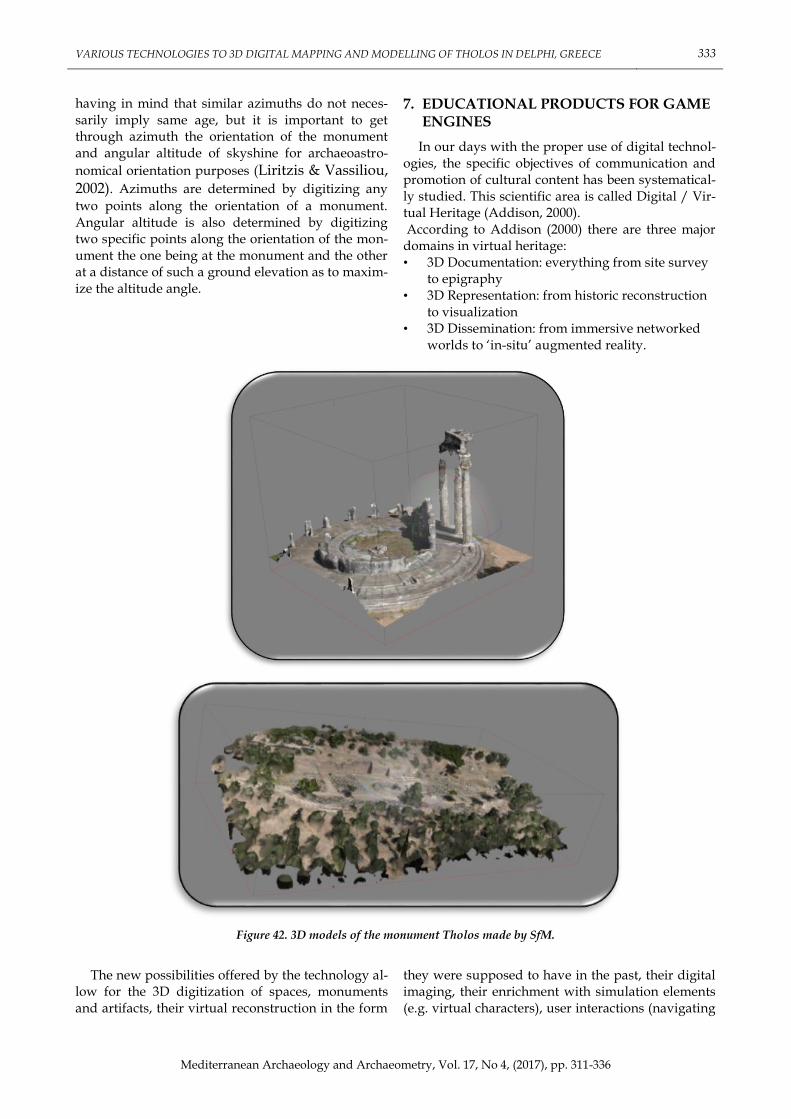
Figure 42. 3D models of the monument Tholos made by SfM.
The new possibilities offered by the technology al-
low for the 3D digitization of spaces, monuments and artifacts, their virtual reconstruction in the form
they were supposed to have in the past, their digital imaging, their enrichment with simulation elements (e.g. virtual characters), user interactions (navigating

334 J. HATZOPOULOS et al.
Mediterranean Archaeology and Archaeometry, Vol. 17, No 4, (2017), pp. 311-336
and manipulating objects), viewing additional in-formation and much more.
Structure from Motion (SfM) photogrammetric range imaging technique has been used, as shown in Fig. 42, for processing all photograph data, which created the 3D models below of the entire Tholos monument.
Elements such as storytelling, testing, gamifica-tion, or even integrating all into a serious game,
could lead to a more fun process, increasing the mo-bilization of users and leading to better learning out-comes (Mortara et al., 2014).
For example, Unity3D game engine software (Fig. 43), could be used to develop a serious game using the 3D models, or a virtual presentation with game and augmented reality elements presenting the an-cient life into the environment of Pronaia Athena and the sanctuary using learning tasks.
Figure 43. 3D models inside Unity3D.
Then evaluations with representative users in many scenarios should be designed and implement-ed using different teaching approaches to draw con-clusions about the suitability and usability of the various design choices as well as the overall contri-bution of such applications to the objectives dissem-ination and promotion of cultural heritage.
8. CONCLUSIONS
There was a quite successful effort to educate postgraduate students in the use of all kinds of tech-nologies for the digital reconstruction of the Tholos archaeological structure in Delphi.
Surveying technologies such as UAS, Total sta-tion, digital camera, Lidar scanner and GPS were used in situ to collect all necessary data and most important it was given the opportunity in each indi-vidual student to participate by hands on in most such processes. Consequently, back in the classroom it was used most advanced technologies in terms of software and methodologies such as photogramme-try for data processing. Data processing in the class-room gave also the opportunity to each individual
student to work with hands on in most advanced software such as Agisoft Photoscan and Structure from Motion (SfM).
The most important part of this project was the real application of Tholos monument and the use of all processing results for its geometric restoration and the site maintenance. The cooperative commu-nication between all the experts and the supplemen-tary nature of such projects proved essential and necessary. The participating students coming from different disciplines and having different back-grounds had the opportunity to collaborate together and learn how to communicate with each other. In addition, they came in contact with modern and con-temporary methods and derivatives, learning their application, utility and necessity. This project formed an innovative learning outcome for graduate students, offered useful data to local archaeological authorities for use in restoration, protection, preser-vation, conservation purposes and highlighted the interdisciplinary value of archaeological sciences concerning digital cultural heritage.

VARIOUS TECHNOLOGIES TO 3D DIGITAL MAPPING AND MODELLING OF THOLOS IN DELPHI, GREECE 335
Mediterranean Archaeology and Archaeometry, Vol. 17, No 4, (2017), pp. 311-336
ACKNOWLEDGEMENTS
The concept, initiation and realization of the postgraduate programme "Applied Archaeological Sciences" was made by Ioannis Liritzis with the excellent coordination and collaboration of the participating teaching team.
Thanks to the Ephoria of Antiquities of Phokis, especially Dr. N. Petrochilos and the Ministry of Culture for facilitating the execution of this ongoing educational project.
REFERENCES
Addison, A. C. (2000). Emerging trends in virtual heritage. IEEE multimedia, 7(2), 22-25. Altuntas Cihan Altuntas, Serhan Herez and Sleyman Kirli (2017), Image based methods for surveying herit-
age of masonry arch bridge with the example of Dokuzunhanin Konya, Turkey, SCIENTIFIC CUL-TURE, Vol. 3, No. 2, 13-20.
Valerio Baiocchi, Donatella Dominici, Michael Elaiopoulos, Vincenzo Massimi, Martina Mormile, Elisa Ros-ciano, (2013). UAV flight plan software: first implementation of UP23d. Towards Horizon 2020. EARSel Proceedings.
Chiabrando, F, Nex, FC, Piatti, D & Rinaudo, F (2011) 'UAV and RPV systems for photogrammetric surveys in archaelogical areas: two tests in the Piedmont region (Italy)' Journal of Archaeological Science, vol 38, no. 3, pp. 697-710. DOI: 10.1016/j.jas.2010.10.022.
Dewez, T. J. B., Girardeau-Montaut, D., Allanic, C., and Rohmer, J. , (2016) Facets : A Cloudcompare plugin to extract geological planes from unstructured 3D point clouds, Int. Arch. Photogramm. Remote Sens. Spatial Inf. Sci., XLI-B5, 799-804, doi:10.5194/isprs-archives-XLI-B5-799-2016.
Forte M., (2005), A Digital “Cyber” Protocol for the Reconstruction of the Archaeological Landscape: Virtual Reality and Mindscapes. In Recording, Modeling and Visualization of Cultural Heritage (eds: E.Baltsavias, A.Gruen, L.Van Gool, M.Pateraki) Published by Taylor & Francis / Balkema ISBN 0 415 39208 X, 339-351, 2005.
Hatzopoulos John N., Christos Vasilakos, Sevastos Christofidis, Sotoris Htouris, Athina-Christiane Loupou, (2006), “Photogrammetric Mapping of Mediterranean Defense Structures Using an Amateur Digi-tal Camera, GPS and Theodolite”, Proceedings of the ASPRS annual conference, May 1-5, 2006, Re-no, Nevada, USA.
Hatzopoulos J. N., (2008) “Topographic Mapping” Covering the wider field of Geospatial Information Science & Technology (GIS&T), Universal Publishers, 750 pages.
Jennifer L. R. Jensen, Adam J. Mathews, (2016) Assessment of Image-Based Point Cloud Products to Gener-ate a Bare Earth Surface and Estimate Canopy Heights in a Woodland Ecosystem. Remote Sens. 8(1), 50; doi:10.3390/rs8010050
Kevin S. Pratt,Robin Murphy,Sam Stover,Chandler Griffin. CONOPS and autonomy recommendations for VTOL small unmanned aerial system based on Hurricane Katrina operations: Journal of Field Robot-ics. Vol. 26. Issue 8. 2009.
S. Klein, F. Fekrsanati, J. Hildenhagen, K. Dickmann, H. Uphoff, Y. Marakis, V. Zafiropulos, (2001) Discolor-ation of marble during laser cleaning by Nd:YAG laser wavelengths. Applied Surface Science, Vol.171, Nos. 3–4, 242-251.
Lawrence, A.W., (1957) Ancient Greek Architecture. Baltimore: Penguin Books. Lerma García J.L., Van Genechten B., Heine E. & Santana Quintero, M. (Eds.), (2008) 3D Risk Mapping, The-
ory and Practice on Terrestrial Laser Scanning. Training Material Based on Practical Applications, Universidad Politécnica de Valencia, Spain, ISBN: 978-84-8363-312-0, 261 pages.
Levy T., E., Vid Petrovic, Thomas Wypych, Aaron Gidding, Kyle Knabb, David Hernandez, Neil G. Smith, Jürgen P. Schlulz, Stephen H. Savage, Falko Kuester, Erez Ben-Yosef, Connor Buitenhuys, Casey Jane Barrett, Mohammad Najjar, Thomas DeFanti (2010) On-Site Digital Archaeology 3.0 and Cyber-Archaeology: Into the Future of the Past – New Developments, Delivery and the Creation of a Data Avalanche. Published by Archaeopress Publishers of British Archaeological Reports Gordon House 276 Banbury Road Oxford OX2 7ED England. (https://www.academia.edu/6135483/OnSite_Digital_Archaeology_3.0_and_CyberArchaeology _Into_the_Future_of_the_Past_New_Developments_Delivery_and_the_Creation_of_a_Data_Avalanche )

336 J. HATZOPOULOS et al.
Mediterranean Archaeology and Archaeometry, Vol. 17, No 4, (2017), pp. 311-336
Levy, T. E., J. D. Anderson, M. Waggoner, N. Smith, A. Muniz, and R. B. Adams, (2001) Interface: Archaeol-ogy and Technology - Digital Archaeology 2001: GIS-Based Excavation Recording in Jordan. The SAA Archaeological Record 1:23 - 29.
Liritzis, I., Al-Otaibi, F.M, Volonakis, P and Drivaliari, A (2015) Digital technologies and trends in cultural heritage. Mediterranean Archaeology and Archaeometry, Vol. 15, No 3, pp. 313-332 (DOI: 10.5281/zenodo.33832).
Liritzis I., and Castro, (2013) Delphi and Cosmovision: Apolo's absence at the land of the hyperboreans and the time for consulting the oracle. Journal of Astronomical History and Heritage, 16(2), 184-206.
Liritzis I. and Vassiliou H., (2006), Highlighting New Archaeoastronomical Results from Greece (prehistoric, classical and Byzantine temples). In Lights and Shadows in Cultural Astronomy. Proceedings of SEAC 13, 2005, Regione Autonoma Della Sardegna & Instituto de Astrofisica de Canarias, Isli, Sardinia, 220-238.
Liritzis I. and Vassiliou H., (2002), Astronomical orientations of ancient temples at Rhodes and Attica with a tentative interpretation. Mediterranean Archaeology & Archaaeometry, Vol. 2, No. 1, 69-79.
Luyster, R (1965) Symbolic Elements in the Cult of Athena. History of Religions 5, no. 1, 133-163. Marmaria (1997) Le Sanctuaire d Athena a Delphes. Paris: Ecole francaise d Athenes; Electricite de France;
Depositaire, De Boccard Edition-Diffusion. Jacek Malczewski (2006) GIS-based multicriteria decision analysis: a survey of the literature. International
Journal of Geographical Information Science 20, 703–726. Michaud, Jean-Pierre, (1973) Fouilles des Delphes: Tresor des Thebes: Architecture et Topographie. Vol. 15-16.
French School of Athens: Athens, Greece. Matthias Lang, Thorsten Behrens, Karsten Schmidt, Dieta Svoboda, Conrad Schmidt, (2015) A Fully Inte-
grated UAV System for Semi-automated Archaeological Prospection. CAA2015. Keep The Revolu-tion Going: Proceedings of the 43rd Annual Conference on Computer Applications and Quantita-tive Methods in Archaeology.
Mortara, M., Catalano, C. E., Bellotti, F., Fiucci, G., Houry-Panchetti, M., & Petridis, P. (2014) Learning cul-tural heritage by serious games. Journal of Cultural Heritage, 15(3), 318-325.
A.T., Mozas-Calvache J.L. Pérez-García F.J. Cardenal-Escarcena E.Mata-Castro J.Delgado-García, (Feb. 2012). Method for photogrammetric surveying of archaeological sites with light aerial platforms. Journal of Archaeological Science. Vol. 39, Issue 2, Pages 521-530.
Pedley, J (2005) Sanctuaries and the Sacred in the Ancient Greek World. New York: Cambridge University Press. Puttock, A.K, A.M. Cunliffe, K. Anderson, R.E. Braziera. (2015) Aerial photography collected with a multi-
rotor drone reveals impact of Eurasian beaver reintroduction on ecosystem structure. Journal of Unmanned Vehicle Systems. Vol3, Issue 3, 123-130.
Sabharwal, A. (2015) Structuring Collections in Digital Archives. Presented at Network Detroit: Digital Human-ities Theory and Practice, Lawrence Technological University, Southfield, MI.
Salama K. K., Ali, M. F., El-Shiekh, S. M.,m (2017) Reconstruction of monastery Saint Jeremiah computer-aided design model, SCIENTIFIC CULTURE, Vol. 3, No., 1, 11-14.
Stefanakis D, J. Hatzopoulos, N. Margaris, N. Danalatos, (2013) Creation of a Remote Sensing Unmanned Aerial System (UAS) for Precision Agriculture and Related Mapping Applications, Proceedings of the annual conference of the ASPRS, March 24-28, Baltimore Maryland, USA.
Tomanis l., Kavvadias A.,Psomiadis E., Michas S., Stefanakis D., (2017) Dam break analysis and flood wave routing using hec-ras and unmanned aerial system 3d digital model data, the case of bramianos dam, Crete. Proccedings of 11th International Hydrogeological Congress of Greece. Athens.
Valavanis, P, (2004) Games and Sanctuaries in Ancient Greece: Olympia, Delphi, Isthmia, Nemea, Athens. Los An-geles: J. Paul Getty Museum.
Valavanis, K.P and Vachtsevanos, G.J (2014) Handbook of Unmanned Aerial Vehicles. Vol. 1. Section 2. Chapter 7. P 107-108. Springer Inc.