use of viirs aot in hierarchical autoregressive model to ...€¦ · use of viirs aot in...
TRANSCRIPT

Use of VIIRS AOT in Hierarchical Autoregressive
Model to Predict Daily PM2.5
Jim Szykman1
Joint work with Erin Schliep2, Alan Gelfand2, David Holland1
1National Exposure Research Laboratory
U.S. EPA, Office of Research and Development, RTP, NC 277112Duke University, Durham, NC 27708
Session 7e: Clouds and Aerosol Breakout
STAR JPSS, 2015 Annual Science Team Meeting
24-28 August 2015
College Park, MD
1

Motivation
Spatial and temporal coverage of existing PM2.5 monitoring -
significant data gaps resulting in over 36 million Americans
(~40% of the area) not covered by a monitoring network
Demand for accurate air quality characterization in community
surveillance/human health analyses
Chemical Transport Models require extensive emission
inventories for model predictions – often do not capture high
PM2.5 concentrations associated with wildfires
Daily AOT is a measure of the true state of the atmosphere for
aerosols
Additional information needed for spatial prediction of PM2.5 in the hatched areas
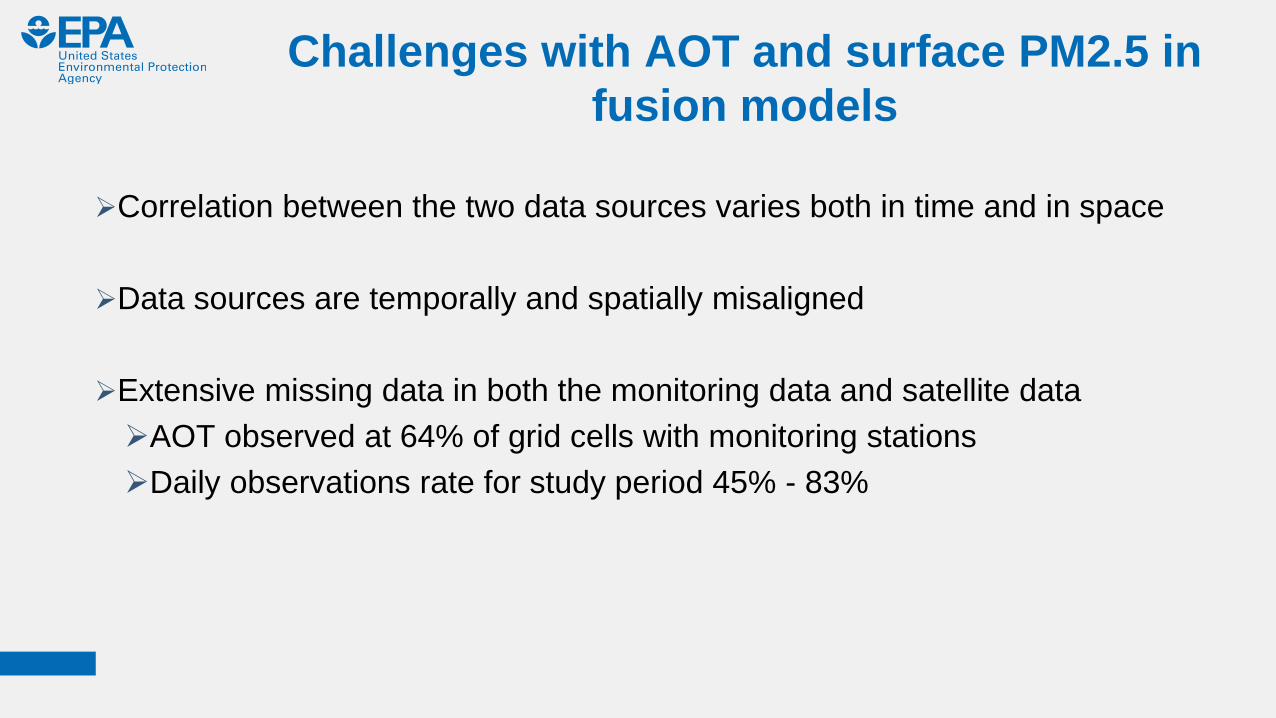
Challenges with AOT and surface PM2.5 in
fusion models
Correlation between the two data sources varies both in time and in space
Data sources are temporally and spatially misaligned
Extensive missing data in both the monitoring data and satellite data
AOT observed at 64% of grid cells with monitoring stations
Daily observations rate for study period 45% - 83%

N = 522R = 0.47
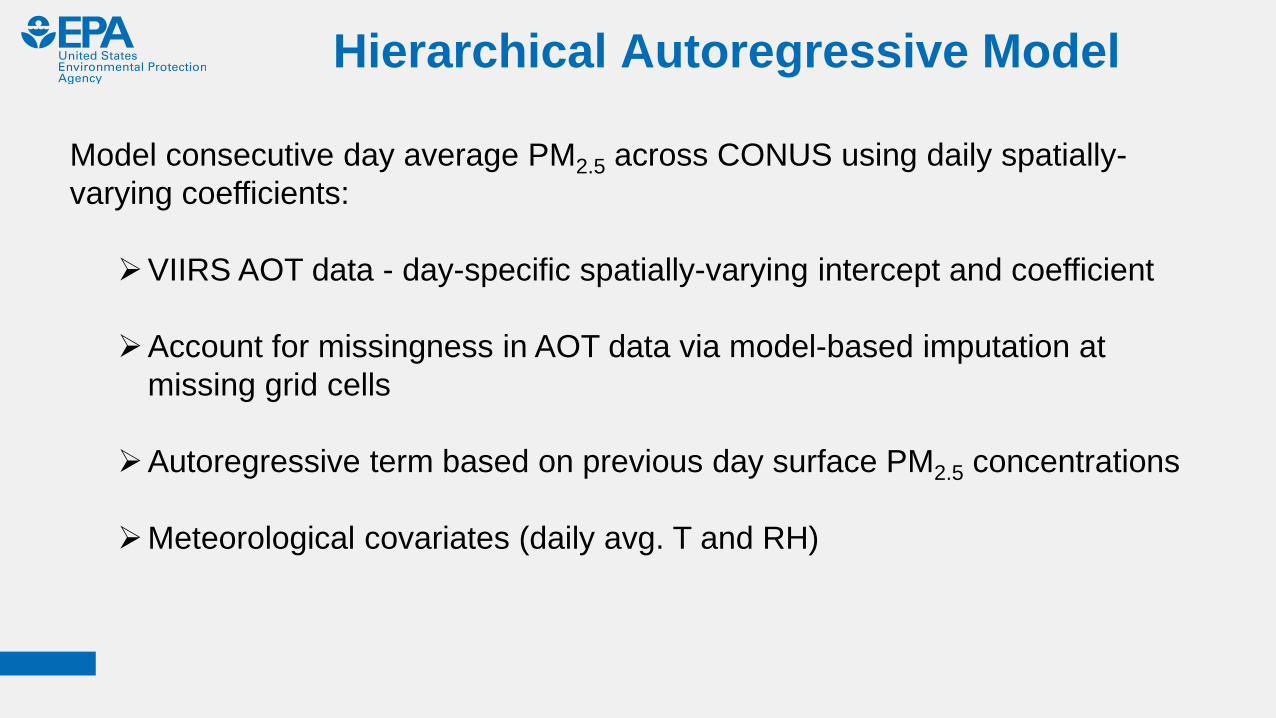
Model consecutive day average PM2.5 across CONUS using daily spatially-
varying coefficients:
VIIRS AOT data - day-specific spatially-varying intercept and coefficient
Account for missingness in AOT data via model-based imputation at
missing grid cells
Autoregressive term based on previous day surface PM2.5 concentrations
Meteorological covariates (daily avg. T and RH)
Hierarchical Autoregressive Model
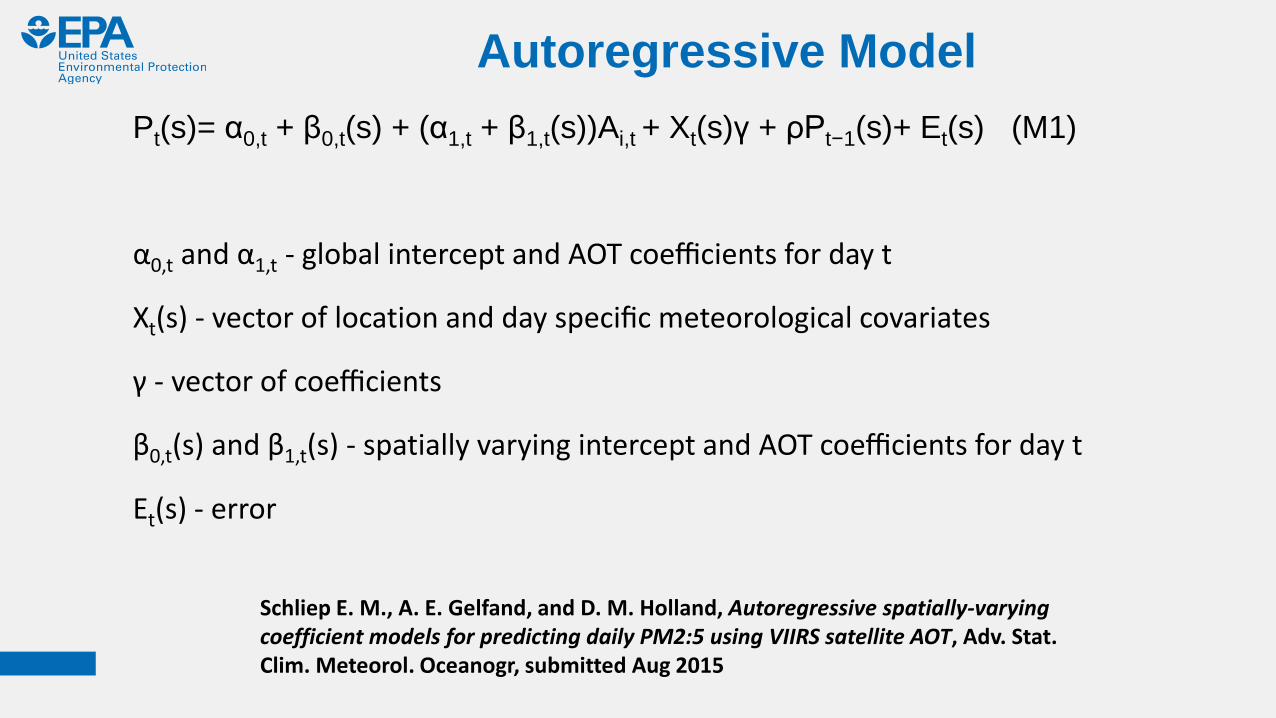
Autoregressive Model
Pt(s)= α0,t + β0,t(s) + (α1,t + β1,t(s))Ai,t + Xt(s)γ + ρPt−1(s)+ Et(s) (M1)
α0,t and α1,t - global intercept and AOT coefficients for day t
Xt(s) - vector of location and day specific meteorological covariates
γ - vector of coefficients
β0,t(s) and β1,t(s) - spatially varying intercept and AOT coefficients for day t
Et(s) - error
Schliep E. M., A. E. Gelfand, and D. M. Holland, Autoregressive spatially-varying coefficient models for predicting daily PM2:5 using VIIRS satellite AOT, Adv. Stat. Clim. Meteorol. Oceanogr, submitted Aug 2015
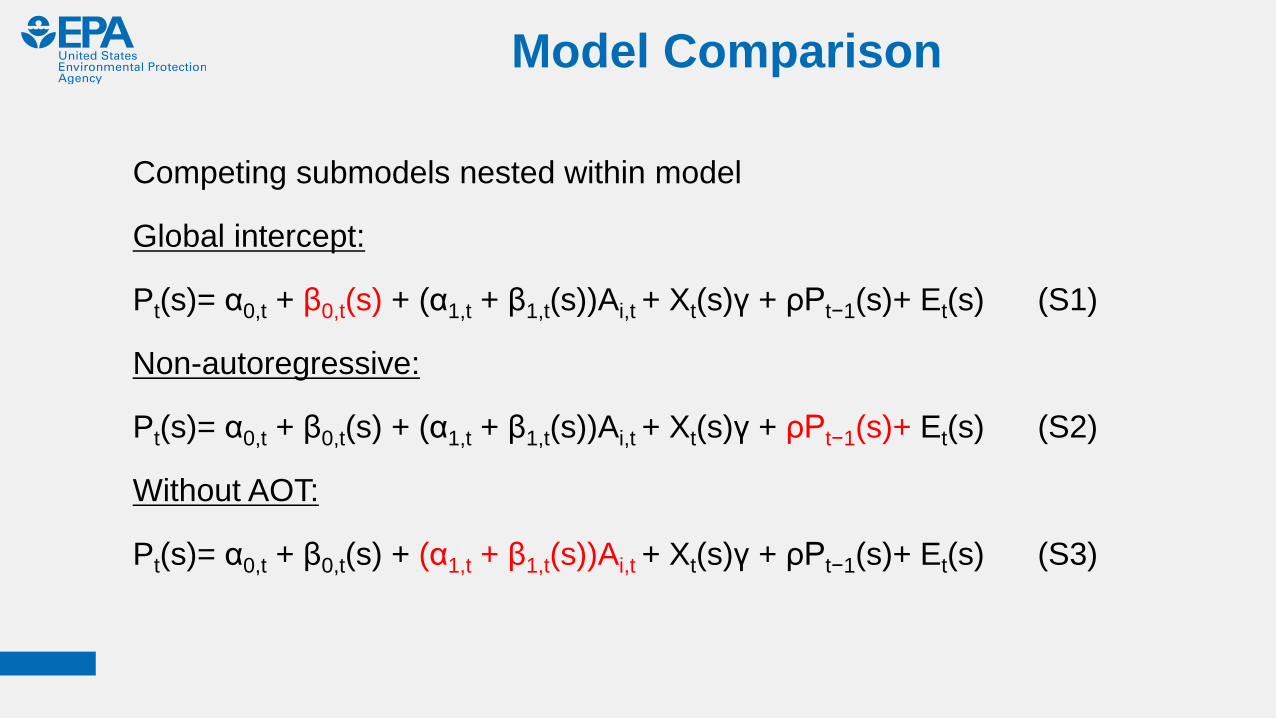
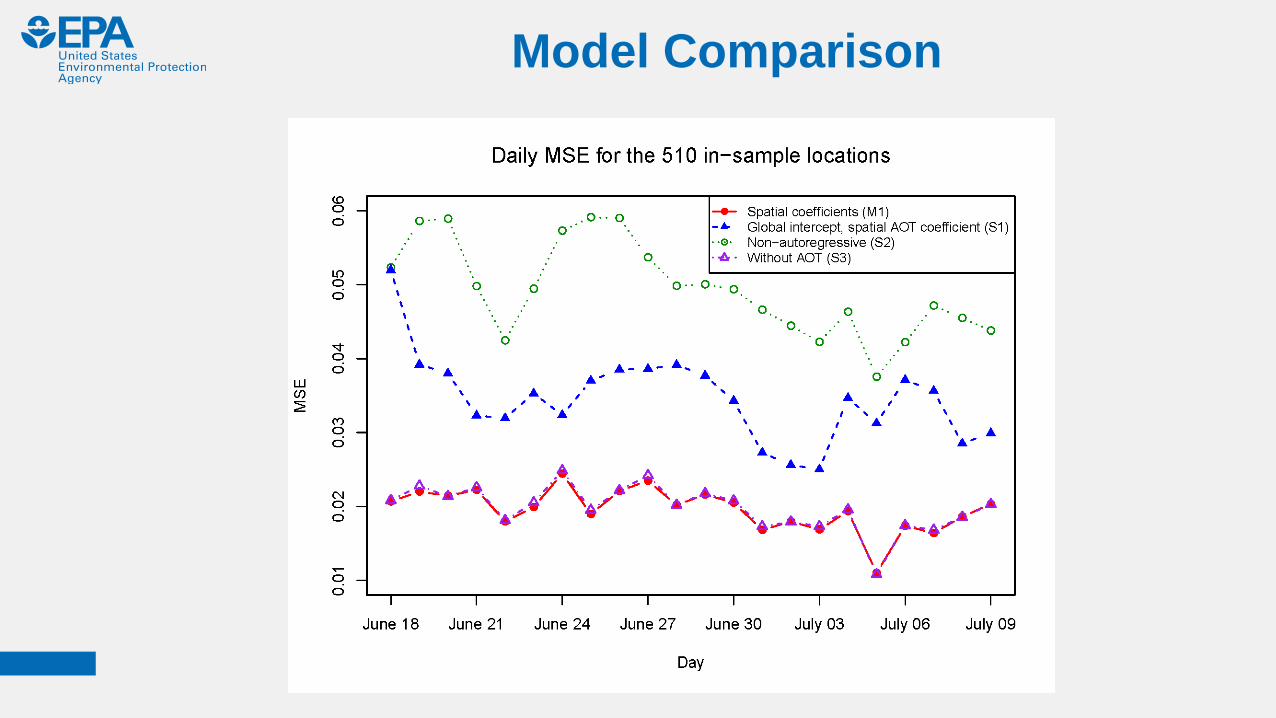
Model Comparison
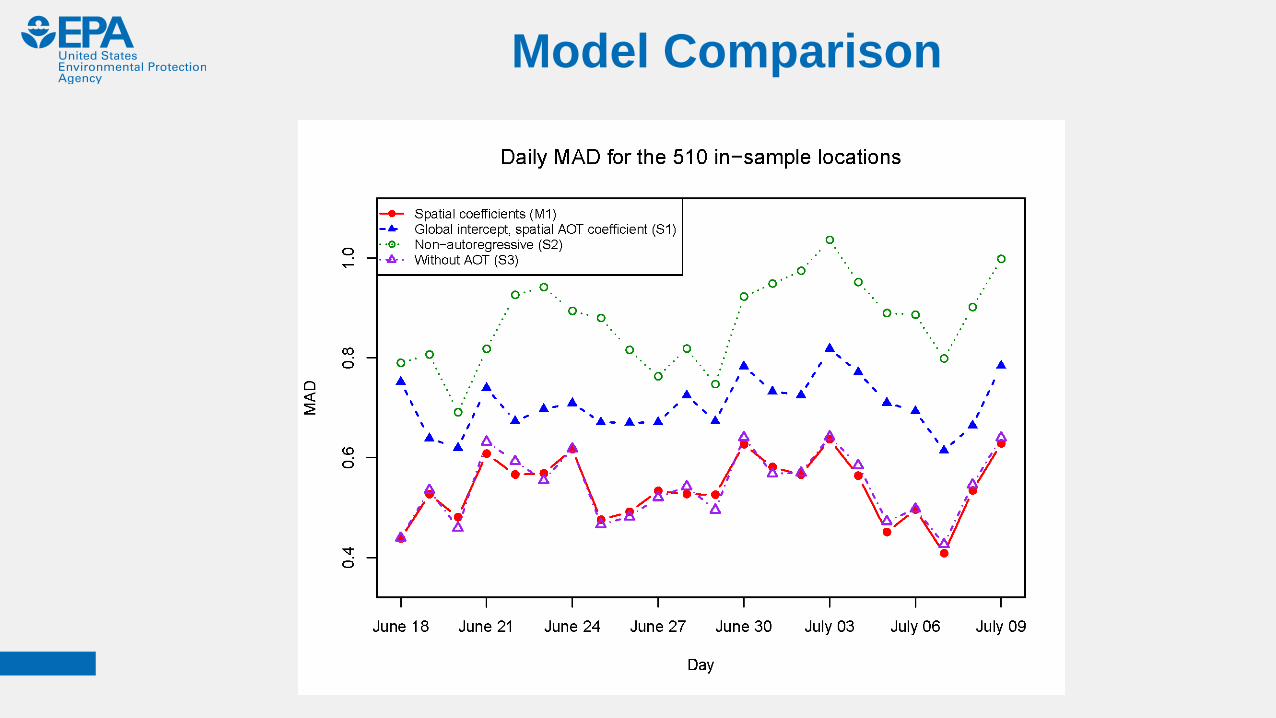
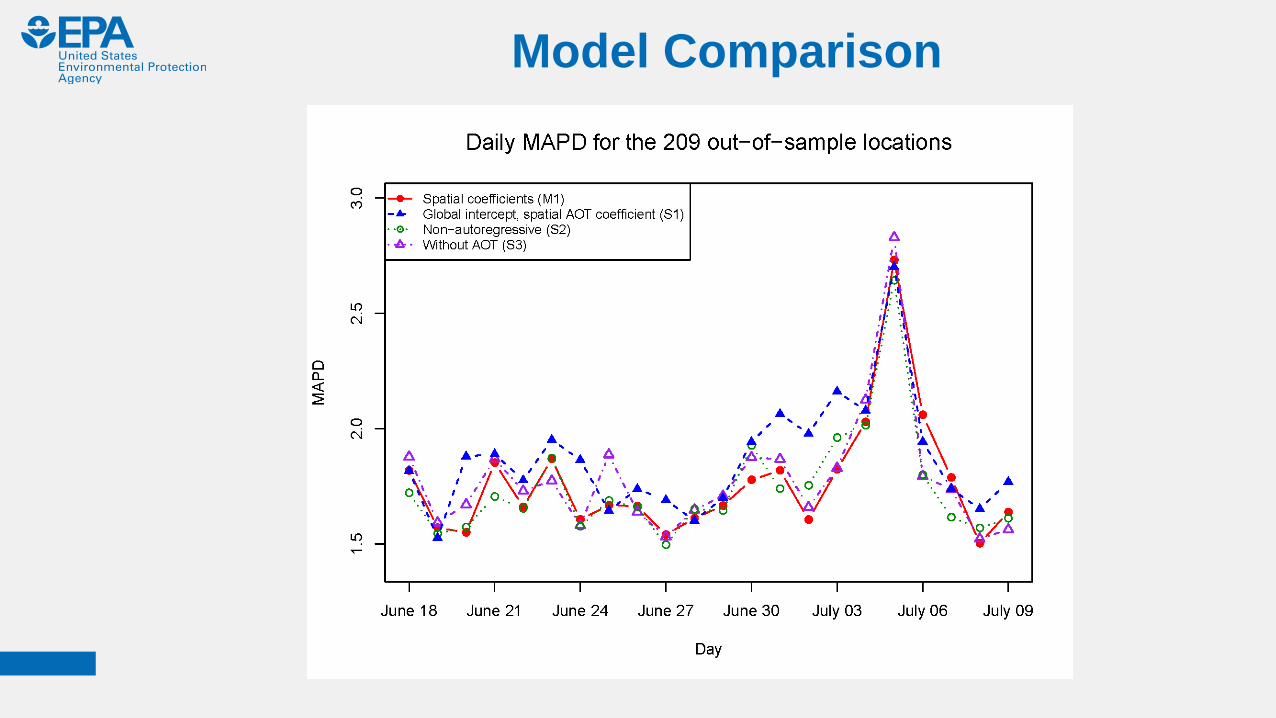
Competing submodels nested within model
Global intercept:
Pt(s)= α0,t + β0,t(s) + (α1,t + β1,t(s))Ai,t + Xt(s)γ + ρPt−1(s)+ Et(s) (S1)
Non-autoregressive:
Pt(s)= α0,t + β0,t(s) + (α1,t + β1,t(s))Ai,t + Xt(s)γ + ρPt−1(s)+ Et(s) (S2)
Without AOT:
Pt(s)= α0,t + β0,t(s) + (α1,t + β1,t(s))Ai,t + Xt(s)γ + ρPt−1(s)+ Et(s) (S3)
Model Comparison
Model Comparison
Model Comparison

Summary and Conclusion
Use of VIIRS AOT in hierarchical autoregressive model to model daily
average PM2.5 concentration across CONUS
Several submodels considered to quantify improvement in daily PM2:5
prediction using AOT
Model comparison results show limited predictive capability with AOT,
results consistent Paciorek and Liu (2009)
Factors likely influencing use of AOT in model
Missing AOT data
Vertical structure of aerosols – need to develop improved scaling of
AOT for aerosol aloft.

Vaisala CL-51 Ceilometer Stated Characteristics:
• Cloud reporting range: 0…43,000 ft (0…13km)
• Backscatter profiling range: 0…49,200 ft
(0…15km)
• Can operate in all weather
• Fast measurement - 6 second measurement
cycle
• Reliable automatic operation
• Good data availability
• Eye safe diode laser (LIDAR)
12
EPA considering use of ceilometer (CL-51) as viable
technology for PAMS mixing layer measurement
CL-51 positioned next to Space Science and
Engineering Center, University of Wisconsin
Mobile Lab

Map based on 2011-2013 ozone design valuesPAMS requirements will be based on 2014-2016 data
Potential Site Locations for ceilometer (CL-51) Network
EPA Photochemical Assessment Monitoring Station
(PAMS) program
HLH
Elevated aerosol plume from western wildfires
Future CL-51 Network would allow for continuous aerosol profile measurement to define HLH on a regional basis
CL-51 provides backscatter profile (~910 nm) up to 15.4 km

14
Disclaimer: Although this work was reviewed by EPA and approved for presentation, it may not necessarily reflect official Agency policy. Mention of products or trade names does not indicate endorsement or recommendation for use by the Agency.