use of x-ray micro-computed tomography in pharmaceuticals ... · pdf fileuse of x-ray...
TRANSCRIPT

6th Conference on Industrial Computed Tomography, Wels, Austria (iCT 2016)
www.3dct.at 1
Use of X-ray micro-computed tomography in pharmaceuticals and food industry
Franziska Sondej1,Christian Rieck1, Martin Schmidt1, Andreas Bück1, Evangelos Tsotsas1
1 Thermal Process Engineering, Otto-von-Guericke University Magdeburg, Universitätsplatz 2, Magdeburg, 39106 Germany, [email protected]
Abstract Food and pharmaceutical products are subjected to strict requirements. Release rates of active ingredients need to be adapted to certain applications, surfaces have to show uniform coloring and storage stability needs to be ensured. The specifications of food and pharmaceutical products strongly depend on the uniformity, porosity and thickness distribution of the coating layer. During the formulation process these properties are created or preserved. Changing only two parameters (e.g., temperature and spray mass flow rate) in the process, the structure as well as the surface of the coating layer will change completely, resulting in completely different product characteristics. To get information about the coating layers and to correlate these with process conditions, X-ray µ-CT can be used. In this study, particles, which were produced in fluidized beds, are investigated using ProCon X-Ray micro-computed tomography. Regarding coating layer morphology, also particles coated with various materials can be investigated by µ-CT measurements. The experimentally determined layer thickness distributions can be used for validation of microprocess models. In this method, a Monte Carlo approach is used to calculate layer thickness distributions on single particles in a fluidized bed coating process. Both experimental and calculated layer thickness distributions are in good agreement supporting the measurement and evaluation procedure presented in this contribution.
Keywords: Product quality, Fluidized bed process, Coating layer morphology, Image analysis, Monte Carlo simulation
1 Introduction
1.1 Particulate products
Particulate products hold a huge share in all industries. About 75 % of all products processed in industry are of particulate form [1]. Also pharmaceutical and food industry use and produce a lot of different particles. Active pharmaceutical ingredients (APIs) often come in or are processed into powder form. Together with matrix material like, e.g., lactose the API is often pressed into tablets, or granulated and filled into pills. To mask unpleasant tastes and to retard the release of APIs, pharmaceuticals are often coated. Also cosmetic products like peeling creams contain functionalized particles. In food industries particles are used to a large extent. Cereals or sweets are often coated with sugar to improve taste or protective shellac to prevent smearing or deterioration. This paper will focus on particles processed in fluidized beds, and their quality measurement via X-ray micro-computed tomography (µ-CT).
1.2 Fluidized bed coating
A fluid flowing through a bed of particles in an upward direction at a certain velocity fluidizes the particles, when it exceeds the minimal fluidization velocity. In the most common case, the fluid is air. In the fluidized state, particles are well mixed with the fluid and the whole particle bed moves like a fluid itself. A fluidized bed granulator usually consists of a ventilator, heater/cooler, distributor plate, fluidized bed chamber, spraying nozzle, calming zone and filter (Fig. 1, left). With this setup, spray coating processes are possible. Therein, particles are sprayed with an, e.g., protective, coloring or masking solid-containing liquid forming a layer on the core particles (Fig. 1, right).
A very important application of coating processes is microencapsulation of, e.g., biodegradable components, offering longer shelf lifes of the active components through protective coating. Meiners [2] gives an overview of microencapsulation techniques. An example is protective coating of beta carotene due to its affinity to oxidation [3]. Also APIs are coated to prevent premature dissolution. Thus, tablets or powders consisting of carrier material like lactose and API can be coated by latexes [4, 5]. However, the dissolution kinetic of coatings like these is of high importance, since the API is supposed to be set free again. Thus, the porosity of the coating layer and its uniformity has to be evaluated. Homogeneous and uniform layers are preferred to ensure constant release rates at the correct time and place (e.g. not in the gastric but in the intestinal area). In this paper a method to investigate the coating layer porosity using µ-CT measurements will be presented based on the findings of Rieck et al. and Sondej et al. [6, 7, 8]. This contribution will focus on spray fluidized bed coating and the usage of the µ-CT to measure shell thickness and shell porosities of single particles, chosen representatively for the whole bulk. A series of fluidized bed experiments will be described, followed by the analysis of produced samples by µ-CT measurements. Experimental findings will then be compared to a theoretical model, calculating shell thicknesses from fluidized bed simulations.
Mor
e In
fo a
t Ope
n A
cces
s D
atab
ase
ww
w.n
dt.n
et/?
id=
1876
2
6th Conference on Industrial Computed Tomography, Wels, Austria (iCT 2016)
www.3dct.at 2
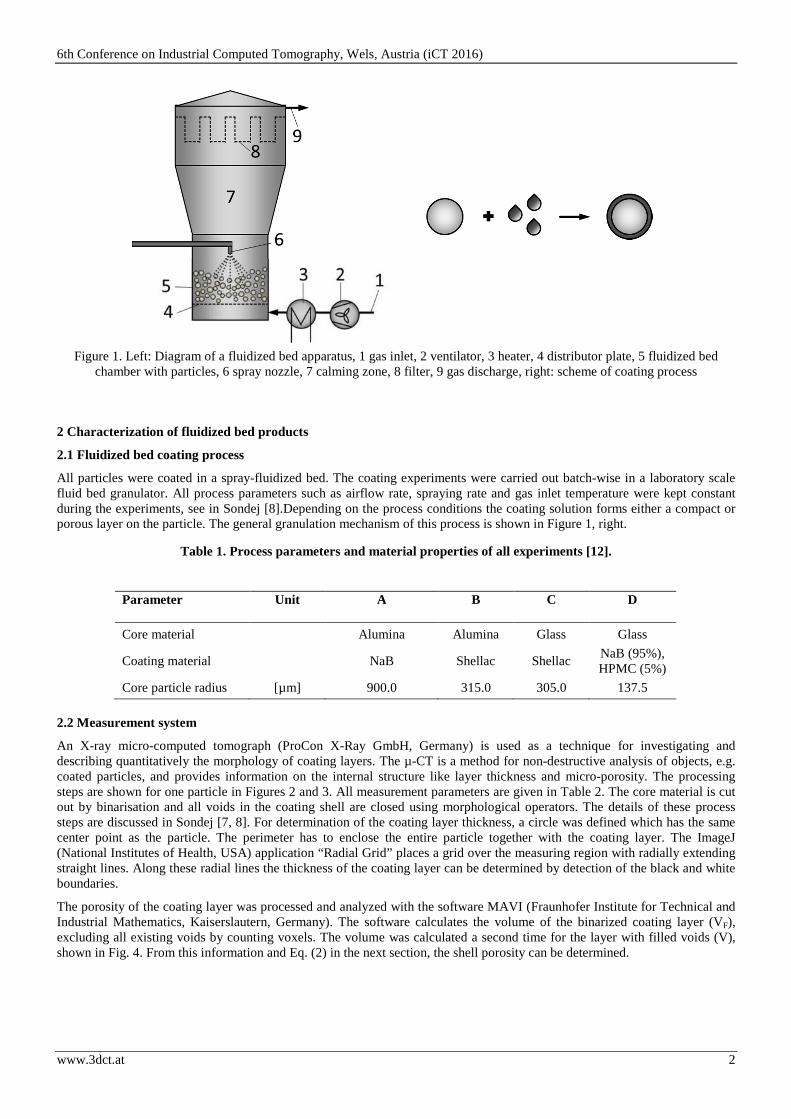
Figure 1. Left: Diagram of a fluidized bed apparatus, 1 gas inlet, 2 ventilator, 3 heater, 4 distributor plate, 5 fluidized bed chamber with particles, 6 spray nozzle, 7 calming zone, 8 filter, 9 gas discharge, right: scheme of coating process
2 Characterization of fluidized bed products
2.1 Fluidized bed coating process
All particles were coated in a spray-fluidized bed. The coating experiments were carried out batch-wise in a laboratory scale fluid bed granulator. All process parameters such as airflow rate, spraying rate and gas inlet temperature were kept constant during the experiments, see in Sondej [8].Depending on the process conditions the coating solution forms either a compact or porous layer on the particle. The general granulation mechanism of this process is shown in Figure 1, right.
Table 1. Process parameters and material properties of all experiments [12].
Parameter Unit A B C D
Core material Alumina Alumina Glass Glass
Coating material NaB Shellac Shellac NaB (95%), HPMC (5%)
Core particle radius [µm] 900.0 315.0 305.0 137.5
2.2 Measurement system
An X-ray micro-computed tomograph (ProCon X-Ray GmbH, Germany) is used as a technique for investigating and describing quantitatively the morphology of coating layers. The µ-CT is a method for non-destructive analysis of objects, e.g. coated particles, and provides information on the internal structure like layer thickness and micro-porosity. The processing steps are shown for one particle in Figures 2 and 3. All measurement parameters are given in Table 2. The core material is cut out by binarisation and all voids in the coating shell are closed using morphological operators. The details of these process steps are discussed in Sondej [7, 8]. For determination of the coating layer thickness, a circle was defined which has the same center point as the particle. The perimeter has to enclose the entire particle together with the coating layer. The ImageJ (National Institutes of Health, USA) application “Radial Grid” places a grid over the measuring region with radially extending straight lines. Along these radial lines the thickness of the coating layer can be determined by detection of the black and white boundaries.
The porosity of the coating layer was processed and analyzed with the software MAVI (Fraunhofer Institute for Technical and Industrial Mathematics, Kaiserslautern, Germany). The software calculates the volume of the binarized coating layer (VF), excluding all existing voids by counting voxels. The volume was calculated a second time for the layer with filled voids (V), shown in Fig. 4. From this information and Eq. (2) in the next section, the shell porosity can be determined.

6th Conference on Industrial Computed Tomography, Wels, Austria (iCT 2016)
www.3dct.at 3
Table 2. Settings of µ-CT measurements.
Measurement parameter Unit A B C D
Voltage [kV] 50 60 60 50
Current [µA] 160 180 180 160
Distance detector-sample [mm] 400 600 600 600
Angle increment [°] 0.3 0.3 0.3 0.3
Exposure time [ms] 2000 3500 3500 2000
Measuring time [h] 2.5 4 4 2.5
Resolution [µm] 1.9 0.9 0.9 0.9
Figure 3. Detailed illustration of the use of the radial grid to obtain layer thicknesses
Figure 2. 2-D slice images of particle from experiment A from µ-CT measurement, original (A), core removed (B), closed shell (C); (equatorial plane) [7].

6th Conference on Industrial Computed Tomography, Wels, Austria (iCT 2016)
www.3dct.at 4
Figure 4. Separated coating layer, filled with “closing” operator
2.3 Coating layer thicknesses and shell porosities
In two-dimensional setting, the thickness of the coating layer (or the shell thickness) s can be expressed simply by the difference of outer radius of the coating layer and the radius of the core particle. Then the layer thickness varies spatially, which can be expressed in terms of the angle α:
���� � ����� �����,� ∈ 0, 360°�. The origin for the radius measurement has to be placed inside the core particle, for instance at the center of gravity. Note that in case of an ideal spherical core particle with a perfect coating, i.e. when the particle remains ideally spherical after coating, no angular dependency exists and the shell thickness can also be expressed in terms of the difference of measured diameters.
The direct calculation of the local shell thickness is a classical inverse problem and can only be solved for special cases, e.g. for the case of ideally spherical core particles with an ideally uniform coating with uniform shell porosity. For this case, with known total mass of coating dry matter (Mc) added to the bed and total mass of core particles in the bed (Mp), Depypere et al. [9] presented an equation to calculate the theoretical layer thickness
In this equation, the particle density of the core particles is given by ρp, whereas ρs is the solid density of the coating material. Due to thermal effects during drying, the coating layer will not be completely compact but possess certain porosity. The mean porosity of the coating layer (ε�� depends on the composition of coating materials and on the chosen parameters in the coating process.
For evaluating the layer porosity, and knowing the image voxel size, a mathematical morphology operator named “closing” was used to close all internal voids of the layer. The mean porosity of the coating layer can be calculated based on the values obtained from the described volume analysis:
ε� � 1 ��� , (2)
where VF is the volume of the coating layer excluding voids and V is the layer volume after closing.
s � ��2 ��1 � �� ∙ ��1 !��� ∙ �"# $% 1&. (1)

6th Conference on Industrial Computed Tomography, Wels, Austria (iCT 2016)
www.3dct.at 5
3 Comparison of measured layer thicknesses to Monte Carlo simulation results The measured layer thicknesses, as well as the theoretical values of the thickness, which depend on the measured layer porosities (NaB – crystalline material, Shellac – natural, non-porous polymer) are shown in Table 3.The measured thicknesses possess good comparability with the theoretical values. The data is compared to layer thicknesses calculated by a stochastic modelling approach presented by Rieck et al. [10]. The model is based on a Monte Carlo method and includes three micro-scale events and processes, which are droplet deposition on the particle surface, droplet drying and layer formation, to describe a coating process. The surface area of each particle in the model is divided into several sub-surfaces (positions) to allow droplet deposition at different positions on each particle. It is then possible to calculate the thickness of the solid layer at each position of each particle leading to layer thickness distributions of the individual particles. This means that the layer thickness varies at different locations on the particle. Details of the algorithm are presented in [10].
Table 3. Calculated theoretical coating thickness and µ-CT results [8].
Experiment sc,theo εc sc,calc
(µ-CT)
σ of sc,calc
(µ-CT)
[ - ] [µm] [ - ] [µm] [µm]
A 26.16 0.30 26.17 6.47
B 26.55 0 28.09 3.94
C 29.69 0 30.31 3.56
D 13.10 0.10 12.47 4.64
In Fig. 5 and Fig. 6, the measured layer thickness distributions are compared with the results of the Monte Carlo simulation. As described above, the layer thicknesses of one individual particle for each experiment were measured. In the simulation, a layer thickness distribution is calculated for each single particle. Therefore it is not clear, which calculated layer thickness distribution should be used for validation. Hence, the layer thickness distributions of two single particles are shown: the particle with the lowest and the particle with the largest mean layer thickness, as indicated in Fig. 5 and Fig. 6. Then, the measured layer thickness distributions should lie in between both curves obtained from the simulation. The measured values are in good agreement with the simulation, supporting the described measurement procedure and its results.
Figure 5: Comparison of the cumulative layer thickness distribution obtained from measurements and the
Monte Carlo method for experiment A (a) and B (b) [10].

6th Conference on Industrial Computed Tomography, Wels, Austria (iCT 2016)
www.3dct.at 6
Figure 6: Comparison of the cumulative layer thickness distribution obtained from measurements and the
Monte Carlo method for experiment C (a) and D (b) [10].
Acknowledgements
The authors gratefully acknowledge the funding of this work by the German Federal Ministry of Science and Education (BMBF) as part of the InnoProfile-Transfer project NaWiTec (03IPT701X); funding of the X-ray micro tomographic device by the European Fund for Regional Development (EFRD, project no. 1211080002) is also gratefully acknowledged.
References [1] H. G. Merkus, Particle Size Measurements. Fundamentals, Practice, Quality, Springer Science+Business Media B.V., p.
1, 2009. [2] J.A. Meiners, Fluid bed microencapsulation and other coating methods for food ingredient and nutraceutical bioactive
compounds. In: Encapsulation technologies and delivery systems for food ingredients and nutraceuticals, N. Garti, D.J. McClements, Woodhead Publishing, p. 151-176, 2012
[3] C.P. Coronel-Aguilera, M.F. San Martín-González, Encapsulation of spray dried beta-carotene emulsion by fluidized bed coating technology. LWT - Food Science and Technology 62, p. 187-193, 2015.
[4] L. Donchun, H. Ichikawa, F. Cui, Y. Fukumori, Short-term delayed-release microcapsules spray coated with acrylic terpolymers. International Journal of Pharmaceutics 2006, 307, p. 300-307, 2006.
[5] J.C. Strong, Psychrometric analysis of the Environmental Equivalency Factor for aqueous tablet coating. AAPS PharmSciTech 10 (1), p. 303-309, 2009.
[6] C. Rieck, T. Hoffmann, A. Bück, M. Peglow, E. Tsotsas, Influence of drying conditions on layer porosity in fluidized bed spray granulation. Powder Technol. 272, p. 120-131, 2015
[7] F. Sondej, A. Bück, K. Koslowsky, P. Bachmann, M. Jacob, E. Tsotsas, Investigation of coating layer morphology by micro-computed X-ray tomography, Powder Technol. 273, p. 165-175, 2015.
[8] F. Sondej, A. Bück, E. Tsotsas, Comparative analysis of coating thickness on single particles using X-ray micro-computed tomography and confocal laser-scanning microscopy, Powder Technol. 287, p. 330-340, 2016.
[9] F. Depypere, P. van Oostveldt, J. Pieters and K. Dewettinck, Quantification of microparticle coating quality by confocal laser scanning microscopy (CLSM), European Journal of Pharmaceutics and Biopharmaceutics 73, No. 1 p. 179-186, 2009.
[10] C. Rieck, A. Bück, E. Tsotsas, Monte Carlo modeling of fluidized bed coating and layering processes, AIChE Journal, in review.