user-driven segmentation of design...
TRANSCRIPT

ICED17
ABSTRACT Design data must often be segmented to inform decision making during the design process, for tasks such as customer segmentation, design benchmarking, and market segmentation. Qualitative segmentation methods are accurate but not scalable due to being human-intensive, while quantitative segmentation methods are scalable but often inaccurate due to implicit mathematical assumptions. We propose an approach combining qualitative human intelligence and quantitative computational algorithms. Scalable clustering and dimensional reduction algorithms are abstracted on the back-end of this approach, while possible data segmentations are presented to the user through an visual interactive 2D interface. We conduct an experiment testing this approach on automobile exterior color preference segmentation. Our preliminary results show users find consistent data segmentations, suggesting this may be a promising approach for combining human intelligence with computational algorithms for design data segmentation.
1 INTRODUCTION
Design involves understanding users, designs, and the relationship between them (Norman, 2004; Pahl and Beitz, 2013), followed by using this understanding to make good design decisions (Chen et al., 2013; Hazelrigg, 1998; Krishnan and Ulrich, 2001; Papalambros and Wilde, 2000). Design decisions may be informed using design data, which often requires segmentation (Lenk et al., 1996; Liu and Dzyabura, 2016; Van Horn and Lewis, 2015). For example, a designer making a range of specialized products may want to segment market preferences to determine untapped markets and develop new products. The benefit of accurate design data segmentation is more targeted products and services, as well as more resource-conscious decisions regarding time and cost overruns for the enterprise developing the design. Common design tasks requiring design data segmentation include: (a) segmenting similar customers in the market to understand their distribution (Wedel and Kamakura, 2012); (b) segmenting similar products on the market to benchmark during new product or service development (Ahmed et al., 2016); and (c) segmenting similar user preferences for designs to understand the distribution of user needs (Burnap et al., 2016; Tuarob and Tucker, 2014). Figure 1 depicts these three common design tasks.
USER-DRIVEN SEGMENTATION OF DESIGN DATA
Alex Maynard Engineering Physics
University of Michigan Ann Arbor, MI 48109 [email protected]
Alexander Burnap Mechanical Engineering University of Michigan Ann Arbor, MI 48109 [email protected]
Panos Y. Papalambros Mechanical Engineering University of Michigan Ann Arbor, MI 48109
ICED17
Figure 1. Common design tasks that require design data segmentation.
Broadly speaking, there are two approaches to segmentation: qualitative and quantitative (Wedel and Kamakura, 2012). Qualitative segmentation is driven by the intuition and experience of design experts, whereas quantitative segmentation uses models and statistical analysis (Allenby and Rossi, 1998). Both quantitative and qualitative approaches have encountered their own challenges. Qualitative segmentation, while often able to capture a deep understanding of stakeholders through observed latent factors, is not scalable to thousands of market segments in global markets. Quantitative segmentation is scalable to global markets, but may not capture latent factors important for design data segmentation, and may make false mathematical assumptions for a given dataset. Specifically, for a given design dataset, a computer knows neither which segmentation model to use nor its associated tuning parameters. This problem is exacerbated as the amount of design data increases through globalization and the prevalence of smart technology (e.g. smart phones, wearables, Internet of Things (Van Horn and Lewis, 2015)). It follows that if we improve our ability to accurately segment design data, we can harness this increased data and improve the design process. Our research challenge is design data segmentation that combines the strengths of human intelligence through qualitative segmentation methods with the scalability and computation intelligence of quantitative models. To this end, we introduce a computational tool with an easy-to-use 2D interface for user-driven segmentation of design data. Segmentation algorithms are abstracted on the back end while the user applies intuition and reasoning on the interactive visual front end. We conduct an experiment to determine the effectiveness of this combined segmentation approach using a case study segmenting customers' color preferences for an automotive design. Our preliminary findings suggest that the tool enables users to determine consistent accurate design data segmentation.
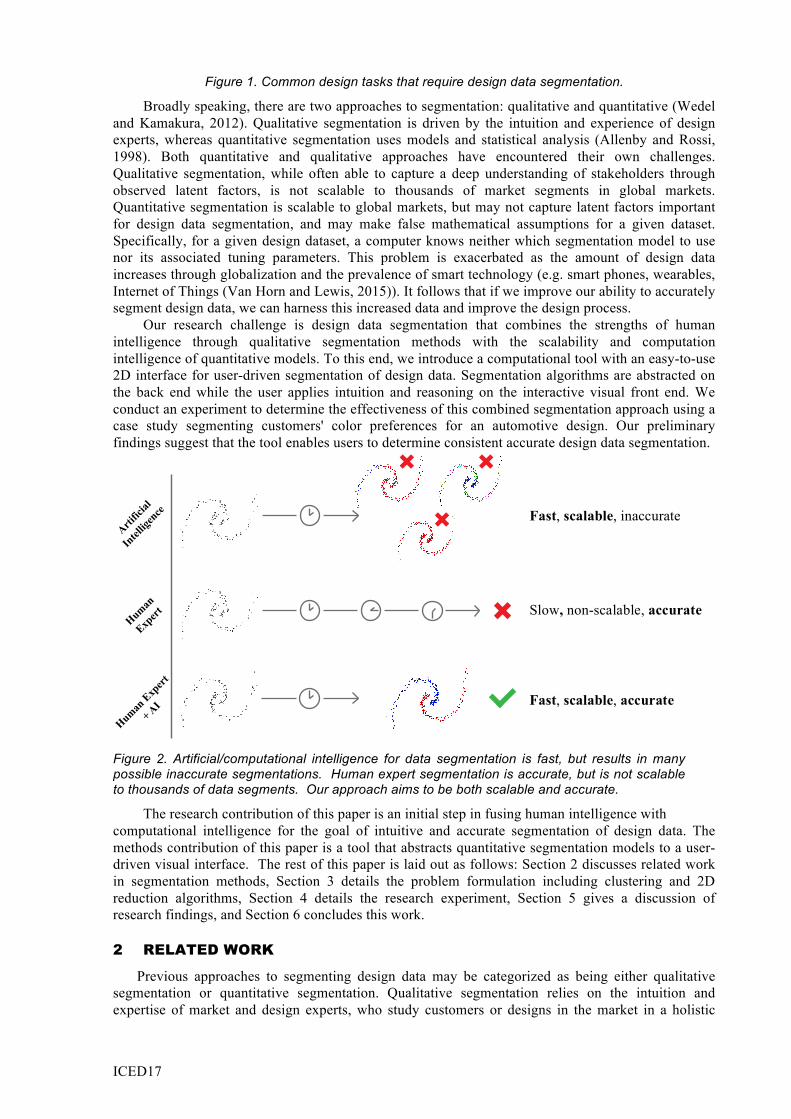
Figure 2. Artificial/computational intelligence for data segmentation is fast, but results in many possible inaccurate segmentations. Human expert segmentation is accurate, but is not scalable to thousands of data segments. Our approach aims to be both scalable and accurate.
The research contribution of this paper is an initial step in fusing human intelligence with computational intelligence for the goal of intuitive and accurate segmentation of design data. The methods contribution of this paper is a tool that abstracts quantitative segmentation models to a user-driven visual interface. The rest of this paper is laid out as follows: Section 2 discusses related work in segmentation methods, Section 3 details the problem formulation including clustering and 2D reduction algorithms, Section 4 details the research experiment, Section 5 gives a discussion of research findings, and Section 6 concludes this work.
2 RELATED WORK
Previous approaches to segmenting design data may be categorized as being either qualitative segmentation or quantitative segmentation. Qualitative segmentation relies on the intuition and expertise of market and design experts, who study customers or designs in the market in a holistic
Art
ific
ial
Inte
llig
ence
Hum
an
Exper
t
Hum
an E
xper
t
+ A
I
Fast, scalable, inaccurate
Slow, non-scalable, accurate
Fast, scalable, accurate

ICED17
manner not restricted by mathematical assumptions. Quantitative segmentation makes use of mathematical models and statistical analysis, using data that is collected from surveys about potential designs or historical data from previously preferred or purchased designs.
2.1 Qualitative Segmentation Design experts often rely on their intuition and experience to determine how a product should best be designed (Cross, 2004; Gonçalves et al., 2014; Hartley, 1996). However, a market with diverse or complex needs may challenge a designer’s ability to develop solutions that do not waste resources by overlapping between two segments while failing to fulfil the needs of others (Burnap et al., 2016). Design experts currently use methods such as focus groups and surveys to capture the market’s wants and needs (General Motors Brand Equity Research, 2014; Wedel and Kamakura, 2012). However, it becomes infeasible to lead focus groups between large, diverse communities with more than just a handful of segments, and surveys may not capture relevant or accurate information for segmentation.
2.2 Quantitative Segmentation Mathematical modelling is a valuable approach for quantitatively determining the segmentation of a dataset. These approaches typically use an algorithm to iterate over the elements of a dataset and determine which are “similar” and which are “dissimilar” based on some mathematical criterion (Wedel and Kamakura, 2012). This mathematical criterion depends on various tuning parameters associated with the algorithm. For example, an algorithm that identifies segments based on the proximity of datapoints may have a parameter that represents the minimum distance two points must be from each other to be considered similar and be put in the same segment. Quantitative segmentation models often lead to incorrect data segmentations if the chosen model or tuning parameters do not define a mathematical criterion appropriate for the design data. Furthermore, datasets and their quantitative segmentations become increasingly difficult to visualize in 2- and 3-dimensions as their own dimensionality increases. As shown in Figure 3, even a simple 3D construct becomes warped and difficult to interpret when we attempt to view it in 2D.
(a) (b) (c)
Figure 3. (a) n-dimensional initial design data (b) n-dimensional clustered design data (c) 2-dimensional reduced design data.
3 PROBLEM FORMULATION
We approach the research challenge of data segmentation by combining human expert intelligence with computational intelligence. Our tool aims to formulate an intuitive visual representation that users can segment design data with, while abstracting computational segmentation algorithms on the backend. This approach poses several challenges, including how datasets in more than three dimensions should be represented, what criteria should decide how a dataset is segmented, and once representation and criteria are chosen, what parameters should be input? The tool solves these problems using available algorithms and techniques. As shown in Figure 3(b) and 3(c), the tool uses two major algorithmic steps on the backend: (b) an n-dimensional clustering step in the original space of the design data, and (c) a 2-dimensional reduction step for data visualization. These steps are both developed in Python. A clustering algorithm will group “similar” data into the same cluster and “dissimilar” data into another based on a chosen mathematical criterion. A 2D reduction algorithm is then used to represent the clustering in 2-

ICED17
dimensional space so that the user can interact with it, while trying to retain as much of the data’s structure in the original n-dimensional space as possible. Users are provided with the 2D visualization through a front-end web-app programmed in JavaScript. This interface allows them to select the pair of algorithms used and parameters input. The colors of the visualization change in real-time to represent the new segmentation. This is what allows users to intuitively interpret segmentations that have been determined by the computational algorithms abstracted on the back-end. No one pair of clustering and reduction algorithms will work for every dataset. Therefore, our tool is designed to use many, and be adapted for other algorithms as needed. The tool applies these algorithms by making assumptions about what parameters might produce meaningful results, then tweaks them until the algorithm outputs become static. While the tool is designed to work for many clustering and 2D reduction algorithms, we demonstrate it using several off-the-shelf ones.
3.1 Clustering Algorithms Different clustering algorithms use different mathematical criterion to determine which datapoints are “similar” and which are “dissimilar.” We give an example of the mathematical criterion of two clustering algorithms in Figure 4. No one algorithm can be used to determine the true clustering of any given dataset, so a variety exists with various advantages and disadvantages. For example, the K-Means algorithm is fast, but typically only works for hyperspherical data, whereas the Affinity Propagation algorithm can segment datasets of arbitrary shape, but is slow and more difficult to use. The algorithms we implemented were are K-Means, Mean Shift, Affinity Propagation, and DBSCAN.
Initialization Step 1 Step 2 Iteration
Figure 4. Example of two clustering algorithms with different mathematical criterion for design data segmentation: (a) treats points similar to a system of coupled springs; (b) makes comparisons based on data density. These opposing mathematical assumptions result in different segmentations.
3.2 2D Dimensionality Reduction Algorithms Reduction algorithms attempt to collapse an n-dimensional dataset (n-D) to two dimensions (2D) while retaining as much information about the original data as possible. Different algorithms have different mathematical criteria representing what they consider valuable information. However, information will in general always be lost regardless of the criteria. The 2D reduction algorithms we implemented were t-SNE, Isomap, MDS, Spectral Embedding, and Locally Linear Embedding.
4 EXPERIMENT
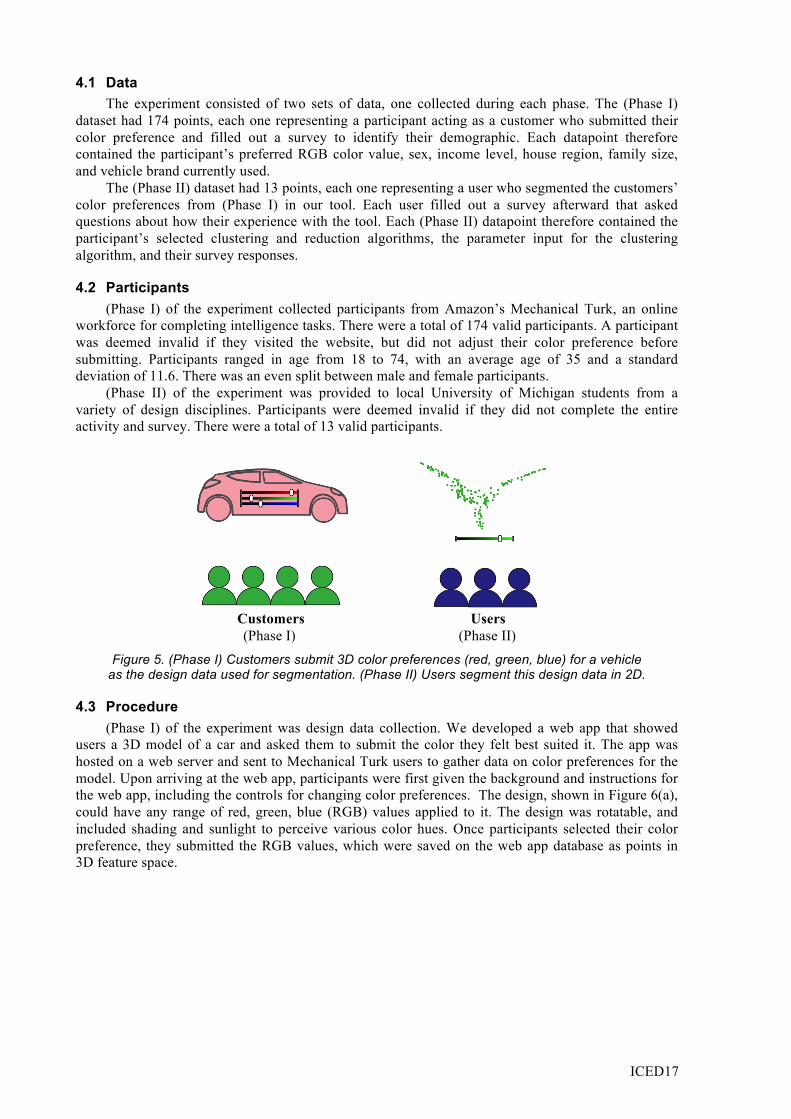
An experiment was conducted to test how well our tool combined human intelligence with computational algorithms for design data segmentation. The experiment had two phases as shown in Figure 5: In (Phase I) we created a web app that allowed participants to submit their preferences of color for a 3D model of a car. In (Phase II) we took the preference data collected in (Phase I) and gave it to users to segment using our tool.
(a) (b)
ICED17
4.1 Data The experiment consisted of two sets of data, one collected during each phase. The (Phase I) dataset had 174 points, each one representing a participant acting as a customer who submitted their color preference and filled out a survey to identify their demographic. Each datapoint therefore contained the participant’s preferred RGB color value, sex, income level, house region, family size, and vehicle brand currently used. The (Phase II) dataset had 13 points, each one representing a user who segmented the customers’ color preferences from (Phase I) in our tool. Each user filled out a survey afterward that asked questions about how their experience with the tool. Each (Phase II) datapoint therefore contained the participant’s selected clustering and reduction algorithms, the parameter input for the clustering algorithm, and their survey responses.
4.2 Participants (Phase I) of the experiment collected participants from Amazon’s Mechanical Turk, an online workforce for completing intelligence tasks. There were a total of 174 valid participants. A participant was deemed invalid if they visited the website, but did not adjust their color preference before submitting. Participants ranged in age from 18 to 74, with an average age of 35 and a standard deviation of 11.6. There was an even split between male and female participants. (Phase II) of the experiment was provided to local University of Michigan students from a variety of design disciplines. Participants were deemed invalid if they did not complete the entire activity and survey. There were a total of 13 valid participants.
Customers Users (Phase I) (Phase II)
Figure 5. (Phase I) Customers submit 3D color preferences (red, green, blue) for a vehicle as the design data used for segmentation. (Phase II) Users segment this design data in 2D.
4.3 Procedure (Phase I) of the experiment was design data collection. We developed a web app that showed users a 3D model of a car and asked them to submit the color they felt best suited it. The app was hosted on a web server and sent to Mechanical Turk users to gather data on color preferences for the model. Upon arriving at the web app, participants were first given the background and instructions for the web app, including the controls for changing color preferences. The design, shown in Figure 6(a), could have any range of red, green, blue (RGB) values applied to it. The design was rotatable, and included shading and sunlight to perceive various color hues. Once participants selected their color preference, they submitted the RGB values, which were saved on the web app database as points in 3D feature space.

ICED17
(a) (b)
Figure 6. (a) (Phase I) color preference interface and (b) (Phase II) segmentation interface.
(Phase II) of the experiment was user-driven data segmentation. We uploaded the color preference data collected in (Phase I) into the tool, as shown in Figure 6(b). The tool was then loaded onto a web application server. We asked participants to use the tool to cluster the preference data. Similar to (Phase I), participants first encountered an instruction page describing the data segmentation task, before they were directed to the tool interface. Once participants had interacted with the tool and chosen what they considered the “best” design data segmentation, they submitted their clustering and 2D reduction algorithm choices as well as associated clustering parameter choices. Upon this submission, participants were redirected to a survey asking questions regarding: (1) Difficulty – “On a scale of 1-5, how difficult was the tool to use?”, (2) Comfort – “Approximately how long was it before you were comfortable using the tool?”, (3) Understanding –“On a scale of 1-5, how well do you feel you understand the tool?”, and (4) Success – “On a scale of 1-5, how successful were you in finding the clusters you wanted?”
4.4 Data Analysis We perform data analysis to answer two questions. First, how consistently did users segment the color preference data using the tool? For this question, we define a metric of data segmentation consistency that accounts for the segment membership of each design datum. Formally, for 𝑁 data, we define a 𝑁𝑥𝑁 segment binary membership matrix, with 1 indicating two data are in the same segment and 0 indicating they are in different segments as defined by the user.
𝐴 ! =𝑎!!(!) ⋯ 𝑎!!
(!)
⋮ ⋱ ⋮𝑎!!(!) ⋯ 𝑎!!
(!), 𝑎!" =
1 𝑖𝑓 𝑎!" 𝑎𝑛𝑑 𝑎!" 𝑎𝑟𝑒 𝑖𝑛 𝑠𝑎𝑚𝑒 𝑠𝑒𝑔𝑚𝑒𝑛𝑡 𝑓𝑜𝑟 𝑢𝑠𝑒𝑟 𝑢0 𝑒𝑙𝑠𝑒
(1)
We then define a metric of similarity between two users' (u=1 and u=2) segmentations according to, 𝜇!"# =
!!!!!
[1 − abs(𝑎!"(!)!
!,!!!,!!! − 𝑎!"! )] (2)
Equations (1) and (2) offer a method of determining how consistently users segmented the design data agnostic of the clustering and 2D reduction algorithms used, as well as the associated parameters of theses algorithms. Moreover, this metric assumes the "true" segmentation belongs to the definition given by the user, as we do not a priori set this segmentation. Second, we asked users how well they felt about using the tool itself, particularly its intuitiveness and performance. To answer the second question, we take the average and standard deviation of their survey responses for each respective question. Each survey response was in the integer range 1-5.
5 RESULTS AND DISCUSSION
Our results provide promising evidence that the tool is effective for design data segmentation. Despite a small (Phase II) sample size, surveyed users generally agreed on how the data should be segmented, and did not find it difficult to determine these segments. Preliminary Result 1: Users generally agreed on segmentations

ICED17
Users agreed on how the color preference data should be segmented. The two most popular clustering algorithms were K-Means and Affinity Propagation. Users' choice of segmentation parameters showed a small spread relative to the range of parameters. More importantly, the segmentations resulting from these parameter selections were near-identical. After applying Equations (1) and (2) to the two most popular segmentations we found that 𝜇!"# = 94%. In other words, the two most popular segmentation algorithms and associated parameters resulted in 94% of data being clustered into the same segments. Moreover, these data segmentations were consistent between users. We found that 92% of users selected these most popular design segmentation algorithms and associated parameters, suggesting that users are capable obtaining a consistent design data segmentation. With more users, this work would benefit from filtering on user expertise (Burnap et al., 2016). Preliminary Result 2: Users generally successfully found segmentations Users successfully found the segmentations they wanted. Figure 7(c) shows their responses to the survey question “how successful were you in finding the clusters you wanted?” The average response was a 3.46 out of five; three representing “neutral” and four representing “somewhat successful.” The standard deviation was 0.75. This indicates that our 13 users achieved the segments they were looking for. Preliminary Result 3: Users generally did not find the tool difficult to use Users did not find the tool difficult. Figure 7(a) shows their responses to the survey question “how difficult was the tool to use?” The average response was 2.77 out of 5; two representing “easy” and three representing “neutral.” The standard deviation was 0.97. This indicates that, on average, users found the tool reasonably easy to use.
Figure 7. Users’ (a) difficulty using the tool; (b) time to become comfortable using the tool; (c) understanding of the tool; (d) success in finding the clusters they wanted with the tool.
5.1 Limitations (Phase II) segmentation was potentially affected by outlier color preferences in (Phase I). Another limitation is that our tool currently only works for hard clustering algorithms (discrete segments), not soft ones (a distribution of segments). We have yet to introduce a way to represent the results of a soft algorithm. (Phase II) had low participant samples, as well as non-expert designers. This limits the demographics and disciplines represented in our results. Additionally, we only collected 13 datapoints for (Phase II) of the experiment. Concrete conclusions cannot be made using such a small dataset, but they indicate promising future work were we to expand the sample size.
(a) (c)
(b) (d)

ICED17
5.2 Future Work There are a number of potential avenues for future work. In terms of developing the tool itself, much work into the user interface is required to enhance its intuitiveness. This would be aided by open source adoption of this software amongst the design research community, as well as collaboration with industrial partners. Further control on setting appropriate ranges for each clustering parameter are also necessary, as users reported issues with clustering parameter granularity. A number of application areas in design may benefit from this work; in general, anytime design data involves heterogeneous segments. Recent work in innovation data analysis of patent repositories (Yan and Luo, 2016) and design ideas (Tuarob and Tucker, 2014) may find innovation niches from various data segments. Segmenting customers themselves for design and manufacturing has applications when the customer population has multiple segments, for example body size for anthropomorphic accommodation (de Vries and Parkinson, 2014). Opportunities exist in the next generation of education assessment tools, in clustering students according to learning styles or to assess reasons why particular concepts are challenging (Koller, 2015; Kulkarni et al., 2015; Merah et al., 2010). Segmenting preferences may benefit from human-aided segmentation using recent sophisticated design preference and choice models (Burnap et al., 2016; Liu and Dzyabura, 2016; Morrow et al., 2014), particularly to overcome theoretical issues stemming from aggregation of this preference data (MacDonald et al., 2009; McComb et al., 2015). Lastly, the tool belongs to a more general emerging area of combining human intelligence with computational intelligence for design research, with opportunities for synergy including interactive preference elicitation (Ren and Papalambros, 2012; Yannou et al., 2008), gaming (Arlitt et al., 2014; Ren et al., 2016), and virtual reality (Lesniak et al., 2016; Pepley et al., 2016; Tovares et al., 2013).
6 CONCLUSION
Design data segmentation is a common task during the design process, and is necessary when segmenting similar customers in the market, similar products on the market, and user preferences for designs. Current approaches to segmentation encounter challenges during design segmentation; on one hand qualitative segmentation methods (e.g., focus groups) are not scalable, while on the other hand quantitative methods (e.g., statistical analysis) often make mathematical assumptions that may not accurately represent the true segmentation of the data. We proposed an approach to combine the strengths of human intelligence with the scalability of computational algorithms using a computational tool with an easy-to-use 2D interface for user-driven segmentation of design data. Our tool is designed such that market experts can use the speed and scalability of quantitative segmentation while retaining the intuition and human expertise that makes qualitative segmentation accurate. We conducted a two-phase experiment to determine the effectiveness of the tool. In (Phase I) of the experiment we collected design preferences data for exterior color choices for a vehicle design. In (Phase II) of the experiment we asked a different set of participants to use the tool to segment the color preferences from (Phase I). Our results show that users agreed on the segmentation of the preference data, and did not find it difficult to achieve the segmentation they wanted. While this work is preliminary, these results are promising for future work combining human intelligence and computational intelligence for design data segmentation.
7 ACKNOWLEDGEMENTS
This research was partially supported by the National Science Foundation Grant Number CMMI 1266184 and by General Motors Corporation. This support is gratefully acknowledged. We also thank Bailey McMillian for assisting in experiment development and distribution.
8 REFERENCES Ahmed, F., Fuge, M. and Gorbunov, L.D. (2016), “Discovering Diverse, High Quality Design Ideas From a
Large Corpus”, ASME 2016 International Design Engineering Technical Conferences and Computers and Information in Engineering Conference, American Society of Mechanical Engineers, p. V007T06A008–V007T06A008.

ICED17
Allenby, G.M. and Rossi, P.E. (1998), “Marketing models of consumer heterogeneity”, Journal of Econometrics, Vol. 89 No. 1, pp. 57–78.
Arlitt, R., Berthelsdorf, F., Immel, S. and Stone, R. (2014), “Using human computation to assist biologically inspired design: Evaluating a Game-With-A-Purpose”, ASME 2014 International Design Engineering Technical Conferences and Computers and Information in Engineering Conference, American Society of Mechanical Engineers, p. V007T07A015–V007T07A015.
Burnap, A., Pan, Y., Liu, Y., Ren, Y., Lee, H., Gonzalez, R. and Papalambros, P.Y. (2016), “Improving Design Preference Prediction Accuracy Using Feature Learning”, Journal of Mechanical Design, Vol. 138 No. 7, p. 71404.
Burnap, A., Ren, Y., Gerth, R., Papazoglou, G., Gonzalez, R. and Papalambros, P.Y., 2015. When crowdsourcing fails: A study of expertise on crowdsourced design evaluation. Journal of Mechanical Design, 137(3), p.031101.
Chen, W., Hoyle, C. and Wassenaar, H.J. (2013), Decision-Based Design, Springer London, London. Cross, N. (2004), “Expertise in design: an overview”, Design Studies, Vol. 25 No. 5, pp. 427–441. General Motors Brand Equity Research, Internal. (2014), , General Motors, Warren, MI. Gonçalves, M., Cardoso, C. and Badke-Schaub, P. (2014), “What inspires designers? Preferences on
inspirational approaches during idea generation”, Design Studies, Vol. 35 No. 1, pp. 29–53. Hartley, J. (1996), “Brands Through the Lens of Style”, presented at the Annual Meeting, Quest and Associates,
San Diego, California. Hazelrigg, G.A. (1998), “A framework for decision-based engineering design”, Journal of Mechanical Design,
Vol. 120 No. 4, pp. 653–658. Koller, D. (2015), “MOOCS: What Have We Learned?”, Proceedings of the 21th ACM SIGKDD International
Conference on Knowledge Discovery and Data Mining, ACM, pp. 3–3. Krishnan, V. and Ulrich, K.T. (2001), “Product development decisions: A review of the literature”, Management
Science, Vol. 47 No. 1, pp. 1–21. Kulkarni, C., Wei, K.P., Le, H., Chia, D., Papadopoulos, K., Cheng, J., Koller, D., et al. (2015), “Peer and self
assessment in massive online classes”, Design Thinking Research, Springer International Publishing, pp. 131–168.
Lenk, P.J., DeSarbo, W.S., Green, P.E. and Young, M.R. (1996), “Hierarchical Bayes Conjoint Analysis: Recovery of Partworth Heterogeneity from Reduced Experimental Designs”, Marketing Science, Vol. 15 No. 2, pp. 173–191.
Lesniak, K., Tucker, C.S., Bilen, S., Terpenny, J. and Anumba, C. (2016), “Networked, Real Time Translation of 3D Mesh Data to Immersive Virtual Reality Environments”, ASME 2016 International Design Engineering Technical Conferences and Computers and Information in Engineering Conference, American Society of Mechanical Engineers, p. V01BT02A053–V01BT02A053.
Liu, L. and Dzyabura, D. (2016), “Capturing Multi-taste Preferences: A Machine Learning Approach”. MacDonald, E.F., Gonzalez, R. and Papalambros, P.Y. (2009), “Preference Inconsistency in Multidisciplinary
Design Decision Making”, Journal of Mechanical Design, Vol. 131 No. 3, p. 31009. McComb, C., Goucher-Lambert, K. and Cagan, J. (2015), “Fairness and Manipulation: An Empirical Study of
Arrow’s Impossibility Theorem”, International Conference on Engineering Design, available. Merah, N., Yang, M.C., Wallace, D.R., Seering, W.P., Tang, V., Arif, A.F., Eleiche, A.-S., et al. (2010), “A
Global Collaborative Effort to Enhance Design in a Mechanical Engineering Curriculum in Saudi Arabia”, ASME 2010 International Design Engineering Technical Conferences and Computers and Information in Engineering Conference, American Society of Mechanical Engineers, pp. 747–752.
Morrow, W.R., Long, M. and MacDonald, E.F. (2014), “Market-System Design Optimization With Consider-Then-Choose Models”, Journal of Mechanical Design, Vol. 136 No. 3, p. 31003.
Norman, D.A. (2004), Emotional Design: Why We Love (or Hate) Everyday Things, Basic books, New York, NY.
Pahl, G. and Beitz, W. (2013), Engineering Design: A Systematic Approach, Springer Science & Business Media.
Papalambros, P.Y. and Wilde, D.J. (2000), Principles of Optimal Design: Modeling and Computation, Cambridge University Press.
Pepley, D., Yovanoff, M., Mirkin, K., Han, D., Miller, S. and Moore, J. (2016), “Design of a Virtual Reality Haptic Robotic Central Venous Catheterization Training Simulator”, ASME 2016 International Design Engineering Technical Conferences and Computers and Information in Engineering Conference, American Society of Mechanical Engineers, p. V05AT07A033–V05AT07A033.
Ren, Y., Bayrak, A.E. and Papalambros, P.Y. (2016), “ecoracer: Game-based optimal electric vehicle design and driver control using human players”, Journal of Mechanical Design, Vol. 138 No. 6, p. 61407.
Ren, Y. and Papalambros, P.Y. (2012), “On design preference elicitation with crowd implicit feedback”, ASME 2012 International Design Engineering Technical Conferences and Computers and Information in Engineering Conference, American Society of Mechanical Engineers, pp. 541–551.

ICED17
Tovares, N., Cagan, J. and Boatwright, P. (2013), “Capturing Consumer Preference Through Experiential Conjoint Analysis”, ASME 2013 IDETC, American Society of Mechanical Engineers, p. V005T06A005–V005T06A005.
Tuarob, S. and Tucker, C.S. (2014), “Discovering next generation product innovations by identifying lead user preferences expressed through large scale social media data”, ASME 2014 International Design Engineering Technical Conferences and Computers and Information in Engineering Conference, American Society of Mechanical Engineers, p. V01BT02A008–V01BT02A008.
Van Horn, D. and Lewis, K. (2015), “The use of analytics in the design of sociotechnical products”, Artificial Intelligence for Engineering Design, Analysis and Manufacturing, Vol. 29 No. 1, pp. 65–81.
de Vries, C. and Parkinson, M.B. (2014), “Limiting disproportionate disaccommodation in design for human variability”, Ergonomics, Vol. 57 No. 1, pp. 52–65.
Wedel, M. and Kamakura, W.A. (2012), Market Segmentation: Conceptual and Methodological Foundations, Vol. 8, Springer Science & Business Media.
Yan, B. and Luo, J. (2016), “Measuring technological distance for patent mapping”, Journal of the Association for Information Science and Technology.
Yannou, B., Dihlmann, M. and Awedikian, R. (2008), “Evolutive Design of Car Silhouettes”, ASME 2008 International Design Engineering Technical Conferences and Computers and Information in Engineering Conference, American Society of Mechanical Engineers, New York, NY, pp. 15–24.