user guide evaluation & development of regional
TRANSCRIPT

User Guide
Evaluation & Development of Regional
Infrastructure for Vehicle Electrification
Model (E-DRIVE)
Version 1.0 (released September 2021)

Overview & Contacts
2
Welcome to the Evaluation & Development of Regional Infrastructure for Vehicle Electrification Model (E-DRIVE). Developed by M.J. Bradley &
Associates (MJB&A) in collaboration with Georgetown Climate Center and Ceres, E-DRIVE is a dynamic analytical resource to support planning and
development of electric vehicle fast charging infrastructure throughout the United States. The Model provides a highly customizable interface to
support a diverse set of users and produce results that reflect a wide range of priorities across nearly all census tracts in the country.
E-DRIVE is a data-driven tool that considers a variety of metrics to determine high priority areas for fast charging development, such as:
• All publicly-available fast chargers in the U.S. (as of the most recent release date)
• Effectively all non-local roadways (interstates, highways, arterials, collectors, etc.) and corresponding vehicle-miles traveled (VMT)
• Over 2.8 trillion annual VMT (nearly 90% of national total annual VMT)
• Over one million commercial locations and other points of interest
The E-DRIVE Model is a screening tool that provides initial insight into areas that may be suitable for new fast charging infrastructure. Additional
analysis, planning, and consideration of local factors may also be necessary to identify individual locations that are best-suited for development.
This model does not account for economic factors, electric utility capacity availability, individual trip data, projected travel behavior, and other
elements that may impact development decisions.
This tool can be accessed on our website at: www.mjbradley.com/analytical-resources.
Please contact MJB&A (contact information below) if you have questions regarding the E-DRIVE Model, are interested in additional analytical
resources, or would like to collaborate on charging infrastructure development projects more specific to your needs.
Contacts:
Grace Van Horn
Principal Consultant
Luke Hellgren
Senior Consultant

Introduction
3
1. Dashboard Tabs
2. Continue to Directions 3. Contact Information
Use tabs to navigate across dashboards
Click to view summary instructions on how to define geographic scope, assign filters,
and apply metric weights
Contact information for additional questions or interest in future collaboration

Summary Directions and Navigation to Region Dashboards
4
1. Analysis
Parameters
2. Equity
Considerations
3. Metric Weighting 4. Results
Click on region to quickly navigate to specific E-DRIVE dashboard
• Tabs on top of dashboard can always be used for
navigation
All dashboards have four regions with customizable inputs and components
1. Analysis Parameters
• Geographic scope and plug type filters
2. Equity Considerations
• Designated Qualified Opportunity Zones (QOZ) and
EPA EJ Index Values
3. Metric Weighting
• Weighting score of each data metric
4. Results
• Census tract rankings of active scenario

E-DRIVE Dashboard: Overview
5
Analysis
Parameters
Equity
Considerations
Metric
Weighting
Results
DataResults Map
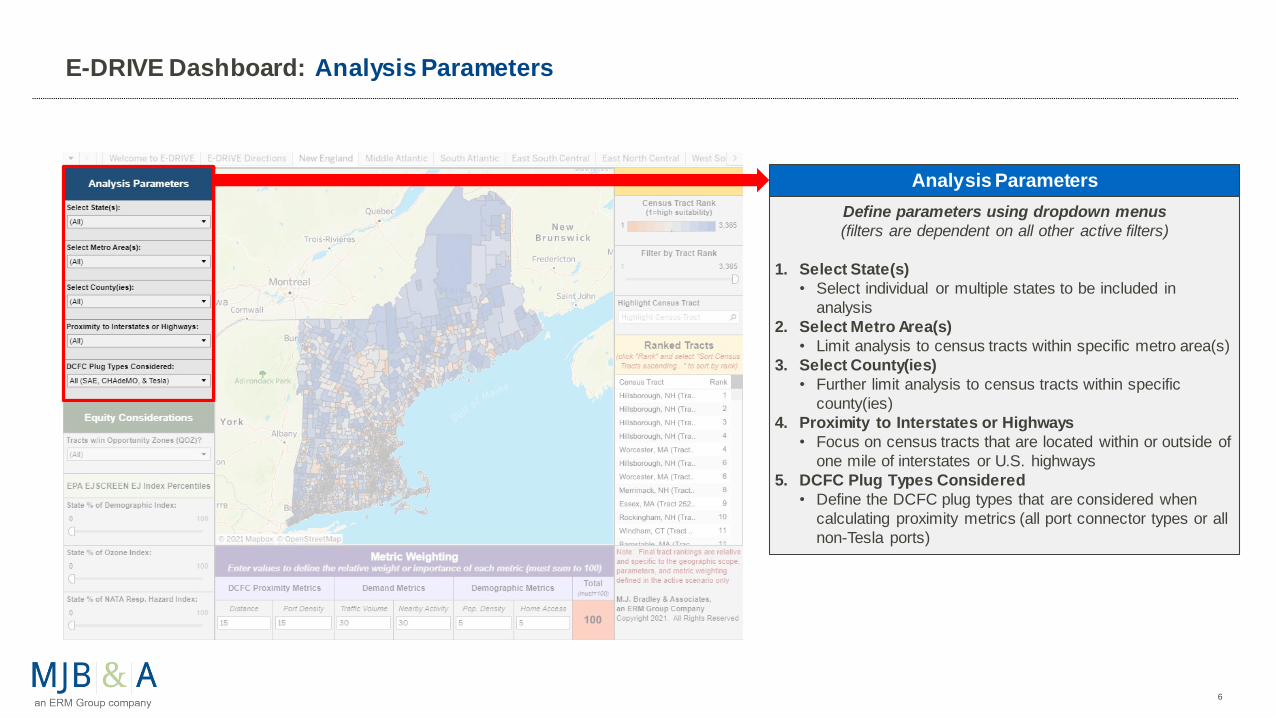
E-DRIVE Dashboard: Analysis Parameters
6
Analysis Parameters
Define parameters using dropdown menus
(filters are dependent on all other active filters)
1. Select State(s)
• Select individual or multiple states to be included in
analysis
2. Select Metro Area(s)
• Limit analysis to census tracts within specific metro area(s)
3. Select County(ies)
• Further limit analysis to census tracts within specific
county(ies)
4. Proximity to Interstates or Highways
• Focus on census tracts that are located within or outside of
one mile of interstates or U.S. highways
5. DCFC Plug Types Considered
• Define the DCFC plug types that are considered when
calculating proximity metrics (all port connector types or all
non-Tesla ports)

E-DRIVE Dashboard: Equity Considerations
7
Equity Considerations
Define with dropdown menu and sliders
(filters are dependent on all other active filters)
1. Tracts w/in Opportunity Zones (QOZ)?
• Determine whether analysis is limited to tracts within
designated Qualified Opportunity Zones (QOZ)*
EPA EJSCREEN** EJ Index Percentiles (slider filters)
2. State % of Demographic Index
• Analyze census tracts that contain a block group with a
Demographic EJ Index value that is above the defined
state percentile
3. State % of Ozone Index
• Analyze census tracts that contain a block group with an
Ozone EJ Index value that is above the defined state
percentile
4. State % of NATA Resp. Hazard Index
• Analyze census tracts that contain a block group with a
NATA Respiratory Hazard EJ Index value that is above the
defined state percentile
* A QOZ is an economically-distressed community where new investments may be eligible for preferential tax treatment (click link for more information)** U.S. EPA developed EJSCREEN to address public health and environmental responsibilities and combines environmental and demographic indicators (click link for more information)

E-DRIVE Dashboard: Metric Weighting
8
Metric Weighting
Weighting scores to define user priorities
(scores must sum to 100 to generate results)
1. DCFC Proximity Metrics
• Distance: Distance from existing DCFC stations to each
census tract
• Port Density: Concentration of nearby DCFC ports
2. Demand Metrics
• Traffic Volume: Vehicle-miles traveled (VMT) and
maximum roadway annual average daily traffic (AADT)
w/in and near each tract
• Nearby Activity: Concentration of nearby commercial
establishments and other points of interest
3. Demographic Metrics
• Population density: Population density of each tract
• Home Access: Estimated residential access to home
charging
Metric Weighting Considerations
E-DRIVE provides the flexibility to define the relative importance of metrics to produce an analysis more reflective of user-specific priorities. For instance, if the user wants to: 1) fill gaps within the existing DCFC network, more weight should be placed on the “DCFC Proximity Metrics;” 2) prioritize traveler use, mor weight could be placed on traffic volume and nearby activity; or 3) focus on local DCFC development, demographic metrics could be highlighted.
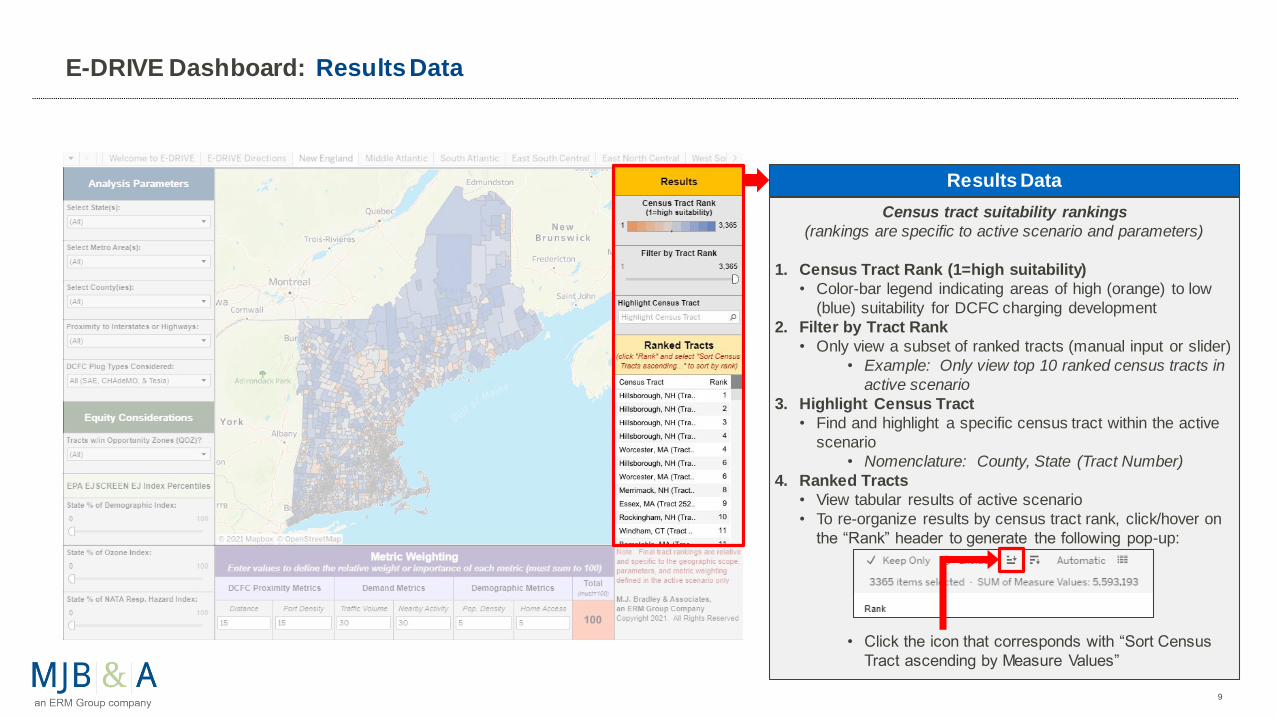
Census tract suitability rankings
(rankings are specific to active scenario and parameters)
1. Census Tract Rank (1=high suitability)
• Color-bar legend indicating areas of high (orange) to low
(blue) suitability for DCFC charging development
2. Filter by Tract Rank
• Only view a subset of ranked tracts (manual input or slider)
• Example: Only view top 10 ranked census tracts in
active scenario
3. Highlight Census Tract
• Find and highlight a specific census tract within the active
scenario
• Nomenclature: County, State (Tract Number)
4. Ranked Tracts
• View tabular results of active scenario
• To re-organize results by census tract rank, click/hover on
the “Rank” header to generate the following pop-up:
• Click the icon that corresponds with “Sort Census
Tract ascending by Measure Values”
E-DRIVE Dashboard: Results Data
9
Results Data

Dynamic map visualizing census tract suitability rankings
(rankings are specific to active scenario and parameters)
Census tracts are colored by suitability ranking of active
scenario
• Orange tracts correspond with top-ranked, high suitability
tracts; blue tracts are associated with tracts with lower
relative suitability rankings
Census tract pop-up information
• Hover over specific census tracts to generate a pop-up box
that provides detailed, tract-specific information:
E-DRIVE Dashboard: Results Map
10
Results Map
Tract ranking of active scenario
and tract identification information
Metric deciles (specific to active
scenario; 1=low, 10=high)
Maximum state percentile of U.S.
EPA EJSCREEN EJ Index values
of block group within tract
Example pop-up box:

For more information, visit w ww.mjbradley.com
11