user guide manual.pdf
DESCRIPTION
fiber watchTRANSCRIPT

MasterWatch User�s Manual 5-1
Chapter 5: Operator Tasks
Operator tasks are performed in the User Interface where you can view information; set alarm, surveillance, and status parameters; and test on demand.
The User Interface
Logging In1. Log into the User Interface.
� For Windows systems: Enter Windows Explorer, select the folder in which FiberWatch verson 3.1 is installed, and then double-click the file named �MasterWatch.bat�.
� For UNIX systems: Type the following command to access the FiberWatch User Interface:MasterWatch
The initial FiberWatch login window is displayed.
2. At the bottom of the FiberWatch login window, type your user name and press the tab key.3. Type your password. Notice that the characters are not displayed as you type them; asterisks are
substituted instead.4. Click OK or press the Enter key.
As you enter information into the FiberWatch windows, remember that FiberWatch is case sensitive. The system distinguishes between upper- and lower-case letters. For example, the word Robert is interpreted differently than the word robert.
Your PasswordThe system administrator assigns a temporary password when you are defined as a user of the FiberWatch system.
To change this password:
1. Follow the four steps outlined in �Logging In�, above.2. Select the User Information tab.3. Click the Change Password button. The Change Password dialog appears4. Enter the new password in both the Password and the Confirm Password fields.
NotePasswords must have at least three characters and cannot exceed 12 characters.
5. Click OK. The Change Password dialog closes.6. Select the desired tab, or click the Logout button, to continue.
Accessing FeaturesAccess to features in any interface is based on the user level assigned by the system administrator. When you enter your login password, the abilities allowed the user with that password are checked by the server and the interface is altered accordingly. Abilities for each level are listed in �Before You Begin � User Accounts� on page 6-1.
This chapter explains the features of the User Interface. Basic usage such as using the mouse, navigating the interface, and using the map tools are defined in Chapter 4, �Understanding the Basics�.

Chapter 5: Operator Tasks
5-2 MasterWatch User�s Manual
Logging OutTo log out:
� Click the Logout button in the lower right corner of the window.
Assessing Network Status1. Select the System tab at the top of the window.2. Select a domain from the Domain List to display its Fiber Circuit Alarms, Surveillance Status, and
Equipment Status. See the following figure.
NoteDomain selection filters all views, showing only the information for the specified domain.
The Fiber Circuit Alarms area consists of the following:
Fiber Circuit Fiber circuit(s) in the selected domain with an active alarm

MasterWatch User�s Manual 5-3
Chapter 5: Operator Tasks
The Surveillance Status area consists of the following:
The Equipment Status area consists of the following:
3. Select the Job Status tab to display information about surveillance and test on demand jobs. For field descriptions, see �Assessing Job Status� on page 6-68.
4. Continue assessing the network with one of these topics:� �Investigating an Alarm� on page 5-4� �Setting up OTDR Surveillance� on page 5-18� �Assessing Equipment Status� on page 5-12� �Clearing Alarms� on page 5-10
Severity Alarms are rated on the degree of severity, starting with �Warning� for the lease severe, through �Critical� for the most severe:
Warning
Minor
Major
Critical
Unknown � Indicates an error condition in the software and its severity cannot be assessed.
Duration (in Hours) Total time of the alarms listed
Fiber Circuit Fiber circuit(s) in the selected domain with surveillance testing active
Status Active � indicates that a fiber circuit is under surveillance
Suspended � indicates that surveillance has been disabled by an alarm, an operator, or an out of service RTU
Canceled � indicates that surveillance has been canceled by either the operator or an alarm
RTU Name for the RTU
Service Status In Service � indicates the RTU is operating and communicating with the TSC and that surveillance jobs are active
Out of Service � indicates that the RTU is not in communication with the TSC and any active surveillance jobs are suspended

Chapter 5: Operator Tasks
5-4 MasterWatch User�s Manual
Investigating AlarmsWhen an alarm is detected, FiberWatch displays the Alarm Report window. The operator must acknowledge the alarm report, using the following procedure, before they can continue to use the system.
Figure 5-1: Alarm Report Window
Acknowledging an Alarm Report1. When the Alarm Report window appears, click the Select All button.2. Enter your user name in the User Name field.3. Enter your password in the Password field.4. Enter any comments, in the Comments field, if desired.5. Click the Acknowledge button.
The User Interface window appears for further investigation of the alarm.
Investigating an Alarm1. Select the Alarm Status tab at the top of the window.2. Select the desired domain from the Alarm Domain List.3. Select an alarm from the Alarm Table to display the details of that alarm.

MasterWatch User�s Manual 5-5
Chapter 5: Operator Tasks
The Alarm Table contains the following data:
Class The element that triggered the alarm:
Fiber CircuitEquipmentEquipment CommunicationsSystemDatabaseUnknown

Chapter 5: Operator Tasks
5-6 MasterWatch User�s Manual
4. Select the Trace Data tab (lower half of the screen), if not currently selected.5. Select Alarm Events from the drop-down box in the lower right corner of the screen. The Alarm
Trace Optical Events table appears.
Severity The importance of the alarm:
Warning � Indicates a problem in the system
Minor � See �Cause � Minor� on page 5-6 for a list of Minor alarm causes.
Major � See �Cause � Major� on page 5-6 for a list of Major alarm causes.
Critical � See �Cause � Critical� on page 5-6 for a list of Critical alarm causes.
Unknown � Indicates an error condition in the software and its severity cannot be assessed.
Primary Element The name of the element (RTU or fiber circuit) that caused the alarm
Date/Time The date and time when the alarm was sent to the test system controller (TSC)
Status The current status of the alarm:
Reported � An alarm that is active and has not yet been acknowledged
Acknowledged � An alarm that has been recognized
Cleared � An alarm that is removed because the problem has been resolved
Cause Probable cause of the problem:
Minor � Communication loss between RTU and TSCLaunch Level Deviation FaultInvalid Surveillance ConfigurationRTU Software FaultSystem Error
Major � Probe Synchronization FailedSurveillance Request Contained Bad ParameterPossible Macrobend DetectedTrace Deviation from Reference DetectedRTU Hardware FaultSystem Database Error
Critical � End Detect FaultEnd to End Loss Deviation FaultPossible Break DetectedServer Restart Required

MasterWatch User�s Manual 5-7
Chapter 5: Operator Tasks
The Alarm Trace Optical Events table contains the following columns:
6. Use the zoom (see page 4-13) and A/B cursor options (see page 4-14) to study the traces if desired.7. Select the Acknowledge tab to acknowledge the alarm. See �Acknowledging Alarms� on page 5-9.8. Select the Clear Alarm tab to clear the alarm. See �Clearing Alarms� on page 5-10.9. Select the Problem Responses tab to view a list of problem responses and their status.10. Select the Alarm Detail tab to view specific alarm information.
Event Type:
Launch � the start of the fiber to the end of the Launch where the OTDR is out of saturation.
Reflective � usually a mechanical connector
Non-reflective � usually a splice
Grouped � two or more reflective events that are so close together that it is not possible to distinguish the exact start and end of the individual events
End � the end of the fiber
Start Optical distance to the beginning of the event
End Optical distance to the end of the event
Loss Total loss in dB caused by the event
Reflectance Measurement of the reflectance of the event.
Loss Between Cumulative loss of the end of the previous event and the beginning of the current event.

Chapter 5: Operator Tasks
5-8 MasterWatch User�s Manual

MasterWatch User�s Manual 5-9
Chapter 5: Operator Tasks
11. Select the Fiber Circuit Status tab at the top of the window.
12. Use the A and B cursors to analyze the reference and alarm traces. Change the data displayed from the Alarm Trace, Reference Events trace, Current Events trace, and Trace Loss Values by using the drop-down menu.
13. Click the Integrated View tab to determine the location of the alarm. Use the map tools to determine the location of the alarm. Map tools are explained in �Using the Map� on page 4-7.
14. When the cause of the alarm is resolved, clear the alarm. See �Clearing Alarms� on page 5-10.15. Collect trace data. See �Collecting an OTDR Trace� on page 5-11. Examine the trace using the zoom
and A/B cursor options. Is this the trace to use as a reference?
Yes - Click the Set as Reference button. Surveillance resumes automatically.
No - Collect another trace to use as a reference if necessary.
Acknowledging Alarms1. Be sure the Alarm Status tab at the top of the window is selected.2. Select the Acknowledge Alarm tab.

Chapter 5: Operator Tasks
5-10 MasterWatch User�s Manual
3. Type the appropriate information in the entry fields:� User Name� Password� Comments
4. Click the Acknowledge button. Alarm status is changed to �Acknowledged�.
Clearing Alarms1. Be sure the Alarm Status tab at the top of the window is selected.2. Select the Clear Alarm tab.
3. Type the appropriate information in the entry fields:� User Name� Password� Comments
4. Click the Clear button. Alarm status is changed to �Cleared�. Surveillance jobs suspended by the alarm are resumed. To check status, select the Job Status tab at the top of the window.

MasterWatch User�s Manual 5-11
Chapter 5: Operator Tasks
Collecting an OTDR Trace1. Be sure the Fiber Circuit Status tab at the top of the window is selected and a fiber circuit in the list
is highlighted.
2. Select Wizards from the drop-down menu on the bottom right of the window.3. Click the Collect Trace button.4. Select the OTDR Parameters to be used for the trace then click Next.5. Select the OTDR Analysis Parameters, then Next.6. Verify the OTDR Trace Collection Summary information. If any information is incorrect, use the
Back button to make changes.7. If the collected trace is to be used as a reference trace, click the Set As Reference button.8. Click Collect.

Chapter 5: Operator Tasks
5-12 MasterWatch User�s Manual
Assessing Equipment Status1. In the User Interface, select the RTU Status tab at the top of the window.2. Select a domain and click the key beside it to display the domain�s contents.
RTU information is displayed for the selected domain.
3. Select an RTU to see status information.
4. Review information in each RTU Status tab shown in Figure 5-2 through Figure 5-4.

MasterWatch User�s Manual 5-13
Chapter 5: Operator Tasks
Figure 5-2: RTU Status � RTU Information Tab
NoteThe details presented on the RTU Information tab are entered by the system administrator via the Domain Elements tab in the Admin Interface.
Figure 5-3: RTU Status � Module Data Tab
NoteThe details presented on the Module Data tab will vary with the selection make in the Module drop-down list. The information presented is entered by the system administrator via the Domain Elements tab in the Admin Interface.The following details the information provided when OTDR is selected from the Module drop-down menu.
Chapter 5: Operator Tasks
5-14 MasterWatch User�s Manual
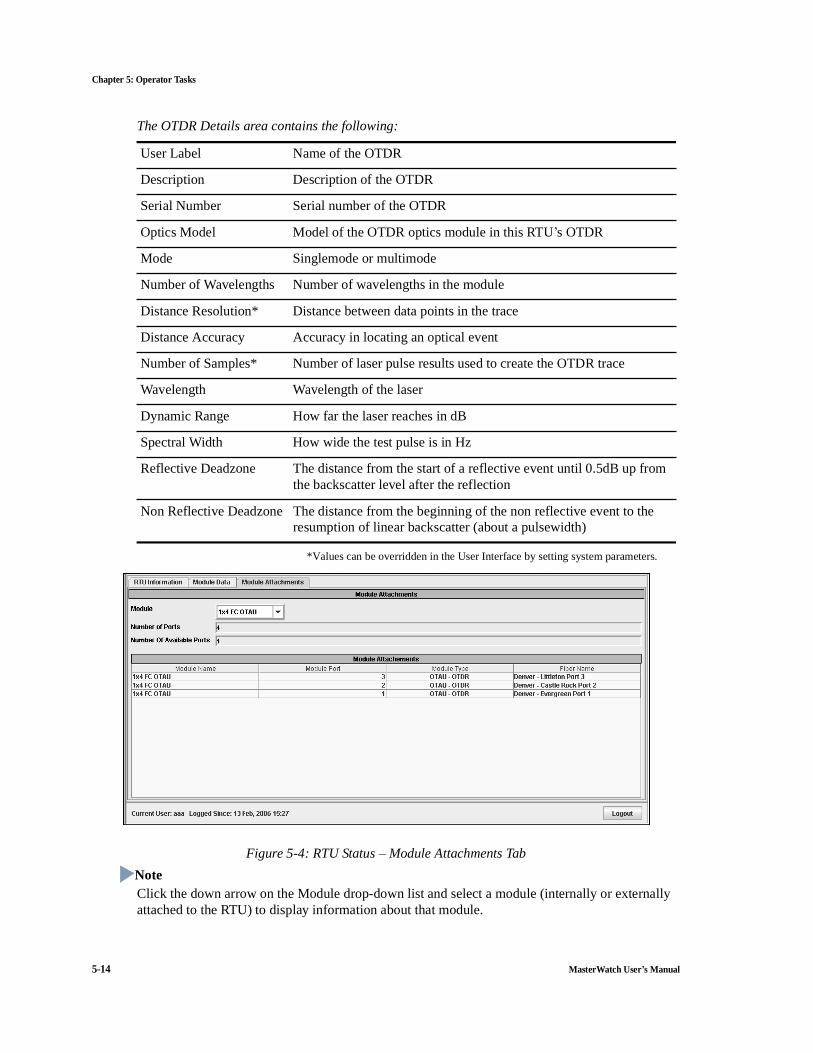
The OTDR Details area contains the following:
*Values can be overridden in the User Interface by setting system parameters.
Figure 5-4: RTU Status � Module Attachments TabNoteClick the down arrow on the Module drop-down list and select a module (internally or externally attached to the RTU) to display information about that module.
User Label Name of the OTDR
Description Description of the OTDR
Serial Number Serial number of the OTDR
Optics Model Model of the OTDR optics module in this RTU�s OTDR
Mode Singlemode or multimode
Number of Wavelengths Number of wavelengths in the module
Distance Resolution* Distance between data points in the trace
Distance Accuracy Accuracy in locating an optical event
Number of Samples* Number of laser pulse results used to create the OTDR trace
Wavelength Wavelength of the laser
Dynamic Range How far the laser reaches in dB
Spectral Width How wide the test pulse is in Hz
Reflective Deadzone The distance from the start of a reflective event until 0.5dB up from the backscatter level after the reflection
Non Reflective Deadzone The distance from the beginning of the non reflective event to the resumption of linear backscatter (about a pulsewidth)

MasterWatch User�s Manual 5-15
Chapter 5: Operator Tasks
The Module Attachment area contains the following:
Assessing OTDR Fiber Circuit Status1. Select the Fiber Circuit Status tab at the top of the window.2. Select a domain and click the key beside it to display the domain�s contents.3. Select a fiber circuit to display its status and OTDR and Reference traces.
Module Lists attached OTAUs, and OTDRs
Number of Ports Number of ports on the selected module
Number of Available Ports Number of ports on the selected module that does not have test fiber circuits attached in the database
Module Name Name of the selected OTAU or OTDR
Module Port Port number of the selected module
Module Type Type of module used
Fiber Name Name of fiber circuit monitored by the selected module

Chapter 5: Operator Tasks
5-16 MasterWatch User�s Manual
Analyzing the OTDR Trace1. Select the Trace Data tab to see trace data for the trace selected in the list.2. Select Reference Events from the drop-down menu at the bottom right of the window. The
Reference Events data is displayed in black.
The Reference Trace Optical Events table contains the following columns:
Traces are displayed in different colors for easier comparison. Default colors are listed here.
3. Use the X/Y zoom options to closely examine the traces. See �Changing the Trace Display� on page 4-13.
4. Use the A/B cursors to see the difference between different segments on each trace.
Event Type:
Reflective � usually a mechanical connector
Non-reflective � usually a splice
Grouped � two or more reflective events that are so close together that it is not possible to distinguish the exact start and end of the individual events
Start Optical distance to the beginning of the event
End Optical distance to the end of the event
Loss Total loss in dB caused by the event
Reflectance Measurement of the reflectance of the event.
Loss Between Cumulative loss of the end of the previous event and the beginning of the current event.
Black Reference trace
Red Trace that caused the alarm
Blue Current trace

MasterWatch User�s Manual 5-17
Chapter 5: Operator Tasks
Analyzing OTDR Trace Loss1. Select the Fiber Circuit Status tab.2. Select Trace Loss from the drop-down menu at the bottom right of the window.
Trace loss values for the area between the A and B cursors are displayed.
3. If desired, change the Loss Modea. Click the down arrow in the Loss Mode field, a drop down list appears.b. Highlight and click the desired loss mode:
- Splice Loss- 2 Point Loss- 2 Point LSA Loss- dB per km Loss- dB per km Loss LSA- Optical Return Loss- 2 Point Attenuation Corrected
NoteThe LSA and Splice Loss cursors are adjustable. Use the mouse to select the cursor point and drag it to the desired location.
Collecting a Trace (OTDR)See �Collecting an OTDR Trace� on page 5-11.
You can check the status of your test on demand job by selecting the Job Status tab at the top of the window.

Chapter 5: Operator Tasks
5-18 MasterWatch User�s Manual
Setting up OTDR Surveillance
NoteBefore setting up OTDR surveillance, make sure that the previously collected on-demand trace is set as the reference trace.
1. From the Fiber Circuit Status tab, select the Wizard option from the drop-down menu at the bottom right of the window.
2. Click the Surveillance button.
3. Select either Trace Compare or End Detect and then click Next.� Trace Compare � compares the traces from the beginning to the end.� End Detect � compares the end reflection only. End Detect is used for very long fibers where
the end of the fiber is in the noise, but the end refection is visible.4. The OTDR Parameters appear. The only parameter that can be changed at the User Interface level
is Test Averages. Click the drop-down menu to change the Test Average setting, if desired, and then click Next to continue. The Surveillance Distance dialog appears.
5. Select Use Optical End and then click Next.or
Select Use Schematic End to use the beginning and ending distances from the schematic element setup, and then click Next.
6. Set the desired maximum deviation for the Major Alarm Threshold Parameters.7. Select Minor Alarm Enable, if desired, and set values for the maximum deviation parameters.

MasterWatch User�s Manual 5-19
Chapter 5: Operator Tasks
8. Click Next to continue. The OTDR Surveillance Summary appears. Review the summary to confirm the setting made.
Use the Back button to go back to any section requiring further change.
or
Click Enable to begin surveillance.
Job StatusOne of the main functions of FiberWatch is the configuration and tracking of job requests. All current test on demand and surveillance jobs for fiber circuits are shown on the Job Status tab.
The status of a job is reflected through two attributes; the current status and pending status. The current status reflects the known status of the job. The pending status reflects that status that the system is attempting to obtain for the job. See �Assessing Job Status� on page 6-68 for an explanation of the status.
Both administrators and operators can view jobs for their domains and alter the status of the job.
OTDR Expert ViewThe FiberWatch OTDR Expert View tab displays historical data from test on demand and auto routine jobs.
OTDR Expert View allow the display of up to ten fiber traces at a time to compare and analyze OTDR trace data. Each trace is displayed in a different color that can be overlaid or offset for viewing.
Using FiberWatch OTDR Expert View1. Select the OTDR Expert View tab.

Chapter 5: Operator Tasks
5-20 MasterWatch User�s Manual
2. In the Fiber Circuit List, select a domain and then select a fiber.3. If the Trace Selection pane (lower left section of the window) is not displayed, select Trace Selection
from the drop-down menu at the bottom of the pane.4. Click the down arrow in the Traces From drop-down menu and select a time frame for the trace data.
5. Choose the traces you want to compare from the Completed Traces list. Use the right arrow to move the selected trace(s) to the Traces To Plot list.

MasterWatch User�s Manual 5-21
Chapter 5: Operator Tasks
Traces are listed by date and time and display in different colors. Each color corresponds to a different trace date and time.
Change the trace view by selecting the Overlay or Offset options on the bottom of the pane.
6. Select the Primary Trace from the drop down menu. The Primary Trace will appear in black as a trace and on the bottom of the window.
7. Select Trace Loss from the drop-down menu at the bottom of the lower right pane, if not already selected. The Trace Loss information corresponds to the Primary Trace.

Chapter 5: Operator Tasks
5-22 MasterWatch User�s Manual
8. Click the down arrow in the Loss Mode field, the Loss Mode drop-down menu appears. Select the desired loss mode: - Splice Loss - 2 Point Loss- 2Point Loss LSA- dB per km Loss- dB per km Loss LSA- Optical Return Loss- 2 Point Attenuation Corrected
In addition, select A to B Reflectance if a reflectance measurement is desired.
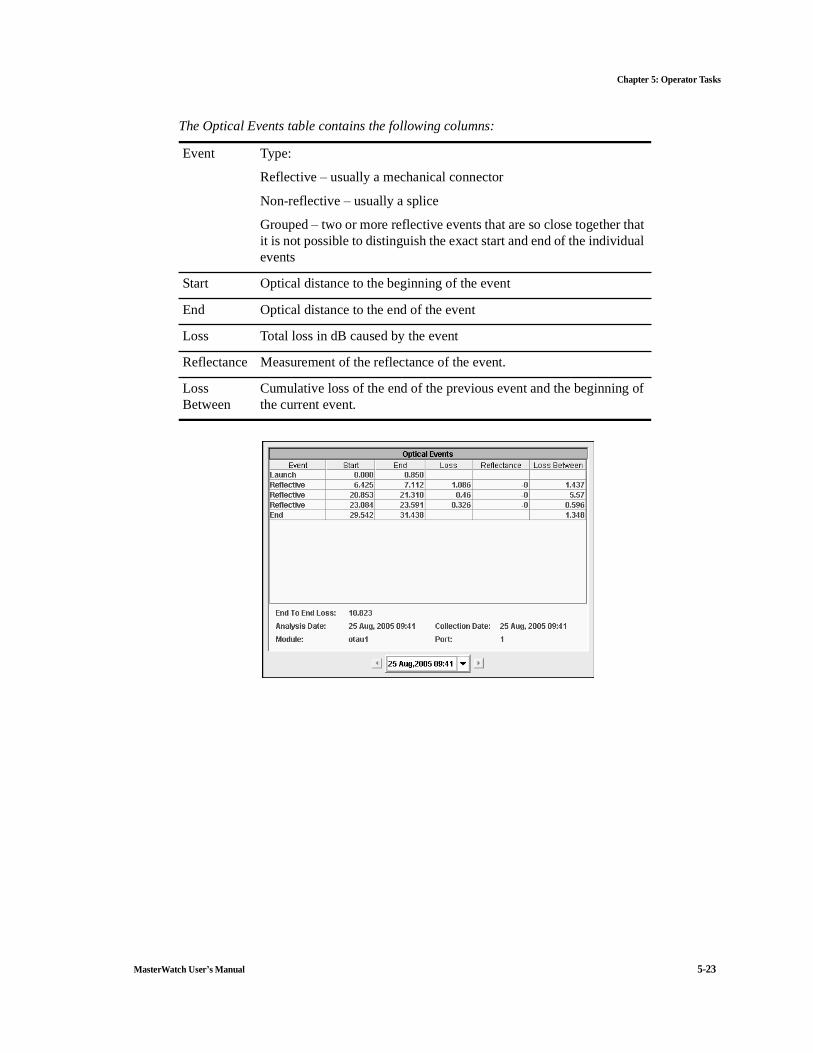
9. Optical events for a selected trace can be view in either of the lower panes of the OTDR Expert View tab.Select the desired trace from the drop-down menu at the bottom of the pane.
MasterWatch User�s Manual 5-23
Chapter 5: Operator Tasks
The Optical Events table contains the following columns:
Event Type:
Reflective � usually a mechanical connector
Non-reflective � usually a splice
Grouped � two or more reflective events that are so close together that it is not possible to distinguish the exact start and end of the individual events
Start Optical distance to the beginning of the event
End Optical distance to the end of the event
Loss Total loss in dB caused by the event
Reflectance Measurement of the reflectance of the event.
LossBetween
Cumulative loss of the end of the previous event and the beginning of the current event.

Chapter 5: Operator Tasks
5-24 MasterWatch User�s Manual
User InformationThe User Information tab provides access to the following:
� Basic User Information � Contact Information� User Domain� Roster� User Preferences
Basic User Information
The Basic User Information tab contains the following fields:
Name This is your username; the name you enter in the Username field on the FiberWatch Login window. See Figure 4-1 on page 4-2.
NoteThis is the only required field for Basic User information.
Full Name Full name of the user. This is an optional field.

MasterWatch User�s Manual 5-25
Chapter 5: Operator Tasks
You can also change your password at the Basic User Information tab. See �Your Password� on page 5-1 for details.
Click the Apply button to save any changes made on the Basic User Information tab, or click Cancel to close the tab without saving any changes.
Contact Information
Title The user�s title. This is an optional field.
Organization The user�s organization (place of work). This is an optional field.
General Access Level
This field is dimmed on the User Interface, as the General Access Level is set at the Administrator Interface.

Chapter 5: Operator Tasks
5-26 MasterWatch User�s Manual
NoteAll fields on the Contact Information tab are optional
The Contact Information tab contains the following fields:.
Click the Apply button to save any changes made on the Contact Information tab, or click Cancel to close the tab without saving any changes.
Office Phone User�s office phone number
Fax User�s office fax number
Home Phone User�s home phone number
Mobile User�s mobile phone number
Pager If entered and enabled (use the drop-down box to the right of the Pager filed), the alarm communications software uses the user�s pager to notify the operator of an alarm.
Pager PIN Personal identification number (PIN) for the operator�s pager.
E-Mail Page If entered and enabled (uses the same drop-down box as the E-Mail field to enable/disable) the alarm communications software sends a text message to the user�s cell phone, notifying the operator of an alarm.
E-Mail If entered and enabled (use the drop-down box to the right of the E-mail filed), the alarm communications software sends an e-mail to notify the user of an alarm.
Test button & drop-down list
Select the desired setting from the drop-down list:
� Test E-mail� Test E-mail Pager� Test Pager
and then click the Test button to verify the selected notification method.

MasterWatch User�s Manual 5-27
Chapter 5: Operator Tasks
User Domain
The Domain Table on the User Domain tab presents a list of domains to which the user has access and the access privileges allowed to the user for the selected domain.
NoteAccess Privileges are established in the Administrator Interface and differ with the user�s General Access Level.

Chapter 5: Operator Tasks
5-28 MasterWatch User�s Manual
Roster
Rosters define the active time period for a user; i.e. �when� is the user responsible for acknowledging a problem, such as a break in the fiber. The Roster tab provides the user a means of reviewing which rosters they are assigned to and the time periods (timeslices) for which they are responsible.

MasterWatch User�s Manual 5-29
Chapter 5: Operator Tasks
User Preferences
The User Preferences tab contains the User Preferences Configuration area and the Select Distance Units area.
� Click the drop-down list in the User Preferences Configuration area and select the desired Default Domain.
� Select a distance unit type by clicking the option button for the desired unit in the Select Distance Unit area. Select from the following:
- kilometers (km)- meters (m)- miles (m)- feet (ft)- kilofeet (kft)
The selected unit will be used when viewing OTDR trace data.

Chapter 5: Operator Tasks
5-30 MasterWatch User�s Manual