user satisfaction from commercial web sites: the effect of design and use moshe zviran 1, chanan...
Post on 19-Dec-2015
216 views
TRANSCRIPT
User satisfaction from commercial web sites: The effect of design and use
Moshe Zviran1, Chanan Glezer2 and Itay Avni1
1 Faculty of Management, Leon Recanati School of Business Administration, Tel Aviv University, Tel Aviv 69978, Israel
2 Department of Information Systems Engineering, Ben-Gurion University of the Negev, Beer-Sheva 84105, Israel
Presentation at the Faculty of Management, Tel Aviv University, 2.2.2006

Outline
1. Introduction
2. Web success measures3. Research questions4. Research constructs: Usability, User-based Design,
Classification of Web sites5. Research model 6. Methodology7. Hypotheses testing8. Visualization of web site attributes9. Summary of empirical findings10. Discussion11. Limitations and Future Research
1. Introduction
• June 29, 2005 – Size of indexable Web 11.5B pages. Hidden web is estimated as 500B pages (clickz.com)
• March 9, 2005 - PCs in-use surpassed 820M in 2004. will top 1B in 2007 (www.c-i-a.com)
• September 3, 2004 - Worldwide Internet users will top 1 Billion in 2005 (www.c-i-a.com)
• December 12, 2003 - In 2007, some 880 million Internet access devices will be sold worldwide (cio.com)
There has been growing interest in identifying design principles and features that can enhance user satisfaction and loyalty to the Electronic Commerce (EC) Websites (Y. Lee and J. Kim, 2002)
A survey found that three of the five main concerns about IT are related to poor user satisfaction (Bensaou and M. Earl, 1998)
User satisfaction with EC applications has been found to be significantly associated with usability and design features unique to the Web, such as download delay, navigation, content, interactivity, and responsiveness (Palmer, 2002).
1. Introduction
Measuring IS success has received much attention in the IS literature (e.g. Beise 1988; Delone and McLean, 1992; Ein-Dor and Segev; Ives and. Olson, 1984).
These view user satisfaction in terms of system use and
acceptance as the practical measure of IS success.
User participation, involvement, and attitude have also been adopted as success measures (Barki and Hardwick, 1994)
For EC, however, there is no way of directly measuring the success of an application (Galletta and Lederer, 1989)
2. Web Success Measures
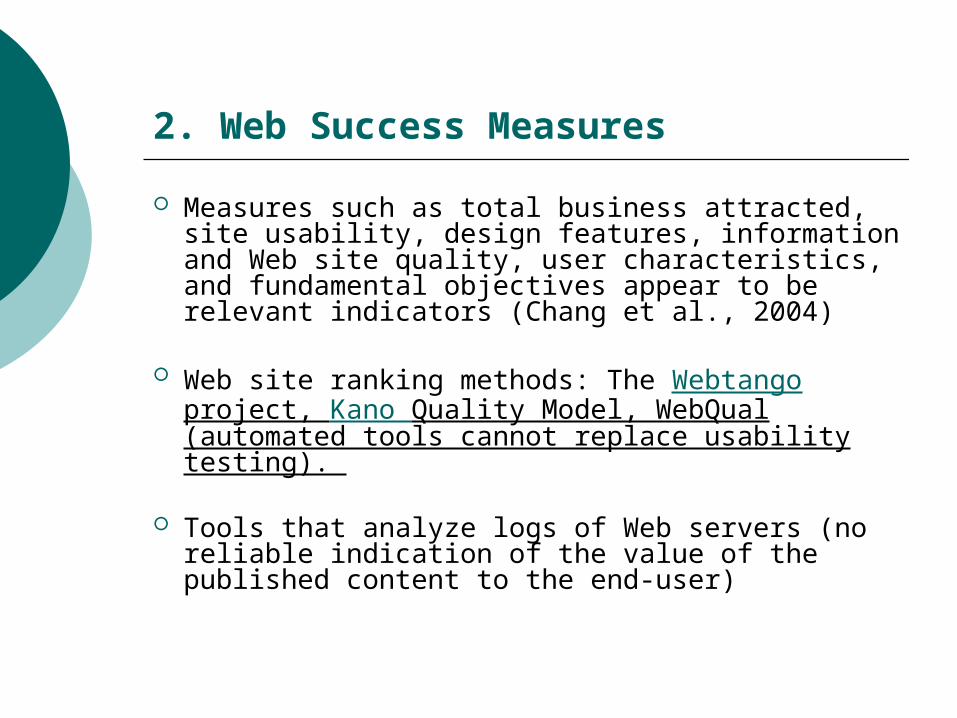
Measures such as total business attracted, site usability, design features, information and Web site quality, user characteristics, and fundamental objectives appear to be relevant indicators (Chang et al., 2004)
Web site ranking methods: The Webtango project, Kano Quality Model, WebQual (automated tools cannot replace usability testing).
Tools that analyze logs of Web servers (no reliable indication of the value of the published content to the end-user)
2. Web Success Measures

2. Web Success Measures -Meta-Study (Chang et. al. 2005)
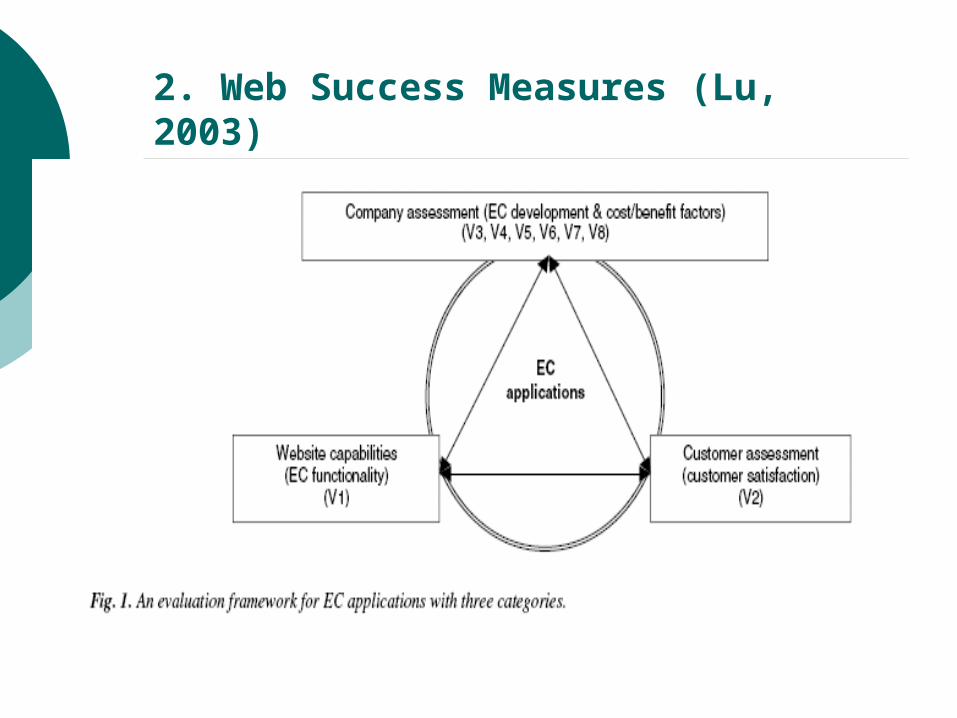
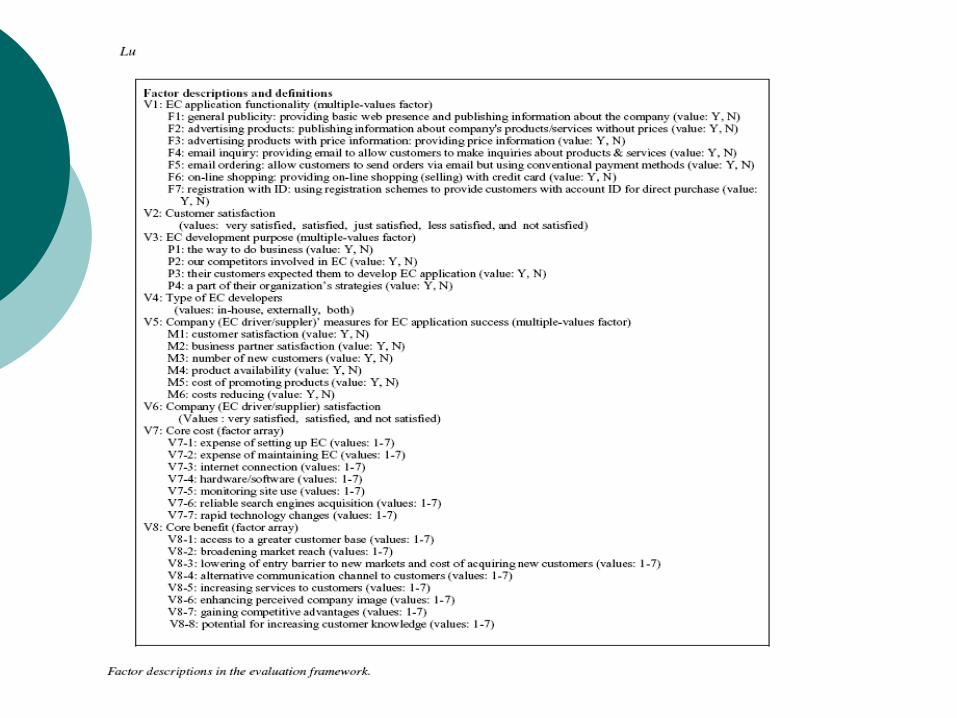
2. Web Success Measures (Lu, 2003)
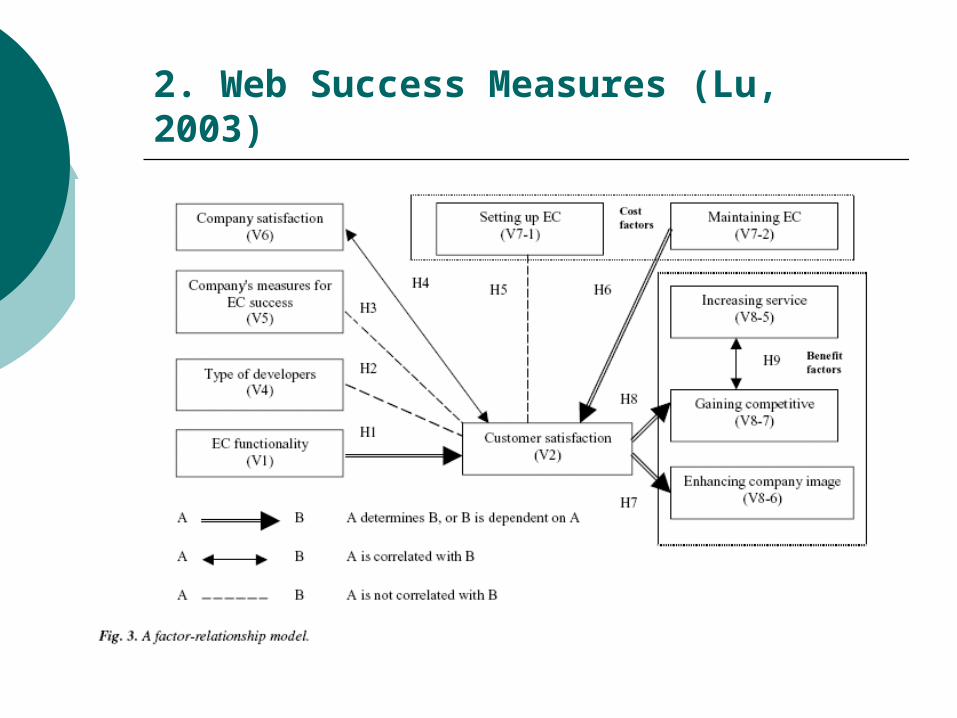
2. Web Success Measures (Lu, 2003)

3. Research Questions
What are the major factors that drive user satisfaction from Web sites?
Are there differences among different types of Web sites with regard to user satisfaction?
4. Research Constructs: Usability
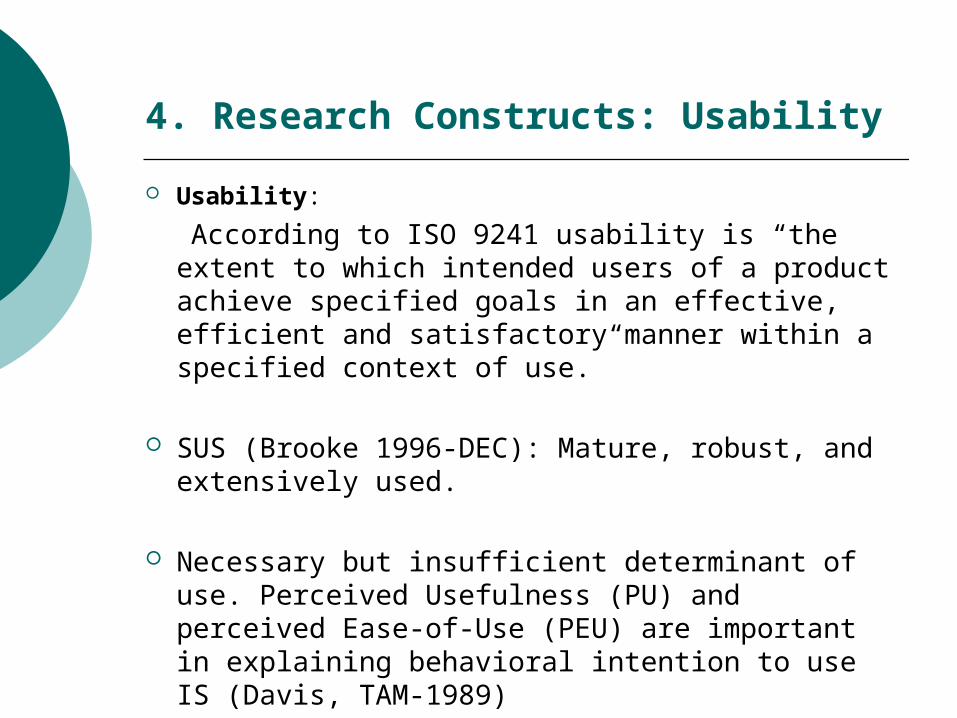
Usability:
According to ISO 9241 usability is “the extent to which intended users of a product achieve specified goals in an effective, efficient and satisfactory manner within a specified context of use.”
SUS (Brooke 1996-DEC): Mature, robust, and extensively used.
Necessary but insufficient determinant of use. Perceived Usefulness (PU) and perceived Ease-of-Use (PEU) are important in explaining behavioral intention to use IS (Davis, TAM-1989)

4. Research Constructs: Web site Classification
Classification of Web sites:
Hoffman (1995): online storefront, Internet presence, content, mall, incentive, and search agent
Cappel and Myerscough (1996): Marketplace awareness, customer support, sales, advertising, and electronic information services.
IBM (1999): publish/subscribe, online shopping, customer self-service, trading, and B2B
4. Research Constructs: User Centered Design
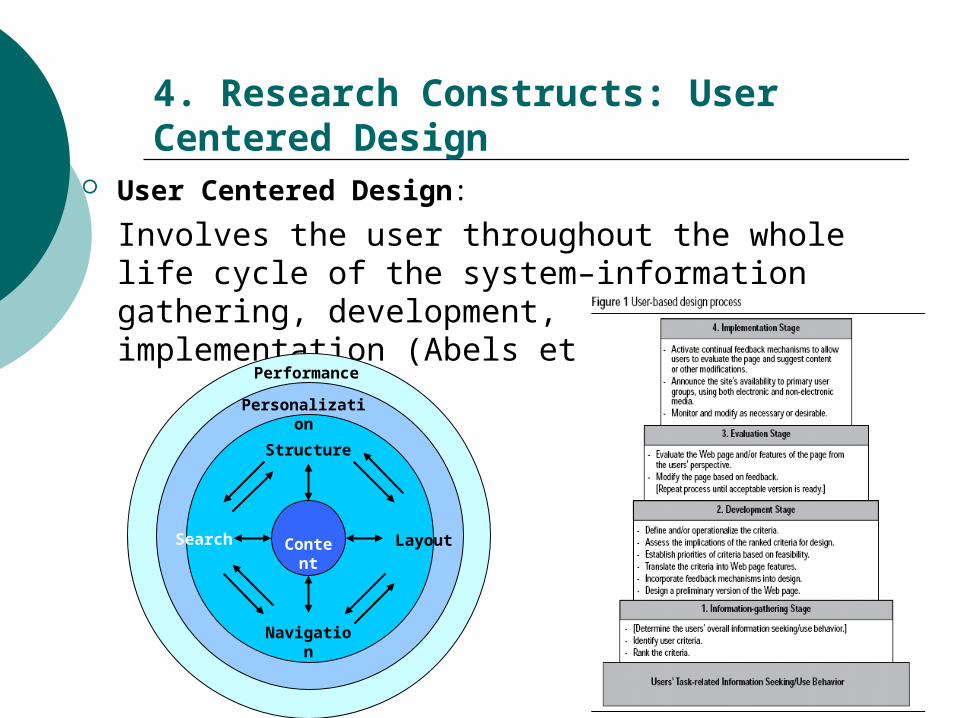
User Centered Design:
Involves the user throughout the whole life cycle of the system–information gathering, development, evaluation, and implementation (Abels et al. 1998)
Structure
LayoutSearch
Navigation
Content
Personalization
Performance
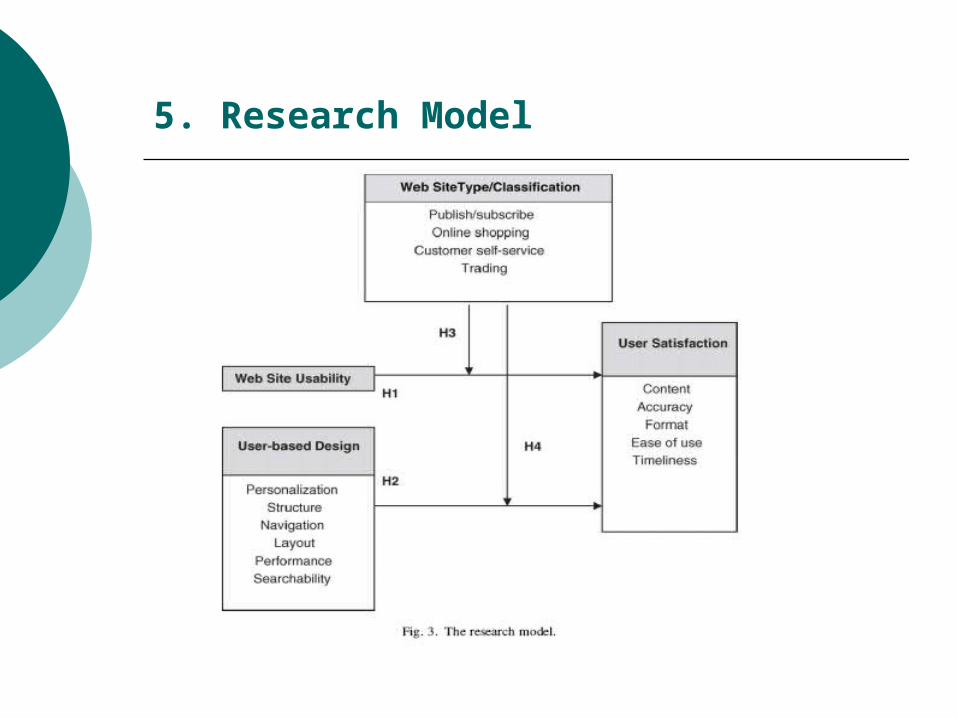
5. Research Model

חקר ספרות
הערות מומחיםשאלונים קיימים
גיבוש שאלון ראשוני, על סמך .שאלונים קיימים וחקר הספרות
לשאלון (Pilot) ביצוע קבוצת מבחן.המשולב
הערות מומחים
עיבוד תשובות קבוצת המבחן וניסוח .השאלון הסופי
בחינה סטטיסטית של משתני .השאלון ואישוש השערות המחקר
מיפוי תכונות האתרים לפי סוג אתר ולפי שם אתר בעזרת ניתוח שונות
.וניתוח גורמים
הצגת כלי למדידת שביעות רצון .מאתר אינטרנט
.איסוף תצפיות
6. Methodology

6. Methodology: Constructs, Items and Sources
6. Methodology: Instrument Refinement
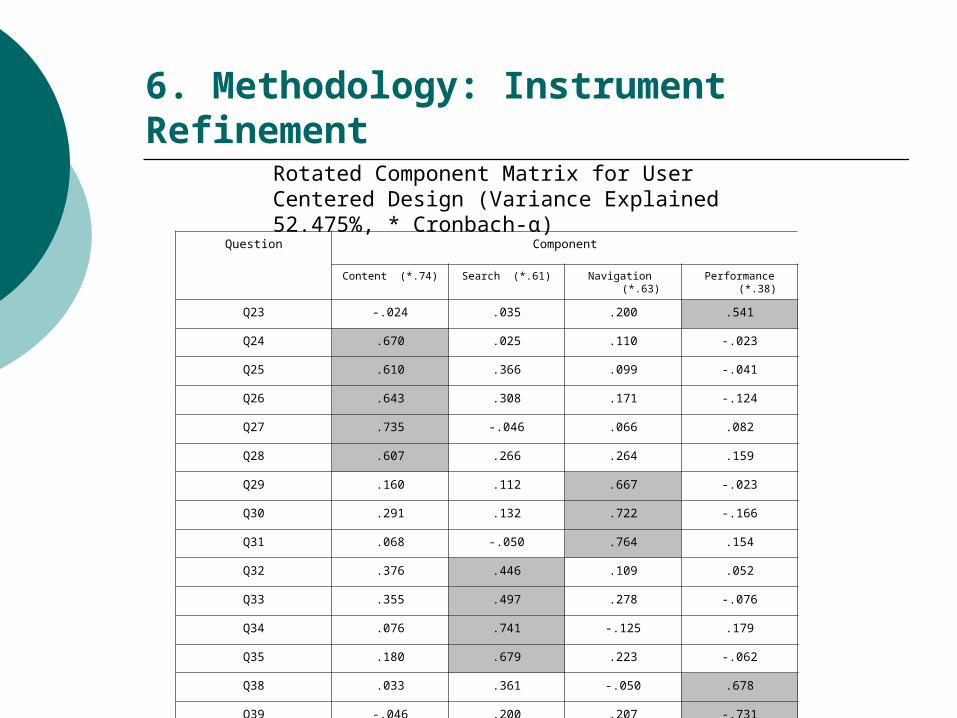
Question Component
Content (*.74) Search (*.61) Navigation (*.63) Performance (*.38)
Q23 -.024 .035 .200 .541
Q24 .670 .025 .110 -.023
Q25 .610 .366 .099 -.041
Q26 .643 .308 .171 -.124
Q27 .735 -.046 .066 .082
Q28 .607 .266 .264 .159
Q29 .160 .112 .667 -.023
Q30 .291 .132 .722 -.166
Q31 .068 -.050 .764 .154
Q32 .376 .446 .109 .052
Q33 .355 .497 .278 -.076
Q34 .076 .741 -.125 .179
Q35 .180 .679 .223 -.062
Q38 .033 .361 -.050 .678
Q39 -.046 .200 .207 -.731
Rotated Component Matrix for User Centered Design (Variance Explained 52.475%, * Cronbach-α)
6. Methodology: Instrument Refinement
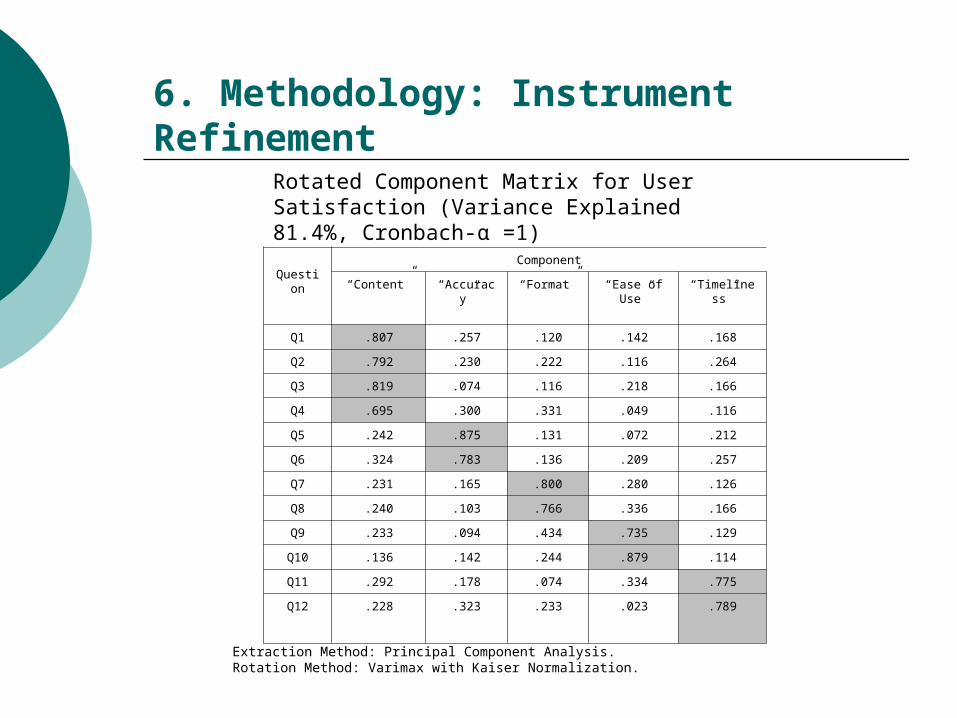
Rotated Component Matrix for User Satisfaction (Variance Explained 81.4%, Cronbach-α =1)
QuestionComponent
“Content” “Accuracy” “Format” “Ease of Use”
“Timeliness”
Q1 .807 .257 .120 .142 .168
Q2 .792 .230 .222 .116 .264
Q3 .819 .074 .116 .218 .166
Q4 .695 .300 .331 .049 .116
Q5 .242 .875 .131 .072 .212
Q6 .324 .783 .136 .209 .257
Q7 .231 .165 .800 .280 .126
Q8 .240 .103 .766 .336 .166
Q9 .233 .094 .434 .735 .129
Q10 .136 .142 .244 .879 .114
Q11 .292 .178 .074 .334 .775
Q12 .228 .323 .233 .023 .789
Extraction Method: Principal Component Analysis. Rotation Method: Varimax with Kaiser Normalization.

6. Methodology: Data Collection
Web based questionnaire for 20 Web sites.
Most of the 359 respondents were students at a major business school (58% men and 42% women)
47.4% of the respondents were undergraduates, 42.9% were graduate students and the rest were faculty members.
Most respondents (81%) were in the 20–30 age-group and seemed to have had significant exposure to the Web.

7. Hypotheses Testing
ANOVA at Site Level: H1 and H2 supported:
User_Satisfaction=0.218+0.368*(usability)+
0.485*(content)+ 0.139*(search); R2=58.6%
All independent variables contribute at α <.05
7. Hypotheses Testing
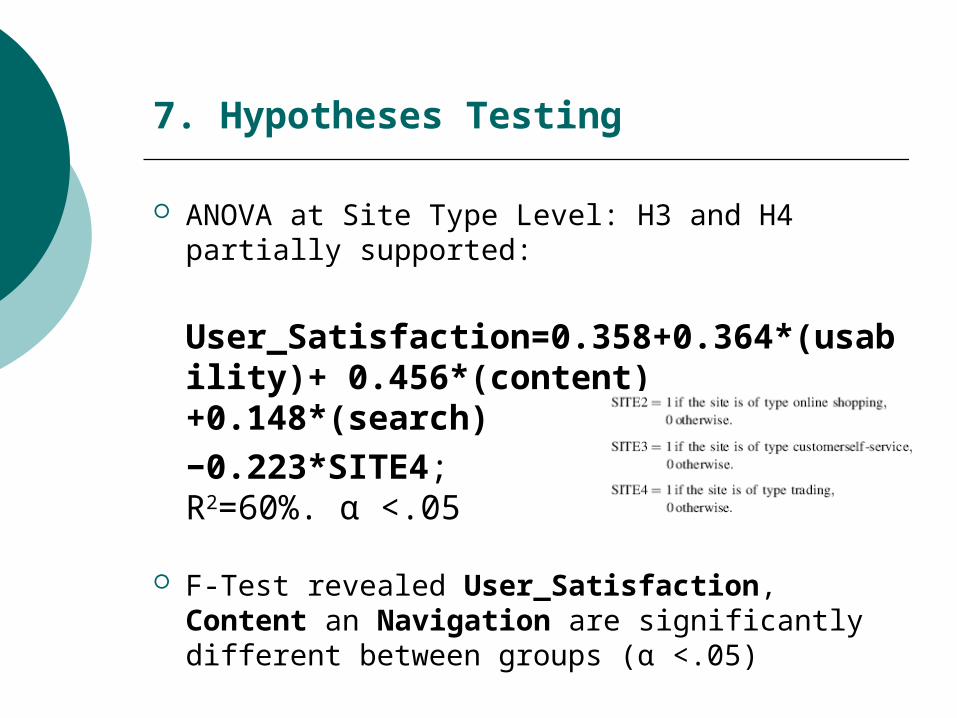
ANOVA at Site Type Level: H3 and H4 partially supported:
User_Satisfaction=0.358+0.364*(usability)+ 0.456*(content)+0.148*(search)
−0.223*SITE4; R2=60%. α <.05
F-Test revealed User_Satisfaction, Content an Navigation are significantly different between groups (α <.05)
8. Visualization of Web Site Attributes
Perceptual maps presented by multidimensional scaling (MDS) can be considered an alternative to Factor Analysis (FA).
With MDS one can analyze any kind of similarity or dissimilarity matrix.
In FA, similarities between objects (e.g., variables) are those expressed by correlation matrix among original variables
Both FA and MDS reduce the observed complexity of nature by explaining the observations in terms of fewer underlying dimensions
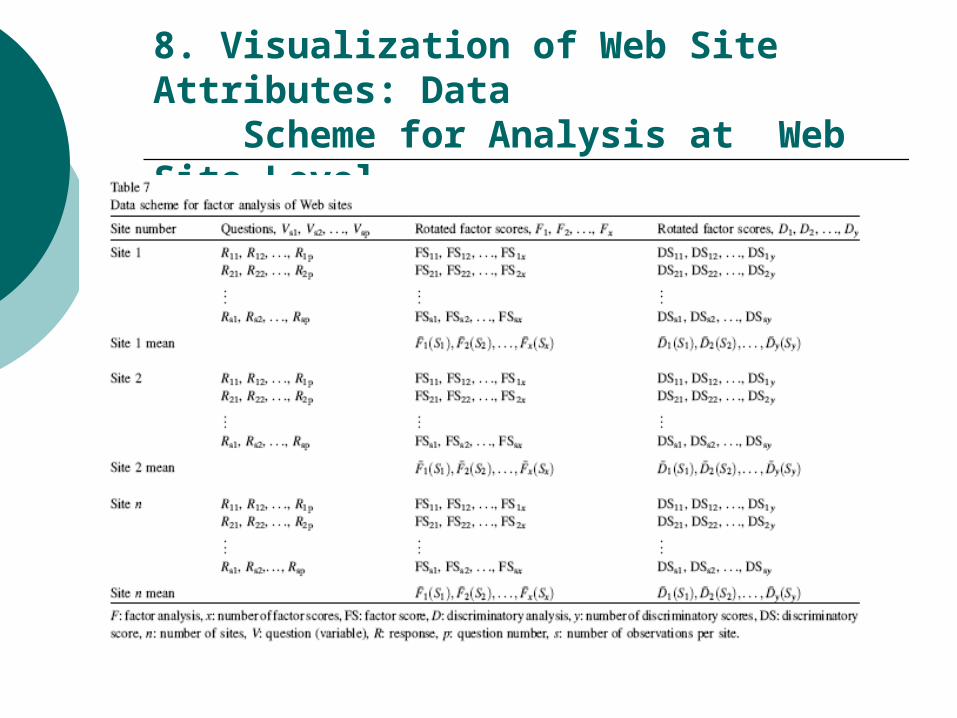
8. Visualization of Web Site Attributes: Data Scheme for Analysis at Web Site Level
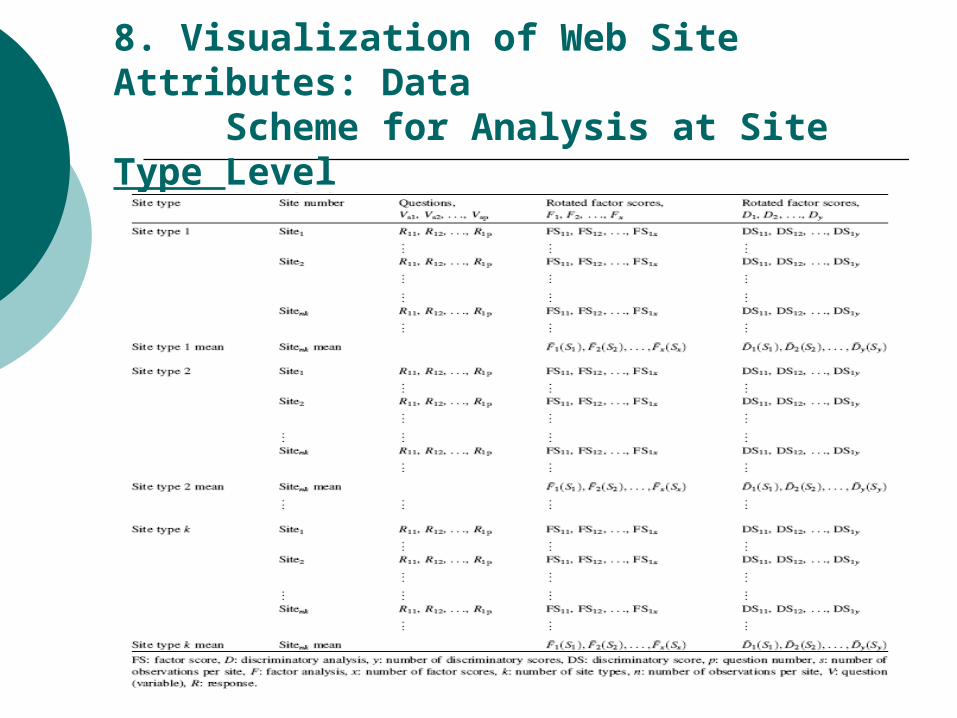
8. Visualization of Web Site Attributes: Data Scheme for Analysis at Site Type Level
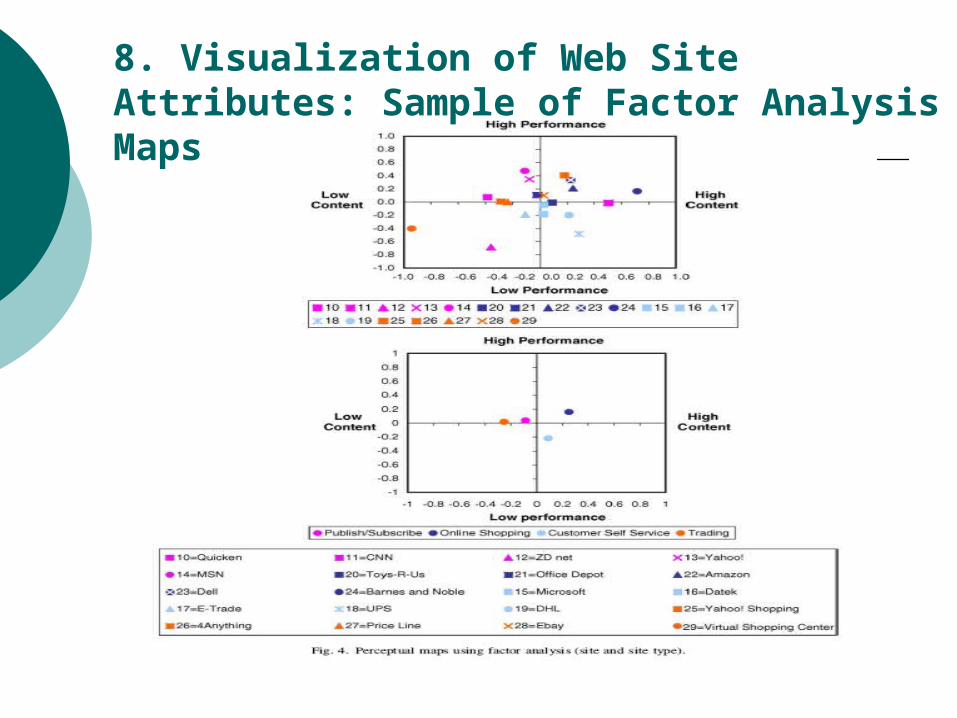
8. Visualization of Web Site Attributes: Sample of Factor Analysis Maps
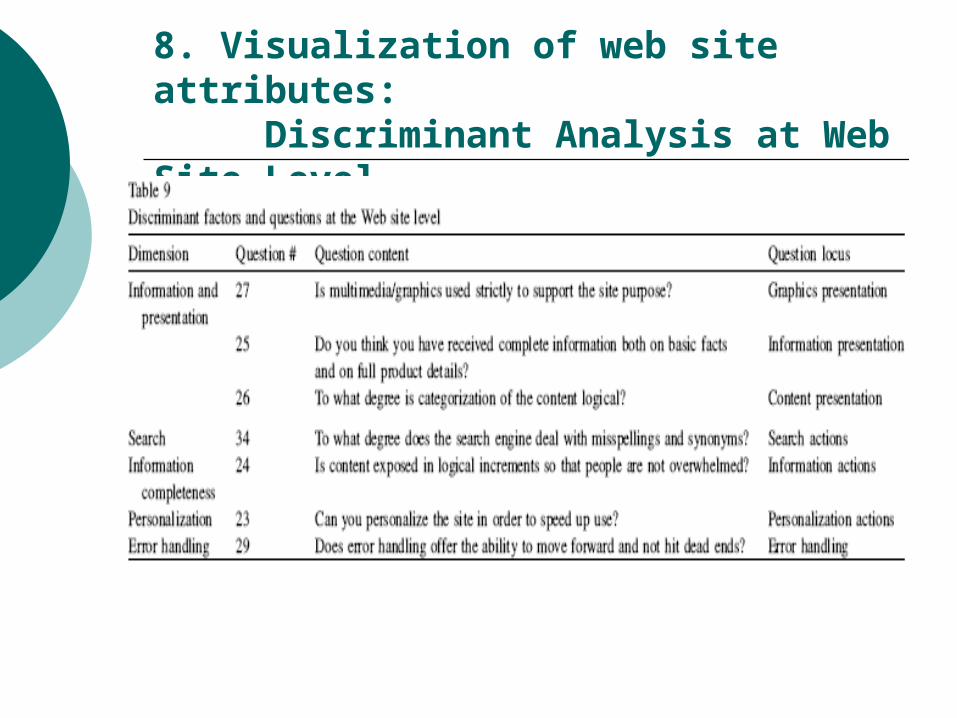
8. Visualization of web site attributes: Discriminant Analysis at Web Site Level

8. Visualization of web site attributes: Sample of Discriminant Analysis Maps at Web Site Level

8. Visualization of web site attributes: Discriminant Analysis at Web Site Type Level
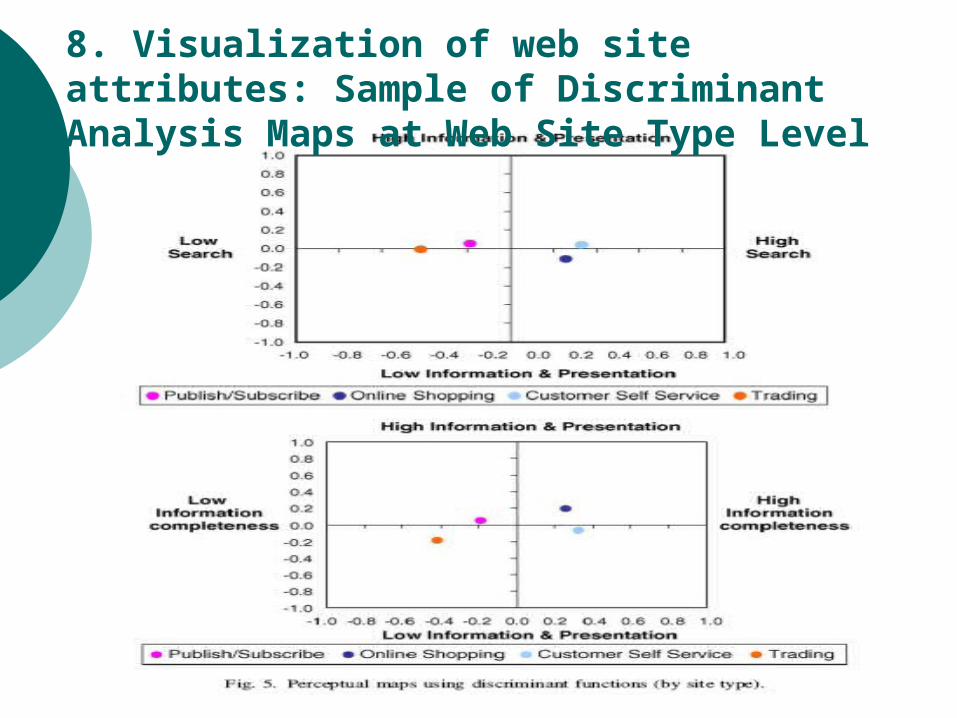
8. Visualization of web site attributes: Sample of Discriminant Analysis Maps at Web Site Type Level
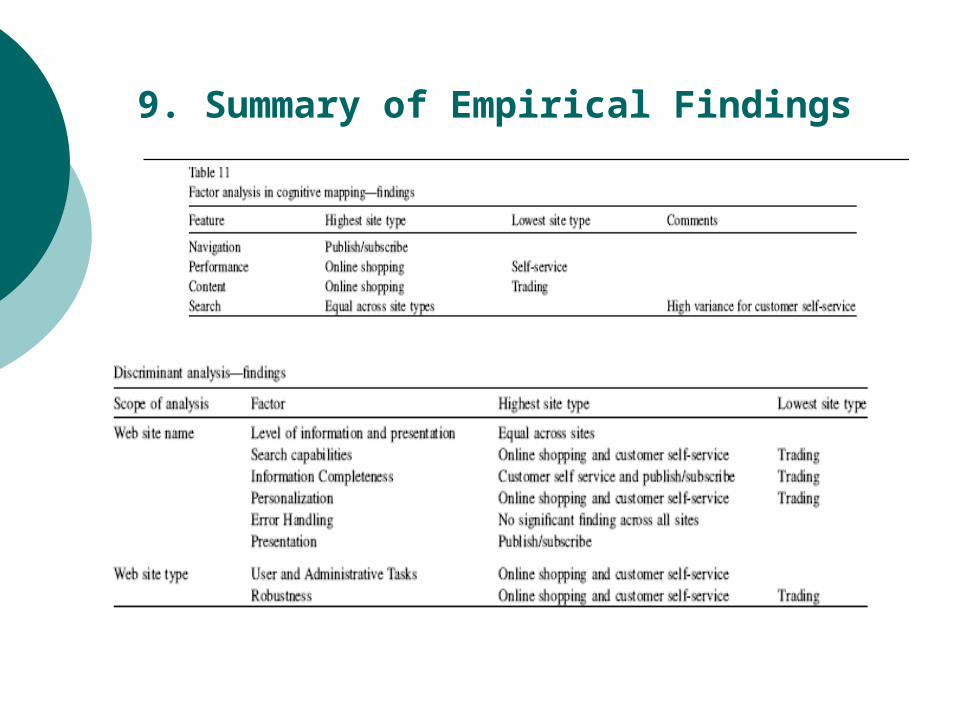
9. Summary of Empirical Findings
This study addressed the increasing differentiation of Web sites according to type and purpose, an issue that has received little attention.
Web sites have different, hidden, and subjective factors that stem from the process of user/system interaction
Incorporating the user-based design construct, which had not been investigated previously in IS user satisfaction research.
9. Discussion
Trading sites have consistently been found to be problematic (by both MDS and ANOVA methods)
Online shopping and customer self-service exhibited good
capabilities and may therefore serve as a role model.
Observation is not surprising considering the fact a satisfied customer is a “must” for maintaining ample revenues and most likely also profitability.
The questionnaire items may serve as a checklist in the development process of Web applications.
9. Discussion

Relationship between usability and user centered design suggests alternative models should be tested.
IBM’s framework categories, while proved useful, have not been validated for exhaustiveness and mutual-exclusiveness
Web site users are random Web surfers who do not participate in the design process
Previous experience of respondents with certain sites and the time of evaluation were not measured
(precision of discriminant classifiers↓)
9. Limitations and Future Research
Classification of Web sites into different categories was done by a single author and not by an expert panel
Web sites are dynamic and might have changed during the evaluation sessions
Demographic limitations: Relatively small size of the sample and the fact that almost half of the participants were students
9. Limitations and Future Research