user's guide for the uranium ore reserve calculation … · 2006-08-07 · user's guide...
TRANSCRIPT

lAEA-TECDOC-484
USER'S GUIDEFOR THE URANIUM ORE RESERVE
CALCULATION SYSTEM(URAD)
A TECHNICAL DOCUMENT ISSUED BY THEINTERNATIONAL ATOMIC ENERGY AGENCY, VIENNA, 1988

PLEASE BE AWARE THATALL OF THE MISSING PAGES IN THIS DOCUMENT
WERE ORIGINALLY BLANK

USER'S GUIDE FOR THE URANIUM ORE RESERVE CALCULATION SYSTEM (URAD)IAEA, VIENNA, 1988IAEA-TECDOC-484ISSN 1011-4289
Printed by the IAEA in AustriaDecember 1988

The IAEA does not normally maintain stocks of reports in this series.However, microfiche copies of these reports can be obtained from
INIS ClearinghouseInternational Atomic Energy AgencyWagramerstrasse 5P.O. Box 100A-1400 Vienna, Austria
Orders should be accompanied by prepayment of Austrian Schillings 100,-in the form of a cheque or in the form of IAEA microfiche service couponswhich may be ordered separately from the INIS Clearinghouse.
FOREWORD
The URAD (Uranium Reserves and Data) system consists of four com-puter programs-des igned to facilitate the evaluation of uranium orereserves analysis and the handling of basic uranium assay data.URAD is designed specifically as a training tool for anyone unfa-m i l i a r with the methodology, data requirements, and/or general com-puter applications in the field of uranium ore reserves analysis.However, it can effectively be used in a 'production' environmentinvolving considerable amounts of data.The basic structure and methodology of the system are outgrowths ofthe methods developed by the Ore Reserves Branch, Grand JunctionOffice, U.S. Atomic Energy Commission during the 1960's and 1970'sby a number of workers who include E.Berkoff, P.C.DeVergie,W.D.Grundy, R.J.Meehan, J.Patterson and J.H.Scott.In order to make this system available to Member States, a contractwith Mr. P.C.DeVergie was made in order to convert the system froma mainframe to a microcomputer. The Grand Junction system as itstood circa 1978 was chosen because of its h i g h r e l i a b i l i t y andyears of successful operation.The resulting programs are written in Microsoft FORTRAN (Version3-1) and may be run on any IBM-compatible microcomputer under DOS2.1 (or later). The system was developed for the Internationa!Atomic Energy Agency under contract 1010.5^10.231 .81 during the pe-riod February through June, 1987-Responsible IAEA staff member was Mr. D. McCarn.
Mr. Paul C. deVergie died just before the issuance of thispublication. In addition to being the person who was contractedby the Agency to develop this program for microcomputer usage,Mr. Paul deVergie was an active participant and contributor to anumber of Agency meetings on uranium resources while stillworking with the US Department of Energy (previously US AtomicEnergy Commission). In 1987 he also served as an Agencytechnical co-operation expert to the People's Republic ofChina. There is no doubt that his contribution to thispublication will be greatly appreciated by workers in this field.
EDITORIAL NOTE
In preparing this material for the press, staff of the International Atomic Energy Agencyhave mounted and paginated the original manuscripts and given some attention to presentation.
The views expressed do not necessarily reflect those of the governments of the Member Statesor organizations under whose auspices the manuscripts were produced.
The use in this book of particular designations of countries or territories does not imply anyjudgement by the publisher, the IAEA, as to the legal status of such countries or territories, oftheir authorities and institutions or of the delimitation of their boundaries.
Jlie mention of specific companies or of their products or brand names does not imply anyendorsement or recommendation on the part of the IAEA.

CONTENTS
.0 INTRODUCTION ........................... 11 . ! Background ........................... 1!.2 History And Acknowledgments .................. 1
1.2.1 Modifications in URAD . . . . . . . . . . . . . . . . . . . 21.2.2 Additional Sources of Information . . . . . . . . . . . . . 3
1.3 General Scope Of The URAD System ................ 31.4 Organization Of The User Guide ................. 31.5 Text Notations, Symbols, And Abbreviations ........... 4
1.5.1 General Notations and Symbols ............... k1.5-2 Notation in Field Descriptions for UDAT Formats . . . . . . 51.5.3 Abbreviations in Text and Illustrations . . . . . . . . . . 6
1.6 URAD Benchmarks ........................ 6
0 OVERVIEk OF THE URAD SYSTEM .............2. 1 Over a 1 1 Structure .................
2.1.1 Processing Primary Data F i l e s . . . . . . . . ."2.1.2 Ore Reserve Calculation Programs . . . . . . . .2.1.3 Print-Output F i l e s . . . . . . . . . . . . . . .
2.2 URAD Files .....................2.2.1 Working F i l e Name Protocol . . . . . . . . . . .2.2.2 F i l e Location . . . . . . . . . . . . . . . . .
2.2.2.1 Hard Disk Available . . . . . . . . . . . .2.2.2.2 Hard Disk Not Available . . . . . . . . . .
2.2.3 Files included with Guide . . . . . . . . . . .2.2.3.1 Program Execute Modules . . . . . . . . . .2.2.3.2 FORTRAN Source Programs . . . . . . . . . .2.2.3.3 Test UDAT Primary Data Files . . . . . . . .2.2.3.4 Test UCON files . . . . . . . . . . . . . .2.2.3-5 Test UDAT Intermediate Data F i l e s . . . . .
...... 7
. . . . . . 7
. . . . . . 7
. . . . . . 7. . . . . . 8
...... 8
. . . . . . 8
. . . . . . 8
. . . . . . 9
. . . . . . 9
. . . . . . 9
. . . . . . 9
. . . . . . 9
. . . . . 10
. . . . . 10
. . . . . 10
3.0 REVIEtt Of URANIUM SAMPLE DATA ................. 123. 1 General ........................... 123.2 Uranium Sample Data Used In URAD ............... JJ
3.2.1 Definitions Used in Guide Relating to Sample Data . . . . 133-2.2 Sample Sets . . . . . . . . . . . . . . . . . . . . . . . 133-2.3 Uranium Sample Data . . . . . . . . . . . . . . . . . . . Ik
3-3 Borehole Radiometrie Logging Data .............. Ik3.3.1 Direct "Readout" to Machine-Readable Media . . . . . . . . 153.3.2 Direct Readout to Printed Media . . . . . . . . . . . . . 153.3.3 Interpreted Values . . . . . . . . . . . . . . . . . . . . 163.3.4 Readings from Printed Radiometrie Strip Logs . . . . . . . 163.3.5 Total Anomalies . . . . . . . . . . . . . . . . . . . . . 163.3.6 Inch-Deflection vs Counts-per-Second Readings . . . . . . 17
3. 4 Radiometrie Disequilibrium .................. 1?3.4.1 General Concepts . . . . . . . . . . . . . . . . . . . . . 1?3.4.2 Application of D i s e q u i l i b r i u m Correction Coefficients . . 18
4.0 UDAT SYSTEM — PRIMARY /BASICS FILES, GENERAL STRUCTURE . . . . 194.1 Primary UOAT Files ...................... 19
4.1.1 Test Primary UDAT F i l e s . . . . . . . . . . . . . . . . . 194.1.1.1 Test F i l e GAMDAT . . . . . . . . . . . . . . . . . . . 194.1.1.2 Test F i l e STARDAT . . . . . . . . . . . . . . . . . . 20
4.1.1.3 Test F i l e GAMDATV . . . . . . . . . . . . . . . . . . 204.1.1.4 Test F i l e STARDATL . . . . . . . . . . . . . . . . . . 20
k.2 Formatted Data ........................ 204.2.1 Sample Set Record Types . . . . . . . . . . . . . . . . . 20
4.2.1.1 Header Records . . . . . . . . . . . . . . . . . . . . 204.2.1.2 Continuation Records . . . . . . . . . . . . . . . . . 214.2.1.3 Lithologie Records . . . . . . . . . . . . . . . . . . 214.2.1.4 Directional Data Records . . . . . . . . . . . . . . . 21
4.2.2 Format Types . . . . . . . . . . . . . . . . . . . . . . . 214.2.2.1 Contiguous Format . . . . . . . . . . . . . . . . . . 214.2.2.2 Non-contiguous Format . . . . . . . . . . . . . . . . 224.2.2.3 Borehole Log Formats . . . . . . . . . . . . . . . . . 22
4.} Format-free Text . . . . . . . . . . . . . . . . . . . . . . . 22
5.0 UDAT SYSTEM — PRIMARY FILES, DESCRIPTION OF ûffA IH SAMPLE SETS 27$. 1 Descriptive Data Common to Records in Every Sample Set . . . . 27
5.1.1 Hole Number / Sample Set Identification . . . . . . . . . 275.1.2 Area Number . . . . . . . . . . . . . . . . . . . . . . . 285.1.3 Property Code . . . . . . . . . . . . . . . . . . . . . . 285.1.4 Record Count or Index . . . . . . . . . . . . . . . . . . 285.1.5 Example D r i l l Hole Location Plot . . . . . . . . . . . . . 28
5.2 Descriptive Data Common to All Header Records ........ 295.2.1 Sample-Type Codes . . . . . . . . . . . . . . . . . . . . 29
5.2.1.1 Scales and Ranges . . . . . . . . . . . . . . . . . . 295.2.1.2 Range/Scale Code Systems . . . . . . . . . . . . . . . 30
5.2.2 Coordinates . . . . . . . . . . . . . . . . . . . . . . . 325.2.2.1 North Coordinate . . . . . . . . . . . . . . . . . . . 335.2.2.2 East Coordinate . . . . . . . . . . . . . . . . . . . 33
5.2-3 Collar (or Reference) Elevation . . . . . . . . . . . . . 335.2.4 Depth to Pit Bottom . . . . . . . . . . . . . . . . . . . 335.2.5 Depth to Oxidized/Non-oxidized Contact . . . . . . . . . . 345.2.6 Depth to F i r s t Sample . . . . . . . . . . . . . . . . . . 345.2.7 Total Depth Sampled . . . . . . . . . . . . . . . . . . . 34
5-3 Additional Entries Common to Borehole Log Header Records ... 355.3.1 Readout Interval . . . . . . . . . . . . . . . . . . . . . 355.3.2 Depth to Hole Water . . . . . . . . . . . . . . . . . . . 355.3.3 K-Factor . . . . . . . . . . . . . . . . . . . . . . . . . 355.3.4 Attenuation Factors . . . . . . . . . . . . . . . . . . . 36
5«3-4.1 Air Correction Factor . . . . . . . . . . . . . . . . 365.3.4.2 Water Correction Factor . . . . . . . . . . . . . . . 37
5.3.5 Dead Time Factor . . . . . . . . . . . . . . . . . . . . . 375.3.6 Full-Scale Deflection . . . . . . . . . . . . . . . . . . 375.3.7 Logging Unit (Log Type) Code . . . . . . . . . . . . . . . 38
5.4 Sample Data . . . . . . . . . . . . . . . . . . . . . . . . . 38
6.0 UDAT SYSTEM — PRIMARY FILES, INDIVIDUAL DATA FORMATS ..... 476. ! Contiguous Sample format . . . . . . . . . . . . . . . . . . . 4?
6.1.1 Header Record, Descriptive Data . . . . . . . . . . . . . 476.1.1.1 Record Count . . . . . . . . . . . . . . . . . . . . . 476.1.1.2 Area Number . . . . . . . . . . . . . . . . . . . . . 486.1.1.3 Hole Number . . . . . . . . . . . . . . . . . . . . . 486.1.1.4 Sample-Type Code 1 . . . . . . . . . . . . . . . . . . 486.1.1.5 Sample-Type Code 2 . . . . . . . . . . . . . . . . . . 486.1.1.6 Sample-Type Code 3 . . . . . . . . . . . . . . . . . . 486.1.1.7 North Coordinate . . . . . . . . . . . . . . . . . . . 486.1.1.8 East Coordinate . . . . . . . . . . . . . . . . . . . 486.1.1.9 Collar Elevation . . . . . . . . . . . . . . . . . . . 486.1.1.10 Pit-Bottom Depth . . . . . . . . . . . . . . . . . . 486 . 1 . 1 . 1 1 Depth to Oxidized/Non-oxidized Contact . . . . . . . 48
6.1.1.12 Depth to Top of F i r s t Sample Interval . . . . . . . . 486.1.1.Ï3 Property Code . . . . . . . . . . . . . . . . . . . . 48
6.1.2 Header Record, Sample Data . . . . . . . . . . . . . . . . 496.1.2.1 Unimetal Sample Interval Data . . . . . . . . . . . . 496.1.2.2 Bimetal Sample Interval Data . . . . . . . . . . . . . 49
6.1.3 Continuation Records . . . . . . . . . . . . . . . . . . . 1*96.1.3.1 Record Count . . . . . . . . . . . . . . . . . . . . . 506.1.3.2 Area Number . . . . . . . . . . . . . . . . . . . . . 506.1.3.3 Hole Number . . . . . . . . . . . . . . . . . . . . . 506.1.3-Â Unimetal Sample Interval Data . . . . . . . . . . . . 506.1.3-5 Bimetal Sample interval Data . . . . . . . . . . . . . 506.1.3.6 Property Code . . . . . . . . . . . . . . . . . . . . 50
6.2 Non-Contiguous Sample Format . . . . . . . . . . . . . . . . . 506.2.1 Header Record . . . . . . . . . . . . . . . . . . . . . . 51
6.2.1.1 Entries Identical to Those in the "Contiguous" Format 516.2.1.2 Sample type code 1 . . . . . . . . . . . . . . . . . . 5'6.2.1.3 Sample type code 2 . . . . . . . . . . . . . . . . . . 516.2.1.4 Sample type code 3 . . . . . . . . . . . . . . . . . . 516.2.1.5 Total Depth Sampled . . . . . . . . . . . . . . . . . 526.2.1.6 Sample Interval Data . . . . . . . . . . . . . . . . . 52
6.2.2 Continuation Records . . . . . . . . . . . . . . . . . . . 526.2.2.1 Sample Interval Data . . . . . . . . . . . . . . . . . 52
6.3 Borehole Log Format . . . . . . . . . . . . . . . . . . . . . $26.3-1 Header Record . . . . . . . . . . . . . . . . . . . . . . 53
6.3.1.1 Entries Identical to Those in the "Contiguous" Format 536.3.1.2 Sample-Type Code 1 . . . . . . . . . . . . . . . . . . 536.3.1.3 Sample-Type Code 2 . . . . . . . . . . . . . . . . . . 536.3.1.4 Sample-Type Code 3 . . . . . . . . . . . . . . . . . . 5^6.3.1.5 Total Depth Sampled (Logged) . . . . . . . . . . . . . 546.3.1.6 Readout Interval . . . . . . . . . . . . . . . . . . . 5**6.3.1.7 Depth to Hole Water . . . . . . . . . . . . . . . . . 546.3.1.8 K-Factor . . . . . . . . . . . . . . . . . . . . . . . 546.3.1.9 Air Correction Factor . . . . . . . . . . . . . . . . 546.3.1.10 Water Correction Factor . . . . . . . . . . . . . . . 5^6.3.1.11 Dead Time . . . . . . . . . . . . . . . . . . . . . . 546.3.1.12 Full-Scale Deflection . . . . . . . . . . . . . . . . 5^*6.3.1.13 Logging Unit Type Code . . . . . . . . . . . . . . . 5^
6.3.2 Continuation Records . . . . . . . . . . . . . . . . . . . 556.3.2.1 Readings in Inches-of-Deflection . . . . . . . . . . . 556.3.2.2 Readings in Counts-Per-Second . . . . . . . . . . . . 556.3.2.3 Interpreted Uranium Values . . . . . . . . . . . . . . 5&6.3.2.4 Special Entries . . . . . . . . . . . . . . . . . . . 56
6.b Lithologie Data Records ......... .......... 59
7.0 THE ÜCON SYSTEM ........................ 697.1 Definition Of A "Slock" ................... 69
7.1.1 Block as Used With Program URDAT . . . . . . . . . . . . . 697.1.2 Blocks as Used With the Ore Reserves Programs ...... 69
7.2 Overall Structure Of A UCON File . . . . . . . . . . . . . . . 707-3 UCON Instructions, General .................. //7.4 instructions Contained In The BCft (Block) Identifier Record . 73
7.4.1 The "B" Instruction . . . . . . . . . . . . . . . . . . . 737.4.2 The ">" Instruction . .................. 737.4.3 The "!" Instruction . . . . . . . . . . . . . . . . . . . 737.4.4 Summary of Usage of the BCM Identifier Record . . . . . . 74
/.$ Instructions Contained In The FCM (File) Identifier Record , . 7^7.5.1 The "F" Instruction . . . . . . . . . . . . . . . . . . . 747-5-2 Other Instructions on the FCM Identifier Record . . . . . 757.5.3 Summary of Usage of the FCM Identifier Record . . . . . . 75
?.6 Edit Instructions Mithin A File Control Module . . . . .7.6.1 General Character i s i es . . . . . . . . . . . . . . .7.6.2 Carry-over or Negation of Ed i t Instructions . . . .7.6.3 The "E" Instruction . . . . . . . . . . . . . . . .7.6.3.1 OPcode2 «= "1" . . . . . . . . . . . . . . . . .7.6.3.2 OPcode2 « "2" . . . . . . . . . . . . . . . . .7.6.3.3 OPcode2 - "3" . . . . . . . . . . . . . . . . .7.6.3.4 OPcode2 - "V . . . . . . . . . . . . . . . . .
7.6.4 The "I" Instruction . . . . . . . . . . . . . . . .7.6.5 The "W" Instruction . . . . . . . . . . . . . . . .7.6.6 The "D" Instruction . . . . . . . . . . . . . . . .7.6.7 The "H" Instruction . . . . . . . . . . . . . . . .7.6.8 The "A" Instruction . . . . . . . . . . . . . . . .7.6.9 The "C" Instruction . . . . . . . . . . . . . . . .7.6.10 Hierarchy of Edit Operations . . . . . . . . . . .
7.7 The "*" Terminator Records . . . . . . . . . . . . . . .7.8 Summary Example . . . . . . . . . . . . . . . . . . . .
8.0 PROGRAH UROff ......................8. / General Concepts and Operations . . . . . . . . . . . .
8.1.1 Requirements . . . . . . . . . . . . . . . . . . . .8.1.2 Importance of Reviewing Data . . . . . . . . . . . .
8.2 The Print-Output F lie . . . . . . . . . . . . . . . . .8.2.1 General URAD Usage of the Print-Output F i l e . . . .
8.2.1.1 Naming and Location of P-0 files . . . . . . . .8.2.2 URAD Printing Protocol . . . . . . . . . . . . . . .8.2.2.1 Vertical Print Control. . . . . . . . . . . . .8.2.2.2 Horizontal Print Control . . . . . . . . . . . .8.2.2.3 Test for Character Width Versus Page Width . . .8.2.2.4 Pagination . . . . . . . . . . . . . . . . . . .8.2.2.5 L i m i t i n g Output Lines . . . . . . . . . . . . .8.2.2.6 L i m i t i n g Sample Sets Processed . . . . . . . . .
8.2.3 Program FORPRINT . . . . . . . . . . . . . . . . . .8.2.3.1 Program RESTPRN . . . . . . . . . . . . . . . .
8.3 URDAT Print-Output . . . . . . . . . . . . . . . . . . .8.3'1 Detailed Data Listings . . . . . . . . . . . . . . .
8.3.1.1 Format Mode . . . . . . . . . . . . . . . . . .8.3.1.2 Examples of Listings . . . . . . . . . . . . . .8.3.1.3 Page Headers . . . . . . . . . . . . . . . . . .
8.3-2 Data Summaries . . . . . . . . . . . . . . . . . . .8.3-2.1 Sample Set Status Summary . . . . . . . . . . .8.3.2.2 "Peak-Grade" Summary . . . . . . . . . . . . . .8.3.2.3 Example of Uranium "Intensity" Plot ......
<9. 4 Gamma-Log Interpretations . . . . . . . . . . . . . . .8.4.1 Calculation of Sample Interval Depths . . . . . . .
8.5 Intermediate UDAT Files . . . . . . . . . . . . . . . .8.5.1 Usage of the Intermediate UDAT F i l e s . . . . . . . .8.5-2 Description of the Intermediate Files . . . . . . .8.5.2.1 F i l e Identification Record . . . . . . . . . . .8.5.2.2 Sample Set Header Record . . . . . . . . . . . .8.5-2.3 Sample Set Sample Record . . . . . . . . . . . .8.5.2.4 Sample Set Lithologie Record . . . . . . . . . .
8.5-3 "Dumping" of the Intermediate Data F i l e s . . . . . .8.6 URDAT Interactive Entries ...............8.6.1 Establi s h i n g F i l e s and Desired Output . . . . . . .
8.6.1.1 Print-Output F i l e . . . . . . . . . . . . . . .8.6.1.2 UCON f i l e . . . . . . . . . . . . . . . . . . .8.6.1.3 Type of Output . . . . . . . . . . . . . . . . .8.6.1.4 Intermediate UDAT f i l e . . . . . . . . . . . . .
... 75
... 75... 76
... 77
... 77... 78
... 78
... 78
... 78
... 81
... 83
... 83... 84
... 84
... 86
. . . 87
. . . 8?
... 55
... 95
... 95
... 95... 96
... 96
... 96
... 97
... 97
... 97
... 97... 98
... 98
... 98
... 99
... 99
... 99
... 99... 100
... 100
... 100
... 100
... 101
... 101
... 102
. . . 102
... 102
. . . 103
... 103
... 103
... 103
... 104
... 105
... 106
... 106
. . . 106
... 107
... 107
... 107
... 107
... 107

8.6.1.5 Print Summary in Condensed Mode? . . . . . . . . . . . 1078.6.2 Print Controls for Data Listing . . . . . . . . . . . . . 1088.6.2.1 Detailed Print-Output Control or "Test" Mode? . . . . 1088.6.2.2 Pagination Requested? . . . . . . . . . . . . . . . . 1088.6.2.3 Paper Page Length & Line Spacing: "Standard" or Other? 1088.6.2.4 Specify Actual Page Length . . . . . . . . . . . . . . 1088.6.2.5 Line Spacing? . . . . . . . . . . . . . . . . . . . . 1088.6.2.6 Paper Page Width? . . . . . . . . . . . . . . . . . . 1088.6.2.7 Specify Actual Page Width . . . . . . . . . . . . . . 1088.6.2.8 Specify Print Width . . . . . . . . . . . . . . . . . 1098.6.2.9 Format Mode? . . . . . . . . . . . . . . . . . . . . . 1098.6.2.10 Option to Continue, Reset Print Controls, or Abort 1098.6.2.11 Option to Reduce Number of Lines Per Page . . . . . . 1098.6.2.12 Lines Per Page . . . . . . . . . . . . . . . . . . . 109
8.6.3 L i m i t i n g Output Listing . . . . . . . . . . . . . . . . . 1098.6.3.1 L i m i t Number of Output Lines? . . . . . . . . . . . . 1098.6.3.2 L i m i t Number of Sample Sets Processed? . . . . . . . . 109
8.6.1* Sample Data Status and "Peak Grade" Summaries . . . . . . 1098.6.4.1 Detailed Summary Listings? . . . . . . . . . . . . . . 110
8.6.5 Method of Referencing Sample Set Position . . . . . . . . 1108.6.5.1 Sample Interval Position Reference? . . . . . . . . . 110
8.6.6 Header Information . . . . . . . . . . . . . . . . . . . . 1108.6.6.1 Name of RUN Submittor . . . . . . . . . . . . . . . . 1108.6.6.2 Date . . . . . . . . . . . . . . . . . . . . . . . . . 1 10
9.0 DEFINITION OF ORE RESERVE TERMS AS USED IH THIS GUIDE . . .3. 1 Physical Parameters . . . . . . . . . . . . . . . . . . .
9-1.1 Reserves . . . . . . . . . . . . . . . . . . . . . . .9-1.1.1 General Characteristics of URAD Reserve Estimates9.1.1.2 "In-place Reserves, Additional" . . . . . . . . .
9.1.2 Ore Interval . . . . . . . . . . . . . . . . . . . . .9-1.3 Minimum Mining Thickness . . . . . . . . . . . . . . .9.1.4 Ore Cutoff . . . . . . . . . . . . . . . . . . . . . .
9.1.4.1 Value-vs-Cost Cutoff . . . . . . . . . . . . . . .9.1.4.2 Arbitrary Cutoff Grade . . . . . . . . . . . . . .
9-1.5 Overburden Waste . . . . . . . . . . . . . . . . . . .9.1.5.1 "Backslope Overburden" . . . . . . . . . . . . . .
9.1.6 Mining Waste . . . . . . . . . . . . . . . . . . . . .9.1.7 Minimum Waste Thickness . . . . . . . . . . . . . . .
9.1.7-1 Underground. . . . . . . . . . . . . . . . . . . .9.1.7.2 Open Pit. . . . . . . . . . . . . . . . . . . . .
9.1.8 Dilution Thickness and Grade . . . . . . . . . . . . .9.1.8.1 Diluting to Minimum Mining Thickness .......9.1.8.2 Mining Dilution . . . . . . . . . . . . . . . . .
9.1.9 Protore . . . . . . . . . . . . . . . . . . . . . . .9.1.9.1 Protore Processing Cost and Percent Recovery . . .9.1.9.2 Treatment of Protore in SCOR . . . . . . . . . . .
9.1.10 Mine Extraction Losses . . . . . . . . . . . . . . .9.1.11 Ore Processing Recovery . . . . . . . . . . . . . . .
5.2 Economic Parameters . . . . . . . . . . . . . . . . . . .9-2.1 Integrated Versus Independent Operations . . . . . . .9.2.2 Operating Versus Capital Costs . . . . . . . . . . . .
9-2.2.1 Operating Costs . . . . . . . . . . . . . . . . .9-2.2.2 Capital Costs . . . . . . . . . . . . . . . . . .9.2.2.3 Mine-Mill Reclamation, Shutdown Costs . . . . . .9.2.2.4 SCOR Cost Elements . . . . . . . . . . . . . . . .9.2.2.5 Preliminary Estimates . . . . . . . . . . . . . .
9.2.3 Operating Costs . . . . . . . . . . . . . . . . . . .9.2.4 Capital Costs . . . . . . . . . . . . . . . . . . . .9.2.4.1 Inter-ore Mining Waste-Costs . . . . . . . . . . .
. . . 117. . 11?. . 117. . 118. . 119. . 119. . 119
, . . 119, . . 120. . . 120. . . 120, . . 121, . . 121. . 122. . 122. . 122. . 123. . 123. . 123. . 124. . 124. . 124. . 124. . 125. . 125. . 125. . 125. . 125. . 125. . 126. . 126. . 126. . 126. . 12?. . 128
10.0 INTERACTIVE ENTRY . . . . . . . . . . . . . . . . . . . . . . . 12910. 1 General Procedures ..................... 129
11.0 GEHERAL PROCEDURES FOR RUHHIHG THE RESEMES PROGRAM. ...... 13211.1 Preliminary Steps ...................... 13211.2 Running the Programs - Standard Interactive Entries . . . . . 13311.3 Contents Of The Intermediate Data File ........... 1J4
11.3.1 Intermediate Data Header Output . . . . . . . . . . . . . 13511.3-2 Sample Interval and Lithologie Data . . . . . . . . . . . 136
12.0 PROGRAM RESUV ...................12. 1 General Concepts And Operations .........12.2 Reserves-Analysis-Options ............
12.2.1 Option 1 . . . . . . . . . . . . . . . . . .12.2.2 Option 2 . . . . . . . . . . . . . . . . . .
12.2.2.1 Calculation of Vanadium Grades . . . . .12.2.3 Option 3 . . . . . . . . . . . . . . . . . .12.2.4 Option k ..................
12. J Running The Program - Interactive Input Requests12.3.1 Standard I n i t i a l Entries . . . . . . . . . .12.3.2 For All Options . . . . . . . . . . . . . . .12.3-3 Options Depending On Reserve-Type . . . . . .
12.3.3.1 Option 1 . . . . . . . . . . . . . . . .12.3.3.2 Option 2 . . . . . . . . . . . . . . . .12.3.3.3 Option 3 . . . . . . . . . . . . . . . .12.3-3-4 Option 4 . . . . . . . . . . . . . . . .
12-3.4 Vanadium D i l u t i o n Grade . . . . . . . . . . .12.3.5 Output Options . . . . . . . . . . . . . . .
...... 138
...... 138
...... 139
. . . . . . 140
. . . . . . 140
. . . . . . 141
. . . . . . 141
...... 141
. . . . . . 1 4 1
. . . . . . 141
. . . . . . 142
. . . . . . 142
. . . . . . 142
. . . . . . 142
. . . . . . 143
. . . . . . 143
. . . . . . 143
. . . . . . 14313.0 PROBRAM ORSAC ......................... 146
!J.) Genera) Concepts And Operations ............... !4eIJ.2 Program 1-nput Parameters ................. 148
13.2.1 Combining Thickness . . . . . . . . . . . . . . . . . . . 14813.2.2 Minimum Grade Cutoff . . . . . . . . . . . . . . . . . . 14813.2.3 Tonnage Factor . . . . . . . . . . . . . . . . . . . . . 14813.2.4 ALPHA1 Constant . . . . . . . . . . . . . . . . . . . . . 148
13-3 Options ........................... 14813.3.1 Program Run Options . . . . . . . . . . . . . . . . . . . 148
13.3.1.1 Option 1: Uranium, Combined Intervals at Equal Thick-ness . . . . . . . . . . . . . . . . . . . . . . . . . . . . . 148
1 3 - 3 - 1 - 2 Option 2: Uranium, Total Sample Interval Above MinimumCutoff . . . . . . . . . . . . . . . . . . . . . . . . . . . . 14913.3.1.3 Option 3: Vanadium, Combined Intervals at Equal Thick-ness . . . . . . . . . . . . . . . . . . . . . . . . . . . . . 149
1 3 - 3 - 1 . 4 Option 4: Vanadium, Total Sample Interval Above M i n i -"mum Cutoff . . . . . . . . . . . . . . . . . . . . . . . .
13- 3 - 2 Program Output Options . . . . . . . . . . . . . . .13.3.2.1 Option 1: Output of Combined Assays . . . . . . .13-3-2.2 Option 2: Output Fractional Tonnage . . . . . . .13.3.2.3 Option 3: Output of Statistical Parameters andChi-Square Test. . . . . . . . . . . . . . . . . . . . . .
13. 3-2. 4 Option 4: Output of Tons and Average Grade. . . .13.3.2.5 Option 5= Summary For All Blocks . . . . . . . .
13' 4 Running The Program - Interactive Entry .........13.4.1 Standard i n i t i a l Entries . . . . . . . . . . . . . .13-4.2 Program Control Entries . . . . . . . . . . . . . . .
13-4.2.1 ->Reserves Analysis Option . . . . . . . . . . .13-4.2.2 -> Combining Thickness . . . . . . . . . . . . .13.4.2.3 ~> Minimum Cutoff Grade . . . . . . . . . . . . .
. . 149
. . 149
. . 149
. . 150
. . 150
. . 150
. . 150
. . 150
. . 150
. . 150
. . 150
. . 150
. . 150

13-4.2.4 -> Tonnage Factor . . . . . . . . . . . . . . . . . . 15013.4.2.5 -> Additive Constant . . . . . . . . . . . . . . . . 15113.4.2.6 -> Output Option . . . . . . . . . . . . . . . . . . 151
14.0 PROGRAM SCOR ......................... 15514. ! Concepts And General Operations ...............Ik.2 Ore Reserves Analysis Methodology ..............
14.2.1 Ore Interval Analysis, General . . . . . . . . . . . . . 15614.2.1.1 Cutoff Grade Determination . . . . . . . . . . . . . 157
14.2.2 Open Pit Analysis . . . . . . . . . . . . . . . . . . . . 15814.2.2.1 Determine Ore Intervals. . . . . . . . . . . . . . . 15814.2.2.2 Determine Protore Intervals . . . . . . . . . . . . . 15814.2.2.3 Determine Category of Mining Waste Intervals .... 15914.2.2.4 Cost Vs Value (Unit Value) . . . . . . . . . . . . . 15914.2.2.5 Sample-Set Output from Open Pit Analysis ...... 16014.2.2.6 Detailed sample-set output. . . . . . . . . . . . . . 16014.2.2.7 Summary sample-set output. . . . . . . . . . . . . . 161
14.2.3 Underground Analysis . . . . . . . . . . . . . . . . . . 16214.2.4 Block Ore Reserves Summary . . . . . . . . . . . . . . . 162
14.2.4.1 Ore Reserve Quantities . . . . . . . . . . . . . . . 16214.2.4.2 Ore Reserve Economics . . . . . . . . . . . . . . . . 164
14.2.5 SCOR Plot F i l e . . . . . . . . . . . . . . . . . . . . . 16514.2.5.1 Structure of the Plot F i l e . . . . . . . . . . . . . 166
14.2.6 Grade-Tonnage Distribution Analysis . . . . . . . . . . . 16714.3 Options and Interactive Entries ............... 167
14.3.1 Standard Entries . . . . . . . . . . . . . . . . . . . . 16814.3.2 Plot Output F i l e . . . . . . . . . . . . . . . . . . . . 16814.3.3 Output Of Ore-Interval Anaylsis . . . . . . . . . . . . . 168
14.3.3-1 Choice of Ore Interval Position Reference . . . . . . 16814.3.4 Calculation And Output Of The G-T Distribution Analysis 16814.3.4.1 Choice of Area-of-lnfluence Method . . . . . . . . . 16814.3-4.2 Combining Thickness . . . . . . . . . . . . . . . . . 1&9
14.3-5 Option For Reserves Calculation By Ore-Interval Analysis 16914.3.6 Open Pit Versus Underground Analysis . . . . . . . . . . 16914.3.7 Integrated Versus Independent Options . . . . . . . . . . 16914.3.8 Ore Cutoff Grades . . . . . . . . . . . . . . . . . . . . 17014.3.8.1 Number of Cutoff Grades . . . . . . . . . . . . . . . 17014.3.8.2 Arbitrary versus Cost/Price Cutoff . . . . . . . . . 170
14.3.9 Standard Physical Parameters and Operating Cost Entries 17014.3.9-1 Ore Processing Operating Cost . . . . . . . . . . . . 17014.3.9.2 Ore Processing Recovery Rate . . . . . . . . . . . . 17014.3.9.3 Uranium Prices . . . . . . . . . . . . . . . . . . . 17014.3-9-4 Minimum Mining Thickness . . . . . . . . . . . . . . 17014.3.9.5 Upper Dilution Thickness . . . . . . . . . . . . . . 17114.3.9.6 Lower Dilution Thickness . . . . . . . . . . . . . . 17114.3.9.7 Tonnage Factor . . . . . . . . . . . . . . . . . . . 17114.3.9.8 Direct Mining Cost . . . . . . . . . . . . . . . . . 17114.3.9.9 Applicable Indirect Mining Cost . . . . . . . . . . . 17114.3.9.10 Haulage Cost . . . . . . . . . . . . . . . . . . . . 17114.3.9.11 Ore Royalty Cost . . . . . . . . . . . . . . . . . . \1\
14.3.10 Open-Pit-Specific Factors . . . . . . . . . . . . . . . 17114.3.10.1 Overburden Removal Cost . . . . . . . . . . . . . . 17114.3.10.2 Option for Charging Open Pit Typel Waste Removal Cost 17214.3.10.3 Option for a Type2 Waste Removal Cost . . . . . . . 17214.3.10.4 Protore Option . . . . . . . . . . . . . . . . . . . 172
14.3.11 Underground-Specific Operation Factors . . . . . . . . . 17314.3.11.1 Option for Charging Underground Typel Waste RemovalCost . . . . . . . . . . . . . . . . . . . . . . . . . . . . . 17314.3.11.2 Minimum Typel ("Stope") Waste Thickness . . . . . . 173
14.3.11.3 Maximum Type! {"Slope") Waste Thickness . . . . . . 17314.3.11.4 Cost for Removal of Type! Waste . . . . . . . . . . 171*
14.3.12 Open-Pit-Specific Capital Cost Factors . . . . . . . . . 17!»11».3.12.1 Pit Slope Angle . . . . . . . . . . . . . . . . . . 17414.3.12.2 Pit Perimeter Length . . . . . . . . . . . . . . . . 17414.3.12.3 Underground-Specific Capital Cost . . . . . . . . . 174
14.3.13 Primary Development Cost . . . . . . . . . . . . . . . . 174Î4.3.14 Genera] Capital Costs . . . . . . . . . . . . . . . . . 1?4
14.3.14.1 Ore Processing Capital Cost . . . . . . . . . . . . 17514.3.14.2 Mine Plant and Equipment Capital Cost . . . . . . . . 17514.3.14.3 "Other" Capital Cost . . . . . . . . . . . . . . . . 175
15.0 APPENDIX A: THE GAMLOG HETHOO ................. 187/£.7 Introduction . . . . . . . . . . . . . . . . . . . . . . . . )8?1$.2 Concepts . . . . . . . . . . . . . . . . . . . . . . . . . . 188
15.2.1 Relating Type Anomalies to Grade . . . . . . . . . . . . 18815.3 Matching Real and Synthetic Anomalies ............ 18$
16.0 APPENDIX B: STARDAT DATA - PROCESSED GAHHA LOG DATA ...... 197
17.0 APPENDIX C: OUTPUT LIST 1MB FROM l/RDAT RUN ........... 20118.0 INDEX ............................. 207
INTRODUCTION
1.0 INTRODUCTION
1.1 BACKGROUND
The URAO (Uranium Reserves and Data) system consists of four computer pro-grams designed to facilitate the evaluation of uranium ore reserves analysisand the handling of basic uranium assay data. The programs are written inMicrosoft FORTRAN (Version 3.1) and may be run on any IBM-compatible micro-computer under DOS 2.1 (or later). The system was developed for the Interna-tional Atomic Energy Agency under contract 1010.5^10.231«Bl during theperiod February through June, 198?- The documentation was edited by D.McCarn of the I A E A in March, 1988. The basic structure and methodology ofthe system are outgrowths of methods developed by the Ore Reserves Branch,Grand Junction Office, U.S. Atomic Energy Commission (GJO/AEC) during theI960's and early 1970's.URAD is designed specifically as a training tool for anyone un f a m i l i a r withthe methodology, data requirements, and/or general computer applications inthe fi e l d of uranium ore reserves analysis. However, it can effectively beused in a 'production1 environment involving considerable amounts of data.Only a basic working knowledge of DOS 2.1 is needed to maintain the systemand run the programs.
1.2 HISTORY AND ACKNOWLEDGMENTS
The computational algorithms, and output forms in URAD were in, large partconverted directly from programs and u t i l i t y subroutines developed GJO/AEC.The history of this development is reviewed briefly to provide readers withsome continuity for reference between the URAD system and the o r i g i n a l pub-lications cited in this guide.During the period 1960-1968 GJO/AEC developed the following computer pro-grams:
GAMLOG (J.H. Scott, 1962) The interpretation of gamma-ray log datausing a d i g i t a l computer. U.S. Atomic Energy Commision, GJO,RME-11+3.DOLLAR (J. Scott, 1963) The Dollar Program For Calculating UraniumOre Reserves. U.S.A.E.C., GJO, RME-1U2.GRADE (J. Scott, 1963) The Grade Program For Calculating UraniumOre Reserves. U.S.A.E.C., GJO, RME-U5.ORSAC (R.J. Meehan and W.D.Grundy, 1964) Estimation of Uranium OreReserves by Statistical Methods and a D i g i t a l Computer.U.S.A.E.C., GJO, RME-183.SCOR (P. deVergie, 1962) Calculation of underground or open pitreserves using grade cutoffs arbitrarily assigned or determined by

INTRODUCTION
economics. Paper presented to the Colorado M i n i n g Association in1968.(A review of the GJO computer applications was presented in 1964by J. Patterson, P. deVergie, and R.J. Meehan at the \9t>k Inter-national Symposium on Computer Applications in the Minerals Indus-try, Colorado School of Mines, Golden, Colorado)
a timehand" meth-
Each of the above programs was initiated somewhat independently atwhen gamma-log data were being taken from gamma-ray logs using "hand" meth-ods, and each had its own particular method for inputting and processing thedata.The period 1962-1969 saw a rapid increase in u t i l i z a t i o n of automaticd i g i t i z i n g of gamma-log data. The GJO system for automatic d i g i t i z i n g wasdescr i bed i n:
Young, H.B. and deVergie, P.C., 1963, Preparation of Gamma-ray LogData for IBM Card Punching, U.S. A. E.G., GJO, RME-144.
A set of routines (PEDAT, deVergi e, 1963) was developed to serve as a stand-ard data input program to read in and edit various types of data and was in-corporated into SCOR, ORSAC, and GRADE (but not into DOLLAR).
When the CDC 3100 computer was in s t a l l e d at GJO in 1969, program MDDAT(deVergie, 19&9) was developed as a 'front-end' module which processed alldata and created secondary data f i l e s (binary) prior to processing by orereserves programs. MDDAT included the GAMLOG interpretation routines. Pro-grams ORSAC and SCOR were converted with some modifications.DOLLAR and GRADE were combined into GRADEV (R.J .Meehan) , to which was addedthe additional capability of handling vanadium assays. The PEDAT routineswere modified and then added to each ore reserve program in order to processand edit the secondary f i l e s created by MDDAT.Modifications and enhancements continued on these programs up through 1979»when the CDC 6600 was installed at GJO. In designing URAD, it was judgedthat the GJO system, as it stood circa 1978. would be most useful point atwhich to begin. A considerable amount of the material presented herein waswas o r i g i n a l l y never f u l l y documented due to the ongoing changes and addi-tions which were constantly taking place.
1.2.1 Modifications in URAD
For URAD, the MDDAT program was modified and revised into program "URDAT"(URanium DATa system); The o r i g i n a l diverse formats for basic sample datawere revised and standardized, and a new format ("Q") was added. The compu-tational algorithms in GRADEV (renamed "RESUV" (REServes for Uranium andVanadium) and ORSAC were left intact.SCOR was considerably modifified; and the PEDAT routines were revised andenhanced. The major changes in the all the programs occurred in the process-ing of the data and input of program parameters. The f i l e handling and datainput procedures were completely revised to form the UCON system, which isaltogther new. Input of parameters into the ore reserve programs was stand-
INTRODUCTION
ardized to the extent feasible, and all such input was made interactive ex-cept for the UCON f i l e handling and data edit instructions.Output features were redesigned specifically for microcomputer printer ca-p a b i 1 i ty.
1.2.2 Additional Sources of InformationThe following publications were excellent sources for information relatingto ore reserves and basic interpretation of gamma-log data:
Practical Borehole Logging Procedures for Mineral Exploration withEmphasis on Uranium, I.A.E.A., Vienna, Techn. Report Series No.259-Methods for the Estimation of Uranium Ore Reserves (an InstructionManual) ,I .A.E.A, Vienna, Technical Report Series No.255-
1.3 GENERAL SCOPE OF THE URAD SYSTEM
1.4 ORGANIZATION OF THE USER GUIDE
This guide includes the following major sections:The OVERVIEW OF THE URAD SYSTEM (Section 2.0) shows the major elements ofthe URAD system.The REVIEW OF SAMPLE DATA (Section 3-0) describes the general type of sampledata found in URAD and includes discussions on radiometric logging data andd i s e q u i l i b r i u m correction of radiometric data.A complete description of the f i l e structure and sample type formats of theUDAT basic sample data f i l e s is provided under: UDAT SYSTEM — PRIMARY(BASIC) FILES, GENERAL FILE STRUCTURE (Section 4.0);
UDAT SYSTEM — PRIMARY FILES, DESCRIPTIVE DATA FOR SAMPLE SETS (Section5.0); and,UDAT SYSTEM — PRIMARY FILES, INDIVIDUAL DATA FORMATS (Section 6.0).A complete description of the UCON system for f i l e access and sample editingis given in THE UCON SYSTEM (Section 7.0).PROGRAM URDAT (Section 8.0) explains the i n i t i a l processing of the primaryUDAT files to obtain standard output listings and gamma-log interpretationsof radiometric data, and to create intermediate UDAT files which are used bythe ore reserves programs - RESUV, ORSAC, and SCOR.A general description of the parameters which must be input interactively tothe ore reserve programs, is given in the DEFINITION OF ORE RESERVES PARAME-TERS (Section 9.0).

INTRODUCTION
INTERACTIVE ENTRY OF PROGRAM CONTROLS AND PARAMETERS (Section 10.0) reviewsthe method used by URAD for entering program parameters interactively (i.e.during program execution) on the console.
P r e l i m i n a r y steps required before running an ore reserve program are re-viewed under GENERAL PROCEDURES FOR RUNNING THE ORE RESERVES PROGRAMS (Sec-tion 11.0). Also described is the interactive entry of those parameterswhich are standard to all programs.
The ore reserve calculation programs RESUV (Section 12.0), ORSAC (Section13.0) and SCOR (Section 14.0) are described in detail. These sections in-clude: the concepts and operational features of each program; detailed in-structions for running the programs; and sample output from test cases.APPENDIX A (Section 15-0) describes the concepts used in the GAMLOG methodof interpreting borehole radiometric data and is excerpted from RME-1^5(Section 1 .2) .APPENDIX B (Section 16.0) is a l i s t i n g of f i l e 'STARDAT1, a test primarysample data f i l e containing a set of actual gamlog data which are i d e n t i f i e dfor a f i c t i t i o u s property.APPENDIX C (Section 17-0) contains a test run and output l i s t by the URDATprogram from test data contained in the supplied diskettes.Section 18.0 contains an index of terms which, it is hoped, w i l l be usefulto the user of the URAD system.
1.5 TEXT NOTATIONS. SYMBOLS. AND ABBREVIATIONS
1.5-1 General Notations and Symbols- Single quotes (' ') are used only when referring to data (in a UCON f i l e )which s p e c i f i c a l l y require enclosing s i n g l e quotes as part of the actualdata entry.- Double quotes (" ") may be used for new or "colloquial" terms, types ofdata elements, and descriptions of codes and actual data entries. However,double quotes are never part of any actual data either in f i l e s or as inter-active entries.- U n d e r l i n i n g ("_") is used to indicate a blank (character) when g i v i n g ex-amples of alphanumeric fields.- Bold Face is used for h i g h l i g h t i n g terms or phrases, or for warning com-ments .- Percent is denoted by "%".- A small "*" in equations denotes multiplication.- A slash "/" in equations denotes d i v i s i o n .- A plus "+" in equations denotes addition
INTRODUCTION
- A minus "-" in equations denotes subtraction.- Two asterisks "''»'t" in equations denote exponentiation (power).- "{ < (--) > }" in equations denotes hierarchy of operations.- "Alphabetic" characters refer to the letters "A" through "Z".- "Alphanumeric" characters refer to the entire A S C I I character set, includ-ing numbers, characters, and special characters (but not "alternate" charac-ters) .- A program "RUN" is the complete processing of all the blocks and file s de-fined in a UCON f i l e . A RUN begins with the entry of the program name andends when all blocks in the UCON f i l e have been processed and program oper-ations completed.- A "block pass" is the complete processing of one block of data as definedby a UCON f i l e .
A "default" value or f i l e name is one which w i l l be used in a program RUNif some optional value or name is not supplied.- AH data currently used in the program are in the "English" weight / meas-ure system; one ton = 2000 pounds.
1.5-2 Notation in F i e l d Descriptions for UDAT FormatsA "field" is the location on a record in which a particular data element isplaced. In fixed-field formats such as required by the UDAT files, a f i e l dis specified by the column numbers of the record. In par t i any-free-formatrecords such as in the UCON (partially) and RNGTBL fi l e s , it may be referredto by its position with respect to a specific code and/or to other fields.The following field notatation is used in t h i s text:- "C" denotes "column" and the number following "C" is the exact column num-ber of a field in a given record; when a field consists of more than onecolumn, the first and last columns are enclosed in parenthesis; example"C(5-8)" means "columns 5 through 8", "C22" means "column 22".
"D" denotes the number of places to the left of the last column of a nu-meric f i e l d at which an assumed decimal is positioned; example "D = 2" meansthat a decimal is assumed 2 places to the left of the last column of thefield ("one place to the left" means "immediately to the left").- "E" denotes the type of data entry, either "A", "N", or "B", where,- "N" denotes "numeric, i.e. the numbers "0" through "9". Unless a "D"(above) is specifically mentioned, no decimal is assumed.- "A" denotes alphanumeric data unless otherwise specified.

INTRODUCTION
Note: The spécial notations described above should not be confusedwit h actual codes used as data.
1.5-3 Abbreviations in Text and I l l u s t r a t i o n sThe following are abréviations used throughout the text:
Blk = blockBLTH = bottom l i t h o l o g i e u n i tBOTEL = bottom elevationCE-fields = entries in columns 13 through J2 of
continuation recordsCoord. = abbreviation for coordinatesCPS (cps) = counts per secondsCu. = cubic (**3)DT = dead timeElev. = elevationFmt. = formatFt. = feetgrd. = gradeLOGe = logorithm to the base emax. = maximummin. = m i n i mummng. = mi ni ngms = microsecondsMV = maximum valuePITBT = depth to pit bottomsec = secondssq. = square (**2)thk. orthick. = thicknessTLTH = top l i t h o l o g i e unitTOPEL = top elevationtot. = totalyd (s) = yard (s)
1.6 URAD BENCHMARKS
Please note that benchmarks for all programs are contained in the supplieddiskettes and include input and output results. Please compare the resultsof the benchmark input data with each of these f i l e s to assure correct oper-ation.

O V E R V I E W OF URAO SYSTEM
2.0 WfRVIEk OF THE ÜRM SYSTEM
2.1 OVERALL STRUCTURE
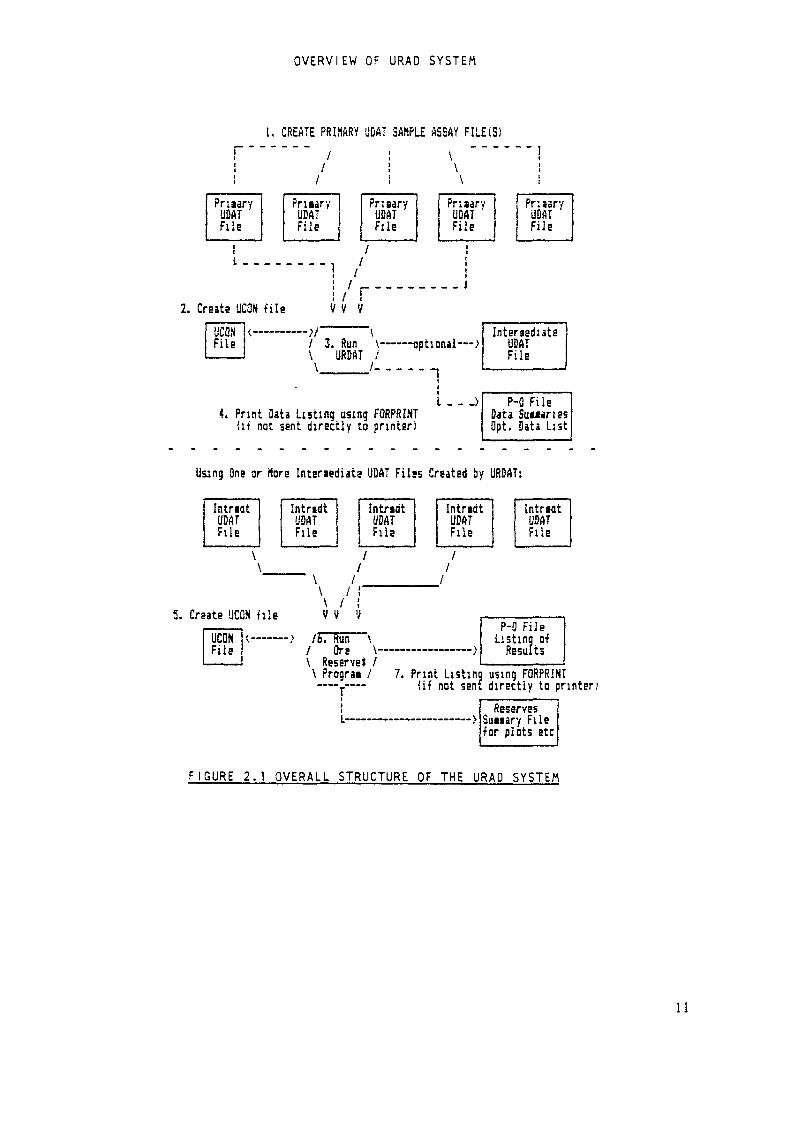
The overall structure of URAD is charted on Figure 2.1.
2.1.1 Processing Primary Data F i l e sThe system for storing the basic uranium sample assay data (Section 3-0)used in URAD is termed "UDAT" (Sections k.Q, 5.0, & 6.0) and requires thedata to be established in UDAT files in one of several "standard" formats.Basic data may be entered (Figure 2.1, step 1) into the UDAT files from thekeyboard, or by "automatic-digitizing" procedures, and are stored perma-nently in Primary (basic) UDAT files. UOAT files may be on hard or floppydisk. If data already exist on some medium (ex: floppy disk) which is com-patible with the microcomputer hardware system but are not in the formatsrequired by the UDAT system , they may be entered into a UDAT f i l e by writ-ing a "con version" program which w i l l arrange them in one of the UDAT for-mats .UCON F îles (Section 7-0) are small temporary f i l e s (Figure 2.1, step 2) cre-ated to provide instructions for selecting, editing, and submitting to URDATany of the data from one or more primary UDAT files. They are also created(step 5) to provide s i m i l a r instructions relating to the intermed iate UDATf i l e s used as input to the ore reserves programs. When so used, they serveto define the blocks (Section 7-1-2) for which reserves w i l l be calculated.A UCON f i l e must be available each time any one of the four main programs isrun and w i l l apply to one specific RUN only. However, the same UCON f i l ecould be used with each of the reserves programs if the ap p l i c a b l e sampledata were to be identical.Program URDAT (Section 8.0) processes (Figure 2.1,step 3) the primary UDATfiles to:1. Create output l i s t i n g and data summaries (see print-ouput f i l e , below).2. Carry out any required interpretation of radiometric data, using theGANLOG (Section 15.0) method.3. Create standardized Intermediate UDAT files which are used for data inputto the RESUV (Section 12.0), ORSAC (Section 13.0), or SCOR (Section 14.0)ore reserve programs. These intermediate f i l e s may be saved or deleted atthe option of the user. During a single URDAT RUN, any number of primaryUDAT files may be processed but only one intermediate UOAT f i l e may be cre-ated.
2.1.2 Ore Reserve Calculation ProgramsThe ore reserves calculation programs -- RESUV, ORSAC, and SCOR — are eachrun independently (Figure 2.1, step 6). Each utilizes an appropriate UCON
OVERVIEW OF URAD SYSTEM
f i l e to obtain sample data from the intermediateof such files may be processed in one block pass
UDAT f i l e s , and any number(and during one RUN).
The reserves programs carry out the ore reserve calculations and create out-put l i s t i n g s of the results (see print-output f i l e , below).
Program SCOR optionally creates "USUM" f i l e s which contain summaries of theore interval analysis on a given set of data under a given set of physicaland economic criteria.
2.1.3 Print-Output F i l e s
Print-output ("p-o") fi l e s (Section 8.2) are those f i l e s (excluding theintermediate UDAT files) on which output of results from the various pro-grams w i l l be placed. P-o f i l e names are assigned interactively at the startof program execution. If the printer is designated as the p-o f i l e , then theresults are printed directly on the printer during program execution. Ifsome other f i l e is designated, then results must be printed separately, (af-ter program execution is completed) using the u t i l i t y program FORPRINT (Fig-ure 2.1, steps 4 & 7; Section 8.2.3).Since a variety of print control commands not standard to FORTRAN are sentto the printer in URAD, program RESTPRN (Section 8.2.3-1) is provided to re-store the printer to standard if a RUN is abnormally aborted w h i l e printingis taking place. Section 8.2 provides detailed information on p r i n t outputopt ions.
2.2 URAD FILES
2.2.1 Working F i l e Name Protocol
UDAT, UCON, and print-output p-o f i l e s may be considered as "working files".Any names may be assigned to URAD working f i l e s , providing they follow DOSconvention; however, a f i l e name may not be referenced by more than 15 char-acters. This allows the inclusion of a device name d: but not directory orsubdirectory names. Examples of URAD working f i l e names are "FILENAME","A:FILENAME", "FILENAME.DAT", "A:F ILENAME.BlN".
The naming, saving, backup, transfer and/or deleting of any URAD f i l e s isleft entirely up to the user, except that URAD does provide default namesfor the UCON f i l e and print output f i l e to be used in a run.URAD does not automatically provide filename extensions .xxx to f i l e namesassigned by the user. If extensions are used, it is suggested that the ex-tension ".DAT" be given to primary UDAT f i l e s , and ".B" or ".BIN" to inter-mediate UDAT file s .
2.2.2_File LocationWhen UDAT or UCON f i l e s are entered interactively during program execution,they must always be available either in the current working directory of thedefault drive, if no device name is provided, or in the root directory of
OVERVIEW OF URAD SYSTEM
the specified disk, if a reference device name is included. S i m i l a r l y , p-of i l e s w i l l be created or accessed either in from the working directory ofthe default drive or the root directory of a specified disk.F i l e "RNGTBL" is a special f i l e ; when needed (Section 5.2.1.2), it must al-ways be in the current working directory of the default drive.
2.2.2.1 Hard Disk AvailableWith a hard disk, it is most convenient to keep the ,EXE modules, the work-ing files, and RNGTBL all in one directory -- always using it as the workingdirectory when running the programs. Any available additional disk drivesmay be used as optional working f i l e storage.Optionally, the .EXE f i l e s may be in one directory example: "URX" and theworking f i l e s and RNGTBL in another example: "URW" . Then, DRW may be usedas the working directory and the .EXE modules may be accessed by first issu-ing the DOS command "PATH \LJRX" (or setting the path in an autoexec batchf i l e ) .To run any of the programs, simply issue the DOS program execute commandi .e. type the program name & press RETURN ,
2.2.2.2 Hard Disk Not AvailableWith a single or dual floppy drive (but no hard disk) system, the ".EXE"modules may be kept on one set of disks, and other disks used to hold theworking f i l e s -- in the disk root directory.
To run a program (after booting the system), si m p l y enter the disk contain-ing the desired program .EXE module into the default drive and issue the DOSprogram execute command . When the console monitor message to specify f i l e"OUTPUT" appears, remove the program disk and enter the disk(s) containingthe required UCON f i l e and primary or secondary UDAT fi)e(s), or, for pro-gram FORPRINT, the p-o f i l e to be printed. If URDAT is being run, the diskin the default drive must contain f i l e RNGTBL (if needed).
2.2.3 F i l e s included with GuideThe following files are included with this Guide.
2.2.}'! Program Execute ModulesExecute modules compiled for use with a mathematics co-processor are:URDAT.EXE, RESUV.EXE, ORSAC.EXE, SCOR.EXE, FORPRINT.EXE, and RESTPRN.EXE.
For use in a microcomputer system lacking a math co-processor, the above areoptionally avallable as: URDAT2.EXE, RESUV2.EXE, ORSAC2.EXE, SCOR2.EXE,FORPRIN2.EXE, and RESTPRN2.EXE.
2.2.J.2 FORTRAN Source ProgramsFORTRAN source code is available for URDAT, RESUV, ORSAC, SCOR, FORPRINT,and RESTPRN.

OVERVIEW OF URAD SYSTEM
2.2.3.3 Test UDAT Primary Data Files
GAMDAT examples of the various primary data formatsGAMDATV for testing bimodal (uranium and vanadium) formatSTARDAT 230 sample sets from a hypothetical uranium depositSTARDATL for testing l i t h o l o g i e data
2.2.3.4 Test UCON files
UCON1 use for test URDAT RUN on f i l e GAMDATUCONL use for test URDAT RUN on f i l e STARDATLUCONS use for test URDAT RUN on f i l e STARDATUCONV use for test URDAT RUN on f i l e GAMDATV
2.2.3.5 Test UDAT Intermediate Data FiJes
STARDATL.8 created by running URDAT using UCONLSTARDAT.B created by running URDAT using UCONSGAMDATV.B created by running URDAT using UCONV
10
O V E R V I E W OF URAD SYSTEM
t. CREATE PRIMARY UDAT SAMPLE ASSAY FILE(S)r /Priaary PruarvUDAT UDATFile File
tL-"-----1
\\\Priaary PriaaryUDAT UDATFile File1
1' r _ _ _ _ _ _ _ . j
I
iiii
Pr.saryUDATFile
2. Create UCQN f i l e v v vI 3. Run \ ——— optional — >\ URDAT /
4, Print Data Listing using FQRPRINT(if not sent directly to printer)L _- _>
Using One ar More Intsnediata UDAT Files Created by URDAT:
? Ib. R u n \/ Ore \-\ Reserve! /
5. Create ÜCON file
\ Prograa / 7. Print Listinn using FQRPRINT——,.—— (if not sent directly to printer;iiii.»••_._—«_.«««,«««••..«•«,
F I G U R E 2.1 OVERALL STRUCTURE OF THE URAD SYSTEM
11
REVIEW OF URANIUM SAMPLE DATA
3.0 REV I Eh OF URAfHUM SAMPLE Off A
3.1 GENERAL
When the u t i l i z a t i o n of computers as an aid to ore reserves analysis isfirst introduced to any in d i v i d u a l or organizational entity, prime interestis usally focused on the ore reserves computations themselves. The main con-cerns are technical justification, r e l i a b i t y of results, the advantage ofone particular method over another, computational speeds, the form of out-put, and so forth. However, once the computer is adopted as a working tool,the users invariably find that the handling of data begins to occupy a seem-ingly disproportionate amount of their time and effort. As the computeru t i l i z a t i o n increases and the amount of data grows larger, more and morework is expected of the computer, and attendant data manipulation becomesincreasingly d i f f i c u l t and complex.Data entry and storage are a common facet of all computer applications. Inthe working environment, data associated with minerals, especially uranium,presents some unique problems:1. There is great diversity in type, collection method, and form of data.2. There are a considerable number of ways the data may be used.3- The data do not generally lend themselves to e a s i l y available standarddata base management systems.For an i n d i v i d u a l or group desiring the f l e x i b i l i t y of handling any type ofdata which may become available, there is a major benefit in establishing astandard data system which w i l l contain all the information needed but, atthe same time, is not unwieldy and may be easily accessed.The following discussion of the URAD data system is therefore intended notonly as a guide to running the programs themselves, but also as a forewarnerof future needs and problems which may be encountered by the user in the de-velopment of any mineral sample data base.The system itself is, to some extent, a "holdover" from the punch-card/magnetic tape environment (and associated data reduction methods) which pre-vailed in the 19eO's and 1970's. Sample data are i n i t i a l l y entered from theconsole keyboard and stored in 80-column records, and strict rules on dataformat apply. However, word-processing systems currently available for usewith microcomputers greatly fa c i l i t a t e the entry, edit, and l i s t i n g of thedata. If applicable data already exist in "machine-readable" form (Section3 - 3 - 1 ) , they may be converted to the required formats.The automatic d i g i t i z i n g of data from gamma-ray log strip charts also pro-vides a relatively quick method of enetering data into the files. Specifictechniques for such procedures are not discussed in this guide, as they de-pend to a large extent on the equipment employed. However, the parametersand coding systems required by URAD for such d i g i t i z e d information are detailed in Sections 5-0 & 6.0.
12

REVIEW OF URANIUM SAMPLE DATA
The next step up from the current URAD system would be one which allowedinteractive entry of basic sample data and stored these data in a more com-pressed form. However, it would be easy to convert both the UDAT primary andsecondary f i l e s to any other data base system
3.2 URANIUM SAMPLE DATA USED IN URAD
3.2.1 Definitions Used in Guide Relating to Sample DataThe general term sample as used herein refers to a linear extent of some ma-terial and its corresponding representative mineral content. In this Sec-tion, and Sections k, 5. & 6» the term sample assays refer directly to thepercentage or "grade" of a "mineral" (actually a specific element or com-pound) in the total material, as determined through laboratory analysis. Theminerals applicable to URAD are uranium (U, with grade generally expressedto the nearest 1000'th of 1 percent U308) and vanadium (V, with grade ex-pressed to the nearest 100'th of 1 percent V205)•Chemical uranium assays refer to assays for which an estimate of the actualgrade has been made either directly or indirectly; this would include chemi-cal, fluorometric, or neutron-activation, analyses. Radiometrie (or"radiometric-equivalent") assays are those based solely on observed radi-ation (usually gamma-radiation) with the assumption that the representeduranium and its daughter products are in radiometric equilibrium (see Sec-tion 3 - M - ( In the sections describing the ore reserve programs, the term"assays" is used generically for all sample data.)Sample readings refer to numeric values from which sample grades may u l t i -mately be determined.Each sample consists of a sample interval which is defined by thickness infeet, and mineral grade — either an actual grade (example: percent U308) ora "reading". In the latter case, the factors required to make the estimateare included in the sample description (below).
3.2.2 Sample SetsSamples suitable for effective use in ore reserves analysis are usuallygrouped in approximately linear "sets", each set consisting of one or moresamples. A sample set includes a description, i.e. one or more symbolicidentifiers (hole number or sample number, property number) and sufficientinformation to accurately assign any sample in the set to a position in somethree-dimensional coordinate reference system. A single "point of origin"suffices to establish this if the set is vertical. If the set is not verti-cal, then additional information must be provided as to its direction fromthe origin point.Examples of sample sets are: a series of core samples from a bore hole; aseries of samples from one total channel sample; measurements of radiometric"counts-per-second" from a bore hole.A sample set may be further characterized by geologic environment.
13
REVIEW OF URANIUM SAMPLE DATA
A data set is s i m p l y a group of sample sets which have some generic common-a l i t y from the user's point of view. A data file is a s p e c i f i c a l l y named DOScomputer f i l e containing sample set data in structured form.
3-2.3 Uranium Sample DataThe basic sample data used in uranium ore reserves calculations consistmai ni y of :1. Radiometrie data from logs of surface or underground boreholes.2. Interpretation of the actual uranium values represented by the above.These may be in the form of: 1) values at equal spacing along the borehole;or, 2) interpretations of thickness and average grade of total anomalies.3. Chemical or radiometric assays of core or cuttings from boreholes.4. Chemical or radiometric assays of representative samples of materials(example: "channel" samples) from mine workings.5- Radiometric or "direct" measurements from "face-scanning" in mine work i ngs.
3.3 BOREHOLE RADIOMETRIC LOGGING DATA
The term "borehole radiometric logging" refers to the act of measuring theamount of radioactivity received by a sensor moving along a borehole; and a"radiometric log" (or "gamma log") is the resulting record of the radio ac-t i v i t y measurements. Such measurements are termed "borehole radiometric log-ging data", or simply "gamma-log" data.For this section, and other sections dealing with gamma-log data, it w i l l beuseful for the reader to refer to Section 17.During the past 35 years, there has been considerable evolution in the methods of both handling and "interpreting" such data, i.e. estimating the uran i urn grades represented by them. These methods have progressed from paper-and-pencil recording and simple factoring of i n d i v i d u a l values read fromhand-driven instruments to direct recording of computer-calculated uraniumestimates directly onto magnetic tape in sophisticated mobile logging units.Since gamma-log data are not always immediately available in the most up-to-date or advanced form to those responsible for reserve calculations, a briefreview is warranted of the various forms in which they may be received.The term "readings" refers to measurements of the radioactivity at given po-sitions in the borehole recorded either directly during the logging proce-dure or subsequently measured from the continuous curve representing theradiometric amplitude on a printed "strip" log (Section 3 - 3 - M - Readings arealmost always taken at regular, consecutive intervals, usually 0.5 or 1.0feet along the length of the borehole. Readings may be in counts-per- second(cps) or in inches-of-deflecti on (when measured from a "strip" log).
14

REVIEW OF URANIUM SAMPLE DATA
URAD uses the "GAMLOG1 method (Scott,1963) described in Section 15 to interprêt such data.The term "interpreted" refers to gamma-log data for which an estimate ofuranium content has been made. "Uninterpreted" refers to gamma-log data re-q u i r i n g further processing to obtain an estimation of the uranium contentrepresented by the data."Descriptive" data which must be provided along with uninterpretedradiometric logging data from any borehole are: 1) the K-factor; 2) the ap-p l i c a b l e attenuation factors; 3) the dead-time correction factor; k) the in-terval at which the readings were taken; 5) the depth from the top("collar") of the borehole at which the first reading was taken; 6) thedepth to any natural water and/or d r i l l i n g f l u i d standing in the hole at thetime the log was made, as well as information on hole casing, ifappplicable. These factors are important since they must also be entered asdata with each sample set of gamma-log data (Section 5-3) in the UDAT files.In the following summary of the most commonly available types of gamma-logdata, brief reference is made to the format (s) used in entering them in theURAD data files. These formats are described in detail in Section 6.
3.3.1 Pirect "Readout" to Machine-Readable MediaAs of this date, "state-of-the-art" radiometric logging units in commercialuse record (or "read out") radiometric readings, in "counts-per-second"("cps") directly onto a "machine-readable" ("computei—readable") medium —usually magnetic tape. Some even have the capability of interpreting andconverting the readings to estimated uranium values during the actual log-ging process. During the early 1980's, logging sensors were developed tomeasure the actual uranium content in boreholes, but these methods have notyet been put into widespread commercial use for uranium exploration theUnited States.In order to u t i l i z e data on magnetic tape without intervening manual tran-scription, the microcomputer must either have an interface with an appropri-ate magnetic tape drive or reader, or the data must be "down-loaded", on adifferent computer, to a medium (floppy disk, hard disk, or other) which iscompatable with the given microcomputer system.
A u t i l i t y program may be easily written to convert such data (or any otheruranium sample set data which is not in the UDAT form) to the required UDATformats. During the period when the precursor to the URAD system was in fulloperation, this type of situation was the rule rather than the exception. Itis far easier to convert such data to one of the UDAT formats than to writean input program such as URDAT for each new format type that is encountered.A discussion of the methods involved in the above processes is outside thescope of this guide.
3.3-2 Direct Readout to Printed MediaCps readings recorded during the logging process are sometimes printedrectly on to paper tape or are printed from magnetic tape. Such data m
di-may be
15

REVIEW OF URANIUM SAMPLE DATA
intered into the UDAT f i l e s using the "FID" borehole log format (Section6.3).
3.3.3 Interpreted ValuesL i s t i n g s of estimated uranium values based on interpretations made by someother computer are sometimes a v a i l a b l e from the logging company or someother source. These may be entered into the UDAT files using the "FnQ"borehole format (Section 6.3) or the "contiguous" format (Section 6.1).
3.3.^ Readings from Printed Radiometric S t r i p LogsThe term "printed radiometric strip log" or "strip log" is used in thisguide to describe the continuous curve automatically drawn, usually by penand ink (stylus) on scaled chart paper, to represent the amplitude of radioactivity measured in the borehole during logging procedures. The general de-f i n i t i o n of the strip log includes the chart paper and associated background material as w e l l as the curve i t s e l f . If direct readout of cps, onsome readable medium, is not a v a i l a b l e , then the printed radiometric s t r i plog provides the only source of data by which to estimate the radioactivityand corresponding uranium content represented in the borehole.Two types of uninterpreted readings may be taken at points along the contin-uous radiometric amplitude curve on a strip log.
1. "Inch-Deflection Readings" are measured from the base l i n e of the log tothe radiometric amplitude curve either by hand or by automatic " d i g i t i z i n g "methods. These are entered into the UDAT f i l e s using the "A-E.I" or " F l l "borehole log formats. If they are automatically d i g i t i z e d onto microcomputerdisk then a si m p l e " u t i l i t y " computer program can be written to convert thedata into the "A-E,1" or " F l l " formats.2. Transparent overlays may be designed to allow the reading of points alongthe amplitude curve in terms of cps, either uncorrected or corrected fordead time. Such readings are entered using the "Fill" or "F1C" formats.In either case, if hand/overlay methods are u t i l i z e d , the readings candirectly transcribed into the data f i l e s using the console typewriter.
be
3-3.5 Total AnomaliesIf a computer is lacking to interpret i n d i v i d u a l readings taken on a 0.5 or1.0-foot basis, the total thickness and average grade represented by totalanomalies may be estimated from printed logs or from tabulations of cpsreadings using the method described in Technical Report Series No. 259."Practical Borehole Logging Procedures for Minera! Exploration with Emphasison Uranium", I A E A , 1986 (Section 1.2.2). Further reading on the subject pub-lished by the I A E A is Technical Report Series No. 212, "Borehole Logging forUranium Exploration", IAEA, 1982.Section 17) Uranium values estimated in this manner are most easily enteredinto the UDAT f i l e s by using the "non-contiguous" format (Section 6.2).
16

REVIEW OF URANIUM SAMPLE DATA
3-3.6 Inch-Deflection vs Counts-per-Second ReadingsIn the current URAD format system, inch-deflection readings are assumed tobe recorded to the nearest one-hundredth of an inch. When the radiometriccount rate exceeds around 50,000 cps, there is a minor, but noticeable d if-ference in the interpreted U308 values derived from actual cps and those de-rived from the cps calculated by: cps=inches-def1ection x cps/inch, where,cps/inch is based on the appropriate logging range scale. This may be ob-served in f i l e "GAMDATX" contained in the supplied diskettes, by comparingthe high grade values of sample set "TEST 4" with those in "TEST 6" (seealso comments in Section 5-4) .The effect is simply caused by the difference in the number of possible sig-nificant d i g i t s in the cps readings as opposed to those available in thecombination of inch-deflection and range-scale values; the latter has less.
in practice, it was found fu t i l e to attempt to d i g i t i z e readings to thenearest 1000th of an inch from strip-logs, since the stylus trace of theradiometric amplitude curve has a width generally greater than 100th of aninch. However, if it were desired to record to the nearest 1000th of aninch, then a new format, say, "i" (instead of "I") could be added to allowfor the extra d i g i t in the continuation record CE-fiefds.
3. A RADIOMETRIC DISEQUILIBRIUM
3.4.1 General Concepts,The uranium occurring in a deposit may be out of e q u i l i b r i u m with respect toits daughter products. The deposit may be so recent that e q u i l i b r i u m has notyet been reached, or it may have been reached in the past and since then thedeposit may have been subjected to processes which have caused the uraniumand/or the chief gamma-giving products (chiefly radium 226) to be prefer-e n t i a l l y removed, at least locally.For such deposits, it is necessary to adjust radiometric values to obtainthe best approximation of representative uranium grade."Equivalent-radiometric" assays and interpretations of borehole logradiometric data are most commonly subject to such adjustment. Anequivalent-radiometric assay is defined as an assay which is made to deter-mine uranium content but is based on measurements of the gross count gammaradiation from the daughter products; the resulting estimate of the uraniumcontent must assume that the uranium and its daughter products are in equi-1 i b r ium.Normally, during the course of evaluating a deposit, as many samples (repre-sentative of the deposit) are taken as considered neccessary and are ana-lyzed for both chemical and radiometric-equivalent grade. Comparisons aremade of the resulting values to determine the ratio of the chemical to theradiometric grades. Simple arithmetic averages of uraniumtradiometric ratiosdo not always suffice for adjustment purposes. The ratios are often notstraight l i n e functions, and different portions of the same deposit may becharacterized by different di s e q u i l i b r i u m relationships. Oxidized portionsoften favor the radiometric values, and, conversely, the quantity of uranium
17
REVIEW OF URANIUM SAMPLE DATA
in unoxidized or enriched portions is often not completely reflected by theradiometric values.Accordingly, it is useful to: classify such sample assay data accordingtheir local geologic environments; to fit values from selected classes toseveral functions using statistical methods such as regression analyses;and, of course, review the "goodness-of-fit" of the derived coefficients.In order to obtain v a l i d results, a complete spectrum of grade values mustbe represented in each class. Functions which have proved useful are:
Y = A + BX + CX**2 + OX**3 + EX**4 (1)LOGe Y = A + B x LOGeX (2) andwhere,X = observed radiometric value,Y = predicted chemical value,A, B, C, D, E are coefficients.
Application of Disequilibrium Correction Coefficients
corrections (Fig-URDAT to create
If d i s e q u i l i b r i u m coefficients have been determined, they may be a p p l i e d toradiometric data in the UDAT f i l e s as explained in Section 7-6.6. All sampledata are coded as to whether or not they may be subject toure 5-1). Corrections may be applied when running programintermediate UDAT files, or they may be applied during the processing of theintermediate f i l e s by one of the ore reserves programs. The latter method isrecommended since once the corrections have been made by URDAT, no furtherchanges should be applied when processing the intermediate f i l e s .
18
UDAT SYSTEM: GENERAL F I L E STRUCTURE
4.0 UOff SYSTEM — PRIHMY (BASICI FILES. GENERAL STRUCTURE
In URAD, all sample data are stored as linear sample sets, as defined above,regardless of their type and o r i g i n , and are contained in standard DOS filesherein termed "UDAT" (Uranium, DATa) files.Sample data are first entered and stored in UDAT primary ("basic") files(Section 4.1) which are in the "sequential, formatted" mode and consist ofrecords having a maximum length of 80 characters each. The data may beentered according to one of several formats.Program URDAT (Section 8.0) processes the primary f i l e s and creates UDATintermediate files which are completely standardized and are in the"sequential, binary" mode. The intermediate files are used as input to theore reserves programs.There is no l i m i t to the number of UDAT f i l e s or the number of sample setsw i t h i n either a primary or intermediate f i l e except those imposed by theconstraints of the microcomputer system itself. UDAT f i l e s may reside onhard disk or floppy disk and may be given any DOS-compatible f i l e names.F i l e size is l i m i t e d to the available capacity of the disk involved.This Section, and Sections 5 & 6, describe the attributes of the UDATprimary data files. The intermediate f i l e s are described in Section 8.5-
Note: Program URDAT is designed so that additional format typesmay be added to the URAD system if needed.
4.1 PRIMARY UDAT FILES
All sample data in a primary f i l e is entered according to "fixed-field"formats in accordance to prescribed rules, but unformatted text is alsoallowed. No records may be greater than 80 columns (characters). Samplesets w i t h i n a given f i l e may consist of any of the UDAT sample types, i.e."contiguous", "contiguous bimetal", "non-contiguous", "A-E", or "F"; anddifferent types may be included w i t h i n the same f i l e .
*t.1.1 Test Primary UDAT F i l e sFour test primary UDAT sample assay fi l e s are included with this guide. Theymay be easily scanned by using available word-processing programs.
4./././ Test File GAMDA7Test f i l e "GAMDAT" contains examples of all the formats. A l i s t i n g of f i l e"GAMDAT" is shown on Figure 4.1a-b. If program URDAT (Section 8.0) is runusing test f i l e "UCON1" as the UCON f i l e , the variables listed in thedesignated print-output from the RUN (Appendix C) may be compared to
19
UDAT SYSTEM: GENERAL F I L E STRUCTURE
those in Fi g u r e 4.la (part 1) and 4.1b (part 2) (see also Sections 3.3.6and 5-4) •
4. I.!. 2 Test File STARDATFigure 4.2 is a partial l i s t i n g of test f i l e "STARDAT" which consists of 230actual sample sets in the "Fill" format. The results of running URDAT onthese sets is shown on Append!< C. This f i l e is used to illustratemany of the features of the URAD programs.
U.1.1.3 Test File GAMDATVFigure 4.3 is a partial l i s t i n g of test f i l esets in the "V" format (both uranium andis used in describing program RESUV.
"GAMDATV" which contains samplevanadium assays). F i l e GAMDATV
U.l.l.k Test F/le STARDA7LF i l e "STARDATL" consists of selected sample sets, from the STARDAT primaryUDAT f i l e , to which have been added hypothetical l i t h o l o g i e records (Section6.4). It is may be used to test the l i t h o l o g i e edit features of the UCONsystem (Section 7-6.4).
4.2 FORMATTED DATA
4.2.1 Sample Set Record TypesA UDAT f i l e consists s i m p l y of data from one or more sample sets, with eachset comprised of a header record and, optionally, continuation records.Every sample point to be recognized in the f i l e s must be represented by aheader record, but continuation records are not required if the intervalrepresented by the sample point is considered devoid of sig n i f i c a n t mineralcontent ("barren"). Lithologie and directional data records may,optionally, follow the continuation records (or the header record, if thereare no continuation records. The organization of the sample sets listed inFigure 4.1 is described by the comment records ("C" in column 1).There are l i m i t s to the number of continuation records w i t h i n a sample set;these are defined in the discussion of the in d i v i d u a l UDAT formats (Section6.0) .
k.2.1.1 Header RecordsThe very first record of any sample set consists of an identification or"header" record containing the descriptive information and , if required,gamma-log interpretation parameters. The point of o r i g i n is referenced bytwo coordinates and an elevation (see Figure 6.1). Each header record mustcontain a primary "sample-type" code in column 13; subsidiary sample-typecodes may be required in columns 14 and 15- The sample-type codes define
20
UDAT SYSTEM: GENERAL F I L E STRUCTURE
both the type and format of the data w i t h i n the given sample set. (Someheader records may also contain sample data.)If the sample set is considered "barren", i.e. there are no continuationrecords, the interval of "barrenness" is assumed to be between the referenceelevation and the "total depth sampled" (Section 5-2.7).
4.2.J.2 Continuation RecordsOne or more continuation records containing sample intervals andcorresponding grades may follow. Each sample interval is represented by athickness and mineral grade value.For borehole log data, the sample interval thicknesses are all the same, andthe value of the interval is entered on the header record. For intervals ofbarren material between anomalies, only the thicknesses are included; thegrade of such intervals is assumed to be negligible.
b.2.1.3 Lithologie RecordsOne or two records containing "lithologie" (geologic) information (Section6.1+) may follow either the last continuation record of a sample set or theheader record (see *NOTE). Lithologie records all have the same format,regardless of the format of the header and continuation records.
Note: if a given group of samples sets have been characterizedwith l i t h o l o g i e information, a barren sample set in that groupmust also contain applicable lithologie data, or else it w i l l beignored completely in a RUN when l i t h o l o g i e edit control is used.
4.2.?.4 Directional Data RecordsOne or more records containing information on the direction and attitude ofthe linear sample set may follow the last l i t h o l o g i e record, the lastcontinuation record or the header record. If the information is not present,the sample set is assumed to be vertical. Directional data records all havethe same format, regardless of the sample set type.
This first version of the guide does not include a description on the foraatand use of directional data.
U.2.2 Format TypesThree basic format types are used:
4.2.2.1 Contiguous FormatThe "contiguous" format is best suited when entering chemical or radiometricassays (from mine workings or borehole materials) from a list of contiguous
21
UDAT SYSTEM: GENERAL F I L E STRUCTURE
samples recorded without regard to m i n e r a l content. The contiguous formatmay contain uranium assays only ( unimetal ) or uranium and vanadium assays( bimetal).
b.2.2.2 Non-contiguous FormatThe "non-contiguous" format is best suited for transcribing sample data frommaps or tabulations where low-grade samples have already been censored; itis also useful for entering interpretations of "total" anomalies from st r i plogs. It does not provide for vanadium assays.
4.2.2.3 Borehole Log FormatsThe "borehole log" formats are used for entering data derived from contin-uous measurements in boreholes. The "FnQ" format is used to enter inter-preted values; the "A-E" and "FID", "F1C" and " F l l " formats are used fordata which must be a d d i t i o n a l l y interpreted.
4.3 FORMAT-FREE TEXT
In addition to the specific sample set data, general text informationconcerning the f i l e or any sample set may be freely interspersed w i t h i n aprimary UDAT f i l e , as shown in Fi g u r e 4.1. The character "C" in the f i r s tcolumn of any record in a primary UDAT f i l e automatically denotes theremainder of the record as being text information.The "C" must be entered in column 1 of any record which is not in a standardsample set format. If it is not, serious problems w i l l result duringprocessing of the data.No text information is carried over to the intermediate UDAT f i l e s .
22
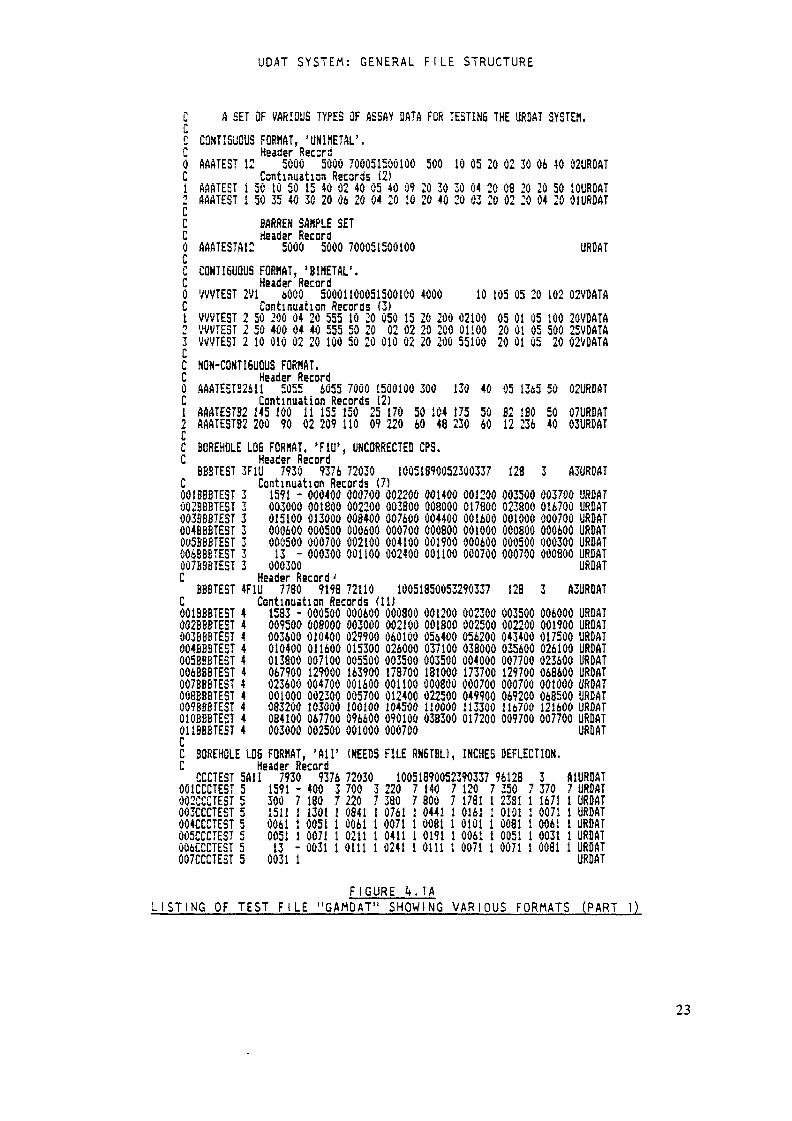
UDAT SYSTEM: GENERAL F I L E STRUCTURE
CCCrw0C1iCCC0CCC0CiT3CCC0C12CCC
A SET OF VARIOUS TYPES OF ASSAY DATA FOR TESTING THE URDAT SYSTEM.CÜNTISüCUS FORMAT, 'UNIilETAL'.Header Rec:rdAAATEST 12 5000 50ÛÛ 700051500100 500 10 Û5 20 02 30 06 40 Ù2URDATContinuation Records (2)SAATEST 1 50 10 50 15 40 02 40 05 40 09 20 30 30 04 20 08 20 20 50 iOURDATAAATEST 1 50 35 40 30 20 06 20 04 20 10 20 40 20 03 20 02 20 04 20 01URDAT
BARREN SAMPLE SETHeader RecordAAATESTA12 5000 5000 700051500100CONTIGUOUS FORMAT, 'BIMETAL'.Header RecordVWTEST 2V1 6000 50001100051500100 4000Continuation Records (3)VWTEST 2 50 200 04 20 555 10 20 050 15 20 200 02100VWTEST 2 50 400 04 40 555 50 20 02 02 20 200 01100WVTEST 2 10 010 02 20 100 50 20 010 02 20 200 55100
URDAT
10 105 05 20 102 02VOATA05 01 05 100 20VDATA20 01 05 500 25VDATA20 01 05 20 Ô2VDATA
NON-CONTIGUOUS FORMAT.Header RecordAAATESTS2611 5055 6055 7000 1500100 300 130 40 05 1365 50 Û2URDATContinuation Records (2)AAATEST32 145 100 11 155 150 25 170 50 104 175 50 82 ISO 50 07URDATAAATEST82 200 90 02 209 110 09 220 60 48 230 60 12 236 40 03URDATUNCORRECTED CPS.
10051890052300337 128 3 A3UROATBOREHOLE LOB FORMAT, 'Fill'Header RecordBEBTEST 3F1U 7930 9376 72030Continuation Records (7)1591 - 000400 000700 002200 001400 001200 003500 003700 URDAT003000 001800 002200 003800 008000 017800 023800 016700 URDAT015100 013000 008400 007600 004400 001600 001000 000700 URDAT000600 000500 Û0060Û 000700 000800 001000 000800 000600 URDAT000500 000700 002100 004100 001900 000600 000500 000300 URDAT13 - 000300 001100 002400 001100 000700 000700 000800 URDATOÔÔ300 URDATHeader Record '
001BBBTEST 3002BBBTEST 3003SB8TEST 3004BBBTEST 3OuSBBBTEST 3ÔÔ68BBTEST 3007BBBTEST 3C EBBTEST 4F1U 7780 9198 72110 10051850053290337 128 3 «URDATC Continuation Records (11)1583 - 000500 000600 000800 001200 002300 003500 006000 URDAT009500 008000 003000 002100 001800 002500 002200 001900 URDAT003600 010400 029900 060100 056400 056200 043400 017500 URDAT010400 011600 015300 026000 037100 038000 035600 026100 URDAT013800 007100 005500 003500 003500 004000 007700 023600 URDAT067900 129000 163900 178700 181000 173700 129700 068600 URDAT023600 004700 001600 001100 000800 000700 000700 Ô010ÔÔ URDAT001000 002300 005700 012400 022500 049900 069200 068500 URDAT083200 103000 100100 104500 110000 113300 116700 121600 URDAT084100 067700 096600 090100 Ô3B300 017200 009700 007700 URDAT003000 002500 001000 000700 URDAT
Ô01BBBTEST 4002BBBTEST 4003BBBTEST 4004BBBTEST 4005BBBTEST 4006BBBTEST 4OÛ7BBBTE5T 4Û08BBBTEST 4009BfiBTEST 4010BBBTEST 4011BBBTE5T 4CC BOREHOLE LOS FORMAT, 'AH' (NEEDS FILE RN6TBL), INCHES DEFLECTION.C Header RecordCCCTEST 5A1I 7930 9376 72030001CCCTEST 5OÛ2CCCÏEST 5003CCCTEST 5004CCCTEST 5005CCCTEST 5OÛ6CCCTEST 5Ô07CCCTEST 5
1591 - 400300 7 18010051890052390337 96128 37 120 7 350 7 370 A1URDAT7 URDAT7 1781 1 2381 1 1671 1 URDAT3 700 3 220 7 1407 220 7 380 7 8001511 1 1301 1 0841 1 0761 ! 0441 1 0161 1 0101 1 0071 1 URDAT0051 1 0061 1 0071 1 0081 1 0101 1 0081 1 0061 1 URDAT1 0071 1 0211 1 0411 1 0191 1 0061 1 0051 1 0031 1 URDAT- 0031 1 0111 1 0241 1 0111
00610051130031 1 0071 1 0071 1 0081 1 URDATURDAT
FIGURE k.]ALISTING OF TEST F I L E "GAHDAT" SHOWING VARIOUS FORMATS (PART 1)
23
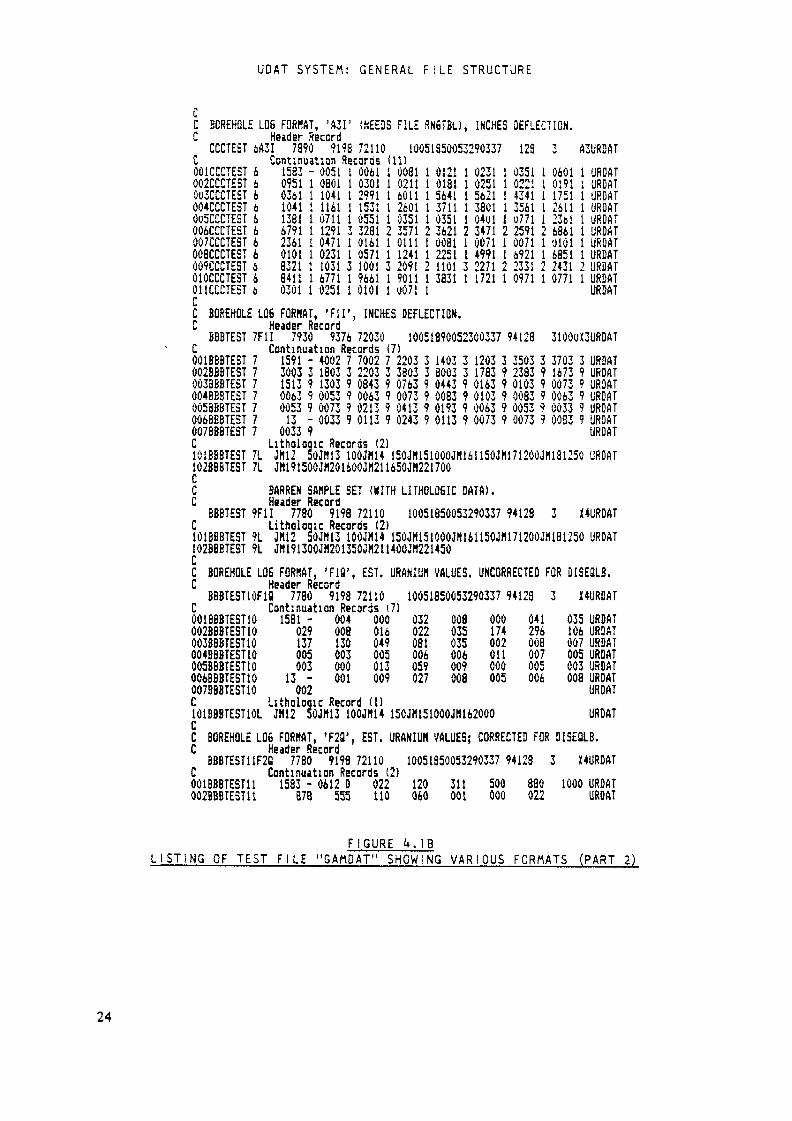
UOAT SYSTEM: GENERAL F I L E STRUCTURE
CC BOREHOLE L05 FORMAT, 'A3I' (NEEDS FILE SN6TBU, INCHES DEFLECTION.C Header RecordCCCTEST 6A3I 7890 919S 72110 10051850053290337 128 3 A3URDATC Continuation Records ill)001CCCTEST 6 1583 - 0051 1 0061 1 0081 1 0121 1 0231 1 0351 1 0601 ! URDftT002CCCTEST 6 0951 1 ÔB01 1 0301 1 0211 1 0181 1 0251 1 0221 1 0191 l URDATOU3CCCTEST 6 0361 1 1041 1 2991 1 6011 ! 5641 1 5621 1 4341 1 1751 1 URDAT004CCCTE5T 6 1041 1 1161 1 153! I 2601 1 3711 1 3801 1 3561 1 2411 1 URÛATÛU5CCCTEST 6 1381 1 0711 1 0551 1 0351 1 0351 1 04üi l U771 1 23bl l ÜRDATOÛ6CCCTEST 6 6791 1 1291 3 3281 2 3571 2 3621 2 3471 2 2591 2 6861 1 URDATOÛ7CCCTEST 6 2361 1 0471 1 0161 1 0111 1 0081 1 0071 1 0071 1 olûl l URDATOÛ8CCCTEST 6 0101 1 0231 1 0571 1 1241 I 2251 1 4991 I 6921 1 6851 1 URDAT009CCCTEST A 8321 1 1031 3 1001 3 2091 2 1101 3 2271 2 2331 2 2431 2 URDAT010CCCTEST 6 8411 1 6771 1 9661 1 9011 1 3831 1 1721 1 0971 1 0771 1 URDATÔÎ1CCCTEST 6 0301 1 0251 1 0101 1 0071 1 URDATCC BOREHOLE LOS FORMAT, 'FIT, INCHES DEFLECTION.C Header RecordBBBTEST 7F1Î 7930 9376 72030 1ÛÛ51890Û523ÛÛ337 94128 31ÛÔOÏ3URDATC Continuation Records (7)001BBBTEST 7 1591 - 4002 7 7002 7 2203 3 1403 3 1203 3 3503 3 3703 3 URDAT0028BBTEST 7 3003 3 1803 3 2203 3 3803 3 8003 3 1783 9 2383 9 1673 9 URDAT003BBBTEST 7 1513 9 1303 9 0843 9 0763 9 0443 9 0163 9 0103 9 0073 9 URDAT004BBBTEST 7 0063 9 0053 9 0063 9 0073 9 0083 9 0103 9 0083 9 0063 9 URDATÔ05BBBTE5T 7 0053 9 0073 9 0213 9 0413 9 0193 9 0063 9 0053 9 0033 9 URDATÔÛ6BBBTEST 7 13 - 0033 9 0113 9 0243 9 0113 9 0073 9 0073 9 0083 9 URDATÔÛ7B8BTEST 7 0033 9 URDATC Lithologie Records (2)101BB8TEST 7L JM12 5ÛJM13 1ÛÛJH14 15ÔJM151ÛÛOJM16115ÛJM17S2ÛOJM131250 URDAT1Û2BBBTEST 7L JM19150ÛJM2Û16ÔOJM211650JH221700CC BARREN SAMPLE SET (KITH LITHOL06IC DATA).C Header RecordBBBTEST 9F1I 7780 9198 72110 1ÛÔ5185ÔÛ5329Û337 94128 3 Ï4URDATC Lithologie Records (2)101BBBTEST 9L JM12 SOJM13 10ÛJM14 15ÔJH1510ÛOJN16115ÛJM1712ÛÛJM18125Û URDAT1Û2BBBTEST 9L JM191300JH2Û135ÛJM2114ÛÛJM22145ÛCC BOREHOLE L06 FORMAT, 'Flu', EST. URANIUM VALUES. UNCQRRECTED FOR OISE8LB.C Header RecordBBBTESTIOF1Ö 7780 9198 72110 10051850053290337 94128 3 Ï4URDAÎC Continuation Records (7)001BBBTEST10 1581 - 004 000 032 008 000 041 035 URDATÛÔ2BBBTEST1Û 029 008 016 022 035 174 296 106 URDAT003BBBTEST10 137 130 049 081 035 002 008 007 URDAT004BB8TEST1Û 005 003 005 006 006 Oil 007 005 URDAT005BBBTE5T10 003 000 013 059 009 000 005 003 URDAT006BBBÏEST10 13 - 001 009 027 008 005 006 008 URDATÛ07BB8TEST10 002 URDATC Lithologie Record (1)1ÔIBBBTEST1ÔL JN12 5ÛJH13 1ÛOJM14 150JH151000JM162000 URÜATCC BOREHOLE L06 FORMAT, 'F2Q', EST. URANIUM VALUES; CORRECTED FOR DISE9LB.C Header RecordBBBTEST11F2Q 7780 9198 72110 10051850053290337 94128 3 K4URDATC Continuation Records (2)001BBBTEST11 1583 - 0612 D 022 120 311 500 880 1000 URDAT002BBBTEST11 878 555 110 060 001 000 022 URDAT
FIGURE k.IBLISTING OF TEST F I L E "GAMDAT" SHOWING VARIOUS FORMATS (PART 2)
24

AAAAAAIAAA2AAA3AAAiAAA5AAAAAAIAAA2AAA3AAA4AAA5AAA6AAA7AAAAAAiAAA2AAA3AAA4AAA5AAAiAAA7AAAAAAAAAiAAA2AAA3AAAAAAAAAAAAiAAA2AAA3AAAAAAAAAAAAiAAA2AAA3AAA4AAA5AAA6AAA7AAA3AAAAAAiAAA2AAA3AAA4AAA5AAA6AAA7AAA8AAA9AAA10AAA11AAA
12AAA
14ZF1Ü143F1Ü1*3143143143H3144F1Ü144144144144144144144145F1U145145145145145145145146F1U147F1U147147147148F1U149F1Ü15ÛF1U150150150151F1ÜÎ52F1U153F1Ü153I57i%JV153153153153}"i30154F1U154154154154154154154154154154154154
120012004045-000430000123000141000014
12003835-OÛ0277000327000027000188000260ÛÔÔÛ2312003790-OOOÖ63000040000252000119000285000021120012003765-0001280000241200120012003470-0007630011021200120014003620-000054000149000467000112000064275 -ÛOOÏ0614003625-000046000141000346000034000168000231000137000092000228000051000239
200400000047000u730001080001090000156000000490002510001891505 -000295000168
80000004500007200005900025700015200021510001200-0000150001380000171400160018000000410007250005222000220020000004800006100014600027800015900011700004900008240000004000004700020900024465 -000056000242000125000090000330000058000 136
2140ÛÔÔ05400089000017900009821450001 080002320001260000520004390001182144000039000101000063000141000107ÔÔÛÔ9621442145000022000253214621442145000046000871000169215021512136000066000059000145000138OÔOÎ430002650000470000672138000054000040000276000189000059000058000208000111000127000288000067000102
0 507 5 1950970 459 527956o7Û00116 000187 ÛÔÔ346001040 OÛ1271 00:366000405 000483 000432000116 000140 Û00116
0 o3S 5 565607000407 001044 001089000193 000167 ÔÛÛ254000094 000118 000095000062 000067 000068000832 000855 000711000092 000094 0000660 426 5 675667000044 OÔÔÎÛÎ 000189000120 000078 000066000055 000069 000076000108 000079 000058000083 000064 000140000072 000099 0000750 507 5 1950970 440 5 665667000036 000051 000050000289 000221 0000520 507 5 1950970 440 5 5856670 400 5 685667000059 000082 000158001304 002356 002541000100 OOÔÔ68 0000390 507 5 1950970 507 5 1950970 452 5 346517000089 000122 000112000067 000092 000151000149 000132 000142000042 000023 000019000086 000060 000046000179 000122 000076000091 000220 0003300000560 455 5 26467000076 000087 000084000046 000062 000059000339 000377 000403000166 000166 000141000066 000093 000156000066 000076 000079000186 000179 000142000104 000110 000120000231 000287 000278000244 000180 000080000106 000258 000565000096 000080 000064
0106 6rt f f 1 J000400*000404OOÛ638 000395000312 000221VVWwU JvWi /
rt f 10000507000296000041000076000494000031011200018000005700015300005100038300003601060112000050000035010601120112000351002381000012010601060106000091000179000266115 -65 -0000420003010106000049000074000330000085000250000082000131000113000238000059000694000043
.9000318000344VW W-vJÔÔOÔ10Ô000374000023.90000900000440002260000550004280000236.90000710000306.9.900062500 16330000096660000690001610004400000770000510000250001586000046000104000365000051000266000111000139000109000199245 -000446
STARflSASTAR.'SASTARflSASTsRflSASTARflSASTARflSASTARflSASTARflSASTARflSASTARflSASTARflSASTARflSASTARflSASTARflSASTARflSASTARflSASTARflSASTARflSASTARflSASTARflSASTARflSASTARflSASTARflSASTARflSASTARflSASTARflSASTARflSASTARflSASTARflSASTARflSASTARflSASTARflSASTARfSASTARflSASTAftRSASTARflSASTARflSASTARflSASTARflSASTARflSASTARflSASTARflSASTARflSASTARflSASTARflSASTARflSASTARflSASTARflSASTARflSASTARflSASTARflSASTARflSASTARflSASTARflSASTARflSASTARflSASTARflSASTARflSA
FIGURE 4.2PARTIAL LISTING OF TEST FILE "STARDAT''
25
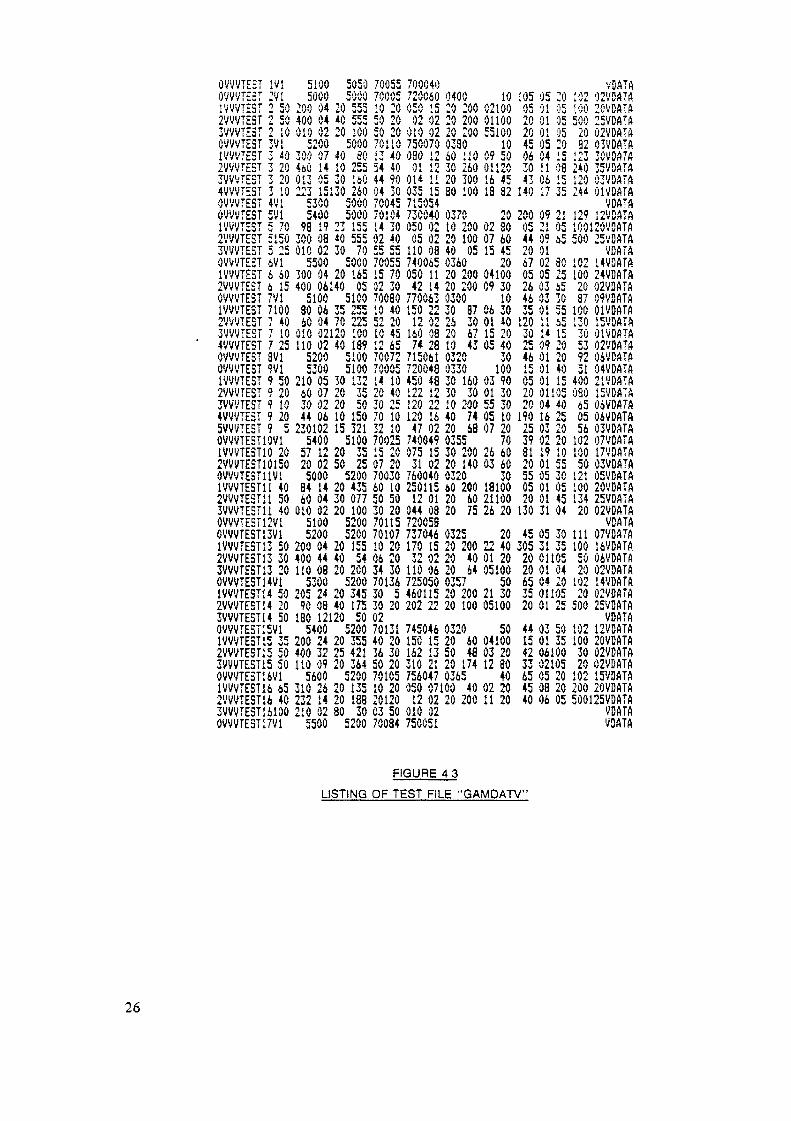
O U 4 J U T C 2 T 11; It l i i ww i i -r iOVVVTEST 2V11VVVTEST 2 502VVVTEST 2 503VVVTE3T 2 10OVVVTEST 3Vl1VVVTEST 3 4i)2VVVTEST 3 203VVVTEST 3 204VVVTEST 3 10OVVVTEST 4VlOVVVTEST 5V11VVVTEST 5 702VVVTE3T 51503VWTEST 5 25OVVVTEST 6V l1VVVTEST 6 602VVVTEST 6 15OVVVTEST 7Vl1VVVTE3T 71002VVVTEST 7 403VVVTEST 7 104VVVTEST 7 25OVVVTEST 3V1OVVVTEST 9Vl1VVVTEST 9 502VVVTEST 9 203VVVTEST 9 104VVVTE5T 9 205VVVTEST 9 5OVVVTESTl0Vl1VVVTEST10 202VVVTESTSU150OVVVTE3T11V11VVVTEST11 402VVVTEST1Î 503VVVÎEST11 40OVVVTEST12V1OVVVTEST13V11VVVTE3T13 502VVVTE5T13 303VVVTEST13 20OVVVTEST14V11VVVTEST14 502VVVTEST14 203VVVTEST14 50OVVVTEST15V11VVVTEST15 352VVVTEST15 503VVVTEST15 50OVVVTE5TS6V11VVVTEST16 652VVVTEST16 403VVVTE5TlilOOOVVVTESTi7Vl
5100 50505000 5000200 04 20 555400 04 40 555010 02 20 1005200 5000300 07 40 804&Û 14 10 255013 05 30 160223 15130 2605300 50005400 500098 19 23 155300 08 40 555010 02 30 705500 5000300 04 20 165400 06140 055100 510080 06 35 25560 04 70 225010 02120 100110 02 40 1895200 51005300 5100210 05 30 13260 07 20 3530 02 20 5044 06 10 150230102 15 3215400 510057 12 20 3520 02 50 255000 520084 14 20 43560 04 30 077010 02 20 1005100 52005200 5200200 04 20 155400 44 40 54110 08 20 2005300 5200205 24 20 34590 08 40 175180 12120 505400 5200200 24 20 355400 32 25 421110 09 20 3645600 5200310 26 20 135232 14 20 188210 02 80 305500 5200
TAArtC/ V V V W10 2050 2050 207011013 4054 4044 9004 30700457010414 3002 40
15 7002 307008010 4052 2010 4512 65700727000514 1020 4030 2570 1032 107002515 2007 207003060 1050 5030 20701157010710 2006 2034 307013630 530 20027013140 203Ä 3050 207010510 202012003 5070084
700040720060f>ffi ^ çVu'S «üi)2 02010 02750070080 1201 12014 n,')TK 1Cv^J tJ i y715054730040050 0205 02110 08740065050 1142 14770063150 2212 02160 0874 28715061720048450 48iOO 10i . *.£120 22120 1647 02740049075 1531 0276004025011512 01044 08720058737046170 1532 02110 06725050460115202 22
040020 20020 20020 200038060 11030 26020 30080 100037010 20020 10040 05036020 20020 200030030 872620100320033030 16030 3010 20040 7420 68035530 20020 140032060 20020 6020 750325
306743
100210001100551001009 500112016 4518 322002 3007 6015 45200410009 301006 3001 4015 2005 403010003 9001 3055 3005 1007 207026 6003 6030181002110026 20204020 40 01 2020 64 051000357 5020 200 21 3020 100 05100
745046 0320 50150 15 20 60 04100162 13 50 48 03 20310 21 20 174 12 80756047 0365 40050 07100 40 02 2012 02 20 200 11 20010 02750051
105 05 20AC AI AC'/U /l V W20 01 0520 01 0545 05 2006 04 1530 11 0843 06 15140 17 35200 09 2105 21 0544 09 6520 0167 02 3005 05 2526 03 i546 03 3035 01 55120 11 6530 14 1525 09 2046 01 2015 01 4005 01 1520 0110520 04 40190 16 2525 03 2039 02 2081 19 1020 01 5555 05 3005 01 0520 01 45130 31 0445 05 30305 31 3520 0110520 01 0465 04 2035 0110520 01 2544 03 5015 01 3542 0610033 0210565 05 2045 08 2040 06 05
VDATA02VDATA
20 OZVDATft82 Ô3VOATA123 30VDATA240 35VDATA120 Ô3VOATA24* OIVDflTAVDATA129 12VDATA10Ô12ÔVDATA500 25VDATAVDATA102 14VDATA100 24VDATA20 02VDATA37 09VDATA100 01 VDATA130 15VOATA30 01VOATA53 02VDATA92 06VCATA51 Ô4VDATA400 21VDATA080 15VDATA65 06VDATA05 06VDATA56 03VDATA102 07VBATA100 17VDATA50 03VDATA121 05VDATA100 20VDAÏA134 25VDATA20 02VDAÏAVDATA111 07VDATA100 16VDATA50 06VDATA20 02VSATA102 14VDATA20 02VDATA500 25VBATAVDATA102 12VDATA100 20VDATA30 02VDATA20 02VDATA102 15VDATA200 20VOATA500125VDATAVDATAVDATA
FIGURE 4 3
LISTING OF TEST FILE "GAMDATV"
26
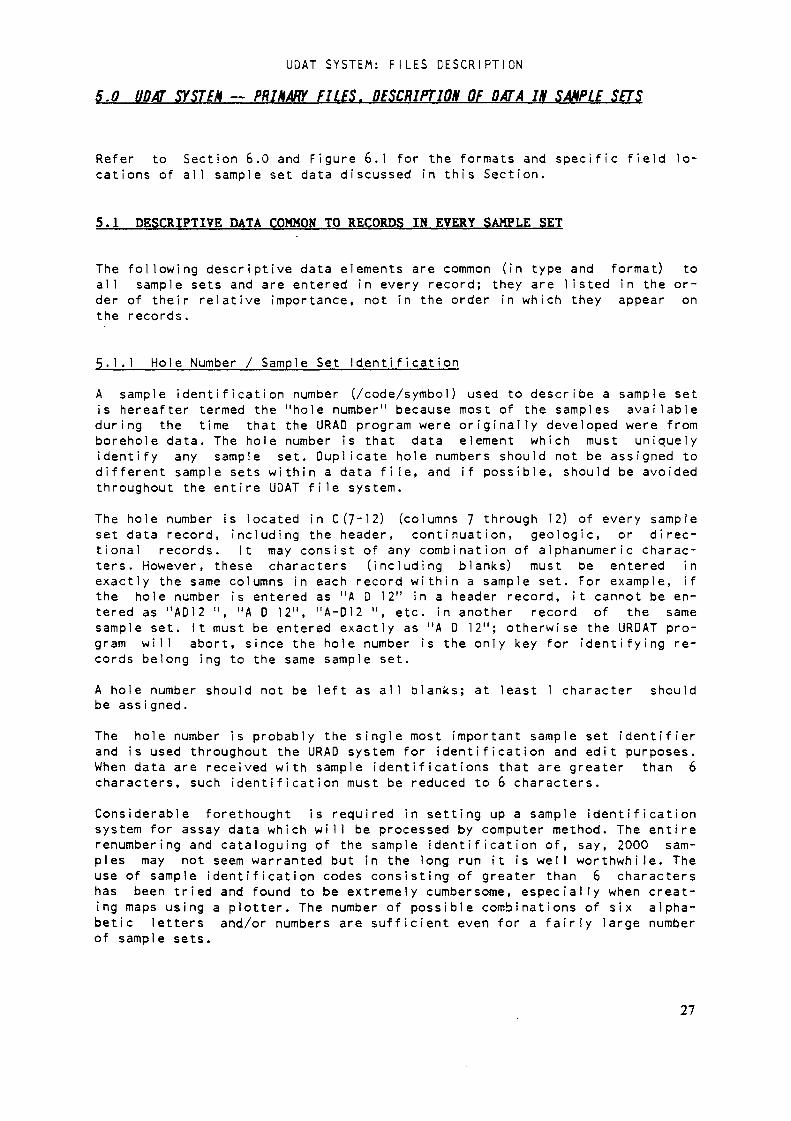
UDAT SYSTEM: F I L E S DESCRIPTION
5.0 UUff SYSTEM — PR1HMY FILES. DESCRIPTION OF DATA IN SÂHPLE SETS
Refer to Section 6.0 and Figure 6.1 for the formats and specific field lo-cations of all sample set data discussed in this Section.
5.1 DESCRIPTIVE DATA COMMON TO RECORDS IN EVERY SAMPLE SET
The following descriptive data elements are common (in type and format) toall sample sets and are entered in every record; they are listed in the or-der of their relative importance, not in the order in which they appear onthe records.
5 - 1 . 1 Hole Number / Sample Set IdentificationA sample identification number (/code/symbol) used to describe a sample setis hereafter termed the "hole number" because most of the samples a v a i l a b l eduring the time that the URAD program were o r i g i n a l l y developed were fromborehole data. The hole number is that data element which must uniquelyidentify any sample set. Duplicate hole numbers should not be assigned todifferent sample sets wi t h i n a data f i l e , and if possible, should be avoidedthroughout the entire UDAT f i l e system.The hole number is located in C(7~12) (columns 7 through 12) of every sampleset data record, including the header, continuation, geologic, or direc-tional records. It may consist of any combination of alphanumeric charac-ters. However, these characters (including blanks) must be entered inexactly the same columns in each record w i t h i n a sample set. For example, ifthe hole number is entered as "A D 12" in a header record, it cannot be en-tered as "AD12 ", "A D 12", "A-D12 ", etc. in another record of the samesample set. It must be entered exactly as "A D 12"; otherwise the URDAT pro-gram w i l l abort, since the hole number is the only key for identifying re-cords belong ing to the same sample set.A hole number should not be left as all blanks; at least 1 character shouldbe ass i gned.
The hole number is probably the single most important sample set identifierand is used throughout the URAD system for identification and edit purposes.When data are received with sample identifications that are greater than 6characters, such identification must be reduced to 6 characters.Considerable forethought is required in setting up a sample identificationsystem for assay data which w i l l be processed by computer method. The entirerenumbering and cataloguing of the sample identification of, say, 2000 sam-ples may not seem warranted but in the long run it is well worthwhile. Theuse of sample identification codes consisting of greater than 6 charactershas been tried and found to be extremely cumbersome, especially when creat-ing maps using a plotter. The number of possible combinations of six alpha-betic letters and/or numbers are sufficient even for a f a i r l y large numberof sample sets.
27
UDAT SYSTEM: F I L E S D E S CRIPTION
5 • 1 • 2 Area Number
The area number is a secondary i d e n t i f i e r which is used to classify samplesets into l o g i c a l groupings such as land survey boundaries, ore blocks, an-ticipated m i n i n g phases or any other u n i t for which separate analyses may beforeseen. The assignment of area numbers to sample sets is optional, but re-commended if the data in a given f i l e consist of over, say, 100 sample sets.The area number is entered in C (A-6) of each record and consists of any com-bination of 3 alphanumeric characters, includi n g blanks. The same rules ofidentity apply to the area numbers as do to the hole numbers, i.e. a givenarea number must always be entered in exactly the same form. However, thesame area number may be assigned to as many sample sets as desired.The area numbers are used both as i d e n t i f i e r s for "cataloguing" purposes andas edit control parameters (Section 7-6.9).
5-1.3 Property CodeThe "property code" is an additional 7~character code provided for sample-identification. It may consist of any combination of alphanumeric charactersand is entered in C (73~79) of each record. It is p r i m a r i l y used for iden-tification of the area, property, mine, or other such broad grouping bywhich the sample sets may be conveniently categorized but is not used in anyprogram operations such as e d i t i n g . The same property code may be assignedto as many sample sets as desired.
5.1.*+ Record Count or I ndexColumns 1 through 3 are reserved for indexing (or "counting") the number ofrecords w i t h i n one given sample set. The record index numbers are p r i m a r i l yfor convenience in visual inspection of the records and they ignored in theURAD programs. However, they are necessary if it is ever desired to sort thesample data.Theoretically, in a computer sort procedure, the primary key would be theproperty code, the secondary key -- the area number, the 3rd key -- the holenumber, and the last key -- the record index.In each header record, the record index f i e l d is left blank, or a "0" (zero)may be entered. The first continuation record contains a "l" in C3, the sec-ond continuation record contains a "2" in C3. and so forth. It is recom-mended that the index for l i t h o l o g i e data records w i t h i n a sample set beginwith "101" and those for directional records with "201".
5.1.5 Example D r i l l Hole Location PlotFigure 5-5 is an example d r i l l hole location map made from data in test f i l e"STARDAT". It shows the position and hole number of each sample set for thehypothetical property "STARMSA" based on the sample set header records in
by the areaf i l e "STARDAT". Alsonumbers "AAA", "BBB"
shown is the o u t l i n e of the areasand "CCC" that are on the header
indicatedrecords.
28
UDAT SYSTEM: F I L E S DESCRIPTION
5.2 DESCRIPTIVE DATA COMMON TO ALL HEADER RECORDS
The following data elements are common (in type and format) to all samplesets (with minor exceptions as noted), and are entered in every header re-cord. These are discussed in the order of their appearance in the record.
5.2.1 Sample-Type CodesC(13-15) of each header record contain "sample-type" codes which identifythe type and format of the given sample set. Figure 5-1 provides a completesummary of all sample-type codes used in the UDAT system. C (14-15) may some-times be blank, but C(13) must always contain a code.Note that the codes determine whether or not estimated uranium values w i l lbe subject to correction for radiometric disequilibrium.Codes "A" through "F" in C13 indicate borehole log data, w h i l e numeric codesindicate other types of sample data. "V" is used for the sample data whichcontain vanadium as well as uranium assays. "L" denotes l i t h o l o g i e data.C14 is an accessory code which is applied in several ways. With the bimetal("V") format, it flags whether or not the uranium values are subject to dis-e q u i l i b r i u m correction; With the non-contiguous format, it is always "1".C15, with borehole log data, denotes the type of readings in the data:
n i »
"U""C"" "
I" for inches of deflection from baseline in rectilinear logs."Z" for inches of deflection from baseline in curvilinear logs.U" for uncorrected (for dead time) counts per second.C" for corrected (for dead time) counts per second.Q" for interpreted borehole log data.
Note: A description of the "Z" format and interpretation ofcurvilinear logs is not included in this first version of the URADuser 's gu i de.
CIS is also used in the non-contiguous format to specify whether samples arereferenced by depth or elevation.
Columns 13. l^i and 15 are designated as sample-type codes 1, 2, and 3 re-spect i vel y .The term "A-E,I" (or s i m p l y "A-E") is an abbreviation for: "A, B, C, D, orE" in C13, "1-9" in C14, and "I" in column 15. The "A-E" and " F l i " codes re-fer to borehole log readings in inches of deflection and are further de-scribed in the following two sections.
5-2. 1 . 1 Scales and RangesWhen a radiometric strip log is generated, the "sensitivity" of the record-ing instrumentation must be l i m i t e d to the extent that the stylus does notexceed the l i m i t s of the strip-chart paper. Conversely, the sensitivity mustbe sufficient that any "anomalous" radioactivity is well defined. Therefore,strip logs are generated, various recording scales are used to specify the
29
UDAT SYSTEM: F I L E S DESCRIPTION
number of counts-per-second (cps) that are represented by a given length ofdeflection from the baseline of the strip chart.
Note: If the logging probe is of the geiger type, the u n i t of ra-dioactivity may be mi 11iroentgens per hour (mr/hr) instead of cps.When the term "cps" is used herein, it is understood that it maybe substituted by "mr/hr".
Each scale is usually defined by a range, which is simply a number code usedas a "short-cut" method of noting, on the strip chart, the scale that is ineffect for any segment of the radiometric amplitude curve.The ranges and associated scales employed by various logging units vary con-siderably. The scale denoted by a range may be in terms of cps-per-inch orcps of total, or "full-scale", deflection (commonly 10 inches) on the chartpaper. Examples of gamma-ray logging factors, scales and ranges for selectedlogging units are shown on Figures 5-2a, b, c, & d.
Note: There is always the poss i b i l t y that the true "full-scale"deflection for a given logging u n i t may not be the same as thetotal inches of deflection indicated by the chart paper used onthe recorder. It is wise to thouroughly check out the specifica-tions of the logging unit .
Radiometric data "digitized" (Section 3-3-M from strip logs in terms ofinches-of-deflecti on must also include information on the associated scales.This is done by entering a numeric "range code" along with each inches-of-deflection reading in the CE-fields (Section 6.3-2) of the continuation re-cords. The range code refers to a "range/scale" table which provides thevalues for cps- (or mr/hr-) per-inch, or at f u l l scale, represented by therange codes for the given log type.When readings are in inches-deflection, the sample-type code in C13 deter-mines the range/scale system (Section 5-2.1.2) which applies to the rangecodes associated with the readings in the given sample set. If the code re-fers to a "full-scale" system, the reference full-scale-deflection (ininches), must also be entered as a data element (Section 5-3-6).During computer processing, the sample-type codes in C(13~l^) and the rangecodes in the C-E fie l d s are used, in combination, to find the the appropri-ate cps- mr/hr- -per-inch scale value --which is then m u l t i p l i e d by theinches-of-deflecti on to give total counts-per-second represented by thereading. The scale is found by searching a table of values previously estab-lished for the given range/scale system.
$.2.1.2 Range/Scale Code SystemsURAD contains two range/scale numeric coding systems. A given sample setmust be in one system or the other, but both types may be included in anyf i l e . For either system, the code "I" must be entered in column 15 (sample-type code 3) of the app l i c a b l e header record to denote that the readings arein inches-of-deflecti on.The "I" code and associated range numbering systems apply only to boreholelog data entered as inch-deflection readings from strip logs!
30
UDAT SYSTEM: F I L E S DESCRIPTION
1. The "A-E.I" System u t i l i z e s the cps-per-inch range/scale method and a setof ranges and associated scales is established for a particular logging unit{or probe) type. The given type is defined by sample-type codes 1 and 2 incolumns 13 and ]k, respectively, of the header record; in this case the twocodes actually represent one 2-character code and w i l l be so referenced inthe remainder of this section. The 2-character code may consist of any com-bination of "A", "B", "C", "D", or "E" in column 13 and the numbers 1through 9 in column 14. Some examples are: "AT1, "89", "E3", and so forth.A DOS f i l e designated as "RNGTBL" must be established to contain the scalevalues represented by the numeric range codes for each and every "A - E" 2-character code which is entered in header records in any of the sample assaydata files. Each record in f i l e "RNGTBL" contains the appropriate 2- charac-ter sample-type code, followed by a l i s t of scales, each of which denotescps/inch for a specific range code associated with the given log type.A test RNGTBL f i l e is included with this guide; it contains the range/scaledata tabulated in figure 5.2 for sample-types "All", "A3I", etc. The scalefor All and A3I are necessary for processing the "A-E, l"-format sample setdata included in test f i l e "GAMDAT". The other types are used to demonstratethe f l e x i b i l i t y in entering the scale values.Figure 5-3 is a structured i l l u s t r a t i o n of the data contained in the RNGTBLf i le.The range code to which each scale applies is i m p l i c i t l y determined by thepositon of a particular scale value on the l i s t . Using Figures 5-3 as an ex-ample, the first record contains "Al" in columns 1 and 2. This is followedby a l i s t of scale values (each separated by a comma). The first value -- 20cps/inch -- represents range code 1, the second value, -- kO cps/inch -- re-presents range code 2 and so forth. The range codes and associated scalesfor each sample-type code are shown in Figure 5-2a.The requirements for a record in f i l e "RNGTBL" are that: the sample-type-code must be in column 1 and 2; each scale value must be immediately fol-lowed by a comma; no "imbedded" blanks may be present; and, the maximum al-lowable number of di g i t s is 7 (including the decimal point), but a decimalis not required if not applicable. No other record types are permitted in"RNGTBL".
The advantage of the "A-E,I" system is that it provides a means for estab-l i s h i n g a specific set of range/scale values for a given log type. The dis-advantage is that an entry must be made in f i l e RNGTBL for each new log type(i.e. one with a different range/scale system) for which data are entered inthe "A-E" format. If a sample set in the "A-E" format is processed by pro-gram URDAT and either 1) no RNGTBL is available in the default drive, or (2RNGTBL contains no l i s t identified by the given 2-character code in the sam-ple set header record, the program w i l l automatically terminate.When the "A-E,I" system is used, the no data entry is required for "Full-scale deflection" in the header record.2. The " F l l " System uses a "standardized" numeric range code table with thescale values (Figure 5-M contained w i t h i n the URDAT program. It is acti-vated by sample type codes "F" (C13), "l" (C1U), and "I" (CIS) in the sampleset header record.
31
UDAT SYSTEM: F I L E S DESCRIPTION
Scale values are in counts-per-second per total inches of the deflection(full-scale) on the s t r i p log chart and relate to the "full-scale" inchesentry (Section 5-6.3) °n the header record. The inches deflection and rangenumbers are entered in the CE-fields exactly as for the "A-E" format, butcps values are calculated by d i v i d i n g the scale value (represented by thea p p l i c a b l e range code) by the value of the " f u l l scale deflection", and thenm u l t i p l y i n g the results by the inches deflection of the given reading.
As an example, if an inch-deflection reading under the " F l l " format has anassociated range code of "33" (Figure 5-^0 and the "full-scale inches" onthe header record is 10.0, then the cps-per-inch w i l l be determined as1000.0 (10000/10); if the "full-scale inches is 5-0, the cps-per-inch w i l lbe 2000.0 (10000/5).
The advantage of the " F l l " system is that it covers most of the s t r i p logrecording scales currently in use, and new, 2-character sample codes and as-sociated range/scale values need not be established for each new log type.However, if a set of scales not included in Figure $.k is encountered, thenthe "A-E" format may be used. The main disadvantage of the " F l l " system isthat the logging-unit type is not e x p l i c i t l y defined by the sample-typecode. For this reason, space is provided on the header (Section 5-3-7) for alog-type "identifier"; the coding system for this must be established by theuser .
NOTE: when preparing to enter inch-deflection readings for a sam-ple set into the data f i l e s , whether "manually" or by automaticd i g i t i z i n g methods, the range/scale notation used for the givenborehole log must be carefully reviewed and understood. Confusing"full-scale" w i t h "cps-per-inch" ranges and scales w i l l lead tolarge-scale errors in converting the readings to counts per sec-ond. The choice of which URDAT range/scale coding system to useshould be be made well in advance of the actual data entry.
5.2.2 Coordinates
Two numeric coordinates of up to 7 d i g i t s each should be entered, to thenearest foot (MV = 9999999 ft), in each header record. These entries are notmandatory and their absence w i l l not cause URAD programs to abort. However,they are needed for certain types of edits in the URAD system and, eventu-a l l y , for plotting purposes as w e l l as for certain geostat i st i cal programs.
As with the hole numbers, considerable forethought should be given to plan-ning the coordinate systems to be used for data which w i l l becomputer-processed. Coordinates should be related to an o r i g i n which notonly references data w i t h i n a given f i l e , but all data which may be eventu-a l l y evaluated "in toto" at some future date. The reestablishment of a newcoordinate system for data o r i g i n a l l y referenced by several "local" coordi-nate systems is well worth the effort.Coordinates must lie w i t h i n the f i r s t quadrant of the Cartesian coordinatesystem; they cannot be negative.
32

UDAT SYSTEM: F I L E S DESCRIPTION
S.2.2. 1 North CoordinateThe north coordinate is the northerly component (y-axis) of distance fromthe reference o r i g i n and is entered in C (16-22).
$.2.2.2 East CoordinateThe east coordinate,C (23-29) is the easterly component (x-axis) of distancefrom the reference o r i g i n .
5-2.3 Collar (or Reference) ElevationThe collar elevation is the vertical (z-axis) point of reference for a sam-ple set. It is a positive or negative numeric value, entered in C (30-35) tothe nearest tenth of a foot, and may consist of up to 6 d i g i t s (MV = 99999-9ft), with a decimal point always assumed between C3^ and C35- It representsthe o r i g i n point of the sample set. For borehole data, this elevation re-presents the "collar" (or surface) elevation of the borehole. If there is aninterval of assumed barren material between the collar elevation and the topof the fi r s t sample of the set, then the thickness of the barren interval isdenoted by the entry — "depth to first sample" (Section 5-2.6).An entry for collar elevation is not mandatory but is h i g h l y recommendedsince certain edit procedures are based on the elevations, and it may be re-quired for certain geostatistical and plotting programs. Sea level is thebest reference datum for collar elevation. If any other datum is used, itshould be applied to all sample sets which may be evaluated "in toto" atsome future date.Negative values for collar elevation are allowed.
5-2.k Depth to Pit BottomThis entry is used to provide information on existing open pit mine workingsand is useful both for plotting and for edi t i n g sample data with respect tothe current position of an open pit (see also Sections 9 - 1 - 1 2 and 14.1). Itrepresents the depth (from the collar) to the intersection of the given sam-ple set with the bottom of pit workings, and may be used to estimate howmuch of the material represented by the sample set has been removed.
Pit-bottom depths are normally entered into a data set at some point afterpit excavation has actually taken place and a certain amount of m i n i n g hastaken place. Comparisons may then be made between the amount of ore actuallymined and reserve calculations based on original samples currently posi-tioned w i t h i n the pit and above the pit bottom. Reserves may also be calcu-lated for unmined potions of the pit.The pit-bottom depth is entered to the nearest 10th of a foot in C(36-39)and may consist of up to k d i g i t s (MV = 999-9 ft); the decimal is assumedbetween C (38) and C (39)• It should not be entered unless a pit actually ex-ists. If a sample set begins at the bottom of a pit, then the pit-bottomdepth should be entered as zero. If the pit-bottom depth entry is blank, itis assumed that no open pit exists at the given sample set location.
33
UDAT SYSTEM: F I L E S DESCRIPTION
5-2.5 Depth to Oxidized/Non-oxidized Contact
This entry is used to mark the approximate position of a change (if known)from an oxidized to non-oxidized environment w i t h i n the total interval re-presented by a sample set. It is sometimes approximated by the top of thewater table (which can often be identified by electric logs). In certainuranium deposits it is d i s t i n g u i s h e d by color change, caused, for example,by the transition of hydrous iron oxides to iron sulphides.A value entered for the "ox idixed/non-oxidi zed" contact w i l l allow the ap-p l i c a t i o n of separate equations for d i s e q u i l i b r i u m correction (Section 3-4)to radiometric grades determined for any samples in the given sample set.The depth from the top of the sample set (represented by the c o l l a r ele-vation) to the approximate oxidized/non-oxidized contact is entered to thenearest foot in C (40-42) and may consist of up to 3 d i g i t s (MV = 999 ft) . Ifthere are no data av a i l a b l e on such a contact, then the field is left blank.If the entire interval of the zone represented by the sample set is presumedto be in an unoxidized environment , a zero is entered. If the entire inter-val represented by the sample set is presumed to be in an oxidized environ-ment, then the bottom of the sampled interval is entered.
5.2.6 Depth to F i r s t SampleThe distance between the point referenced by the col l a r and the top of thefirst sample interval of a sample set (or to the first radiometric readingthat represents a sample interval) is entered to the nearest tenth of afoot. It may consist of up to 5 d i g i t s , with a decimal point assumed 1 placeto the left of the rightmost d i g i t (MV = 9999.9 ft). For the contiguous for-mats, the value is entered in C (43-47) , w i t h the decimal point is assumedbetween C46 and CkJ, For the borehole log formats, it is entered in thef i r s t continuation record (Section 6.3-2.4). For the non-contiguous format,it is not used because the f i r s t sample interval defines the value (Section6.2).
5.2.7 Total Depth SampledThe distance from the point represented by the collar to the bottom (or end)of the sampled interval is entered in C (43~47) to the nearest tenth of afoot, with the decimal point assumed between C46 and C4?. Up to 5 d i g i t s areallowed (MV = 9999-9 ft). For borehole log data, this distance representsthe bottom depth logged (not necessarily the bottom of the hole). For otherdata it represents the distance to the bottom of the last interval of thesample set.
Note: The contiguous sample formats do not provide any entry fortotal depth sampled, and it is calculated in the URDAT program. Ifan interval of barren material is known to exist below . the lastsampled interval, it should be entered as a "pseudo-sample".
34
UDAT SYSTEM: FILES DESCRIPTION
5.3 ADDITIONAL ENTRIES COMMON TO BOREHOLE LOG HEADER RECORDS
All borehole log data ("A-E" and "F") must include, in the header records,the following additional data which is used for interpretation. Although the"FnQ" format does not require some of these data for successful processing,they should be entered for reference purposes.
5.3-1 Readout IntervalThis is the interval at which readings are recorded during the logging proc-ess or at which representative readings are measured from strip logs. It isgenerally 0.5 or 1.0 feet and is entered in 0(1+8-1+9) to the nearest tenth ofa foot, as a 2-digit number with the decimal assumed between C48 and C49.
5.3.2 Depth to Hole WaterThis is the distance from the collar to the level of any water and/or d r i l ling f l u i d which may be standing in the hole when it was logged. If the f i e l dis left blank, it is assumed that all recorded intervals were logged in wa-ter. The "depth to hole water" is entered in C (50-52) to the nearest foot;up to three d i g i t s are allowed (MV = 999 ft). This value is used in conjunc-tion with the "attenuation" factors (Section 4.3.4).
5-3.3 K-FactorThe k-factor is the basic constant of proportionality which is used to convert the radiometric data to representative estimated uranium values (SeeSection 17)- It is usually derived by logging a simulated d r i l l hole (or"test" hole) which contains a measured interval of known uranium grade. Thenormal "standard" is usually a dry (no fluid) four and one half inch diam-eter hole, with the uranium assumed to be at radiometric e q u i l i b r i u m as pos-sible. (However, the "standard" could instead be a hole completely f i l l e dwi th 1iquid) .The k-factor is applied directly to radiometric cps measured in holes havingthe same characteristics as the test hole. For borehole environments differ-ing from the standard, "attenuation" factors are used; see Section 5-3.4.The logging speed and time constant at which the k-factor has been computedmust also be known so that any changes in logging speed during logging pro-cedures may be entered into the data (Sections 6.3.2.4 and 17) •Up to 3 significant digits of the k-factor are entered in C (53~55). followedby an exponent, in C56, which is assumed to be negative. To determine theproper entry and exponent, simply count the number of places that the deci-mal must be moved so that it w i l l be immediately to the right of the lastsignificant d i g i t allowed.Example: if the k-factor is 0.0000312, the decimal must be moved 7 places tothe right — 0000312.; the k-factor entry is 312 and the exponent is enteredas 7. If the k-factor is 0.0001462, the decimal must be moved to the rig h t 6
35
UDAT SYSTEM: F I L E S DESCRIPTION
places -- 000146.2; the k-factor entry is 146 (3 s i g n i f i c a n t d i g i t s ) and theexponent entered is 6.
For situations where more than three significant d i g i t s of the k-factor aredesired, see Section 6.3-2.4.
5-3-4 Attenuation Factors
When logging boreholes in the f i e l d , conditions which may often vary fromthose existing in the "test hole" (Section 5-3-3) are: existance (or lack)of f l u i d in the hole; different hole diameter; and, the presence of holecasing. These differences are taken into account by applying, to thek-factor, m u l t i p l i c a t i v e (see below) attentuation factors based on theore-tical considerations or additional calibrations in "test holes" having con-dit i o n s which vary from the "standard" test hole. Since it is not feasibleto construct a series of test holes to cover every possible deviation fromthe "standard", correction curves are generally developed. Example hole at-tenuation data are shown in Figure 5-2. Two attenuation factors are pro-vided in UDAT formats; one is for correcting the k-factor for readings ina i r - f i l l e d portions (dry environment) of a d r i l l hole and the other forfluid- (water"-) f i l l e d portions or "wet" environments; each factor is usedindependently of the other. The depth to hole water (Section 5-3-2) is en-tered so that the distinction can be made between the two environments. Ap-p l i c a b l e casing, hole-diameter, and other attenuation factors must beincluded in the air and the water correction factors before they are enteredin the header records.For example, if the air and water correction factor are 1.00 and 1.10, re-spectively, at a given hole diameter and the casing factor is 1.2 for 1/8-inch casing, then for a 1/8-inch cased hole, the air and water correctionfactors must be entered as 1.20 and 1.32, respectively.Correction for additional factors which directly affect the k-factor arediscussed in Section 6.3-2.4.
5.3.b.l Air Correction FactorThe "air correction factor" applies to changes in the "dry" environment andis entered in C (57~59). to the nearest hundredth of a unit, with the decimalpoint assumed between C57 and C53; up to three d i g i t s are allowed (MV =9-99) -An air correction factor is not needed when the entire interval representedby a sample set was logged in f l u i d .If the k-factor was determined for a "dry" environment and the conditions ofthe logged hole match those in the test hole, then the air correction factorshould be entered as "1.00" (decimal point omitted). If no air correctionfactor is entered in the header record, it is assumed to be 1.00.An air correction factor other than 1.00 is needed when:
1. The k-factor was o r i g i n a l l y determined for a "dry" environment,but the casing conditions and/or hole-diameter of the logged holeare different from the test hole.
36
UDAT SYSTEM: F I L E S DESCRIPTION
2. The k-factor was o r i g i n a l l y determined for a "wet" environment.
5.3.b.2 Hater Correct ion FactorThe water correction factor applies to changes in the "wet" environment andis entered in C (60-62), to the nearest hundredth of a unit, with the decimalpoint assumed between C60 and C6l; up to three d i g i t s are allowed (MV =9-99).A water correction factor is not needed when the entire interval representedby a sample set was logged in air.If the k-factor was determined for a "wet" environment and the conditions ofthe logged hole match those in the test hole, then the water correction fac-tor should be entered as "1.00" (decimal point omitted). If no water cor-rection factor is entered in the header record, it is assumed to be 1.00.A water correction factor other than 1.00 is needed when:
1. The k-factor was o r i g i n a l l y determined for a "wet" environment,but the casing conditions, f l u i d conditions and/or hole-diameterof the logged hole are different from the test hole.2. The k-factor was o r i g i n a l l y determined for a "dry" environment.
5-3-5 Dead Time FactorThe dead time reflects attenuation in the "counting" capa b i l i t y of the elec-tronic equipment used to log the hole according to the equation:
CPSt = CPSo / ( 1 - ( CPSo x (DT/1000000) ) ) where,CPSt = "true" counts per second,CPSo = observed counts per second,DT = equipment dead time in microseconds (ms).
The dead time is entered in microseconds in C(63-66). It is the only dataelement in the header record which may contain an ex p l i c i t decimal point.The decimal point may be in any position of the field; if the decimal is notentered, it is assumed to be to the right of C66. The dead time value there-fore may range from 0.001 to 9999 ms; there may be up to four significantd i g i t s if the decimal is not entered, and three significant d i g i t s if it isentered.
5-3-6 Full-Seale DeflectionIn UROAT, the range codes used for the "FT I" format (Section 5.2.1.2) arebased on the full-scale deflection of the stylus (on a strip log) at the
37
UDAT SYSTEM: F I L E S DESCRIPTION
given range, where the "f u l l scale" is the number of cps represented at thetotal scaled width of the chart paper used for the log (or as otherwisespecified for the given logging unit; see note, Section 5-2.1.1). For exam-ple, if a scale of "1000" is specified for a f u l l scale at 10 inches, eachinch of deflection represents 100 cps; if the same scale is indicated for a5-inch f u l l scale, then it represents 200 cps per inch. This is in contrastto the method used for the "A-E" format where the range code ap p l i e s to ascale which is already established as cps per inch.Therefore, whenever the " F l l " is used, the number of inches represented asas applying to "full scale" must be entered in C(67~70) of the header re-cord, with the decimal assumed between C68 and C69«
5.3.7 Logging Unit (Log Type) CodeIt has been generally found prudent to maintain a record of the character-istics of the logging units used in obtaining borehole data. C (71-72) ofthe header record (for the "borehole log" format) is reserved for any2-character code which the user may establish to identify the p a r t i c u l a runit which was used to obtain the data represented in the given sample set.
5.4 SAMPLE DATA
The UDAT system provides formats for entering any of the sample data de-scribed in Section 3- The formats for the various types of sample data d i f -fer according to the type of data involved and are discussed separately andin detail in the following section.F i l e "GAMDAT" is a test primary UDAT f i l e containing examples of the varioussample assay data formats. In this f i l e , sample sets "TEST 1", "TESTAI","TEST 2", "TESTB2", "TEST 9", and "TEST11" are hypothetical data sets.("TEST 8" was removed since it simply duplicated another set.)Sets "TEST 3" and "TEST V are d i g i t a l cps readings from an actual log. Toshow the relationships of the various borehole log formats, "TEST 5" and"TEST 7" were prepared to simulate (as closely as possible) "TEST 3" cpsreadings as though they had been digitized from a strip-chart asinch-deflection readings. "TEST 5" is based on the RNGT8L range-code system,and "TEST 7" on the internal " F l l " range-code system. S i m i l a r l y , "TEST 6"simulates "TEST 4" (RNGTBL system).In preparing "TEST10", the U308 interpreted values from "TEST 3" were used.All l i t h o l o g i e data are hypothetical,When f i l e GAMDAT is processed by URDAT, without any editing (using UCON f i l e"UCON1, for example), the results are as shown in APPENDIX C. The discrep-ancies in the high grade portions of "TEST 4" and "TEST 6" are discussed inSection 3'3«6.F i l e s "STARDAT", "GAMDATV", and "STARDATL" are other test f i l e s (Section4.1) which illustrate various types of sample data.
38

UDAT SYSTEM: F I L E S DESCRIPTION
TVPE OF FORMATS AND DATA SAMPLE-TYPE CODESTypet Type2 Type3(C13) ;C14) 1Î15;
Contiguous FormatUnimetal (uranium only)Radioietric-squivalent assays - - - - - - - { Btt 8* Chemical (or equivalent) assays - - - - - - 2 8 BInterpretations at hörende anomalies(uncorrectsd tor disequilibrium) - - - - 3 B Bt Interpretations at borenole anoiahes(correctea far disequilibrium) - - - - - 4 B Bt Any designation desired oy user; lustbe alreaay corrected tor disequilbrium 5 B BBuetal (uranium and vanadiui)Uranium is raaiometric-equivalent - - - - - V 1 8t Uraniua is chemical (or equivalent) - - - - V 2 BNon-contiguous Foriat—————*—————— mftafliometric-equmlent assays - - - - - - - 6 1 I o r 2t Cheaical lor equivalent) assays - - - - - - 7 t I o r 2Interpretations of borehole anomaliestuncarrected for disequilibrim) - - - - 8 1 1 or 2t Interpretations of borehole anoiahes(corrected for disequilibrium) - - - - - 9 1 I o r 2Borehole Loo ForiatDigitized (inch-deflection) readings, rangecodes apply to file RNGTBL coding:Rectilinear logs - - - - - - - - - - - - A-E 1-? ICurvilinear logs - - - - - - - - - - - - A-E 1-9 IDigitizes (inch-aeflection) readings, rangecodes apply to standard (Figure x) codes:Rectilinear logs only - - - - - - - - - - F 1 IEPS readings, uncorrecteu for dead tue - - F l UCPS readings, corrected for dead tue F l CReadings are actual estnated uraniut grades:Uncorrecteo for disequilibrium - - - - - F 1 QI Corrected tor disequilibrium - - - - - - f 2 Q
» Uranium «lues may not be corrected for disequilbnum.tt 'B* indicated field is left blank.It* For non-contiguous format: T denotes deptns;*2' denotes elevations.
F I G U R E 5.TSUMMARY OF DATA REPRESENTED BY UDAT SAMPLE-TYPE CODES
(IN COLUMNS 13-15 OF SAMPLE-SET HEADER RECORDS)
39
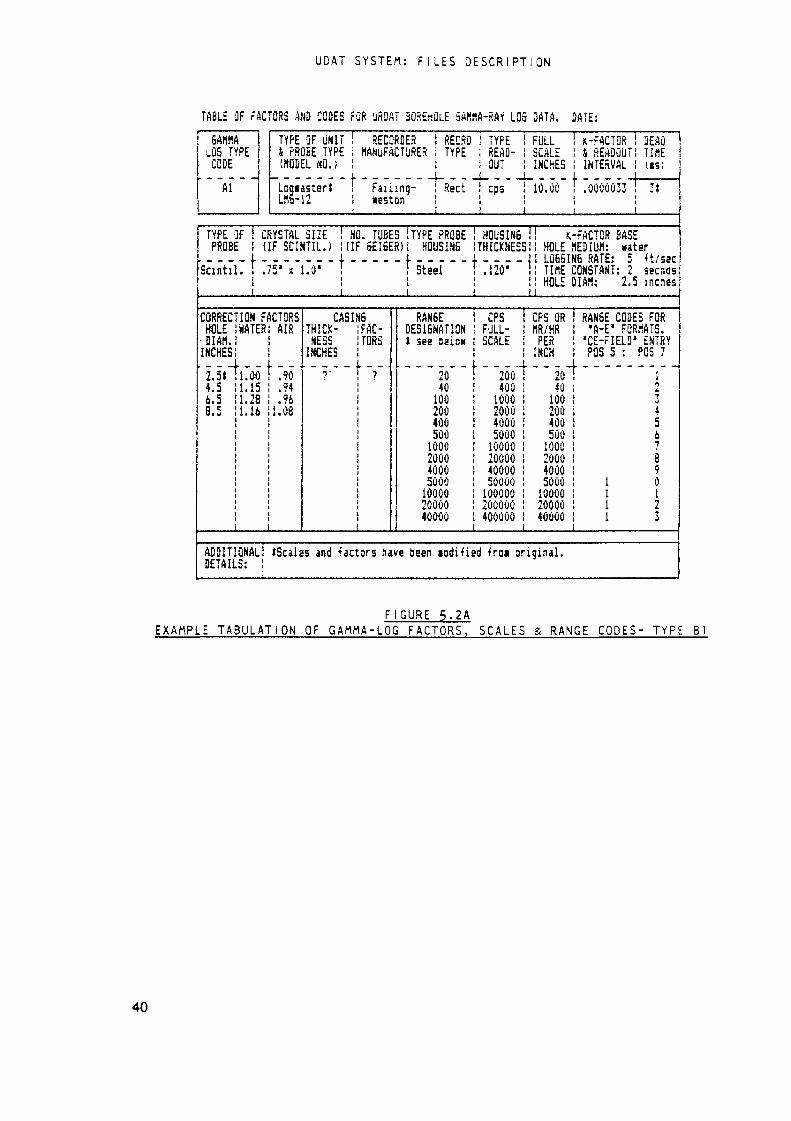
UDAT SYSTEM: F I L E S D E S C R I P T I O N
TABLE OF FACTORS AND CODES FÜR uRDAT SOSErtÜLE SAHfiA-RAf LOS 3ATA. DATE:
5AMHALUS TYPECODEAl
TYPE OF UNIT ! RECORDER ! RECRD ! TYPE FULL n-FACTOR DEAD *4 PROBE TYPE 1 MANUFACTURER ! TYPE READ- SCALE 4 READOUT TIftE(MODEL KO.) ! ! OUT INCHES INTERVAL (is)Latjsastsrt i Failing- i Rect cps 10. ÛÛ .0000033 31Lilfi-12 1 »eston !i i i i
TYPE 0F !PROBE 1|
Scintil. !tII
CRYSTAL SIZE ! NO. TUBES iTYPE PROBE HGUSÎN6 ! fc-FACTQR BASE(IF SCINTIL.) j(IF 5£I6ER)i HOUSING- - - - — — -*- — — — -i— — - — -.
1 1i !
CORRECTION FACTORSHOLE ! HATER•DIAH.iINCHES:" 2.5» !l7oÖ4.5 11.156.5 11.238.5 11.16Il
1l11ll111lll1
AIR
' 790.94.961.08
i
CASIN6THICK-NESSINCHESr
FAC-TORS
•y
t
RAN6EDES1SNATÎONt see Bel UK........
401002004005001000200040005000100002000040000
THICKNESS! HOLE MEDIUM: »star. _ _ _ _ . ! LQ65IN6 RATE: 5 ft/sec.120" ! TIME CONSTANT: 2 secr.ds! HOLE DIAH: 2.5 menéstCPS CPS OR RANGE CODES FORFULL-SCALE
"200~40010002000400050001000020ÛÛÛ4000050000100000200000400000i
MR/HRPERINCH...--,Oft
401002004005001000200040005000100002000040000
•A-E1 FORMATS.•CE-FIELD' ENTRYPOS 5 : POS 7- - - - - - - - f -
0L.34567891 01 11 21 3i
ADDITIONAL! IScâias and factors have been aod H led fraa original.DETAILS: 'i
F I G U R E 5 . 2 AEXAMPLE T A B U L A T I O N OF GAMMA-LOG F A C T O R S , S C A L E S S RANGE C O D E S - TYPE
40
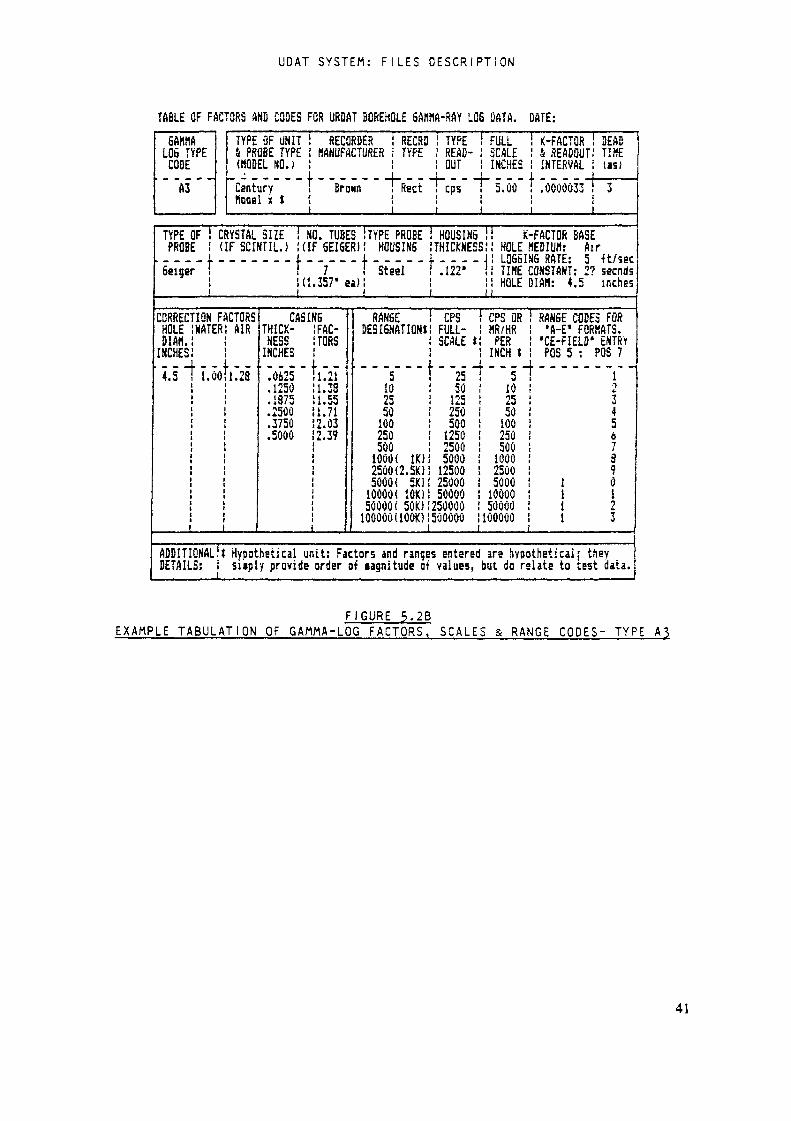
UOAT SYSTEM: F I L E S D E S C R I P T I O N
TABLE OF FACTORS AND CODES FOR URDAT BOREHOLE 5AHÎ1A-RAY LQ5 DATA. DATE:
6AW1ALOS TYPECODE"" ~A3 " ~
TYPE ÜF UNIT ! RECORDER ! RECRD TYPE FULLS PROBE TYPE ! KANüFACTüRER i TYPE READ- SCALE(MODEL NO.) ! ! OUT INCHES["Century ! Brown T Rect cps 5.00ffooel x t f !1 i i i f
! K-FACTQR! i READOUT! INTERVAL[ .0000033ii
DEADTHEtiSJ
3
TYPE OF ! CRYSTAL SIZE ! NO. TUBES ÎTYPE PROBE ! HOUSING ! K-FACTOR BASEPROBE i (IF SCINTIL.) ! (IF 6EI6ER) ! HOUSING iTHICKNESS! HOLE HEBIUH: Air. . _ _ - f . - - - - _ - i - - - . . i _ _ _ - _ i - . . . j LOGGING RATE: 5 ft/secGeiger ! I 7 f Steel i .122» 1 TIME CONSTANT: 2? secnds! 1(1. 357' eat! ! ! HOLE DIAH: 4.5 inchesI i ! f 1 1
CORRECHOLEDIAH.INCHES4.5
j
flQN FKATER
1.00
ACTORSAIR
1.28
CASINGTHICK- IFAC-NESS 1TORSINCHES 1
!l250 ÎL38.1875 11.55.2500 11.71.3750 12.03.5000 !2.39iiiiiiiiiiii
RANGE ! CPSDESIGNATION*! FULL-j SCALE 1. _ _ - - _ _ { _ - _ -
5 I 2510 ! 5025 i 12550 ! 250100 ! 500250 ! 1250500 ! 25001000< IKJ! 50002500(2.5Ki: 125005000 ( 5KJ! 25000lOOOOi 1010! 5000050000 ( 50KJ! 250000100000 tlOOK) 1500000i i
CPS ORHR/HRPERINCH 151025501002505001000250050001000050000100000
RANGE CODES FOR•A-E1 FORKATS.•CE-FIELD' ENTRYPOS 5 : POS 7L -
l
111
10345a71890i73
ADDITIONAL!* Hypothetical unit: Factors and ranges entered are hypothetical; theyDETAILS: i siipiy provide order at lagnitude of values, but do relate to test data.
F I G U R E 5.2BEXAMPLE TABULAT ION OF GAMMA-LOG F A C T O R S , S C A L E S & RANGE C O D E S - TYPE A3
41
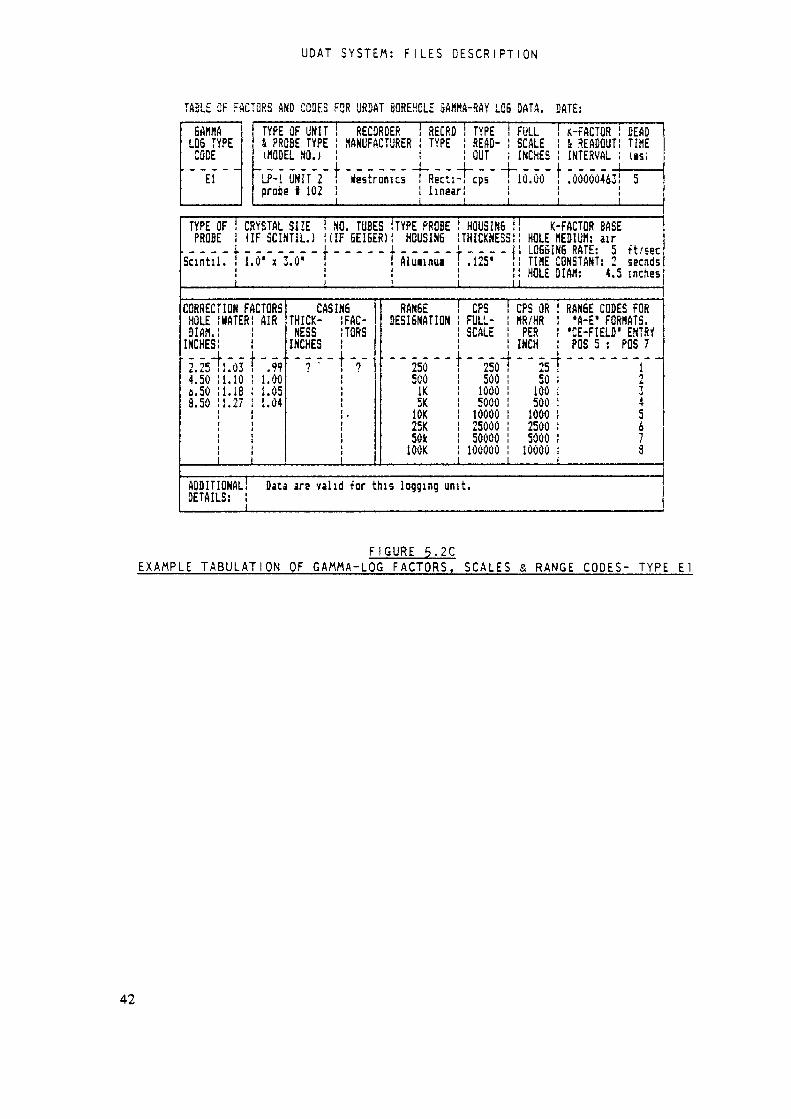
UDAT SYSTEM: F I L E S D E S C R I P T I O N
TABLE OF FACTORS AND COSF.S FOR ÜRDAT BOREHOLE 5AflHA-RAY LQ6 DATA. BATE:
SAMMALQS TYPECODEEl
TYPE OF UNITi PROBE TYPE(«QUEL NO.)LP-I UNÎT 2 1probe i 102
RECORDER«ANUFACTURERL _ _ _ _ _ _ _,tfestranics
RECRD i TYPE ! FULLTYPE ! READ- ! SCALE! OUT ; INCHESRect:-! cps I 10. 00linear! !i i
K-FACTÛR i BEAD& READOUT: TIMEINTERVAL l (is)(.._._ J ————.00000463! 5It!
TYPE OF ! CRYSTAL SIZE i NO. TUBES iTYPE PROBEPROBE ! (IF 3CINTIL.) ! (IF GEIGER) ! HOUSING1 | |
Scintil. ! 1.0' x 3.0' î ÎÂlminui ]: : :I 1 !
CORRECTION FACTORSHOLE ! HATERÖIA«. !INCHES:' 2 al:« '4.50 11.10a. 50 11.183.50 11.271l1l1111
AIR
' ".WLOOL 051.04
1 1
CASINGTHICK-NESSINCHES......
FAC-TORS
Y
j
RANGEDESIGNATION
' " " 250 " " '500IK5KiOK25K50k100K
HOUSING i K-FACTQR BASETHICKNESS: HOLE NEDIU«: airr . . . . J LOGGING RATE: 5 ft/sec' .125' ! TIHE CONSTANT: 2 secnds! HOLE DIA«: 4.5 inches1 1
CPSFULL-SCALE
~25u"50010005000100002500050000100000
CPS OR«R/HRPERINCH' " " 25"5010050010002500500010000
RANGE CODES FOR•A-E" FORMATS.•CE-FIELU" EHTRYPOS 5 : POS 7..._.._T-27•J45i78i i i
ADDITIONAL! Data are valid for this logging unit.DETAILS: !
F IGURE 5 . 2 CE X A M P L E T A B U L A T I O N OF GAMMA-LOG F A C T O R S , S C A L E S & R A N G E C O O E S - TYPE E l
42

UDAT SYSTEM: F I L E S DESCRIPTION
TABLE OF FACTORS AND CODES FOR URDAT BOREHOLE âAIMA-RAf LÛ5 DATft. DATE: Jan. 1988
GAHMALOS TYPECODE" ËB~ " ~
TYPE OF UNIT i RECORDER ! RECRD TYPE i FÜLL i K-FACTOR4 PROBE TYPE ! MANUFACTURER ! TYPE READ- ! SCALE ! i READOUT(HODEL NO.) i i OUT ! INCHES ! INTERVALHount Sapris t Ht. Sopris T Rect.^cps i 4.27 t VariableModel 11 ! ! analog M 120 u;!U l P--JT7«? ! ! I I 1 . . _ .i
BEADTIKE(iSJ, i ft \,,0| ii
TYPE OF i CRYSTAL SIZE ! NO. TUBES ITYPE PROBE HOUSING ! K-FACTOR BASEPROBE ! (IF SC1NTÎL.) i (IF SEIGER)! HOUSINGI I |
Scint. ! .5' x 1.5* ! Î Steelf i i1 1 !
CORRECTION FACTORSHOLE J HATERDIA«, iINCHES!2725 ~Tl7o354.50 Î1.0766.5 il. 115
1t1j^itiiiii
AIR
•;-
f J__
CASINGTHICK-NESSINCHES' ".0625" '.1250.1875.2500.3750
FAC-TORS
' 1. 241.331.431.671.87
RANGEDESIGNATION
' " " " " 50~1002005001000200050001000020ÔOÛ50000100000
THICKNESS! HOLE HEDIUJJ: airL . _ _ _ J LOGGING RATE: 5 . .. „.*f/sor' .125' ! TIHE CONSTANTS sec eii.! HOLE DIA«: 4.Îi inches
CPS CPS OR ! RANGE CODES FORFULL-SCALE
- a."1002ÛU500100020005000100002000050000100000
HR/HR ! 'A-c1 FORMATS.PER ! 'CE-FIELD' ENTRYINCH ! POS 5 :Ï0759I21.186!42.37!105.931211.86!423.73!1059.3 i2118.64!4237.3 i10593. ! 121186.4 ! 1i i
POS 7" "l" "7
345678901
ADDITIONAL! Obtained by phone froi Mount Sopris in Delta, Cola.DETAILS: !i
FIGURE 5.2DEXAMPLE TABULATION OF GAMMA-LOG FACTORS. SCALES & RANGE CODES- TYPE E8
43

UDAT S Y S T E M : F I L E S D E S C R I P T I O N
, Rscard Foriit ,
cal um i 1111 i ! 11112222222222333333333344444444445555555555&66ôù6666b777777777f3nusûers >!123456789ôi234567390i:345o789ûl23456789ûl234567B9ôl23456789ûl23456789ûl234567890
Record 1 :Ai 2û.4ô,lûû,20ô,400,5ûû,iûOO,2QûO,4ôûO,5ûOo,lûOOû,200ôû,4ûûûô,2 !A3 5,10,25.50,100,250.500,100Û,25ÔÛ,50ÛO,1ÛÛOÔ,5ÔÔOÛ,100ÔÔÔ,3 !Ei 25,50,100,500,1000.2500,5000,100004 IE8 lu.59,21.186,42.37,105.93,211.86,423.73,Iô59.3,2118.i4,4237.3,10593,21186,4,
F I G U R E 5 .3EXAMPLE OF SAMPLE-TYPE CODES AND A S S O C I A T E D RANGE S C A L E S IN F I L E "RNGTBL"
44

UDAT SYSTEM: F I L E S DESCRIPTION
Range Full Sealsi t of cps12345678910li121314151617IB192021
L
.01.02.025.05.1.2.25.51.02.02.53.04.05.010.020.025.030.040.050.0100.0
Rangs
222324252527282930313233343536373839404142
Full Sealsi of cps
200. 1.2K)250. t.25kJ300. <.3K)400. I.4K)500. (.5fci
1,000. (IK)2,000. (2K)2,500. i2.SH]3,000. (3K)4,000. (4K)5,000. (5K>
10,000. (iOK)20,000. (2ÔK)25,000. (25K)30,000. (30K>40,000. (40K)50,000. (50K)
100,000. (100K)200, ÛOÛ. (200K)250,000. (250K)300,000. (3ÔOK)
Rangs
4344454647484950515253545556575859606162i
Full 5c1 af c400,000.500. 000.1,250.1,500.7,500.
600.750.800.8,000.80,000.6,000.1,000,000.12,500.1,600.3,200.640.9,000.18,000.19,000.15,000.
alsps(40ÜK)(5ÔÛK1Ü.25K)ll.SKi(7.5K)(.6K){.75K)UK)(8(0(80K)(6K)UOÛÛK)Ü2.5K)(1.6K)(3.2K)1.64K)<9K)(18K)(19K)(15K)
FIGUREFULL SCALE CPS VALUES FOR "F"-TYPE RANGE NUMBERS (5/8?)
45
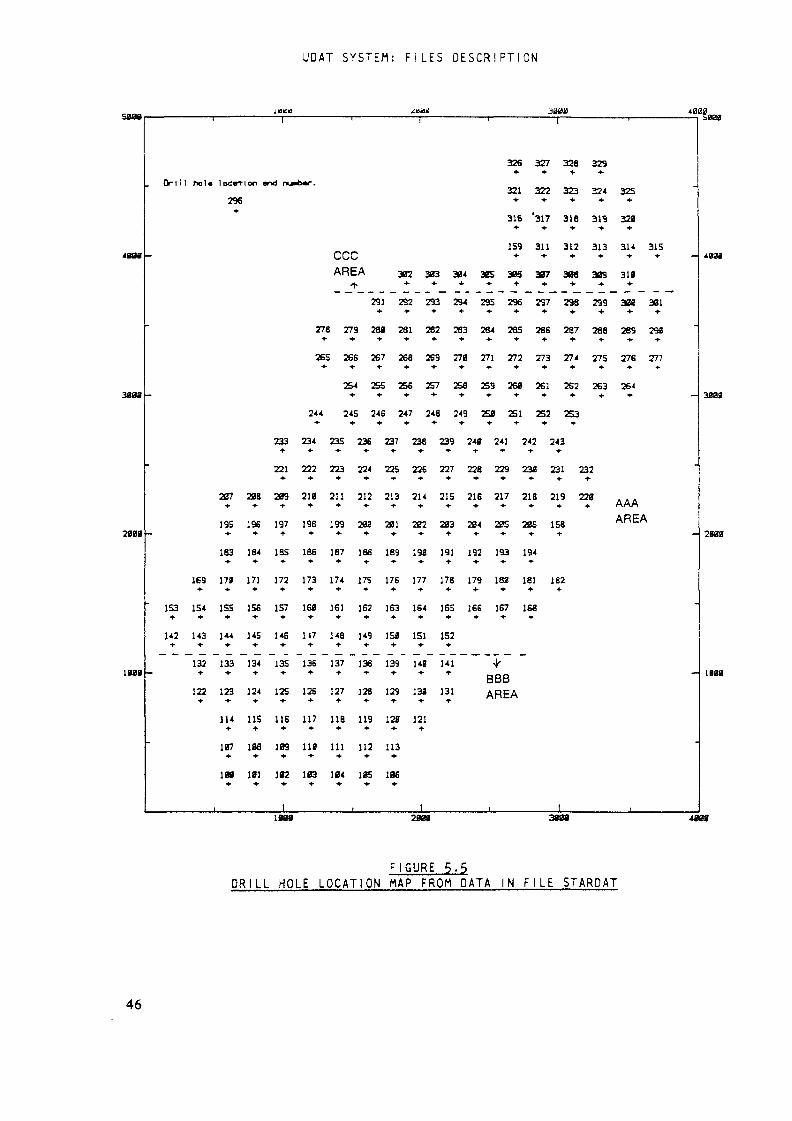
UDAT SYSTEM: F I L E S DESCRIPTION
IB«« aiail J4J0Dsaaa,———————,——————————————,——————————————,———————-
40M
3008
•2am
1008
326 327 328 329* • * • + +Drill hoi« location end nu»bar.
321 322 323 324 325296 •*• + ••• t- +
316 '317 316 319 32B•*• -I- -t- 4- •*•
CCC159 311 312 313 31* 315
AAAAREA
AREA 302 303 304 305 306 307 308 309 318
291 292 293 294 295 296 297 298 299 308 301
278 279 288 281 282 283 264 285 286 287 288 289 29fl
265 266 267 268 269 270 271 272 273 274 275 276 277
254 255 25« 257 258 259 260 261 262 263 264
244 245 246 247 248 249 258 251 252 2S3
233 234 235 236 237 238 239 240 241 242 243
221 222 223 224 225 226 227 228 229 230 231 232
207 208 209 210 211 212 213 214 215 216 217 218 219 220
195 196 197 196 199 200 201 202 203 204 205 2B6 158
183 184 185 186 187 188 189 190 191 192 193 194
169 17» 17] 172 173 174 175 176 177 178 179 182 181 182
153 154 155 156 157 160 161 ]62 163 164 165 166 167 168
142 143 144 145 146 1(7 146 149 150 151 152
132 133 134 135 136 137 136 139 148 141 ^* * * * * * * * * * B B B
122 123 124 125 126 127 128 129 13» 131 AREA
114 115 HE 117 118 119 122 121
107 106 109 110 111 112 113
108 101 102 103 104 105 106» + * + » * *
_______t_________I_________,_________I_________i_________t_____
4008
3003
2200
1000
1180 2008 3808 4808
FIGURE 5.5DRILL HOLE LOCATION MAP FROM DATA IN F I L E STARDAT
46

UDAT PRIMARY F I L E S
6.0 UDAT SYSTEM — PfUHMf FILES. INDIVIDUAL DATA FORMATS
The format chosen for sample data entry depends on the type and form of datareceived (Section 3-0). Figure 6.1, "a" through "1", shows all data for-mats described below. The carets between columns at the base of eachformat indicate the position of assumed decimals. No decimal points areactually entered in any of the sample data formats, with the exception ofthe dead time (Section 5-3«5). and the special entry code for time basechange (Section 6.3-2.1*)
Note: Refer to Figure 4.1a-b for actual examples of any of theformats described below.
F i e l d descriptions for common header record data elements discussed in Sec-tion 5-0 are noted briefly, but the detailed descriptions are not repeated.The specific fields for common entries described under the contiguous,unimetal format are noted, but not described in detail, for the contiguousbimetal, non-contiguous, and borehole formats.See Section 1.5 for review of abbreviations and symbols.
6.1 CONTIGUOUS SAMPLE FORMAT
The "contiguous " sample format provides a method for entering sample dataas a l i s t of contiguous sample intervals, with each interval referenced by asample thickness and corresponding grade (s) . Samples are listed in order ofincreasing distance from the point of o r i g i n referenced by the collar ele-vation. Any intervals of zero grade must be entered as such. The intervalrepresented by the depth to first sample is assumed to be of zero grade.There is no entry for "total depth sampled"; if a barren interval is knownto exist beyond the sampled interval, it should be entered at zero grade.There are two variations of the contiguous format: one for uranium assaysonly ("unimetal"), Figures 6.la & b, and one for both uranium and vanadiumassays ("bimetal"), Figures 6.1c & d. The only differences between thesetwo formats are the sample-type code and the sample entries. A given sampleset must be entirely in one format or the other.
Note: In the contiguous format, the header card contains thebeginning sample intervals.
6.1.1 Header Record, Descriptive DataFigures 6. la (unimetal) and 6.1c (bimetal) show the header record formats,
6. /. /. / Record CountC(l-3), E=N; see Section 5 - 1 - ^ J leave blank or enter zero.
47
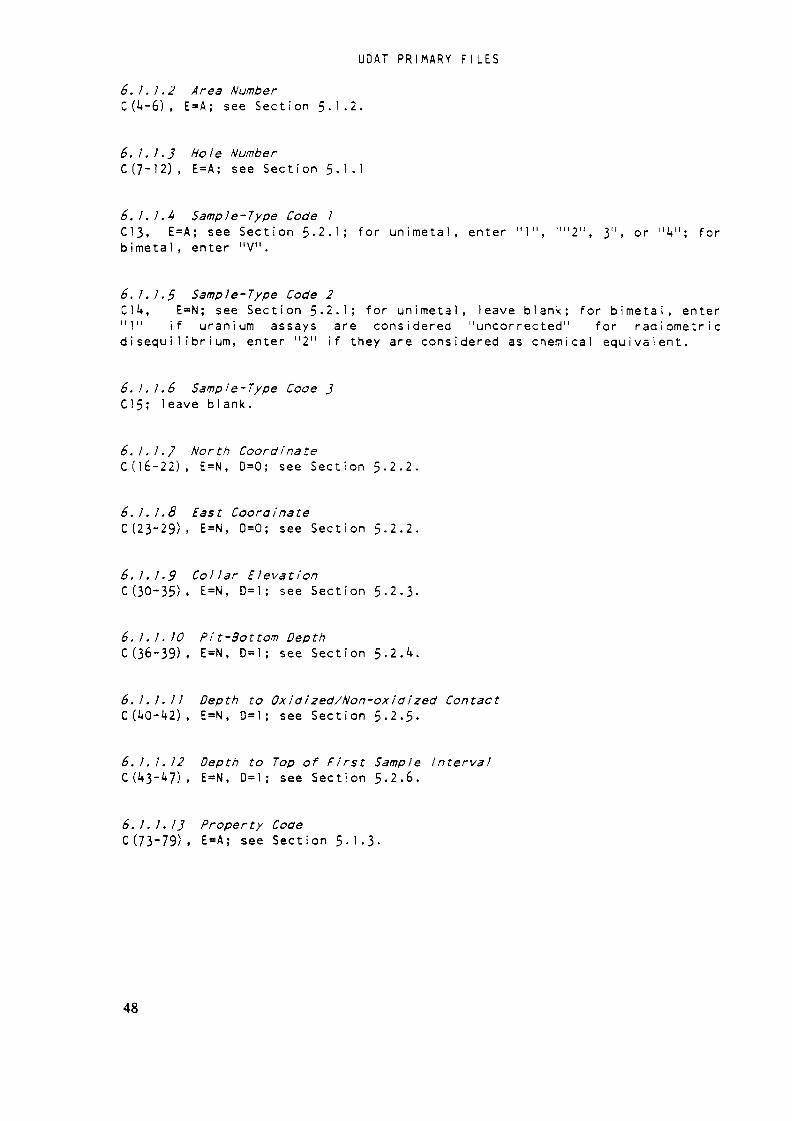
UDAT PRIMARY FI LES
6.1.1.2 Area NumberC (U-6) , E=A; see Section 5.1.2.
6.1.1.3 Hole NumberC(7-12), E=A; see Section 5.1.1
6.Ï./.4 Sample-Type Code 1C13, E=A; see Section 5.2.1; for unimetal, enter "1", ""2", 3", or "1*"; forbimetal, enter "V".
6.1.1.5 Sample-Type Code 2C14, E=N; see Section 5-2.1; for unimetal, leave blank; for b i m e t a l , enter"1" if uranium assays are considered "uncorrected" for radiometricd i s e q u i l i b r i u m , enter "2" if they are considered as chemical equivalent.
6. J.I.6 Sample-Type Code 3C15; leave blank.
6.1.1.7 North CoordinateC06-22), E=N, D=0; see Section 5-2.2.
6.1.1.8 East CoordinateC (23-29). E=N, 0=0; see Section 5.2.2.
6.1.1.9 Collar ElevationC (30-35), E=N, D=l; see Section 5-2.3-
6. 1. 1. 10 Pit-Bottom DepthC (36-39), E=N, D=l; see Sec t i on 5 .2 .U.
6.1.1.11 Depth to Oxidized/Non-oxidized Contact0(1*0-1*2), E=N, 0=1; see Sect ion 5 - 2 . 5 -
6. 1. 1. 12 Depth to Top of FÎrst Sample IntervalC (43-1*7), E=N, 0=1; see Sect ion 5 .2 .6 .
6. 1.1. 13 Property CodeC (73-79). E=A; see Sect ion 5 - 1 - 3 -
48
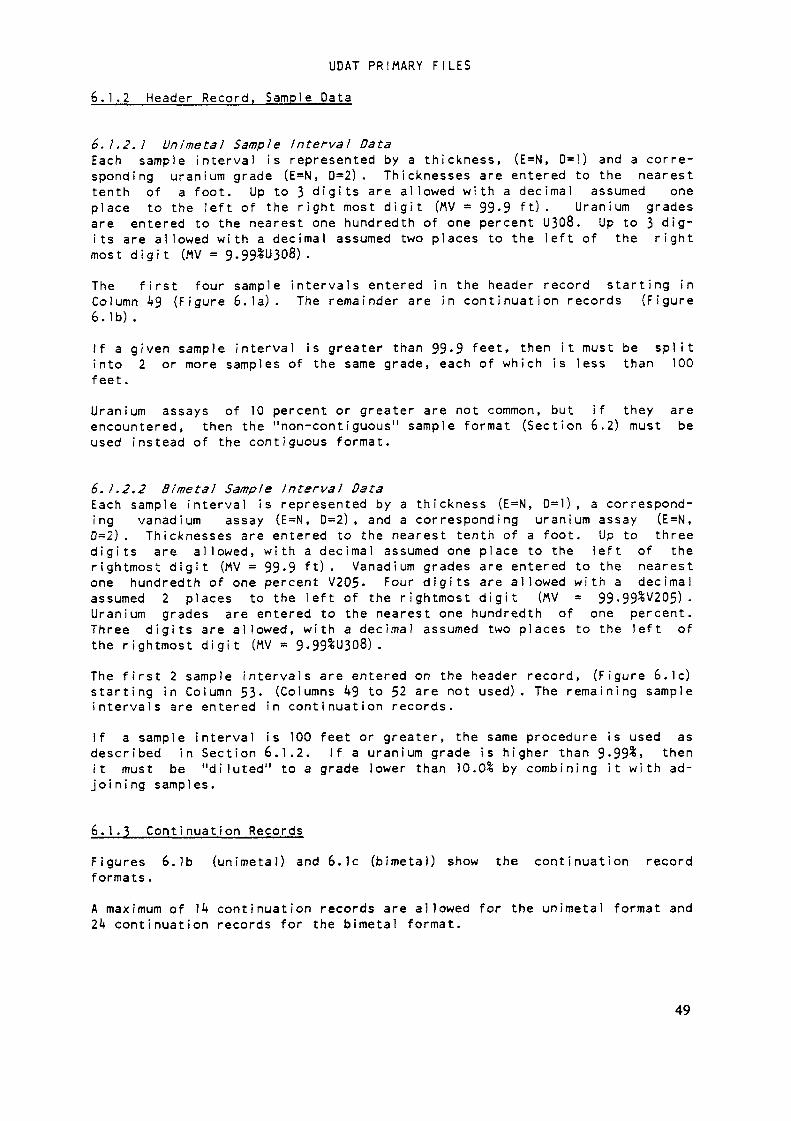
UDAT PRIMARY F I L E S
6.1.2 Header Record. Sample Data
6.1.2. 1 Unimetal Sample Interval DataEach sample interval is represented by a thickness, (E=N, D=l) and a corre-sponding uranium grade (E=N, D=2). Thicknesses are entered to the nearesttenth of a foot. Up to 3 digits are allowed with a decimal assumed oneplace to the left of the right most d i g i t (MV = 99-9 ft). Uranium gradesare entered to the nearest one hundredth of one percent U308. Up to 3 dig-its are allowed with a decimal assumed two places to the left of the rightmost d i g i t (MV = 9-99*U308).
The first four sample intervals entered in the header record starting inColumn J*9 (Figure 6. la). The remainder are in continuation records (Figure6.1b) .If a given sample interval is greater than 99-9 feet, then it must be s p l i tinto 2 or more samples of the same grade, each of which is less than 100feet.Uranium assays of 10 percent or greater are not common, but if they areencountered, then the "non-contiguous" sample format (Section 6.2) must beused instead of the contiguous format.
6.1.2.2 Bimetal Sample interval DataEach sample interval is represented by a thickness (E=N, 0=1), a correspond-ing vanadium assay (E=N, D=2), and a corresponding uranium assay (E=N,D=2). Thicknesses are entered to the nearest tenth of a foot. Up to threed i g i t s are allowed, with a decimal assumed one place to the left of therightmost d i g i t (MV = 99-9 ft). Vanadium grades are entered to the nearestone hundredth of one percent V205« Four d i g i t s are allowed with a decimalassumed 2 places to the left of the rightmost d i g i t (MV = 99-99%V205).Uranium grades are entered to the nearest one hundredth of one percent.Three d i g i t s are allowed, with a decimal assumed two places to the left ofthe rightmost d i g i t (MV = 9.99%U308) .The first 2 sample intervals are entered on the header record, (Figure 6.1c)starting in Column 53. (Columns U9 to 52 are not used). The remaining sampleintervals are entered in continuation records.
If a sample interval is 100 feet or greater, the same procedure is used asdescribed in Section 6.1.2. If a uranium grade is higher than 9-99%. thenit must be "diluted" to a grade lower than 10.0% by combining it with ad-joining samples.
6.1.3 Continuation RecordsFigures 6.1b (unimeta!) and 6.1c (bimetal) show the continuation recordformats.A maximum of Ik continuation records are allowed for the unimetal format and21+ continuation records for the bimetal format.
49
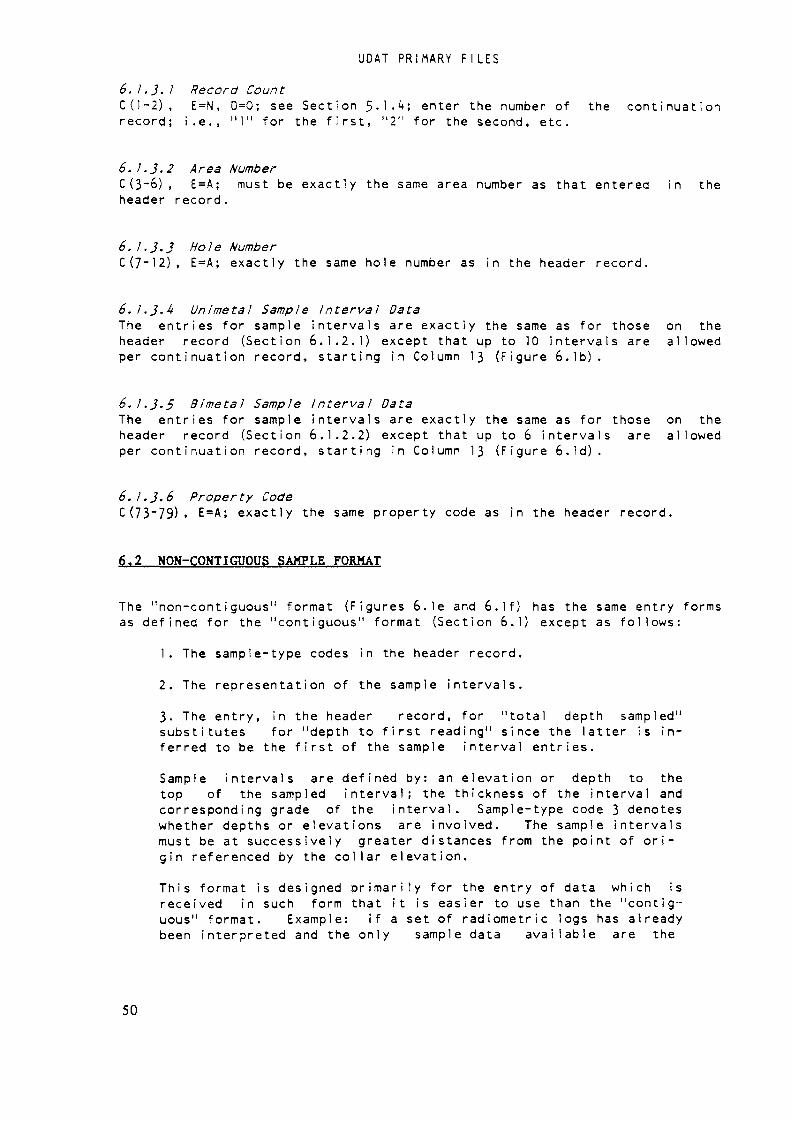
UOAT PRIMARY F I L E S
6.1.3.1 Record CountC{l-2), E=N, 0=0; see Section 5 - l - ^ ; enter the number of the continuationrecord; i.e., "1" for the first, "2" for the second, etc.
6.1.3.2 Area NumberC(3-&), E=A; must be exactly the same area number as that entered in theheader record.
6. 1.3.3 Hole NumberC(7~12), E=A; exactly the same hole number as in the header record.
6./.J.4 Un/métal Sample Interval DataThe entries for sample intervals are exactly the same as for those on theheader record (Section 6.1.2.1) except that up to 10 intervals are allowedper continuation record, starting in Column 13 (Figure 6.1b).
6.1.3.5 Bimetal Sample Interval DataThe entries for sample intervals are exactly the same as for those on theheader record (Section 6.1.2.2) except that up to 6 intervals are allowedper continuation record, starting in Column 13 (Figure 6.Id).
6.1.3.6 Property CodeC(73"79)i E=A; exactly the same property code as in the header record.
6.2 NON-CONTIGUOUS SAMPLE FORMAT
The "non-contiguous" format (Figures 6.le and 6.If) has the same entry formsas defined for the "contiguous" format (Section 6.1) except as follows:
1. The sample-type codes in the header record.2. The representation of the sample intervals.3. The entry, in the header record, for "total depth sampled"substitutes for "depth to first reading" since the latter is in-ferred to be the first of the sample interval entries.Sample intervals are defined by: an elevation or depth to thetop of the sampled interval; the thickness of the interval andcorresponding grade of the interval. Sample-type code 3 denoteswhether depths or elevations are involved. The sample intervalsmust be at successively greater distances from the point of ori-gin referenced by the collar elevation.This format is designed p r i m a r i l y for the entry of data which isreceived in such form that it is easier to use than the "contig-uous" format. Example: if a set of radiometric logs has alreadybeen interpreted and the only sample data available are the
50

UDAT PRIMARY F I L E S
depth (or elevation) of predefinednon-contiguous format is most appropriate.
anomalies, then the
Intervals of "barren" material need not be entered. Any i m p l i e dinterval between one entry and the next is assumed to be barren.Example: if one entry represents 125-5 feet in depth, 10 feetthickness and 0.10% U308; and the next entry represents 140.0 indepth, 5 feet in thickness and 0.20% U308; then actually 3 threeintervals are generated as follows:
10.0 ft. @ 0.10% U308,4.5 ft. @ 0.00% U308, and5.0 ft. @ 0.20% U308.
Note: It is necessary to insure that the interval implied byone elevation or depth and corresponding thickness does not over-lap onto the next interval, or the data wi 1 Î be rejected.' Exam-ple: An interval represented by an elevation of 5000-0 feet and athickness of 10.0 feet could not be followed by an interval withelevation of 4991 feet.
6.2.1 Header RecordThe header record format is shown on Figure 6.le.
6.2.1.1 Entries Identical to Those in the "Contiguous" FormatData elements in the non-contiguous format which have the exact same formatas for the contiguous format on header and/or continuation records (Section6.2.1) are: record count, area number, hole number, north and east coordi-nates, collar elevation, pit-bottom depth, depth to ox idized/unoxidizedcontact, and property code.Data elementsfoilows:
which differ from those in the contiguous format are listed as
6.2. 1.2 Sample type code 1C13, E=A; see Section 5.2.1; enter "6",(7", "8", or "9".
6.2, I.J Sample type code 2C14, E=A; see Section 5.2.1; enter a "1".
6.2.1. 4 Sample type code 3C15» E=A; see Section 5-2.1; enter a or f "I1 the elevation/depth entry denotes elevation at the top of each sample interval;the elevation/depth entry denotes depths to the top of each samplefrom the point referenced by the collar elevation.
if "2",interval
51
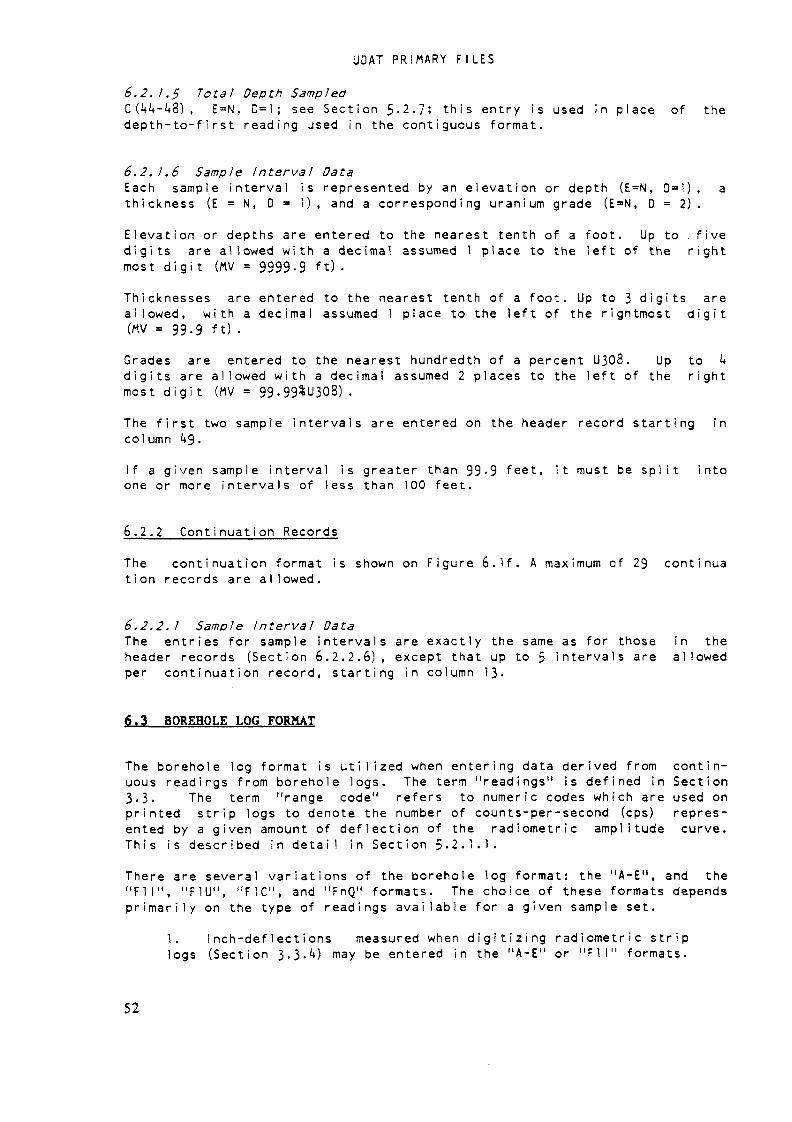
UDAT PRIMARY F I L E S
6.2, 1.5 Total Depth SampledC (1+4-48) , E=N, D=l ; see Section 5-2.7; this entry is used in place of thedepth-to-f i rst reading used in the contiguous format.
6.2. 1 .6 Sample Interval DataEach sample interval is represented by an elevation or depth (E=N, 0=1), athickness (E = N, D = 1) , and a corresponding uranium grade (E=N, D = 2) .Elevation or depths are entered to the nearest tenth of a foot. Up to . fivedigits are allowed with a decimal assumed 1 place to the left of the rightmost d i g i t (MV = 9999-9 ft) .Thicknesses are entered to the nearest tenth of a foot. Up to 3 d i g i t s areallowed, with a decimal assumed 1 place to the left of the rightmost d i g i t
= 99.9 ft) .Grades are entered to the nearest hundredth of a percent U308. Up to kd i g i t s are allowed w i t h a decimal assumed 2 places to the left of the rightmost d i g i t (MV = 99-99*U308).The first two sample intervals are entered on the header record starting incolumn 1+9.If a given sample interval is greater than 99-9 feet, it must be s p l i t intoone or more intervals of less than 100 feet.
6.2.2 Continuation RecordsThe continuation format is shown on Figure 6.If. A maximum of 29 continuation records are allowed.
6.2.2.1 Sample Interval DataThe entries for sample intervals are exactly the same as for those in theheader records (Section 6.2.2.6), except that up to 5 intervals are allowedper continuation record, starting in column 13-
6.3 BOREHOLE LOG FORMAT
The borehole log format is u t i l i z e d when entering data derived from contin-uous readings from borehole logs. The term "readings" is defined in Section3.3. The term "range code" refers to numeric codes which are used onprinted strip logs to denote the number of counts-per-second (cps) repres-ented by a given amount of deflection of the radiometric amplitude curve.This is described in detail in Section 5-2.1.1.There are several variations of the borehole log format: the "A-E", and the"Fil", "F1U", "F1C", and "FnQ" formats. The choice of these formats dependsp r i m a r i l y on the type of readings available for a given sample set.
1. Inch-deflections measured when d i g i t i z i n g radiometric striplogs (Section 3.3.1») may be entered in the "A-E" or " F l l " formats.
52
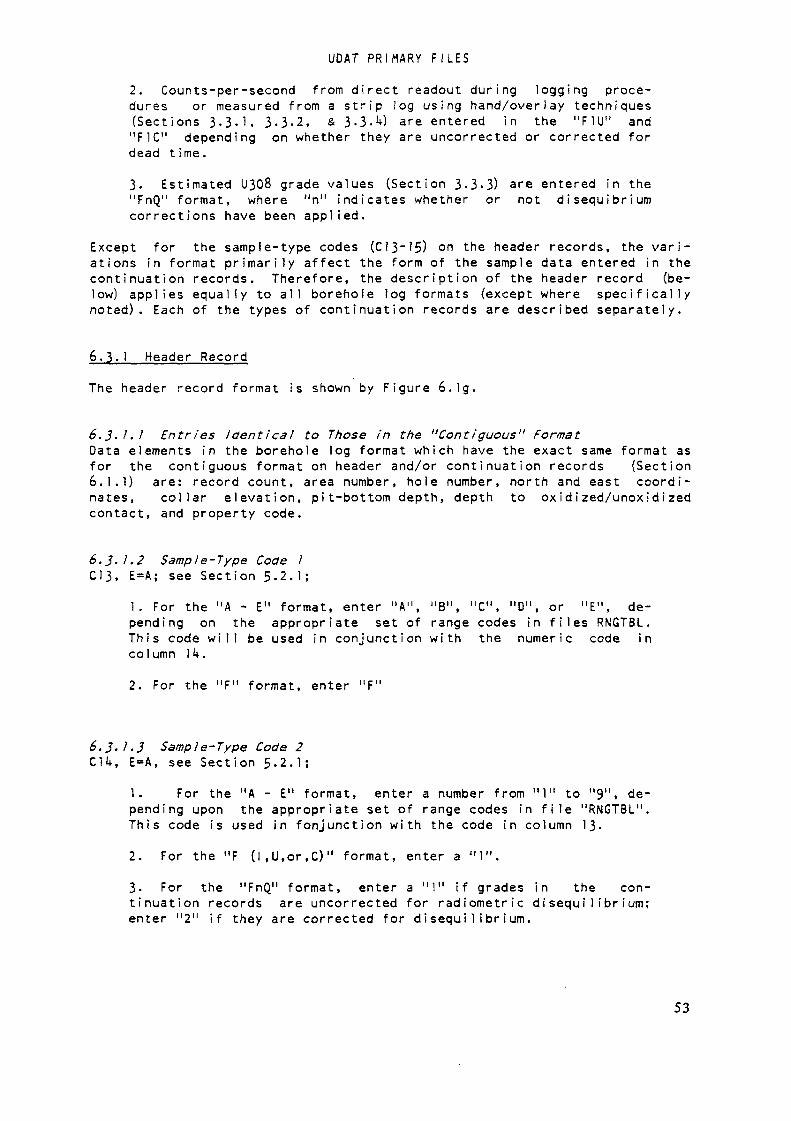
UDAT PRIMARY F I L E S
2. Counts-per-second from direct readout during logging proce-dures or measured from a strip log using hand/overlay techniques(Sections 3-3.1, 3-3-2, & 3-3-^) are entered in the "F1U" and"F1C" depending on whether they are uncorrected or corrected fordead time.3- Estimated U30.8 grade values (Section 3-3.3) are entered in the"FnQ" format, where "n" indicates whether or not disequibriumcorrections have been applied.
Except for the sample-type codes (C13~'5) on the header records, the vari-ations in format primarily affect the form of the sample data entered in thecontinuation records. Therefore, the description of the header record (be-low) applies equally to all borehole log formats (except where specificallynoted). Each of the types of continuation records are described separately.
6.3.1 Header RecordThe header record format is shown by Figure 6.1g.
6. J. 1 . 1 Entries Identical to Those in the "Contiguous" FormatData elements in the borehole log format which have the exact same format asfor the contiguous format on header and/or continuation records (Section6.1.1) are: record count, area number, hole number, north and east coordi-nates, collar elevation, pit-bottom depth, depth to oxidized/unoxidi zedcontact, and property code.
é.J. 1.2 Sample-Type Code 1C13, E=A; see Section 5.2.1;
1. For the "A - E" format, enter "A", "B", "C", "D", or "E", de-pending on the appropriate set of range codes in files RNGTBL.This code w i l l be used in conjunction with the numeric code incolumn 14.2. For the "F" format, enter "F"
6.3.}.3 Sample-Type Code 2C14, E=A, see Section 5.2.1;
1. For the "A - E" format, enter a number from "1" to "9", de-pending upon the appropriate set of range codes in f i l e "RNGTBL".This code is used in fonjunction with the code in column 13.2. For the "F (I.U.or.C)" format, enter a "1".3- For the "FnQ" format, enter a "1" if grades in the con-tinuation records are uncorrected for radiometric disequilibrium;enter "2" if they are corrected for disequilibrium.
53
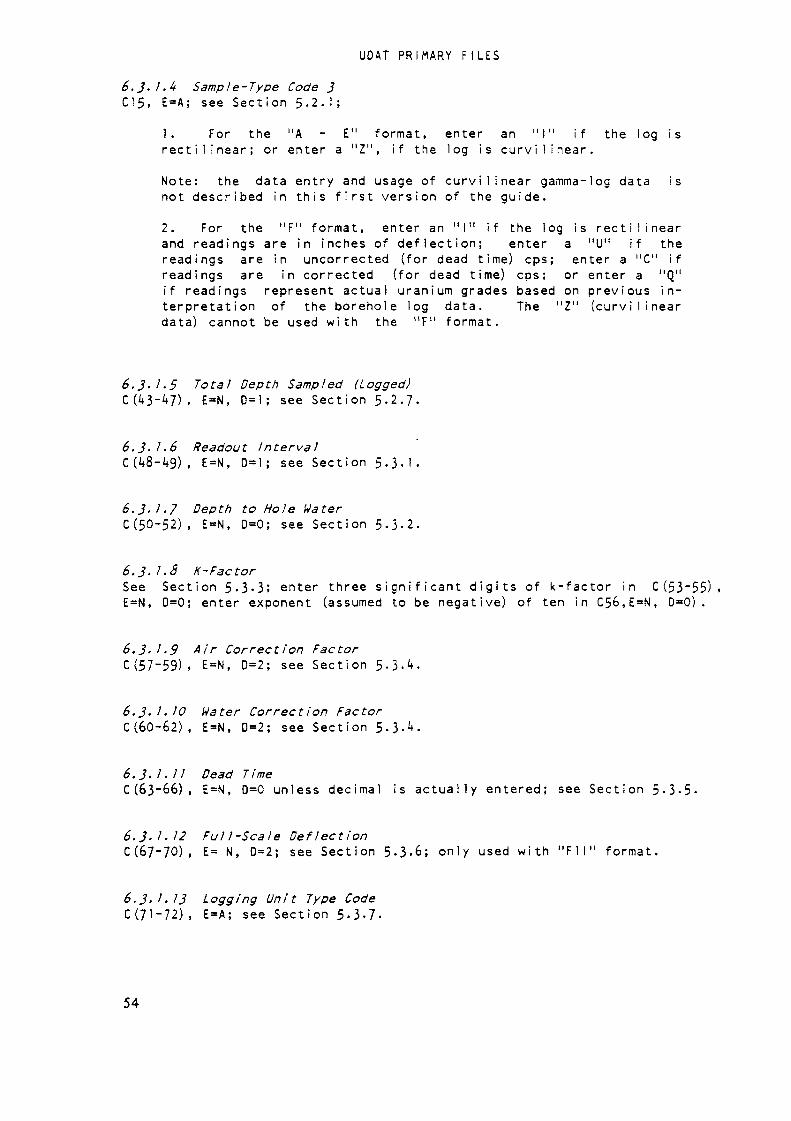
UDAT PRIMARY FI LES
6.J./.4 Sample-Type Code 3CIS. E=A; see Section 5-2.1;
1. For the "A - E" format, enter an "I" if the log isr e c t i l i n e a r ; or enter a "Z", if the log is c u r v i l i n e a r .Note: the data entry and usage of curvilinear gamma-log data isnot described in this first version of the guide.2. For the "F" format, enter an "I" if the log is rectilinearand readings are in inches of deflection; enter a "U" if thereadings are in uncorrected (for dead time) cps; enter a "C" ifreadings are in corrected (for dead time) cps; or enter a "Q"if readings represent actual uranium grades based on previous in-terpretation of the borehole log data. The "Z" (curvilineardata) cannot be used with the "F" format.
6.3.1.5 Total Depth Sampled (Logged)C(J*3-U7), E=N, 0=1; see Section 5-2.7.
6.3. 1.6 Readout IntervalC(J+8-J»9), E=N, 0=1; see Section 5.3-1.
6.3.1.7 Depth to Hole HaterC(50-52), E=N, D=0; see Section 5-3.2.
6.3.1.8 K-FactorSee Section 5-3-3; enter three sign i f i c a n t d i g i t s of k-factor in C(53~55).E=N, D=0; enter exponent (assumed to be negative) of ten in C56,E=N, 0=0).
6.3' 1-9 Air Correction FactorC (57-59), E=N, 0=2; see Section 5-3.<+.
6.3. 1. 10 Hater Correction FactorC (60-62), E=N, 0=2; see Section 5-3- 1*-
6.3.1.11 Dead TimeC(63-66), E=N, 0=0 unless decimal is actually entered; see Section 5-3-5'
6.3.1.12 Full-Scale DeflectionC(67~70), E= N, 0=2; see Section 5-3.6; only used with " F l l " format.
6.3-1•13 Logging Unit Type CodeC(71-72), E=A; see Section 5-3-7.
54
UOAT PRIMARY F I L E S
6.3-2 Continuation RecordsContinuation record formats are shown on Figure 6.1 "h" through "k".A maximum of 37 continuation cards are allowed. The entries for recordcount, area number, hole number, and property code are the same as those forthe header record.Columns 13 and \k are not used. Columns 15 through 72 are subdivided into 8fields which w i l l be hereafter termed "continuation entry fields" or CE-fields. Each CE-field consists of seven columns; these w i l l be referred toas positions one through seven, with the leftmost position being "1" and therightmost being "7". Position 1 is usually left blank and only used undercertain conditions.The first CE-field begins in column 15- Eight CE-fields are allowed perrecord; fields should not be skipped (entire field left blank) unless theyfollow the last v a l i d reading of a sample set.A CE-field may contain either a "reading" (which denotes inches-deflection,cps, or grade) or a "special entry". The sample-type codes in the headerrecord determine which type of reading is used; only one type can be used inany given sample set. Most of the special entries apply equally to allborehole log data types; one is used only for inch-deflection readings takenfrom strip logs (Section 6.3-2.4).
6.J.2. / Readings in Inches-of-DeflectionAn "inches-of-deflection" reading is the distance ("deflection") from thebaseline of a printed log to a point on the radiometric amplitude of the logand is measured along a l i n e perpendicular to the baseline. It is enteredto the nearest hundreth of an inch in positions 2 through k of the CE-field.Up to three d i g i t s are normally entered with a decimal assumed between posi-tions 2 and 3- The deflections on a strip log seldom extend beyond 10inches from the baseline. However, position 1 of the f i e l d may be used ifthe deflection is 10 inches or greater.In order to define how many counts-per-second are represented by the meas-ured deflection, a range code (Sections 5-2.1.1 and 5-2.1.2) must be en-tered in positions 5 and 7 of the CE-field (Figures 6.1, "j" & "k").Position 7 contains the "unit" d i g i t of the range code and position 5 con-tains the "tens" d i g i t . Range codes do not consist of more than 2 digits.If the range code is 2, then position 7 w i 1 1 contain a "2" and position 5is left blank; if the range code is 13. then position 7 contains a "3" andposition 5 w i l l contain a "1".The "inches-deflection" type reading is used when d i g i t i z i n g a log by hand/overlay or automatic methods. The type of range code used is determined bythe Sample-Type Codes ! and 2 (Section 5-2.3).
6.J.2.2 Readings in Counts-Pet—SecondCounts-per-second ("cps") readings are obtained by direct measurement of thegross count radioactivity recorded by the logging sensor or by analysis ofthe deflection of the radiometric amplitude curve on printed logs. A "U" or"C" in column 15 (Sample-Type Code 3) on the header record automatically
55
UDAT PRIMARY F I L E S
i d e n t i f i e s all radiometric readings in the continuation records as beinguncorrected (U) or corrected (C) cps.Cps readings are entered to the nearest unit, in position 2CE-field (Figures 6.1, j & k) . Note: on these figures,do not apply to cps readings and should be ignored.Up to 6 d i g i t s are allowed (MV = 999999 cps). If a valuethen position 1 may be used for a " m i l l i o n s " d i g i t .
through 7 ofthe carets
i n
the
exceeds 999999.
6.3.2.3 Interpreted Uranium Values"Interpreted values" represent actual estimates of uranium content (Section3•3•3)• They are entered to the nearest thousandth of one percent in posi-tions 3 through 7 of the CE-fields as shown on Figures 6.1, j & k. Thecaret shows the position of the decimal assumed between positions k and 5of the CE-fields.
6.}.2.4 Spec/a/ EntriesThe "special entries" (Figure 6.11) allow additional descriptive data to beentered in the the continuation records as well as providing for anychanges, w i t h i n a logged interval, in the o r i g i n a l interpretai on parameterswhich are entered in the header record.During the course of logging procedures, certain segments of a borehole aresometimes logged using different parameters. This happens frequently when aborehole is only p a r t i a l l y logged because of blockage in the hole or mal-functioning of the logging equipment: when the borehole is later reopenedand/or logged again, the portion which was previously logged may be skippedand the remainder logged with a different logging unit than previously used.Except for the "depth to first reading" (below), special entries may occurin any CE-field except the very fi r s t and very last CE-fields. in a sampleset. In addition, a given special entry cannot follow another l i k e entryunless separated by at least one reading; for example, a special entry fortime base change cannot immediately follow a previous time base change un-less one or more readings intervene. One type of special entry may imme-d i a t e l y follow a different special entry.
1. Depth to Firat Reading. The very first CE-field of the veryfirst continuation record following any header record in theborehole log format must contain the value for the "depth tofirst reading". It is entered to the nearest tenth of a foot inposition 2 through 6 with a decimal assumed between positions 5and 6 (MV=9999-9 ft, see Figures 6.l h and 6.1J). A lower casedash ("-") must be entered in the 7th C-E f i e l d position.2. Skipped Interval. Wherever readings have been deleted("skipped") because of obvious lack of significant representativeradioactivity, the thickness of the "skipped" interval is en-tered in the C E - f i e l d following the last reading entered. Thethickness is entered to the nearest tenth of a foot in positions2 through 5- Up to k d i g i t s may be entered, with a decimal as-sumed between positions k and 5. (MV=999-9 ft). The thickness of
56
UDAT PRIMARY F I L E S
a skipped zone rarely exceeds this magnitude but if necessary, a"thousands" d i g i t may be entered in position 1.A CE-field for a skipped interval may be entered between anyreadings of the sample set except:- at the beginning, since the depth to first reading is essen-t i a l l y a skipped interval,- at the end, or,- immediately following another skipped interval entry. Note thatthe decimal positon in the CE-field for skipped intervals is notthe same as that for the "depth to first reading".Position 6 is not used and a lower-case dash ("-") must be en-tered i n pos i t ion 7•3. Date Logged. An optional entry for the date on which the logwas made is provided by the special CE-field for "date". The num-ber of the month is entered in positons 2 and 3. and that forthe day in positions k & 5• Position 6 is not used and a "D"must be entered in position 7-4. Logging-Speed ("Time Base") Change Factor. The "logging speed"is the rate, in distance/time (feet/minute), at which the log-ging sensor travels along the borehole. If a hole is logged ata rate s i g n i f i c a n t l y different from that used when deter-m i n i n g the k-factor (the "base" logging speed"), an appropriatecorrection must be applied to the k-factor.This may be done by entering a "time base change factor" (Figure6.1k) in the CE-field of a continuation at the point where thechange takes place. The factor is entered to the nearest hun-dredth of a unit in positions 2 through 6 of the appropriateCE-field. Up to 5 d i g i t s are allowed, with a decimal assumed be-tween the positions 1* and 5 (MV=999.99). A "period" (".") must beentered in position 7-The value of the change factor must be that necessary toproperly correct the k-factor divided by base speed. Anyrecorded or calculated cps value following the logging-speedchange entry w i l l be automatically m u l t i p l i e d by the change fac-tor.For example: if a k-factor were determined at a logging speedof 5 feet per minute, but a change to a speed of 10 fpm was i n d i -cated on a log, then the entry for the logging speed change fac-tor would "2.0", assuming that the number of counts per secondrecorded over a given interval was inversely proportional to thelogging speed. This is not always true, so when changes inlogging speed are encountered in borehole log data, the equip-ment manufacturer should be consulted to determine the actual ef-fects of such changes.
51
UDAT PRIMARY F ILES
If and when it is indicated that the logging speed has reverted tothe "base" speed, then another logging-speed change entry mustbe made, with the factor entered as "1.0".The "base" logging speed for radiometric readings in a sample setis not entered as a data element, since it is assumed to be theone which was used in establishing the k-factor. However, itshould be known and recorded for reference purposes (see Figures5.2a & b).The time base change factor entry can also be used to correctfor other changes in logging conditions which may affect the va-l i d i t y of the given k-factor. Simply remember that it is am u 1 i p i i c a t i v e factor applied directly to the value forcounts-per-second.The term "time constant" (see Section 17) refers to the elec-tronic instrumentation of radiactivity-recording equipment andis the interval of time over which gamma-rays are actually"counted" internally before being recorded as (average) countsper second on an analog-chart or d i g i t a l rate-meter.If the time constant used in logging a hole is s i g n i f i c a n t l y d i f -ferent from that used when the k-factor was established, therew i l l be differences in the configuration of the anomalies. Atime constant increase w i l l result in a dampening effect of the"highs" and "lows", w h i l e a decrease w i l l intensify the "re-lief" of the anomalies. In general, the higher the time con-stant, the lower the logging speed should be.Too h i g h an increase in time constant may affect the v a l i d i t y ofthe k-factor, and as with the logging speed, the effects of suchchanges should be understood and taken into consideration. The"time-base change factor may be used to make the appropriate cor-rections.5. Dead Time Change. The entry for the dead time in the headerrecords provide for a value of up to 9999 microseconds or adecimal value of 3 si g n i f i c a n t d i g i t s (which covers most es-timated dead times). However should the dead time: 1) exceed9999 microseconds; 2) be reported as a decimal fraction withmore than 3 significant d i g i t s , or 3) change w i t h i n the loggedinterval; two special entries are provided.The first is for dead times greater than 9999 microseconds. Thedead time is entered to the nearest microsecond in positions 2through 6 of the CE-field. Up to five s i g n i f i c a n t d i g i t s may beentered with the decimal assumed to the right of position 6(MV=99999 microseconds). A "plus" sign ("+") must be entered inpos i ton 7 •The other entry is for fractional dead times consisting of morethen 3 d i g i t s to the right of the decimal. The dead time is en-tered in positions 2 through 6 of the CE-field. Up to five sig-nif i c a n t d i g i t s may be entered, with the decimal assumed between
58

UDAT PRIMARY F I L E S
positions 2 and 3 (MV=9.9999 microseconds). An "S" must be en-tered i n pos i t ion 7•6. K-Factor Change. The entry for K-factor in the header recordprovides up to three significant d i g i t s . If more than 3 signif-icant d i g i t s are required, or if the k-factor should changew i t h i n the the logged interval, a special entry is provided. Thek-factor is entered in positions 2 through 5 of the CE-field andthe exponent is position 6. Up to k significant digits may be en-tered with a decimal assumed to the right of position 5- Position6 contains the (negative) exponent of 10 as described in Section5.3.3. A "K" must be entered in position 7-7. Readout Interval. Any change in the interval at whichreadings are recorded within given borehole are entered to thenearest tenth of a foot in positions 2 through 5 of a CE-field.Up to k digits may be entered, with a decimal assumed betweenpositions 3 and k (MV=99.99 ft). An "I" must be entered in posi-tion 7 •8. Chart Baseline Change. This entry is useful when d i g i t i z i n ga radiometric strip log which contains one or more changes or"shifts" in its effective baseline. A shift to the right (to-wards the amplitude curve) is recorded as a positive change, anda shift to the left as a negative change. The distance of theshift from the original baseline is entered to the nearest hun-dredth of an inch in positions 3 to 5 of the CE-field. Up tothree d i g i t s are allowed with a decimal assumwed between positions3 and 4. If the shift is negative (away from the amplitudecurve) a negative or "minus" sign ("-") must be entered in posi-tion 2. A "B" must be entered in position ?•This entry precludes the neccessity of having to change de-flection measurements from the o r i g i n a l baseline to a newbaseline if a shift occurs and is especially convenient whend i g i t i z i n g logs by automatic methods.
6.4 LITHOLOGIC DATA RECORDS
Lithologie data, in UDAT primary files, consist of:1. 4-character alphanumeric codes that represent intervals iden-tified as geologic units.2. Corresponding depths, from the collar elevation referencepoint, to the top of each unit.
Lithologie units are usually determined in "bedded sandstone" type uraniumdeposits by examination of resistivity, self-potential, and other types ofborehole geophysical logging data. Such data may be present on the samestrip log that contains the gamma-ray log or they may be obtained from someother source. Geologic data may also be available as records of core orsample cuttings.
59
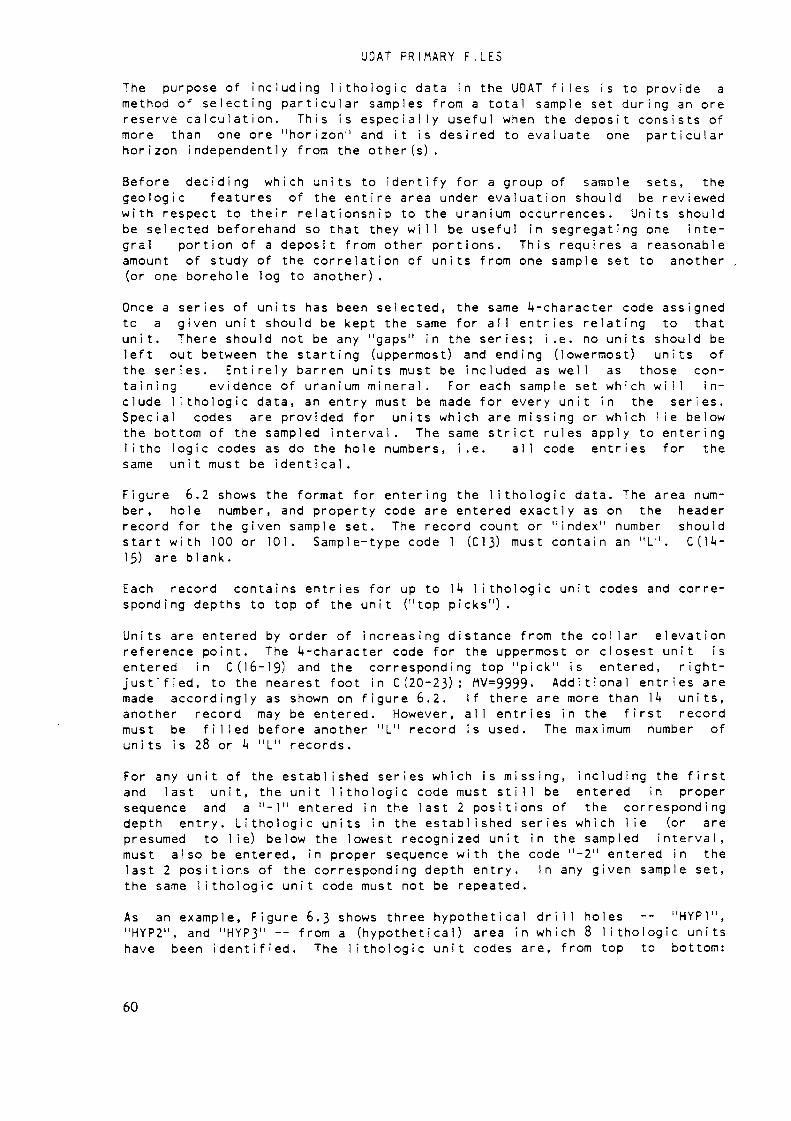
UDAT PRIMARY F ILES
The purpose of i n c l u d i n g l i t h o l o g i e data in the UDAT f i l e s is to provide amethod of selecting p a r t i c u l a r samples from a total sample set during an orereserve calculation. This is especially useful when the deposit consists ofmore than one ore "horizon" and it is desired to evaluate one particularhorizon independently from the other (s) .Before deciding which units to identify for a group of sample sets, thegeologic features of the entire area under evaluation should be reviewedwith respect to their relationship to the uranium occurrences. Units shouldbe selected beforehand so that they w i l l be useful in segregating one inte-gral portion of a deposit from other portions. This requires a reasonableamount of study of the correlation of units from one sample set to another(or one borehole log to another).Once a series of units has been selected, the same ^-character code assignedto a given unit should be kept the same for all entries relating to thatunit. There should not be any "gaps" in the series; i.e. no units should beleft out between the starting (uppermost) and ending (lowermost) units ofthe series. E n t i r e l y barren units must be included as well as those con-t a i n i n g evidence of uranium m i n e r a l . For each sample set which w i l l in-clude l i t h o l o g i e data, an entry must be made for every u n i t in the series.Special codes are provided for units which are m i s s i n g or which lie belowthe bottom of the sampled interval. The same strict rules apply to entering1 i t h o l o g i c codes as do the hole numbers, i.e. all code entries for thesame unit must be identical.Figure 6.2 shows the format for entering the li t h o l o g i e data. The area num-ber, hole number, and property code are entered exactly as on the headerrecord for the given sample set. The record count or "index" number shouldstart w i t h 100 or 101. Sample-type code l (C13) must contain an "I". C(14-15) are blank.Each record contains entries for up to 14 l i t h o l o g i e u n i t codes and corre-sponding depths to top of the unit ("top picks") .Units are entered by order of increasing distance from the collar elevationreference point. The ^-character code for the uppermost or closest un i t isentered in C (16-19) and the corresponding top "pick" is entered, right-justified, to the nearest foot in C (20-23) ; MV=9999- A d d i t i o n a l entries aremade accordingly as shown on figure 6.2. If there are more than 14 units,another record may be entered. However, all entries in the first recordmust be f i l l e d before another "L" record is used. The maximum number ofunits is 28 or 4 "L" records.For any unit of the established series which is m i s s i n g , i n c l u d i n g the f i r s tand last unit, the unit l i t h o l o g i e code must s t i l l be entered in propersequence and a "-1" entered in the last 2 positions of the correspondingdepth entry. L i t h o l o g i e units in the established series which lie (or arepresumed to l i e ) below the lowest recognized unit in the sampled interval,must also be entered, in proper sequence with the code "-2" entered in thelast 2 positions of the corresponding depth entry. In any given sample set,the same l i t h o l o g i e unit code must not be repeated.As an example, Figure 6.3 shows three hypothetical d r i l l holes -- "HYP1","HYP2", and "HYP3" -- from a (hypothetical) area in which 8 l i t h o l o g i e unitshave been id e n t i f i e d . The l i t h o l o g i e unit codes are, from top to bottom:
60
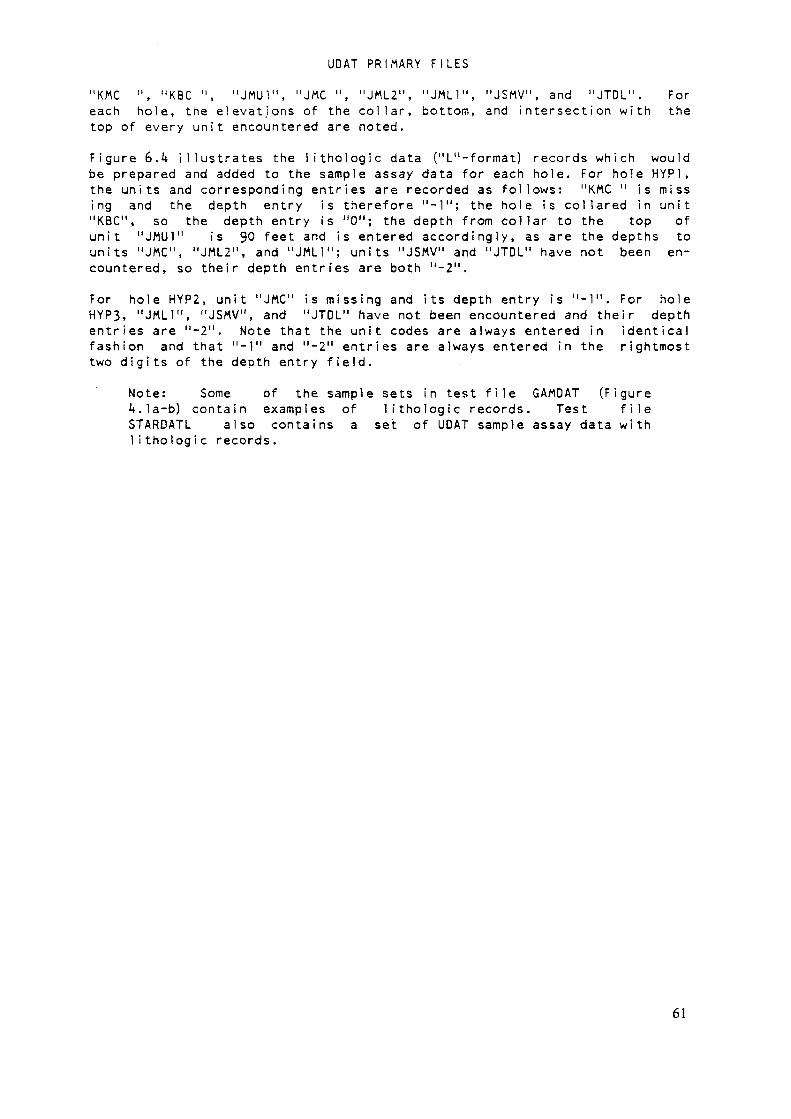
UDAT PRIMARY F I L E S
"KMC ", "KBC ", "JMU1", "JMC ", "JML2", "JML1", "JSMV", and "JTDL". Foreach hole, the elevations of the collar, bottom, and intersection with thetop of every un i t encountered are noted.Figure 6.k illustrates the l i t h o l o g i e data ("L"-format) records which wouldbe prepared and added to the sample assay data for each hole. For hole HYP1,the units and corresponding entries are recorded as follows: "KMC " is missing and the depth entry is therefore "-1"; the hole is collared in unit"KBC", so the depth entry is "0"; the depth from collar to the top ofunit "JMU1" is 90 feet and is entered accordingly, as are the depths tounits "JMC", "JML2", and "JML1"; units "JSMV" and "JTDL" have not been en-countered, so their depth entries are both "-2".For hole HYP2, unit "JMC" is missing and its depth entry is "-1". For holeHYP3, "JMLV, "JSMV", and "JTDL" have not been encountered and their depthentries are "-2". Note that the unit codes are always entered in identicalfashion and that "-1" and "-2" entries are always entered in the rightmosttwo d i g i t s of the depth entry field.
Note: Some of the sample sets in test f i l e GAMDAT (Figure4.1a-b) contain examples of lithologie records. Test f i l eSTARDATL also contains a set of UDAT sample assay data with1i thologi c records.
61

UDAT PR
IMAR
Y F
ILES
*!T^
CL
C
o c
k. t"
S3"*zz—«cU_
tnS10J=
C
a. c
cu c
Ih^c"a_=
k. aO
u
k. a>*
h
O
E
in•ooLJ
a. s
• c
m —
"f]ai i
-a i
w :u,
000
I*- O
»
1 .4-1 --
-- «
i m
r— »
I -i^-e*-!
er*--- — —
r-^ o-
ss|:-o
~°~
°-l
^£-
.-oro
-C-O
CN
i'*
J-i —
>-o<=>
mtn
- -sS
S-
——
-U
"S —
0.
_»t —
—— --
—
—
•
.«rm
-o.*
.*_• —
— —
u» j
*r o-
-si«:?:]•
- «W
Csl
il=li :
PO
-0
e: —
-- —
o
*o «
r
>
*O O
«4
a> -- -- —
—
*-o —fî«
Ss-
— -- —
S C
ïïï_(S
I «•
CM
tO
r* r>i
ex —
5
£:£
•-O
-«09
——
-O
*Ur^
u:;£
~rf w_
^- ^?
i .
—— O
1 c a*
' O
B
-O
! u
n~
- -.- — - .^
t !"«•
--"*—
~*H-•<-"1*«.1
j"j— .-------
.•.•;-•...."s£
!
1 :
u*oc
•
s ;
ina* .
-5cij .•.
•aub
•
1Z:-
.
•«c
.3«O
.
3
*O3
•
O*
er •
oCJ
.
-0i :
||l*:äjcinuf!
Sij1£IOk—
—• c
*mt ck.
C
^1
k. u,
c^uJ!»«-1
JUJ
•lrOr**-.
«U•1C
M
CSJ
e>4
«•IM!
Ol
»os.uo-CNOJ
o*o~*u•1s"oToTup.
r^u•1•43K
-Ot_l
in"
in.c
O9O
|fc**'_
Jr^
ao
l
r»- -o
7tï?_
• r»- CM
^5-
S5s:.-0-0
^£-
.-oro
,e -o
rxi
-o —
--o<
»
^Ss-
j.--
— ._
mu-s
•ES
S-
mc^«
.*r> —
TU
«r?
^~"
°^^"
. "Win
JS •»
•«»•
•Ê5H-
i|i:.>^>^o
^Sv-s||:
• fOO
^KS
-
. r^«
r-
rsiex
. — oo
««-a
^< -----M
— *o
-Mrs*
OB
-O
— ••;-—
--•<•J•<l^-^J-*<_-.«•<•<•<--•<•<Ê--
.*.*••.*•B.:••!=
T :
5£gi ;
1u
>«.
.
z :
:e:nMO
•
S» •
*Jc
.oCJ
•
-a
•
"f-§•£k.
~CO
k'*-
sca1Ul
Z3
5z3»• M
»• M
0J=
C
ex ccu c
"O ^>
OL C
•*•*
ff=•k. a»« k.
— » «
O 1
e=tsfeuII•* —a*—m
cM
i X
Sc
!SC
"Slu
CD
O
f-,O-
r— e»
:«= S
2-:
—
r- in
i"S
rZir ~
*. U
—
—— ---H
S»f—
• C>
4
•«r-. —
r«< ta
•^r*- ~" '
0^0-0
s^s^-0*0
ra-o
cv4
u~t ao
—
cnr> -o
"
£S
s-
»•*«
»«
*n c-«*x *«
*«u-) —
i
1 «
M
L.
-W l
, W
1 C
—
— --
—
»•*•- « c
^- —'
O M
O -
- --—
.
ïll II1
*->-0
4 C
--
-- —
t o
*••»
"^i -_ —
_«i
— --— .
Ss-~
S2-S
rii
CN
«^
r-i CNI
~n
_£
Sp
-
rrr:-,t^
5Ei?-o—
— »^»— -c**
o
-- -- —e
o*
— .. _ao-aifir**~*
--•<B-
-<""__—"*::• <_
"-:--J3J—.
>
---
^I
OUÖl
&>•o•a3=S^3äkk.wi
O3O*
CaCJ
CJ
-J3
62
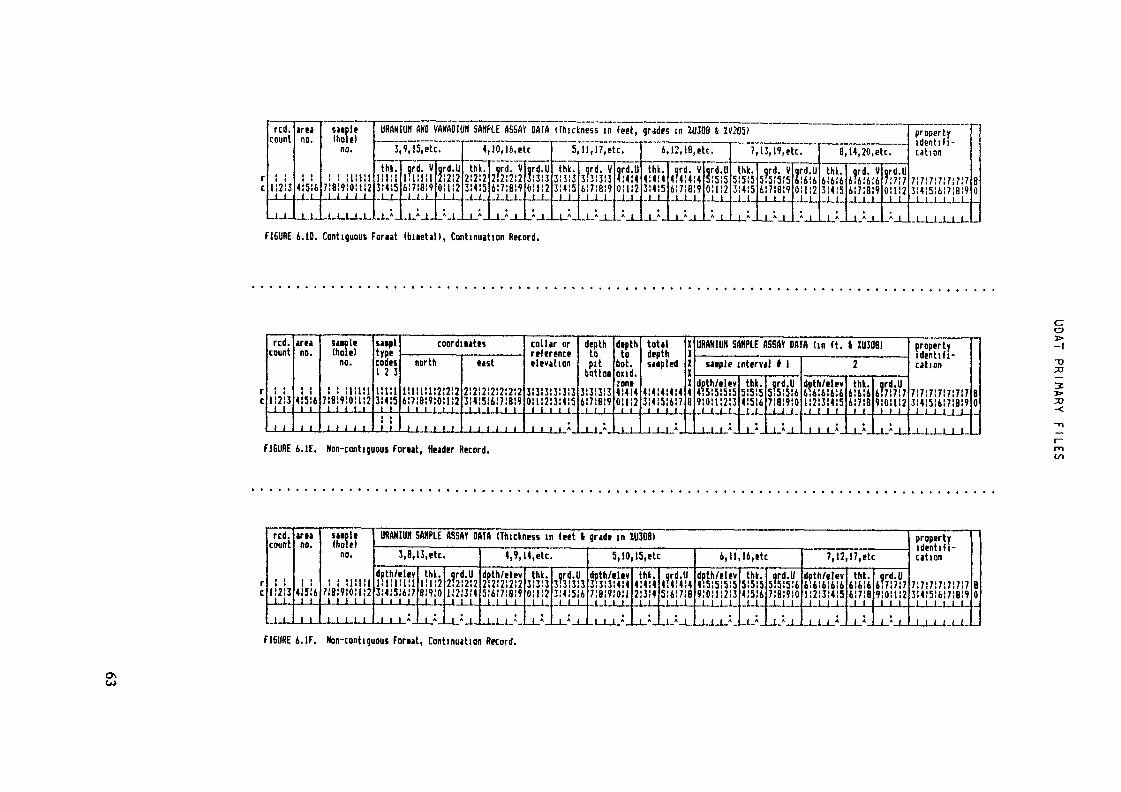
UDAT PR
IMAR
Y F
ILES
— —
—*
-4r—
-a t
ti
tu •** o
—
— -4
-4
i a c
-
r-in
l ]
a oj^-f
-- — -4
—4
w -o
i) t^
«r
l j
o.
u
—
— -4
-J
-,——
—[_
,|^^" j——
—j
! j ife
^s-j -"i•ïî°:J
J.-0
00
l l
Ï3-1 1
srï~-i
-i_^O r^i
t j
= S
~J~ J
"2Sr:_i
J
*g>J -l
gJH
^• 4
fj4n
l n 1
= la
> **-o- l
"'WQO
l
'i
- i i •
i» è i
• jt*1
O~
I I
_. »-> oo
I
"1
!U
*J
l «-
l CT>—
— —
—•—
* —
4
O
i !" l ."-
j l j
15 l- L
-Î2Ï3
J .<'
3l <
" £^"-1
J
c
IrstiHïH l
s I--LÏHU3 ^s
II-T .„^
l l
*.
----! -
ja o
r*«r<
îH~ ==:
S^
I
3§
k. O
^MH 3
R 3
HT
,=
SF
J!Jt-l
•s:,• O
l
63

UD
AT P
RIM
AR
Y FI LE
S
r n
?:_
c -- —
—
* a
.t3 r-^
« ir ~
• o
c
"5^
~3
—
*~ôâ~*
r« .
— —
—ai o
m
•o c —
— —
u o
—
---.
-
4---
85
win
-o
Sin
tn
** c a«
*»«o*= t«i M
ai —
---
-^ «z
— r
•
.S-3 i
up
w 5
—-8-5-
gg r g-«=
3 —
rtï
*wv4
«n a» —
-CTo
e a w
k.
Q.W
a-— a»
oa
«• o
. u
Wi tn »
ut a>
-*J «*»-«-'
ŒO
u C Q
"
S- S
||
toUJ
£UUJ
o_entn3aoCOUNTS/SECONI*Ta1OëOC.
S
CORRECTED 01
MC
W
•« »
•
mt —
lî•1 C
Si'
si
o• •*•>i ^us"mOJ
r-jLJOl
enOl
r^lui
-oua«tno"utft«r*
>«
3H
g
030
li :
u -4
in
||1ïii :
SïK
-
¥»
t-^O
3
lii :—
— -
»^>r^
Poor-4'O
v-««>oaM
—r^
^rrïï.
»*— ;*
*"oô
~
— -.„
::s:
--mt««i
.*--
«•j-_----
ai
a«
>- >
M
^
C
CO
*
*r1•V
<9<
«.
«I
—T-i_f •
«M
» «»
-
»m u
M t_
«n c•• «
« W
i
i e
v.
LU
O
1e_i M
*e
-si
a« ea.—^
-S
LJ ai -
"o"5 *c
ooo c
si"=O
I
£S
J
£•" S
k-
k
•i —
M
A
-!i•o û
ws—
aai o
1 C
•O
IMm
— -
*Ë g
l u
—
I 0>
*-
| ^
g
64

UDAT PR
IMAR
Y F
ILES
i
>• —
CL. t
o
aL.
cv-
mLU
ù=arLU
_ J
Ac5g"5uu
aC3
inat
So^d
-s: ui
T>
*C
*« JM
•t •—f~i —«
C
Mai a
~9
C
h? C
03.ÏS
r— -o-
f— -oa
: M
r-.iTî
i_^i -—
_._ —
r-~.=>M
*û
cr-
lin o
---- —
le
ai -- —
—
I
-O
rO
tn LJ — - —
— '
t_ a
t-- — —
1_> uir--
in u
-- — -
tu a*u")»»i
lEU
iS::-'
1-3
U->O
L •*o-~
(
U^
-*"X
>
!i*H=i:
rw •-•- -»- ir»
— -o-»-
-_•
12
„X«
_<
[-..rr.'
ai aw POO-
fSw
toa
ole
ai —
— -
13
fj -O
t] r-î_
n~
1
C*«
*jr*>rO
iu* ut—
•- — - —ja» ai*">c-4|U
I^-"
je a
t-----
ir»
0*0-
U- S
ÏSÎ-,
lut u
i -- -- —loi
OJO
.IÜ-»lc _
.-,„
-
—
»
CN
«_»
S S* rt?T-
-a«*- —
.00
ai c
«—> --.'•-
_;--
**"*"r:ï?_|-,-.-!—
—
>~
o
— . .._
e: o-
"™-
——
——
—
4V "1
=5:—
-ai a
i1r
-S3=
s
1 - "-o
c
«—
t >-o
« •» -1
L»
Ul
>-»
_ «1
~1 c
ai-4
-i i^-"c
, ——
i S
--.^
ai j
«a t_ e: —
-ct
ut-«
- -* —
at
a.
ui
**JJ..
-. — .
u
11 in
« a*«"*
»•< .--a
-o —
'N*
t i
-~f
—— ._
"" U
l C
—
1 i
w» in
i_1 e_» —
— —
T:
4r="s-s-st
i/t O
U f
• <
at c LJ ui —
—4
0-4
-0
»
. 1
a.
1 ->
. a
-— • +
— J a"°
"S"5
C
I in
V e
r « w
t U
. 01
C
>-t_
II
*"• °ti
S *"
.<
• tn
-
1 01
O
-t- -
"HJ
Ï !"] —
——
— J
-J1
—41
"-J «?•£1rx
.gai
1 r~~
-+
J-= '
-to
— • o
."Ir
I]"II-1
-iS4-1-i3H
iJ —
• *
r -o
J LU
•
) C
E
1
W
: -s
« «n
. . in
.
. e —
•
e
-s» a
— • •
» — ur
_w
ai
*ai in
•
-a
..c
at •
o
.u_
-CT0o
.
i :
»
.
C-J
•
L.
lj_
*
^
.(C
•
äUl
•
Cll
•
c-» *
a3
.ai
."3
«01
.
2 :
-0
*
LU
*
>-.,
U.
-a» -*•C
L.)
a
o*_ -cca. -
01
UJ
ocLU
Us"CJ
feer»LU
CJ
acs<rUJ
ce"-=*•
>-:>
-
o< —
ü•1 C
m-o e
LJ ak. au
C09
j O
.._
__
I.*J —
— —
3 -3
1
--*--•
U»
-- -- -
(.=?..--_
LJ r^.-c>
W^
-00-
tx u
i ut-- —
-0-5 _=; —
,_.. —
_—
• w-«- -a -o
le a
i-- -- -
_^-3
s-
a/^~j -o O
Ho-* ^
*-i^a
— .
-~aj ai -o-o-
~" *l^
'°'^
a5
~is*
unt^^u
u~> -o
1er a» -
--- —
J— t_
IT
) —
•
ja
*n-o
Ul
•»• O
-
^
J-* "^/~
-r-i
ui
ut —
-- —
Ic o« —
• -- —
1=
3
-W
f?
Ul
--fC
M
'S*,
-e— ."
— *
U) U
-- --
——
eu air*io
-
ÉC: eu —
-- -
Jj3
»O
-O
LJ
Ï^ÎX
ai •*-> r»"» "w
— •• tn u
-—--—
.•»
Qi Ö
l f?
CH
|3..sïs:j
r~~ ut u— .—
—
— *
QJ a
icxira
r** *j—
.0- _
-o o« a
i---oo
****** r: t? JX
XJ-.
— M
"
r-.™"
-oi/i._
..*
l•4 -
J -
i -
i —
ai—"1OJ
r-—•<-ai
----•«_
01
——-'l
Öl
...-UJ
*<
01 J_-1---
T3tu
•1
~* O
l
! **~ "S
( •-»-
Ul
l « at
c*m-
-o
e e
1 >^o . -»
-W
. LJ >
-_
_ 1
l C
O
l_^**-*
1ai o
i_r o
c
•w u. e
—
• -r
-^II"^"O
l 3 c
OJ n
!*-
——
—
T-
i ui u
i i
Ȥ
JJ3
,Is
is-
1T
3 --
"cO
-a
-o
»*
ut-*-j—
or -
•v O
—
——
-,
C=
Cli>
*"
C
— —
— 0
1 -
Ul
U»
T3
UO
O
T3
1
C
in UJ
C
Ul-«
-»
C
u. O
J c= •-— L.
oj-*-t »4-1
a
Öl
O-«
—
J 1 !
__ 1 1
-J
JJ
_ai O
f-
-o
-»tn
— i o
ro i -o
t .->
r- xv *
u-f—
^
•>*. 01
.
13U
H__- .
.
! -eî
[ LUU
3
u_9
tU
1 «•
«
u. "-—
•
1: fv tr
* L.
i a «
) —
• Ul
l-J-J
01
t ai U
T «
•^
.
J C
>
•* •
•on
o.
U_
Ul
= •
o
.
cc
*
e
«
•o<cInc
••o0
1
2 '
LJ
ai •
ca
.u.a*a
•
Ol
ai
LU
.ceg
;
ai -*-cu
eo
a
_5."E
"5aiina.crexai
^tti.aiaiai£.
«aiUl
OJ
tnUJ
CJ
enuu.
LUeu. —
•"c
ai c
-o"-:
LJ 3
U 0LJ
aa-o
< r*- r^-
1 O
--
— -
i *«
^^
. tj — - -- —
S iT
^Z
— "
_o — -»- -o
oo
m ••«
o-o
-o
. «r sr.
-*-* LJ ai -o —
tJ-j^
S-
I?-ïi§
:I-" "
^"
a
-..__
_LJ tT
" --
-- —
LTi
——
Ultj->
O
* c -*-o
-
"^ S
i O "«
—
sJ Ë25-in
-«-h
O
«•
Ul i*-
——
*-• ai in
-«- o
tu .c
—r-ic
a
*J
—— ' >-•>
U-ï
n* •-- ai —
— —
ai r_ -- -_ —
a/ cyi -. K-* fvi
—
-» â-~->—
•-_j __r o
-- -- —
r^o-
0) -
0-0403
Oi
C-^
f^
"^ S ^
T^^"1
^~r^rw
«4 «a «*- 1-4 cr-ai o
---- —
C3.C
—
*CO
——
10
«ï^>
o -.__
—c
»-
„S
-
— rsdm.-„-„^
j..~q
ii -j
—i -1
;
1111 x
**
j 11j -
1 X
1-111 r1 „~]-:\ **~1 en
1 x
-.
1 •*-
Xx--JX1-'2<«--:(=1:>qX
~1
»c_
X_
XJ-J~1 !°I Ul
> -a
!;t *ai
-^a«sai
IJ.a!Ol
in5o .
W"S
•i-Sc ai
2-
•^s-a°--5IS
c— ^.
? ^I»165
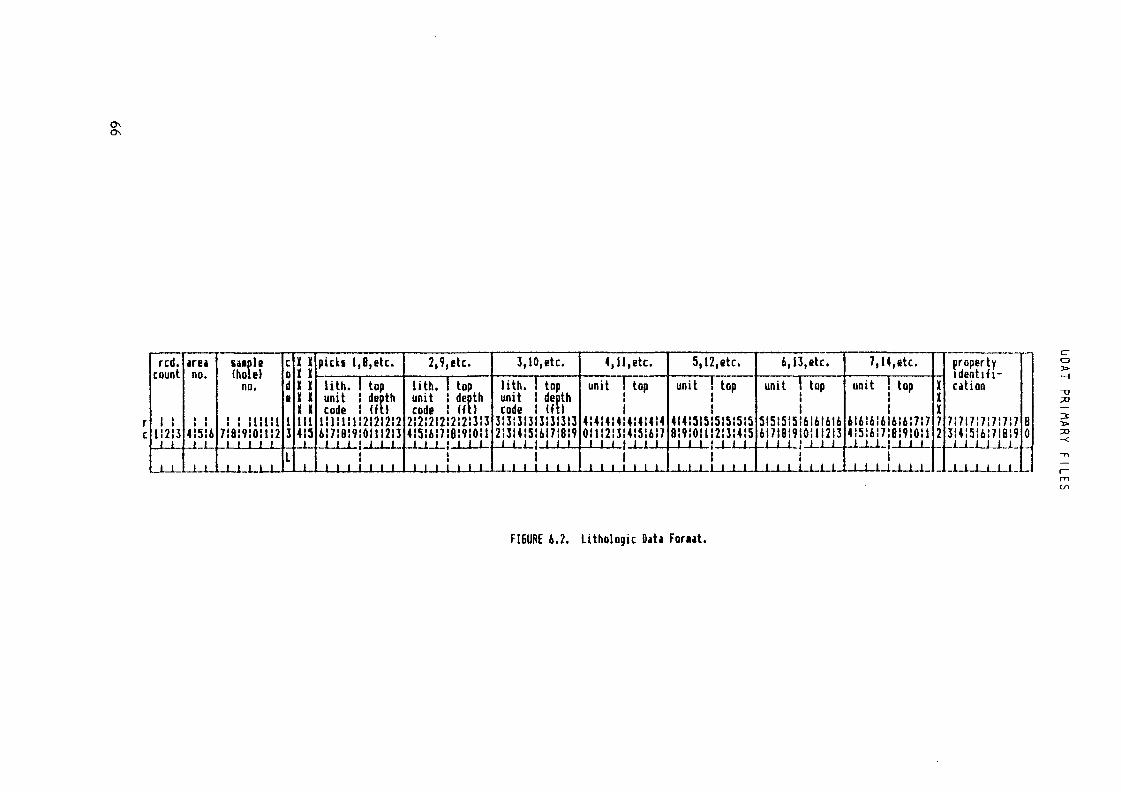
ON
red.count
! ii:2:3
1 1
areano.
i ii i41516
I !
saiple(holet
no.
! i illlil
i i i i î
c0de
13
L
X Ï1 11 11 11 1111415
1
1
picks 1,8, etc.
lith. 1 topunit t depthcode ! (ft)
6Î7 iB:9 Îom2Î31
,. 1.1.1 .i .L. i-i..
2,9,etc.
lith. ! topunit ! depthcode ! (ft!
2:21212:212:313
Li-LiJJJ~
1 1 1 I 1 l l
3, 10, etc.
lith. ! topunit i depthcode i (ft)
3:3i3!3l3i3!3!32i3!4l5;i!7!8!9-l-1-l-l-l..i.l..,
1i » i i i i i
4,11, etc.
unit ! top
, , , ! , , ,0:i:2:3':4:5:6Î7
1i i i i i i i
5,12,etc.
unit ! top
4l4!5!5!5i5:5:58:9iO!U2:3!4:S
1 1 1.1.1 111
,l,.l,,t-l_l.l_l-
6, 13, etc.
unit i topi
5:51515!616!616617!819|011!2I3
1
7,14,etc.
unit ! top
6!6i61fci6:617!74:5:6:7:Bi9:o:i.1..1-1-J..I.. 1..1
t-i-1-l-i..J...l.l-
KIX72
propertyidentifi-cation
3:415!6:7I8:i l_l_l_l_i
J.-1 1-I.LJ-
-XI
mist
FIGURE 6.2. Lithologie Data Fanât.
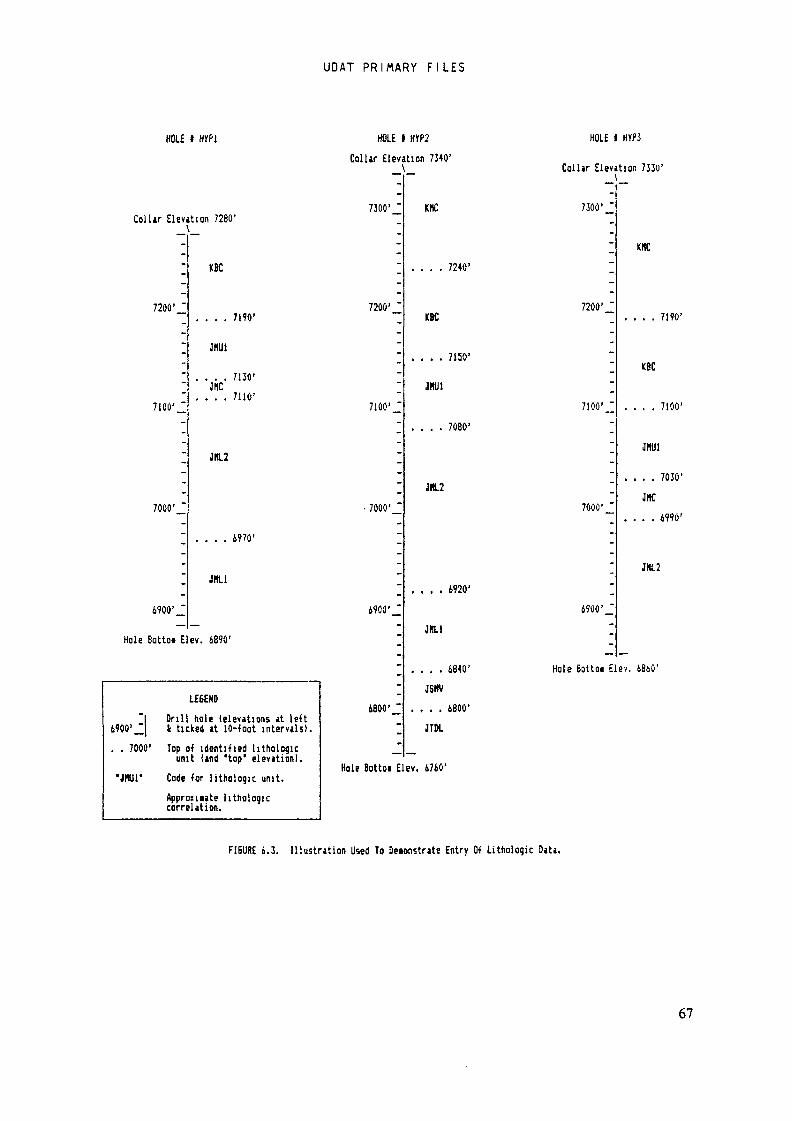
HOLE J
UDAT PRIMARY F I L E S
HOLE I HYP2Collar Elevation 7340'\
HOLE t »mCollar Elevation 733U'
Collar Elevation 7280'-
-
7200' J
7100' J-
--
7000'J~
-
6900' J
Hole Bottot El
KBC
.... 7190'
JHU1
.... 7130'JNC.... 7110'
JHL2
.... 6970'
JHL1
ev. 6890'
7300'J
-
-
7200' J
7100'J-
--
• 7000' J—
-6900'J
—
»
LE6END 6800' J1 Drill hole (elevations at led6900' _2| i ticked at 10-foot intervals). ". . 7000' lop of identified lithologie _2unit (and 'top* elevation). Hole Bottoi El•Mil* Code for lithologie unit.
Approxnate lithologiecorrelation.
K«C 7300 'J
-.... 7240' 1
7MO' "KBC ~
.... 7150' ~
im I7100'J
.... 7080' '_
-
-
7000 '_!"
.... 6920' I6900 'J
JHtl I
KHC
.... 7190'
KBC
.... 7100'
JHU1
.... 7030'JKC
.... 6990'
JNL2
.... 6840' Hole Bottoi Elev. i860'JSMV
.... 6800'
ev. 6760'
FÎSURE 6.3. Illustration Used To Deioastrate Entry 0< Lithologie Data.
67
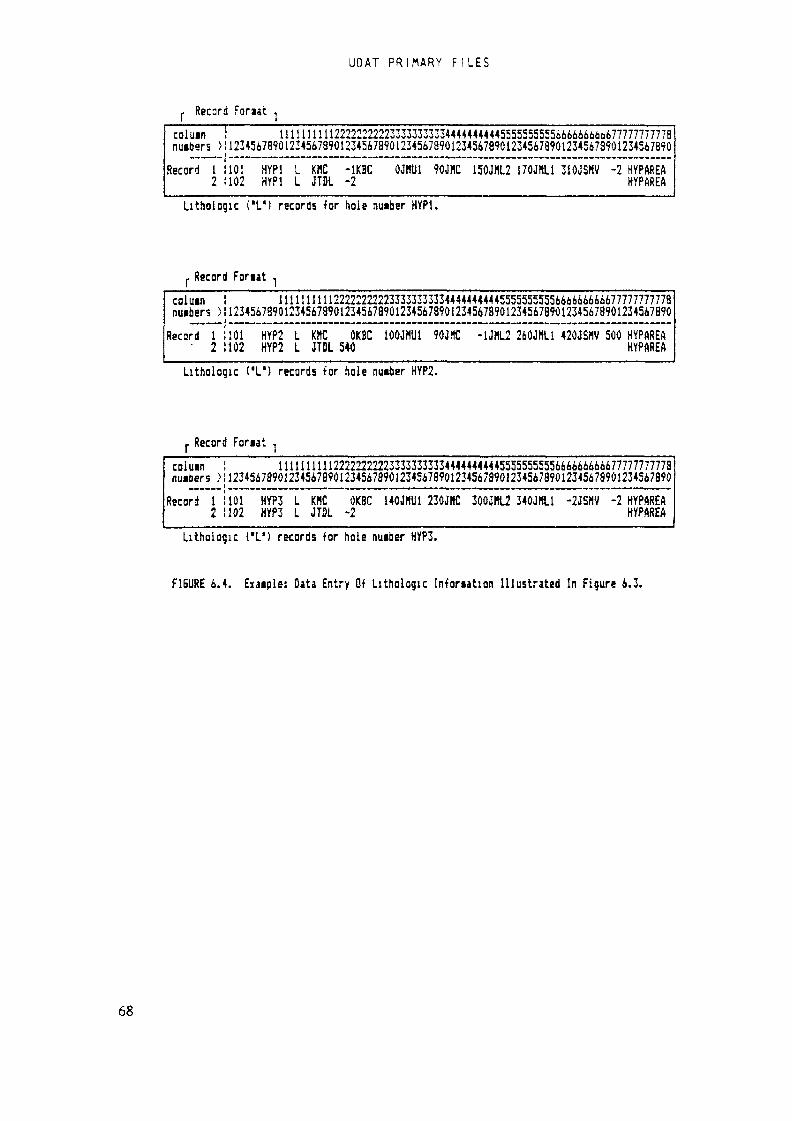
UDAT PRIMARY F ILES
, Recard Foraat ,colu«n i U11 i 11111222222222233333333334444444444555555555566666666u677777777778timbers >!123456789012345673901234567890123456789Û1234567890123456789Û12345673901234567890
Record i 11012 1102 HYP! L KHC -1KBCHYP1 L JTDL -2 OJHU1 90J«C 150JHL2 170JKL1 3IOJSHV -2 HYPAfiEAHYPAREALithologie ("L") records ^or hole nutber HYP1.
, Record Foriat ,coi um ! 11111111112222222222333333333344444444445555555555666664666677777777778nuibers )!123456789012345678901234567890123456789012345678901234567890123456789Û1234567B90
Recard l !101 HYP2 L K«C ÛKBC 100JHU1 90JHC -1JHL2 260JM11 420JSMV 500 HYPAREA• 2 i 102 HYP2 L JTDL 540 HYPAREALithologie CL') records for hole timber HYP2.
, Record Foraat ,CDlun ! 1111 il 11112222222222333333333344444444445555555555666666666677777777778miibers >!1234567B9012345678901234567890123456789012345678901234567890123456789Û1234567890
Record 1 1101 HYP3 L KNC ÛK8C 140JKU1 230JHC 30ÛJHL2 340JML1 -2JSMV -2 HYPAREA2 1102 HYP3 L JT2L -2 HYPAREALithologie CL1) records iar hole nuiber HYP3.
f I SURE 6.4. Exaiple: Data Entry Of Lithologie Infonation Illustrated In Figure 6.3.
68
THE UCON SYSTEM
7.0 THE UCOfl SYSTfft
In order to process the uranium sample data, the URAD programs must be pro-vided with the a b i l i t y to: 1) specify the file(s) on which the sample setsreside, 2) indicate which of the sets are to be included in a given run. 3)perform any additional necessary operations on the samples, and k) accessthe files and obtain the specified sample sets."UCON" (Uranium sample input CONtrol) is the name given to the system whichcontrols these operations.A "UCON fil e " is an independent set of data consisting of instructions whichcompletely define all the sample set data which w i l l be used in any RUN of aURAD program. A UCON f i l e is in the "formatted" mode and contains recordswith length of 80 characters or less. Every time a URAD program is run, itsimply requests the name of the particular UCON f i l e designated for thegiven RUN; and during the RUN, the f i l e is automatically interrogated forinstructions u n t i l all sample data data designated by the file(s) have beenprocessed.An appropriate UCON f i l e must be prepared by the user before any URAD pro-gram is run.
7.1 DEFINITION OF A "BLOCK'
A "block" is simply a group of UDAT sample sets defined by a set of in-structions in a UCON f i l e .
7.1.1 Block as Used With Program URDATIn one RUN, program URDAT w i l l process the sample sets (from one or moreprimary (basic) UDAT files) defined by one, and only one, UCON block, and(optionally) output the processed data onto a single secondary UDAT f i l e .
7.1.2 Blocks as Used With the Ore Reserves ProgramsIn one RUN, programs RESUV, ORSAC, or SCOR may process the sample sets (fromone or more intermediate UDAT files) defined by up to 26 blocks, and calcu-late reserves for each block. For these ore reserves programs, a "block" as-sumes the added significance of including the area! dimensions, in squarefeet, of the reserve block, as well as the sample information to be used inthe calculations.W i t h i n the computer programs themselves, there is no actual "connection" be-tween the block and its designated area. It is up to the user to determinewhich sample sets apply-to the chosen block area (or vice versa). Generally,this is done by visual examination of maps, cross-sections and associatedsample and geologic data. A group of sample sets is chosen, the outline ofan area is drawn around the chosen sets, and the areal dimension is measuredby planimeter, or by some other method.
69
THE UCON SYSTEM
However, there is no restriction in a UCON block that all sample sets de-fined by the block f a l l exactly w i t h i n the confines of a predetermined arealoutline. For various reasons, the user may choose to include, in the sampleset definition, sets that f a l l outside the drawn or i m p l i e d areal outlinerepresenting the block area.
7.2 OVERALL STRUCTURE OF A UCON FILE
In a UCON f i l e , a block is defined by a series of records (Figure 7-D whichcomprise a "block control module" ("BCM"). Each record is identified by aninstruction code in columns 1 and 2 (Section 7-3) • The first record of a BCMis a "BCM identifier" and the last record is a "BCM terminator".The BCM identifier record contains a block code, a block area and a blockname used to identify the block in ouput l i s t i n g s . (These parameters are de-fined in detail in Section 7-^) The block code and block area are not en-tered when program URDAT is run. If present, they w i l l be ignored.The BCM terminator record simply contains the "BCM terminator" code -- "*8",unless it represents the last BCM of the UCON f i l e (see below).W i t h i n a BCM there are one or more " f i l e control modules" ("FCM"). Each FCMspecifies the name of a UDAT f i l e which contains sample sets to be includedin the block as well as optional instructions for e d i t i n g those sample sets.The f i r s t record of an FCM is the "FCM identifier" which contains the nameof the f i l e to be processed (and optional additional information). The lastrecord of an FCM is the "FCM terminator" which s i m p l y contains the "FCM ter-minator" code -- "* '', unless it represents the last FCM of the given BCM(see below). One BCM may contain an u n l i m i t e d number of FCMs.The last record of every UCON f i l e must be the RUN terminator, which con-tains the "RUN terminator" code -- "ftft".Figure 7-1 illustrates the general structure of a UCON f i l e which containsone BCM which, in turn, contains one FCM. The "1C" records indicate optionala d d i t i o n a l edit instruction records (Section 7.6) w i t h i n the FCM. If oneterminator record follows another, the "lower- ranking" terminator recordsmust be omitted as shown in Figure 7-1. where the RUN terminator record("ft*") also serves as the BCM and FCM terminator records.Figure 1,2 shows the overall structure of a UCON f i l e which establishesthree blocks. The first BCM contains three FCMs; the second, 1 FCM, and thethird, 2 FCM's. An ore reserve program processing a UCON f i l e having thisstructure w i l l read the fi r s t BCM id e n t i f i e r record, and obtain sample datafrom each of the three f i l e s specified by the FCM's. When the f i r s t BCM ter-minator is encountered, the reserve program w i l l complete calculations forthe first block. It w i l l then read the second BCM ide n t i f i e r , obtain sampledata from the one specified f i l e and complete another reserve calculation;and so forth. When the f i l e terminator is encountered, the reserve programw i l l complete calculations for the third block, complete any additional op-erations required, and terminate.
Note: in Figure 7.2, lesser-ranking redundant terminator recordsare omitted; i.e. the terminator record for the last FCM in each
70

THE UCON SYSTEM
block is omitted and the block terminator record serves to bothterminate the FCM and the BCM. S i m i l a r l y the RUN terminator servesto terminate the last BCM as well as the last FCM in the last BCM.
Since the concept of ore reserve blocks underlies the operation of all thereserve programs, it is important to understand that any ore reserve blockin URAD is i m p l i c i t l y defined both by the sample sets included in a UCONblock control module and the area assigned to that module.
7.3 UCON INSTRUCTIONS. GENERAL
To review, a block control module (BCM) in a UCON f i l e consists of a seriesof 80 (or less)-character records starting with a BCM identifier record andending with a BCM terminator record. Every record may be considered to con-sist of one or more instructions, with each instruction generally followedby parameters (or "operatives", see below) pertaining to that given instruc-tion. Some instructions do not require additional operatives or the opera-tives are optional.The following descriptions of the types and uses of the instructions mayseem detailed and complicated. However, once the p r i n c i p a l s are understood,the user w i l l find that it is very easy to construct a UCON f i l e and thatany sample data from any UDAT f i l e may be identified and selected. The easewith which this is done w i l l depend to a large extent in the planning andorganization that was used in preparing the applicable UDAT primary (basic)or intermediate sample data files.Each UCON instruction consists of a 2-character "operator" code (OPcode)generally followed by one or more parameters or "operatives". The firstcharacter of the operator code is designated as the "primary" operator code(or "OPcodel"); the second character is the "secondary" operator code (or"OPcode2"). The OPcodel is a unique character which specifies the generictype of instruction. OPcode2 refers to optional uses for the instruction oroptional entries for the operatives. No spaces are permitted between theOPcodel and OPcode2 of an instruction.The instruction operator codes discussed below in the test are enclosed indouble quotes. They may be shown as OPcodel only or as both OPcodel andOPcode2. However, quotes are never used with the operation codes when actu-a l l y preparing a UCON f i l eSome operator codes must start at the beginning (first 2 columns) of a re-cord. Others may appear anywhere in a record. Some secondary OPcodes arejust "padding" (non-functional).The operatives consist of numeric values or alphanumeric character "names".Alphanumeric names include: block codes, block names, f i l e names, l i t h o l o g i eunit codes, hole numbers and area numbers. Block codes, block names, f i l enames and lithologie unit codes must always be enclosed by single quotes (''); the others are never enclosed.
e
Numeric operatives are: the block area, l i m i t i n g elevations, d i s e q u i l i b r i u mcoefficients, and l i m i t i n g coordinates. A numeric operative must always in-clude the decimal point if it is entered as a decimal fraction, but need not
71

THE UCON SYSTEM
include the decimal if it is a whole number. This is in contrast to the en-tries in the UDAT f i l e s , where decimal fractions are i m p l i e d by the formats. The block area and the coordinate values are entered to the nearestwhole unit and must not contain a decimal point.
All individual entries for operatives must be followed by a comma (",") un-less s p e c i f i c a l l y noted (see "H" and "A" instructions) or unless the opera-tive is the last one in a record. Instruction OPcodes are never d i r e c t l yfollowed by a comma, even if one instruction operater code is immediatelyfollowed by another with no intervening opérâtive (s) .Figure 7-3 is a summary of UCON instructions and l i s t s the primary OPcodefor each instruction, the general type of secondary OPcode, the number andtype of operatives, and the usage of the instruction. The secondary OPcodesvary, depending on the primary OPcode. Where an OPcode2 is applicable, it isshown as "n" or "a"; if entirely nonfunctional, it is shown as the symbol"#". The description under "usage" states if the operator code must begin incolumn one of a record. The secondary OPcodes and the operatives are de-scribed in detail in Sections J .k through 7-7-The "8" instruction defines a BCM; the "F" instruction defines an FCM.
The "E", "L", "Q", "W", "A", "H", and "C" instructions are contained w i t h i na given f i l e control module and apply to the f i l e name entered in the FCMi d e n t i f i e r record. They are termed "edit" instructions.Examples, from Figure 7-3:
{B B#; i=0 or 1 (A=3); Q=yes, C=yes } designates that "B" is theOP codel used to establish a block control module; the OPcode2 isnonfunctional; there may be either no operative or one operative,and if there is an operative it consists of exactly 3 characters;the operative (if present) must be enclosed in (single) quotes andmust be followed by a comma.{ E En= 1,2,3,^5 i=0 or 2 (N <= 7); D=yes(l)*, C=yes } desig-nates that "E" is the OPcodel for edit by elevation and/or posi-tion with respect to an open p i t ; the OPcode2 may be a s i n g l ed i g i t number from 1 through it or an "N"; there may be either nooperatives or 2 operatives following the operator code; if thereare (two) operatives, and they consist of up to 7 numeric d i g i t s(including a decimal, if present); a decimal is allowed with oned i g i t to the r i g h t of the decimal ( unless otherwise noted in thetext); the operatives must be separated by commas from themselvesand from any succeeding instruction operator code in the same re-cord.{ A Aa= +,-,b,N; i<=26/rec (A=3) » max. rec.=l; Q=no,C=no } desig-nates that "A" is the OPcodel for edit by sample set area number;the OP code2 may be the characters "+", "-"(negative sign), blank,or "N"; there may up to 26 operatives per record, each operativeconsisting of exactly 3 characters; a maximum of one record is al-lowed; operatives are not enclosed by quotes, and no commas areused as separators.
72
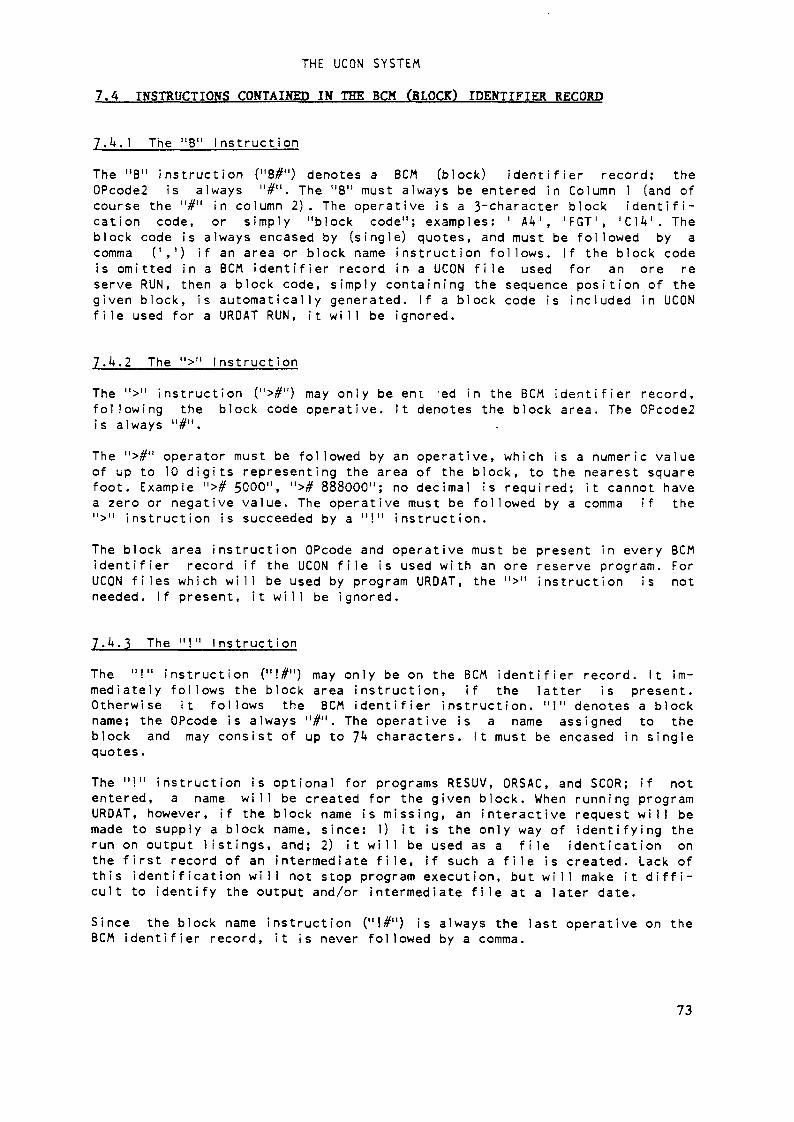
THE UCON SYSTEM
7.4 INSTRUCTIONS CONTAINED IN THE BCM (BLOCK) IDENTIFIER RECORD
7.^.1 The "8" InstructionThe "B" instruction ("B#") denotes a BCM (block) identifier record; theOPcode2 is always "#" . The "B" must always be entered in Column 1 (and ofcourse the "#" in column 2). The operative is a 3"Character block identifi-cation code, or simply "block code"; examples: ' A4 1, 'FGT1, 'CIV. Theblock code is always encased by (single) quotes, and must be followed by acomma (',') if an area or block name instruction follows. If the block codeis omitted in a BCM identifier record in a UCON f i l e used for an ore reserve RUN, then a block code, simply containing the sequence position of thegiven block, is automatically generated. If a block code is included in UCONf i l e used for a URDAT RUN, it w i l l be ignored.
7.4.2 The ">" InstructionThe ">" instruction (">#") may only be ent -ed in the BCM id e n t i f i e r record,following the block code operative. It denotes the block area. The OPcode2is always "#".The ">#" operator must be followed by an operative, which is a numeric valueof up to 10 d i g i t s representing the area of the block, to the nearest squarefoot. Example "># 500C", "># 888000"; no decimal is required; it cannot havea zero or negative value. The operative must be followed by a comma if the">" instruction is succeeded by a "!" instruction.The block area instruction QPcode and operative must be present in every BCMidentifier record if the UCON f i l e is used with an ore reserve program. ForUCON f i l e s which w i l l be used by program URDAT, the ">" instruction is notneeded. If present, it w i l l be ignored.
7.4.3 The "!" InstructionThe "!" instruction ("!#") may only be on the BCM identifier record. It im-mediately follows the block area instruction, if the latter is present.Otherwise it follows the BCM identifier instruction. "!" denotes a blockname; the OPcode is always "#" . The operative is a name assigned to theblock and may consist of up to 7^* characters. It must be encased in singlequotes.The "!" instruction is optional for programs RESUV, ORSAC, and SCOR; if notentered, a name w i l l be created for the given block. When running programURDAT, however, if the block name is missing, an interactive request w i l l bemade to supply a block name, since: 1) it is the only way of identifying therun on output listi n g s , and; 2) it w i l l be used as a f i l e identication onthe first record of an intermediate f i l e , if such a f i l e is created. Lack ofthis identification w i l l not stop program execution, but w i l l make it d i f f i -cult to identify the output and/or intermediate f i l e at a later date.Since the block name instruction ("!#") is always the last operative on theBCM identifier record, it is never followed by a comma.
73
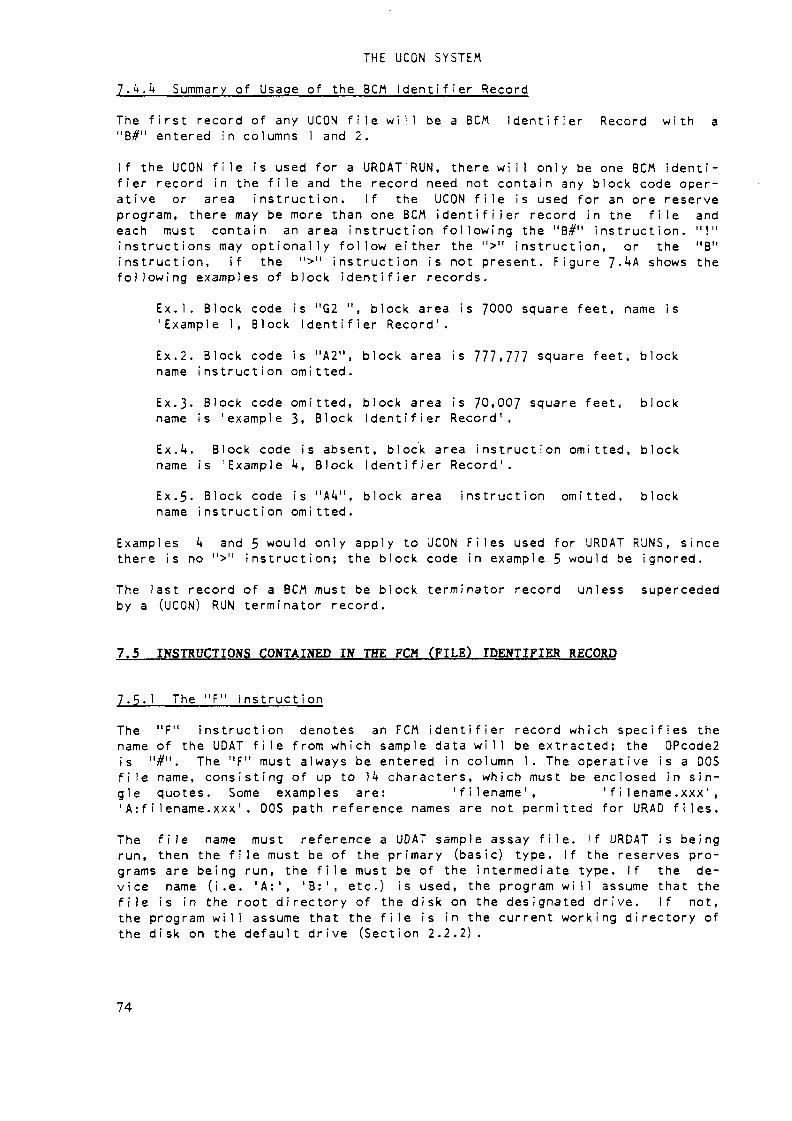
THE UCON SYSTEM
7.4.4 Summary of Usage of the BCM Identifier RecordThe f i r s t record of any UCON f i l e w i l l be a BCM I d e n t i f i e r Record with a"8#" entered in columns 1 and 2.If the UCON f i l e is used for a URDAT'RUN, there w i l l only be one BCM identi-fier record in the f i l e and the record need not contain any block code oper-ative or area instruction. If the UCON f i l e is used for an ore reserveprogram, there may be more than one BCM i d e n t i f i i e r record in the f i l e andeach must contain an area instruction following the "B#" instruction. "!"instructions may optionally follow either the ">" instruction, or the "B"instruction, if the ">" instruction is not present. Figure 7-4A shows thefollowing examples of block identifier records.
Ex.1. Block code is "G2 ", block area is 7000 square feet, name is'Example 1, Block Identifier Record'.Ex.2. Block code is "A2", block area is 777,777 square feet, blockname instruction omitted.Ex.3- Block code omitted, block area is 70.007 square feet, blockname is 'example 3, Block Identifier Record1.Ex.4. Block code is absent, block area instruction omitted, blockname is 'Example k, Block Identifier Record'.Ex.5- Block code is "A4", block area instruction omitted, blockname instruction omitted.
Examples 4 and 5 would only apply to UCON F i l e s used for URDAT RUNS, sincethere is no ">" instruction; the block code in example 5 would be ignored.The last record of a BCM must be block terminator record unless supercededby a (UCON) RUN terminator record.
7.5 INSTRUCTIONS CONTAINED IN THE FCM (FILE) IDENTIFIER RECORD
7.5.1 The "F" InstructionThe "F" instruction denotes an FCM identifier record which specifies thename of the UDAT f i l e from which sample data w i l l be extracted; the OPcode2is "#". The "F" must always be entered in column 1. The operative is a DOSf i l e name, consisting of up to 14 characters, which must be enclosed in sin-gle quotes. Some examples are: 'filename', 'filename.xxx','A:fi1ename.xxx'. DOS path reference names are not permitted for URAD files.The f i i e name must reference a UDAT sample assay f i l e . If URDAT is beingrun, then the f i l e must be of the primary (basic) type. If the reserves pro-grams are being run, the f i l e must be of the intermediate type. If the de-vice name (i.e. 'A:', 'B:', etc.) is used, the program w i l l assume that thef i l e is in the root directory of the disk on the designated drive. If not,the program w i l l assume that the f i l e is in the current working directory ofthe disk on the default drive (Section 2.2.2).
74

THE UCON SYSTEM
7-5-2 Other Instructions on the FCM Identifier Record"E", "L", "W", and /or "Q" instructions (see below) may also be included onan FCM identifier record, if space allows. If such are included, the f i l ename operative must be followed by a comma.
7.5.3 Summary of Usage of the FCM Identifier RecordA BCM identifier record must always be followed by an FCM identifier record.If m u l t i p l e files are to be processed for a block, then additional FCM iden-t i f i e r records w i l l be included within the BCM. The f i l e name is crucial inidentifying the data which w i l l be processed.An FCM identifier record is the first record of a f i l e control module andalways has "F#" in columns 1 and 2. Figure J.kB illustrates some examples ofFCM identifier records:
Ex.1. F i l e 'STARDAT1 is the UDAT f i l e requested and is assumed tobe on the current working directory of the default disk drive.Ex.2. F i l e 'STARDAT.B1 is the UDAT f i l e requested and is assumedto be on the default drive as above.Ex.3. F i l e 'GAMOAT' is the UDAT f i l e requested and is assumed tobe in the root directory of the floppy disk on the 'A1 drive. Someedit instructions are also entered in this record.
The last record of an FCM must be an FCM terminator record unless supercededby a BCM or RUN terminator record.
7.6 EDIT INSTRUCTIONS WITHIN A FILE CONTROL MODULE
7.6.1 General Character i s i esThe instructions described in this section are all used for editing or cor-rection of sample data. They are all optional and are only included w i t h i n af i l e control module as needed.The "E", "L", "W", and "Q" instructions all affect editing or correction ofsamples w i t h i n sample sets. More than one of these may be included on thesame record, including an FCM identifier record (see example 3, Figure 7^B.However, whenever one of these instructions is the first instruction of arecord, it must start in column 1 of the record. "E", "L", "W", or "Q" in-structions may not be entered on the same record as "C", "A", or "H" in-struct ions.The "C", "A", and "H" OPcodes must always begin in column 1 of a record, andno other instructions may appear on that record. These instructions apply toentire sample sets and determine whether an entire set is to be included orrejected during the processing of a file.There is no specific order of entry of these instructions w i t h i n a f i l e con-trol module, except that if two "Q" instruction are contained w i t h i n one
15
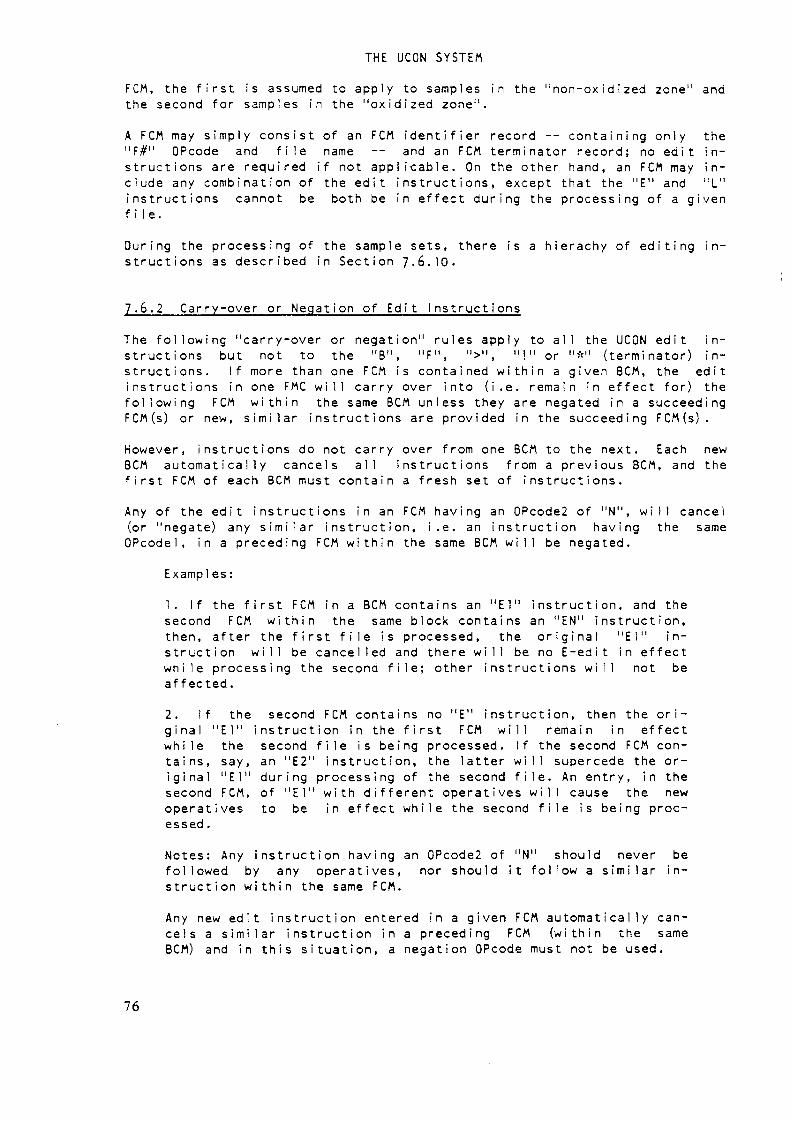
THE UCON SYSTEM
FCM, the f i r s t is assumed to apply to samples in the "non-oxidized zone" andthe second for samples in the "oxidized zone".
A FCM may s i m p l y consist of an FCM identifier record -- containing only the"F#" OPcode and f i l e name -- and an FCM terminator record; no edit in-structions are required if not applicable. On the other hand, an FCM may in-clude any combination of the edit instructions, except that the "E" and "L"instructions cannot be both be in effect during the processing of a givenf i le.During the processing of the sample sets, there is a hierachy of editing in-structions as described in Section 7-6.10.
7.6.2 Carry-over or Negation of E d i t InstructionsThe following "carry-over or negation" rules apply to all the UCON edit in-structions but not to the "B", "F", ">", "!" or "*" (terminator) in-structions. If more than one FCM is contained w i t h i n a given BCM, the editinstructions in one FMC w i l l carry over into (i.e. remain in effect for) thef o l l o w i n g FCM w i t h i n the same BCM unless they are negated in a succeedingFCM(s) or new, s i m i l a r instructions are provided in the succeeding FCM(s).However, instructions do not carry over from one BCM to the next. Each newBCM automatically cancels all instructions from a previous BCM, and thef i r s t FCM of each BCM must contain a fresh set of instructions.
Any of the edit instructions in an FCM having an OPcode2 of "N", w i l l cancel(or "negate) any s i m i l a r instruction, i.e. an instruction having the sameOPcodel, in a preceding FCM w i t h i n the same BCM w i l l be negated.
Examples :
1. If the first FCM in a BCM contains an "El" instruction, and thesecond FCM w i t h i n the same block contains an "EN" instruction,then, after the first f i l e is processed, the o r i g i n a l "El" in-struction w i l l be cancelled and there w i l l be no E-edit in effectw h i l e processing the second f i l e ; other instructions w i l l not beaffected.2. If the second FCM contains no "E" instruction, then the ori-g i n a l "El" instruction in the first FCM w i l l remain in effectw h i l e the second f i l e is being processed. If the second FCM con-tains, say, an "E2" instruction, the latter w i l l supercede the or-i g i n a l "El" during processing of the second f i l e . An entry, in thesecond FCM, of "El" with different operatives w i l l cause the newoperatives to be in effect w h i l e the second f i l e is being proc-essed .Notes: Any instruction having an OPcode2 of "N" should never befollowed by any operatives, nor should it follow a s i m i l a r in-struction w i t h i n the same FCM.Any new edit instruction entered in a given FCM automatically can-cels a s i m i l a r instruction in a preceding FCM (within the sameBCM) and in this situation, a negation OPcode must not be used.
76
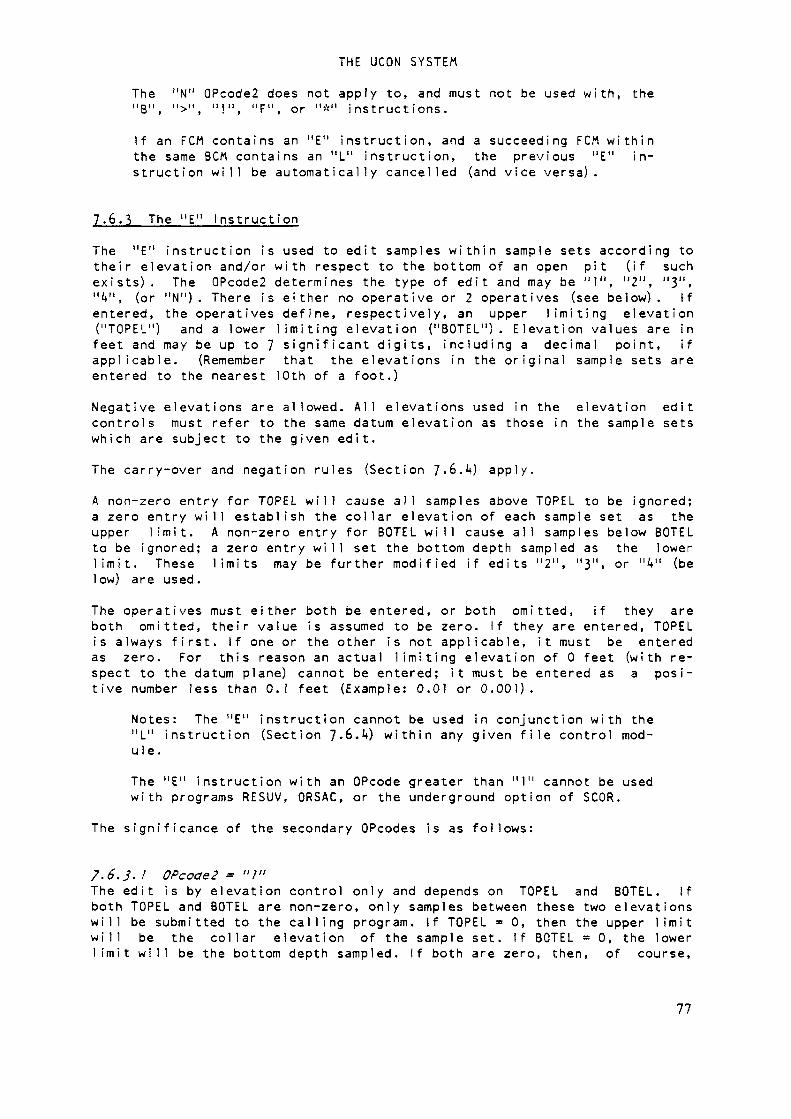
THE UCON SYSTEM
The "N" OPcode2 does not apply to, and must not be used with, the"8", ">", "!", "F", or "*'' instructions.If an FCM contains an "E" instruction, and a succeeding FCM w i t h i nthe same BCM contains an "L" instruction, the previous "E" in-struction w i l l be automatically cancelled (and vice versa).
7.6.3 The "E" InstructionThe "E" instruction is used to edit samples w i t h i n sample sets according totheir elevation and/or with respect to the bottom of an open pit (if suchexists). The OPcode2 determines the type of edit and may be "1", "2", "3","V, (or "N") . There is either no operative or 2 operatives (see below). Ifentered, the operatives define, respectively, an upper l i m i t i n g elevation("TOPEL") and a lower l i m i t i n g elevation ("BOTEL"). Elevation values are infeet and may be up to 7 significant d i g i t s , including a decimal point, ifapplicable. (Remember that the elevations in the original sample sets areentered to the nearest 10th of a foot.)Negative elevations are allowed. All elevations used in the elevation editcontrols must refer to the same datum elevation as those in the sample setswhich are subject to the given edit.The carry-over and negation rules (Section J.6.k) apply.A non-zero entry for TOPEL w i l l cause all samples above TOPEL to be ignored;a zero entry w i l l establish the collar elevation of each sample set as theupper l i m i t . A non-zero entry for BOTEL w i l l cause all samples below BOTELto be ignored; a zero entry w i l l set the bottom depth sampled as the lowerl i m i t . These l i m i t s may be further modified if edits "2", "3", or "V (below) are used.The operatives must either both be entered, or both omitted, if they areboth omitted, their value is assumed to be zero. If they are entered, TOPELis always first. If one or the other is not applicable, it must be enteredas zero. For this reason an actual l i m i t i n g elevation of 0 feet (with re-spect to the datum plane) cannot be entered; it must be entered as a posi-tive number less than O.Î feet (Example: 0.01 or 0.001).
Notes: The "E" instruction cannot be used in conjunction with the"L" instruction (Section J.b.k) w i t h i n any given f i l e control mod-ule.The "E" instruction with an OPcode greater than "1" cannot be usedwith programs RESUV, ORSAC, or the underground option of SCOR.
The significance of the secondary OPcodes is as follows:
7,6.3- ! OPcode2 = "I"The edit is by elevation control only and depends on TOPEL and BOTEL. Ifboth TOPEL and BOTEL are non-zero, only samples between these two elevationsw i l l be submitted to the c a l l i n g program. If TOPEL = 0, then the upper l i m i tw i l l be the collar elevation of the sample set. If BOTEL = 0, the lowerl i m i t w i l l be the bottom depth sampled. If both are zero, then, of course,
77
THE UCON SYSTEM
no editing w i l l effectively take place at a l l . This edit is not affected bythe presence of entries for pit-bottom in the sample sets.
7.6.3.2 OPcode2 = "2"Only sample sets ly i n g w i t h i n a pit (i.e., sample sets having a pit-bottomdepth ("PITBT") entered in their header records) w i l l be accepted; all oth-ers w i l l be completely rejected from the f i l e . For those accepted, only sam-ples l y i n g below the PITBT w i l l be included. If TOPEL and BOTEL are enteredas operatives, TOPEL w i l l be ignored, if it t i e s above the PITBT,
7.6.3.3 OPcode2 = "J"Only sample sets having a PITBT entry w i l l be accepted and furthermore, onlysamples above the PITBT w i l l be accepted. If TOPEL and BOTEL are entered asoperatives, BOTEL w i l l be ignored if it l i e s below the PITBT.
7.6.J.4 OPcode2 = "k"All hole sample sets are accepted. However, for any sample set containing anentry for PITBT, only those samples l y i n g below the PITBT w i l l be accepted;and, if the operatives are included TOPEL w i l l be ignored if it l i e s abovethe PITBT. For those sample sets not having a PITBT entry, TOPEL and BOTELw i l l be applied as described for an secondary OPcode of "1".
Note: There are two important factors to remember with respect toentries for PITBT in the primary (basic) UOAT fil e s :1. In the processing of the sample sets during a SCOR open pitRUN, if no "E" edit is in effect, the procedure described abovefor an OPcode2 of "V is automatically implemented since it is as-sumed that all material above the PITEL has been removed. An "El"instruction, with or without operatives, must be used overrideth i s cond i t i on.
2. The "E" pit-bottom control edits (secondary OPcodes = 2, 3. °r4) w i l l only be recognized when running the SCOR program for openpit analysis. When RUNs are made on RESUV, ORSAC, orSCOR-underground- option, the PITBT entries, or edits pertainingto them, are completely ignored!
Examples of entry for the "E" instruction are shown in Figure 7-^+C.Ex.1. Select only sample sets which have a non-blank entry forPITBT (depth to pit bottom); select only samples below the PITBTand above 200 feet in depth.Ex.2. Cancel any previous "E" instruction w i t h i n the given BCM.
7.6.4 The "L" InstructionThe "L" instruction is used to edit data on the basis of l i t h o l o g i e informa-tion associated with the sample sets, as described in Section 6.i*. It pro-vides the most versatile method of isolating m i n e r a l i z e d zones w i t h i n a
78
THE UCON SYSTEM
deposit. The secondary OPcodes are "#" and "N". The carry-over and negationrules (Section J.e.k) apply.The "L" instruction cannot, however, be used in conjunction with the "E"edit instruction w i t h i n a block control module; in effect, the L-edit, it-self, establishes the upper and lower bundaries for sample selection. Sampleset entries for PITBT are ignored when the L-edit is in effect.The operatives are the it-character lithologie codes for an "upper l i t h o l o g i eunit" ("TLTH") and a lower lithologie unit ("BLTH") within the range ofwhich samples w i l l be selected. The lithologie codes for TLTH and BLTH mustalways both be present, and each must be encased in single quotes (' ')andseparated by a comma. TLTH cannot be a unit which is lower than BLTH in theestablished "lithologie sequence" (Section 6.4).This edit is extremely useful in separating ore rones on the basis of atti-tude or li t h o l o g i e environment. It is most useful in bedded deposits but canalso be used to represent selected zones in other deposits, providing thatsome forethought has been given to this when establishing the primary(basic) UDAT data bases. It is especially useful in statistical analysis ofa deposit when it may be desired to run an analysis of (likely) individualsample populations which include only portions of the total samples in thesample sets.The edit assumes that specific lithologie (or psuedo-1ithologic) intervalshave been designated and entered in the "L" format with each of the applica-ble sample sets. TLTH and BLTH are ^-character codes chosen from the totall i s t of lithologie codes entered with the sample sets.The preparation of the "L" format records is described in Section 6.4. Toreview: the 4-character alphanumeric code for each l i t h o l o g i e unit is en-tered along with the corresponding "top pi c k 1 , i.e. the depth from the col-lar elevation of the sample set to the top of the given li t h o l o g i e unit. Theunit code/depth entries are made in order of increasing distance from thepoint indicated by the collar elevation.The depths are all positive numbers, except that:
1. For the l i t h o l o g i e unit in which the sample set is "collared"(i.e. in which the top of the sample set is positioned) the depthis entered as zero.2. Lithologie units with the flag "-1" (Section 6.4) in their cor-responding depth entries are considered to be missing (absent)above or within the total interval represented by the sample set.Lithologie units with the flag "-2" in their corresponding depthentries denote units assumed to lie below the lowest recognizedlithologie unit present in the interval represented by the givensample set.
Once a total sequence of lithologie units has been selected as being signif-icant for the region which includes the deposit(s) under evaluation, the "L"records in each sample set must include entries for every lithologie unitincluded in the total sequence. When the lithologie edit is in effect, and aunit represented by either TLTH or BLTH is not found, then the entire sampleset is rejected.
79
THE UCON SYSTEM
The edit is simple. As each sample set is processed, the TLTH operative iscompared to all the l i t h o l o g i e u n i t codes in the sample set l i s t and, if amatch is made, the depth corresponding to the matched unit becomes the topl i m i t i n g depth; all samples above that point are excluded. The BLTH iss i m i l a r y compared, and if a match is made, the depth of the u n i t succeedingthe matched unit becomes the bottom l i m i t i n g depth and all samples belowthat depth are excluded.If sample selection is desired from one particular unit only, then the codefor that unit is entered both for TLTH and BLTH. Whenever either of the l i m -its "splits" an integral sample, only the portion w i t h i n the l i m i t s is ac-cepted. Example: if there is a sample of 5 feet @ 0.20% U308 l y i n g in theelevation range of 2005 - 2000 feet, and the TLTH is determined at 2002feet, only 2 feet @ 0.20%U308 w i l l be included as an "accepted" sample.The following operations also take place during the matching process:
1. Whenever a BTLH edit operative represents the last (lowest)unit recognized w i t h i n a sampled interval, whether the very lastunit of the entire sequence or the last to contain a positivedepth entry), the bottom-depth-sampled automatically becomes thelower l i m i t i n g elevation.2. Whenever a BLTH edit operative is matched to a sample set u n i twhich lies below the bottom depth sampled for the given set, thebottom depth sampled automatically becomes the lower l i m i t i n gdepth.
3. Whenever a TLTH or BLTH edit operative is matched with a corre-sponding (sample set) unit which has a depth entry of "-]" (miss-ing), the depth of the first succeeding unit which contains apositive depth value becomes the upper (or lower) l i m i t i n g depth.If all units are missing in the range specified by TLTH and BLTH,then the interval is automatically considered "barren".
The following examples of the "L" instruction are shown on Figure 7 .kD; F i g -ures 6.3 and 6.i+ may be used as references.
Ex.1. TLTH and BLTH are entered as 'JMU1 1 and 'JML2' respectively.For Hole # HYP1, the top and bottom l i m i t i n g depths would be 90'(7280 minus 7190) and 310' (7280 minus 6970), respectively. ForHole HYP2, they would be 190' and 1*20'.Ex,2. TLTH and BLTH are 'JML2' and 'JMLT. For Hole HYP1, the topand bottom l i m i t s would be 170' and 390' (depth to bottom of thehole). For Hole HYP3, the l i m i t s would be 3*+0' and ^70' (the holebottom).Ex.3. TLTH and BLTH are 'JMC ' and 'JMC ' (same unit). For HoleHYP1, the l i m i t s would be 150' and 170'. Hole HYP2 would be con-sidered "barren" since the unit is not present.Ex.U. TLTH and BLTH are 'JSMV and 'JTDL1. For Hole HYP2, the l i m -its would be 500' and 580'. Holes HYP1 and HYP3 would be consid-ered barren since both units are either missing or presumably liebelow the bottom of these holes.
80

THE UCON SYSTEM
Ex.5. TLTH and BLTH are 'KMC ' and "KBC '. For Hole HYP1, the l i m -its would be 0' and 90'; unit 'KMC ' is missing and the hole iscollared in uni t 'KBC '.Ex.6. TLTH and BLTH are 'JMC ' and 'JML2'. For Hole HYP3, the l i m -its would be 300' and 1+70'. For Hole HYP2, they would be 260' (topof unit 'JML2" since unit 'JMC ' is missing), and 1*20'.
The characters making up the l i t h o l o g i e code (including blocks) must exactlymatch those in the data, or the hole is rejected entirely. For example: 'JMC1 would not match 'JMC '. For this reason it is wise to use k charactercombinations for l i t h o l o g i e codes rather than using one or more blanks. Thishas not been done in the examples expressly for illustrative purposes!If the L-edit is in effect for a run, and there are no lithologie data (L-records) associated with a sample set, the entire set is rejected.Test f i l e "STARDATL" (Section 4.1) may be used to test the effects of the"L" instruction.
7.6.5 The "W" InstructionThe "W" instruction is used to edit samples by their position relative tothe depth to oxidized/non-oxidized contact (Section 5-2.5)- The secondaryOPcode is either "1" or "2". If "1", only samples below the contact w i l l beselected. If "2" only samples above the contact w i l l be selected. A "WN" op-erator negates any previous "W" instruction w i t h i n a block control module.If sample sets have no entry for "depth-to-oxidized/non-oxidized contact",then the depth w i l l be assumed to 0, indicating that all samples are assumedto lie below the contact. An operator code of "W2" w i l l e l i m i n a t e all suchsamples. Therefore this instruction must be used with care. There is no op-erative required with the "W" instruction. Example 2, Figure 7-^B» shows theentry of the "W" instruction with an OPcode2 of "2". 7.6.6 The "Q" Instruc-tion The "Q" instruction is used for correcting radiometric assays for dise-q u i l i b r i u m . The OPcode2 is "1", "2", or "N". Operatives are numeric valueswhich may contain up to 6 significant d i g i t s , including a decimal point.These values are the coefficients used in the "correction" equation (Section3.M designated by the OPcode2. Two functions are used:
1. If OPcode2 is 1, the equation is a polynomial of the form:
y = A + BX + CX **2 + D* **3 + E* **4where,
X is the radiometric grade, andY is the corrected grade,
and the operatives are the coefficients A, B, C, D, and E.The degree of the equation is imp ] i c i t y denoted by the number ofcoefficients (operatives) following the instruction code. If 2 co-efficients are entered, the degree of the polynomial is 1, etc.The operatives are entered in the sequence -- A, B, etc. Any zero
81
THE UCON SYSTEM
coefficient of ltered must be en
esser ranktered.
then the last non-zero coefficient en-
Example: if the equation isY = 1.3X + O.Ol»X**3, '
then the operatives must be "0", "1.3", "0", and ".OU" (See Exam-ple 1 , F igure. 7-2. If OPcode2 = "2", the equation is a logarithmic function of theform:
LOGeY = A + B x LOGeX
Only 2 operatives, i.e. the "A" and "B" coefficients, are re-quired. If "A" is zero, it must be entered as "0". Example 2,Figure 7-^E, shows the coefficients entered for the equation:
LOGeY = 0.188 + 0.994 x LOGeX
The form and coefficents of the equations must be previously de-termined by statistical analysis of the a p p l i c a b l e sample assaydata (Section 3-4)
Two "Q" instructions are permitted in one FCM (example 3, Figure 7-4E). Ifonly one "Q" instruction (and associated operatives) is entered in a givenFCM, it w i l l apply to all samples of a sample set. If two "Q" instructionsare entered, the first w i l l be applied to all sample assays assumed to be ina "non-oxidized" environment, and the second to all those in an "oxidized"environment. The value for "depth to ox id i zed/non-ox i d i zed" contact in sam-ple set header records w i l l determine the position of the i n d i v i d u a l sampleswi t h respect to that contact.Remember that if the entry for depth-to- ox. /non-ox. -contact is entered as 0(or left blank) in a header record, it is assumed that all samples represen-ted by that record lie in the unoxidixed environment.If corrections are to be made only to samples in the oxidized zone, then a"dummy" "Q" instruction must be entered, f i r s t , for the non-oxidized zone.Example: "Ql 0,1", where "Y = 0 + X" is assumed. This "correction" w i l l bemade to samples in the unoxized xone, but, of course, no change in valuew i l l resul t .
The carry-over and negation rules (Section 7-6.2) apply.Note: If two "Q" instructions are entered in an FCM, a "QN" in-struction OPcode in a following FCM in the same BCM w i l l negateboth previous instructions; a single "Q" instruction in a follow-ing FCM also negates both previous instructions and establishes anew correction equation which w i l l be applied to all samples.
82
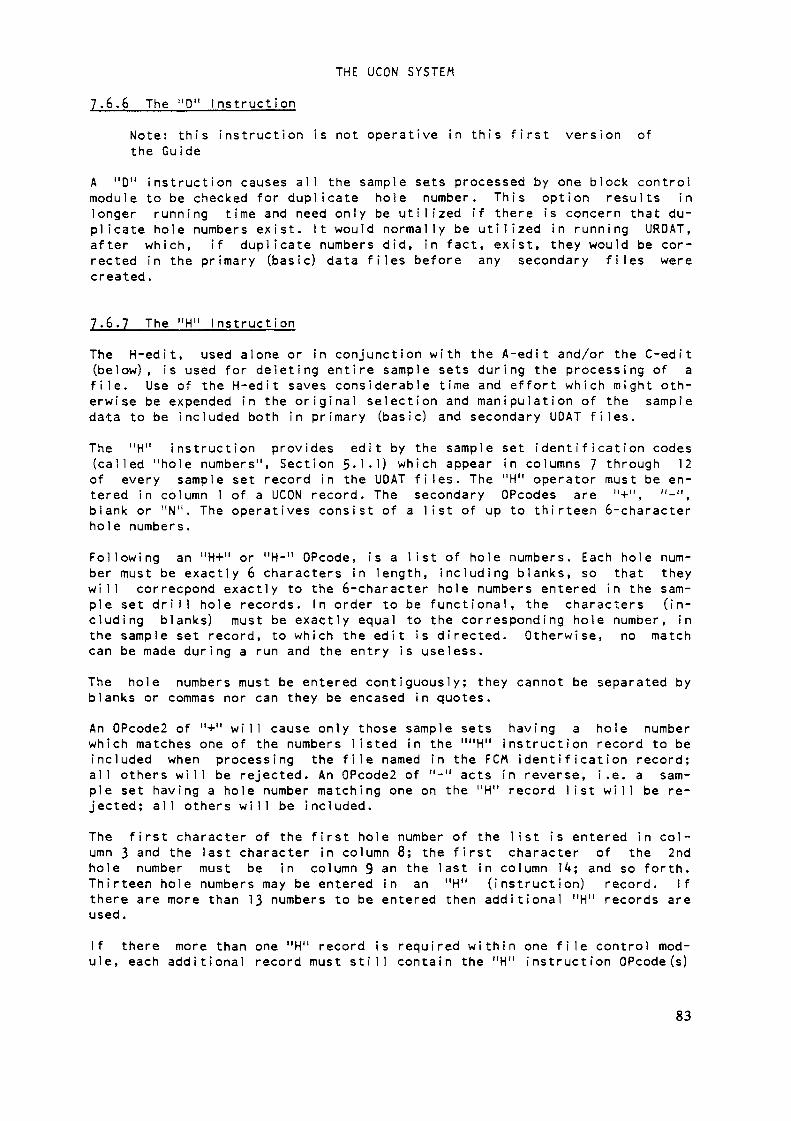
THE UCON SYSTEM
7.6.6 The "0" InstructionNote: this instruction is not operative in this first version ofthe Guide
A "D" instruction causes all the sample sets processed by one block controlmodule to be checked for duplicate hole number. This option results inlonger running time and need only be utilized if there is concern that du-plicate hole numbers exist. It would normally be utilized in running URDAT,after which, if duplicate numbers did, in fact, exist, they would be cor-rected in the primary (basic) data files before any secondary files werecreated.
7.6.7 The "H" InstructionThe H-edit, used alone or in conjunction with the A-edit and/or the C-edit(below), is used for deleting entire sample sets during the processing of af i l e . Use of the H-edit saves considerable time and effort which might oth-erwise be expended in the original selection and manipulation of the sampledata to be included both in primary (basic) and secondary UDAT files.The "H" instruction provides edit by the sample set identification codes(called "hole numbers", Section 5 - 1 - D which appear in columns 7 through 12of every sample set record in the UOAT files. The "H" operator must be en-tered in column 1 of a UCON record. The secondary OPcodes are "+", "-",blank or "N". The operatives consist of a l i s t of up to thirteen 6-characterhole numbers.Following an "H+" or "H-" OPcode, is a l i s t of hole numbers. Each hole num-ber must be exactly 6 characters in length, including blanks, so that theyw i l l correcpond exactly to the 6-character hole numbers entered in the sam-ple set d r i l l hole records. In order to be functional, the characters (in-cluding blanks) must be exactly equal to the corresponding hole number, inthe sample set record, to which the edit is directed. Otherwise, no matchcan be made during a run and the entry is useless.The hole numbers must be entered contiguously; they cannot be separated byblanks or commas nor can they be encased in quotes.An OPcode2 of "+" w i l l cause only those sample sets having a hole numberwhich matches one of the numbers listed in the ""H" instruction record to beincluded when processing the f i l e named in the FCM identification record;all others w i l l be rejected. An OPcode2 of "-" acts in reverse, i.e. a sam-ple set having a hole number matching one on the "H" record l i s t w i l l be re-jected; all others w i l l be included.The first character of the first hole number of the l i s t is entered in col-umn 3 and the last character in column 8; the first character of the 2ndhole number must be in column 9 an the last in column 14; and so forth.Thirteen hole numbers may be entered in an "H" (instruction) record. Ifthere are more than 13 numbers to be entered then additional "H" records areused.If there more than one "H" record is required w i t h i n one f i l e control mod-ule, each additional record must s t i l l contain the "H" instruction OPcode (s)
83
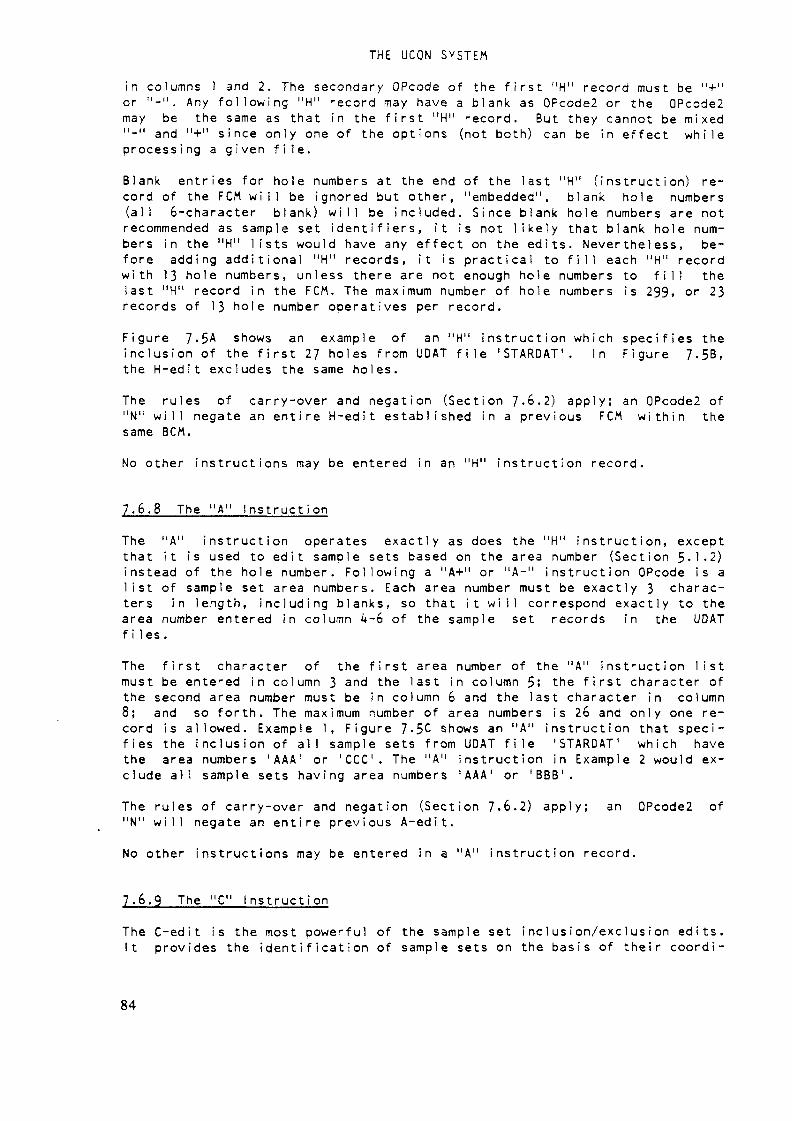
THE UCON SYSTEM
in columns 1 and 2. The secondary OPcode of the first "H" record must be "+"or "-". Any foll o w i n g "H" record may have a blank as OPcode2 or the OPcode2may be the same as that in the first "H" record. But they cannot be mixed"-" and "+" since only one of the options (not both) can be in effect w h i l eprocessing a given f i l e .Blank entries for hole numbers at the end of the last "H" (instruction) re-cord of the FCM w i l l be ignored but other, "embedded", blank hole numbers(all 6-character blank) w i l l be included. Since blank hole numbers are notrecommended as sample set identifiers, it is not l i k e l y that blank hole num-bers in the "H" l i s t s would have any effect on the edits. Nevertheless, be-fore adding additional "H" records, it is practical to f i l l each "H" recordwith 13 hole numbers, unless there are not enough hole numbers to f i l l thelast "H" record in the FCM. The maximum number of hole numbers is 299, or 23records of 13 hole number operatives per record.Figure 7-5A shows an example of an "H" instruction which specifies theinclusion of the first 27 holes from UDAT f i l e 'STARDAT'. In Figure 7-5B,the H-edit excludes the same holes.The rules of carry-over and negation (Section 7-6.2) apply; an OPcodel of"N" w i l l negate an entire H-edit established in a previous FCM w i t h i n thesame BCM.No other instructions may be entered in an "H" instruction record.
7.6.8 The "A" instructionThe "A" instruction operates exactly as does the "H" instruction, exceptthat it is used to edit sample sets based on the area number (Section 5 - 1 - 2 )instead of the hole number. Following a "A+" or "A-" instruction OPcode is al i s t of sample set area numbers. Each area number must be exactly 3 charac-ters in length, including blanks, so that it w i l l correspond exactly to thearea number entered in column 4-6 of the sample set records in the UDATfi l e s .The first character of the first area number of the "A" instruction l i s tmust be entered in column 3 and the last in column 5; the first character ofthe second area number must be in column 6 and the last character in column8; and so forth. The maximum number of area numbers is 26 and only one re-cord is allowed. Example 1, Figure 7-5C shows an "A" instruction that speci-fies the inclusion of all sample sets from UDAT f i l e 'STARDAT' which havethe area numbers 'AAA' or 'CCC'. The "A" instruction in Example 2 would ex-clude all sample sets having area numbers 'AAA' or 'BBB 1.The rules of carry-over and negation (Section 7-6.2) apply; an OPcode2 of"N" w i l l negate an entire previous A-edit.No other instructions may be entered in a "A" instruction record.
7.6.9 The "C" InstructionThe C-edit is the most powerful of the sample set inclusion/exclusion edits.It provides the identification of sample sets on the basis of their coordi-
84
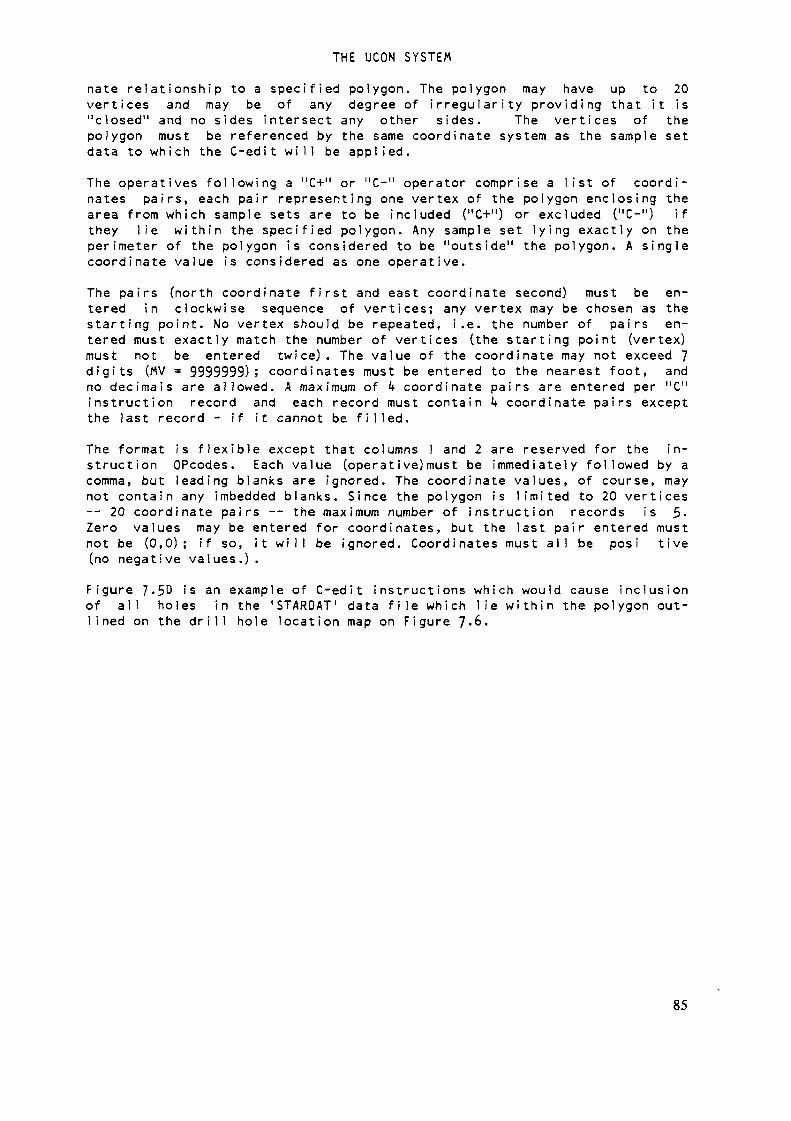
THE UCON SYSTEM
nate relationship to a specified polygon. The polygon may have up to 20vertices and may be of any degree of irregularity providing that it is"closed" and no sides intersect any other sides. The vertices of thepolygon must be referenced by the same coordinate system as the sample setdata to which the C-edit w i l l be applied.The operatives following a "C+" or "C-" operator comprise a l i s t of coordi-nates pairs, each pair representing one vertex of the polygon enclosing thearea from which sample sets are to be included ("C+") or excluded ("C-") ifthey lie within the specified polygon. Any sample set lying exactly on theperimeter of the polygon is considered to be "outside" the polygon. A singlecoordinate value is considered as one operative.The pairs (north coordinate first and east coordinate second) must be en-tered in clockwise sequence of vertices; any vertex may be chosen as thestarting point. No vertex should be repeated, i.e. the number of pairs en-tered must exactly match the number of vertices (the starting point (vertex)must not be entered twice). The value of the coordinate may not exceed 7d i g i t s (MV = 9999999); coordinates must be entered to the nearest foot, andno decimals are allowed. A maximum of 4 coordinate pairs are entered per "C"instruction record and each record must contain k coordinate pairs exceptthe last record - if it cannot be f i l l e d .The format is flexible except that columns 1 and 2 are reserved for the in-struction OPcodes. Each value (operative)must be immediately followed by acomma, but leading blanks are ignored. The coordinate values, of course, maynot contain any imbedded blanks. Since the polygon is limited to 20 vertices— 20 coordinate pairs -- the maximum number of instruction records is 5.Zero values may be entered for coordinates, but the last pair entered mustnot be (0,0); if so, it w i l l be ignored. Coordinates must all be posi tive(no negative values.).Figure 7-5D is an example of C-edit instructions which would cause inclusionof all holes in the 'STARDAT' data f i l e which lie w i t h i n the polygon out-lined on the d r i l l hole location map on Figure 7-6.
85

THE UCON SYSTEM
The vertices of the polygon are numbered and circled on the map and theircoordinates (in feet) are listed as follows:
Vertex Number1231+5678910
1 11213}k151617
North Coordinate700
1 10011001300130017001700240031003100260022001700170013001300700
East Coordinate15001500170017001 100110018001 150170030502650305026002100210019001900
If the instruction in the first C-edit record was "C-" instead of"C+", only the holes outside the polygon would be included.
The rules of carry-over/negation (Section 7-6.2) apply; an OPcode2 of "N"w i l l negate an entire C-edit in a previous FCM w i t h i n the same BCM. No otherinstructions may be entered in a "C" instruction record.
7.6.10 Hierarchy of E d i t OperationsThe order in which the edits specified in a f i l e control module take placeduring program execution is listed below.
1 .2.3-k.5-6.
C-edit .A-edi t.H-edit.Q-corr .L-edi t orW-edit.
E-edit.
This order is especially important to keep in mind when planning sample setselection ("C", "A", and "H" edits). If the C-edit is in effect, A- orH-edits w i l l only be performed on the sample sets which meet the C-edit re-quirement (inside or outside the polygon). If the A-edit is in effect, onlysample sets which meet A-edit specifications w i l l be subject to any H-editrequirements. Example: if a sample set is designated for inclusion by anH-edit specification, but has an area number which is designated for exclu-sion by a A-edit specification, the sample set w i l l be excluded.
86
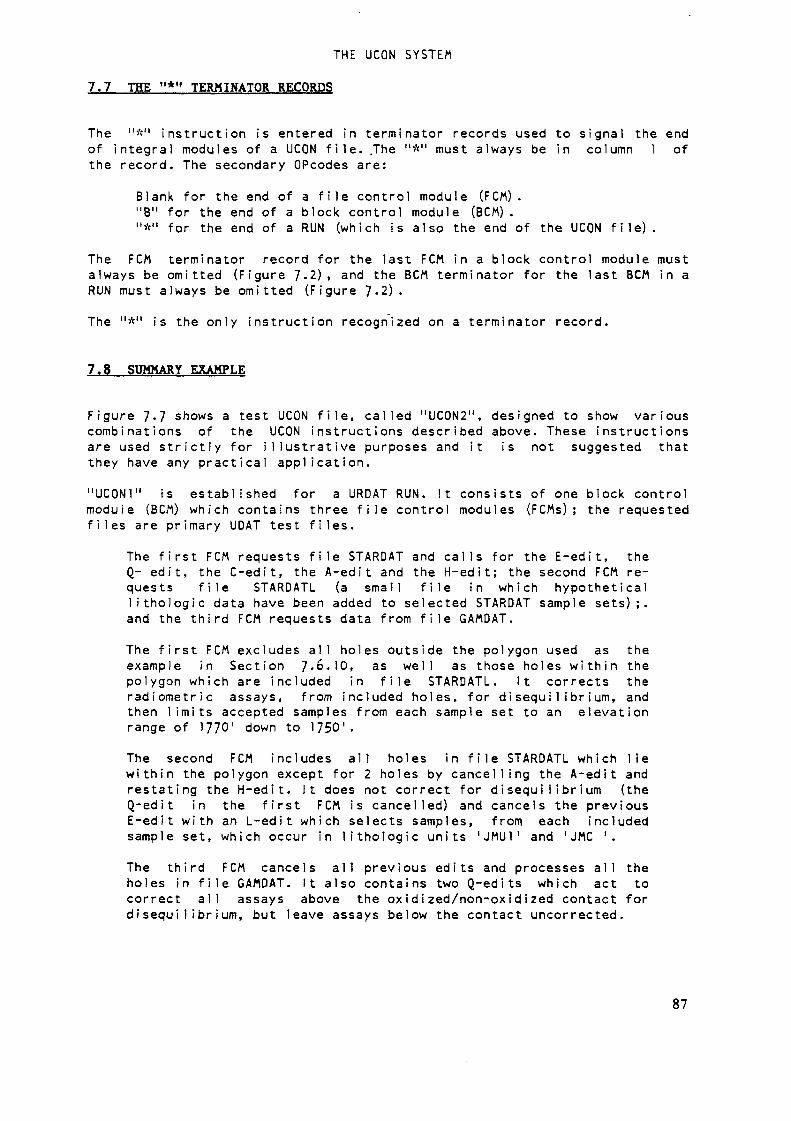
THE UCON SYSTEM
7.7 THE "*" TERMINATOR RECORDS
The "*" instruction is entered in terminator records used to signal the endof integral modules of a UCON f i l e . .The "*" must always be in column 1 ofthe record. The secondary OPcodes are:
Blank for the end of a f i l e control module (FCM)."B" for the end of a block control module (BCM) ."*" for the end of a RUN (which is also the end of the UCON file).
The FCM terminator record for the last FCM in a block control module mustalways be omitted (Figure 7-2), and the BCM terminator for the last BCM in aRUN must always be omitted (Figure 7-2).The "*" is the only instruction recognized on a terminator record.
7.8 SUMMARY EXAMPLE
Figure 7.7 shows a test UCON f i l e , called "UCON2", designed to show variouscombinations of the UCON instructions described above. These instructionsare used strictl y for illustrative purposes and it is not suggested thatthey have any practical application."UCON1" is established for a URDAT RUN. It consists of one block controlmodule (BCM) which contains three f i l e control modules (FCMs); the requestedf i l e s are primary UDAT test files.
The first FCM requests f i l e STARDAT and c a l l s for the E-edit, theQ- edit, the C-edit, the A-edit and the H-edit; the second FCM re-quests f i l e STARDATL (a small f i l e in which hypotheticall i t h o l o g i e data have been added to selected STARDAT sample sets);,and the third FCM requests data from f i l e GAMDAT.The first FCM excludes all holes outside the polygon used as theexample in Section 7-6.10, as well as those holes w i t h i n thepolygon which are included in f i l e STARDATL. It corrects theradiometric assays, from included holes, for disequilibrium, andthen l i m i t s accepted samples from each sample set to an elevationrange of 1770' down to 1750'.The second FCM includes all holes in f i l e STARDATL which liew i t h i n the polygon except for 2 holes by cancelling the A-edit andrestating the H-edit. It does not correct for dis e q u i l i b r i u m (theQ-edit in the first FCM is cancelled) and cancels the previousE-edit with an L-edit which selects samples, from each includedsample set, which occur in lithologie units 'JMU1' and 'JMC '.The third FCM cancels all previous edits and processes all theholes in f i l e GAMDAT. It also contains two Q-edits which act tocorrect all assays above the oxidized/non-oxidized contact fordisequilibrium, but leave assays below the contact uncorrected.
87
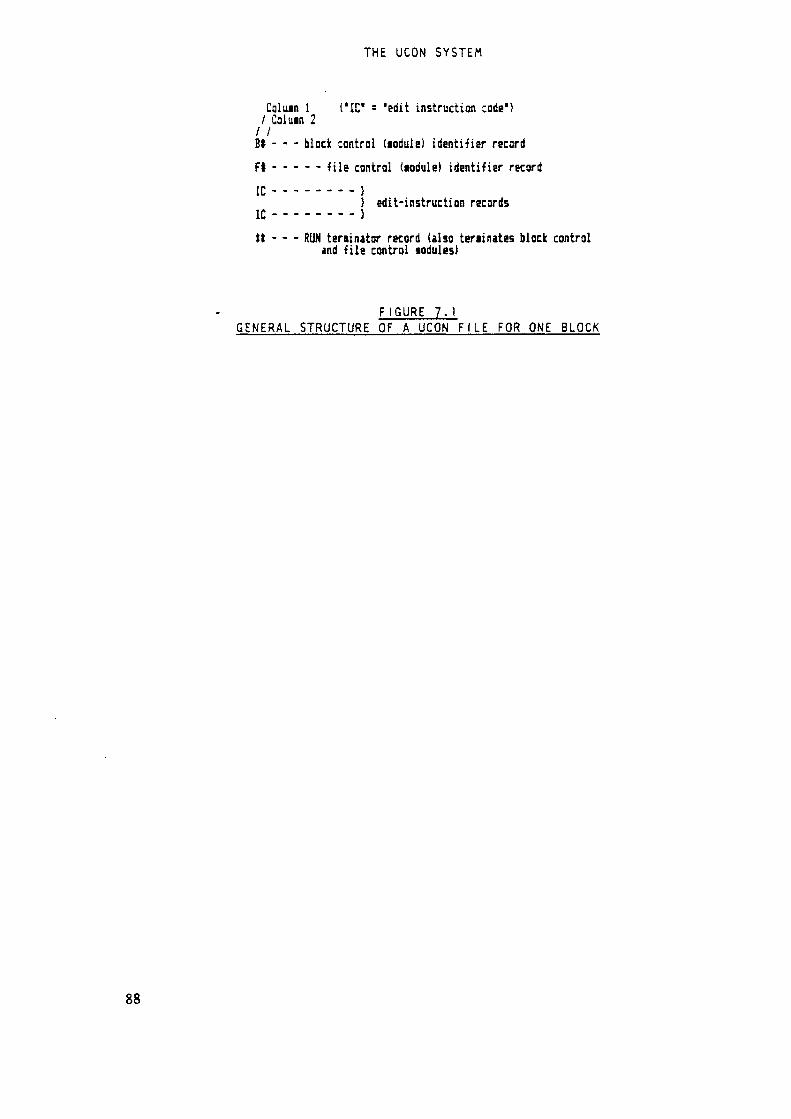
THE UCON SYSTEM
Coiuin 1 ('1C* = 'edit instruction code1)/ Coiuin 2/ /Bt - - - black control (icdule) identifier recordFt - - - - - fils control («odulel identifier recordIC ........ j
} edit-instruction records1C - - - - - - - - }Jt - - - RUN t er Binst or record (also teninates block control
and f i le control sodules)
F I G U R E 7 .1GENERAL STRUCTURE OF A UCON F I L E FOR ONE BLOCK
88
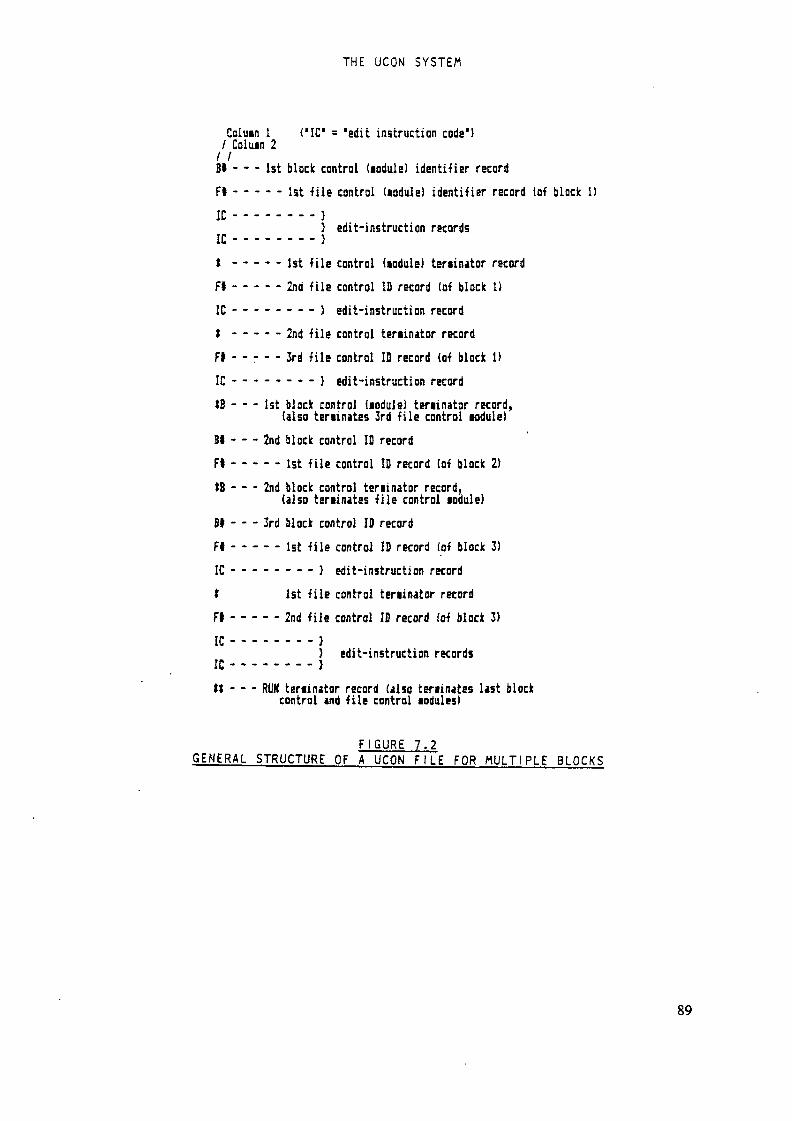
THE UCON SYSTEM
Column i CIC' = 'edit instruction code*)/ Coluin 2/ /8» - - - 1st black central dadule) identifier recordFt - - - - - 1st file control (iodule) identifier record (of block 1)JC ........ j} adit-instruction recordsIC ........ jI - - - - - 1st file control (module) terminator recordFl - - - - - 2nd file control ID record (of block 1)1 C - - - - - - - - ) edit-instruction recordj ..... 2nd file control teninator recordFl - - r - - 3rd file control ID record (of block 1)1 C - - - - - - - - } edit-instruction recordIB - - - 1st block control (module) teriinator record,(also terminates 3rd file control module)81 - - - 2nd block control ID recordFt - - - - - 1st file control ID record (of block 2)IB - - - 2nd block control terminator record,(also terminates file control iodule)Bf - - - 3rd block control ID recordFt - - - - - 1st file control ID record (of block 3)1 C - - - - - - - - } edit-instruction recordt 1st file control teriinator recordFt - - - - - 2nd file control ID record (of black 3)
} edit-instruction records1 C - - - - - - - - }it - - - RUN teriinator record (alia teriinates last blockcontrol and file control modules)
F I G U R E 7.2GENERAL STRUCTURE OF A UCON F I L E FOR MULTIPLE SLOCKS
89

THE UCON SYSTEM
Priaary Pruary iGPcoae SecondaryOPcodes*B St
!t
FI
NuiOer anaType afOperatives»»
usage
i=0 or i CA1 =3) 9=yesC=yesi=l (H l 10) D=no
C=yes1=1 ('ft' i 74) 9=yesC=noi=l CA' i 15) 9=yesC=yes
La = i, or N i=2 CA' = 4) 3=785C=yes
BCS (block) identifier(aust begin in coiuin 1 af record)block area(follows '3' instruction)block naae(follows *>' instruction;file control (coiuin 1)
lithologie edit
En = 1,2,3,4, N i=0 or 2 (N '. 7) D = y e s t i ) » < » elevation (or open pi t ) editC=yesKn = 1,:,» t=0
9n = 1,2, or N i=l-5 (N i 6J D=yes(5)C=yesCa = *,-,b,N i :8/rec (N i 7[ o=no
Aa = +,-,b,Maax. rec. =5 C=yes
i i2a/rec (A = 3) Q=noaax. rec. * 1 C=noHa = V,b,.1 i 113/rec (A = 6) 9=notax. rec. = 5 C=no»a = b,3, t
t13il
oxidi:ed / non-oxidi:ed contact editdisequilibrium corrections)
saaole set coordinate edittaust begin in coiuin 1!saaole set area nuacer edit(aust begin in coluan 1)saaole set hole nuaber editlaust Begin in coluan 1)terainator (coluan 1), where:is file teriinatoris block teriinatoris RUN teriinator
I For secondary OPcodes: "n* is nuaenc and allowable nuaoers are shown.'a' is character and allowable tens are snowi; "b" = Ulan*."*' is non-functional (padding).<» For operatives: ":* is the nuafaer of operatives;"A" or "M" is nuaoer of characters or nuaenc digits (including deciaal, if applicable);' l' indicates aaxiaua liait, '=' indicates exact nuaoer of cnaracters.
"0=yes or no* indicates ohetner nuaenc operative can be a deciaal fraction.(nuaber in parens is nuaber of places to right of deciaai)*Q=yes or no' indicates Pettier alphanuaeric operative aust 3e encasesd in quotes."C=yes or no" indicates whether coaaas lust separate operatives froa theaselvesand frei succeeding instructions on the saae record,"aax. rec* inßicates aaxiaua nua&er of records allowed for aulti-record instructions.ttt See documentation text.
F I G U R E 7 . 3SUMMARY OF UCON INSTRUCTIONS
90

THE UCON SYSTEM
, Record rsraat ,
coium ! ! 1111111112222222:::333333333344444444445555555555ùoooooooé67777777777a !nuwers /il2345à739Ô!2345à7S9012345ù789Û12345o739ûl2345o7S9012345ù7S?012345ti78?Oi2345û739ô
Exaaoie 1 IS* '52 ', ;* 70ÛO, It ' EÏAMH.E 1, SLflCK IDENTIFIER RECORD.'! 2 1 8*' A1 ' )*777777
"3 IB* t 7 0 0 0 7 ' * ' EXAHPLE 3, BLOCK IDENTIFIER äECQRD.'4 IB* 'I ' EXAHPLE 4, BLOCK IDENTIFIER RECORD.'5 IB* 'A4 '
FISURE 7.4A. Exaipies 3f 'JCQN Bloc* >.BC«! Identifier Records.
Record Forait ,
cola« l U 111 II11i2222222222333333333344444444445555555555baôùoÈ6ô6à77777777778nuibers ;!l234567890l2345i7390t23456789<)i2345o7S9<}l23456789ui2345à7890l234567890l2345ô7890
Exaipla I ;F* 'STARDAT'2 .'F* 'flrSTflfiUAT.S'3 ;Ft'SAflDAT',Ei 5000,aOOO, Ul .01,1.4, «2
FI6ÜRE 7.48. Ex a« i es Of ÜCQN File tFCfl) Identifier Records.
r Record Foriat ,
coluin ! 1111111111222222222233333333334444444444555555555566oa6o6o667777-7777778muoers *:l2345fi78901234567890l2345à7890l2345679901^456789012345ù7B90i:34567W012345o7a90
lEx»:le l IE2 0, 200I 2 IEN
FIGURE 7.4C. Exâiples Of The UCCN 'E1 Instruction.. Record Foraat
col urn ; 11111111112222222222333333333344444444445555555555i6È6o6à6à677777777773nmoers : !S234567890123456789012345i7890l2345&78901234567890123456789012345u78901234567890Exîiple 1 111 'JHUr,'JHL2'2 IL* 'JKL2' , 'JULI13 ill 'JHC ','M '4 It* 'JSflV ,'JTDL'5 IL» 'KHC ', 'K3C '6 iL*'J«C ','JHL2'
FIGURE 7.4D. Examples Of The UCON V Instruction.r Record Fcrwt ,t t
colutn I 11111111112222222222333333333344444444445555555555o66ûûà666677777777778nuiöers >l12345i7890123456789012345678901234567890i:3456789012!45ö78901234567B9012345i7890Esaipie 1 !Q[ 0. 1.3, 0, .i)42 182 .188, .9943 IQ2 .188 ,.994, 31 -.01, 1.5, -.06
FI5URE 7.4E. Examples Of The UCON §8' Instruction.
FIGURE 7.UA-EEXAMPLES OF "B". "F". "E", "L", AND "0" UCON INSTRUCTIONS
91
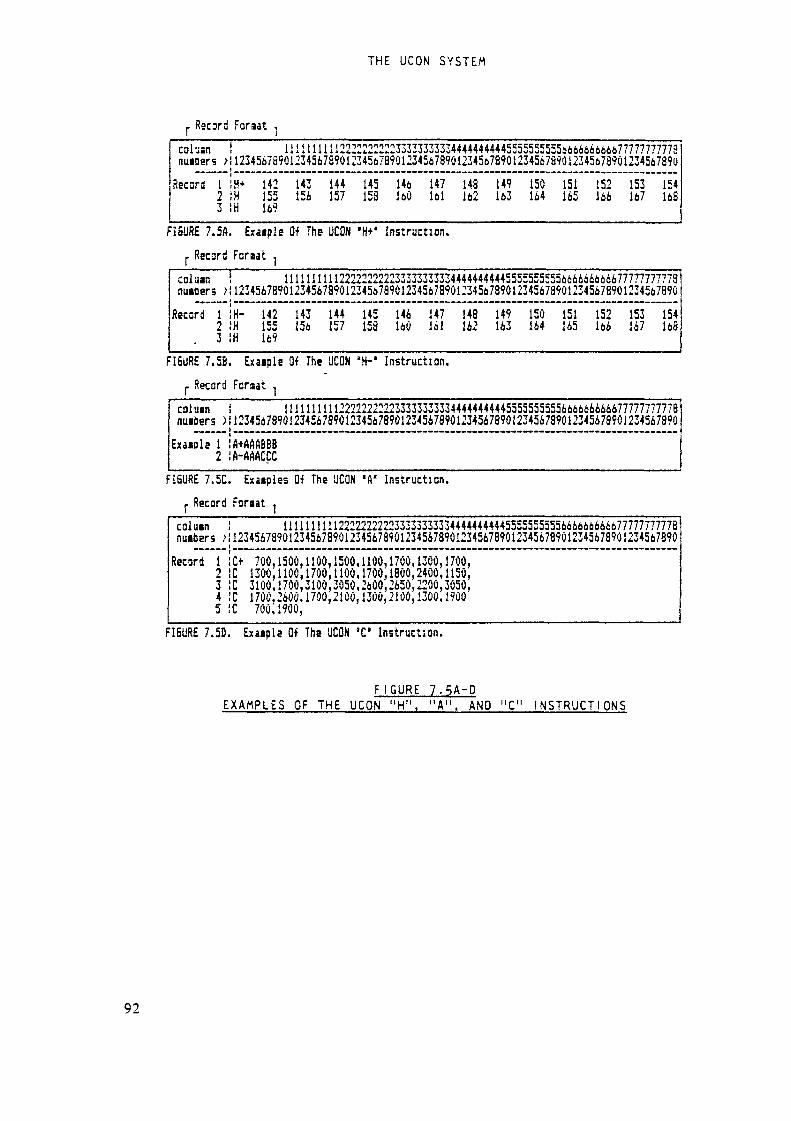
THE UCON SYSTEM
Record Foraat
CDltisn i 111 i 1111112222222222333333333344444444445555555555666666666677777777778!nuiBers >!1234567890123456789012345678901234567890123456789012345678901234567890123456789Ü
Record 1 !H+ 142 143 144 145 146 147 148 1492 !H 155 156 157 158 16Û lui 162 1633 !H 169
150 151 152 153 154164 165 166 167 168
FÎSURE 7.5A. Exaaple Of The ÜCON "H+" Instruction.,. Record Foraat ,
coi uan 1 1111111111 2222222222333333333344444444445555555555666666666677777777778auioers )', 12345678901234567890123456789012345678901234567890123456739012345678901234567890Record 1 !H-2 ,'H3 !H
142155169143156 144257 145158 146160 147161 148162 149163 150164 151165 152166 153167 154168
FIGURE 7.58. Exaiple Of The UCON 'H-' Instruction.,. Record Forsat ,
coi uin ! 11 i 1111 i 112222222222333333333344444444445555555555666666666677777777778nuibers )112345678901234567890123456789012345678901234567890123456799012345678901234567890Exaiole 1 ifl+AAABBB2 IA-AAACCCFI6URE 7.5C. Exaiples Of The UCQN 'A" Instruction.
. Record Foraatcoluin ! 11111111112222222222333333333344444444445555555555666666666677777777778nuibers )! 12345678901234567890123456789012345678901234567890123456789012345678901234567890
Record l 1C+ 700,1500,1100,1500,1100,1700,1300,1700,2 1C 1300,1100,1700,1100,1700,1800,2400,1150,3 1C 3100,1700,3100,3050,2600,2650,2200,3050,4 1C 1700,2600,1700,2100,1300,2100,1300,19005 1C 700,1900,
FI5URE 7.5D. Exaiple Of The UCON 'C1 Instruction.
F I G U R E 7 . 5 A - DEXAMPLES OF THE UCON "H", "A", AND "C" INSTRUCTIONS
92
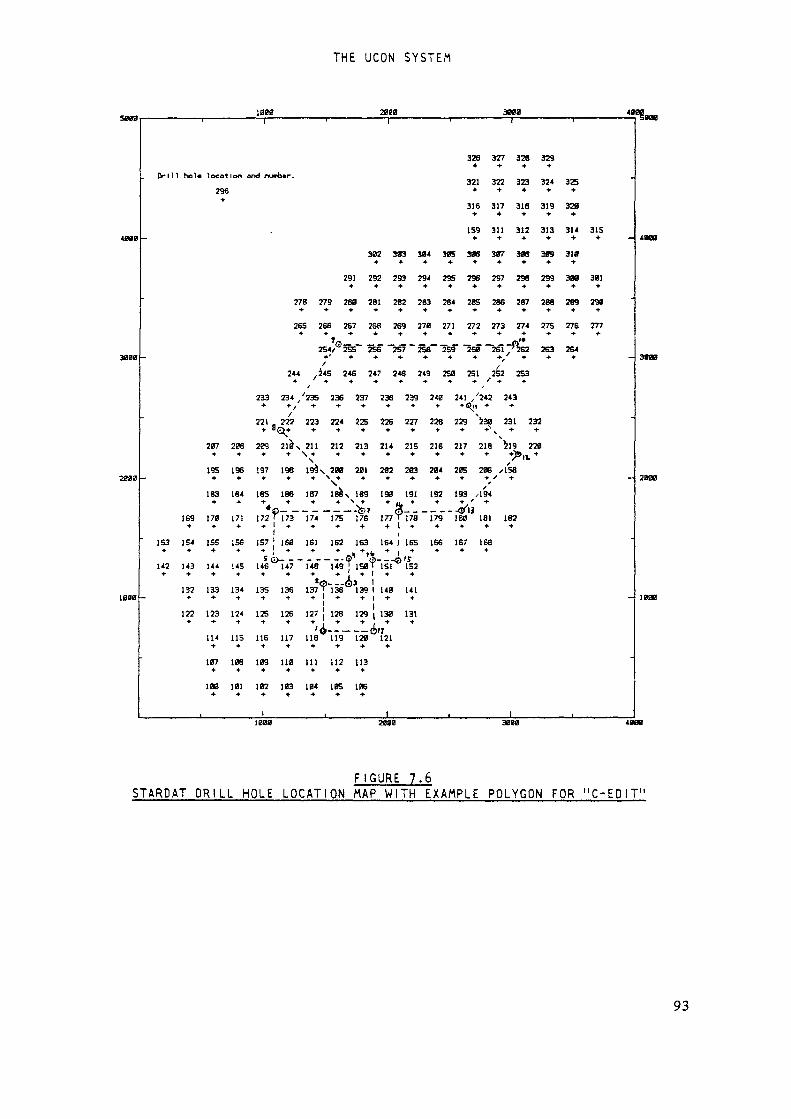
THE UCON SYSTEM
2M0 3000
326 327 328 329
296 + + + + +316 317 318 319 320+ * * + +159 311 312 313 314 31S
4OT0 - * * * * * *
302 303 304 305 306 307 308 309 310
291 292 293 294 295 296 297 298 299 300 381
278 279 280 281 282 283 284 285 286 287 288 289 29«
265 266 267 268 269 270 271 272 273 274 375 276 277f '•
2S4/3 2SS~ 256" ~2S7 ~ 2S8~ "25? "260" ~26Ï J^262 263 264* , * * * + * * , * * *
244 ,245 246 247 248 249 2S0 251 252 253/ r
233 234/235 236 237 238 239 240 241/245 243
/ \221 222 223 224 22S 226 227 228 229 230 231 232
207 208 209 210s 211 212 213 214 215 216 217 218 219 220
x , V
195 196 197 198 199s 200 201 202 203 204 205 206 tV-&
183 184 185 186 187 188s 189 190 191 192 193^,194
169 170 171 [72 '173 174 ITS 176 177 T77B ~ Î79~ 1819 18] 182
153 154 155 156 157 j 1S0 161 162 163 164 I 165 166 167 168
142 143 144 145 146 ^ ~ t~48~ ~149 j 150f "llf® 152
*©-_-<!)»132 133 134 135 136 137 ' 138 139 140 141
I122 123 124 125 126 127 | 128 129 130 131
114 115 116 117 118 119 120 121
107 108 109 110 111 112 113
100 101 102 103 104 105 106
I I3088
FIGURE 7.6STARDAT DRILL HOLE LOCATION MAP WITH EXAMPLE POLYGON FOR "C-EDIT"
93
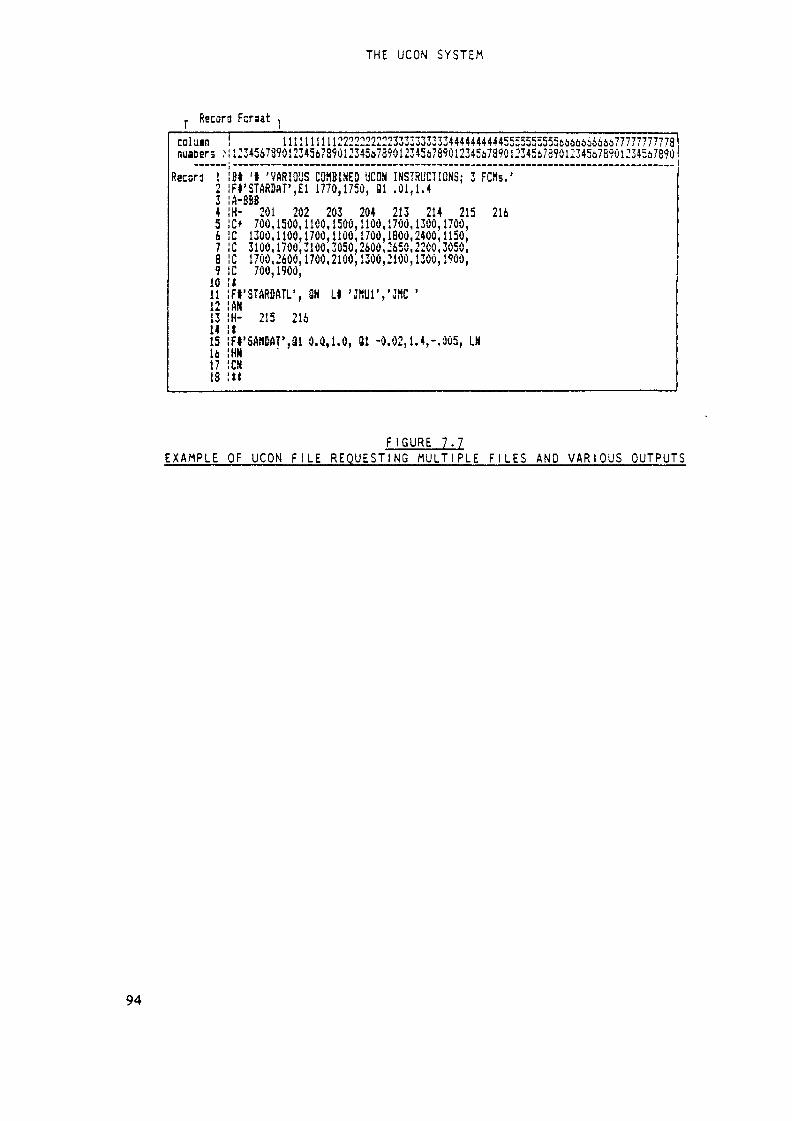
THE UCON SYSTEM
, Recora Ferait ,
calu«n ! i 11 ! i 111 i1222222222233333333334444444444555555555566ô6ià66iô77777777773nuaöers .M12345à789ûl23456789ôl23456789ûl2345ù789ûl2345i789ûi2345i789ûl2345o7S9ôl2345i789û
Record 1 IB*1 IB* 't 'VARIOUS COMBINED UCON INSTRUCTIONS; 3 FCSs.'2 !F*'STARDflT',£l 1770,1750, 31 .01,1.43 IA-B5 1C* 700,1500,1100,1500,1100,1700,1300,1700,4 !K- 201 202 203 204 213 214 215 2166 1C 1300,1100,1700,1100,1700,1800,2400,1150,7 1C 3100,1700,3100,3050,2600,2650,2200,3050,8 1C 1700,2600,1700,2100,1300,2100,1300,1900,9 1C 700,1900,10 :i11 IFt'STARBATL', 8N LI 'JHUiyJHC '12 !AN13 1H- 215 21614 it15 iFI'SAflDAT',81 0.4,1.0, 81 -0.02,1.4,-.005, LMla IHN17 ICH18 !»
F I G U R E 7 .7EXAMPLE OF UCON F I L E R E Q U E S T I N G MULTIPLE F I L E S AND V A R I O U S OUTPUTS
94
PROGRAM URDAT
8.0 PROBRAM URûff
8.1 GENERAL CONCEPTS AND OPERATIONS
URDAT is a "front-end" program designed to select and edit any combinationof data from the UDAT primary sample-assay files and:
1. Create listings (Section 8.3.1) and summaries (Section 8.3-2)of the selected data for review and evaluation purposes.2. Interpret gamma-Jog data (Section 8.4).
3- Create standardi2ed intermediate UDAT files which may be ac-cessed by any of the ore reserves programs (Section 8.5)•
8.1.1 Requ i rementsTo run program URDAT, it is only necessary that a UCON f i l e (Section 7-0) beavailable and that the data f i l e s requested in that UCON f i l e exist asprimary UDAT files If any of the latter contain data in the borehole log"A-E" format, then f i l e "RNGTBL" must also be available and it must containthe set(s) of range-scale values corresponding to the particular "A-E"code (s) in the data (see Sections 5-2.1.1 and 5-2.1.2).F i l e "RNGTBL" must be in the same working directory as the URDAT programexecute module ("URDAT.EXE"). If the UCON f i l e is on the default drive, itmust also be in the same directory as "URDAT.EXE".All other control information needed for URDAT is submitted interactivelyduring the URDAT RUN (Section 8.6).The data lis t i n g s and summaries are output to a "print-output" f i l e (Section8.2).
8.1.2 Importance of Reviewing Data
Once a certain familiarity has been gained with a particular computer-basedore reserve data and calculation system, there is a tendency for many usersto review the data at increasingly lower frequencies! They come to trustthe data i m p l i c i t y , simply because it seems so well organized, and also findit tedious to review sometimes seemingly overwhelming quantities oflistings. If large amounts of data are involved in an ore reservescalculation, the attitude may prevail that a few errors w i l l not influencethe results.Such a point-of-view can cause problems, especially when the ore reserveanalyst becomes more and more separated from the beginning of the datapreparation stream by borehole-log-analysi s specialists, automatic-d i g i t i z i n g systems, data-entry operators, computer experts, and others. Itis easy for difficult-to-detect errors to occur in data files. Just one or
95

PROGRAM URDAT
two small errors in basic borehole-log interpretation factors, for example,wreck havoc on a f i n a l reserves estimate.
Therefore, it is recommended that l i s t i n g s be made (and carefully reviewed)of all new or edited UDAT primary data f i l e s before creating intermediatef i l e s for use as input to the ore reserves programs.URDAT is designed to make data review as easy as possible. Listings may becondensed to use relatively l i t t l e space; sample assay values are flagged;and data summaries are available. A quick scan of the latter is warrantedevery time an intermediate data f i l e is created.There are other measures not in the scope of the URAD system at t h i s timewhich can be taken to m i n i m i z e data errors. These include quality controlof d i g i t i z i n g operations and u t i l i t y computer programs which flag variousparameters if they lie outside given value ranges.
8.2 THE PRINT-OUTPUT FILE
8.2.1 General URAO Usage of the Print-Output F i l eThe "print-output" ("p-o") f i l e , in all the URAD programs, is designated asthe f i l e on which formatted output from a program RUN w i l l be p'aced. Print-output includes detailed and summary results which are used for purposes ofanalysis. It also includes error or end-of-RUN messages, but not scratch orintermediate data f i l e s intended as input to other programs.The p-o f i l e may be a hard or floppy disk f i l e or the printer itself. Toavoid the creation of a large number of p-o f i l e s over an extended period,all URAO programs provide for use of a default p-o f i l e named "OUTPUT";however, any other f i l e name may be designated as the p-o f i l e for any givenRUN. All the URAD programs also provide the option of sending outputdirectly to the printer during program execution by assigning 'LPT1' as thep-o f i l e .A p-o f i l e is always created when a URAD program is run, regardless of thetype of RUN specified. Even if an output l i s t i n g is not requested, thedefault f i l e "OUTPUT" (or any other f i l e selected) w i l l be newly created andany previous information on the given f i l e w i l l be destroyed.When the p-o is placed on a disk f i l e , all the FORTRAN-generated printer-driver controls are preserved; if it is later desired to print such output,program FORPRINT (Section 8.2.3) may be used, and all the o r i g i n a l outputspecifications (pagination, l i n e spacing, etc.) w i l l s t i l l be in effect.Execution of the programs is much slower if printing is done "on-line", sothis feature provides the capa b i l i t y of making repeated "test" RUNS for agiven problem, sending the p-o to a disk f i l e , scanning the results eachtime, and then actually printing the output when satisfied with the results(or at a more convenient time, or even on a different computer system) .
8.2.1.1 Naming and Location of P-O filesThere is a maximum of 15 characters permitted for URAD f i l e names.Directory or subdirectory names are not recommended in naming p-o f i l e s ; any
96

PROGRAM URDAT
p-o f i l e created on the default drive w i l l be in the same directory as theURDAT program execute module. P-o f i l e s created on a Moppy disk should bein the latter's root directory.
If the p-o f i l e is not on the default drive, make sure the device name d:is included as part of the f i l e name; examples, "A:FILENAME" or"BtURDPOl.SAV".It is prudent to check the intended p-o f i l e before making any RUN to insurethat it does not contain information which should be saved. If it does,then rename the f i l e or copy it to another f i l e using standard DOS commands-- before making the RUN.
8.2.2 URAD Printing Protocol
URAO printer controls are compatible with the EPSOM FX Series, or with anyprinters which may set to emulate the EPSOM ("Standard P r i n t i n g Mode").Print-output l i s t i n g s may be generated for various combinations of paperpage size, l i n e spacing, and/or character size.
8.2.2.1 Vertical Print Control"Standard" p r i n t i n g paper page length (vertical) is considered by URAD to be11" (inches). However, any other length may be specified, to the nearest10th of an inch."Standard" l i n e spacing is 6 li n e s per inch (Ipi), or 66 lines per page(ipp) with ll"-inch paper page length. Optionally, 6, J, 8, or 9 'pi l i n espacing may be requested for any pr i n t output.
8.2.2.2 Horizontal Print Control"Standard" paper page width (horizontal, excluding the perforated strips) isconsidered to be 8.5"; however any width (5" minimum) may be optionallyspecified, to the nearest 10th of an inch.The "character width" here defines both the character size and horizontalspacing. Three character widths are available: "Standard Pica" -- 10 characters per inch (cpi); "Standard Elite" -- 12 cpi; and "Condensed Pica"17-2 cpi.
8.2.2.3 Test for Character Width Versus Page WidthThe lines in the various sections of URAD print-output are formatted toeither 80 (maximum) or )32 (maximum) columns. If the combination of pageand character width, established interactively, does not allow p r i n t i n g ofthe lines, at the maximum format width used by a program, without overlap(to the next line), a width adjustment is automatically attempted and amessage is displayed.For example, the URDAT program provides a special option for an 80- or 132-character per line format; if the paper width is 8.5" and the 132 cpi formatis chosen, the character width is automatically changed to 1 7 - 1 cpi.
97

PROGRAM URDAT
In those sections of the other URAD programs which are partly in the 132-column format mode, the character width is automatically condensed, if nec-essary, and then restored to the i n i t i a l conditions for the 80-columnsect ions.
8. 2. 2. 4 PaginationThe term "pagination", as used here, refers to the numbering of outputpages, entering headings at the top of each new page, and the structuringof output to fit w i t h i n each page; it is provided as an option in some ofthe programs. If pagination is not used then the output li n e s are simplyprinted consecutively without regard to pages and the f u l l number ofav a i l a b l e lines per page are used, except for a small margin at the top andbottom of each page.Under the "testing" option (example: Section 8.6.2.1) p r i n t i n g is allat 8 ]pi, 17-2 cpi (condensed), with no pagination, and no top or
donebottom
marg i nsWhen the pagination option is in effect, the maximum number of l i n e s perpage are determined as follows:
mlpp = ( Ipi * pi ) - Ipi where,mlpp = maximum number of lines per page (to nearest integer);Ipi = lines per inch (entered interactively);pi = page length in inches (entered interactively).
For example, with a paper length of 1) inches, there is a maximum of 60lines per page printed at 6 Ipi and 80 lines at 10 I p i . This provides am i n i m u m total top/bottom margin of approximately one inch. The marginplacement can be controlled when setting the position of the top of thef i r s t page with respect to the typewriter ribbon before a RUN is made.An interactive option is provided to over-ride the default number of linesper page, if desired; only a reduction of 1 pp is allowed.
8.2.2.5 Limiting Output LinesURAD programs provide the option of placing an approximate l i m i t to thetotal number of p-o lines in a RUN. This is useful for testing data, forexamining p-o layouts, or for avoiding output of an accidental or unwantedextremely large number of p-o lines due to unchecked errors in data or con-trols. If the number of output lines exceeds the l i m i t , the RUN is simplyterminated; all data processed to that point w i l l be available on the p-of i l e , but summaries w i l l not be available. If an intermediate data f i l e isbeing created when such a break occurs, the f i l e w i l l contain all sample setdata created up to the point of termination.
8.2.2.6 Limiting Sample Sets ProcessedThe programs also provide the option of placing a l i m i t to the number ofsample sets to be processed. Conditions are the same as for l i m i t i n g output1 i nes (above) .
98
PROGRAM URDAT
8.2.3 Program FORPRINT
Program FORPRINT is used to print any print-output (p-o) f i l e generated by aURAD program. When URAD l i s t i n g s are directed to a p-o f i l e other than'LPT1 1, the first output record is a print-control identification recordwhich contains the following:
1. Name of the URAD program which generated the output; recordcolumns (re) 2-6; ie. "URDAT", "ORSAC", "RESUV", or "SCOR_".2. Pagination code; re 9; 0 if output not paginated, 1 if pagi-nated.3. Format mode code; re 10; 1 if maximum number of characters per1 i n e is 80, 2 if 132.k. Character width code; 1 if 10 cpi, 2 if 12 cpi, or 3 if 1 7 - 1cpi .5- Paper length (vertical); re 11-15; length to nearest 10th ofi nch.If the p-o header record has been "disturbed", FORPRINT w i l ldisplay an appropriate message.
Note: All the printer-driver commands are included inthe output so that the f i l e may be later printed ex-actly as specified during the original RUN. If any ofthese commands are disturbed, the l i s t i n g may be gar-bled!
FORPRINT simply requests the name of the p-o f i l e to be printed and providesthe opportunity to check on paper si2e requirements before continuing.
8.2.3.1 Program RES7PRNIf any l i s t i n g of a URAD program is aborted before normal termination, program RESTPRN should be run to restore the printer.
8.3 URDAT PRINT-OUTPUT
8.3.1 Detailed Data Listings
The detailed data l i s t i n g s identify all the parameters for each selectedsample set in a form designed for easy review. If corrections forradiometric d i s e q u i l i b r i u m have been made, the applicable coefficients areshown. If sample editing has been carried out, the selected intervals arenoted, but the entire sample set is s t i l l listed. Lithologie are listed.The position, thickness, and grade of each sample interval are shown. Ref-erence positions are the bottom the sample intervals, denoted by depth(from collar) or by elevation, depending on the option chosen.
99

PROGRAM URDAT
Uranium grades are listed to the nearest thousandth of a percent, with cer-tain ranges of values marked as follows for quick identification:
0. 100 to 0.199 %U308
"**" 0.200 to 0.1+99 "
"$" 0.500 to 0.999 "
"$$" 1 .000 and over "
8.3.1.1 Format ModeURDAT provides the option of p r i n t i n g the detailed data l i s t i n g in an 80- or1 32-column-per-l i ne format. The latter allows more data to be printed oneach l i n e and is useful for saving paper space. This mode may be used at 10cpi or 12 cpi if the paper width is sufficient.
8.3.1.2 Examples of ListingsThe following examples ill u s t r a t e the various formats:
F i g u r e 8.1 is a l i s t i n g of a "uranium-only" sample set in the80- column mode, w i t h both ed i t i n g and d i s e q u i l i b r i u m correctionsappl i ed .Figure 8.2 shows the same set in the 132-column, condensed mode.Figure 8.3 lists a bimetal sample set in the 80-column mode.Note that the 132-column, condensed mode, used with 8.5-inchpaper w i l l save considerable space. The 132-column mode mayalso be used wi t h a character width of 10 cpi if 14 3/4-inchp r i n t i n g width is available.
S.}.!.} Page HeadersThe heading for each l i s t i n g contains the name of the primary UOAT f i l e fromwhich the data were obtained, the date of the RUN, the name of theuser/operator, the "block name" entered in the UCON f i l e , the names of theUCON and print-output f i l e s , and the name of the intermediate data f i l e , ifsuch has been created. If no pagination is requested, the heading w i l lonly appear each time a new primary UDAT f i l e is accessed. If paginationis in effect, a heading w i l l appear at the beginning of each new page.
8.3.2 Data SummariesAt the end of each URDAT run, a summary review of all sample sets processedis always listed. The summary consists of two parts as described below.For each part, the number of sample sets processed in each of the definedcategories is provided, and there is also an option to l i s t the actual sam-ple numbers of all sets in each category. The latter option is termed a"detailed" summary. Data summaries use the 80-column format.
100
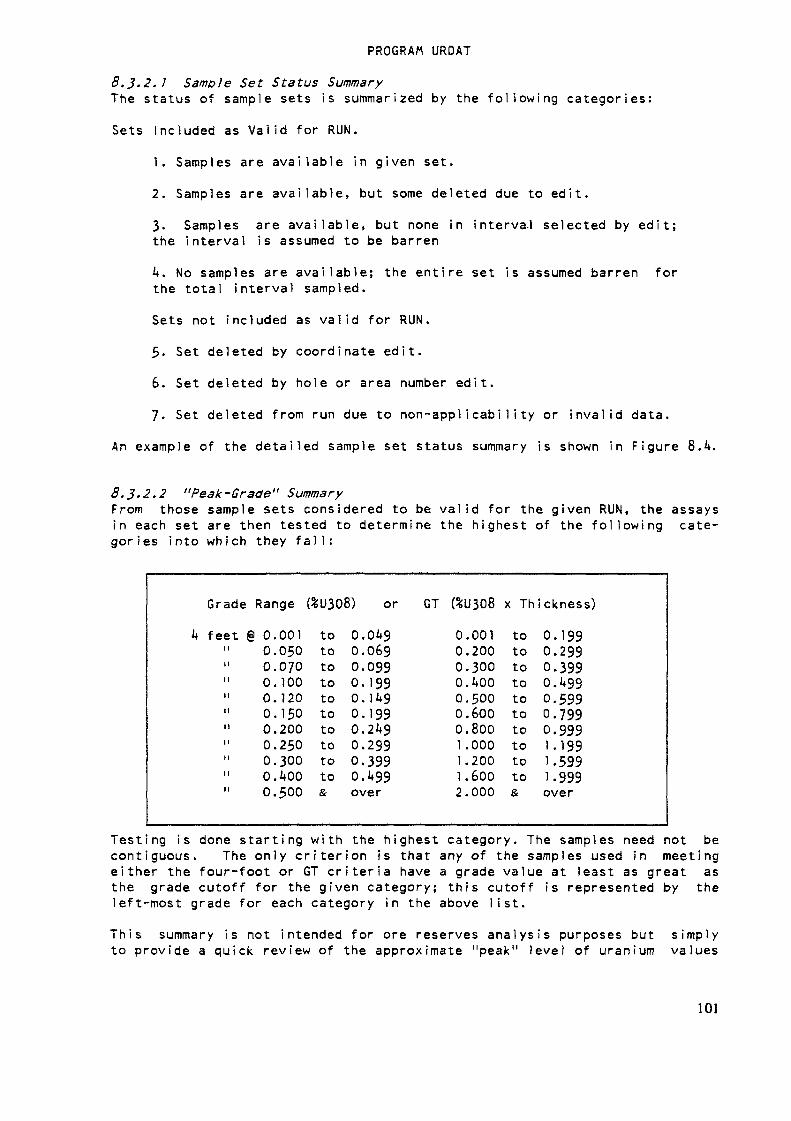
PROGRAM URDAT
8.3.2.1 Sample Set Status SummaryThe status of sample sets is summarized by the following categories:Sets Included as Va l i d for RUN.
1. Samples are available in given set.2. Samples are available, but some deleted due to edit.3. Samples are available, but none in interva.l selected by edit;the interval is assumed to be barren4. No samples are available; the entire set is assumed barren forthe total interval sampled.Sets not included as valid for RUN.5. Set deleted by coordinate edit.6. Set deleted by hole or area number edit.7. Set deleted from run due to non-applicability or invalid data.
An example of the detailed sample set status summary is shown in Figure 8.1».
8.3.2.2 "Peak-Grade" SummaryFrom those sample sets considered to be valid for the given RUN, the assaysin each set are then tested to determine the highest of the following cate-gories into which they fall:
Grade Range (%U308) orU feetu
iinnnitn1 1nn
g 0.0010.0500.0700.1000.1200.1500.2000.2500.3000.4000.500
totototototototototo&
0.0490.0690.0990.1990.1490.1990.2490.2990.3990.499over
GT (%U3080.0010.2000.3000.4000.5000.6000.8001 .0001.2001.6002.000
x Thtotototototototototo&
ickness)
0.1990.2990.3990.4990.5990.7990.9991.1991.5991.999over
Testing is done starting with the highest category. The samples need not becontiguous. The only criterion is that any of the samples used in meetingeither the four-foot or GT criteria have a grade value at least as great asthe grade cutoff for the given category; this cutoff is represented by theleft-most grade for each category in the above l i s t .This summary is not intended for ore reserves analysis purposes but simplyto provide a quick review of the approximate "peak" level of uranium values
101
PROGRAM URDATin the sets of data processed in a given URDAT RUN.example of the "peak-grade" summary.
Figure 8.5 gives an
8.3.2.3 Example of Uranium "Intensity" PlotIf appropriate plotting equipment and software are available, the results ofthe peak-grade summaries may be used to create plots which provide apreliminary overview of the "insensity" of uranium mineralizationrepresented by a set of basic data. Figure 8.6 shows the d r i l l holelocation plot of the f i l e "STARDAT" data, with each hole location symbolreflecting the peak-grade of the given sample set. (The grade categorieshave been combined into wider ranges.)
8.4 GAMMA-LOG INTERPRETATIONS
During a URDAT RUN, all sample data in the "borehole log" format (Section6.3) are converted to estimated uranium values using the GAMLOG iterativeinterpretation technique. Data in the "xxQ" format are exempted, since theyrepresent already interpreted values.
Calculation of Sample Interval DepthsThe protocol for measuring the depths of readings of representative radio-activity during the "production" logging of boreholes is usually to i n i t i -ate such readings at positions which represent even divisions of thegiven measurement system. One-foot readings are theoretically positioned ateven increments of one foot in depth (from the collar), for example, depthsof, say, 10, 11, - - 20 feet, rather than 10.35. 11-35, - - 12.35 feet.S i m i l a r l y , one-half foot readings are positioned at even foot andhalf-foot increments of depth. This method is also used for conveniencewhen d i g i t i z i n g from borehole "strip" log charts.In most techniques for interpreting gamma-log data, it is assumed that anygiven measurement (or "reading") of radioactivity taken in a borehole isactually at the midpoint of the interval which it represents. Therefore, ifreadings have been taken at one-half-foot intervals, and a reading at adepth of, say, 100 feet is ultimately converted to an estimated uraniumvalue by some interpretive method, the interval represented by that esti-mated uranium value is actually between 99-5 and 100.5 feet in depth.For a sample set in the "borehole" format, the "depth-to-first-reading" ("d-t-f-r") is considered by URDAT to be the depth to the position of the inter-val represented by the first reading, but the depth to the top of the firstsample interval generated at that point is recognized to be the d-t-f-rminus one-half of the applicable readout interval.Therefore, if the readout interval is 1 foot, the top depth of the firstsample interval is calculated to be one-half foot less than the d-t-f-r. Ifthe d-t-f-r is entered as zero, then the subtraction does not take place,and the depth to top of the first sample interval is calculated also aszero.
102
PROGRAM URDATIf the readout interval is one-half foot, however, no subtraction is evermade, the top depth of the first sample interval is the same as the d-t-f-r,and all sample intervals are assigned depths which are 3 inches lower thanthey theoretically should be. This is done to avoid having to record depthsto the nearest hundredth of a foot, and, in practice, it does not appearthat the depths can really be measured to that degree of accuracy under mostlogging conditions, except for relatively "shallow" holes.The thickness of any "skipped" intervals (Section x.x) is reduced by a quan-tity equal to the readout interval, again, since each cps or inch-deflection"reading" is assumed to represent the "mid-point" of its representive thick-ness, i.e. the value of the readout interval. For example, if (precedingdownward) the last reading preceding a skipped interval of 10 feet is at 900feet in depth, and the first interval following the "skip" is at 910 feet,then (assuming the readout interval at 0.5 feet) the actual "skip" mustbe represented by only 9-5 feet since the bottom of the interval representedby the upper reading is actually assumed at 900.25 feet in depth, and thatof the lower reading at 909-75 feet.
8.5 INTERMEDIATE UDAT PILES
8.5-1 Usage of the Intermediate UDAT Fi l e sOne of the primary functions of the URDAT program is to create standardizeddata f i l e s from the mix of various formats which comprise the primary datafiles. Then any program which requires the sample set data need only have asimple input routine to read them in. The standardized f i l e s created byURDAT are termed "intermediate" UDAT files and are in sequential binarymode.Naming and location of the intermediate files follows the same protocol asdescribed for the p-o files (see Section 2.8.1.1). There is no default namefor intermediate files and the printer (LPT1) must not be used. It is recommended that the extensions "B" or "BIN" be used with intermediate f i l enames; examples: "FILENAME.B" or A:F ILENAME.BIN".
8.5.2 Description of the Intermediate F i l e sThe intermediate files are described in detail in the event that they may beuseful as input to other programs besides those in URAD.AH records are in binary mode.
8.Ç.2.1 File Identification RecordThe first record of any intermediate UDAT f i l e is always an 80-characteridentification record containing the "block name" which was entered in theblock identifier record (Sections 7-3 & 7-M of the UCON f i l e used in gener-ating the given intermediate file. All other records contain sample setdata. Comment records ("C" in column 1) in the source primary UDAT f i l e sare not placed on the intermediate files.
103
PROGRAM URDAT8.S.2.2 Sample Set Header RecordEach sample set is represented by a "header" record. If there are any sam-ple data for the sample set, the header record is followed by a "sample"record. If there are lit h o l o g i e data, the sample record is followed by a"lithologie" record; if there is no sample record, the l i t h o l o g i e recordimmediately follows the header record.All header records are of the same length. Sample and l i t h o l o g i e recordsare of variable length.In the following description of the record variables, "I" is integer, "R" isreal, and "Ch" is character. The number following the "*" is the number ofbytes. The abbreviation in quotes is that displayed when the sample setdata from an intermediate f i l e is output during execution of one of the orereserves programs (Section 8.5-3)-The header record contains:"C13"; Ch*l; sample-type code in column 13 of origina! header record."CIV; 1*2; sample-type code in column Ht of o r i g i n a l header record."NDAT";I*2; basic data type: 1 = contiguous format, U only; 2 = non-
contiguous format (U-only); 3 = borehole-log format; k = contiguousformat, U and V.
"IQC"; 1*2; code defining o r i g i n a l d i s e q u i l i b r i u m status of U assays(see F igure 5-1 :if non-borehole format and NDAT=1, or 2, then IQC is:
1 — if not subject to d i s e q u i l i b r i u m correction;2 — if subject to correction;
if non-borehole format and NDAT=^, then iCQ is:3 — if not subject to d i s e q u i l i b r i u m correction;k — if subject to correction;
if borehole format, NDAT=3, then ICQ is:1 — if format type (column 15) was "C";2 — if format type was "U"3 — if format type was "Z"4 — if format type was "I
(types "C","U","Z",,and "I" are always subject to correction)5 — if format type was "Q", not subject to correction;6> -- if format type was "Q", subject to correction;
if the code is not applicable, ICQ = 7-"IDQ"; 1*2; code defining current status of "correctable" data:
0 — if diseq. correction has not been applied in URDAT;1 -- if diseq. correction has already been applied in URDAT,
or data not subject to disequiIbriurn correction."A#"; Ch*3; area number (columns k-6 of or i g i n a l header)."H#"; CH*6; hole (sample set) number (columns 7~12 of header) ."P#"; Ch*7; property code (columns 73~79 of header)."MC"; RM; north coordinate."EC"; RM; east coordinate."EL"; RM; original collar elevation."PE"; RM; elevation at pit bottom; a "-9999." indicates no depth to
pit bottom was entered in original data."DPO"; RM; original depth to first sample interval; 0 if no samples."DSM"; RM; depth sampled (from original collar)."WTB"; RM; depth to oxid./non-oxid, contact (from o r i g i n a l collar)."IC2"; 1*2; élévation/lithologie edit status code ("control zone" is
104
PROGRAM URDATthat defined by upper and lower edit elevation limits):if 1, data not edi ted.if 2, data edited; sample set barren; control zone assumed barren.if 3» data edited; samples available, but some have been deleted.
k, w i l l not occur; sample set has already been deleted,if 5. data edited; samples available, but control zone is barren.
6, w i l l not occur; sample set has already been deleted,if 7. data edited; samples available, and none deleted.
"El"; RM; if edited, new elevation at top of total sample interval;if not, same as "EL".
"E2"; RM; if edited, new elev. at bottom of total sample interval;if not, elevation represented by "DSM".
"DPC"; RM; if edited, new depth to 1st sample interval — from "El";if not, same as "DPO".
"NA"; 1*2; number of sample intervals in set; 0 if none. If NA is setto a negative value, the grade variables are IM instead of1*2. This only occurs when at least one uranium grade exceedsa value of 32%U308.
"NL"; 1*2; number of lithologie units in sample set; 0 if none.
8.^.2.3 Sample Set Sample RecordThe sample record w i l l be present if "NA" (above) is non-zero; it contains"NA" number of sample intervals. If "NDAT"=1,2, or 3. each interval consists of thickness (RM) and grade %U308 x 1000 (1*2). If "NDAT" = k, eachinterval consists of thickness (RM) , grade %V205 x 100 (1*2), and grade%U308 x 1000 (1*2). In order to save space in the intermediate data files,the uranium and vanadium grades are converted, in program URDAT, toINTEGER*2 by multiplying by 1000 and 100 respectively to preserve the original precision. The integer values are rounded to the nearest whole number(using the intrinsic function NINT).A uranium-only sample record has the form:
(T(1),IA(1)), (T(2),IA(2)), --- (T (NA) , I A (NA) ) where,T(l) and IA(1) are the thickness and integer representative of the Ugrade, respectively, of the first sample interval, etc.
A uranium & vanadium sample record has the form:(T(1),IV(1),IA(1)), (T(2),IV(2),IA(2)), - - - (T (NA) , I V (NA) , I A (NA) )where, IV(1) is the integer representative of the V grade of the 1stsample interval, etc; T and IA are as above.
If the value of any uranium grade in the sample set exceeds 32%U308, the U-grade variables are stored on the intermediate files as IM and the value ofNA is set to negative. Any input routine which processes the intermediatedata files must have two arrays to handle the integer representations of theuranium grades -- one an 1*2 array and the other an IM array. The sign of"NA" must be checked and the uranium assays i n i t i a l l y read into the appropriate 1*2 array (if NA is positive) or the l M array (if NA is negative).This requires alternate read statements. Either array of integers may thenbe reconverted to REAL by setting NA=abs (NA) and carrying out:
105

PROGRAM URDAT
A(i) = float(IA(i)) / 1000. where,A = the array of grades reconverted toI A = the 1*2 or I *4 array into which the U grades are read;i = the element number of the grade arrays, for i = 1 to NA.
V-values are simply handled by reading them into an INTEGER*2 array andcarrying out:
V(i) = float (IV(i))/100. where,V * the array of grades reconverted to R*k;IV = the 1*2 array into which the V grades are readi = same as above.
3.$.2.4 Sample Set Lithologie RecordThe lithologie record w i l l be present if "NL" is non-zero, and has the form:
((UNO) ,DU(1)) , (UN (2), DU (2)), --- (UN (NL) , DU (ML) ) where,
UN(l) (Ch*4) is the code for the 1st (topmost) l i t h o l o g i e unit andOU(1) (R*4) is the depth to the top of the 1st unit from the o r i g i n a lcollar elevation (see Section 6.2).
8.5.3 "Dumping" of the Intermediate Data Fi l e sPrograms RESUV, ORSAC, and SCOR each provide the option to l i s t a briefsummary of the sample set data from the intermediate UDAT files which theyare processing during a given RUN. This is primarily useful for examiningthe data during test runs. The header data is referenced by the abbreviations listed in Section 8.5. The sample data are simply shown by a sequent i a l l i s t i n g of the thickness, and grade of each sample interval as shown inF igure 1 1 .1 .It is not recommended that the above option be taken with long productionruns since it requires a great deal of printing, and the primary data f i l eshould have been printed at least once when processing with URDAT. If it istaken, the resulting l i s t i n g w i l l be non-paginated.
8.6 URDAT INTERACTIVE ENTRIES
The URDAT interactive entries and various options are described below in theapproximate order in which they occur during program execution. The "minor"(U-number) paragraph headings below refer to the prompts which appear on theconsole monitor. Many of the entries and options are also used in programsRESUV, ORSAC, and SCOR.See Section 10 for general interactive-entry procedures.
106
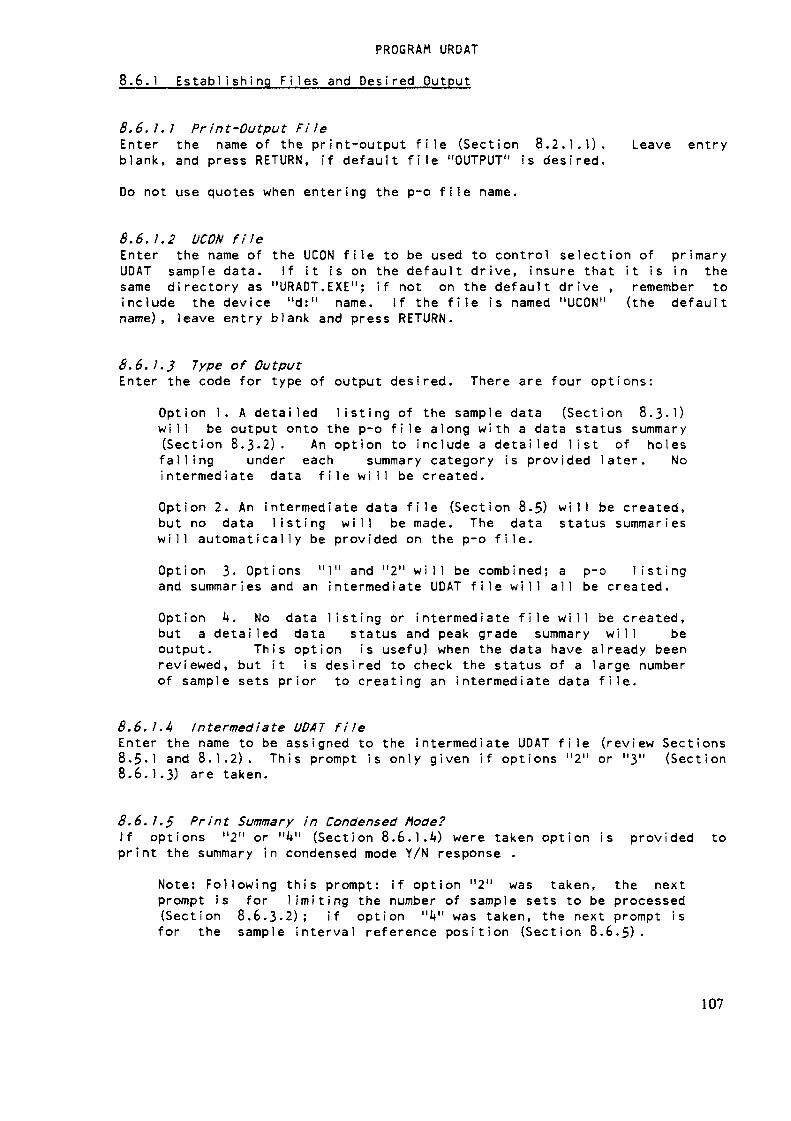
PROGRAM URDAT
8.6.1 Establishing F i l e s and Desired Output
8.6.1.1 Print-Output FileEnter the name of the print-output f i l e (Section 8.2.1.1). Leave entryblank, and press RETURN, if default f i l e "OUTPUT" is desired.Do not use quotes when entering the p-o f i l e name.
8.6.1.2 UCON fileEnter the name of the UCON f i l e to be used to control selection of primaryUDAT sample data. If it is on the default drive, insure that it is in thesame directory as "URADT.EXE"; if not on the default drive , remember toinclude the device "d:" name. If the f i l e is named "UCON" (the defaultname), leave entry blank and press RETURN.
8.6.1.3 Type of OutputEnter the code for type of output desired. There are four options:
Option 1. A detailed l i s t i n g of the sample data (Section 8.3-1)w i l l be output onto the p-o f i l e along with a data status summary(Section 8.3-2). An option to include a detailed l i s t of holesf a l l i n g under each summary category is provided later. Nointermediate data f i l e w i l l be created.Option 2. An intermediate data f i l e (Section 8-5) w i l l be created,but no data l i s t i n g w i l l be made. The data status summariesw i l l automatically be provided on the p-o file.Option 3- Options "1" and "2" w i l l be combined; a p-o l i s t i n gand summaries and an intermediate UDAT f i l e w i l l all be created.Option 4. No data l i s t i n g or intermediate f i l e w i l l be created,but a detailed data status and peak grade summary w i l l beoutput. This option is usefu.1 when the data have already beenreviewed, but it is desired to check the status of a large numberof sample sets prior to creating an intermediate data f i l e .
8.6.1.4 Intermediate UDAT fileEnter the name to be assigned to the intermediate UDAT f i l e (review Sections8-5-1 and 8.1.2). This prompt is only given if options "2" or "3" (Section8.6.1.3) are taken.
8.6.1.^ Print Summary in Condensed Mode?If options "2" or "V (Section 8.6.1.4) were taken option is provided toprint the summary in condensed mode Y/N response .
Note: Following this prompt: if option "2" was taken, the nextprompt is for l i m i t i n g the number of sample sets to be processed(Section 8.6.3-2); if option "V was taken, the next prompt isfor the sample interval reference position (Section 8.6.5).
107

PROGRAM URDAT8.6.2 Print Controls for Data ListingIf options "1" or "3" (Sect!on8.6.1.3) were taken, then there is a series ofoptions available for establishing the form of the detailed data l i s t i n g .
8.6.2.1 Detailed Print-Output Control or "Test" Mode?Enter Y to specify the print output in detail; enter N for a simple non-paginated, non-margin, condensed l i s t i n g (Section 8.2.2.4). The latter isuseful for saving paper when a more structured li s t i n g is not needed. Whenthe N option is taken, the next prompt is for l i m i t i n g the number of linesto be printed (Section 8.6.3-0.
8.6.2.2 Pagination Requested?Enter Y (yes) or N (no) to request for pagination (Section 8.2.2.4).
8.6.2.3 Paper Page Length & Line Spacing: "Standard" or Other?Enter "1" for paper page length (vertical) of 11 inches and spacing oflines per inch; enter "2" to specify optional length and l i n e spacing.option 1 is taken, the next prompt is for paper width (Section 8.6.2.6).
6If
8.6.2. k Specify Actual Page LengthThis prompt is given if option 2, Section 8.6.2.4, was taken.
Enter, to the nearest 10th of an inch, the actual length (vertical, Section8.2.2.1) of the pages of printing paper to be used. If value is a wholenumber, the decimal point is not required. Make sure the length is accu-rately measured.
8.6.2.5 Line Spacing?Enter "6", "7", "8", or "9" lines perinch; "7" actually results in 7-2 I p i .
8.6.2.6 Paper Page Width?This entry refers to the actual width (horizontal, Section 8.2.2.2) of thepages of printing paper to be used. Enter "1" (or blank) if 8.5"; enter "2"if 14 3/4" or greater; enter "3" if page width is other than these. Ifoptions 1 or 2 are taken, the next prompt w i l l be for character width (Sec-tion 8.6.2.8).
8.6.2.7 Specify Actual Page UidthThis prompt is given if option 3. Section 8.6.2.6, was taken.Enter, to the nearest 10th of an inch, the actual width (horizontal, Section8.2.2.2) of the pages of printing paper to be used. if value is a wholenumber, the decimal point is not required. Make sure the width is accu-rately measured.
108
PROGRAM URDAT
8.6.2.8 Specify Print UidthThis entry specifies the character width and size in characters per inch(cpi, horizontal) as described in Section 8.2.2.2.Enter "1" (or blank) for 10 cpi; "2" for 12 cpi; or "3" for 17-1 cpi.
8.6.2.? Format Mode?Enter "1" for listing format designed for maximum of 80 columns per line;enter "2" for maximum of 132 columns per l i n e (Section 8.3.1.1).
8.6.2. 10 Option to Continue, Reset Print Controls, or AbortOnce the page width, character width, and format mode have been set, a testis made to determine if page width is sufficient to contain the print lines,as described in Section 8.2.2.3- If the character width must be adjusted tomeet the specified page width, a prompt is given for 3 options.Enter "Y" to continue RUN with revised character width; enter "N" to restartthe whole print control sequence; enter "*" to abort program.If the paper width is insufficient to contain the lines, even in the condensed-width mode, the RUN w i l l terminate. Wider paper w i l l be required.
8.6.2.11 Option to Reduce Number of Lines Per PageIf the pagination option (Section 8.6.2.2) has been selected, the option isprovided here to reduce number of lines per page as explained in Section8.2.2. . Enter "Y" if a reduction is desired; "N" if not.
8.6.2.12 Lines Per PageIf the Y option was taken in Section 8.6.2.11, the prompt is given to enterthe number of lines per page desired.
8.6.3 L i m i t i n g Output Listing
8.6.3.1 Limit Number of Output Lines?Enter "Y" to l i m i t output lines (Section 8.2.2.5); next prompt w i l l be fornumber of lines. Enter "N" if no l i m i t desired.
8.6.3.2 Limit Number of Sample Sets Processed?Enter "Y" to l i m i t sample sets processed (Section 8.2.2.6); next prompt wi1be for number of sets. Enter "N" if no l i m i t desired.
8.6.1» Sample Data Status and "Peak Grade" SummariesSee Section 8.3-2 for description of the data summaries. The summaries arealways printed, unless a RUN is cut short because of output l i m i t s . Thefollowing options relate to whether or not a complete (or "detailed") l i s ting is desired of all sample sets included in each summary category. Tensample set numbers are printed in an output line.
109
PROGRAM URDAT8. 6.4.1 Detailed Summary Listings?Enter: "1" (or leave blank) for no detail ( l i s t i n g of sample set numbers);"2" for detail on sample set status only (Section 8.3.2.1); "3" for detailon peak grade summary only (Section 8.3.2.2); "4" for options 2 and 3 com-bined.
8.6.5 Method of Referencing Sample Set PositionIn the sample set data listings (Section 8.3-1). each sample interval isreferenced by the position at the "bottom" of the interval, i.e. the end ofthe interval furthest from the collar. This position may be referencedeither as an elevation or by depth from the collar.
8.6,5.1 Sample Interval Position Reference?Enter "1" (or blank) for reference by depths, "2" for elevations.
8.6.6 Header InformationThe following entries are used for identification purposes and are enteredon page headings, but program execution w i l l not be affected if they areleft blank.
8.6.6.1 Name of RUN Submit torEnter the name of the person making the RUN. There cannot be more than 20characters, including blanks.
8.6.6.2 DateEnter the date of the run. There cannot be more than 8 characters, includ-ing blanks; any characters are permissible.
110
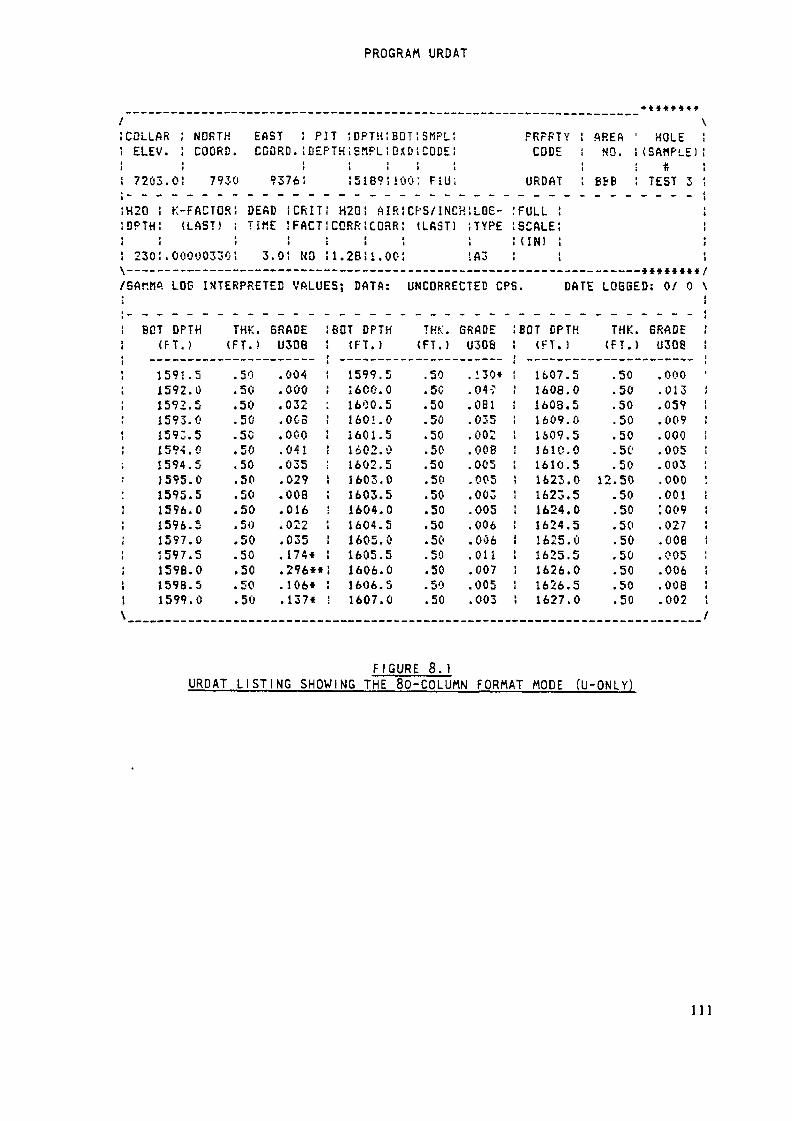
PROGRAM URDAT
'COLLARELEV.7203.
H2Q !DPTH:i
230!.V _ _ _ _ _ _
! NORTH! COORD1
0! 793
K-FACTOR(LAST)
00000330
*
0
I
t11
EASTCCQRD
; PIT ; DPTH; EOT;. ! DEPTH ;SttPL!0.<£'
t9376!
DEAD !TIKE !
!3.0!
CftITFACTNO
< i1 (! 5189! 100
111|
SMPLCODE
FiU
14
1t
J H2G! HlftiCF-'S/lNCHïLOe-ÎCORR1CORR!» ( lI 1 1
ll.2Bil.Oei
(LAST) ITYPEiI A3
PRFPTY 1 AREA ' HOLECODE ! NO. (SAMPLE)
! *URDAT ! B*B TEST
IFULL! SCALE! (IN)!
3
ttHA LOG INTERPRETED VALUES; DATA: UNCORRECTEB CPS. DATE LOBBED: O/ O \
BOT DPTH<FT.)
1591.51592.01592.51593.01593.51594.01594.53595.01595.51596.01596.51597.01597.51598.0159B.51599.0
\
THK.<FT.)
.50
.50
.50
.50
.50
.50
.50
.50
.50
.50
.50
.50
.50
.50
.50
.50
GRADEU30B.004.000.032.003.000.041.035.029.008.016.022.035.174*.296**. 1 06*.137«
BOT DPTH(FT.)1599.516CO.O1600.51601.01601.5lc.02.01602.53603.01603.51604.01604.51605.01605.51606.01606.51607.0
THK.<FT.)
.50
. 50
.50
.5u
.50
.50
.50
.50
.50
.50
.50
.50
.50
.50
.50
.50
GRADEU308.130*.04-7.061.035.002.008.005.005.003.005.006.006.011.007.005.003
BOT DPTH«FT. !
1607.51606.01608.51609.01609. 51610.01610.51623.01623.51624.01624.51625. Û1625.51626.01626.51627.0
THK.(FT.).50.50.50.50.50.50.50
12.50.50.50.50.50.50.50.50.50
GRADEU3Q8.000.013.059.009.000.005.003.000.001:oo9.027.008.005.006.006.002
/
FIGURE 8.1URDAT L I S T I N G SHOWING THE 8Q-COLÜMN FORMAT MODE (U-QNLY)
111
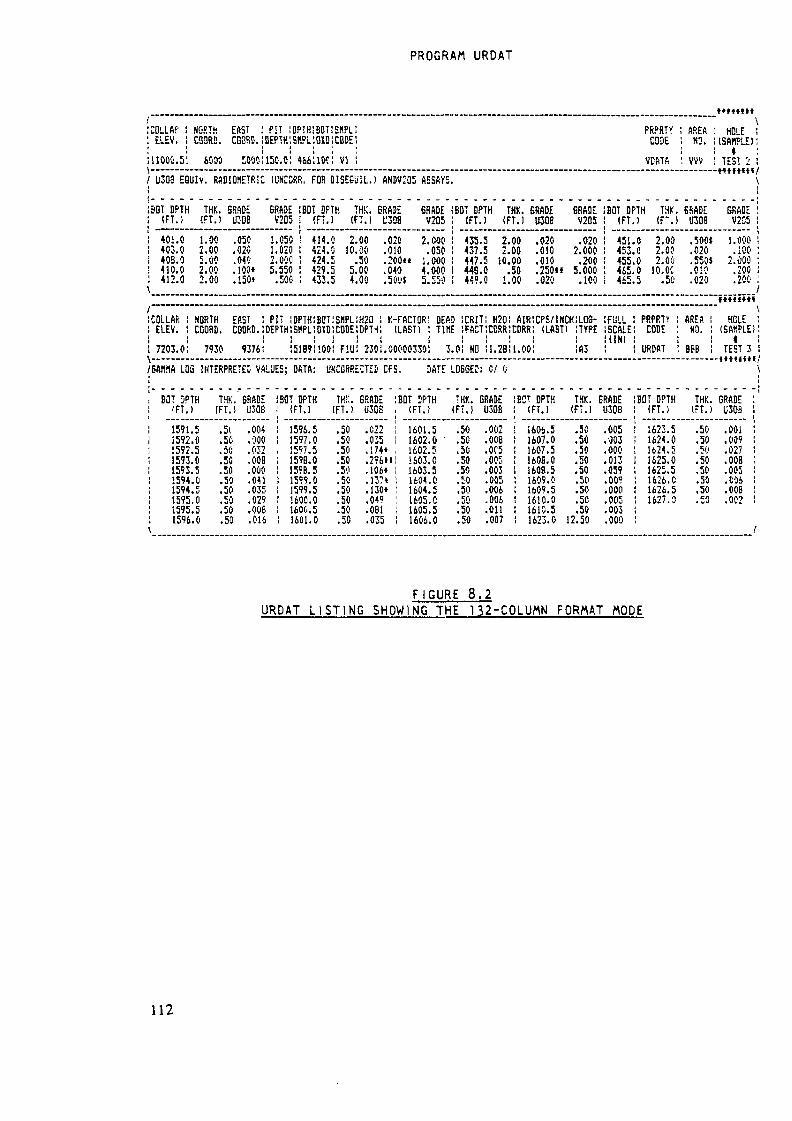
PROGRAM URDAT
COLLA? SGRTh EAST ! PIT !OP!H!BOT!EflPL!ELEV . CÜ3RD . CQBRD . 1 DEPTH j SC.PL | BIB ! CODE ',
11000.5 6030 ÎOOCÎ150.0! 466!10ci VI !
PRPRTYCODE
VDATA
AREA !NO.
VVV
\HOLE
(SfffiPLE)t
TEST 2U3D3 EQU1V. RADIOKETRIC IUNCCÜR. FOR DISESUiL. ) ANBV205 ASSAYS.
SOI DPTH(FT.:-401.0403.0403.0410.0412.0
\
THK. SRADE 5RP.3E BOT DPTh THK. BRADE 6RADE(FT.) ii:-OB V205 (FT.) (FT.I L'308 V2051.00 .050 1.050 414.0 2.00 .020 2.0002.00 .020 1,020 424.0 10.00 .010 .0505. 00 .040 2.0ÛO 424.5 .50 .200«« 1.0002.00 .100* 5.550 429.5 5.00 .040 4.0002.00 .150* .500 433.5 4.00 .50«$ 5.550
BOT DPTH THK. 6RADE(FT.) (FT.) U30B
435437447449449
.5 2.00 .020
.5 2.00 .010
.5 10.00 .010
.0 .50 .250*»
.0 1.00 .020
BRADEV205
.0202.000
.2005.000
.100
COLLARELEV.
7203.0
6AMA LOG
NORTH EftST ! PIT ! DPTH ! BOT :SltPl!H20 ! K-FACTQR! DEAD 1CRIT! H20! AIR!CPS/INCH!LOS-COORD. CODRD.iBEPrHiSHPLiOWICOKiDPT'i: (LAST) ! TIME JFACTICDRRJCDRR! (LftSTl [TYPE
7930 9376! !51B9!!00! Fill! 2301.00000330! 3.0! NO il. 28!!. 00! !A3
INTERPRET
BUT 3PTH THK.'FT.) (FT.)
1591.1592.1592.1593.1593.1594.1594.1595.1595.1596.
\
5 .510 .505 .500 .505 .500 .505 .500 .505 .500 .50
EC VALUES; DATA; INCORRECTES CFS. DATE
GRACE BflT DPTH THK. SRABEU308 (FT.) (FT.! U308
.004 1596.5 .50 .022
.000 1597.0 .50 .035
.032 1597.5 .50 .174«
.OOB 159B.O .50 .296»
.000 159B.5 .50 .106«
.04! 1599.0 .50 .13?«
.035 1599.5 .50 .130«
.029 1600.0 .50 .049
.008 1600.5 .50 .08!
.016 I tO l .O .50 .035
BOT ÎPTH(FT.)
1601.51602.0 -1602.51603.01603.51604.01604.51605.01605.51606.0
LOGGED
THK.( F T . )
.50
.50
.50
.50
.50
.50,50.50.50.50
: C/ 0
GRADEÜ3QB
.002
.008
.OC5
.005
.003
.005
.006
.006
.011
.007
BCT DPTH(FT. )
1606.51607.01607.5160B.O160B.51609.01609.51610.01610.51623.0
BOT DPTH W.(FT.) (FM
451.453.455.465.465.
FÜLLSCALE(IN)
THK. GRADE(Fi . ) U30B
.50 .005
.50 .003
.50 .000
.50 .013
.50 .059
.50 .00?
.50 .000
.50 .005
.50 .00312.50 .000
0 2.000 2.000 2.000 10. OC5 .50
PRPRTVCODE
URDAT
BOT OPTH(FT.)
1623.51624.01624.51625.01625.51626.C1626.51627. D
GRADEU30B
.500«
.020
.550*
.010
.020
AREANO.
BBB
THK.(FT. )
.50
.50
.5«
.50
.50
.50
.50
.50
GRADEV205
1.000.100
2.000.200.200
it*«t«t«\
HOLEISAtlPLE)
4TEST I
-<««ii<«<
GRADEU30B
.001
.009
.027
.OOB
.005
.006
.OOB
.002
FIGURE 8.2URDAT LISTING SHOWING THE 132-COLUMN FORMAT HOPE
112
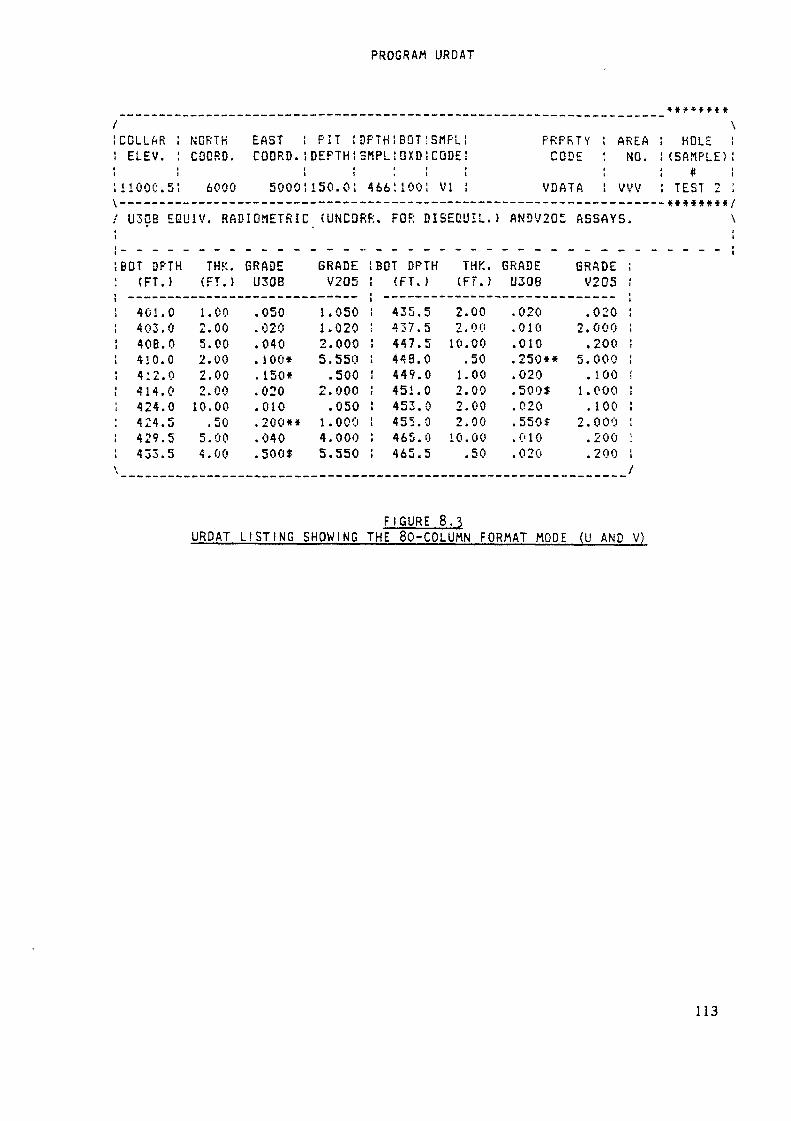
PROGRAM URDAT
<#**»»•**COLLARELEV.
1100C.5
NORTHCOORD.6000
EAST !COORD. !
1
5000!U30B EQU1V. RADIOMETRIC
BOT DPTH(FT.)
401.0403.040B.O410.0412.0414.0424.0424.5429.5433.5
THK.(FT.)1.002.005.002.002.002.0010.00.50
5.004.00
GRADEU30B.050.020.040. 100*.150*.020.010. 200**.040.500*
PIT i DPTH: BOT ISMPL!DEPTH !SMPL!QXD! CODE!
1 I I I1 i l l150.0! 466Î100! VI !
(UNCORR. FOR DISEQUIL.)
GRADE !BOT DPTHV205 !1.050 !1.020 !2.000 !5.550 !.500 !
2.000 !.050 :1.000 !4.000 !5.550 !
(FT.)435.5437.5447.5443.0449.0451.0453.0455.0465.0465.5
THK.(FT.)2.002.0010.00.501.002.002.002.0010.00.50
PRPRTY ! AREA HOLECODE : NO. (SAMPLE)
! *VDATA ! VVV TEST 2
ANDV2QE
GRADEU308.020.010.010.250«*.020.500$.020.550$.010.020
ASSAYS.
GRADEV205.0202.000.200
5.000. 1001.000. 100
2.000.200.200
f
FIGURE 8.3URDAT LISTING SHOWING THE 80-COLUMN FORMAT MODE (U AND V)
113
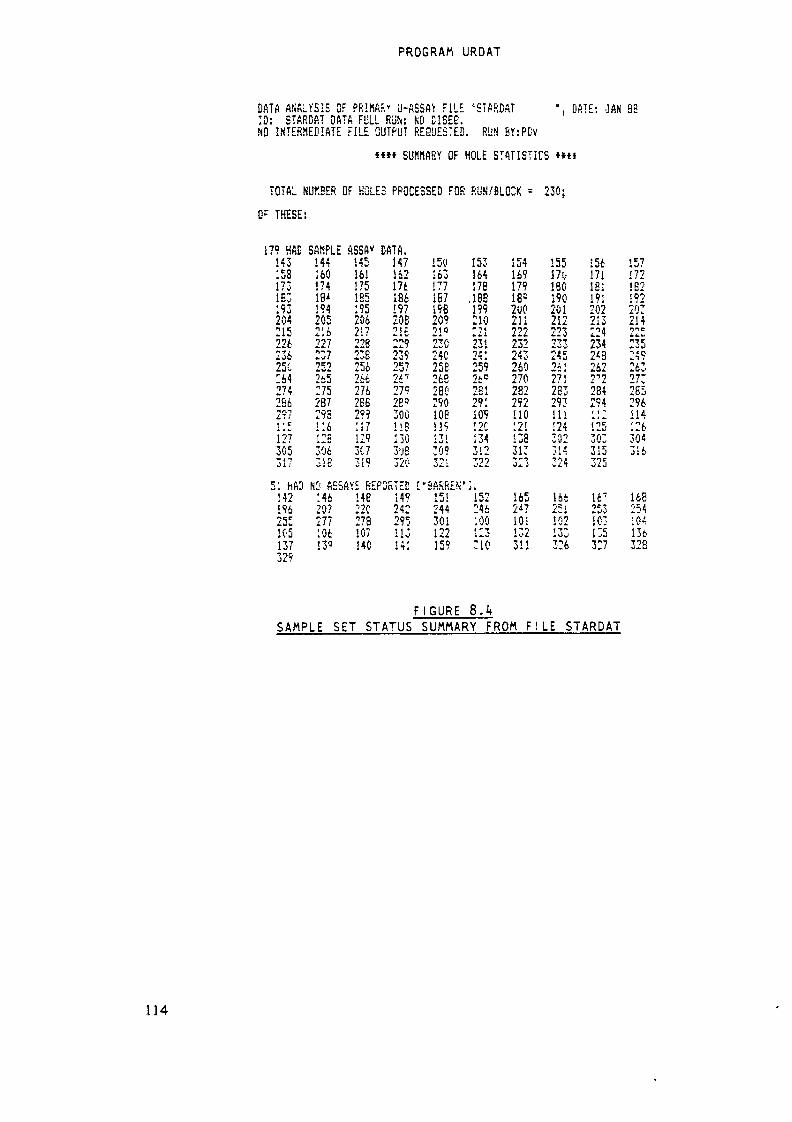
PROGRAM URDAT
DATA ANALYSIS OF PRIKftR» U-ASSA^ FILE '«TARDAT ", DATE: JAK 3SID: EÎARDAT DATA FÜLL RON: M DISES.NO INTERMEDIATE FILE OUTPUT REQUESTED. RUN BY:PCV
**« SUNrtABY OF HOLE STATISTICS *«*
TOTAL NUf.8ER OF HOLES PROCESSED FOR RUN/BLOCK = 230;
G- THESE:
179 HAD SAMPLE ASSA* DATA.143153173IB;193204:i5til23625C:64274266297« « rÎ2?305•» i •)Oil
5'. HAD!42196255105137329
14416017418*19420521s2272377ti17265275287293116128306318
14516117518519520621?2292382562662762EE29?« « T1 1 ;129307319
!47Ü217t18619?20B21£inn2392572e72792E"300118no3'JB320
ND ASSAYS REPORTED14i20?27710t13«
148220273107140
149242295113141
15«16317718719820921"23G24025Ê26828029010811913130932i
["BARREN-IS!244301122159
15316417B.1881?9210*-M-il2312412592t"'81291109i'C134312322
J .152n46100123:io
15416917918'2UO211222232243260270282292no12!13331:•"••?0* J
1652*710!13231!
15517o1801902012122232332452cl27128329311!124302314324
lit2?1102133326
•5617118119!2022132242342^3262v>72842941 1 ""
125303315325
16"253103135327
1571721R9!92203214225235249263273285296114!2630*316
168254104136328
F I G U R E 8.kSAMPLE SET STATUS SUMMARY FROM F I L E STARDAT
114
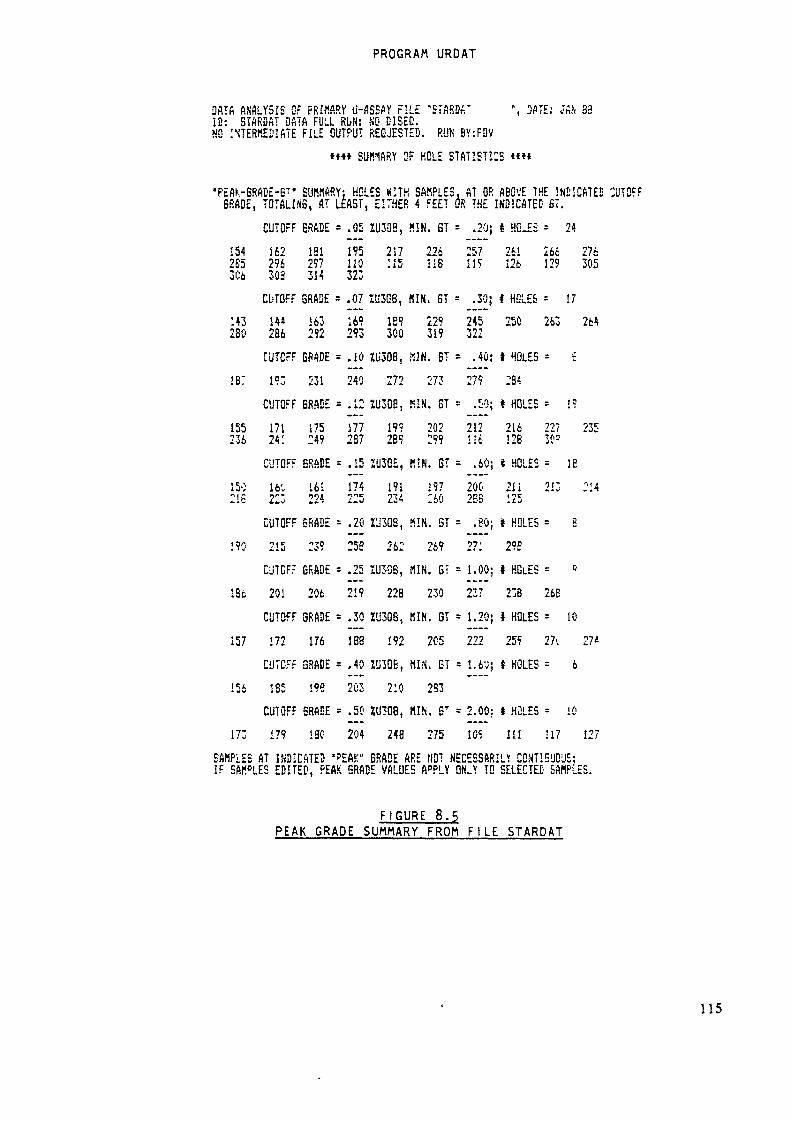
PROGRAM URDAT
DAÏfi ANALYSIS £?r PRIMARY u-flSSi5Y FILE 'SIARDr ", DATE: JA* S3ID: STARDAT DATA FULL RUN: NO DISES,NO INTERMEDIATE FILE OUTPUT REEJESTED. RUN BY:FDV**« SUK1ARY OF HOLE STATISTICS «***
•PEAK-SRAI!E-GT° SUMfiRY; HOLES KITH SAKPLES, AT OR ABOVE THE INDICATED CUTOFFBRADE, TOTALES, AT LEAST, EITHER 4 FEET OS THE INDICATED ST.CUTOFF GRADE = .OS ÏU3US, KIN. 6T = .20; I HO.ES = 24
154 162 181 195 217 226 257 261 26c 2762Ë5 296 297 110 :i5 118 135 126 129 3053C6 303 314 323CUTOFF GRADE = .07 ÏK3Q8, KIN. 6T = .30; I HOLES = 17
M3 14* 163 169 1E9 22? 245 250 263 2fc4280 286 292 293 300 319 322CUTCFF SPADE = .10 Xb'308, KIN. 6T = .40; t HOLES = £
IB: 19; 231 240 272 273 27? 234CUTOFF ERASE = .12 ÏUSOfi, SIN. ST = .50; t HOLES = 19
155 171 175 177 19? 202 212 216 227 235236 241 249 237 2B9 299 Ile Î28 303CUTOFF GRADE = .is iu3Q£, KIN. BT = .60; * HOLES = IB
150 16'. 161 174 191 19? 200 211 213 21421E 213 224 225 234 260 2BB 125CUTOFF BRADE = .20 rjsoe, «IN. ST = .80; t HOLES = a
!?0 2!5 239 256 262 269 271 29ECLJTGFF BRADE = .25 iißös, «IK. 6î = i.oo; * HOLES = °
18fc 201 206 219 22B 230 237 238 26BCUTOFF GRADE = .30 ÏUSOB, KIN. GT = 1.205 * HOLES = 10
157 S72 176 188 192 205 222 259 27i 27*CUTOFF GRADE = .40 ZIHQB, «IN. GT = i.6-jj t HOLES = 6
156 185 !98 2C3 210 2B3CUTOFF SRADE = .50 ÏU3Q8, «IN. ET = 2.0Û: I H2LES - 10
173 179 ISO 204 248 275 10« 111 117 127SAMPLES AT INDICATED «"EAK" GRADE ARE NOT NECESSARILY CONTIGUOUS;IF SA«CLES EDITED, PEAK GRADE VALUES APPLY QN.Y TO SELECTED SAMPLES.
FIGURE 8.5PEAK GRADE SUMMARY FROM F I L E STARDAT
115
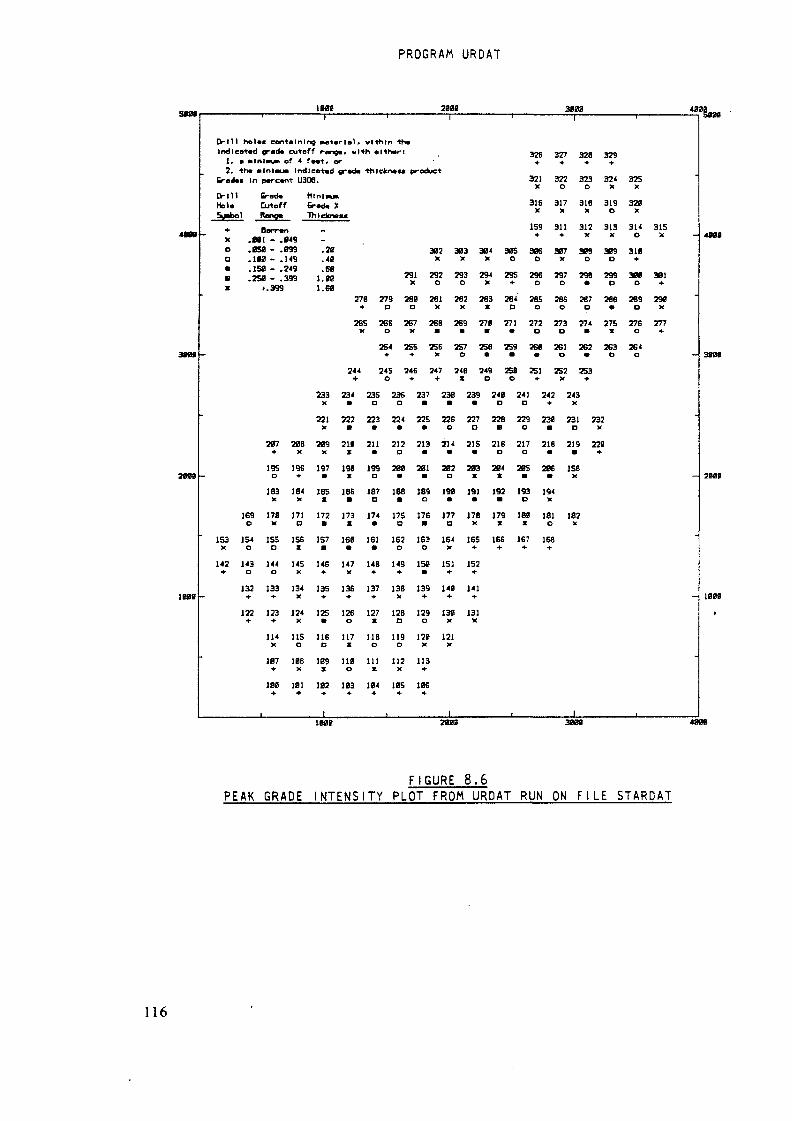
PROGRAM URDAT
1MB 3B0B1 1 ' i
Drill holeM containing Material» vlthln theIndicated grade cutoff range, with either!
1. a mlntmj* of 4 feet, or2. the Minium* Indicated grade ttolclcne«« product
Greaet In percent U308.
Drill Grade Minim»Hole Cutoff Grade XSgabol Range TMdcneu
4- BarrenX .MI - .0490 .050 - .099a .1(0 - .149• .150 - .• .250 - .x >.399
249399
.20
.40
USB
1 l '
326 327 328 3294 4 - 4 - 4
321 322 323 324 325X O O X X
316 317 318 319 32«X X X O X
159 311 312 313 314 315+ 4- x x o x -
302 303 304 305 306 307 308 309 31«X X X O O X O D 4
291 292 293 294 295 296 297 298 299 30« 30)X O O X 4 O O A D O 4
276 279 28« 281 282 283 284 285 286 287 286 289 29«4 O 0 x x x o o o o v o x
265 26S 267 266 269 270 271 272 273 274 275 276 277X o X • • • • O O B X O 4
254 25S 256 257 258 259 26« 261 262 263 264-
207*
195
183x
169 178o x
" 153 354 155X O O
142 143 1444- O O
132 1334 - 4
122 123+ 4-
114X
107»
less
20Bx
196
184x
171D
156X
145x
134x
124X
MS0
10Bx
101
233x
221x
209x
197
185X
172•
157•
1464
1354
125•
116a
109x
102
1
2444
234•
222•
211x
198
186•
173x
16«•
147x
136*
126o
117x
11«o
103
4- 4 X o « B } « o e > o o —
245 246 247 246 249 251 251 252 253
235O
223•
211•
199
187o
174•
161•
148+
137+
127x
118o
HIx
104
0
236a
224•
212o
20«
188•
175O
162o
149+
13Bx
12Ba
119o
112x
105
+
237•
225•
213•
201
189o
176•
163o
150•
1394
129o
120x
1134
106
4
238•
226o
214•
202
190•
177D
164X
151+
140+
130x
121x
1
X D 0 4- X 4
239 24« 24] 242 243• O O 4 X
227 228 229 23« 231 232O • O • O X
215 216 217 216 219 220• O 0 • • 4
203 204 205 206 158
191 192 193 194• • o x
178 179 18« 161 182X X X 0 X
165 166 167 1684 - 4 4 4
152•#•
14}•#• —
131x
-
t 1 i
1000 10m
1MB 2OTS
FIGURE 8.6PEAK GRADE INTENSITY PLOT FROM URDAT RUN ON F I L E STARDAT
116
DEFINITION OF TERMS
9.0 DEFIHITIOH OF ORE RESERVE TERMS AS USED IN THIS GUIDE
9.1 PHYSICAL PARAMETERS
9.1.1 ReservesIn this guide, a reserve w i l l be considered simply as a quantity of materialestimated to be available for some current or future use. The modifyingterms used along with the word "reserve" w i l l define it more specifically.An in-place ore reserve or simply "ore reserve" w i l l apply to the estimateof the volume (area x thickness) of material, in the ground, which is char-acterized by a given minimum (mining) thickness (Section 9-1-3) and a mini-mum mineral content or value (Section $.].k) at that thickness. The materialwithin the ore reserve volume is defined as ore and expressed in estimatedtons of ore and average grade of contained mineral. The volume is convertedto tons by the tonnage factor, which is the density of the material, ex-pressed in cubic feet per ton.The average grade is expressed in hundredths (or thousandths) of a percentU308 and may be converted to pounds of uranium by:
pounds U308 = tons ore x 20. x gradeAn ore reserve may be additonally defined according to the method used incalculating it; examples: "diluted" or "undiluted" (Section 9.1.8.2),"geostati st i cal", "area-of-influence", "general outline", etc.An extractable (ore) reserve is that portion of an in-place ore reservewhich is expected to be actually removed from the ground and be availablefor mineral processing. It is also expressed in tons and average grade. Arecoverable (ore) reserve is the quantity of mineral from the in-place orereserve which is expected to be ultimately available in concentrate afterboth extraction and processing have occurred. Recoverable reserves are ex-pressed in weight of mineral product (tons or pounds of U308).Up to this point, there have been no economic criteria attached to the term"reserves". Such criteria may be applied by further defining an ore reserveas being "profitably recoverable at a given market price and given pro-duction costs", where the production costs may be "forward costs" (all fu-ture expenses from some given point in time) or "economic recovery costs"(basically all past and future expenses).The term "profit" may simply mean that the value of the mineral in the re-serve exceeds the cost of producing it, or, the definition may be furtherexpanded by stipulating that a particular minimum rate of return must be re-alized over the period of production. The "value" of the contained mineraldepends on the circumstances of sale to a buyer (Section 9.2.1).A discussion of the pros and cons of various definitions are beyond thescope of this guide. The URAD programs are simply "mechanical" methods ofestimating mineral quantities using certain rules and procedures. With theappropriate physical and economic input parameters, results may be generated
117

D E F I N I T I O N OF TERMS
to fit a great variety of economic situations. However, the programs containno capability for analysing "discounted cash flow rate of return".
$. 7././ General Characteristics of URAD Reserve EstimatesThe ore reserves estimated by the URAD system f a l l into the "measured", in-dicated, and inferred" or "reasonably assured resource" categories.They are based on the "general outline" method, wherein an ore reserves "en-tity" is simply defined by circumscribing a real or imagined boundary aroundthe area within which the reserve w i l l be calculated. Such a boundary isusually placed such that it reflects, to the extent possible, the margin ofa mineral (or "ore") deposit or the separation of one part of a deposit fromanother. The most cr i t i c a l regions are those around the apparent peripheryof the deposit where it must be decided how further out from the last "sig-nificant" sample set the actual boundary is located. The definitions of theterms " ore deposit", "boundary", and "significance" of samples set varywidely depending on the experience of the ore reserves analyst, the geologiccharacteristics of the area involved, and the spacing of the sample assaydata.The smallest ore reserves entity considered in URAD is a block (Section7.1), which is defined both by a specific area value (in square feet) and bythose samples which are used in estimating the thickness and average gradeof ore w i t h i n the area boundaries.Reserves estimated by the general outline method are most l i k e l y to have ahigher reliability if the sample sets represent either truly randomspacings or, conversely, regular spacings. Therefore, care must be taken torecognize "biased" spacing of sample sets, i.e. different "density" of sam-ple set spacing based on deposit characteristics.It is not unusual to find that more sampling has been carried out, for exam-ple, in higher grade or more accessible portions of a deposit than others,and it is prudent to establish block outlines which take such situationsinto account. If one area of a deposit has been sampled at 50-foot intervalsand another at 200-foot intervals, then each area should be analysed sepa-rately and the relative r e l i a b l i t y of results accordingly recognized.The methodoloy of reserves analysis (and associated terminology) used in theURAD ore reserves programs was o r i g i n a l l y oriented towards relatively thin-bedded and approximately horizontal uranium deposits of the bedded sandstone type, with individual ore zones varying from around two to fifty feet.However, it could be used with other types of deposits.Evaluation of a reserve calculated by the URAD programs actually consists ofa two-phase analysis The first is the calculation of the reserve with therestriction imposed by a cost-vs-value cutoff that stipulates that no mate-r i a l which cannot support production operating costs w i l l be included in thereserve. The second is the overall analysis of the reserve calculated by thefirst step to compare its total value with the total cost of production, in-cluding all applicable capital costs. If "arbitrary" grade cutoffs are usedinstead of cost-vs-value cutoffs, then the economic implication of the firstphase does not apply. In program SCOR, both steps are included; in programsORSAC and RESUV, the second step must be carried out by some other means.
118
D E F I N I T I O N OF TERMS9.}.].2 "In-place Reserves, Additional"Estimates of ore reserves calculated by ORSAC and RESUV are considered "in-place" or "geologic" reserves. These estimates do not include mining orprocessing losses. However, for many studies, it is not feasible to takesuch losses into account.
9-1.2 Ore IntervalAn ore interval is represented by one or more contiguous samples character-ized by mineral grades or values which are generally not less than somepre-assigned cutoff (Section $.].k). Samples below cutoff may be included inan ore interval only under certain conditons (Section 3.~\.k), however, theaverage grade of the total interval must s t i l l be equal to or greater thanthe cutoff.The interval is assumed to be linear and roughly perpendicular to the localmean plane of the mineral deposit. In addition, it must be at least equal inthickness to the minimum mining thickness. An ore zone is the actual or in-ferred projection of ore from one identified ore interval to another.
9.1.3 Minimum M i n i n g ThicknessThe minimum m i n i n g thickness is generally considered as the minimum thick-ness of material which can or w i l l be physically be removed by the antic-ipated mining method; it is determined both by the capability of avai l a b i l eequipment and methods as well as by cost considerations. Generally, the"thinner" the minimum m i n i n g thickness, the more expensive the m i n i n g cost.The minimum thickness may also be affected by mine safety considerations.In large open pit operations, the minimum m i n i n g thickness is usually notless than 2 feet. Underground workings are usually 8 to 10 feet in height.However, underground m i n i n g of thin, high-grade zones may be carried out by"split" shooting; first blasting out and removing either the ore or thewaste and then removing the other. This, of course, is more expensive thanblasting the entire face and removing the all the material together.The determination of minimum mining thickness should somewhat reflect thethickness of the available sample intervals on which the ore reserves esti-mate is based. If samples are, say, a minimum of 10 feet in thickness, it isnot very practical to try to determine ore intervals at a minimum miningthickness of 2 or 3 feet.In any case, the minimum mining thickness is one of the most cr i t i c a l param-eters in any ore reserve estimation. For programs SCOR and RESUV, it specif-i c a l l y represents the minimum thickness which can be attained by an oreinterval. In ORSAC, it is the thickness to which samples are combined toform the elements of the sample population to be statistically analyzed.
9.1 .4 Ore CutoffThe term "cutoff", as used in URAD, is a preassigned or calculated mineralgrade or value, below which sample intervals are generally not included whendelineating an ore interval. "Value" is defined here as the estimated dollar
119

D E F I N I T I O N OF TERMS
value of the contained or recoverable mineral represented by a sample ( oran interval or an entire deposit). Intervals of material representinggrades (or values) below the cutoff are not included in an ore interval un-less:
1. They are required to bring the interval up to minimum m i n i n gthickness (Sections 9 - 1 - 3 and 9-1-8.1) .2. They lie between ore intervals, but are so thin that they couldnot be physically or economically separated from the ore duringthe course of mining (Section 9-1-7) •3- They are included as upper and/or lower d i l u t i o n (Section9.1.8.2).
The RESUV and SCOR programs provide two basic methods for assigning cutoffs.In the ORSAC program, cutoffs are not assigned. Reserves are calculated fora spectrum of grade cutoffs, which are not determined by economic factors,and the reserves at each cutoff are based on a statistically-derived grade-tonnage di s t r i b u t i o n of an entire deposit; the desired cutoff is determinedindependently of the program, and then the ORSAC results are checked to de-termine how much ore is available at that cutoff.
S. 1.4.? Value-vs-Cost CutoffIn programs RESUV and SCOR, a cutoff grade or value may theoretically repre-sent the break-even point in cost versus value (of contained or recoverablemineral) at which material may be extracted, carried to some given location,and, optionally, processed.This is based on the reasoning that it is not generally feasible to extracta quantity of material which, when delivered to the point at which paymentis made, w i l l not be at least equal in value to the total cost of delivery.This is called a "break-even" or "marginal cost" cutoff p r i n c i p l e and isutilized in all cases (in URAD) when cutoffs are determined by cost versusvalue. Programs RESUV and SCOR provide the option of calculating cost-versus-value cutoffs based on economic data supplied as program input param-eters .
9. 1 ,k.2 Arbitrary Cutoff GradeAn "arbitrary" cutoff is one which is simply assigned without any neccessaryregard to economic relationships. Programs RESUV and SCOR provide the optionof submitting arbitrary cutoffs.Additional discussions of cutoff are included in the Sections describing theindiv i d u a l ore reserves programs.
9.1.5 Overburden WasteOverburden waste is only considered in the SCOR open pit mode.The term "overburden waste thickness" (or simply "overburden thickness") isused to define the distance from the ground surface to the top of the uppermost ore interval defined in a sample set. "Direct overburden" is the mate-
120
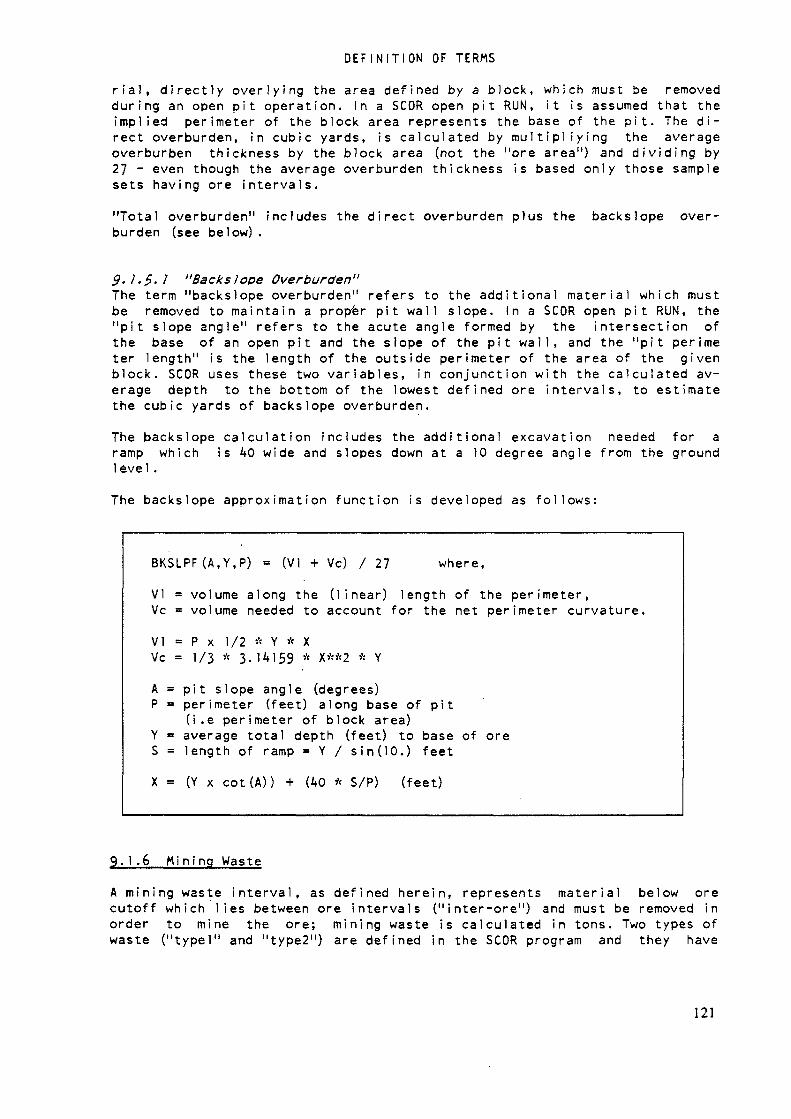
D E F I N I T I O N OF TERMS
r i a l , directly overlying the area defined by a block, which must be removedduring an open pit operation. In a SCOR open pit RUN, it is assumed that theimplied perimeter of the block area represents the base of the pit. The di-rect overburden, in cubic yards, is calculated by m u l t i p l i y i n g the averageoverburben thickness by the block area (not the "ore area") and d i v i d i n g by27 ~ even though the average overburden thickness is based only those samplesets having ore intervals."Total overburden" includes the direct overburden plus the backs lope over-burden (see below) .
9- l 'S- l "Backslope Overburden"The term "backslope overburden" refers to the additional material which mustbe removed to maintain a proper pit wall slope. In a SCOR open pit RUN, the"pit slope angle" refers to the acute angle formed by the intersection ofthe base of an open pit and the slope of the pit wall, and the "pit périmeter length" is the length of the outside perimeter of the area of the givenblock. SCOR uses these two variables, in conjunction with the calculated av-erage depth to the bottom of the lowest defined ore intervals, to estimatethe cubic yards of backslope overburden.The backslope calculation includes the additional excavation needed for aramp which is 40 wide and slopes down at a 10 degree angle from the groundlevel.The backslope approximation function is developed as follows:
BKSLPF (A.Y.P) = (VI 4- Vc) / 2? where,VI = volume along the (linear) length of the perimeter,Vc = volume needed to account for the net perimeter curvature,VI = P x 1/2 * y A xVc = 1/3 * 3-14159 * x**2 * YA = pit slope angle (degrees)P = perimeter (feet) along base of pit
(i.e perimeter of block area)Y = average total depth (feet) to base of oreS = length of ramp = Y / sin(10.) feetX = (Y x cot (A)) + (40 * S/P) (feet)
9.1.6 Mi ning WasteA mining waste interval, as defined herein, represents material below orecutoff which l i e s between ore intervals ("inter-ore") and must be removed inorder to mine the ore; mining waste is calculated in tons. Two types ofwaste ("typel" and "type2") are defined in the SCOR program and they have
121

D E F I N I T I O N OF TERMS
different connotations depending on whether an open pit or underground oper-ation is being evaluated.
Waste materials removed during primary development (i.e. shaft sinking,haulageway construction, and other "access" operations) are not included asmining waste.
9.1.7 Minimum Waste ThicknessThe minimum waste thickness is the minimum thickness of material below orecutoff which can be physically separated from ore intervals during m i n i n gopérât ions.
v5- 1 •?• I UndergroundFor underground operations, the type! mining waste is that material whichmust be removed (when mining t h i n l y separated ore intervals) because it isnot sufficiently competent to stand in place even with support, or ischeaper to remove than support. The typel waste ("stoping" waste) minimumthickness may be less than the minimum m i n i n g thickness. An upper l i m i t mustbe placed on the typel thickness; this l i m i t reflects the minimum thicknessof material, between more or less horizontal ore zones, which would be leftin place (with or without support) during ore extraction. The type2 desig-nation is not used.
9.1.7.2 Open PitFor open pit operations, the m i n i n g waste is defined as any p h y s i c a l l y sepa-rable material between ore intervals and may, optionally, be subdivided intotypel and type2 for costing purposes (Section 9-2.J+.6).The minimum typel waste thickness is automatically the same as the minimumm i n i n g thickness. If no type2 waste category is requested, then all inter-ore waste is categorized as typel.However, when a "minimum type2 waste thickness" is assigned, m i n i n g wasteless than this thickness (and equal to or greater than the minimum m i n i n gthickness) is placed in the "typel" category, and that greater than the min-imum type2 thickness in "type2". The type2 waste option allows the chargingof lower waste removal costs to thick zones of inter-ore waste.
Example: if a deposit to be mined by open pit methods consists of3 ore zones, with the uppermost zone 200 feet below the surface,the middle zone 10 to 15 feet below the first, and the lowest 2 to6 feet below the m i d d l e zone, then very large-scale earth-removalmethods and equipment would be used in stripping (at r e l a t i v e l ylow cost) the overburden to the first ore zone, whil e the cost forremoving waste between the lowest two zones would be close to them i n i n g cost. The cost for removing the material below the upperzone would probably be somewhere in between the two extremes.
The decision to treat type2 waste (as defined above) as an additional oper-ating cost, as opposed to a primary development (capital) cost, is open toquestion. It depends largely on the mine operator's method of h a n d l i n g mineexpenditures and would m a i n l y be affected by tax considerations.
122
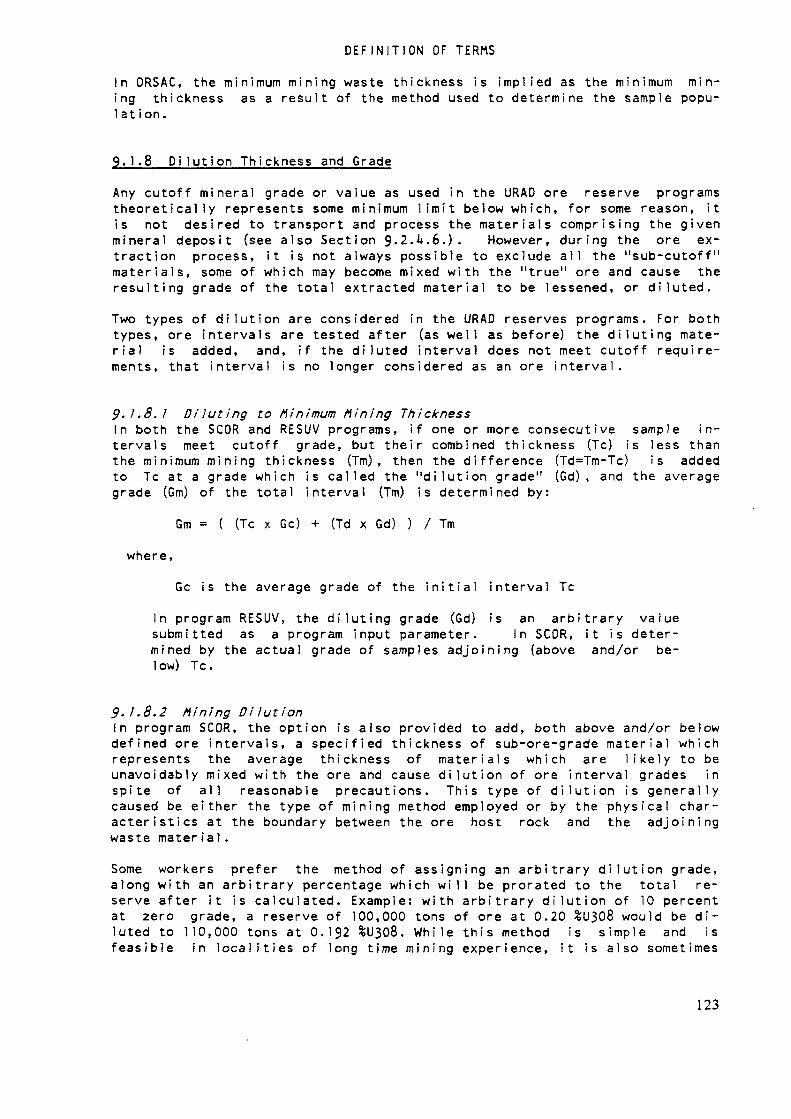
D E F I N I T I O N OF TERMSIn ORSAC, the minimum mining waste thickness is implied as the minimum min-ing thickness as a result of the method used to determine the sample popu-lation.
9.1.8 Dilution Thickness and GradeAny cutoff mineral grade or value as used in the URAD ore reserve programstheoretically represents some minimum l i m i t below which, for some reason, itis not desired to transport and process the materials comprising the givenmineral deposit (see also Section 9-2.4.6.). However, during the ore ex-traction process, it is not always possible to exclude all the "sub-cutoff"materials, some of which may become mixed with the "true" ore and cause theresulting grade of the total extracted material to be lessened, or diluted.Two types of dilution are considered in the URAD reserves programs. For bothtypes, ore intervals are tested after (as well as before) the d i l u t i n g mate-r i a l is added, and, if the diluted interval does not meet cutoff require-ments, that interval is no longer considered as an ore interval.
9' t '8, 1 Diluting to Minimum Mining JhicknessIn both the SCOR and RESUV programs, if one or more consecutive sample in-tervals meet cutoff grade, but their combined thickness (Tc) is less thanthe minimum mining thickness (Tm) , then the difference (Td=Tm-Tc) is addedto Tc at a grade which is called the "dilution grade" (Gd) , and the averagegrade (Gm) of the total interval (Tm) is determined by:
Gm = ( (Tc x Gc) + (Td x Gd) ) / Tmwhere,
Gc is the average grade of the i n i t i a l interval TcIn program RESUV, the diluting grade (Gd) is an arbitrary valuesubmitted as a program input parameter. In SCOR, it is deter-mined by the actual grade of samples adjoining (above and/or be-1 ow) Tc .
9-1.8.2 Mining DilutionIn program SCOR, the option is also provided to add, both above and/or belowdefined ore intervals, a specified thickness of sub-ore-grade material whichrepresents the average thickness of materials which are l i k e l y to beunavoidably mixed with the ore and cause dilution of ore interval grades inspite of all reasonable precautions. This type of d i l u t i o n is generallycaused be either the type of mining method employed or by the physical char-acteristics at the boundary between the ore host rock and the adjoiningwaste mater ial .Some workers prefer the method of assigning an arbitrary d i l u t i o n grade,along with an arbitrary percentage which w i l l be prorated to the total re-serve after it is calculated. Example: with arbitrary d i l u t i o n of 10 percentat zero grade, a reserve of 100,000 tons of ore at 0.20 %U308 would be di-luted to 110,000 tons at 0.192 %U308. Wh i l e this method is simple and isfeasible in localities of long time mining experience, it is also sometimes
123
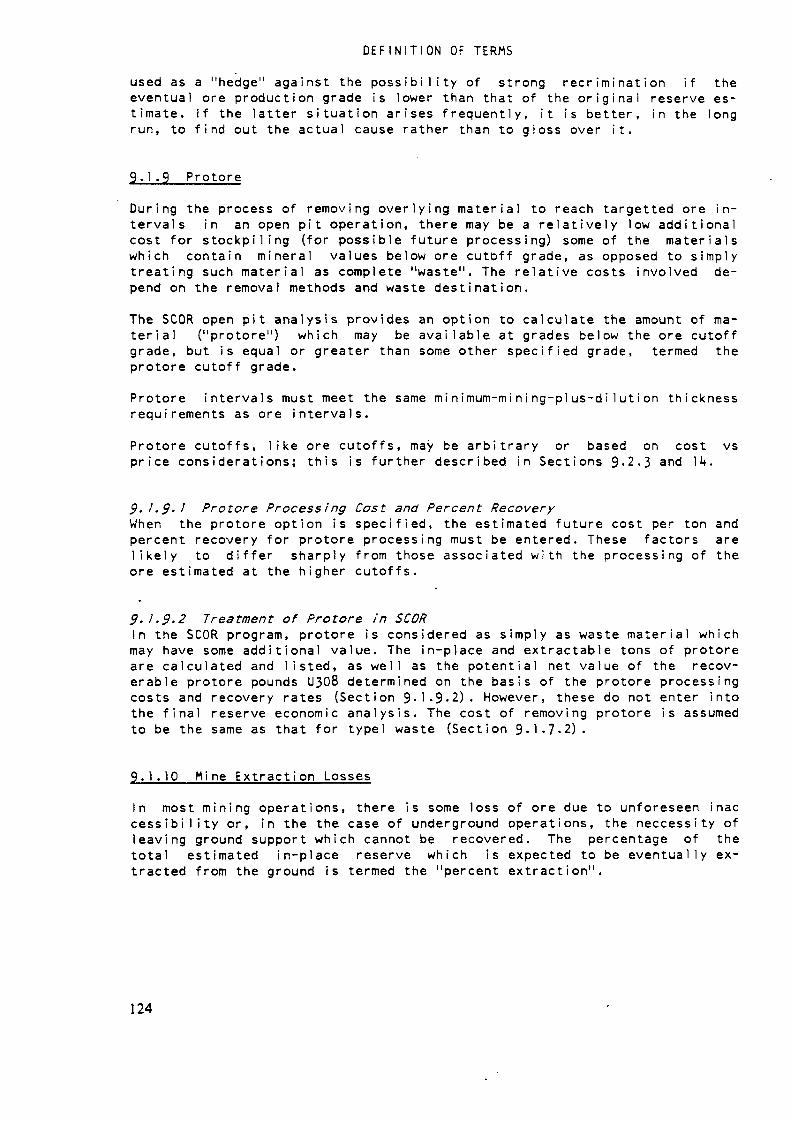
D E F I N I T I O N OF TERMS
used as a "hedge" against the possibility of strong recrimination if theeventual ore production grade is lower than that of the o r i g i n a l reserve es-timate. If the latter situation arises frequently, it is better, in the longrun, to find out the actual cause rather than to gloss over it.
9.1.9 ProtoreDuring the process of removing overlying material to reach targetted ore in-tervals in an open pit operation, there may be a relatively low additionalcost for stockpiling (for possible future processing) some of the materialswhich contain mineral values below ore cutoff grade, as opposed to sim p l ytreating such material as complete "waste". The relative costs involved de-pend on the removal methods and waste destination.The SCOR open pit analysis provides an option to calculate the amount of ma-terial ("protore") which may be available at grades below the ore cutoffgrade, but is equal or greater than some other specified grade, termed theprotore cutoff grade.Protore intervals must meet the same minimum-minin g - p l u s - d i l u t i o n thicknessrequirements as ore intervals.Protore cutoffs, l i k e ore cutoffs, may be arbitrary or based on cost vsprice considerations; this is further described in Sections 9-2.3 and 14.
9. 1.3- 1 Protore Processing Cost and Percent RecoveryWhen the protore option is specified, the estimated future cost per ton andpercent recovery for protore processing must be entered. These factors arel i k e l y to differ sharply from those associated with the processing of theore estimated at the higher cutoffs.
9.1.9.2 Treatment of Protore in SCORIn the SCOR program, protore is considered as simply as waste material whichmay have some additional value. The in-place and extractable tons of protoreare calculated and listed, as well as the potential net value of the recov-erable protore pounds U308 determined on the basis of the protore processingcosts and recovery rates (Section 9.1.9-2). However, these do not enter intothe final reserve economic analysis. The cost of removing protore is assumedto be the same as that for typel waste (Section 9-1-7-2).
9.1.10 Kine Extraction LossesIn most m i n i n g operations, there is some loss of ore due to unforeseen inaccessibility or, in the the case of underground operations, the neccessity ofleaving ground support which cannot be recovered. The percentage of thetotal estimated in-place reserve which is expected to be eventually ex-tracted from the ground is termed the "percent extraction".
124

D E F I N I T I O N OF TERMS9.1.11 Ore Processing Recovery
if an ore reserve is to be considered as "recoverable", then the percentageof the total contained mineral which w i l l be available after processing mustbe estimated. This is termed the percent recovery from ore processing , orsimply "percent recovery".
9.2 ECONOMIC PARAMETERS
9.2.1 Integrated Versus Independent OperationsAn operation is "integrated" if both mining and processing are both consid-ered as part of a single integral operation, and the end product is uraniumin concentrate. In an integrated operation, the m i n i n i g and processing func-tions and facilities are usually controlled by a single organization. Cutoffcalculations and value of ore are based on recoverable U308.
An operation is "independent" if the mining activities are completely separate from the processing function as, for example, when a mine operatorsells ore to a processing plant controlled by a different organization. Inthis case, the end product is usually considered uranium in ore and valueand cutoff computations are performed accordingly. Processing costs and re-coveries are generally not considered for independent operations.
9.2.2 Operating Versus Capital Costs
9-2.2. 1 Operating Costs"Operating" costs are those which must directly be applied to each ton ofore which is handled and are expensed accordingly. Operating costs include(but are not neccessarily limited to) those for labor, materials, power,fuel, royalties, insurance, and local ongoing adminstrative, technical, andclerical activities.
9.2.2.2 Capita! Costs"Capital" costs are those which must be essentially expensed before actualore mini n g and processing take place or in the early phases of production.Such costs include (but are not limited to) those for property acquisition,exploration, construction of mine and processing facilities, and activitiesneccessary to gain access to the ore, preparatory to mining, such as shaftsinking and mine primary development.
Aside from good mine accounting practice, the primary reason for sharplyseparating these two types is for investment and tax purposes; the timing ofthe capital expenditures strongly affects the eventual profitability of amining operation.Capital costs are generally applied "in toto" to an entire operation, andthen the breakout of cost/ton of ore for the various cost elements is made.In SCOR, the capital costs should be determined by: 1) running a preliminaryore reserves analysis on a prospective operation; 2) determining the magni-tude of the operation and size and total cost of required f a c i l i t i e s , 3) di-
125
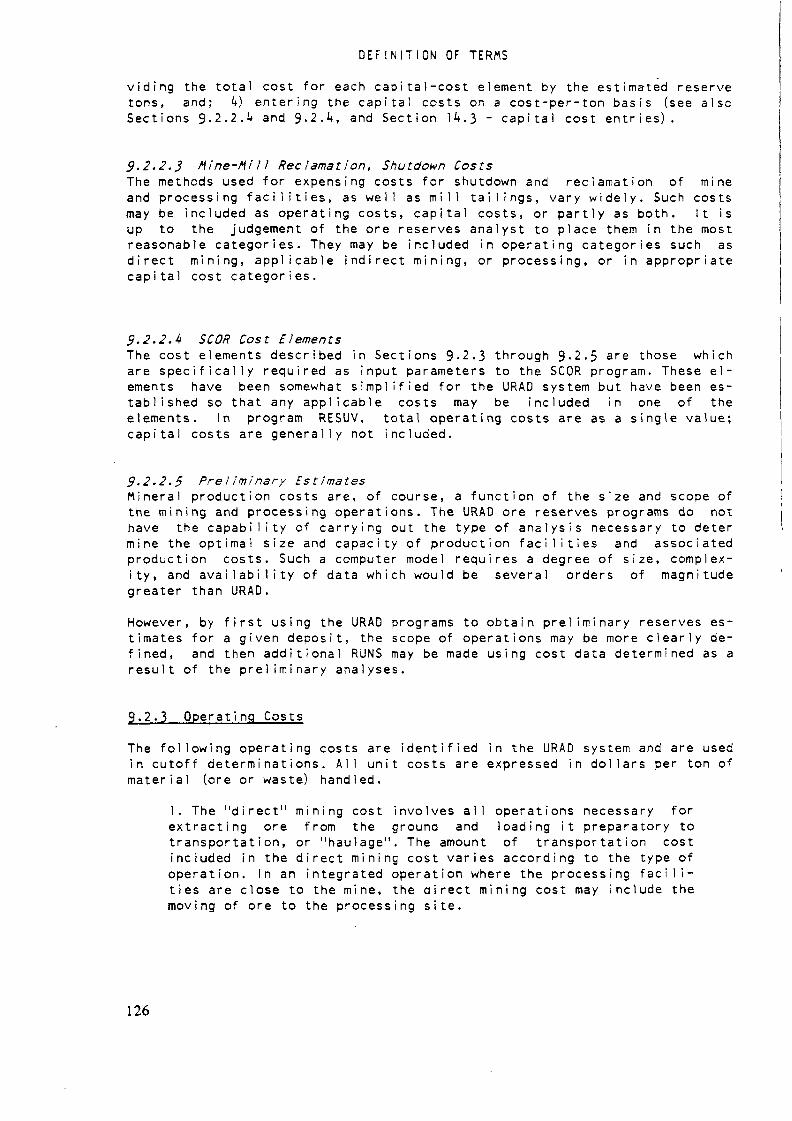
D E F I N I T I O N OF TERMS
v i d i n g the total cost for each capital-cost element by the estimated reservetons, and; k) entering the capital costs on a cost-per-ton basis (see alsoSections 9-2.2.** and 9-2.k, and Section 14.3 ~ capital cost entries).
$.2.2.3 Mine-Mill Reclamation, Shutdown CostsThe methods used for expensing costs for shutdown and reclamation of mineand processing f a c i l i t i e s , as well as m i l l t a i l i n g s , vary widely. Such costsmay be included as operating costs, capital costs, or partly as both. It isup to the judgement of the ore reserves analyst to place them in the mostreasonable categories. They may be included in operating categories such asdirect m i n i n g , applicable indirect m i n i n g , or processing, or in appropriatecapital cost categories.
9.2.2. k SCOR Cost ElementsThe cost elements described in Sections 9-2.3 through 9-2.5 are those whichare s p e c i f i c a l l y required as input parameters to the SCOR program. These el-ements have been somewhat s i m p l i f i e d for the URAD system but have been es-tablished so that any applicable costs may be included in one of theelements. In program RESUV, total operating costs are as a single value;capital costs are generally not included.
9.2.2.5 Preliminary EstimatesMineral production costs are, of course, a function of the size and scope ofthe m i n i n g and processing operations. The URAD ore reserves programs do nothave the capability of carrying out the type of analysis necessary to determine the optimal size and capacity of production f a c i l i t i e s and associatedproduction costs. Such a computer model requires a degree of size, complex-ity, and a v a i l a b i l i t y of data which would be several orders of magnitudegreater than URAD.However, by first using the URAD programs to obtain preliminary reserves es-timates for a given deposit, the scope of operations may be more c l e a r l y de-fined, and then a d d i t i o n a l RUNS may be made using cost data determined as aresult of the p r e l i m i n a r y analyses.
9.2.3 Operating CostsThe following operating costs are identified in the URAD system and are usedin cutoff determinations. All unit costs are expressed in dollars per ton ofmaterial (ore or waste) handled.
1. The "direct" m i n i n g cost involves all operations necessary forextracting ore from the ground and loading it preparatory totransportation, or "haulage". The amount of transportation costincluded in the direct m i n i n g cost varies according to the type ofoperation. In an integrated operation where the processing f a c i l i -ties are close to the mine, the direct m i n i n g cost may include themoving of ore to the processing site.
126
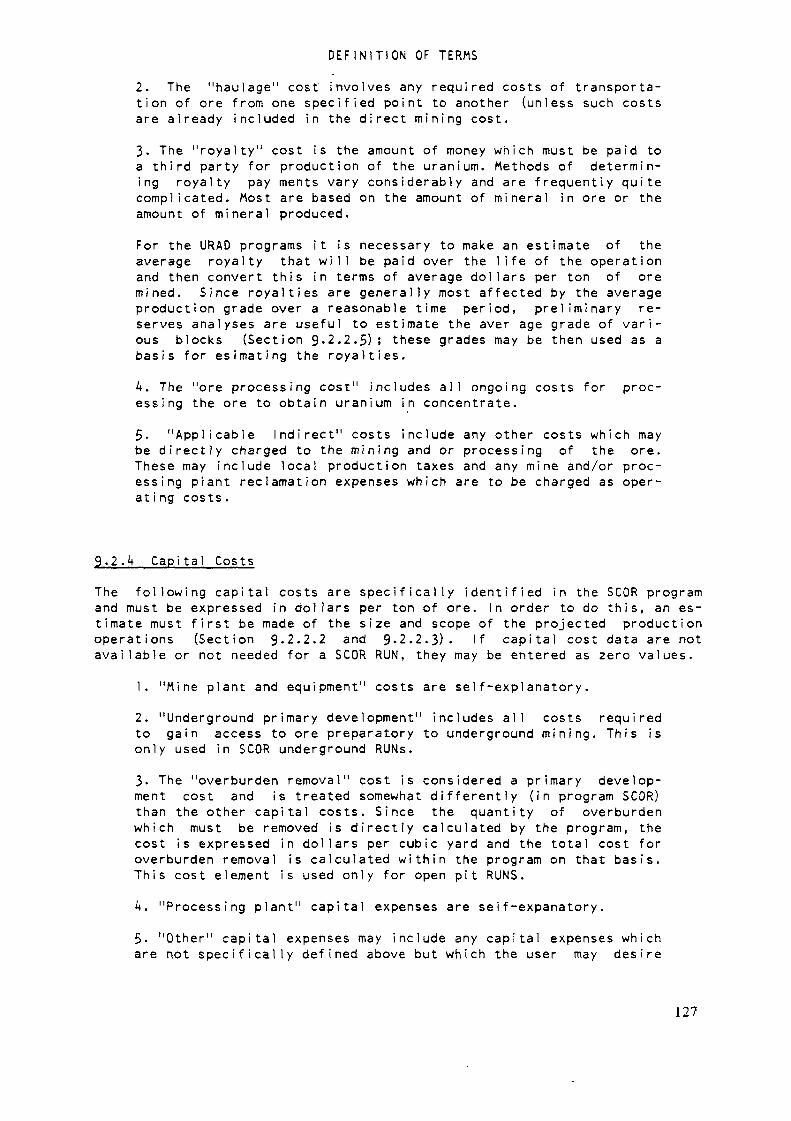
D E F I N I T I O N OF TERMS
2. The "haulage" cost' involves any required costs of transporta-tion of ore from one specified point to another (unless such costsare already included in the direct m i n i n g cost.3. The "royalty" cost is the amount of money which must be paid toa third party for production of the uranium. Methods of determin-ing royalty pay ments vary considerably and are frequently quitecomplicated. Most are based on the amount of mineral in ore or theamount of mineral produced.For the URAD programs it is necessary to make an estimate of theaverage royalty that w i l l be paid over the l i f e of the operationand then convert this in terms of average dollars per ton of oremined. Since royalties are generally most affected by the averageproduction grade over a reasonable time period, preliminary re-serves analyses are useful to estimate the aver age grade of vari-ous blocks (Section 9.2.2.5); these grades may be then used as abasis for esimating the royalties.4. The "ore processing cost" includes all ongoing costs for proc-essing the ore to obtain uranium in concentrate.5. "Applicable Indirect" costs include any other costs which maybe directly charged to the mining and or processing of the ore.These may include local production taxes and any mine and/or proc-essing plant reclamation expenses which are to be charged as oper-ating costs.
9.2.U Capi tal CostsThe following capital costs are specifically identified in the SCOR programand must be expressed in dollars per ton of ore. In order to do this, an es-timate must first be made of the size and scope of the projected productionoperations (Section 9-2.2.2 and 9-2.2.3). If capital cost data are notavailable or not needed for a SCOR RUN, they may be entered as zero values.
1. "Mine plant and equipment" costs are self-explanatory.2. "Underground primary development" includes all costs requiredto gain access to ore preparatory to underground mining. This isonly used in SCOR underground RUNs.3- The "overburden removal" cost is considered a primary develop-ment cost and is treated somewhat differently (in program SCOR)than the other capital costs. Since the quantity of overburdenwhich must be removed is directly calculated by the program, thecost is expressed in dollars per cubic yard and the total cost foroverburden removal is calculated within the program on that basis.This cost element is used only for open pit RUNS.A. "Processing plant" capital expenses are self-expanatory.5- "Other" capital expenses may include any capital expenses whichare not specifically defined above but which the user may desire
12?

D E F I N I T I O N OF TERMS
to include, such as property acquisition, exploration, mine andprocessing site preparation, and any mine or processing reclama-tion a c t i v i t i e s which are to be treated as capital expenditures.
S'2.k.l Inter-ore Mining Waste-CostsM i n i n g waste is defined in Section 9 - 1 - 6 » and the costs for m i n i n g waste re-moval are discussed separately here because there are several methods oftreating such costs. Program SCOR provides options for charging costs usingeither of the methods described below. M i n i n g waste removal costs are ex-pressed in dollars per ton
1. The mining waste costs are sometimes included in the directmining costs, especially when there is sufficient backlog of expe-rience, in m i n i n g a given type of deposit, to estimate the averageamount of waste which w i l l be removed for every ton of ore mined.In this situation the waste cost is said to be "pro-rated" to them i n i n g cost. In estimating costs for "split- shooting" undergroundoperations (Section 9-1.3)« for example, one method is to estimatethe average ratio of waste to ore assuming mine workngs of, say, 8feet in height; calculate the total cost for removing both ore andwaste; use a small (one to two feet) m i n i n u m m i n i n g thickness; andconsider the ore + waste cost as direct m i n i n g cost. Example: ifthe ore-to-waste ratio is one ton of ore for every 3 tons ofwaste, and the ore m i n i n g cost is $50 per ton and waste removal is$10 per ton then the direct m i n i n g cost for ore m i n i n g would becharged at $80 per ton.When waste removal costs are prorated, they are i m p l i c i t e ) / in-cluded in cost vs value cutoff calculations.2. In other situations, it is preferred to separately estimate thequantity of m i n i n g waste and charge its removal as a indépendantcost element. In underground operations, the cost w i l l depend p r i -m a r i l y on whether the waste must be brought to the surface orwhether it be simply moved into "mined out" portions of the under-ground workings.S i m i l a r l y , in open pit operations, m i n i n g waste removal costs de-pend largely on the distance that the waste must be moved as wellas the size of equipment used. In addition, where ore zones areseparated by relatively thick waste zones ("type2' waste, see Sec-tion 9.1.7)» it is generally chea per to remove such waste mate-r i a l than that (typel waste) which is between closely separatedore zones. An identified typel waste m i n i n g cost should always in-clude the cost of moving it to its destination.
When costs are assigned to specific waste types, such costs are not includedin the cutoff calculations but are applied to the economic evaluation of thereserves as a whole.When the SCOR protore option is in effect, the cost/ton for m i n i n g the protore is included in the protore cutoff calculation (if the latter is determined by cost vs price) and the typel m i n i n g waste removal cost is used asthe protore cost.
128
INTERACTIVE ENTRY
10.0 INTERACTIVE Btfîfff
10.1 GENERAL PROCEDURES
Each of the programs require some "interactive" (I/A) entry of program parameters. For every I/A entry, a data request message (termed a "prompt")w i l l appear and this prompt w i l l clearly indicate the type of data needed.The prompt w i l l be immediately followed by an arrow (" -> ") or one or more"framers", which are dashed line segments ( — -. — ) or ( —— -.-), etc. En-tries are made simply by using the console typewriter to key in the appro-priate response immediately to the right of the arrow or (approximately)under the f ramer (s) . Some prompts only require a "Y" (for "yes') or a "N"(for "no") response. When the complete entry has been made for a prompt,the RETURN key is pressed.The arrow is used when data consist of either a numeric integer code, a Y orN response, or an alphanumeric name. Framers are used for decimal numbersor for multiple entries. A mult i p l e entry is one where several values arerequested for a given prompt.The framers w i l l indicate the maximum number of significant d i g i t s and themaximum number of places to the right of the decimal point (if applicable)to which numbers may be entered. They w i l l also have a reference heading ifsuch is appropriate. Examples are shown on Figure 10.1. Note that the nu-meric entries need not be directly under the framers since the latter areused primarily to apprise the user-operator of the general form of entry aswell as of how many entries are required. Even if the framer, as well asthe guide text material, indicates a certain number of d i g i t s to the rightof the decimal point to which a particular numeric value may be entered,such numbers need not be entered if not applicable. For example, a costvalue of thirty dollars may be entered as "30" instead of "30.00". Allsignificant digits to the left of the decimal must, of course, be included.Each prompt indicates exactly what options are available for(or entries). The values are either specifically identified
" "a given entryor a range of
of values is provided in brackets. Example " (>0, <50 ft)" indicates that theentry values must be greater than zero but less than fifty (feet). Entriesoutside the specified range or mistakenly-entered alphabetic characters innumeric fields w i l l be caught and the opportunity w i l l be provided for re-entering the values. A few basic guidelines are suggested:
1. For m u l t i p l e entries under "framers" be sure that each nu-meric value is separated by at least one blank space, but do notuse any other "separators" such as a comma (,) .2. Do not enter any numeric value with "imbedded blanks", i.e.the number "one thousand five hundred and sixty two point twofive" must be "1562.25", not "1562 .25", or "1 562.25" or "1562
25", etc. Any blank within a numeric value w i l l cause it to beread by the computer as 2 numeric values.3- For numeric entries use only numeric digits and a decimalpoint, if required. Do not use commas (,) , percent signs (%) ,
129
INTERACTIVE ENTRY
d o l l a r signs ($), or any other non-numeric character, i n c l u d i n gplus (+) or minus (-) signs. No negative entries are requiredfor any of the URAD interac tive prompts.k. Do not use quotes (') when entering f i l e names or other alpha-numeric data interactively. Keep in mind that the URAD proceduresfor interactive data entry differ from those used in estab-l i s h i n g the "LJCON" f i l e and edit instuctions discussed in Section7.0.5- There is no way for the programs to determine if f i l e namesare correct or not. Therefore, after a f i l e name is entered,the opportunity is provided to examine the name and re-enter it,if it is i ncorrect.6. Keep the console keyboard in the "CAPS LOCK" mode duringI/A entry. The URAD system assumes that any alphabetic lettersin data w i l l be uppercase ("A", not "a").7. Most "single-digit code" entries do not provide the option ofre-entry if they lie w i t h i n the range of acceptance; such entriesshould be made with care. "Y" or "N" responses f a l l in thiscategory. Any numeric data entered under framers are automat-i c a l l y displayed when they f a l l w i t h i n their accep table range; ifan erroneous number is seen by the operator, the entire set (de-fined by the given framer (s) may be re-entered.
130
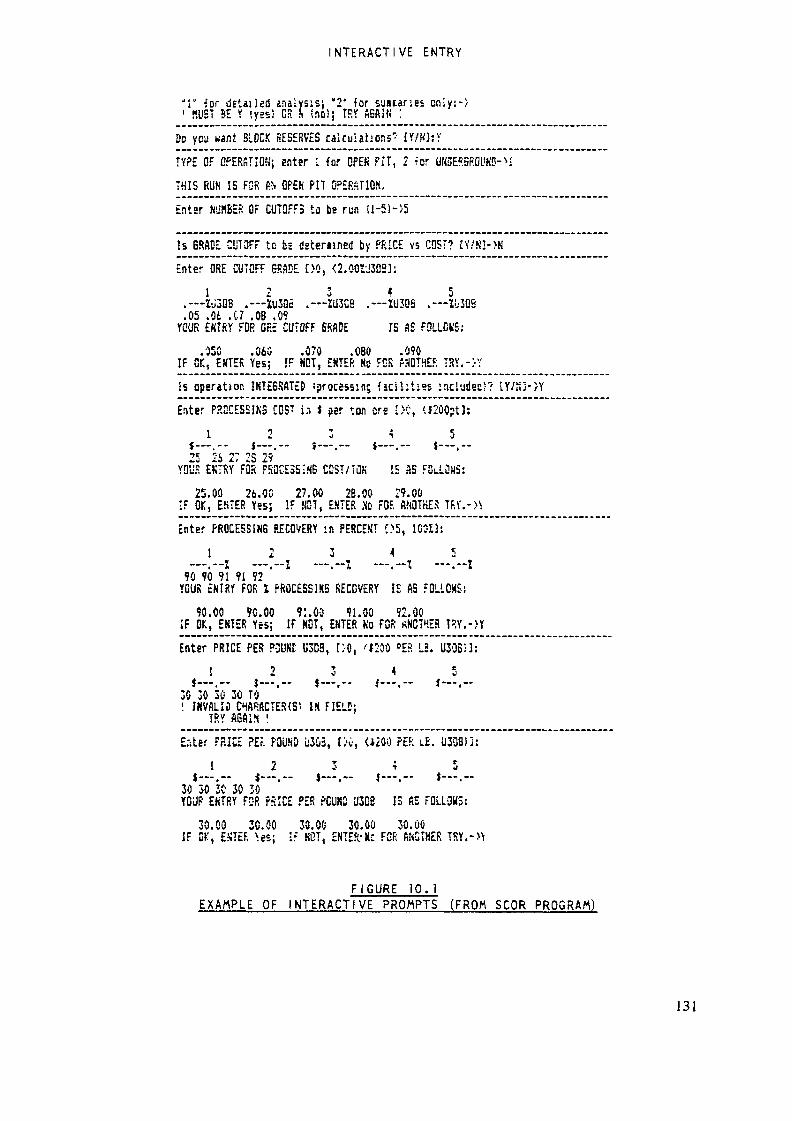
I N T E R A C T I V E ENTRY
T -for detailed analysis; "2" for saitaries cniy:->1 RUST BE Y lyes! OR S. (no!; TRY fiEAIN :
DD you want SLOCK RESERVES calculations'- fY/NhV
TYPE OF OPERATION; enter • for OPES PIT, 2 tor UNDEP.SRDUXB-M
THIS RUN IS FOR AN OPEN PIT OPERATION.
Entsr NUMBER OF CUTOFFS to be run il-5!->5
Is BRAD- CUTOFF to fcs deteruned by PRICE vs COST? IV/N2->N
Enter ORE CUTOFF 6RSDE DO, <2.00S'J30S3:
1 2 3 4 5.---luSflfi .—iu30e .—IÜ3C8 .—ÏU308 .--•-ÏI-30S.05 .06 .(.7 .08 .09
YOUR EKTRY FDfi GEE CUTOFF BRADE IS AS fOLLCh'S:
.050 .060 .070 .080 .090IF OrM EMTER Yes; IF NOT, ENTER No FOR MOTHER TSY.->"
Is operation INTE6SATED iprocessin? facilities lacludec)? LY/?u->Y
Enter PROCESSES COST j:, $ ?er ton ors DC, <J200ptl:
1 2 3 4 5j— ... |—... î—.- $—... $—...'5 ''à 27 2S 29
YOUR EKTRY F2S PROCESSES CCST/ÎOK IS AS FÛLLUSS:
25.00 26.CC 27.00 28.00 29.00IF OK, ESTER Yes; IF NOT, EXTER te FOF. AttOTKES TRY.-«
Enter PROCESSING RECOVERY in PERCEKÏ C>5, 1COIÎ:
1 2 3 4 5—.--I —.--I —.--I —.-I —.--I
90 90 91 91 92YOUR ENTRY FOR I PROCESSES RECOVERY IS AS FOLLOWS;
90.00 90.00 91.00 91.00 92.00IF OK, ENTER Yes; IF HOT, EKTER Ko FOR «NCTHER TRY.- )Y
Enter PRICE PER P3üKt U3D8, DO, •/*20Ô DEH LE. Ü3Ü85J:
1 2 3 4 5j—... j—... $—.- f—... j—...
30 30 30 30 TO! INVALID CHARACTERS IS FIELD;TRY AGA1M !EsUr PRICE ?Ef. FÛUND U3Û3, I>«, O2ÛO PEP. iE. u3G8li:
1 2 3 4 5$....„ $—.-- j— .-- î— .« |— .-
30 30 30 30 30YCÜP ENTRY FGR PSICE PER ?GUS2 U3GB IS fiS FOLLQM5:
30.00 30.00 30. OC 30.00 30.00IF OK, ESTEF, «es; Ir KCT, ENTES; K-: FGR ANOTHER TRY.->\
FIGURE 10.1EXAMPLE OF INTERACTIVE PROMPTS (FROM SCOR PROGRAM)
131

GENERAL PROCEDURES
11.0 BEHERAL PROCEDURES FOR RÜHMIMB THE RESERVES PROGRAM
There are three ore reserves programs in the URAD system - RESUV, ORSAC, andSCOR. These are discussed in Sections 12.0, 13-0, and 14.0, respectively.The description of each program includes:
1. General concepts and operations of the program2. Optional features3. How to run the program, including interactive entry proceduresk. Examples of output.
11.1 PRELIMINARY STEPS
Each program is run on a block-by-block basis and must access a UCON f i l e(Section 7.0) to process the appropriate sample data. Before running any re-serve program, the following procedures should be implemented. The sequenceof the following steps may depend up on particular circumstances. For exam-ple, it is assumed the work on steps 2, 3 and 5 wi'' have been carried outwell in advance of the reserves analysis.
1. Review the applicable sample data, and using whatever meansavailable - preferably sample or d r i l l hole location maps, andcross sections - outline and compute the area of each block (Sec-tion 7-1) for which a reserve esti mate is desired. For SCOR openpit RUNs which w i l l request a final reserve estimate and economicanalysis, the length of the perimeter of the pit base (Section9.1.5.1) must be measured (or estimated).2. Review the sample sets to be included in each block and insurethat they are available on one or more "intermediate" UDAT files.If not, run program URDAT (Section 8.0) to select the necessarysamples from the appropriate "primary" (basic) UDAT files and tocreate the intermediate file(s).3. If the required sample sets are not in the primary file(s),they must of course be entered (Sections 4.0 through 6.0) beforeany programs can be run at a l l .k. Before establishing a UCON f i l e , examine the sample sets to de-termine the feasibility of using area number, hole number, and/orcoordinate control for selecting the assay sets to be included ineach block.5. If the uranium deposit is "mult i-hörizonal", and it is desiredto analyse zones separately, determine which zone (s) are to be in-cluded within each block and how samples w i t h i n such zones are toselected from the sample sets. For relatively flat-lying deposits,elevation control (Section 7-6.3) can be utilized. For erratic orsteeply-dipping deposits, lithologie con trois (Section 7-6.4) aremore efficient, providing that lith o l o g i e data are included withthe sample sets and that the breakdown of l i t h o l o g i e is ade quateto select the desired zones.
132
GENERAL PROCEDURES6. Determine if any of the samples need to be corrected for dise-q u i l i b r i u m (Sections $.k and 7-6.6) If so, obtain the equationform and necessary coefficients. If these are not available itw i l l be necessary to derive them before any further analysis iscarried out.7. Prepare a UCON f i l e (Section 7-0) and give it the name of thestandard default f i l e "UCON1 or some other f i l e name. The blockidentification rec ords (Section 7-3) contain the block number,the area, and a title, if des ired. Make sure that each f i l e iden-tification record (contains the exact name of the intermediatef i l e on which the required data resides, and that names for fileswhich are not on the default disk drive include the device names("A":, "B:", etc.).8. Review the standard and optional control parameters under whichthe prog ram is to be run. These w i l l be requested interactivelyand it is useful to have them already written down, especiallywhen first learning to use the program. The standard control pa-rameters are described in Section 11.2.9. Review Section 8.2 and determine where the output is to be gen-erated. If output is to be on a floppy disk, review the fileswhich may already exist on the disk. If there is any material onf i l e OUTPUT that should not be wiped out, copy it to another f i l e ,or use a different print-output f i l e name. (File OUTPUT is the"default" f i l e for all print-output from the programs. LPT1 is thename submitted for direct output to the printer.10. If it desired to test just a few sample sets, consider placinga l i m i t on the number of sample sets or output lines.11. Review Section 10.0 for the methods of the interactive dataentry.
11.2 RUNNING THE PROGRAMS - STANDARD INTERACTIVE ENTRIES
The following standard entries are not all necessarily listed in the orderin which they occur during program execution.1. To execute any program, simply enter the name of the applicable reservesprogram to the right of the systems prompt (example "C:\>" and press return.2. A request w i l l be made as to whether a printout of the assay data on thecurrent intermediate UDAT f i l e is desired. This option should not be takenunless there is some question on the data and the user-operator wishes todetermine what data are on the intermediate file(s) being processed. When aconsiderable number of sample sets are involved, then it is wise to put al i m i t on the number of lines to be output. See Section 11.3 for additionalinformation on the contents of the intermediate data f i l e .3. A request w i l l be made for the name of the f i l e on which the output is tobe generated.
133
GENERAL PROCEDURES
If results are to be output d i r e c t l y on the printer, make sure that theprinter is on and that the paper is properly positioned at the top of afresh page; enter "LPT1" and press RETURN.
If results are to entered on the standard default f i l e "OUTCON", s i m p l ypress RETURN (do not enter any characters).
If results are to be entered on some f i l e other than OUTCON, check once moreto be sure the f i l e name is correct; if the output f i l e does not reside onthe default disk drive, make sure that the device name ("A:", "B:", etc.) isi ncluded.Enter the f i l e name, and press RETURN. An opportunity w i l l be provided tocheck the f i l e name and re-enter it, if desired.
k. A request w i l l be made for the name of the applicable UCON file. If theUCON control data are on the default f i l e "UCON", then simply press RETURN.If on some other f i l e , enter the f i l e name and press RETURN. Observe the de-vice name precautions. An opportunity w i l l be provided to check the f i l ename and re-enter it if desired.
5. Additional standard i n i t i a l requests w i l l be:-> Print-output control options for pagination, character width,and l i n e spacing. These are essentially as described for programURDAT in Section 8.6.2; any variations are self-explanatory. Forprograms RESUV and ORSAC, the only option is paper width; if lessthan Ik 1/2 inches, p r i n t i n g w i l l be compresed.
-> Detailed sample set summary l i s t i n g . The short summary l i s t sthe number of holes included, those rejected, the number excludedby edit, the number meeting cutoff, etc. The f u l l (detailed) sum-mary lists the actual sample set identification numbers for eachcategory.
-> Name of user or operator (up to 20 characters).
-> Date (up to 8 characters; the forms XX/XX/XX or XX-XX-XX arerecommended, but any characters are allowed).-> Title (RUN description) of up to 75 characters which w i l l beused on output headings.
-> Each program w i l l then have a series of requests for RUN pro-gram control and program parameters: these are are described underthe sections for the appropriate programs. When first running theprograms, it is wise to l i s t the prospective options and data en-tries on paper before executing.
11.3 CONTENTS OF THE INTERMEDIATE DATA FILE
In Section 8.5-2, the data elements and formats of the intermediate UDATf i l e s are described. When the option is taken to "dump" the data from anintermediate f i l e during an ore reserve RUN, the data from each sample set
134

GENERAL PROCEDURESare listed as shown in Figure 1 1 . 1 , which shows output fromsample set and a uranium-vanadium set.
a uranium-only
11.3.1 Intermediate Data Header OutputThe sample-set header data are dumped in three lines. Each variable is pre-ceded by an alphanumeric abbreviation which defines the record. These areexplained in Section 8.5-2.2 and w i l l not be repeated here. Most of the datahave been discussed in detail in Sections k.O through 6.0. The area,sample-set, and property codes (A#, H#, and P#) are placed within double as-terisks ("**") .Some data need further explanation, especiallyedits which may take place when running URDAT.
if they are affected by any
"DSM", the total depth sampled, is always the same as the o r i g i n a l value en-tered for "depth sampled" in either barren or non-barren gamma-log data. Ifthe o r i g i n a l data were non-gamma-log data, it is the depth to the bottom ofthe last sample interval. For any barren sample-set which o r i g i n a l l y did nothave any entry for depth sampled, it is set to zero. For non-barrengamma-log data which o r i g i n a l l y did not have an entry for "depth sampled",DSH is set to the bottom of the last (lowest) ;nterval, and then that valueis set to negative. Any DSM which is zero or negative is "undefined"."DPO" is always the depth from the o r i g i n a l collar elevation to the top ofthe first sample interval. For barren holes, it is set to zero."EL" is always the collar elevation of the sample set."PE" is always set to the elevation at the pit surface if a "depth-to-pi t-bottom" was o r i g i n a l l y entered in the sample-set data. If not, it is set to-9999 (undefined) ."El" is always i n i t i a l l y set to "EL" in URDAT. If a sample set is subjectedto a l i t h o l o g i e and/or elevation edit, El is reset to the top of the "edit-interval". The ed i t- i nterva! is that portion of the original sample setwhich remains after the edit is carried out. El is considered as the "work-ing" elevation of a sample set."E2" is always set to the elevation implied by EL andpositive. If DSM is undefined, then E2 is set to -9999
DSM, if the latter(also undefined).
s
Whenever a sample set subjected to a l i t h o l o g i e and/or elevation edit, E2 isset to the bottom of the edi t-i nterval if the latter is defined. If the bot-tom of the edit interval is undefined, then E2 is left (or set) to -9999."DPC" is o r i g i n a l l y set to DPO, but if a l i t h o l o g i e and/or elevation editcuts out any of the upper portion of the sample set, it is reset as thedepth from El to the top of the first sample of the edi t-i nterval ."IC2" always reflects the status of the sample following the most recentedit.
Note: When SCOR is run in the open pit mode, with no edits, theworking elevation of any sample set having a defined pit elevation
135
GENERAL PROCEDURESis automatically set to that pit elevation, and any sample inter-vals o r i g i n a l l y above that position are deleted.
11.3*2 Sample Interval and Lithologie DataSample interval data are listed horizontally and sequentially, from left toright. There are 6 intervals per lin e for uranium-only data, with each in-terval represented by depth and grade %U308. There are four intervals perline for uranium-vanadium data with each interval represented by thickness,grade %V205» and grade %U308.The actual grades are the same as those appearing in the URDAT output list-ing, but may sometimes appear to differ by 0.01 %U308 because of output rounding problems; they are only listed to the neares hundredth of one percent.Any lithologie codes and depths are also listed horizontally and sequen-t i a l l y from left to right.
136
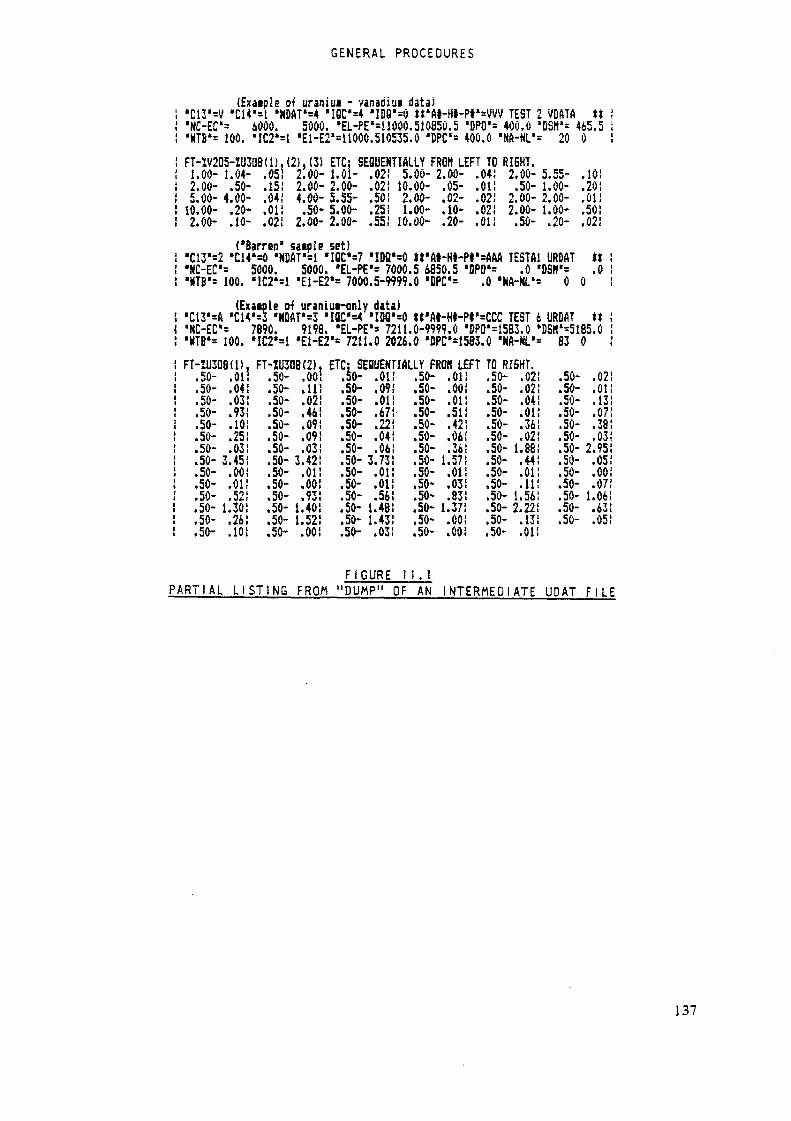
GENERAL PROCEDURES
(Exâiple of uraniut - vanadiui data)•C13'=V 'Ci*'«! *NDAT'=4 "IQC'M 'IDQ'=Ô «<flt-HI-PI»=Wy TEST 2 VDATA »•HC-EC's 6000. 5000. 'EL-PE'=i1000.510850.5 'DPO'= 400.Ô 'DSH'= 465.5•XTB'= 100. 'IC2*=t 'Ei-E2'=itOOO.510535.0 'DPC"= 400.0 'NA-NL'= 20 0FT-ÏV205-IU3QBU)1.00- t. 04-2.00- .50-5.00- 4.00-
10.00- .20-2.00- .10-
.051
.15!
.04!
.01!
.02!
(2), (3)2.00-2.00-4.00-.50-2.00-
ETC: SEQUENTIALLY FRO« LEFT TO1.01-2.00-5.55-5.00-2.00-
.021.021.50!.25!.55!
5.00-10.00-2.00-1.00-10.00-
2.00-.05-.02-.10-.20-
.041.01!.02!.02!.011
RI5HT.2.B2.2..
00-50-00-00-50-
5121
.55-.00-.00-.00-.20-
.10!.20!.01!.50!.021('Barren* saiple set)•C13'=2 'CM'sO 'NDAT"=l *IQC'=7 fIDQ§=0 «'A•HC-EC1« 5000. 5000. "EL-PE'= 7000.5 6850.5
•HTB'= 100. 'UB'sl 'E1-E2'« 7000.5-9999.0 'OPC'«
TESTAI URDATDPO'= .0 '&Slf=.0 'MA-«.1« 0 0tl.0
(Exaiple of uraniut-only data)cH'sS 'mr=z 'lac'M 'IUQ^O «»'«»-Ht-pt^ccc TEST 6 URDAT **7B9Û. 9198. 'EL-PE'= 7211.0-9999.0 'DPO ISBS.O •DSH1=5185.0•NC-£C'=•DTB'= 100. *IC2'=1 gEl-E2§= 7211.0 2026.0 'DPC'=!583.Û 'NA-«L'= 83 0FT-ÏU308(1),
.50- .011
.50- .04!
.50- .03!
.50- .93!
.50- .10!
.50- .25!
.50- .03!
.50- 3.45!
.50- .00!
.50- .01!
.50- .52!
.50- 1.30!
.50- .26!
.50- .10!
FT-IU308(2)..50- .00!.50- .11!.50- .02!.50- .461.50- .09!.50- .09!.50- .03!.50- 3.42!.50- .01!.50- .00!.50- .93!.50- 1.401.50- 1.521.50- .001
ETC; SEQUENTIALLY FROK LEFT.50- .011 .50- .01!.50- .091 .50- .001.50- .011 .50- .01!.50- .67! .50- .51!.50- .221 .50- .42!.50- .04! .50- .06!.50- .06!.50- 3.73!
.50- .36!
.50- 1.57!.50- .01! .50- .01!.50- .01! .50- .031.50- .561 .50- .831.50- 1.48! .50- 1.371.50- 1.431 .50- .001.50- .031 .50- .00!
TO RI5HT..50- .02!.50- .02!.50- .04!.50- .OU.50- .36!.50- .021.50- 1.88!.50- .44!.50- .01!.50- .11!.50- 1.56!.50- 2.22!.50- .13!.50- .01!
.50- .02!
.50- .01!
.50- .13!
.50- .07!
.50- .38!
.50- .03!
.50- 2.95!
.50- .05!
.50- .00!
.50- .07!
.50- 1.06!
.50- .63!
.50- .05!
FIGURE 1 1 . ]P A R T I A L L I S T I N G FROM "DUMP" OF AN INTERMEDIATE UDAT F I L E
137
PROGRAM RESUV
12.0 PROGRAM RESUV
12.1 GENERAL CONCEPTS AND OPERATIONS
Program RESUV (Reserves for Uranium and Vanadium) is designed to calculateuranium and, optionally, vanadium reserves for predetermined undergroundblocks. The blocks are first outlined as described in Section 7.1. Afterblocks, block areas, and associated UDAT intermediate data f i l e s have beendefined in the appropriate UCON f i l e (Section 7-0)• RESUV is then executedand all control parameters are read interactively.The parameters include: t i t l e of run, minimum m i n i n g thickness, minimumwaste thickness, uranium and vanadium d i l u t i o n grades, tonnage factor, thetype of cutoff option desired, and depending on this option, either uraniumgrade cutoff (s) or mineral value(s) and production cost (s) .RESUV then processes the sample data and calculates reserves for all blocks,one cutoff at a time. There may be up to seven cutoffs at which reserves arecalculated (for each block) depending on the control parameters submitted.The cutoffs are based on either arbitrary uranium grades or production costversus contained mineral value.For each cutoff, the procedures are as follows. Each sample set chosen bythe UCON controls for the given block is analyzed to determine the thicknessof "ore" represented by the set. "Ore" (Section 9-1) is defined as materialwhich w i l l need minimum thickness and cut- off requirements. Samples aregrouped into "preliminary" intervals which may consist of one or more sam-ples meeting grade cutoff requirements.If such zones do not meet minimum m i n i n g thickness requirements, then suffi-cient material is added (at the d i l u t i o n grades) to bring the interval up tominimum thickness, such zones are further tested against the cutoff and ifthey meet cutoff requirements, they are included as "ore"; otherwise theyare rejected. No additional d i l u t i o n is made.
Example: if grade cutoff, m i n i m u m m i n i n g thickness, and uraniumd i l u t i o n grade have been submitted as 0.20 %U308, 8 feet and 0.02%U308 respectively, an interval of 6 feet @ 0.25 hundredths wouldbe diluted to 8ft. @ 0.238 %U308 and would pass the cutoff test.An interval of k ft. @ 0.20%U308 would be diluted to 8 ft. @ 0.11%U308 and not be included as an ore interval.
138

PROGRAM RESUVAll ore zones defined in a given sample set are combined to obtain a totalthickness and average grade of ore represented by the set. When all samplesets for a given block have been processed at a given cutoff, the thicknessand average grade of that portion of the block which contains ore is determined by:
Tb = S{Ti}/N (i=l-N), andGb = S{TixGi}/S{Ti} (i = l-N)where,N = total number of sample sets containing ore zones,i = an i n d i v i d u a l sample set,S{Ti} = summation of thicknesses of all ore intervals,SfTixGi} = summation of grade x thickness of all ore intervals.Tb = average thickness of ore in the block,Gb = average grade of ore in the block.The "ore area" (AREAO) of the block is determined by:AREAO = AREAS x N/Nt
where,AREAB = the total block area,Nt = total number of sample sets in the block.
Total tons of ore (TNb) and total pounds of U30-8 (LBb) in the block are de-termined by:
TNb = Tb x AREAO / TF , and,LBb = TNb x Gb x 20.where,TF = the tonnage factor in cubic feet per ton.
The reserves and associated factors are (optionally) printed after reservesfor a given cutoff have been calculated for each block. When ali blocks havebeen processes for one cutoff, then the next cutoff is analysed. When allcutoffs have been analysed, a summary of reserves at each cutoff is printed.The reserves are considered in-place reserves with no d i l u t i o n except thatneeded to bring ore intervals uo to minimum m i n i n g thickness.
12.2 RESERVES-ANALYSIS-OPTIONS
There are four main options in running RESUV; these depend p r i m a r i l y ontype of cutoff desired. Option 3 is the same as option 2 except formethod of handling vanadium values. Option k is the same as Option 1 exceptthat vanadium is included in Option 4.
thethe
139
PROGRAM RESUV
12.2.1 Option 1Reserves are only calculated for uranium. The cutoff is an arbitrary uraniumgrade which is submitted as a program control parameter. Up to 7 cutoffgrades are permitted for one run. The grade may be entered to the nearestone thousandth of a percent U308.
12.2.2 Option 2Reserves are calculated for uranium and vanadium. The cutoff is determinedby a comparison of total production operating cost with the value of uraniumand vanadium represented by the samples, i.e. the cost (C = total cost perton) for producing a ton of ore versus the estimated combined value of ura-nium and vanadium in that ton. The latter is determined by:
Value (V) equals pounds per ton times value per pound, orV = ((Gu x Pu) -t- (Gv x Pv)) x 20.where,Gu = uranium grade,Pu = uranium price per pound U308,Gv = vanadium grade,Pv = vanadium price per pound U308.
(The factor 20. is used since grades are expressed as percentages).For any interval comprising one or more samples, V (Value per ton) is compared against C (cost per ton); if C is less than V, then the interval meetscutoff requirements. The production cost per ton and uranium and vanadiumprices (in dollars per pound) are submitted as program control parameters.
Note: In this option and Sections 12.2.3 and 12.2.A, a vanadiumd i l u t i o n grade is used in the same manner as the uranium d i l u t i o ngrade described in Section 12.1.
Up to 7 entries each may be made for cost, uranium price and vanadium price.However, all combinations of these parameters are run for each block and thetotal number of combinations may not exceed 50; i.e:
# costs x # U prices x # v prices cannot be greater than 50.If entries are made such that the number of combinations is greater than 50,the program w i l l automatically terminate with an appropriate message.
140

PROGRAM RESUV
12.2.2. J Calculât ion of Vanadium GrauesIn Option 2 vanadium grades are calculated as a function of the uraniumgrade. The function equation may be one of the two following forms.
V = a + bU + cU**2 + dl)**3, orLOGe(V) = a + b x LOGe (U)where,V = percent V205U = percent U308a,b,c, and d - appropriate coefficients.
The coefficients must be determined previously by statistical evaluation ofthe relationships between uranium and vanadium grades. The methods are moreor less the same as discussed for disequilibrium factors (Section 3-^) •
ents to be enteredIf Option 2 is selected, RESUV w i l l request the coefficiinteractively as part of the program control parameters.
12.2.3 Option 3Option 3 is exactly the same as Option 2, except that actual values forvanadium are used. Therefore, this option may only be run on sample datawhich includes vanadium assays, i.e. were o r i g i n a l l y entered in the contig-uous bimetal format (Section 6.0).In running this option, this program w i l l be terminated if assay sets areencountered which contain no vanadium entries.
12.2.4 Option kIn this option, reserves are calculated for both uranium and vanadium, butthe cutoff is based on an arbitrary uranium grade. Only the uranium cutoffgrade is used to determine ore zones; the vanadium reserves are calculatedfrom vanadium assays associated with the uranium grade which meet cutoff re-quirements. This option should also be run only if the sample set data con-tain vanadium assays.
12.3 RUNNING THE PROGRAM - INTERACTIVE INPUT REQUESTS
12.3.1 Standard I n i t i a l EntriesProgram Name: Enter "RESUV" to the right of the systems prompt; i.e.
"C:\> RESUV".Other standard entries are as described in Section 11.2.When RESUV is executed, the sequence of program-specific interactive entryrequests (denoted below by "->" ) i s as follows:
141
PROGRAM RESUV
12.3-2 For Al 1 Options
->Tit1e of Run; This is a t i t l e or run description of up to 75 charactersthat w i l l be used for output headings.
->Minimum M i n i n g Thickness; Section 9 - 1 - 3 ; up to three s i g n i f i c a n t d i g i t s ;to the nearest tenth of a foot; must be 1 foot or greater.
->ttinimum Waste Thickness; Section 9 - 1 - 7 - T ; up to three significant d i g i t s ;to the nearest tenth of a foot; must be 1 foot or greater.->Tonnage Factor; Section 9.1.1; up to 1» significant d i g i t s ; to the nearesthundredth of a cubic foot per ton; may not be 0.->Uranium D i l u t i o n Grade; Sections 9 - 1 - 8 - 1 and 12.1; up to 3 significantd i g i t s ; to the nearest one thousandth of a percent U308; may be 0, but notgreater than 0.20 %U308.->Reserve-Analysi s Option; Section 12.2; enter 1,2,3 or k; may not be 0.
12.3-3 Options Depending On Reserve-TypeThe following requests w i l l depend on the Reserves-Analysis option chosen(just above, and Section 12.2)
12.3.3. 1 Option 1->Number of Uranium Cutoff Grades; Section 12.2.1; may be up to J.->List of Cutoff Grades; entries for the number of grades entered above; upto k s i g n i f i c a n t d i g i t s ; to the nearest one thousandth of a percent U308; no0 entries.
12.3-3-2 Option 2->Number of Production Costs to be Evaluated; Section 12.2.2; up to ?•->List Production Costs; Section 12.2.2; may be up to 7 total productioncosts; number of values w i l l depend on previous entry; up to 5 s i g n i f i c a n td i g i t s ; to the nearest one hundredth of a dollar; no 0 entries.->Number of Uranium Prices to be Evaluated; Section 12.2.2; may be to 7-->List of Uranium Prices; Section 12.2.2; may be up to 7 uranium prices;number of values w i l l depend on previous entry; up to 5 s i g n i f i c a n t d i g i t s ;to the nearest one hundredth of a dollar; no 0 entries.->Number of vanadium prices to be Evaluated; Section 12.2.2; may be to J.->List of Vanadium Prices; Section 12.2.2; may be up to 7 prices; number ofvalues w i l l depend on previous entry; up to 5 s i g n i f i c a n t d i g i t s ; to thenearest one hundredth of a dollar; no 0 entries.->Type of Vanadium Ratio Equation. Section 12.2.2.1; enter 1 for polynomialand 2 for exponential.
142
PROGRAM RESUV
->Coefficients for Vanadium Ratio Equation. Section 12.2.2.1; enter cooefficient as indicated. If coefficients are zero, enter 0.
12.3-3-3 Option 3The entries w i l l be exactly as for Option 2 except no request w i l l be madefor vanadium ratio coefficients.
12.3.3.b Option 4The entries w i l l be exactly as for Option 1.
12.3-^ Vanadium D i l u t i o n GradeIf Options 2, 3« or k are chosen there w i l l be the entry:->Vanadium Di l u t i o n Grade; Note - Section 2.2.2; up to 3 s i g n i f i c a n t d i g i t s ;to the nearest one thousandth of a percent LJ308; may be 0, but not greaterthan 0.50 %V205.
12.3-5 Output Options->; Enter 0 for bl ock-by-block and Summary results, or 1 for summary re-
sults onl y .
Figures 12.1 and 12.2 illustrate examples of the output from RESUV.
143
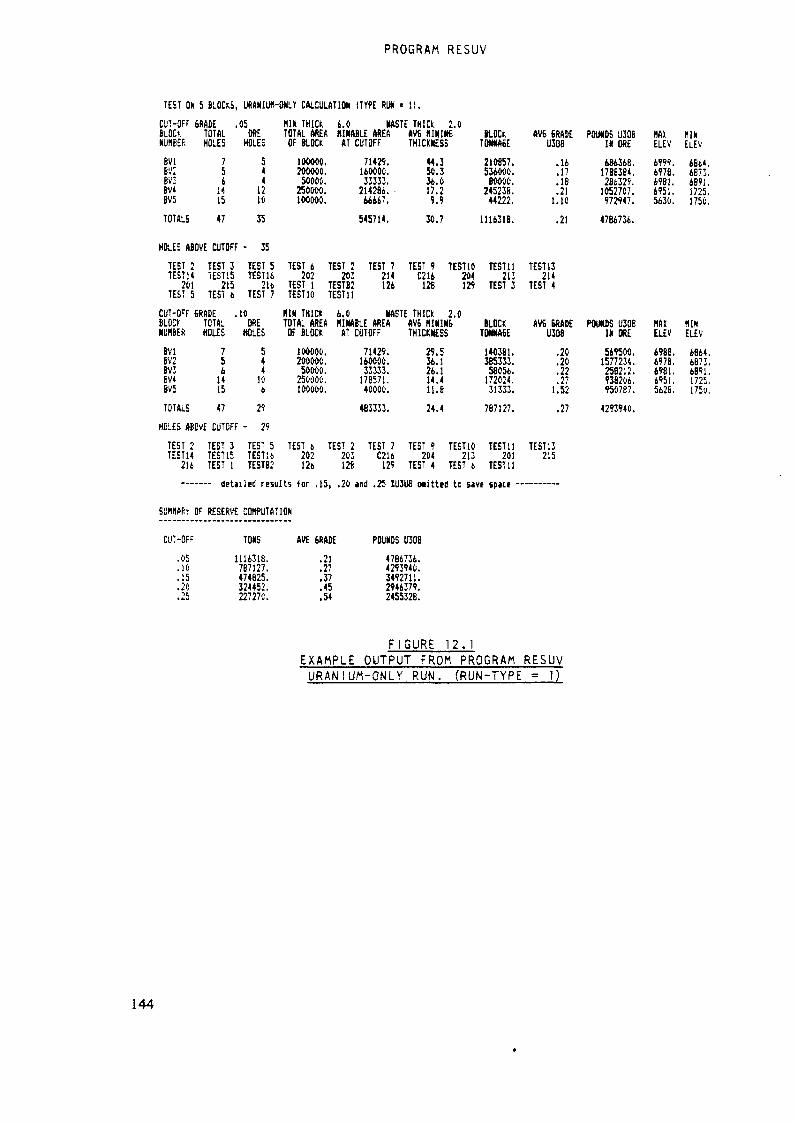
PROGRAM RESUV
TEST Ok 5 BLOCKS, URANIUtl-WLY CALCULATION (TYPE RUM = II.
CUT-OFF BRADE .osBLOC* TOTAL ORENUMBER HOLES HOLESBV1BV:BV3BV4BV5TOTALS
756H1547
54412It35
HIN THICH 6.0 »ASTE THICK 2.0TOTAL AREA HI KABLE AREA AYS HIKIKtOF BLOCK AT CUTOFF THICKNESS10000«.20000Û.50000.250000.100000.
714».140000.33333.214286.44667.545714.
M.350.336.017.21.130.7
ILOCKTONKA6E210857.534000.BOOOO.245236.44222.111631B.
e 6RADEU306.U.17.18.211.10.21
POUNDS U308IK m484368.17B83B4.2B632Î.1052707.972947.4784734.
«Ai flikELEV ELEV4999, 6864.6976, 4873,4981. 4891.4951. 1725.5430, 175C.
HOLES ABO« CUTOFF - 35TEST 2TEST! 4201TEST 5
CUT-OFFBLOWNIMBESBV1BV2BV3BV46V5
TEST 3TEST15215TEST t>GRADETOTALHOLES
7561415
TEST 5TEST16216TEST 7.10OREHOLES
5441C6
TEST 6 TEST 2 TEST 7202 203 214TEST 1 TESTB2 126TEST10 TEST1ÏKIN THICtTOTAL AREAOF BLOCK
100000.200000.50000.250ÛOO.100000.
TEST 9 TESTIO TEST11C216 204 213128 129 TEST 3TEST13214TEST 4
6.0 KASTE THICK 2.0HINABLE AREAAT CUTOFF71429.160000.33333.178571.40000.
AVS flININSTHICKNESS29.536.126.114.4U. B
BLOCKTONNABE140361.385333.58056.172024,31333.
AVE 6RADEU308.20.20.22.271.52
POUNDS U308I« ORE569500.157723«.258212.938206.950787.
HAIELEV6988.6978.6981.6951,5628.
KINELEV6864.6873.6891.1725.1750,
TOTALS 47 29HOLES ABOVE CUTOFF - 25
483333. 24.4 787127. .27 4293940.
TEST 2 TEST 3TEST14 TEST15216 TEST 1TEST 5TEST!*TESTB2
TEST 6202 TEST 2203128TEST 7C216129
TEST 9204TEST 4TESTIO TEST 11213 201TEST 6 TEST 11
TEST 13215
detnled results tor .15, .20 and .25 IU3U8 Kitted tc save space
SUHhftRr OF RESERVE COWUTATION
CUT-OFF
.05
.10
.15
.20
TONS
1116318.787127.474825.324452.227270.
AVE SRADE
.21
.27
.37
.45
.54
POUNDS U308
4786736.4293940.3492711.2946379.2455328.
F IGURE 1 2 . 1EXAMPLE OUTPUT FROM PROGRAM RESUV
URANIUM-ONLY RUN. (RUN-TYPE = 1)
144
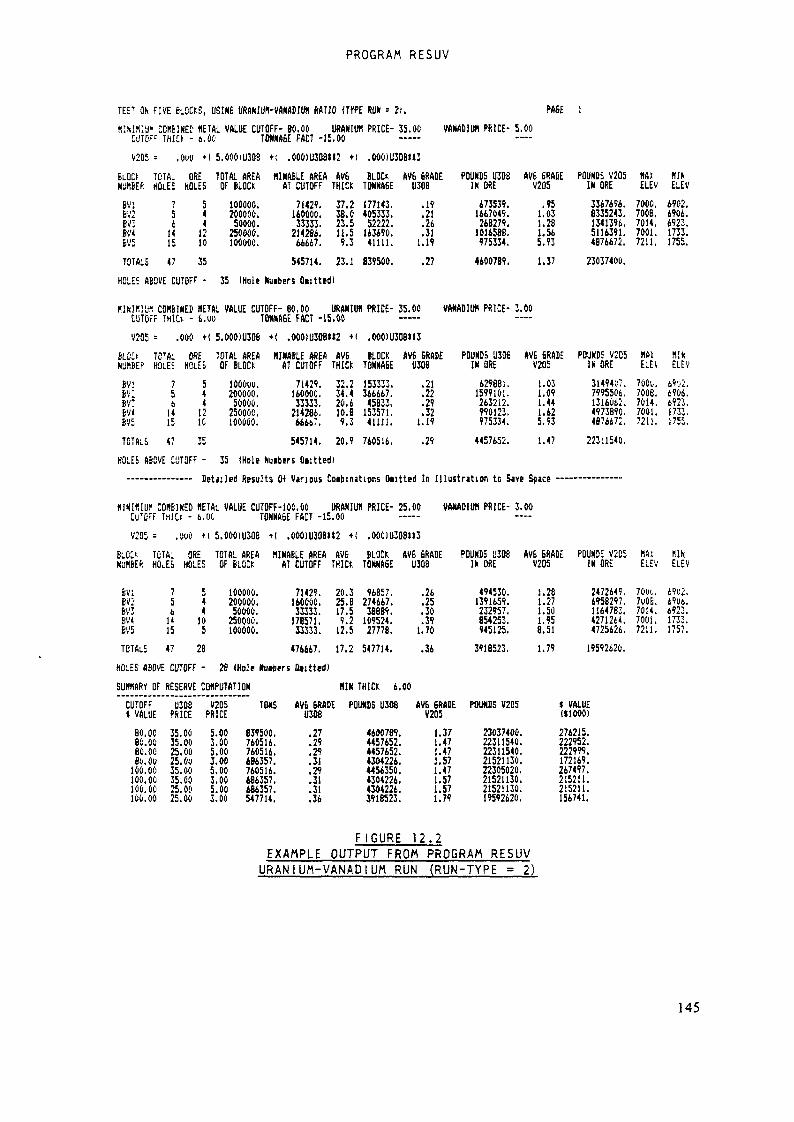
PROGRAM RESUV
TEtT ON FIVE BLOCKS, USINE URANIiffl-VANADIl» RATIO (WE m - 2l.
CCKBIHEÎ «ETAL VALUE CUTOFF- 80.00 URANIUM PRICE- 35.00 VANADIUM PRICE- 5.00
PA6E !
V205
BLOCtNifflBER
BV;BV:BV3B'/4BV5
: ,
TOTA.HOLES
1
56
1415
OW + 1
OREHOLES
544
1210
5.000IU308
TOTAL AREAOF BLOCK
100000.200000.50000.
25000Û.100000.
.OOÛ1U308H2 *( .OÛOIU30BH3
TOTALS 47 35HOLES ABOVE CUTOFF - 35
(UNABLE AREA AV6AT CUTOFF THICK71429.140000.33333.214284.66667.
37.238. 023.511.59.3
BLOCK AVS 6RADETONNA6E U308177143.405333.52222.14349«.41111.
545714, 23.1 839500.(Hole Nuibers On t ted I
.19.21.26.311.19
.27
POUNDS U308IN ORE473539.1667049.268279.1014588.975334.4600789.
AVS 6RA0EV2D5.951.031.281.565.931.37
POUNCE V2Û5IN ORE3367696.8335243.1341396.5116391.487667Î.23037400.
«AtELEV ELEV7000. 4902.7008. 6906.7014, 6923.7001, 1733.7211. 1755,
«1KIHÎUK COMBINED HETAL VALUE CUTOFF- 80,00 URANIUM PRICE- 35.00CUTOFF THlO - 6.UU TONNA6E FACT -15.00 —— -V205 = .000 +( 5.0001U306 +( .000)U308»*2 +( .OOOIU308U3
VANADIUM PRICE- 3.00
BLOC»NWfBEPB1,1:BV:BV:BV<8V5
TC'ALHOLES7561415
TOTALS 4?
OREHOLES5441210
35
TOTAL AREAOF BLOCKlOOOuu.200000.50000.250000.100000.
«NABLE AREA AVSAT CUTOFF THICK71429.160000,33333.214286.66667,
32.234.420.610.89.3
BLOCKTONNASE153333.366667.45B33.153571.4H11.
545714. 20.9 760516,
AVS BRADEU30B
.21.22.29.321.19
.29
POUNDS U306IN ORE629881.1599101.263212.990123.975334.4457652.
AVS 6RADEV2051.031.091.441.625.931.47
HOLES ABOVE CUTOFF - 35 (Hole Nuibers Gutted)——————— Detailed Results W Various Coibinitions tatted In Illustration to Save Space
POUNDS V205IN ORE31494U7.7995506.1316062.4973890.4876672.223:1540.
MAIELE',7001.7008.7014.7001.7211.
HINELEV
6906.6923.1733.J755.
KlNIKIUf COH6INED «ETAL VALUE CUTOFF-100.00 URANIUH PRICE- 25.00 VANADIUM PRICE- 3.00ClTOFF T«!Ct - 6.00 TONNA6E FACT -15.00V205 = .'MO +( 5.0001U308 +( .000)U308U2 +! .000103081*3
SLUCk TOTAL ORE TOTAL AREANtîKBEft HO^ES HOLES OF BLOCK NINABLE AfiEfi AVS BLOCK AVS 6RADE POUNDS U306 AVS BRADEAT CUTOFF THICK TONNA6E U308 IN ORE V205 POUNDS V205IN ORE hftsELEV «IKELEV
BVlmBV3BV<BV5
7561415
TOTALS 47
54410528
100000.200000.50000.25000Û.100000.
71429.140000.33333.178571.Î3333.
20.325.B17.59.212.5
96857.274667.38889.109524.27778.476667. 17.2 547714.
.26.25.30.391.70
.36HOLES ABOVE CUTOFF - 28 (Hole Nuibers Dtitted)SUMIARY OF RESERVE COMPUTATIONCUTOFF« VALUE80. OC80.0080. OCBy. Ou100.00100.00100,00100.00
U3D8PRICE35.0035.0025.0025.0V35.0035.0025.0025.00
V205PRICE5.003.005.003.005.003.005.003.00
TONS
839500.760516.760516.486357.740516.486357.486357.547714.
AVS BRADEU30B.27.29.29.31.29.31.31.36
HIN THICK 6.00POUNDS U30S
4400789.4457652.4457652.4304226.4456350.4304226.4304226.3918523.
AVE BRADEV2051.371.471.471.571.471.571.571.79
494530. 1.26 247264Ç. 70%. 69«2.1391659. 1.27 6958297. 7uOE. 69ut.232957. 1.50 1164783. 7014. 6923.854253, 1.95 4271264. 7001. 1733.945125. 8.51 4725626. 7211. 1757.3918523. 1.79 19592620.
POUNDS V205 « VALUE(11000)2Î037400. 274215.22311540. 222952.22311540. 222999.21521130. 172169.22305020. 267497.21521130. 215211.21521130. 215211.19592620. 156741.
FIGURE 12.2EXAMPLE OUTPUT FROM PROGRAM RESUV
URANIUM-VANADIUM RUN (RUN-TYPE = 2)
145
PROGRAM ORSAC
13.0 PROGRAM ORS AC
13.1 GENERAL CONCEPTS AND OPERATIONS
Program ORSAC (Uranium Ore Reserve Estimation by Standard Methods and Com-puter) is designed to calculate uranium ore reserves for predeterminedblocks using a throretical statistical model. Each block consists of a totalvolume defined by an assigned area and the average of the total thickness ofmineralized material in each sample set. The mineralized material is definedby an i n i t i a l minimum grade cutoff (usually 0.01%U308). The grade of mate-r i a l w i t h i n the total volume are "fit" to a log on normal distribution andthe fractional tons and average grade of material in the block available atcutoffs of 0.01 %U3U8 to 0.60 %U308 are calculated. A detailed descriptionof the theoretical concepts of the ORSAC method is available from RME-183(Section 1.2) .The blocks are first outlined as described in section 7-1 and then a UCONf i l e (Section 7-0) must be prepared to identify the block area and the ap-propriate sample data to be processed for each block.Review Section 11.0 before running the program.Since the results from ORSAC are most r e l i a b l e if the total sample popu-lation of a deposit is included in a block, it is best not to truncate lowgrade portions of a deposit or to break up continuous portions of a depositin defining the blocks. However, if the total deposit is actually comprisedof several smaller integral mineralized entities, each such entity should beanalyzed separately.ORSAC has proven especially effective in obtaining reserve estimates whererelatively sparse sample data are available and/or if sample points are farapart. It generally provides better results in analyses for underground de-posits than for deposits which w i l l be mined by open pit methods, p r i m a r i l ybecause of the lesser mimimum m i n i n g (combining) thickness required, andalso, possibly, because the o r i g i n a l d i s t r i b u t i o n of mineral values in shal-low deposits has been altered by considerable remobi l izati on.In addition to the "standard i n i t i a l parameters" Section 11.2), the programinput parameters include "combining" thickness, i n i t i a l m i n i m u m cutoffgrade, tonnage factor, and, optionally, an additive constant "ALPHA1" (Sec-tion 16.0) used in the statistical analysis. There are several ways of com-b i n i n g the sample data (Section 1 3 - 3 - 1 ) . and several output options areprovided (Section 13-3-2).For each block, ORSAC processes all the sample sets provided by UCON, com-bines consecutive samples in each set into an interval of m i n i m u m m i n i n gthickness, and determines the average grade of that interval. If the averagegrade is equal or greater than the assigned i n i t i a l cutoff grade, the inter-val is considered as part of the representative sample population of thetotal volume of material and is saved; otherwise it is rejected. If the lastinterval graded is less than the minimum m i n i n g thickness, it is expanded tothe minimum thickness by combining with zero grade material. The total
146
th i cknesslated.
PROGRAM ORSAC
of material above cutoff represented by the sample set is calcu-
When all sample sets in the block have been processed, the average grades ofall intervals that have met cutoff become the elements of the sample popu-lation on which all statistical analysis w i l l be performed. Figure 1 3 - 1 is al i s t i n g of the combined intervals.These grades are arranged into ascending order and the 10th, 50th, and 90thpercent!les are calculated (Note: this differs from the discussion in Sec-tion 16) which refers to the 20th, 50th, and 80th percentiles.).The additive constant ALPHA is calculated for the transformation:
X = LOGe(z + A) (Section 16) .The calculation should be such that the value of ALPHA should be equal to orgreater than zero. Negative skewness of the assay data may sometimes causeALPHA to be computed as a negative value. Therefore, an option is providedto enter a program parameter — ALPHA1 - (Section 13-2.3) which w i l l be sub-stituted for ALPHA if a negative value for ALPHA is computed. If no value issubmitted for ALPHA1 and ALPHA is negative, ALPHA is set to zero.The arithmetic mean,cal culated.
standard elevation, variance, skewness and kurtosis are
The grades are then converted to the l o g a r i t h m i c (to the base e) values by:Gl = LOGe(G+A)where,G = or i g i nal grade,A = additional constant ALPHA (or ALPHA1),Gl = logarithm of the o r i g i n a l grade.
The statistical parameters of the logarithmic values (mean, standard direc-tion, variance, etc) are determined and a chi-square test is applied to theconverted grades to determine their goodness-of-fi t to a log normaldestribution (i.e. a normal distribution of the logarithmic values).Sichels t-estimator of the mean is determined and the "fractional" tonnageand average grade at cutoffs from 0.01 to 0.60% U308 are calculated and op-t i o n a l l y printed. The statistical parameters of the arithmetic andlog-normal ^distributions are printed as well as the results of thechi-square test. Figure 13-2 shows an example of the chi-square test re-sults.The "actual" estimated tons and average grade at each cutoff are then calcu-lated and printed; an example is shown on Figure 1 3 - 3 -When the last block has been processed, a summary of estimated reserves forall blocks in the given run are presented at cutoffs of 0.01 to 0.60 percentU308.
147

PROGRAM ORSAC
13.2 PROGRAM INPUT PARAMETERS
13.2.1 Combining Thickness
The combining thickness chosen for a run should approximate the minimum min-ing thickness anticipated in m i n i n g operations. It may be from 2 to 50 feet,to the nearest tenth of a foot.
13.2.2 Minimum Grade Cutoff
This cutoff determines the minimum average grade at which combined intervalsw i l l be accepted into the sample population. It should not be confused withthe m i n i n g grade cutoffs used in the RESUV and SCOR programs. The results ofthe ORSAC program provide the amount of material a v a i l a b l e at various m i n i n gcutoff grades.The minimum grade cutoff may be from 0.005 to 0.20 percent U308 or V205. Ifthe sample data are not truncated, best results are obtained at around 0.01or 0.02 percent U308 or V205- For both uranium and uranium, some experiencemust be gained in evaluating a deposit using ORSAC. Evaluation of the"goodness-of-fit" of the chi-square test for varying parameters is neces-sary .
13.2.3 Tonnage FactorThe tonnage factor is entered in cubic feet per ton, to the nearest one hun-dredth of a cubic foot.
13.2.14 ALPHA1 Constant
If an entry is made for the alpha constant (Section 1 3 - 1 ) . it w i l l be used,providing the value for ALPHA determined in the program is negative. If noentry is made, it w i l l be determined in the program>
13.3 OPTIONS
13.3.1 Program Run OptionsThe program provides four options for establishing the intervals of "com-bined" assays which w i l l comprise the sample population on which the statis-tical analyses w i l l be performed. The relative merits of these options isdiscussed below.
7J.J. 7.7 Option 1: uranium, Combined Intervals at Equal ThicknessAll uranium samples of each sample set are combined into intervals, thethickness of which are established by the "combining thickness".
if the sample data represent equal sample intervals or the intervals aresufficiently small that they may be combined into larger intervals without
148
PROGRAM ORSAC
"splitting" samples, then the results of the analyses w i l l be s t a t i s t i c a l l y"pure", i.e. w i l l conform to the theoretical model as it was o r i g i n a l l y de-rived, incremental equal readings from gamma-log data, therefore, providethe best sample assay types with which to run the ORSAC program. Uraniumassay data consisting of unequal sample intervals may be analyzed by ORSACbut the results cannaot be considered statistically "valid". If the sampleintervals are equal but at thicnesses of, say, k feet, then the combiningthickness should be an even multple of the the sample interval thickness,i.e. k, 8, 12 (etc.) feet.
13-3- 1'2 Option 2: Uranium, Total Sample Interval Above Minimum CutoffAll samples of a sample set are combined into one interval. Any contiguousintervals, having thickness equal to or greater than the combining intervaland averaging less than the minimum grade cutoff, are deleted. The "grade xthickness" products of the total sample intervals become the elements of theORSAC sample population. The avearage thickness of the combined intervals isused as the average thickness of the depositThis option provides a means of using ORSAC with sample data which are atintervals of uneven thicknesses. The results provide a good estimate of theaverage grade and thickness of the entire deposit, but do not equate themineral distribution to the method by which the deposit w i l l be mined. It istherefore most useful for evaluating deposits which are either "massive" orrelatively uniform in thickness, but w i l l not accurately represent the even-tual extraction of ore from thinly-bedded deposits of varying thickness.
13'3'1'3 Option J: Vanadium, Combined Intervals at Equal ThicknessThis option is the same as Option 1 (above), but uses vanadium assays. Itmay only be used, of course, if vanadium sample data are present in the ap-p l i c a b l e sample data file(s). If the sample data represents equal sample in-tervals, and the combining thickness is as stipulated under Option 1, thenthe results may be considered v a l i d .
fJ.J.f.4 Option 4: Vanadium, Total Sample Interval Above Minimum CutoffThis option is the same as Option 2 (above), but uses vanadium assays, ifpresent in the applicable samp! assay data file(s).
13.3.2 Program Output OptionsThere are five output options. These are listed below in hierachy of ascend-ing operation, i.e. whichever option is chosen, all the higher (but notlower) options w i l l automatically take effect.
13'3-2. ! Option 1: Output of Combined AssaysAll the combined intervals used in the sample population w i l l be listed foreach block processed.
149
PROGRAM ORSAC
13-3-2.2 Option 2: Output Fractional TonnageThe percent of total tons ava i l a b l e at each m i n i n g grade cutoff w i l l belisted for each block.
13-3-2.3 Option j: Output of Statistical Parameters and Chi-Square TestThe statistical parameters for both arithmetic and log-normal d i s t r i b u t i o n"fits" w i l l be listed for each block.
13.3.2.4 Opt/on 4: Output of Tons and Average GradeThe estimated tons (and average grade) available at each m i n i n g grade cutoff(from 0.01 to 0.60%U308/V205 w i l l be listed for each block.
13-3-2.5 Option 5-' Summary For AI! BlocksThe total combined estimated tons (and average grade) for all blocks w i l l belisted. If there is only one block, and Option 4 is also in effect, thissummary is not neccessary and w i l l be automatically deleted
13.A RUNNING THE PROGRAM - INTERACTIVE EKTRY
13.4.1 Standard I n i t i a l EntriesStandard entries are as described in Section 1 1 . 2 ,
13-^-2 Program Control Entries
13-4.2.1 ->Reserves Analysis OptionSection 13.3.1; enter "1", "2", "3", or "4" depending on which of the corre-sponding options described in Section 1 3 - 3 - 1 is desired. Do not requestoptions 3 or k if the data on the intermediate data file(s), specified inthe appropriate UCON f i l e , do not contain vanadium sample assay data!
13.4.2.2 -> Combining ThicknessSection 1 3 - 2 . 1 ; enter the thickness of the interval into which sample w i l lbe combined; up to 3 sig n i f i c a n t d i g i t s ; to the nearest tenth of a foot; maynot be 0.
13-4.2.3 ~> Minimum Cutoff GradeSection 13.2.2; enter the minimum grade at which combined intervals w i l l beaccepted; up to 3 s i g n i f i c a n t d i g i t s ; to the nearest thousandth of one percent U308; may be 0, but 0.01 generally gives better results.
J3.4.2.4 -> Tonnage FactorSection 13-2.3; enter the tonnage factor; up to 3 sgnificant d i g i t s ; to thenearest hundredth of a cubic foot per ton; between 5 and 60 cu. ft. per ton.
150

PROGRAM ORSAC
13.b.2.5 -> Additive ConstantSection 13-2.4; enter the "ALPHA" constant; up to 2 s i g n i f i c a n t d i g i t s ; tothe nearest thousandth of one percent U308; may be 0.
J3.4.2.6 -> Output OptionSection 13-3.2; enter "1", "2", "3", "4", or
151

PROGRAM O R S A C
ORSAC STATISTICAL ANALYSIS EASED ON COMPOSITED URftKIUH ASSAY VALUES.
CUTOFF 8. FEET OF .V iOTOTAL FQQTAbE OF SAftPLES ABOVE CUTOFF 1&64.0
AVERA6E THICKNESS 46.22TOTflL AREA 20000ÔO.
TONNAGE FACTOR 15.0*W SUMMARY OF HOLE STATISTICS ««It
TOTAL NUMBER OF HOLES PROCESSED FOR RUN/BLOCK = 4?;OF THESE:
27 HAD INTERVALS ABOVE MINIMUM CUTOFF BRADE.202 203 214 C216 TEST 2 TEST 3 TEST 5 TEST 6 TEST 7 TEST 8TEST 9 TEST10 TEST1! TEST13 TEST14 TEST15 TEST16 TEST 1 TEST 2 ÏESTB2TEST 3 TEST 4 TEST 5 TEST 6 TEST 7 TEST10 TESTll
9 HAD INTERVflLS ; «IN. CUTOFF. SOME ASSAYS DELETED BY EDIT.2(»4 213 214 201 215 216 126 126 12910 COMPLTELY "BARREN", [NO ASSAYS REPORTED FOR HOLE].A216 I3t> 137 139 TEST 1 TEST 4 TESTlI TESU7 TESTAI TEST 91 HAD ASSAYS. 6UT INTERVAL DEFINED BY EDIT SPECS HAS BARREN.138
ARITHMETIC ESTldflTORS- COUNT MEAN20Y .159
.010 .010
.018 .018
.023 .025.029 .029,034 .034.039 .039.046 .047.054 .054.059 .059.065 .066.075 .075.062 .082.102 .103.111 .113.126 .130.136 .136.155 .156.175 .176.207 .217.242 .242.378 .414
STD. DEV. VARIANCE SKEKNESS ü.URTÜSIS.5563 .3080 12,7689 175.B251
.010,019.025.029.035.039.047.054.059.069.076.083.103.113.131.137.160.178.217.245.454
PCT lu.023
PC T 50.077 .236
ALPHA. 0«5
ORDERED ASSAY DATflOH'019025030035iï79Ô4B05506007007606610411613213616«17*219253809
.014
.019.025
.031.036
.03".049
.056.061.070.077.097
.106
.119.132.140.165.161.220
.295.B09
.014
.019
.025
.031.036.039.05u
.056.061
.07U.079
.100.108.120.132.140.166
.183.222.295.929
.015.019.026
.031.036.040.051
.056.063
.071.079
.100
.110
.121.133
.142.169
.184.233
.2971.132
.017
.021;.026.032.036.040.052.058.063.071.08«.101.llu
.121.133.145.174.195.236.3051.133
.017
.022.026.032.038. 04U.053.058
.064
.071.081.102
.110.122.133.151.174.195.239
.3187.841
.018
.022
.028
.033
.039
.04'.'
.053
.056
.064,075.081.102.110.123.133.154.174.199.239
7T7
F I G U R E 13.1EXAMPLE OF RESULTS OF ORSAC RUN ON 1 BLOCK
I N I T I A L SUMMARY AND ORDERED COMBINED INTERVALS
152
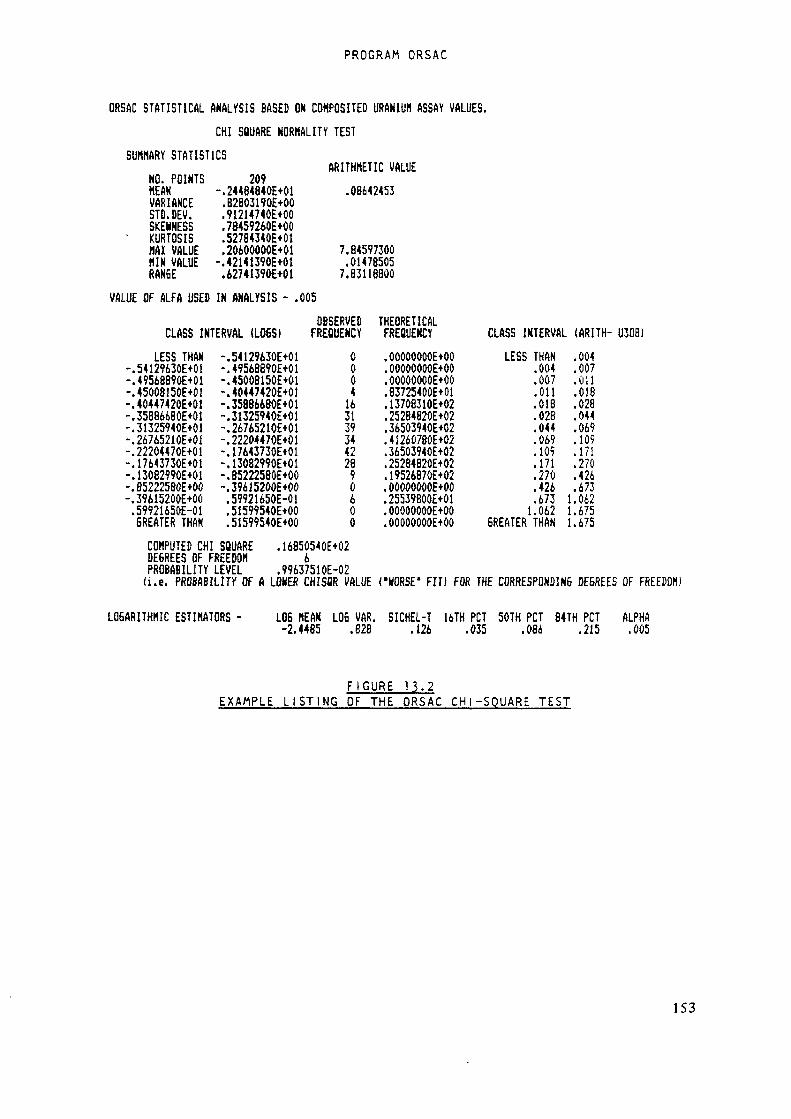
PROGRAM ORSAC
ORSAC STATISTICAL ANALYSIS BASED OK COHPOSITED URANIUM ASSAY VALUES.CHI SQUARE NORMALITY TEST
SUMMARY STATISTICSNO. POINTSttEAKVARIANCESTD.DEV.SKENNESSKURTQSIS«AX VALUEHIN VALUERANGE
209-.24484840E+01.B2803190E+00.91214740E+00.78459260E+00.52784340E+01.2Û600000E+01-.42141390E+01.62741390E+01
ARITHMETIC VALUE.08642453
7.84597300.014785057.83118800VALUE OF ALFA USED IN ANALYSIS - .005
CLASS INTERVAL (LOGS)LESS THAN.54129630E+01.49568890E+01.45008!50E+0!.40447420E+Ô1.35886680E+Û1.31325940E+01.2676521OE+Oi.22204470E+01.17643730E+01.13082990E+Û1.85222580E+00.39615200E+OÛ.59921650E-01GREATER THAN
-.54129630E+01-.4956B890E+01-.4500B150E+01-.40447420E+01-.35886680E+01-.31325940E+01-.26765210E+01-.22204470E+01-.17643730E+01-.13082990E+01-.85222580E+00-.39615200E+OÔ.59921650E-01.51599540E+00.51599540E+00
OBSERVEDFREQUENCY000416313934422890600
THEORETICALFREQUENCY.OOOOOOOOE+OÛ.OOOOOOOOE+00.OOÔÛOOOÛE+ÛÔ.83725400E+01.13708310E+02.25284820E+02.36503940E+02.4126078ÔE+02.36503940E+02.25284820E+02.19526870E+02.OOOOÛOOOE+OÛ.25539BÔOE+Ô1.OOOOOOOOE+00.ÔOOÔOÛÔÛE+ÔO
CLASS INTERVAL (ARIÏH- U308)LESS THAN.004.007,011.018.028.044.069
.105.171.270.426.6731.062
.004.007.011.018.028.044.069.109.171.270.426.6731.0621.675GREATER THAN 1.675COMPUTED CHI SQUARE .16850540E+02DEGREES OF FREEDOM 6PROBABILITY LEVEL .99637510E-02(i.e. PROBABILITY OF A LOKER CHISOR VALUE ('HORSE' FIT) FOR THE CORRESPONDIN6 DEGREES OF FREEDOM)
LOGARITHMIC ESTIMATORS - LOB MEAN LOG VAR. SICHEL-T 16TH PCT 50TH PCT 84TH PCT ALPHA-2.4485 .828 .126 .035 .086 .215 .005
FIGURE 13.2EXAMPLE LISTING OF THE ORSAC CHI-SQUARE TEST
153
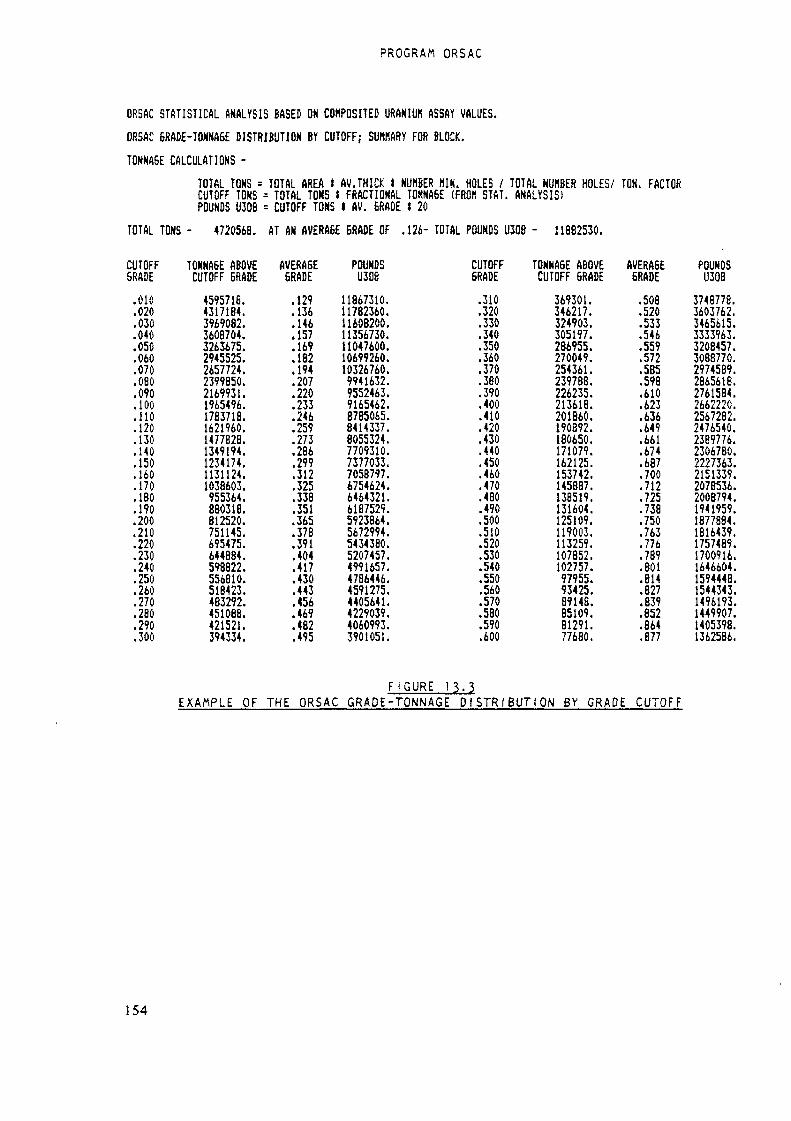
PROGRAM ORSAC
ORSftC STATISTICAL ANALYSIS BASED ON COMPOSITED URANIUM ASSAY VALUES.ORSAC 6RADE-TONNA6E DISTRIBUTION BY CUTOFF; SUKMARY FOR BLOCK.TONNAGE CALCULATIONS -
TOTAL TONS = TOTAL AREA J AV.THICK » NUMBER HIN. HOLES / TOTAL NUMBER HOLES/ TON. FACTORCUTOFF TONS = TOTAL TOUS < FRACTIONAL TONNA6E (FROM STAT. ANALYSIS)POUNDS U308 = CUTOFF TONS I AV. 6RADE t 2ÛTOTAL TONS - 4720568. AT AN AVERAGE BRADE OF .124- TOTAL POUNDS U3ÛB - 11B82530.
CUTOFFBRADE.010.020.030.040.050.060.070.080.090.100.110.120.130.140.150.160.170.180.190.200.210.220.230.240.250.260.270.280.290.300
TONNA6E ABOVECUTOFF BRADE4595718.4317184.3969082.3608704.3263675.2945525.2657724.2399850.2169931.1965496.1783718.1621960.1477828.1349194.1234174.1131124.1038603.955364.680318.812520.751145.695475.644884.598822.556810.518423.483292.451088.421521.394334.
AVERA6EBRADE.129.136.146.157.169.182.194.207.220.233.246.259.273.286.299.312.325.338.351.365.378.391.404.417.430.443.456.469.482.495
POUNDSU30811867310.11782360.11608200.11356730.11047600.10699260.10326760.9941632.9552463.9165462.8785065.8414337.8055324.7709310.7377033.7058797.6754624.6464321.6187529.5923864.5672994.5434380.5207457.4991657.4786446.4591275.4405641.4229039.4060993.3901051.
F I G U R E
CUTOFFBRADE.310.320.330.340.350.360.370.380.390.400.410.420.430.440.450.460.470.480.490.500.510.520.530.540.550.560.570.580.590.600
1 J-?
TONNABE ABOVECUTOFF BRADE369301.346217.324903.305197.286955.270049.254361.239788.226235.213618.201860.190892.180650.171079.162125.153742.145887.138519.131604.125109.119003.113259.107852.102757.97955.93425.89148.85109.81291.77680.
AVERABEBRADE.508.520.533.546.559.572.585.598.610.623.636.649.661.674.687.700.712.725.738.750.763.776.789.801.814.827.839.852.864.877
POUNDSU3083748778.3603762.3465615.3333963.3208457.3088770.2974589.2865618.2761584.2662220.2567282.2476540.2389776.2306780.2227363.2151339.2078536.2008794.1941959.1877884.1816439.1757489.1700916.1646604.1594448.1544343.1496193.1449907.1405398.1362586.
EXAMPLE OF THE ORSAC GRADE-TONNAGE DISTRIBUTION BY GRADE CUTOFF
154
URAD ORE RESERVE SYSTEM
14.0 PROBRAH SCOR
14.1 CONCEPTS AND GENERAL OPERATIONS
Program SCOR (System for Calculating Ore Reserves) is designed to calculateopen pit or underground uranium reserves for predetermined blocks, using thegeneral outline method. Two types of reserve calculations are made. One isbased on the strict analysis of ore intervals defined by cutoffs (Sections14.2.1 -I4.2.5)i resulting in estimate of quantities, cost, and value of re-coverable pounds of LJ308. The other is a general grade-tonnage ("G-T") vscutoff analysis based on combined sample intervals (Section 14.2.6). Thelatter is useful for preliminary evaluation and does not distinguish betweenopen pit and underground modes; it does not utilize cost data and results inan in-place reserve estimation.For most effective use, SCOR should be run in two phases; the f i r s t by usingthe grade-tonnage vs cutoff distribution for obtaining a p r e l i m i n a r y overview of the deposit(s), and the second by using the ore-interval analysisfor making a f i n a l ore reserves calculation.Selection of sample assay data for a SCOR RUN is done by creating an appro-priate UCON f i l e (Section 7-0) which w i l l specify the area of each block andthe sample assay data to be included in the block. The designated UDAT f i l e smust be "intermediate" f i l e s , i.e. they must have been previously created bya URDAT RUN. For both the ore-interval and G-T d i s t r i b u t i o n analysis, re-serves are calculated one block at a time.All other program controls and data are entered interactively at the begin-ning of the RUN and vary according to the options desired. Input parametersmay be generally classified as:1. Program controls which specify the type of calculations and output.2. "Physical" data, including:
Minimum m i n i n g thickness, type! and type2 waste thicknesses, upperand lower d i l u t i o n thicknesses, tonnage factor, ore gradecutoff (s), protore grade cutoff (s), processing recovery rates,mine extraction, and, for open pit calculations, the pit slope an-gle and the estimated length of the perimeter at the base of thepit.
3. "Economic" data, including:Operating costs: direct m i n i n g , applicable indirect m i n i n g ,haulage, royalty, processing, overburden removal, and m i n i n g wasteremoval.Mineral value: price per pound U308.Capital Costs: mine plant and equipment, primary development,processing f a c i l i t i e s , and additional capital costs.
155
URAD ORE RESERVE SYSTEM
4. Standard entries as described in Section 11.2.General descriptions of the "physical" and "economic" data are provided inSection 9-0 and should be reviewed before running the SCOR program. Some ofthese data apply to all cutoffs being evaluated; others must be repeated foreach cutoff (the interactive prompts w i l l indicate if m u l t i p l e entries arerequi red) .Figure 14.1 illustrates the general flow of SCOR. When the ore-intervalanalysis option is requested, at! or most of the physical and economic dataare requested, if only the G-T distribution analysis is requested, thenthere are no requests for economic data, and physical data consist s i m p l y ofa combining thickness, a tonnage factor, and an "area-of- influence".The RUN options and interactive entry are described in Section 14.3.
14.2 ORE RESERVES ANALYSIS METHODOLOGY
SCOR has two methods for calculating reserves; the ore-interval a n a l y s i s andthe grade-tonnage d i s t r i b u t i o n analysis. These may be run together or sepa-rately. The methodology and results of the ore-interval a n a l y s i s are de-scribed in Sections 14.2.1 through 14.2.55. and those for the G-Td i s t r i b u t i o n in Section 14.2.6.
14.2.1 Ore Interval A n a l y s i s , GeneralThe ore-interval analysis must be specified for either open pit. (Section14.2.1) or underground (Section 14.2.2) mode. A summary of the data enteredinteractively for an ore-interval analysis is automatically output on thep-o f i l e at the beginning of each block analysis. Figures 14.2 and 14.3 showprint-output summaries for an open pit and underground run, respectively.The ore-interval analysis requires that grade cutoffs (Section 9-1-4) be es-tablished. At least one cutoff must be specified; up to five are permitted.Cutoff calculations are described in Section 14.2.1.After the cutoff grades are determined, they, and all their associated data,are sorted in increasing order of grade (%U308) so that once a cutoff, atwhich there are no ore intervals, is reached no further processing or outputof sample set results w i l l be needed.The ore-interval analysis for one block is carried out in two stages.
1. Each selected sample set is evaluated to determine the ore in-tervals (Section 9-1-2) and associated factors (waste, etc.) thatmay exist at each of the cutoff grades (Sections 9 - 1 - 4 and14.2.1.1 specified during interactive entry. All pertinent calcu-lations for each sample set are stored. Results of the sample setanalysis are (optionally) listed on the p-o file.2. If a f i n a l reserve estimate has been requested, the results ofstage 1 are used to calculate the reserves and associated econom-
156
URAD ORE RESERVE SYSTEMics; these are automatically summarized and listed on the p-o f i l e(Section 14.2.4).
Ik.2. 1. 1 Cutoff Grade Déterminât ionSCOR provides two methods for establishing grade cutoffs, in percent U308,for ore (Section 9.1.2) and protore (Sections 9.1-9 and 14.2.2.2) intervals.The first is simply to enter one or more arbitrary cutoff values; the secondis to determine cutoff based on break-even cost-versus-value. Only one ofthe methods may be used in any given RUN, except that arbitrary protorecutoffs may be used with cost/value ore cutoffs. The choice of the numberand type of cutoffs is made during interactive entry.Protore cutoffs are only used in the open pit "mode", and only if specif-i c a l l y requested.There is no conceptual distinction made between ore cutoffs for the open pitmode and those for the underground mode. For open pit analysis, the conceptof overburden-to-ore ratio is not considered, although this ratio may, ofcourse, be calculated from the results of a RUN. To determine the effect ofoverburden, ore (and protore, if applicable) intervals are determined first,and then the net value of the intervals is tested to see if it is sufficientto support overburden.Arbitrary cutoffs for both ore and protore are simply entered according tothe choice of the user and w i l l not be affected by any of the other datacost, recovery, etc.Cost/value cutoffs, however, are based s t r i c t l y on other data, and are de-termined as follows.1. For ore cutoff ("COG"), the equation for an integrated operation is:
COG = (CMN + CMN! + CHL + CML + RLT) / (PPP * 0.2 * %RCV/100)(For an independent operation, the term "CML" is null)
2. For protore cutoff ("COGP"), the equation is:COGP = (CMNW + CMLP + RLTP) / (PPP * 0.2 * %RCVP/100)
where,CMN = direct operating ore m i n i n g cost/ton.CMN1 = applicable indirect operating m i n i n g cost per ton.CHL = cost/ton of hauling ore to processing plant.CML = operating cost/ton for ore processing.RLT = ore royalty cost/ton.PPP = price ($) per pound U308.%RCV = ore processing recovery, in percent.CMNW = cost/ton for waste removal (to waste destination).CMLP = estimated future total protore processing cost/ton.RLTP = estimated future protore royalty cost
(arbiträr!ly = 0.5 * RLT) .%RCVP = estimated future protore processing recovery, in percent.
157

URAD ORE RESERVE SYSTEMNote: the protore cutoff is estimated on the basis that, d u r i n gm i n i n g operations, it would be handled in the same manner aswaste, but would later be a v a i l a b l e for processing. Protore doesnot enter into the fin a l reserves economic caculations.
14.2.2 Open Pit An a l y s i s
Ik.2, 2.1 Determine Ore IntervalsOre intervals meeting minimum grade and thickness requirements are deline-ated according to the c r i t e r i a discussed in Sections 9 - 1 - 2 , 9 - 1 - 3 . 9.1.^,9.1.6, and 9-1 -7-In b r i n g i n g ore intervals up to minimum m i n i n g thickness, actual samplegrades are used (i.e. there is no assigned " d i l u t i o n grade"). After di-lution, the average grade of each interval is again tested against the cut-off grade and the interval is rejected if the cutoff grade is not met. Anyadjacent samples which comprise a interval equal to or greater than the min-imum m i n i n g thickness and are less than cutoff are not included in the oreintervals but are considered as waste intervals (Section 9 - 1 - 7 ) or (op-tionally) potential protore intervals (Section 9 - 1 - 9 ) -If upper and/or lower d i l u t i o n thicknesses (Section 9-1-8.2) have beem sub-mitted, ore intervals are diluted by the appropriate thickness at the gradeof the sample adjacent to those comprising the ore interval and are againchecked. The interva!-générâting a l g o r i t h m always attempts to obtain thehighest grade-thickness product posssible w i t h i n the l i m i t s of the pre-scr i bed cr i ter i a.For example, assume two intervals ("#i" and "#3") meeting cutoff, but eachless than m i n i m u m m i n i n g thickness, and separated by a sub-cutoff interval("#2") which would be less than minimum m i n i n g thickness after d i l u t i o n wereadded to the bottom of #1 and the top of #3 (the d i l u t i n g material wouldhave to come out of #2, of course). In such a case, the foll o w i n g combina-tions would be tested: #1, only, diluted to minimum m i n i n g thickness withthe highest adjacent m a t e r i a l s ; #3, only, w i t h same procedure as #1; #1, #2,and #3 combined and diluted. The combination meeting cutoff grade require-ments, and with the highest GT, would be chosen. If no combination was foundto meet cutoff, then all the -intervals would be placed in a waste category!
14.2.2.2 Determine Protore IntervalsWhen all ore intervals have been defined, then, if the protore option (Sec-tion 14.3-16) has been chosen, the inter-ore waste intervals are analyzed todetermine if they contain any intervals of material at minimum m i n i n g thickness, plus d i l u t i o n , with an average grade between the protore cutoff gradeand the ore cutoff grade. If so they are assigned as protore. However, pro-tore intervals cannot be separated from ore or other protore intervals byany sub-protore-cutoff waste intervals which are less than m i n i m u m m i n i n gth i ckness.
158
URAD ORE RESERVE SYSTEMlb.2.2.3 Determine Category of Mining Waste IntervalsAny waste intervals between ore intervals (or remaining between ore and/orany defined protore intervals) are categorized as "type!" or "type2" m i n i n gwaste as fol lows:If a type2 waste minimum thickness has been submitted, then all inter-orewaste intervals are tested against that thickness. Any waste intervals equalto or greater than the type2 waste thickness are assigned accordingly.Lesser intervals are assigned as typel waste. If no type2 waste thicknesshas been submitted, then all waste is assigned to typel waste.
lb.2.2.1t Cost Vs Value (Unit Value)At each cutoff, the value of the ore intervals (and protore intervals, ifdefined) is then compared to the cost for m i n i n g these intervals as well asremoving a representative column of total overlying materials including bothm i n i n g waste and overburden. For a simple case (no protore or type2 wastedesignation) the comparison is made by determining TCOST (unit total cost)and TVAL (unit total value).Total unit cost is expressed as:
TCOST = (DxCR) + (TO(l)xCM) + ((TW(l)xCW) + (T)(2)xCM)) +((TW(2)xCW) + (TO(3)xCM)). . . + ( (TW (N-l) xCW + (TO (N) x CM) ) (1)
where,D = Depth from surface to first ore intervalCR = Cost of overburden removal per yard divided by 27«N = Number of ore intervalsT0(j) = Thickness of the jth ore interval (j = 1,N)CM «Total operating cost per ton divided by TFTW(j) = Thickness of the jth typel waste interval (j = l.N-1)CW = Cost of m i n i n g typel waste per ton divided by TFTF = Tonnage factor (cubic feet per ton)
Total u n i t value is expressed as:VO (j) = 0.20 X G0(j) x price x RCV/100. , andTVAL = (T0(l) x V0(l) + ((TO (2) x VO (2) ) . . . .+ ( (TO (N) x VO (N) ) (2)
where,T0(j) = Thickness of the jth ore interval (j = 1,N)G0(j) = Trade in %U308 of TO (I), (j = 1,N)Price = Dollars per pound U308 (price)V0(l) = Dollar per ton value of ore, (j = 1,N)RCV = Ore processing recovery (in percent).
The ore intervals are evaluated successively downward and the net cumulativeTVAL (j) - TCOST (j) values at the bottom of each jth interval are saved. Ifany of the value are positive, the ore interval are considered to "carry"the representative overburden, otherwise they do not "carry" the overburden.
159
URAD ORE RESERVE SYSTEMIf protore and/or type2 waste are added to the analysis, then, for cost, theterms of the interval in brackets (" ( )") in equation (1) are expanded to:
((TY(j-l)xCY) + (TP(j-l)xCW) + (TW(j-l)x CW) + (TO(j)xCM)) ,
and, for value, those in brackets in equation (2) to:((TP(j-l)xVP(j-l)) + (TO(j)xVO(j)) for value,where,VP(j-l) = 0.20 x GP(j-l) x price x PRCV/100.
N = Number of ore intervals,TY(j-l) = Thickness of type2 waste, above the jth ore interval,CY = cost/ton for removing type2 waste d i v i d e d by TFTW(l-l) = Thickness of typel m i n i n g waste, also above the jth ore
i nterval,CW = cost/ton for removing typel waste (or protore) d i v i d e d by TF
(if for protore, includes protore processing cost/ton)TP(j-l) = Thickness of protore between the jth and (j-l)tr. ore intervalVP(j-l) = D o l l a r per ton value of protoreGP(j-l) = Average grade in %U308 of TP(j-l)PRCV = Protore processing recovery (in percent)
Note: The results of the u n i t value analysis proviae a source ofdata for a d d i t i o n a l analyses beyond those currently carried out inthis version of the SCOR program (see Section 14.2.5)
14.2.2.5 Sample-Set Output from Open Pit AnalysisThe resulting ore intervals determined from each sample set may be op-t i o n a l l y printed to show either d e t a i l s of each zone or summaries for thesample set.
Ik.2.2.6 Detailed sample-set outputFigure \k.k shows the detailed out put from two sample sets - one containsore intervals, and the other is barren. The input data used for the ore in-terval analysis are the same as shown in Figure Ht.2. Most of the l i s t i n g isself-explanatory. For each sample set, there are two header lines which l i s thole number, coordinates, etc. If ore intervals are defined, they are liste dbelow the header lines.Three elevations are shown in the header lines - the o r i g i n a l collar ele-vation of the sample set; the pit elevation, if such exists, and; the "edit"or "working" elevation. The latter is the elevation from which all depths toore and other intervals are currently referenced. If no editing has takenplace and there is no pit elevation, the working elevation w i l l be the sameas the collar elevation; If there has been no ed i t i n g , but a pit elevationexists, then the working elevation w i l l be the same as the pit elevation. Inan open pit RUN, any pit elevation automatically becomes the working ele-vation (unless an edit is made) since, by d e f i n i t i o n , all material down tothe current pit bottom has been removed (Sec tion 5-2.4).
160
URAD ORE RESERVE SYSTEMFor reference (and plotting) purposes, an asterisk is placed beside eitherthe collar elevation or the pit elevation to indicate which should representthe "ground" surface. The header entry for "DEPTH" indicates the total depthsampled from the collar elevation.The top of each ore interval is designated by elevation or depth from theworking elevation (see Section x.x). The thickness and average grade of eachore interval is shown, as well as the cumulative unit value (Section14.2.2.4) at the base of the ore interval. Individual waste and protorethicknesses are not shown. Following the l i s t i n g of the i n d i v i d u a l ore intervals is a summary which includes total thickness and average grade of ore,total waste thickness, and total thickness and average grade of protore.Type2 waste and protore are not indicated if not requested interactively.
Ik.2.2.7 Summary sample-set outputFigure 14.5 shows the summary sample-interval output for several samplesets, incl u d i n g the ones shown in Figure 14.4. The purpose of t h i s output(in contrast to the detailed output des cribed above) is to save p r i n t i n gspace when a large number of sample sets is processed and a printout of theresults for i n d i v i d u a l sample sets is desired.For each sample set, there is always one 64-column header entry. If ore in-tervals are calculated for one cutoff, they w i l l appear on the same l i n e asthe header information. Ore interval data for the second and third cutoffsw i l l be on a second l i n e , and those for fourth and f i f t h cutoffs on a thirdl i n e . If no intervals have been defined for a requested cutoff, no entryw i l l be made for that cutoff.Each data value is preceded by a s i n g l e upper- or lower-case alphabeticcode. The codes for the header data are:
"b"= block code,"a"= area number,"h"= hole (sample set) number,"p"= property code,"Y"= north coordinate,"X"= east coordinate,"C"= reference elevation if it is the collar elevation or"P"= reference elevation if it is the pit elevation,"E"= working (edit) elevation,
and following the latter is a single-digit number indicating the number ofcutoffs for which ore intervals were determined. The interactive-input datasummary (Figure 14.2) must be referenced for cutoffs and prices.
161
URAD ORE RESERVE SYSTEM
Ore-interval data for each cutoff is preceded by an asterisk ("A") followedby the "sequence" number of the cutoff, i.e. the numerical sequence, fromleft to right, in which it is listed on Figure 14.2. The alphabetic codesare:
"D"= depth from working elevation to top of f i r s t ore interval,"T"= total thickness of all ore for the sample set at given cutoff,"G"= average grade (%U308) of the combined ore intervals,"$"= cumulative d o l l a r value of the ore intervals,"w"= total thickness of type! waste,"W"= total thickness of type2 waste,"t"= total protore thickness, and,"g"= average grade (%U308) of combined protore.Note: when the the ore intervals "carry" the overburden, the dol-lar value ("$") represents the lowest ore interval which reflectsa break-even or positive net unit value.
14.2.3 Underground AnalysisThe sample sets are analyzed and listed the same way as for the open pitanalysis (Section 14.2.2), with the following exceptions.
1. The minimum (typel) waste thickness between ore zones may beless than the minimum m i n i n g thickness.2. Waste thickness greater than the "upper" typel waste thickness{Section 9.1.7-1) are taken into account, but not stored or1 i sted.
3. There is no protore calculation.4. Pit elevations are ignored and the collar elevation is alwaysthe reference elevation.6. In the unit value analysis, the net value of each zone is cal-culated and l i s t e d separately and not cumulated.
Figures 14.6 and 14.7 show, respectively, detailed and summary sample inter-val output from the the same sample sets used as illustrations in Section14.2.2, but analyzed on an underground basis. The input data used for theore interval analysis are the same as shown in Figure 14.3-
14.2.4 Block Ore Reserves Summary
Figures 14.8 and 14.9 show l i s t i n g s of f i n a l ore reserves summaries from theore interval analysis for open pit and underground reserves, respectively.The results are developed as described in Sections 14.2.4.1 and 14.2.4.2.
/4.2.4.Î Ore Reserve QuantitiesAfter all sample sets in a block have undergone the ore-interval analysis, af i n a l ore reserve estimate is calculated at each cutoff grade as follows:
162
URAD ORE RESERVE SYSTEM
"SUM" is the summation function. If options have not been taken to computecertain variables, then their value w i l l be n u l l .
"s-s" is equivalent to "sample set (s);"tn" = tons;"lb" = pounds U308,"yd" = cubic yards."NT" is the total number of s-s utilized in the block analysis."NI" = number of s-s having ore intervals at the cutoff."NW1" = number of s-s having typel waste intervals."NW2" = number of s-s having type2 waste intervals."NP" = number of s-s having protore intervals.
"Ti" and "Gi" may be considered as the total thickness and weighted averagegrade of the ore intervals in each s-s of NI.
"TVi" = depth to 1st ore interval in each s-s of NI."TWli" = total thickness of typel waste intervals in each s-s of NW1."TW2i" = total thickness of type2 waste intervals in each s-s of NW2."TPi" and "GPi" = total thickness and weighted average grade of the
protore intervals in each s-s of NP."TF" = tonnage factor in cubic feet per ton."%XTRC" = percent ore extraction."%RCV" = percent ore processing recovery."%PRCV" = estimated future percent protore processing recovery."OT" = average thickness of ore in the block = SUM (Ti,i = l,N I) / NI."OG" = average grade of ore = SUM(Ti x G i , i = l , N I ) / SUM (Ti , i = l , N I ) ."BA" = the assigned area of the block"OA" = ore area = BA x NI / NT."TONSIP" = tn ore in-place = OA x OT / TF."LBSIP" = lb (in ore) in-place = TONSIP x OG x 20."TONSXT" = tn ore extractable = TONSIP x %XTRC/100."LBSXT" = lb (in ore) extractable = LBSIP x %XTRC/100."LBSRC" = lb recoverable from ore = LBSXT x %RCV/100.(For an "independent" operation, if the value is based st r i c t l y onuranium contained in ore, then LBSRC = LBSXT.)
For open pit:"TWT1" = average typel thickness, prorated over OA = SUM (TW1,i = l,NW1) / NI."TWT2" = average type2 thickness, prorated over OA = SUM (TW2,i = l,NW2) / NI."TONSW1" = tn typel waste extractable = TWT1 x OA x (%XTRC/100) / TF."TONSW2" = tn type2 waste extractable = TWT2 x OA x (%XTRC/100) / TF."POT" = average protore thickness, prorated over OA = SUM (TPi,i = l,NP) / NI."POG" = average grade of protore = SUM(TPi x G P i , i = l,NP) / SUM (TPi,i = 1,NP) ."PTONSXT" = tn protore extractable = POT x OA x (%XTRC/100) / TF."PLBSXT" = lb (in protore) extractable = PTONSXT x 20 x POG."PLBSRC" = lb recoverable from protore = PLBSXT x %PRCV/100.
"TOV" = average direct overburden thickness = SUM (TVi,i = l , N I ) / NI.(The overburden thickness is based on s-s having ore intervals, butis assigned to the entire block area, see Section 9 - 1 - 5 - )
"OVBYD" = yd overburden directly overlying block-area = BA x TOV / 27."TTOT" = average thickness to bottom of pit = TOV + OT + TWT1 + TWT2 + POT."ANGL" = pit slope angle.
163

URAD ORE RESERVE SYSTEM
"P" = lenght of pit perimeter (same as block area perimeter)."BKSLPF" = backslope function (see Section 9-1.5.1)."BSLP" = yd overburden in backslope = BKSLPF (ANGL,TTOT,P) ."OVBTOT" = total yd overburden = OVBYD + BSLP.
For underground:"TWT1" = average typel thickness, prorated over OA = SUM (TW1» 1 = 1,NW1) / NI"TONSW1" = tn typel waste extractable ~ TWT1 x OA x (%XTRC/100) / TF.
t4.2.4.2 Ore Reserve EconomicsAfter the quantities (Section 1^.2.3-D have been determined, then costs areappl i ed as foilows:The "cost" is in dollars and the v a r i a b l e names defined in Section U.2.3.1are not redefined.Operating costs:
"CM" = direct m i n i n g cost/ton."CMI" = a p p l i c a b l e indirect cost/ton."CH" = haulage cost/ton."CML" = ore processing cost/ton."CRLT" = ore royalty cost/ton. ."CW1" = typel waste removal cost/ton."CW2" = typet waste removal cost/ton."CP" = protore removal cost/ton = CW1 (open pit only) ."CPML" = protore processing cost/ton (open pit only)."CPRLT" = protore royalty cost/ton = CRLT * 0.5 (open pit only).
(This cost is an approximation of the total capital andoperating cost per ton estimated for future protoreprocess i ng.)
"TOCPT" = total ore m i n i n g operating cost/ton == CM + CMI + CH + CML 4- CRLT
(If operation is "independent", CML = null.)"TMOC" = total ore m i n i n g operating cost = TONSXT x TOCPT."TW1C" = total typel waste removal cost = TONSW1 x CW1.For open pit/protore option,
"TW1C" = (PTONSXT + TONSW1) x CW1(the protore is considered as waste in the cost calculationand is not included in the f i n a l cost vs value comparison.)
"TW2C" = total type2 waste removal cost = TONSW2 x CW2"TOC" = total operating cost = TMOC + TW1C + TW2C
164
URAD ORE RESERVE SYSTEMCapital costs:
"CPYD" = overburden removal cost/yd (open pit only)."COVB" = total overburden removal cost = OVBTOT x CPYD
(open pit only)."CPl" = mine plant and equipment cost/ton (prorated to TONSXT)."CPML" = processing plant construction cost/ton (prorated as above)
(If operation is "independent, CPML is null.)"COH" = "other capital" cost/ton (prorated as above)"CPD" = Primary development cost/ton
(prorated as above, underground only)."TCC" = Total capital cost:For open pit operation,
"TCC" = COVB + (CPL + CPML + COH) x TONSXT.For underground operation,
"TCC" = (CPD + CPL + CPML + COH) x TONSXT.
Overal1 cost:"TCOST" = total operating cost + total capital cost = TOC + TCC
Total value from ore:"PPP " = price in dollars per pound U308."TVAL " = total value = PPP x LBSRC
Net value from ore:"NVAL" = total value less total cost = TVAL - TCOST."NVPT" = net value per ton = NVAL / TONSXT.
(If NVPT is less than -999, it is set to -999.)"NVPP" = net value per pound U308 = NVAL / LBSRC
The potential net value per ton of any protore, as it sits, is:"NVPTP" = ((PPP x PLBSRC)- (PTONSXT x (CPRLT+CPML))) / PTONSXT"NVPPP" = net value per pound protore =
((PPP x PLBSRC)-(PTONXT x (CPRLT+CPML))) / PLBSRC
14.2.5 SCQR Plot Fi leOne of the most useful applications of the ore-interval analysis has beenthat of creating a sample-set location plot (or " d r i l l - h o l e location map")which shows the position, sample number, and ore-interval attributes of eachsample set. Such plots can be created for each cutoff, or, with appropriatesymbols, certain attributes may be shown for all cutoffs at once.Using such plots: blocks may be revised and measured; open pit outlines maybe delineated on the basis of the "carry" or "not carry" determinations foreach sample set; ore interval thickness, grade, grade-thickness-product, andunit value may be isopached and contoured.A d d i t i o n a l l y , cross sections may be plotted to show the relative verticalpositions of the various ore intervals.It was not w i t h i n the scope of the current URAD project to include plottingprograms. However, the option is provided to create a summary output plotf i l e containing data from which plots can be generated if a plotter and ap-propriate software are available. This f i l e is termed a "SCOR plot file" and
165
URAD ORE RESERVE SYSTEM
may be optionally created any time that SCOR is run in the ore-intervalanalysis mode.
/4.2.$./ Structure of the Plot FileThe plot f i l e consists entirely of 80- (or less) column, formatted records.Figure 14.10 is plot f i l e made during the same run that created the outputlisted in Figure Ht. 4. Each f i l e w i l l begin with two "heading" records anddata for each block w i l l begin with a "block identification" record. Following each block record is a series of sample-set records. The number ofsample-sets w i l l correspond to the number of v a l i d sample sets .processed forthe block. For each sample set there is one header record, followed a number of records equivalent to the number of cutoffs for which ore intervalswere established in the given sample set.
1. The first "heading" record of the3-character code followed by the t i t l e (RUNmaking the RUN (Section 11.2). The 3~character code indicateswhether the RUN was made in the open pit ("0-P")underground mode ("U-G") .
plot f i l e contains adescription) used in
mode or the
2. The' second "heading" record indicatesper pound U308) and grade ("P-C:") of eachi.e. for two cut offs, the f i r s t at 30grade value of 0.124 %U308, and the secondand value of 0.146 %U308, the record would
P-C: $ 30.00- 0.124%. $ 25-00- 0.146%. $
the associated price ($cutoff used in the RUNd o l l a r s per pound and aat 25 d o l l a r s per poundbe:
The price-cutoff sets are separated by a period (".") and the lastd o l l a r sign ("$") may be ignored.3. The block identification record contains the block code, blocksequence number and the block area (square feet) . The followingrecord:BLK:BK1; SEQ#: 1 ; AREA: 1000000.
indicates that thethe sequence ofsquare feet.
block code is "BK1", the block was the f i r s t inblocks processed, and the block area is 1000000
4. If the sample set records (following each block i d e n t i f i c a t i o nrecord) in Figure 14.10 are compared with the sample set summaryrecords listed in Figure 14.5» it is p l a i n that the record formatsof both header and ore- interval records in the plot f i l e corre-spond almost exactly to the correponding entries in the summaryprintout. The only differences are that in the plot f i l e : a) theasterisk ("5';") at the the beginning of each ore interval record isdeleted, and; b) the header and ore-interval entries are on i n d i -vidual records instead of two per line!With these two exceptions in mind, the format descriptions dis-cussed in Section 15-2.2.5 may be directly applied to the thesample-set data in the plot f i l e .
166
URAD ORE RESERVE SYSTEM14.2.6 Grade-Tonnage Distribution AnalysisSCOR provides the option of combining samples from each sample set into aninterval of predetermined thickness (termed the "combining thickness") andclassifying the average grade of each interval by grade intervals of 0.01%U308. The intervals are actually (0.001 - 0.009, 0.01 - 0.019, 0.02 -0.029, etc), up to 2.999, then they are at 0.50% U308 up to 5% and allgreater than 5% are lumped together. Beyond 0.50, only class intervals con-taining values are listed.The combining thickness is specified during interactive entry.After ali the sample sets from a block have been processed, the number ofintervals f a l l i n g into each class w i l l have been automatically calculated.Tons of "ore" in each class interval is obtained by:
TO = NCI x CT x AREA/TF,
and pounds LJ308 (LB) are obtained by:LB = TO * 20 x GA where,NCI is the number of combined intervals f a l l i n g into the given class.CT is the combining thicknessAREA is either a designated "area-of-inf1uence" or the total block
area divided by the number of v a l i d sample sets processed forthe block; the option is specified during interactive entry.
TF is the tonnage factor.GA is the average grade of the class interval.
From this base, a cumulative distribution of in-place tons of ore and poundsof U308 is constructed (Figure 14.11).The estimate of reserves obtained in this fashion is only a rough approxi-mation, but it provides some i n i t i a l insight into the overall grade-tonnagedistribution of a given set of data. It may be used in estimating i n i t i a ltonnages and average grades, at various grade cutoffs, to apply when at-tempting to establish royalties, processing recovery rates, and capital andoperating costs which depend on the magnitude of operations.SCOR may be run to obtain that incremental analysis without any other analy-sis being carried out.
14.3 OPTIONS AND INTERACTIVE ENTRIES
This section combines discussion of the options and interactive entries re-quired when running the program.Specific entries are noted by "->"; no entry reference is made for obvious"Yes" or "No" responses. For additional information on any of the variables,review applicable descriptions in Sections 9-0, 10.0, 11.0, 14.1, and 14.2.WARNING! The interactive entries for SCOR are somewhat extensive if theore-interval analysis mode is chosen. Therefore, make sure that you have de-
167
URAD ORE RESERVE SYSTEM
cided on input and output f i l e s and interactive entry options and data before preceding with a RUN.
14.3.1 Standard EntriesThe standard entries and options described in Section 11.2 w i l l not be repeated here. The term "request" used below denotes an interactive prompt.
l*t.3-2 Plot Output F i l eA plot output f i l e (or "plot file") w i l l be generated only on request. Ifthe option is taken, a request w i l l be made for the desired f i l e name. F i l enaming procedures and precautions are the same as for other URAD outputf i l e s . Each time a plot f i l e is generated, it w i l l destroy any previous dataon any existing f i l e of the same name.
H.3-3 Output Of Ore-Interval A n a y l s i sThe results of the ore-interval analysis of each sample set may be printedor suppressed:->0 to suppress. If to be printed, the options are:->1 to output detailed l i s t i n g (Section 1^.2.1.5-1) on the p-o f i l e .->2 to output summary l i s t i n g (Section 1^.2.1.5-2) on the p-o f i l e .
J4.J.J./ Choice of Ore Interval Position ReferenceIf the detail l i s t i n g (option 1 above) is chosen, then there is also thechoice of whether the position of the ore intervals (Figures }k.k & l k.6)are to be referenced by elevation or depth from the working elevation.->blank for depths;->1 for elevations.
14.3.^ Calculation And Output Of The G-T D i s t r i b u t i o n AnalysisThe grade-tonnage distribution analysis is only calculated on request. Whencalculated, it is automatically printed on the p-o f i l e ; if requested, thefollowing additional requests for area-of-inf1uence method and combiningthickness w i l l be made.
I4.J.4.J Choice of Area-of'-1nf/uence MethodThe area-of-influence (Section 14.2.6) to be assigned to each combined in-terval may be determined either by:->1 to enter a specific value for the area of influence; or,->2 to d i v i d e the block area entered in the UCON block identifier
record by the total number of sample sets included w i t h i n theblock; this is done internally by the program.
168
URAD ORE RESERVE SYSTEMIf option "1" is chosen, there w i l l be a request to enter the value of thearea-of influence;-> area-of-influence; up to 8 s i g n i f i c a n t digits; to (reasonably)
nearest square foot
I4.J.4.2 Combining Thickness-> combining thickness ("CT"), Section 14.2.6).
14.3-5 Option For Reserves Calculation By Ore-Interval AnalysisIf this option is taken, reserves w i l l be calculated using the ore-intervalanalysis methods described in Section 14.2.4. A summary of the reserve anal-ysis for each block w i l l be automatically output on the p-o f i l e .
Note: If this option is taken, there w i l l be a later request forunderground or open pit capital cost data, as well as for all therequired physical and economic data needed for the ore-intervalanalysis. If it is not taken, but output of the sample-set analy-sis (detail or summary) and/or the plot f i l e is requested, therew i l l be no request for capital cost data, but thephysical/economic data w i l l be requested. If none of the above arerequested, and the G-T analysis is not requested, the program w i l lterminate! If only the G-T analysis is requested, then, most ofthe physical/economic data w i l l not be required.
14.3-6 Open Pit Versus Underground AnalysisIf the ore-interval sample-set output, ore-interval reserves analysis, orplot f i l e output are requested, the RUN must be designated as "open pit" or"underground". Whichever mode is chosen w i l l apply to all blocks included inthe RUN. The open pit option assumes that the block areas outline the bottomof postulated open pits.->1 for open pit mode;->2 for underground mode.
14.3-7 Integrated Versus Independent OptionsThe ore-interval analysis must be run in the "integrated" or "independentmode (Section 9.2).If ->Y (integrated), processing costs and recovery rates w i l l be requestedand used in all applicable portions of the analysis.If ->N (independent), processing costs w i l l not be requested or included inthe reserves analysis, but the option w i l l be later provided as to whetheror not an ore processing recovery rate (other than 100%) should be appliedin determining ore cutoff or pounds U308.
169
URAD ORE RESERVE SYSTEM14.3.8 Ore Cutoff Grades
Ik.3.8.1 Number of Cutoff GradesA request is made for the number of cutoffs to be run; at least one is man-datory, and up to five may be chosen; -># cutoffs.
J4.3.8.2 Arbitrary versus Cost/Price CutoffThe choice is provided as to whether ( ->Y ) cutoff grades w i l l be calcu-lated as function of cost vs price (Sections 9.1.4.1 and 14.2.1.1), or whether ( ->N ) they w i l l be directly submitted as arbitrary values (Sections9. 1 .4.2 and 14.2.1.1).If the "arbitrary" option is chosen, then: ->ore cutoff (s) in tenths, hun-dredths, or thousandths of one percent U308; a decimal point is mandatory; azero cutoff grade is not allowed.If the cost/price option is chosen, the cutoffs are calculated i n t e r n a l l y .
14.3.9 Standard Physical Parameters and Operating Cost EntriesIf the ore-interval analysis option has been chosen, the entries for thissection w i l l all be requested regardless of whether the run is designated as"open-pit" or "underground". For some data elements, the number of entriesw i l l be equivalent to the number of cutoffs requested (Section 14.3.8.1);these are indicated by the term ("for # cutoffs"). For others, only oneentry w i l l be required.Even if arbitrary cutoffs have been submitted, and the given RUN is beingmade simply to determine ore reserve quantities at those cutoffs, it is nev-ertheless prudent to submit reasonable values for costs and price.
34.3-9- 1 Ore Processing Operating Cost->Processing Cost; up to 5 significant d i g i t s ; to the nearest hundredth of adollar; for # cutoffs.
Ik. 3-9"^ Ore Processing Recovery Rate->0re processing recovery rate; up to 5 significant d i g i t s ; to the nearesthundredth of one percent; for # cutoffs; may not be zero.
1^.3.9.3 Uranium Prices->Price per pound U308; up to 5 significant d i g i t s ; to nearest hundredth ofa d o l l a r ; for # cutoffs, no zero entries allowed.
34.3-9-4 Minimum Mining Thickness->Minimum m i n i n g thickness; up to 3 significant digits; to nearest 10th of afoot; must be at least 1 foot. In the open pit mode, this w i l l also be usedas the protore minimum m i n i n g thickness, as well as the minimum type! wastethi ckness.
170

URAD ORE RESERVE SYSTEM
lb.3-9-5 Upper Dilution Thickness->Upper d i l u t i o n thickness; up to 3 s i g n i f i c a n t d i g i t s ; to nearest 10th of afoot; may be zero. This is the thickness of " d i l u t i n g " material adjacent toand above defined ore intervals which w i l l be added to the intervals at thegrade of the d i l u t i n g material.
lb.3'9-6 Lower Dilution Thickness->Lower dilution thickness; same criteria as "upper d i l u t i o n thickness"(above). Material is adjacent to and below ore intervals.
lb-3'9'7 Tonnage Factor->Tonnage factor in cubic feet per ton; up to U significant figures; tonearest hundredth of a cubic foot; may not be zero. This w i l l be used toconvert volumes of ore, waste, and protore into tons.
!4.3.9.8 Direct Mining Cost->Direct m i n i n g cost/ton; up to 5 s i g n i f i c a n t d i g i t s ; to nearest hundredthof a dollar; may be zero; fot # cutoffs, includes all cost for m i n i n g a tonof ore and moving to the point where it w i l l be first loaded and transportedto a processing plant, i.e. to the point where the "haulage" cost comes intoeffect.
lb.3-9-9 Applicable Indirect Mining Cost->Applicable indirect m i n i n g cost/ton; up to 5 significant d i g i t s ; to near-est hundredth of a dollar; may be zero; for # cutoffs. Any operating costnot included in direct m i n i n g , haulage, royalty, or processing, but wnich isaffected by the ore "production" rate. '
lk.3.9.10 Haulage Cost->Haulage cost /ton; up to 5 significant digits; to nearest hundredth ofdollar; may be zero; any cost of transporting material which is not incluein the direct m i n i n g cost.
H4.3.9.11 Ore Royalty Cost->Royalty cost in dollars per ton of ore; up to 5 significant d i g i t s ; tonearest hundredth of a dollar; may be zero; for # cutoffs. Value ofrenumeration to a third party directly or indirectly based on the uraniumcontent of the ore itself.
14.3.10 Open-Pit-Specific FactorsThe following requests w i l l only be made if RUN has been designated in theopen pi t mode.
Ik.3. 10. / Overburden Removal Cost->0verburden removal cost per cubic yard; up to 4 significant d i g i t s ; tonearest hundredth of a dollar; may be zero.
171
URAD ORE RESERVE SYSTEM
!4.J.?0.2 Opt/on for Charging Open Pit Typel Waste Removal Cost->Y if typel waste removal is prorated to d i r e c t m i n i n g cost.->N if not.If ->Y, the typel waste intervals w i l l be calculated, but not costed.If ->N, then there w i l l be a request for entry of the typel waste cost, and,
->Typel waste removal cost/ton (of waste); up to k s i g n i f i c a n t d i g i t s ; tonearest hundredth of a dollar; may be zero; for # cutoffs.
14.J. JO.3 Opt:on for a 7ype2 Mas te Removal CostThis option provides for the designation of a m i n i m u m thickness of type2waste.->Y to assign a type2 waste category;->N if no such waste breakdown is desired.If yes, requests for the mininum thickness and removal cost of type2 wastew i l l follow. The maximum typel waste thickness is set equal to the m i n i m u mType2 waste thickness, and waste intervals at that thickness w i l l be chargedto Type 1 waste.->minimum type2 waste thickness; up to 3 s i g n i f i c a n t d i g i t s ; to nearest 10thof a foot; must be greater than minimum mining thickness.
->cost/ton for remoming Type2 waste; up to 5 s i g n i f i c a n t d i g i t s ; to nearesthundredth of a d o l l a r ; may not be zero.
14.J.10.4 Protore Opt/onThe number of protore cutoffs entered w i l l be equivalent to the number ofore cutoffs established. The protore cutoff establihed at any given ore cut-off must be less than that ore cutoff.The protore option is provided in two modes: 1) if ore cutoffs have beensubmitted a r b i t r a r i l y , and; 2) if determined by cost vs price.For mode 1 :->0 for no protore analysis;->1 for arbitrary protore cutoffs.
For mode 2:->0 for no protore analysis;->1 for arbitrary protore cutoffs;->2 for protore cutoffs calculated by cost vs price as described in
Section H.2.1 .1 .If the protore option is not taken, the next three requests w i l l be omitted
Protore Processing Cost:->Protore Processing cost per ton of protore; up to 5 s i g n i f i c a n t d i g i t s ; tonearest hundredth of a dollar: may be zero; for # cutoffs. To be useful,
172

URAD ORE RESERVE SYSTEMthis value should reflect the best estimate of the total cost per ton whichw i l l be incurred in the future for processing the protore.
Protore Processing Recovery Rate:
->Ant i c i pated protore recovery rate, in percent; up to 5 significant d i g i t s ;to nearest hundredth of a percent; may not be zero; for # cutoffs.
Protore Cutoffs:
If the choice has been made (Section 14. 3. 10. It) for protore calculations byarbitrary cutoff, then:->Protore cutof f (s) , in tenths, hundredths, or thousandths of one percentU308; a decimal point is mandatory.If the choice is for the protore cutoffs to be determined by cost versusprice, they w i l l be calculated internally.After protore cutoffs are established, each is displayed on the monitoralong w i t h its corresponding ore cutoff. This provides the opportunity tocompare the two, and a "prompt" option is provided to reconsider the protorecutoffs. If ->Y, interactive entry flow w i l l return to the very beginning ofthe protore sequence. If ->N, the entry sequence w i l l continue, but if anyprotore cutoff is not less than its corresponding ore cutoff, an error mes-sage w i l l be displayed and the flow w i l l return to the beginning of the pro-tore sequence, so that the protore option may be reconsidered.Following the completion of the protore option procedures, the program w i l lbranch to the open pit capital costs option.
14.3.11 Underground-Specific Operation FactorsThe following requests w i l l only be made if the RUN has been designated inthe underground mode.
J4.J.Jf.t Option for Charging Underground 7/pel Waste Removal Cost->Y if type'l waste removal is prorated to direct m i n i n g cost. ->N if not.
/4.J.Ü.2 Minimum Type! ("Stope") Waste Thickness->Minimum thickness of typel waste intervals; up to 4 signi f i c a n t d i g i t s ; tonearest 10th of a foot; must be at least 2 feet; may be less than minimumm i n i n g thickness.The minimum Typel waste thickness is always considered in the ore intervalcalculations. However, if its removal cost is prorated to the direct m i n i n gcost (Section 14. 3- 11.1). no typel waste w i l l be calculated or costed, andthe next two requests w i l l be omitted.
lb.3.11.3 Maximum Typel ("Stope") Waste Thickness->Maximum thickness of typel waste intervals; up to k s i g n i f i c a n t d i g i t s ; tonearest 10th of a foot; must be greater than minimum typel thickness.
173
URAD ORE RESERVE SYSTEM
?4.J.n.4 Cost for Removal of Type! Haste->Cost/ton for removing typel waste; up to 5hundredth of a d o l l a r .
s i g n i f i c a n t d i g i t s ; to nearest
14.3.12 Open-Pit-Specific Capital Cost FactorsIf the option has been selected for reserves calculation (Section lUthe following requests w i l l be made relating to open pit capital costs
Ik. 3. 12. 1 Pit Slope Angle->The pit slope angle; up to U s i g n i f i c a n t d i g i t s ;of a degree. Must be from 30 to 90 degrees. If itno backslope w i l l be calculated, and the next twoperimeter data w i l l not be made.
to the nearest hundredthis entered as 90 degrees,requests, c a l l i n g for pit
/4.J. 12.2 Pit Perimeter LengthIf the v a l i d pit slope angle (between 30 and 90 degrees) is entered (above),then there w i l l be two requests. The f i r s t is for the number of blocks to beprocessed for a given RUN, as defined by the a p p l i c a b l e UCON f i l e .
Then, for each block, there w i l l be a request for the corresponding pit per-imeter to be used for the backslope calculation. The block numbers in the"prompts" correspond to the sequence in which the blocks are arranged in theUCON f i l e , and do not refer to any block "code" identifications which may beassigned to the blocks. The first "B#" instruction record represents thef i r s t block; the second "B#" record, the second block; and so forth. Foreach block prompt, enter:
->The total length, in feet, of the perimeter at the base of the p i t ; up to6 s i g n i f i c a n t d i g i t s ; to nearest foot; may not be zero This should be theperimeter of the block area. If there are any other primary developmentcosts besides the overburden removal, they must be included in "other capi-tal costs" (below) .
14. j. 12.3 Underground-Specific Capital CostIf the option has been selected for reserves calculation (Section 14.3-5)the following request w i l l be made relating to undergorund c a p i t a l costs.
14.3-13 Primary Development Cost->Primary development cost/ton of ore; up to 5 significant d i g i t s ;est hundredth of a d o l l a r ; may be zero; for # cutoffs.
to near
14.3.14 General Capital CostsIf the option has been selected for reserves calculation (Section 14.3-5).the following requests w i l l be made rela t i n g to both open pit and underground modes.
174

URAD ORE RESERVE SYSTEM14.3' 14..! Ore Processing Capital CostThis request w i l l not be made, if RUN is in the "independent" mode.->Capital cost for ore processing, per ton of ore; up to 5 significant dig-its; to nearest hundredth of a dollar; may be zero, for # cutoffs.
14.3.14.2 Mine Plant and Equipment Capital Cost->Capital cost for mine plant and equipment, per ton of ore; Up to 5 signif-icant digits; to nearest hundredth of a dollar; may be zero; for # cutoffs.
14.3.14.3 "Other" Capital Cost->Any other applicable capital costi per ton ore; up to 5 significant dig-its; to nearest hundredth of a dollar; may be zero; for # cutoffs.
175
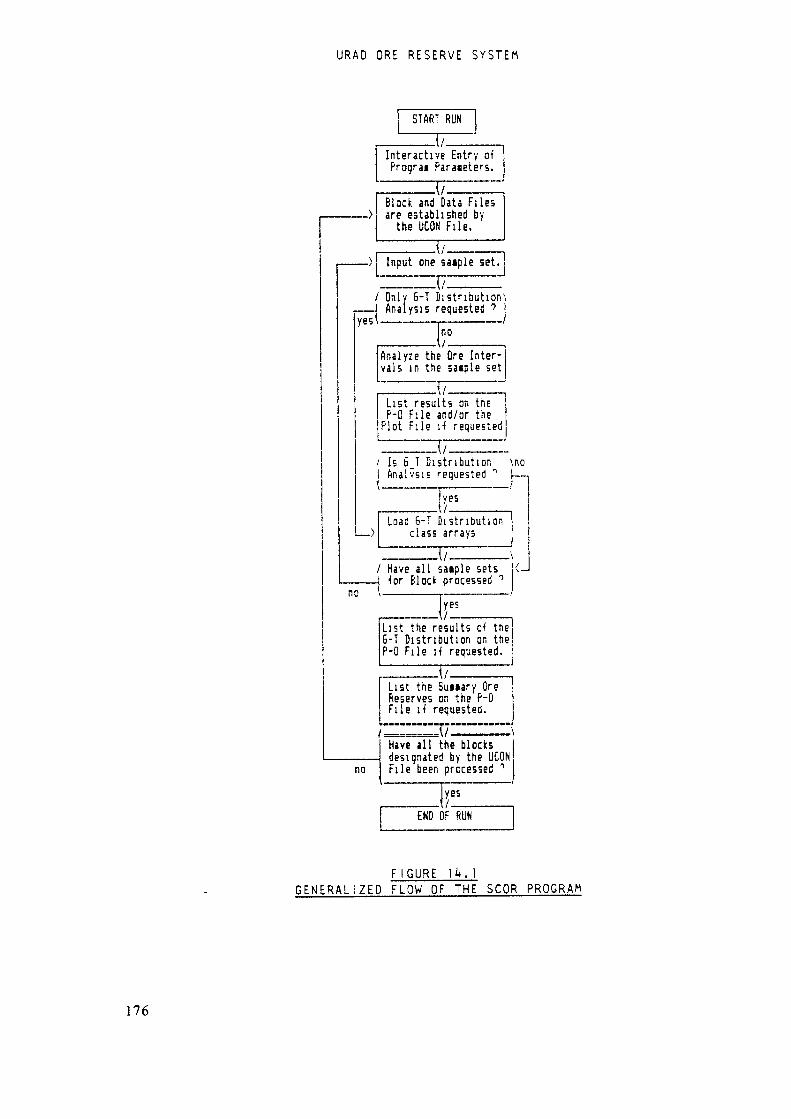
URAD ORE RESERVE SYSTEM
START RUNIt/-Interactive Entry ofPrograi Paraieters.It/.Block and Data Filesare established bythe ÜCON File.It/IInput one saipie set.117:
yes/ Only 6-T Distribution1!Analysis requested *>
no
noAnalyze the Ore Inter-vals in the saiple set
.17.List results on theP-D File and/or thePlot File i-f requestedIt/./ Is 6_T Distribution \noj Analvsis requested " I—.yesI—Load 6-T Distributionclass arrays
it/i/ Have all saiple sets-J ^or Block processed ^
' _IrList the results o^ the6-T Distribution on theP-0 File if requested.
List the Suiiary OreReserves on the P-0File if requested. _\Have all the blocksdesignated fay the UCONFile been processed "•
END OF RUN
F I G U R EGENERALIZED FLOW OF THE SCOR PROGRAM
176
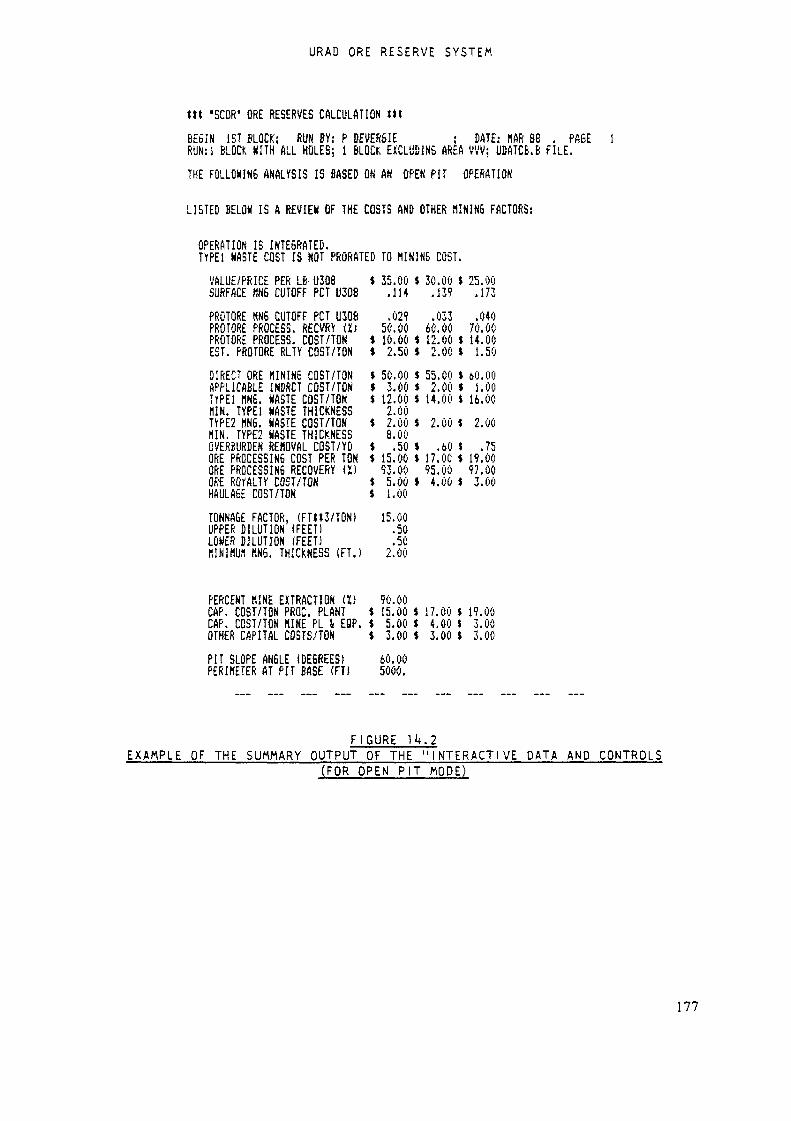
URAD ORE RESERVE SYSTEM
tit "SCOR1 ORE RESERVES CALCULATION WBE6IN 1ST BLOCK; RUH BY: P DEVERSIE ; DATE: «AR 88 . PA5ERUN:! BLOCK KITH ALL HOLES; 1 BLOCK EXCLUDING AREA VW; UDATCB.B FILE.THE FOLLOWING ANALYSIS IS BASED ON AN OPEK PIT OPERATION
LISTED BELOW IS A REVIEW OF THE COSTS AND OTHER MINING FACTORS:
OPERATION IS INTEGRATED.TYPE! WASTE COST IS KOT PRORATED TO MINING COST.VALUE/PRICE PER Lfi- U308 * 35.00 t 30.00 * 25.oùSURFACE «N6 CUTOFF PCT U308 .114 .139 .173PROTORE HN6 CUTOFF PCT U308 .029 .033 .040PRÖTORE PROCESS. KECVRY tt; 50.00 60.00 70.00PROTORE PROCESS. COST/TON * 10.00 $ 12.00 $ 14.00EST. PROTORE RLTY COST/TON * 2.50 * 2.00 * 1.50DIRECT ORE MINING COST/TON * 50.00 « 55.00 $ 6Û.OOAPPLICABLE INDRCT COST/TON J 3.00 * 2.00 * 1.00TrPEl MNG. WASTE COST/TON * 12.00 $ 14.00 * 16.00MIN. TYPE1 WASTE THICKNESS 2.00TVPE2 HN6. WASTE COST/TON * 2.00 * 2.00 * 2.00HIN. TYPE2 WASTE THICKNESS 8.00OVERBURDEN REMOVAL COST/YD * .50 * .60 $ .75ORE PROCESSING COST PER TON $ 15.00 » 17.00 * 19.00ORE PROCESSING RECOVERY (X) 93.00 95.00 97.00ORE ROYALTY COST/TON * 5.00 t 4.OÙ $ 3.00HAULAGE COST/TON * 1.00TONNAGE FACTOR, (FW3/TON) 15.00UPPER DILUTION (FEET) .50LOHER DILUTION (FEET) .50«1NIMUH MNG. THICKNESS (FT.) 2.00
PERCENT MINE EXTRACTION (X) 90.00CAP. COST/TON PfiOC. PLANT * 15.00 $ 17.00 $ 19.00CAP. COST/TON RINE PL & EQP. * 5.00 * 4.00 * 3.00OTHER CAPITAL COSTS/TON $ 3.00 * 3.00 * 3.00PIT SLOPE ANGLE (DEGREES) 60.00PERIMETER AT PIT BASE (FT! 5000.
FIGURE 14.2EXAMPLE OF THE SUMMARY OUTPUT OF THE "INTERACTIVE DATA AND CONTROLS
(FOR OPEN PIT MODE)
177

URAD ORE RESERVE SYSTEM
«» 'SCOR' ORE RESERVES CALCULATION WBEGIN 1ST BLOCK: RUN BY: P DEVER6IE ; DATE: «Aft 86 . PA5ERUN:TEST ON ONE BLOCK, ALL DATA FRO« UDATCB.B FILE.THE FOLLOWING ANALYSIS IS BASED ON AN UNDERGROUND OPERATION
LISTED BELOW IS A REVIEW OF THE COSTS AND OTHER HININ6 FACTORS:
OPERATION IS INDEPENDENT.TYPE1 «ASTE COST IS NOT PRORATED TO HIKING COST.VALUE/PRICE PER LB U30Ë * 35.00 * 30.00 * 25.00 $ 20.00UND6RND HN6 CUTOFF PCT U308 .114 .139 .173 .200
NO PROTORE CALCULATION REQUESTED.DIRECT ORE K1NIN6 COST/TON * 60.00 $ 65.00 * 70.00 t 75.00APPLICABLE INDRCT COST/TON « 1.00 $ 2.00 » 3.00 * 4.00STOPE NN6. KASTE COST/TON $ 15.00 * 15.00 * 15.00 $ 15.00«IN. STOPE »ASTE THICKNESS 2.00«An. STOPE «ASTE THICKNESS 10.00ORE PROCESSING COST PER TON * .ÛC $ .00 < .00 $ .00ORE PROCESSING RECOVERY (I) 100.00 100.00 100.00 100.00ORE ROYALTY COST/TON » 2.00 « 3.00 $ 4.00 $ 5.00HAULA6E COST/TON $ 2.00TONNAGE FACTOR, (FTU3/TON) 15.00UPPER DILUTION <FEET) .00LOWER DILUTION (FEET) .00HINIHU« «N6. THICKNESS (FT.) B.OO
PERCENT «INE EXTRACTION (Ï) 95.00CAP. COST/TON PRI«. DEVLP. * 5.00 * 5.00 $ 5.00 $ 5.00CAP. COST/TON «INE PL l E8P. $ 3.00 * 3.00 « 3.00 $ 3.00OTHER CAPITAL COSTS/TON » 2.00 $ 2.00 $ 2.00 $ 2.00
F I G U R E Ht.3EXAMPLE OF THE SUMMARY OUTPUT OF THE "INTERACTIVE DATA AND CONTROLS'
(FOR UNDERGROUND MODE)
178

URAD ORE RESERVE SYSTEM
It? X-COORD E-CÜORD ELEV. PIT-ELV. ED-ELV. DEPTH PRPTV AREA-* HCLE-t0-P 6000 5000 11000.5 10850.51 1ÔB5Û.5 465.5 VDATA VVV TEST 2WILL ORE CARRY OVERBURDEN YES YES Y'ESBRADE CUTOFF, PERC U30B. .114 .139 .173«AK COST / L6 U308 * 35.00 * 30.00 $ 25,00DEPTH TO FIRST ORE ZONE 259.5 279.0 279.0ELEV. AT TOP OF 1ST ZONE 10591.0 10571.5 10571.5tit ORE ZONE, THICKNESS 3.00 5.00 5.00BRADE OF ORE. XU308. .120 .406 .406CUMUL, NET UNIT VALUE, t -4.0 * 44.6 * 29.9tPROTQRE, THICKNESS 5.00 .00 .00BRADE OF PROTORE ÏU308 .056 .000 .000DEPTH TO TOP OF ORE 279.00 297.00 297.00ttt ORE ZONE, THICKNESS 5.00 B.50 8.506RADE OF ORE, XU3Q8. .406 .270 .270CUKUL. NET UNIT VALUE. * 56.3 $ 85.3 * 54.8tPROTORE, THICKNESS .00 .00 .00GRADE OF PROTORE ÏU3Q8 .000 .000 .000DEPTH TO TOP OF ORE 297.00 .00 .00ttt ORE ZONE, THICKNESS 8.50 .00 .00GRADE OF ORE, -ÏU308. .270 .000 .000CUMUL. NET UNIT VALUE. * 112.2 * .0 » .0OVERBURDEN THICKNESS (FT) 259.50 279.00 279.00TOTAL ORE THICKNESS (FT)ORE, AVERAGE GRADE (ÏU308)TOT. PROTORE THICKNESS (FT)PROTORE. AVE GRADE UU308)TOTAL TYPE1 HASTE (FT)TOTAL TYPE2 (1N6. HASTE
TYP N-COORD E-COORD ELEV.0-P 5ÛOÔ 5000 7000. 5
16.50.2845.00.056.00
24.50
PIT-ELV.6850.5t
13.50.320
.00.000.00
13.00
ED-ELV.6856.5
13.50.320.00
.000.00
13.00
DEPTH PRPTY AREA-1ÜRDAT AAA
HOLE-tTESTAI
THIS SAMPLE SET IS BARREN FOR THE INTERVAL TESTED.
F I G U R E I4.ltEXAMPLE OF DETAILED L I S T I N G OF ORE INTERVALS ANALYSIS BY SAMPLE SET
(FOR OPEN PIT MODE)
179

URAD ORE R E S E R V E SYSTEM
SCOP. ANALYSIS DF 1NTERHED. 'JDAT FILE 'IJDATCB.B ', DATE: MAR 86RUN:OPEN PIT ORE INTERVAL ANALYSIS; COMPARE SUfflWRf V5 DETAIL P-C.BUfiBLtl. TKO HOLES, FiLE UDATCB.B, FOR COMPARISON.NO PLOT-DATA OUTPUT REQUESTED RUN BY:P DEVERBIE
bBU«2 D
a VVV279.
hTEST0 T 13,
2 pVDATA Y50 6 .320 t
60ÛO l85. 3 K
5000P10850.5.0 N 13.0 t
E 10850..09 .
5 3000
t!»3
DD
259.5 T279.0 T
16.50 613.50 6
.284
.J20112.2 «54.8 M .i) M 24.5 t.0 K 13.u t 5.0 g
.Og.056.ÛÛO
aAAA tiTESTA! püRDAT V 5000 X 5000P 4850.5 E 6B5Û.5 0
F I G U R EEXAMPLE OF SUMMARY LISTING OF ORE INTERVALS ANALYSIS BY SAMPLE SET
(FOR PIT MODE)
180
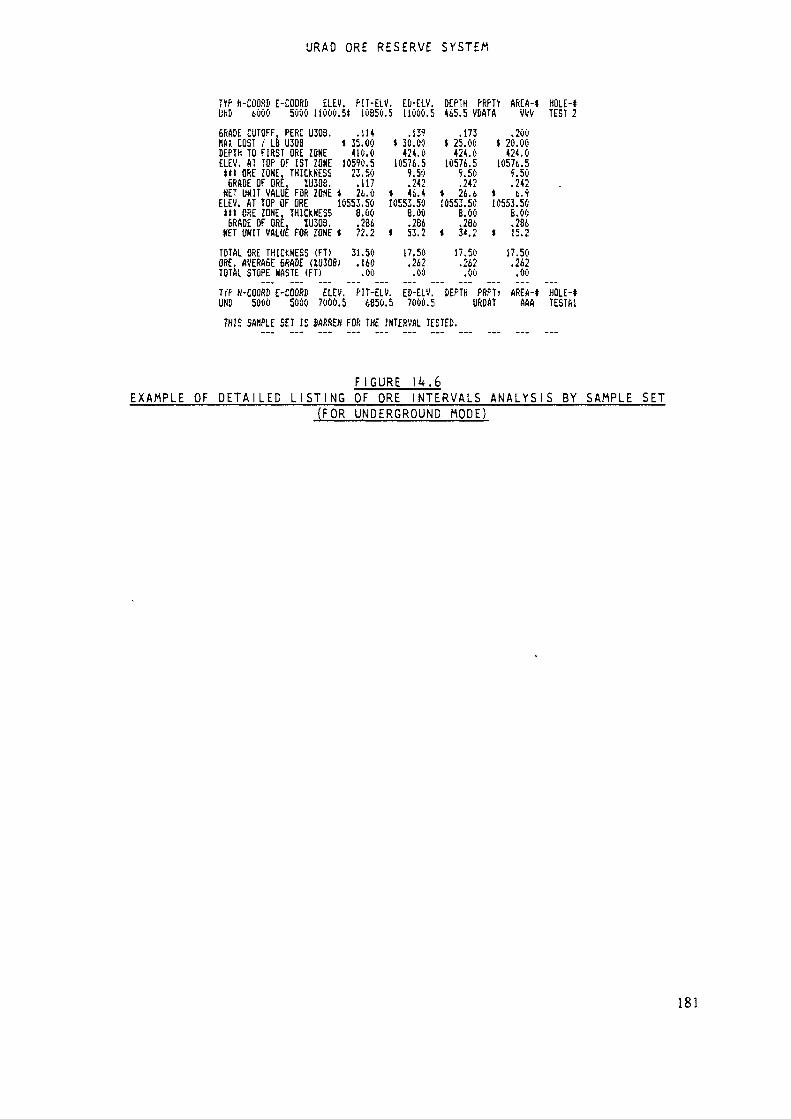
URAO ORE RESERVE SYSTEM
TVP N-COÜRÜ E-CQÛRD ELEV. PIT-ELV. ED-ELV. DEfTH PRPTy AREA-« HOLE-iUND 6000 5000 11000.5* 10850.5 110ÛÛ.5 465.5 VDftTA VW TEST 2
BRADE CUTOFF. PERC U30B. .114BAI COST / L§ U30B » 35.00DEPTH TO FIRST ORE ZONE 410.0ELEV. AT TOP OF 1ST ZONE 10590.5W ORE ZONE. THICKNESS 23.50GRADE OF ORE, ÏU308. .117NET UNIT VALUE FOR ZONE 1 24.0ELEV. AT TOP OF ORE 10553.50III ORE ZONE, THICKNESS 8.00BRADE OF ORE. ÏU308. .286NET UNIT VALUE FOR ZONE « 72.2TOTAL ORE THICKNESS (FT) 31.50ORE, AVERAGE GRADE UÜ30B; .160TOTAL STOPE NASTE IFT) .00Tff K-COflRD E-COORD ELEV. PIT-ELUND 500Û 5000 7000.5 6850
.139« 30.00424.010576.59.50.242» 46.410553.508.00.286« 53.217.50.262.00
V. ED-ELV..5 7000.5
.173 .200» 25.00 * 20.00424.0 424.010576.5 10576.59.50 9.50.242 .242t 26.6 i 6.910553.50 10553.508.00 B.OO.286 .286« 34.2 « 15.217.50 17.50.262 .262.00 .00
DEPTH PRPTT AREA-*URDAT AAA HOLE-1TESTAITHIS SA«PLE SET IS BARREN FOR THE INTERVAL TESTED.
F I G U R EEXAMPLE OF D E T A I L E D L I S T I N G OF ORE INTERVALS A N A L Y S I S BY SAMPLE SET
(FOR UNDERGROUND MODE)
181
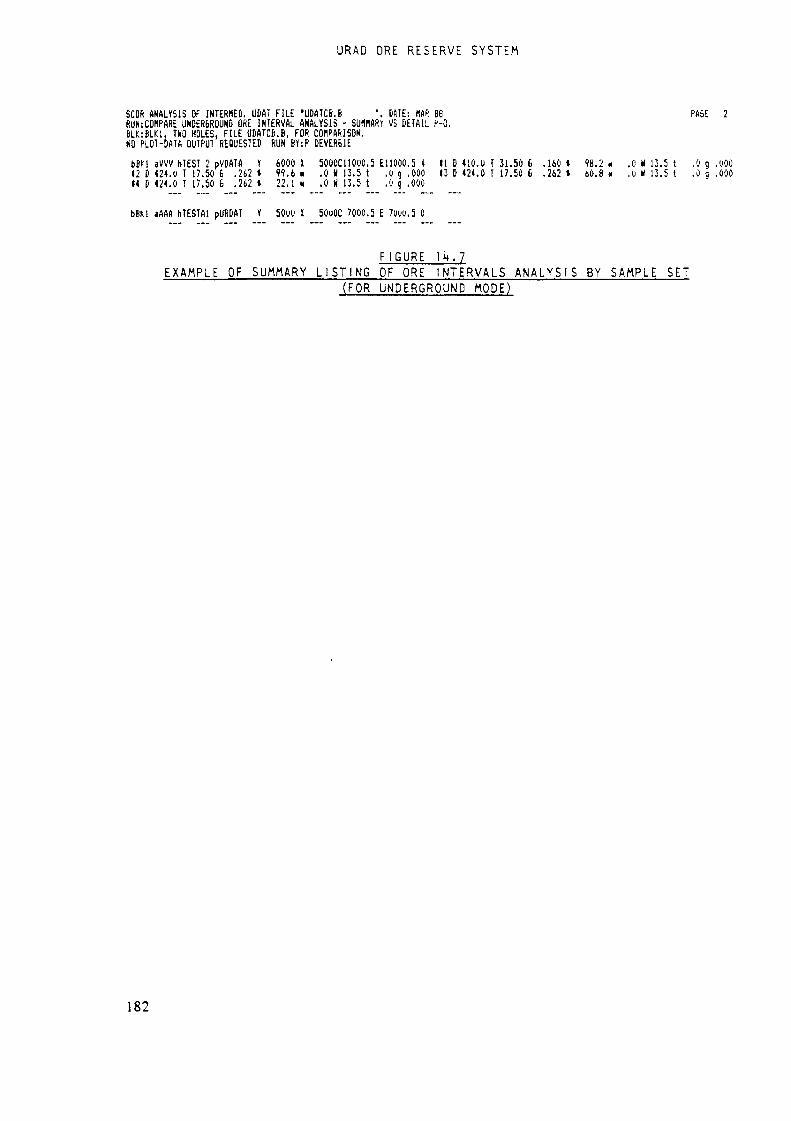
URAD ORE RESERVE SYSTEM
SCÛR ANALfSlS OF INTERMEO. MAT FILE 'UDATC6.B '. DATE: KAR B6RUNiCONPARE UNOER6RÜUND ORE INTERVAL ANALVSIS - SUflHARY VS DETAIL f-0.BU:8LKl, TMO HOLES. FILE UDATCB.8, FOR COMPARISON.KO PLOT-DATA OUTPUT REQUESTED RUN BY:P DEVER&IEtiBM »VVV hTEST 2 pVDATA Ï 6000 »»2 D 424.U T 17.50 6 .262 » 99.4 n»4 D 424.0 T 17.50 6 .262 J 22.1 n
50ÜOC110U0.5 E11000.5 4.0 K 13.5 t .0 g .000.0 K 13.5 t .Og .000
11 D 410.0 T 31.50 6D 424.0 T 17.50 E
.160
.2629fl.260.8
RASE 2
13.5 t .0 g13.5 t .0 9
.UOO
.000
bBKl lAAA hTESTAl pUROAT V 50UU Ï 5ÛOOC 7000.5 E 7W0.5 0
F I G U R E lit. 7EXAMPLE OF SUMMARY LISTING OF ORE INTERVALS ANALYSIS BY SAMPLE SET
(FOR UNDERGROUND MODE)
182
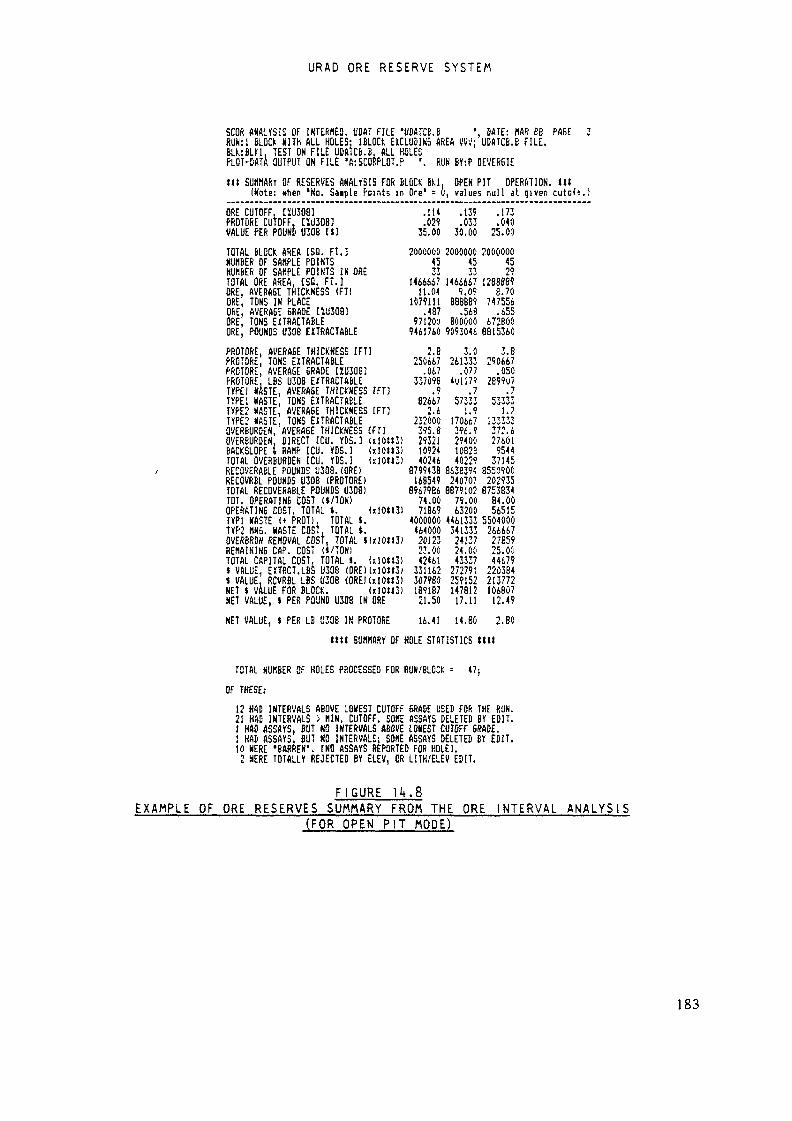
URAD ORE RESERVE SYSTEM
SCOR ANALYSIS 0F INTERNED. ÜBAT FILE 'UBATCB.B ', DATE: NAR B6 PAGE 3RUN:1 BLOC* HITH ALL HOLES; IBLÛCfc EtCLUDIKi AREA W,1; UDATCB.6 FILE.BLk:BLia. TEST ON FILE UDAÏCB.È. ALL «ÖLESPLOT-DATA OUTPUT ON FILE 'JüSCÖRPLDT.P '. RUN BY:P DEVER61E
W SUHMARr OF RESERVES ANALYSIS FOR BLOCK BU. OPEN PIT OPERATION, «t(Note: »hen 'No. SaipU Points in Ore1 = 6, values null at given cutofO
ORE CUTOFF, [XU308) .114 .139 .173PROTORE CUTOFF, [IÜ30B) .029 .033 .040VALUE PER POUND U30B ti) 35.00 30.00 25.00
TOTAL BLOCK AREA [SB. FT.]NUMBER OF SAMPLE POINTSNUMBER OF SAMPLE POINTS IN ORETOTAL ORE AREA. (SO. FT.]ORE, AVERAGE THICKNESS (FT)ORE, TONS IN PLACEORE, AVERAGE GRADE [ÏU3083ORE, TONS EJTRACTABLEORE, POUNDS U308 EKTRACTftfiLEPROTORE. AVERAGE THICKNESS IFT] 2.8 3.0 3.BPROTORE, TONS EURACTABLE 250667 261333 290667PROTORE, AVERAGE GRADE IÏU308] .067 .077 .050PROTORE. LBS U30B EÜTRACTA6LE 337098 4ull7« 2899U7TYPE! «ASTE, AVERAGE THICKNESS IFT) .9 .7 .7TYPE1 KASTE, TONS EXTRACTABLE 82667 57333 53333TYPE2 «ASTE, AVERAGE THICKNESS IFT) 2.6 1.9 1.7TYPE: KASTE, TONS EXTRACTABLE 232000 no6t7 133333OVERBURDEN, AVERAGE THICKNESS CFT] 3«.fi 396.1 372.6OVERBURDEN, DIRECT ICU. YDS.] U10U3) 29321 29400 27601BACKSLOPE i RAMP ICU. YDS.) (ilOItï) 10924 1Û82B 9544TOTAL OVERBURDEN ICU. YDS.) (xlOU3) 40246 40229 37145RECOVERABLE POUNDS 11308. (OREI 8799438 8638394 8550900RECOVRBL POUNDS U308 (PftOTORE) 168549 240707 202935TOTAL RECOVERABLE POUNDS U308I 8967986 8879102 8753834TOT. OPERATING COST (»/TON) 74.00 79.00 84.00OPERATING COST, TOTAL ». <ilOM3) 71869 63200 56515TYP1 KASTE i* PROT), TOTAL $. 4000000 4461333 5504000TYP2 MNG. WASTE COSt. TOTAL J. 464000 341333 266667OVER6RDN REMOVAL COST. TOTAL $lxlOW) 20123 24137 27859REMAINING CAP. COST (i/TONl 23.00 24.OC 25.00TOTAL CAPITAL COST. TOTAL ». U10U3I 42461 43337 44679« VALUE, EXTRCT.LBS U306 (ORE) U1ÛU3) 331162 27279! 22Û3B4$ VALUE. RCVRBL L8S U308 <ORE!CxIO«3l 307980 259152 213772NET » VALUE FOR BLOCK. (ilOII3) 189187 147812 106807NET VALUE, $ PER POUND 1)30,8 IN ORE 21.50 17.11 12.49
20000ÔÛ 2060000 2ÛOOÛOÛ45 45 4533 33 29
1466667 1466667 128888911.04 9.09 8.70
1079111 B88B89 747556.487 .568 .655
97120U BOOOOÔ 6728009461760 909304È 8815360
«ET VALUE, * PER LB U308 IN PROTORE 16.41 14.80 2.80
Wt SUMMARY OF HOLE STATISTICS »««I
TOTAL NUMBER OF HOLES PROCESSED FOR RUH/BLOCK = 47;
OF THESE:
12 HAD INTERVALS ABOVE LOHEST CUTOFF GRADE USED FOR THE RUN.21 HAD INTERVALS > MIN. CUTOFF. SOME ASSAYS DELETED BY EDIT.1 HAD ASSAYS, BUT KO INTERVALS ABOVE LOHEST CUTOFF 6RADE.1 HAD ASSAYS. BUT NO INTERVALS: SOME ASSAYS DELETED BY EDIT.10 WERE 'BARREN'. [NO ASSAYS REPORTED FOR HOLE],
2 MERE TOTALLY REJECTED BY ELEV, OR LITH/ELEV EDIT.
F I G U R E 14.8EXAMPLE OF ORE RESERVES SUMMARY FROtt THE ORE
(FOR OPEN PIT MODE)INTERVAL ANALYSIS
183

URAD ORE RESERVE SYSTEM
SCOR ANALYSIS OF INTERNED. UDAT FILE 'UDATCB.BRUHTEST OH ONE BLOC*, ALL DATA FROM UDATCß.B FILL.BLK:BLU, TEST ON FILE UfiATCS.B, ALL HOLESNO PLOT-DATA OUTPUT REflUESTED RUN BY: P DEVERÛIE
DfiTE: «AR 88
«It SUHMARY OF RESERVES ANALYSIS FOR BLOCK BU.(Note: Kh«n 'No. Saiple Points in Ore' = 0UNDERGROUND OPERATION. IK, values null at given cuto«.)ORE CUTOFF, CÏU308JVALUE PER POUND U308 It]TOTAL BLOCK AREA [38. FT.)NUMBER OF SAMPLE POINTSNUMBER OF SAMPLE POINTS IN ORETOTAL ORE AREA, £SQ. FT.]ORE. AVERAGE THICKNESS (FT)ORE, TUNS IN PLACEORE, AVERAGE GRADE CIU3081ORE, TONS «TRACTABLEORE, POUNDS U308 EÏTRACTABLESTOPE HASTE. AVERAGE THICKNESSSTOPE KASTE, TDKS EXTRACTABLETOT. OPERATING COST (i/TON)OPERATING COST, TOTAL J.STDPE KNG HASTE COST, TOTAL i.TOTAL CAPITAL COST (i/TON)TOTAL CAPITAL COST. TOTAL ».
«10»*3iCFT]
(xlOU31
ixlO**311 VALUE. EXTRCT.LBS U308 (ORE! lx!w»3)NET 1 VALUE FOR BLOCK,NET VALUE, t PER POUND U306 IK(»101*31ORE
.11435.00200ÛOOO4726110638326.52195662S.329185822712220
1.41U1064tS.OO120785151595810.0018582«2769128680823.47
.13930.0020000004724102127723.2915S5532.384150625511560
1.27815672.00108450117234110.001506334680522212019.21
.17325.00200000047
2293617019 221199433.467
11394611044fi.63368679.009001750531910.001139526599516407815.42
.20020.002000000472189361716.559B5S16.536936525K>047
.i"i0
8a.OO805410lu. Ou9365200932111025I1.Û5
»tit SUMMARY OF HOLE STATISTICS mi
TOTAL NUtlBER OF HOLES PROCESSED FUR RUN/BLOCK = «7jOF THESE;
20 HAD INTERVALS ABOVE LOHEST CUTOFF GRADE USED FOR THE RUK.6 HAD INTERVALS > HI«. CUTOFF. SOME ASSAYS DELETED E" EDIT.8 HAD ASSAYS, BUT NO INTERVALS ABOVE LOÜEST CUTOFF GRADE.3 HAD ASSAYS. BUT NO INTERVALS; SOME ASSAYS DELETED BY EDIT.10 KERE 'BARREN1. [NO ASSAYS REPORTED FOR HOLEI.
F I G U R E 14.9EXAMPLE OF ORE RESERVES SUMMARY FROM THE ORE
(FOR UNDERGROUND NODE)INTERVAL A N A L Y S I S
184
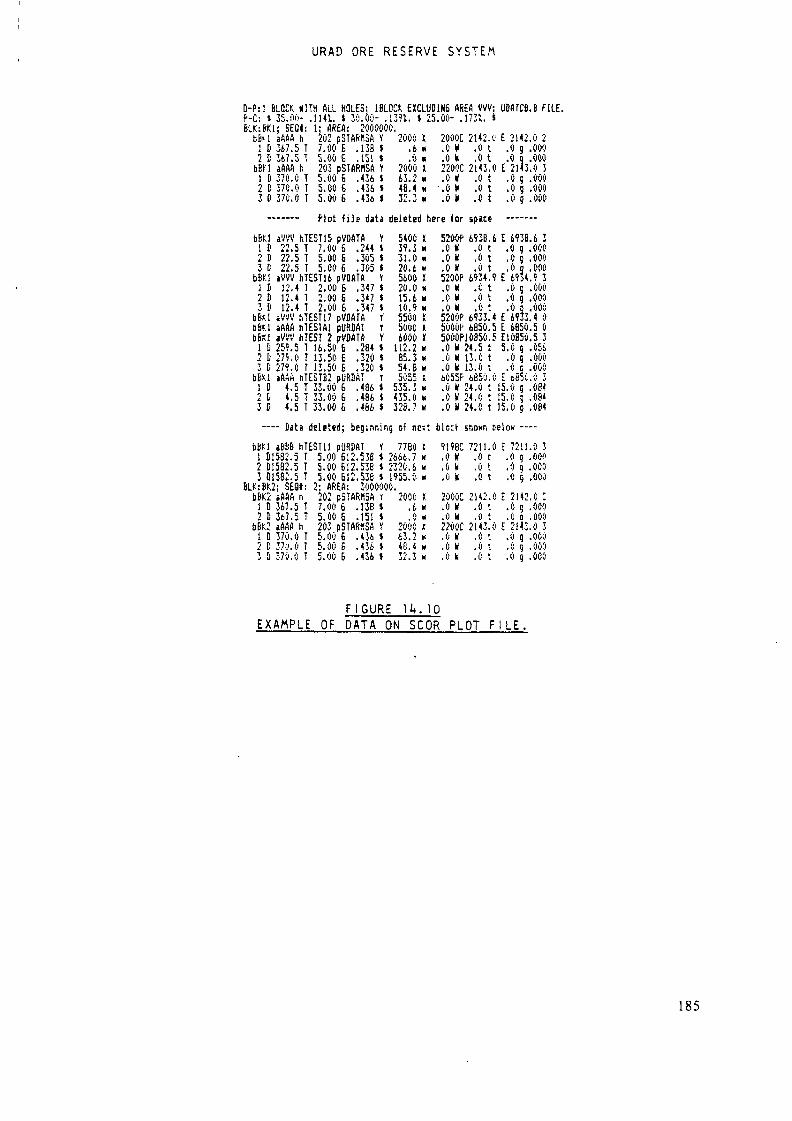
URAD ORE R E S E R V E SYSTEM
D-P:1 8LCCK KITH ALL HOLES; IBLDCK EXCLUOIN6 AREA WV; UDATCB.B FILE.P-C: » 35.im- .1141. » 30.ÙO- .1391. $ 25.00- .173X. *BU:8K1; SEBI: i; AREA: 2000000.
bBM aAAA h 202 pSTARKSA Y 2000 'l 2ÛÛÛC 2142.1' E 2142.0 2! D 3i7.5 T 7.00 6 .138 » .6 » .OK .0 t .0 g .0002 D 367.5 T 5.006 .151» .0« .OK .Ot .0 9 .000
ten âAAA h 203 pSTARMSft Y 2000 I 2200C 2143.0 E 2143.0 31 D 37Ù.O T 5.00 6 .436 » 63.2 « .OK .Ot .Og Ml2 D 37Û.O T 5.006 .436* 46.4 M ' . O * .0 t .0 9 .0003 D 370.0 T 5.00 6 .434 » 32.3 « .OK .6 t .0 g .000
flot file data deleted here tor space
bBU1 D2 D3 D
bBKl1 S2 D3 D
fa 8k!D 6UbBfCl
1 D2 D3 D
&BK11 D2 D3 D
*VW22.522.522.5
aVVV12.412.412.4
»WaAAAaVVV259.5J75.0279.0aAAA
4.54.54.5
HTEST15 pVDATAT 7.00 6 .244T 5.00 6 .305T 5.00 6 .305
hTESm pVDATAT 2.00 B .347T 2.00 6 .347T 2.00 6 .347
hTESTU pVOAFAhlESIAl pURDAihTEST 2 pVBATA
T 16.50 6 .284T 13.50 6 .320T 13.50 6 .320
HTE3TB2 pURDftTT 33.00 6 .486T 33.00 6 .486Î 33.00 6 .486
YS$iY$$«rTY«^5Tttt
—— Data deleted; beginning
bBM aBBB hTESTll pURDAT1 D1582.52 D1582.53 Dl 582. 5
BLK:BK2bîK2
1 D2 D
bßK21 D2 D3 D
T 5.00 612.538T 5.00 612.53BT 5.00 612.538
1* 2t 2
540039.331.020.6560020.015.610.9550050004000
112.285.354.85055
535.3435.0328.7
1MMKKNHH1tXWMMlKMM
of next
7780666.7320.6
* 1955.0
iKM1«
5200P.0*.0 K.0 H5200P.0 k.0 N.0 M5200C5ÙOÙP
6938.0.0.0
6934.C.0.0
69336650
5000P10850.0 N.0 K.0 N6055F.0 K.0 «.0 »
block
9198C.0 X.0 M.0 K
24.513.013.06850
24.024.024.0
snotin
7211.0.0.0
.6ttt.9ttt.4.5.5ttt.0tt-
t
E,
f
£p,
£'E
693B.0« .09 -U a .6934.O g .V 9 .« a .4933.6850.
£10850.5.
c'55.15.15,
0 9 .y g .0 G .bSSC.«g .« g .0 g .
6 3«000000009 30000000004 05 05 30560000000 3«84081084
»elow ——
.0ttt
E
m
; SEQ»; 2; AREA: 3000000.aAAA367.5367.5aAAA370.037'i.y370.0
n 202 pSTARHSAT 7 . 0 0 6 .138T 5 . 0 0 6 .151
h 203 pSTAfttSAT 5.00 6 .436r 5 .006 ,4361 5.00 6 .436
i«ty»tt
2000.6.0
200063.248, 432.3
XMNIKNM
20ÛÙC.0 K.0 U2200C.0 N.0 ti.0 K
2142.0.0
2143.0.0.0
.utt,',rt
*
Et
£.
t
7211.O o .U 0 .0 g" .
2142.0 5 .IJ 0 .2U3.O g .« g .0 g .
0 3Où»000000
o :0000000 3000000000
F I G U R E U.10EXAMPLE 0F D A T A ON SCOR PLOT F I L E .
185
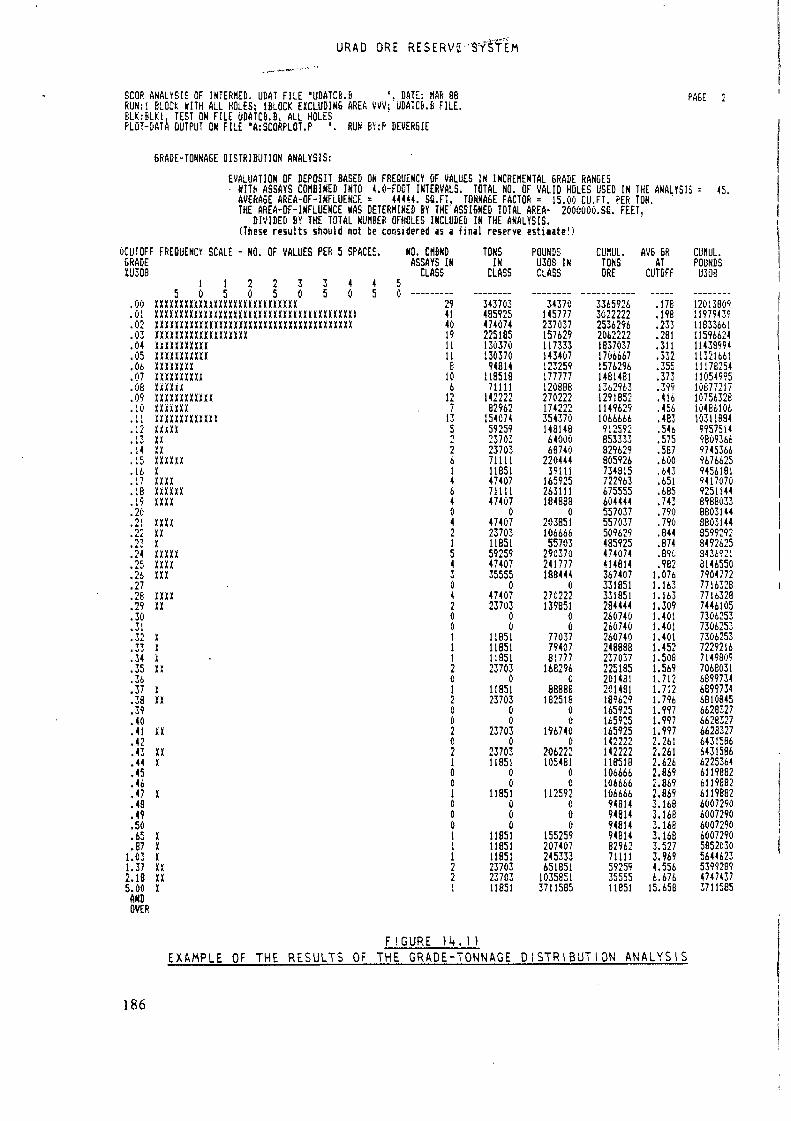
URAD ORE RESERVS-'SffTEM
SCOR ANALYSIS OF INTERNED. UDAT FILE "UDATCB.B '. BATE: MAR 88RUN:! BLOC* KITH ALL HOLES; 18LOCK EXCLUDING AREA VVV;'UMTCB.fi FILE.BLKiBLKl. TEST ON FILE UDATCB.B. ALL HOLESPLOT-DATA OUTPUT ON FILE 'A:SCORPLOT.P '. m BY:P DEVER6IE
PABE
GRADE-TONNAGE DISTRIBUTION ANALYSIS:EVALUATION OF DEPOSIT BASED ON FREflUENCY OF VALUES IN INCREMENTAL GRADE RANGES- «ÎTH ASSAYS COMBINED INTO 4.0-FOOT INTERVALS. TOTAL NO. OF VALID HOLES USED IN THE ANALYSIS =AVERAGE AREA-OF-INFLUENCE = «44«. Sfl.FT. TONNAGE FACTOR = 15.00 CU.FT. PER TON. 'THE AREA-OF-INFLUENCE «AS DETERMINED BY THE'ASSIGNED TOTAL AREA- 2000000.SC. FEET.DIVIDED BY THE TOTAL NUMBER OFHOLES INCLUDED IN THE ANALYSIS.(These results should not be considered K t final reserve estiiate!)
45,
OCUTOFF FREQUENCY SCALE - NO. OF VALUES PER 5 SPACES.GRADEÏU308
1 1 2 2 3 3 4 4 55 0 5 0 5 0 5 0 5 0
.00 x x x x x x x x x x x x n x x x x x x x x x x x x x x x.01 x x x x x x x x x x x x x x x x x x x x x x x x x x x x x x x x x x x x m x ».02 x x x x x x x x x m x x x x x x x x x m x x x x x x x x x x x x x x x x
. 0 3 X X X X X X X X X X X X X X X X X X X
. 0 4 X X X X X X X X X X X.05 xxxxmmx
.06 x x x x x x x i :.07 n x x x x x x x x
.08 mxa.09 nxmwm
. 1 0 X X X X X X X.1! mxxmxxxxx
.12 xxnx
.13 XX.u n
. 1 5 X X X X X K
.16 X
. 1 7 X X X X
. 1 8 X X X X X K
. 1 9 X X X X
.20
. 2 ! X X X X
. 2 2 X X
.23 X
.24 xnn
. 2 5 X X X X
. 2 6 X X X
.27
. 2 8 X X X X
.29 XX
.30
.31
.32 X
.33 X
.34 X
.35 XX
.36
.37 X
.38 XX
.39
.40
.41 XX
.42.43 XX.44 X.45.46.47 X.48.49.50.65 X.87 X
1.03 X1.37 XX2.18 XX5.00 X
ANDOVER
F 1EXAMPLE OF THE RESULTS OF THE
NO. CMBNDASSAYS IN
CLASS
2941401911116
106
127
13522614640421543042001112012002021001000111224
CURE U.
TONSIN
CLASS
34370348592547407422518513037013037094814
M851871111
14222282962
1540745925923703237037111111851474077111147407
0474072370311851592594740735555
04740723703
00
11851118511185123703
01185123703
00
237030
2370311851
00
11851000
11851118511185!237032370311851
11GRADE-TONNAGE
POUNDSU30B INCLASS
343701457772370371576291173331434071232591777771208882702221742223543701481486400068740
2204443911!
165925263111184888
020385110666655703
290370241777188444
0270222139851
00
770377940781777
1682960
88889182518
00
1967400
206222105481
00
112592000
155259207407245333651851
10358513711585
DISTRIBUT
CUMUL.TONSORE
3365926302222225362962062222183703717066671576296148148113629631291852114962910666669125928533338296298059267348157229636755556044445570375570375096294859254740744148143674073318513318512844442607402607402607402488882370372251852014812014B1189629165925165925165925142222142222118518106666106666106666
9481 4948149481494B148296271111592593555511851
AVB GRAT
CUTOFF
.17B
.198
.233
.281
.311
.332
.355
.373
.399.416.456.483.546.575.587.600.643.651.685.743.790.790.844.874.89Û.982
1.0761.1631.1631.3091.4011.4011.4011.4521.5081.5691.7121.7121.7961.9971.9971.9972.2612.2612.6262.8692.8692.8693.1683.1683.1683.1683.5273.9694.5566.676
15.658
CUMUL.POUNDS
U308
1201380911979439118336611159662411438994U32166111178254li 05499510677217107563261048610610311884995751498093669745366967662594561819417070925114489880338803 144880314485992926492625843692181465507904772771632877163287446105730625373062537306253722921671498097068031689973468997346810845662832766283276628327643158664315866225364611988261198826119882600729060072906007290600729058520305644623539928947474373711585
ION A N A L Y S I S
186
APPENDIX A: GAMLOG METHOD
15.0 APPENDIX A: THE GAHLOG METHOD
15.1 INTRODUCTION
The GAMLOG method is essentially a tria 1-and-error iterative process of loginterpretation used to determine U308 grades for a series of 1/2 or 1 footlayers comprising the ore zone under analysis. The GAMLOG program was firstdeveloped by Scott, 19&2 and is cited in the following reference:GAMLOG (J.H. Scott, 19&2) The interpretation of gamma-ray log data using ad i g i t a l computer. U.S. Atomic Energy Commision, GJO, RME-143-The objective of the process is to find a grade for each separate gamma-raylog anomaly (one from each separate layer) which could be composited to forman overall anomaly that would closely match the real anomaly under analysis.Iterations are performed until sufficient accuracy is achieved.To develop the GAMLOG program it was neccesary to establish "type" anomaliesfor 1/2 and 1 foot thick layers of homogeneous uranium ore. The deflectionamplitudes at various points along the type anomalies were determined atpercentages of peak amplitude and therefore were independent of grade. Sinceno homogeneous ore layers exactly 1/2 and 1 foot thick were a v a i l a b l e foractual logging, the type anomalies were derived through numerical differen-t i a t i o n from the log of a 4 foot thick test ore zone composed of homogeneousore (test pit N-3, AEC compound, Grand Junction, Colorado, U.S.A.).The method can be understood by imagining that the it-foot layer is composedof several contiguous 1/2 foot thick layers all having the same grade asshown in Figure 1. If hypothetical i n d i v i d u a l anomalies are plotted for all1/2 foot layers, the sum of the amplitudes of all overlapping i n d i v i d u a lanomalies w i l l equal the amplitude of the 4 foot anomaly at any depth.Referring to Figure 1, if we examine the k foot anomaly deflections A, B, C,D, E .... a series of points 1/2 foot apart, we see that by subtracting suc-cessive adjacent deflections of the k foot anomaly we obtain the amplitudea, b, c, d, c, b, a of the 1/2 foot anomaly: that is B - A = a; C - B = b; D- C = c, etc.Therefore, if we simply subtract successive readings 1/2 foot apart alongthe large anomaly, we w i l l obtain the desired points along the 1/2 footanomaly. This procedure was used to obtain the 1/2 foot type anomaly. The 1foot type anomaly was obtained by subtracting successive readings 1 footapart along the k foot anomaly.Since small percentage errors in the k foot anomaly can lead to large errorsin the 1/2 and 1 foot type anomalies, it was necessary to obtain very accu-rate deflection amplitudes for the k foot anomaly. In practice this was ac-complished by connecting a sealer to a SR-300 logger and measuringcumulative counts at fixed depths for periods of time long enough to givesufficiently accurate calculated count rates.Successive sealer readings were made at 0.1 foot intervals, starting nearthe bottom of the k foot ore zone and working upward. All count rates ob-
187
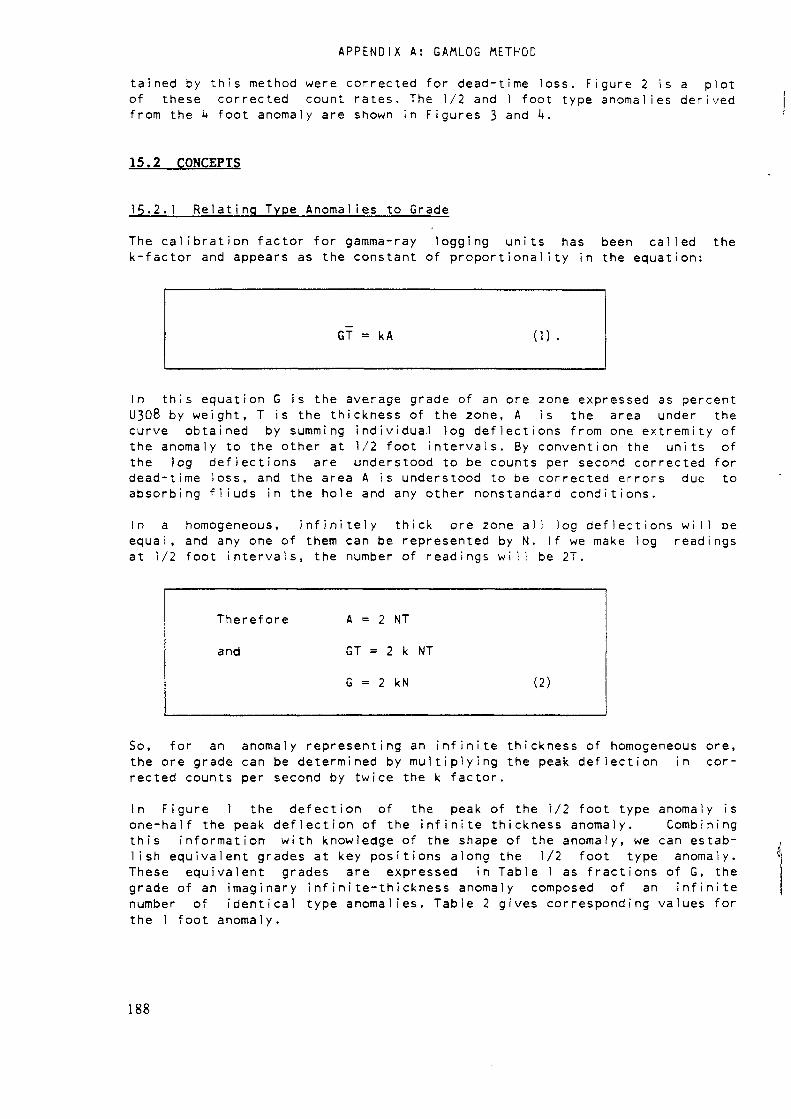
APPENDIX A: GAMLOG METHOD
tained by t h i s method were corrected for dead-time loss. Figure 2 is a plotof these corrected count rates. The 1/2 and 1 foot type anomalies derivedfrom the k foot anomaly are shown in Figures 3 and k.
15.2 CONCEPTS
15.2.1 Relating Type Anomalies to GradeThe calibration factor for gamma-ray logging units has been called thek-factor and appears as the constant of proportionality in the equation:
GT = kA (1) •
In this equation G is the average grade of an ore zone expressed as percentU308 by weight, T is the thickness of the zone, A is the area under thecurve obtained by summing individua.l log deflections from one extremity ofthe anomaly to the other at 1/2 foot intervals. By convention the units ofthe log deflections are understood to be counts per second corrected fordead-time loss, and the area A is understood to be corrected errors due toabsorbing f l i u d s in the hole and any other nonstandard conditions.In a homogeneous, i n f i n i t e l y thick ore zone all log deflections w i l l beequal, and any one of them can be represented by N. If we make log readingsat 1/2 foot intervals, the number of readings w i l l be 2T.
Therefore
andA = 2 NT
GT = 2 k NT
G = 2 kN (2)
So, for an anomaly representing an i n f i n i t e thickness of homogeneous ore,the ore grade can be determined by m u l t i p l y i n g the peak deflection in cor-rected counts per second by twice the k factor.In Figure 1 the defection of the peak of the 1/2 foot type anomaly isone-half the peak deflection of the i n f i n i t e thickness anomaly. Combiningthis information with knowledge of the shape of the anomaly, we can estab-l i s h equivalent grades at key positions along the 1/2 foot type anomaly.These equivalent grades are expressed in Table 1 as fractions of G, thegrade of an imaginary infinite-thickness anomaly composed of an i n f i n i t enumber of identical type anomalies. Table 2 gives corresponding values forthe 1 foot anomaly.
188
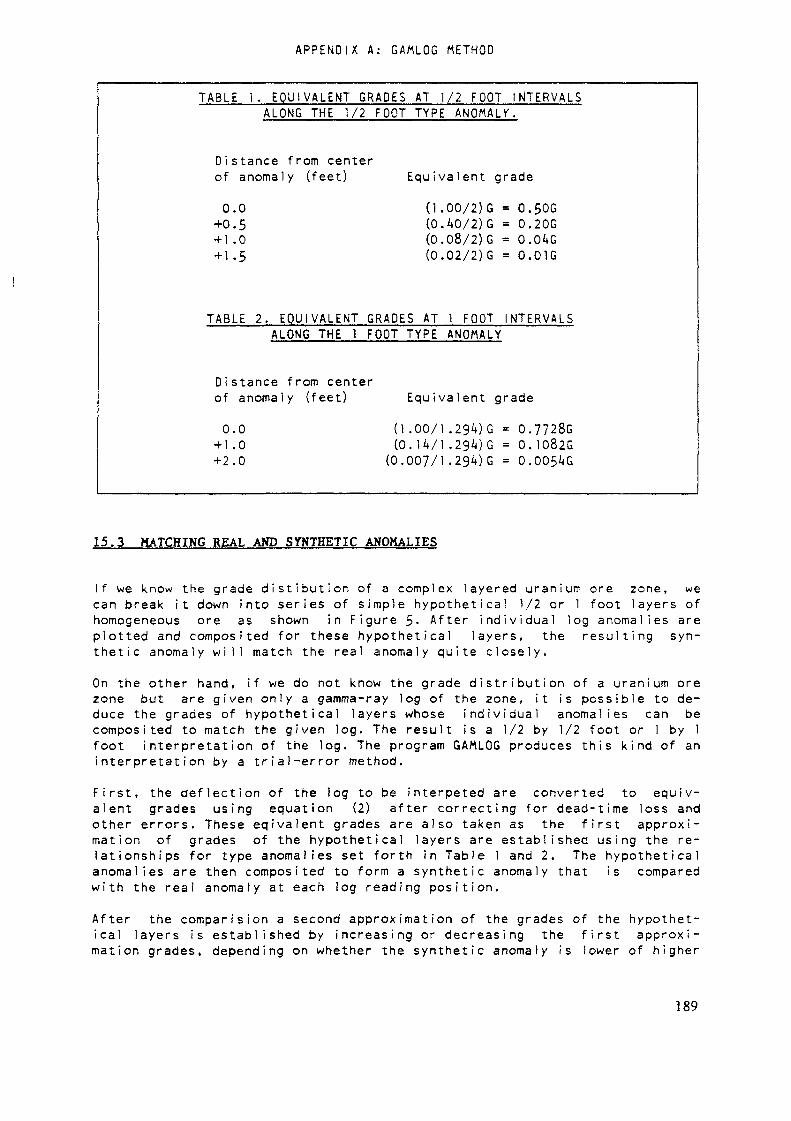
APPENDIX A: GAMLOG METHOD
TABLE 1. EQUIVALENT GRADES AT 1/2 FOOT INTERVALSALONG THE 1/2 FOOT TYPE ANOMALY.
Distance from centerof anomaly (feet) Equivalent grade
0.0 (1 .00 /2)G = 0.50G+0.5 ( O . A O / 2 ) G = 0.20G+ 1 .0 (0.08/2)G = 0.04G+ 1 .5 (0 .02/2)G = 0 .01G
TABLE 2. EQUIVALENT GRADES AT 1 FOOT INTERVALSALONG THE 1 FOOT TYPE ANOMALY
Distance from centerof anomaly (feet) Equivalent grade
0.0 (1.00/1,2Sk)G = 0.7728G+ 1.0 (O.U/1.29MG = 0.1082G+2.0 (0.007/1.294)G = 0.0054G
15.3 MATCHING REAL AND SYNTHETIC ANOMALIES
If we know the grade d i s t i b u t i o n of a complex layered uranium ore zone, wecan break it down into series of simple hypothetical 1/2 or 1 foot layers ofhomogeneous ore as shown in Figure 5- After i n d i v i d u a l log anomalies areplotted and composited for these hypothetical layers, the resulting syn-thetic anomaly w i l l match the real anomaly quite closely.On the other hand, if we do not know the grade d i s t r i b u t i o n of a uranium orezone but are given only a gamma-ray log of the zone, it is possible to de-duce the grades of hypothetical layers whose ind i v i d u a l anomalies can becomposited to match the given log. The result is a 1/2 by 1/2 foot or 1 by 1foot interpretation of the log. The program GAMLOG produces this kind of aninterpretation by a trial-error method.First, the deflection of the log to be interpeted are converted to equiv-alent grades using equation (2) after correcting for dead-time loss andother errors. These eqivalent grades are also taken as the first approxi-mation of grades of the hypothetical layers are established using the re-lationships for type anomalies set forth in Table 1 and 2. The hypotheticalanomalies are then composited to form a synthetic anomaly that is comparedwith the real anomaly at each log reading position.After the comparision a second approximation of the grades of the hypothet-ical layers is established by increasing or decreasing the f i r s t approxi-mation grades, depending on whether the synthetic anomaly is lower of higher
189

APPENDIX A: GAMLOG METHOD
than the real anomaly. Anomalies for the hypothetical layers are reestab-lished and recomposited, and another comparison is made between the realanomaly and the new synthetic anomaly.This process is repeated up to ten times. If the comparatives results i n d i -cate that the absolute values of all discrepancies are less than 0.005 per-cent U308, the process is stopped short of ten iterations. The rate atwhich the synthetic anomaly approaches a good fit w i t h real anomaly for atypical complex ore zone (AEC test pit N~5) is shown in Fiqure 6 where aver-age absolute error is plotted for each successive iteration.The iterative anomaly-matching method used in GAMLOG was based on type anom-a l i e s derived for AEC gamma-ray logging equipment. Presumably the responsecharacteristics of certain commercial logging equipment are close enough tothat of AEC eqiupment to validate GAMLOG interpretation of these other logs.However, one should avoid using GAMLOG to interpret logs which show appreci-able distortion due to logging at a speed too h i g h for the time constant.W e l l logs used by the petroleum industry commonly f a l l into the latter cate-gory. However, it would be possible to modify GAMLOG so that these oil com-pany logs could be interpreted if proper type anomalies were derived.
190
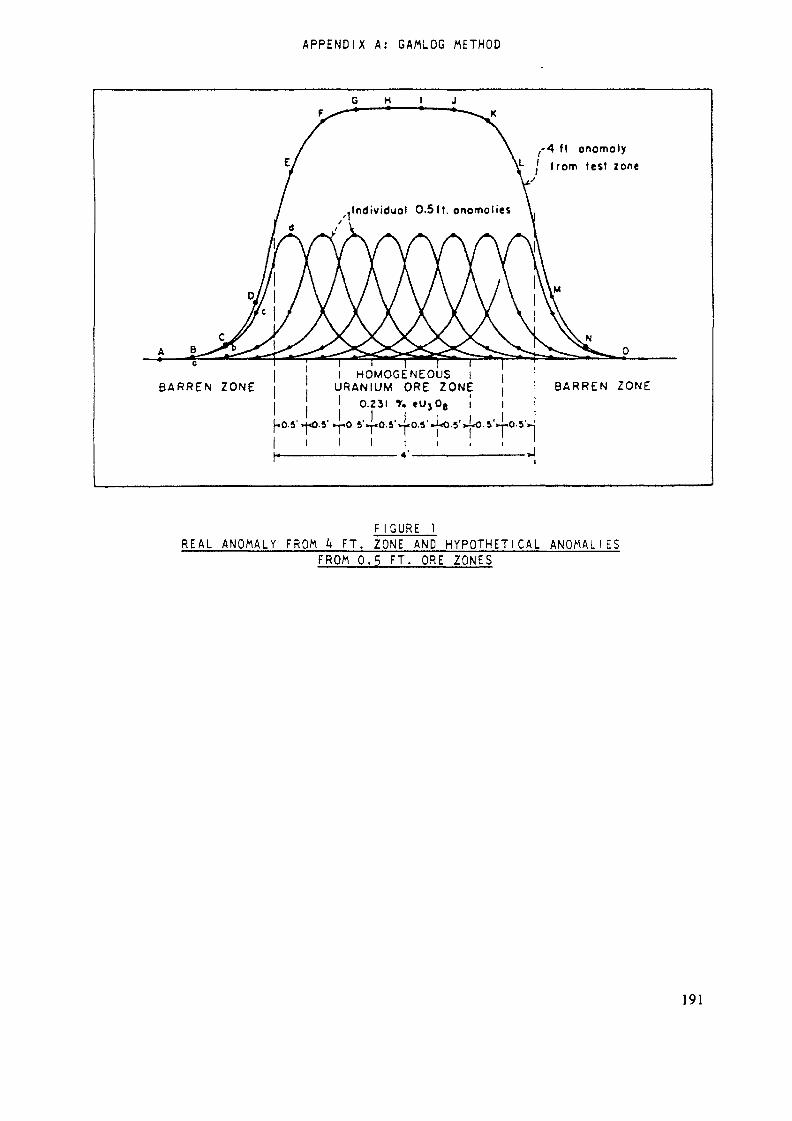
APPENDIX A: GAMLOG METHOD
6 H I J
f'A ft onomolyf rom lest zone
Individual 0.5ft. anomalies
BARREN ZONE
l i l l rI HOMOGENEOUS l
j URANIUM ORE ZONEi l O . Z 3 I % *UjO e ][-0.5' >|«O.S' «-T-0 S'^0.5'^0.5' «i«0.5'>{«O.S'
i i i i . ! !
BARREN ZONE
'«-«0.8'
>J
F I G U R E 1REAL ANOMALY FROM k FT. ZONE AND HYPOTHETICAL A N O M A L I E S
FROM O.S FT. ORE ZONES
191
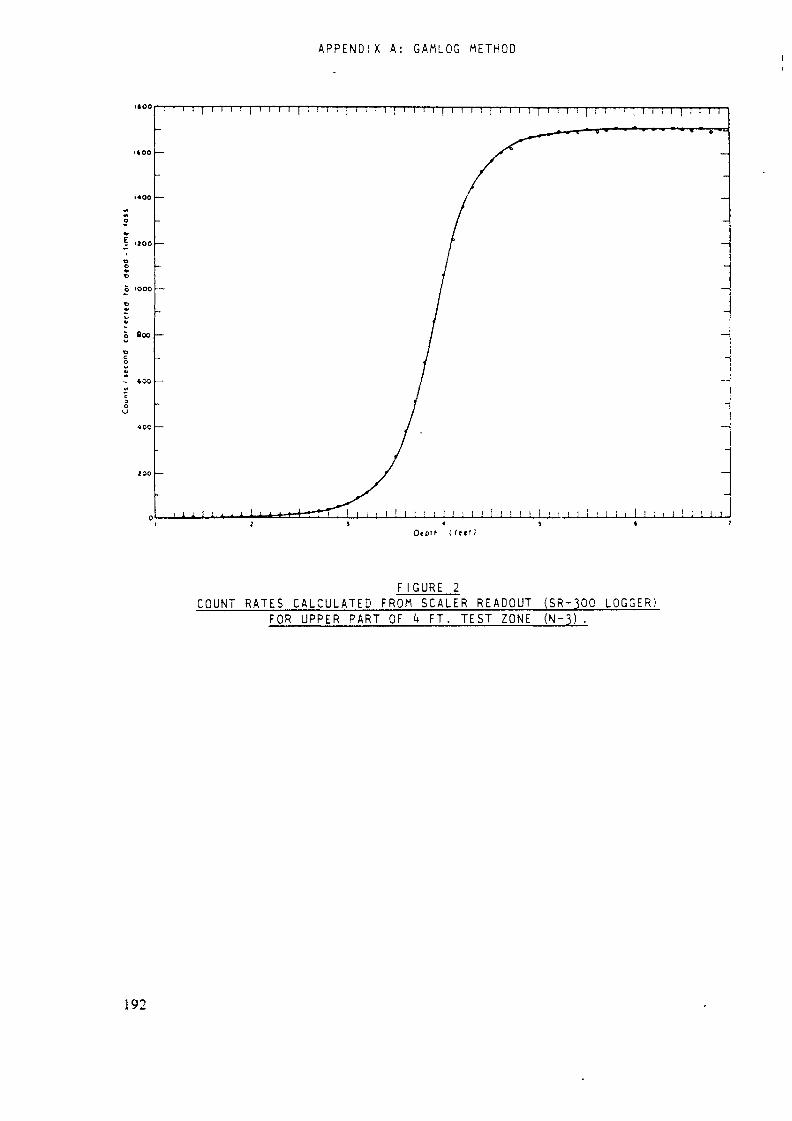
A P P E N D I X A: GAMLOG METHOD
D to'i' l U ei l
F I G U R E 2COUNT RATES CALCULATED FROM SCALER READOUT (SR-300 LOGGER)
FOR UPPER PART OF k FT. TEST ZONE (N-3) .
192

APPENDIX A: GANLOG METHOD
l T T i j J I T l j l J I i j i T I J I i l >£Tv I I I
-t 0
Distance from ctnter of onomoly (t«ci)
FIGURE 3"TYPE" ANOMALY FOR 0.5 FT. ORE ZONE.
* 2
193

APPENDIX A: GAMLOG METHOD
Distonc» from center of onomoly ( (t*t )
F I G U R E k"TYPE" ANOMALY FOR 1 FT. ORE ZONE.
194
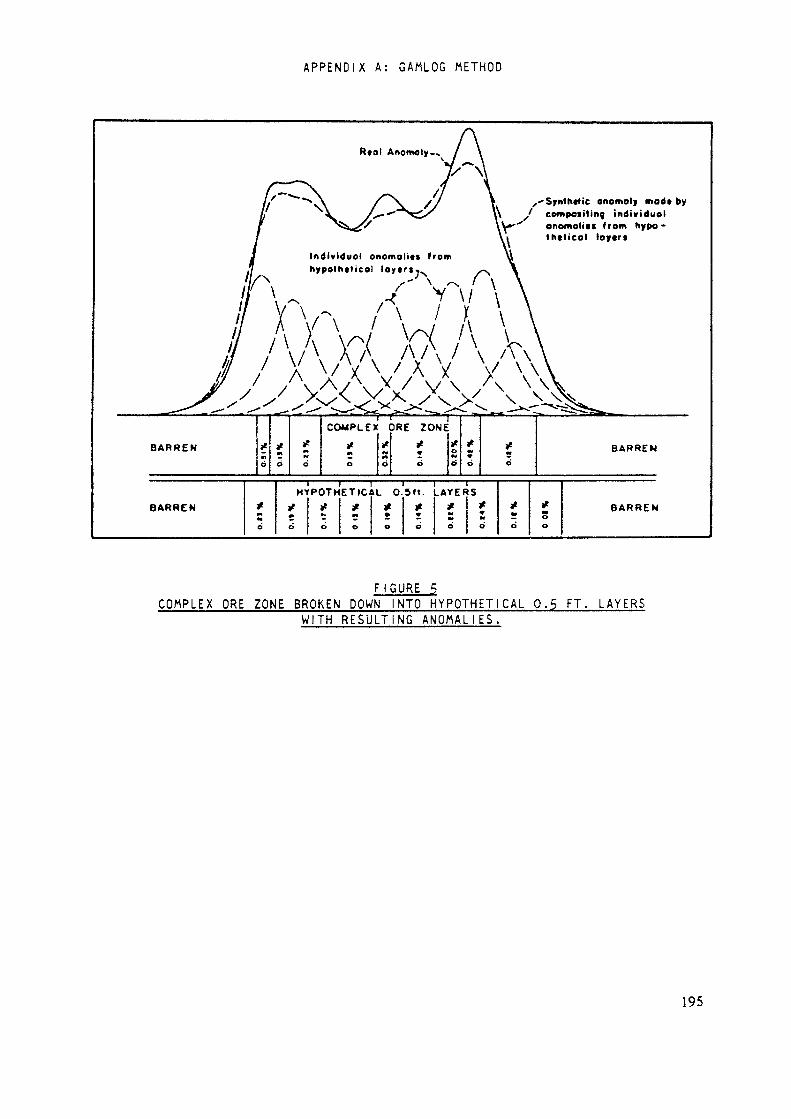
APPENDIX A: GAMLOG METHOD
Y"tot anomalies from
hypothetical
x~Sjrnlh*tic anomaly mod« bycompositing individualonomolitt (ram hypo-Ihcticol loytrt
BARREN
BARREN
«6
Z
#M0
»tmH
Ô
H'
=0
COUPLE)
M
O
POTMETIC
t -
r-it
MMÖ
r ^" — *nDRE ZONE
*6
IL O
•°
5f t .
*
r-
M
0
-AYE
M
*0
«H
à
IRS
M
BARREN
o0
BARREN
FIGURE 5COMPLEX ORE ZONE BROKEN DOWN INTO HYPOTHETICAL 0.5 FT. LAYERS
WITH RESULTING ANOMALIES.
195
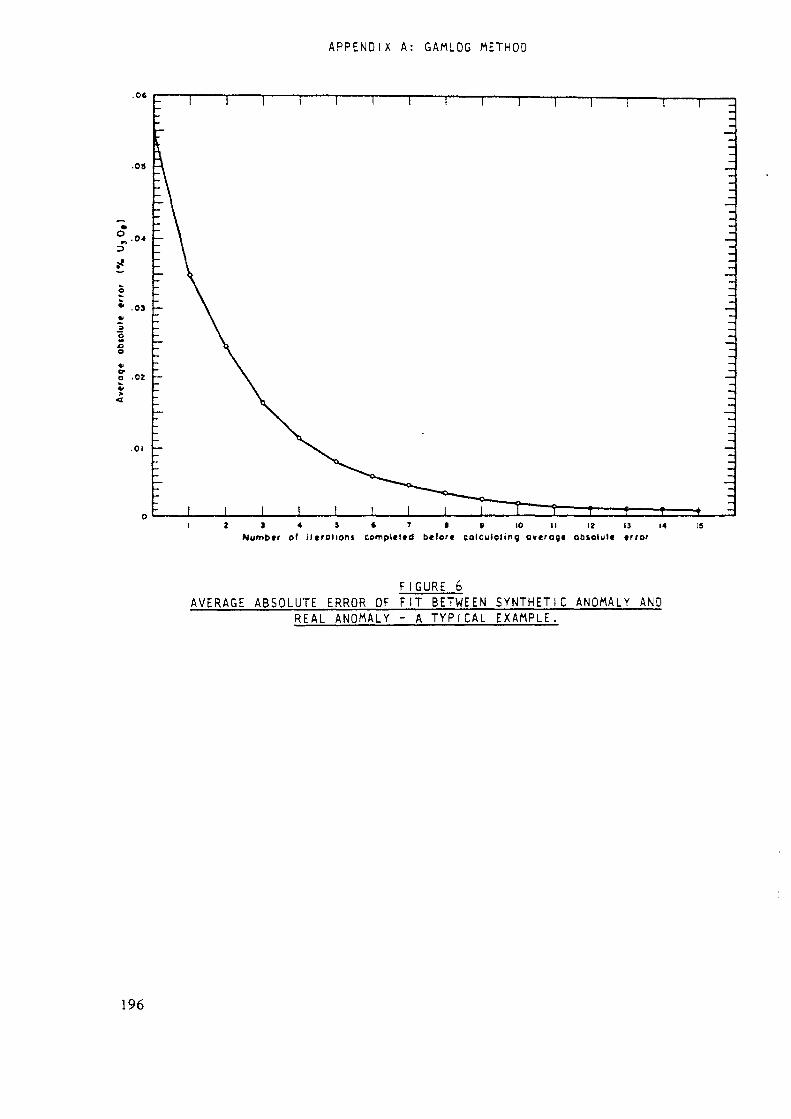
A P P E N D I X A: GAMLOG METHOD
.0«
2 J 4 S » 7 » » 10 II 12 13 14Numb »r of iterations com pit ltd bcfor« colculolmc ov«ragt obsolult «rror
FIGURE 6AVERAGE ABSOLUTE ERROR OF FIT BETWEEN SYNTHETIC ANOMALY AND
REAL ANOMALY - A TYPICAL EXAMPLE.
196
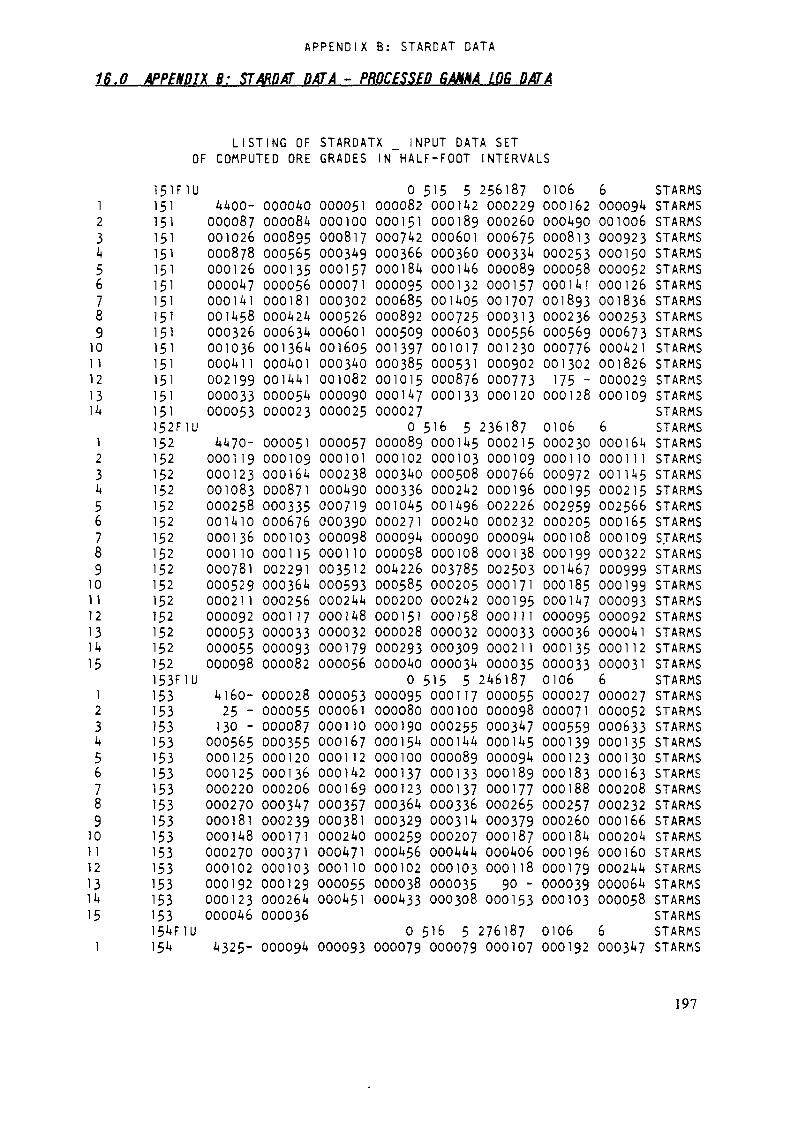
APPENDIX B: STARDAT DATA
16.0 APPENDIX B: SJARDff Off A - PROCESSED GAMMA LOG DATA
}2345678910
1 1121314123k5678910
1 112131415
l23k56789101 112131415
1
151F151151151151151151151151151151151151151151152F152152152152152152152152152152152152152152152153F153153153153153153153153153153153153153153153154F15*
LISTING ÜF STARDATX INPUT DATA SETOF COMPUTED ORE GRADES IN HALF-FOOT INTERVALS
1U 0 515 5 256187 0106 6 STARMS4400- 000040 000051 000082 000)42 000229 000162 000094 STARMS000087 000084 000100 000151 000189 000260 000490 001006 STARMS001026 000895 000817 000742 000601 000675 000813 000923 STARMS000878 000565 000349 000366 000360 000334 000253 000150 STARMS000126 000135 000157 000184 000146 000089 000058 000052 STARMS000047 000056 000071 000095 000132 000157 000141 000126 STARMS000141 00018l 000302 000685 001405 001707 001893 001836 STARMS001458 000424 000526 000892 000725 000313 000236 000253 STARMS000326 000634 000601 000509 000603 000556 000569 000673 STARMS001036 001364 001605 001397 001017 001230 000776 000421 STARMS000411 000401 000340 000385 000531 000902 001302 001826 STARMS002199 001441 001082 001015 000876 000773 175 - 000029 STARMS000033 000054 000090 000147 000133 000120 000128 000109 STARMS000053 000023 000025 000027 STARMS
1U 0 516 5 236187 0106 6 STARMS4470- 000051 000057 000089 000145 000215 000230 000164 STARMS000119 000109 oooioi 000102 000103 000109 ooono 000111 STARMS000123 000164 000238 000340 000508 000766 000972 001145 STARMS001083 000871 000490 000336 000242 000196 000195 000215 STARMS000258 000335 000719 001045 001496 002226 002959 002566 STARMS001410 000676 000390 000271 000240 000232 000205 000165 STARMS000136 000103 000098 000094 000090 000094 000108 000109 SJARMS000110 000115 000110 000098 000108 000138 000199 000322 STARMS000781 002291 003512 004226 003785 002503 001467 000999 STARMS000529 000364 000593 000585 000205 000171 000185 000199 STARMS000211 000256 000244 000200 000242 000195 00014? 000093 STARMS000092 000 H 7 000148 000151 000158 000111 000095 000092 STARMS000053 000033 000032 000028 000032 000033 000036 000041 STARMS000055 000093 000179 000293 000309 000211 000135 000112 STARMS000098 000082 000056 000040 000034 000035 000033 000031 STARMS
1U 0 515 5 246187 0106 6 STARMS4160- 000028 000053 000095 000117 000055 000027 000027 STARMS25 - 000055 000061 000080 000100 000098 000071 000052 STARMS130 - 000087 ooono 000190 000255 000347 000559 000633 STARMS
000565 000355 000167 000154 000144 000145 000139 000135 STARMS000125 000120 000112 000100 00008g 000094 000123 000130 STARMS000125 000136 000142 000137 000133 000189 000183 000163 STARMS000220 000206 000169 000123 000137 000177 000188 000208 STARMS000270 000347 000357 000364 000336 000265 000257 000232 STARMS00018l 000239 00038l 000329 000314 000379 000260 000166 STARMS000148 000171 000240 000259 00020? 00018? 000184 000204 STARMS000270 000371 000471 000456 000444 000406 000196 000160 STARMS000102 000103 ooono 000102 000103 000118 000179 000244 STARMS000192 000129 000055 000038 000035 90 - 000039 000064 STARMS000123 000264 000451 000433 000308 000153 000103 000058 STARMS000046 000036 STARMS
1U 0 516 5 276187 0106 6 STARMS4325- 000094 000093 000079 000079 00010? 000192 000347 STARMS
197
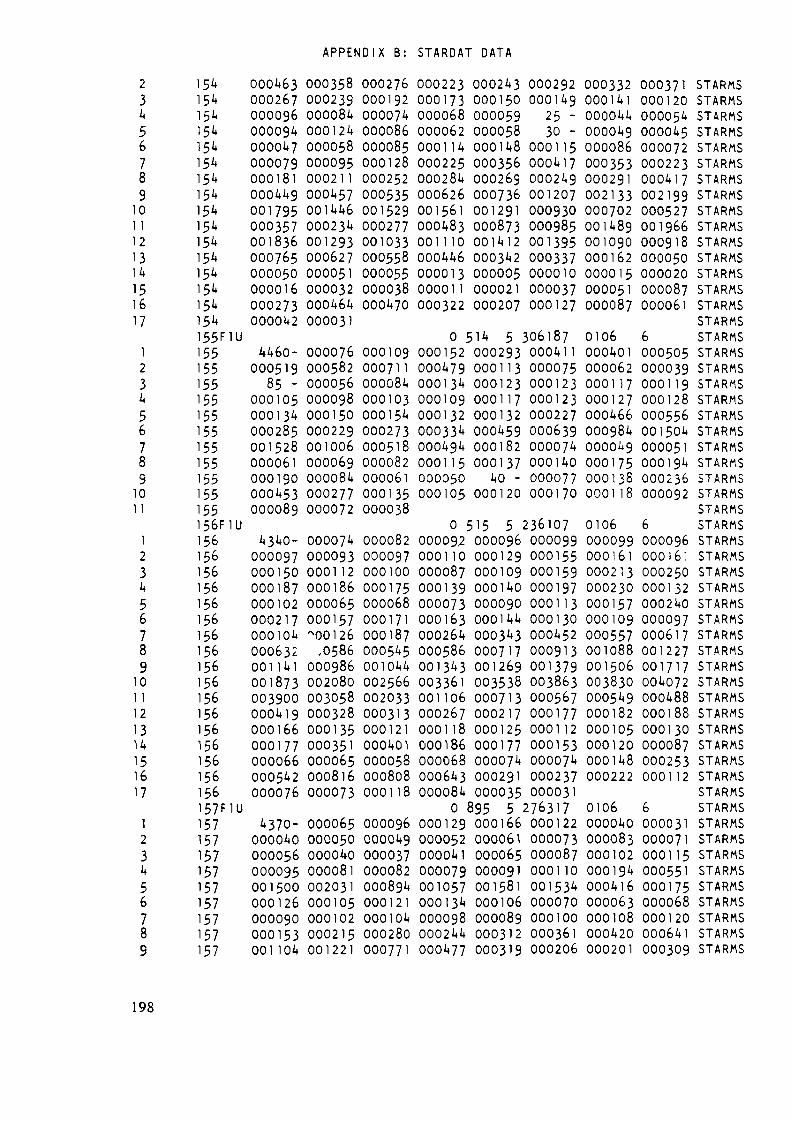
APPENDIX B: STARDAT DATA
23k56789101 1121311+151617123456789101 1
123456789101 1121314151617123456789
154154154154154154154154154154154154154154154154155F1U155155155155155155155155155155155156F1U156156156156156156156156156156156156156156156156156157F1U157157157157157157157157157
000463 000358 000276 000223 000243 000292 000332 000371 STARMS000267 000239 000192 000173 000150 000149 000141 000120 STARMS000096 000084 000074 000068 000059 25 - 000044 000054 STARMS000094 000124 000086 000062 000058 30 - 000049 000045 STARMS000047 000058 000085 000114 000148 000115 000086 000072 STARMS000079 000095 000128 000225 000356 000417 000353 000223 STARMS000181 000211 000252 000284 000269 000249 000291 000417 STARMS000449 000457 000535 000626 000736 001207 002133 002199 STARMS001795 001446 001529 001561 001291 000930 000702 000527 STARMS000357 000234 000277 000483 000873 000985 001489 001966 STARMS001836 001293 001033 001 no 001412 001395 001090 000918 STARMS000765 000627 000558 000446 000342 000337 000162 000050 STARMS000050 000051 000055 000013 000005 000010 000015 000020 STARMS000016 000032 000038 000011 000021 000037 000051 000087 STARMS000273 000464 000470 000322 000207 000127 000087 000061 STARMS000042 000031 STARMS
0 514 5 306187 0106 6 STARMS4460- 000076 000109 000152 000293 000411 000401 000505 STARMS000519 000582 000711 000479 000113 000075 000062 000039 STARMS
85 - 000056 000084 000134 000123 000123 000117 000119 STARMS000105 000098 000103 000109 000117 000123 000127 000128 STARMS000134 000150 000154 000132 000132 000227 000466 000556 STARMS000285 000229 000273 000334 000459 000639 000984 001504 STARMS001528 001006 000518 000494 000182 000074 0000 9 000051 STARMS000061 000069 000082 000115 000137 000140 000175 000194 STARMS000190 000084 000061 000050 40 - 000077 000138 000236 STARMS000453 000277 000135 000105 000120 000170 000118 000092 STARMS000089 000072 000038 STARMS
0 515 5 236107 0106 6 STARMS4340- 000074 000082 000092 000096 000099 000099 000096 STARMS000097 000093 000097 000110 000129 000155 000161 000161 STARMS000150 000112 000100 000087 000109 000159 000213 000250 STARMS000187 000186 000175 000139 000140 000197 000230 000132 STARMS000102 000065 000068 000073 000090 000113 000157 000240 STARMS000217 000157 000171 000163 000144 000130 000109 000097 STARMS000104 ^00126 000187 000264 000343 000452 000557 000617 STARMS000632 ,0586 000545 000586 000717 000913 001088 001227 STARMS001141 000986 001044 001343 001269 001379 001506 001717 STARMS001873 002080 002566 003361 003538 003863 003830 004072 STARMS003900 003058 002033 001106 000713 000567 000549 000488 STARMS000419 000328 000313 000267 000217 000177 000182 000188 STARMS000166 000135 000121 000118 000125 000112 000105 000130 STARMS000177 000351 000401 000186 000177 000153 000120 00008? STARMS000066 000065 000058 000068 000074 000074 000148 000253 STARMS000542 000816 000808 000643 000291 000237 000222 000112 STARMS000076 000073 000118 000084 000035 000031 STARMS
0 895 5 276317 0106 6 STARMS4370- 000065 000096 000129 000166 000122 000040 000031 STARMS000040 000050 000049 000052 000061 000073 000083 000071 STARMS000056 000040 000037 000041 000065 000087 000102 000115 STARMS000095 000081 000082 000079 000091 000110 000194 000551 STARMS001500 002031 000894 001057 001581 001534 000416 000175 STARMS000126 000105 000121 000134 000106 000070 000063 000068 STARMS000090 000102 000104 000098 000089 000100 000108 000120 STARMS000153 000215 000280 000244 000312 000361 000420 000641 STARMS001104 001221 000771 000477 000319 000206 000201 000309 STARMS
198

APPENDIX B: STARDAT DATA
101 1121314
123456789101 11213}k1516171231+56 .789101 112131412345678910
l]1213}23
157157157157157158F1U158158158158158158158158158158158158158158158158158159F1U159159159159159159159159159159159159159159160F1U160160160160160160160160160160160160160161F1U161161161
000269 000238 000204 000182 000182 000385 000448 000397 STARMS000184 000119 000117 000095 000105 000108 000067 000050 STARMS000051 000054 000055 000044 000033 60 - 000032 000047 STARMS000068 000092 000159 000313 000323 000261 000146 000099 STARMS000051 000039 000026 000022 000019 STARMS
0 430 5 286107 0106 6 STARMS3505- 000064 000093 000117 000159 000185 000214 00024? STARMS
000143 000074 000064 000063 000076 000105 000114 000100 STARMS000072 000054 000052 000051 000059 000095 000146 000139 STARMS000100 000136 000209 000180 000089 000051 000035 000030 STARMS000036 000049 000074 000068 000038 000039 000031 000032 STARMS000040 000051 000069 000078 000104 000089 000063 000047 STARMS000045 100 - 000138 000167 000194 000247 000395 000665 STARMS001125 001401 001221 000934 000756 000678 000647 000636 STARMS000797 001101 001474 001952 002038 001868 001073 000583 STARMS000314 000221 000207 000164 000166 000203 000202 000176 STARMS000187 000199 000222 000259 000232 000206 000199 000197 STARMS000180 000166 000146 000139 000139 000132 000101 000074 STARMS000111 000341 000644 000605 000252 000203 000293 000319 STARMS000150 000089 000091 000055 000043 000032 000032 000030 STARMS000028 000027 000030 000038 000040 000054 000076 000141 STARMS000305 000407 000650 000632 000401 000244 000249 000254 STARMS000233 000141 000119 000080 000039 000017 000016 000016 STARMS
0 436 5 196107 0106 6 STARMS3580- 000055 000066 000098 000100 000066 000077 000112 STARMS
000136 000087 000069 000077 000097 000103 000094 000108 STARMS000057 000045 50 - 000067 000095 000166 000197 000153 STARMS000134 000154 000200 000179 000114 000114 000109 000085 STARMS000071 000057 000042 000037 000048 000062 000058 000054 STARMS000051 000050 000041 000029 000025 000021 000028 000035 STARMS000057 000104 000170 000136 000084 000076 000078 000130 STARMS000280 000525 000724 000672 000884 001105 000981 001667 STARMS002523 001693 000672 000487 000390 000287 000257 000272 STARMS000297 000286 000269 000255 000212 000213 000209 000205 STARMS000206 000196 000178 000166 000148 000140 000136 000086 STARMS000089 000125 000170 000191 000151 000088 000051 000038 STARMS000029 75 - 000056 000078 000106 000184 000292 000627 STARMS000619 000438 000357 000109 000083 000060 000049 STARMS
0 426 5 196107 0106 6 STARMS3500- 000043 000053 000067 000094 000133 000204 000211 STARMS000172 000140 000116 000098 000100 000124 000169 000156 STARMS000133 000114 000087 000084 000074 000071 145 - 000036 STARMS000051 000072 000143 000142 000111 000054 000043 000072 STARMS000139 000134 000095 000090 000109 000150 000236 000470 STARMS000605 000790 000656 000325 000266 000321 000593 001162 STARMS001731 001070 001020 00146? 001453 001421 001412 001249 STARMS001128 001276 001123 000941 001047 001164 001286 001394 STARMS001737 001577 000775 000442 000442 000515 000373 000268 STARMS000228 000438 000746 000753 000410 000095 000057 000049 STARMS65 - 000030 000036 000058 000080 000109 000147 000206 STARMS
000347 000434 000375 000235 000196 000148 000112 000065 STARMS000050 000035 000027 000026 STARMS
0 420 5 296107 0106 6 STARMS3585- 000054 000095 000093 000071 000078 000111 000155 STARMS
000191 000230 000237 000270 000231 000098 000067 000055 STARMS000052 000059 000070 000114 000123 000141 000238 000306 STARMS
199
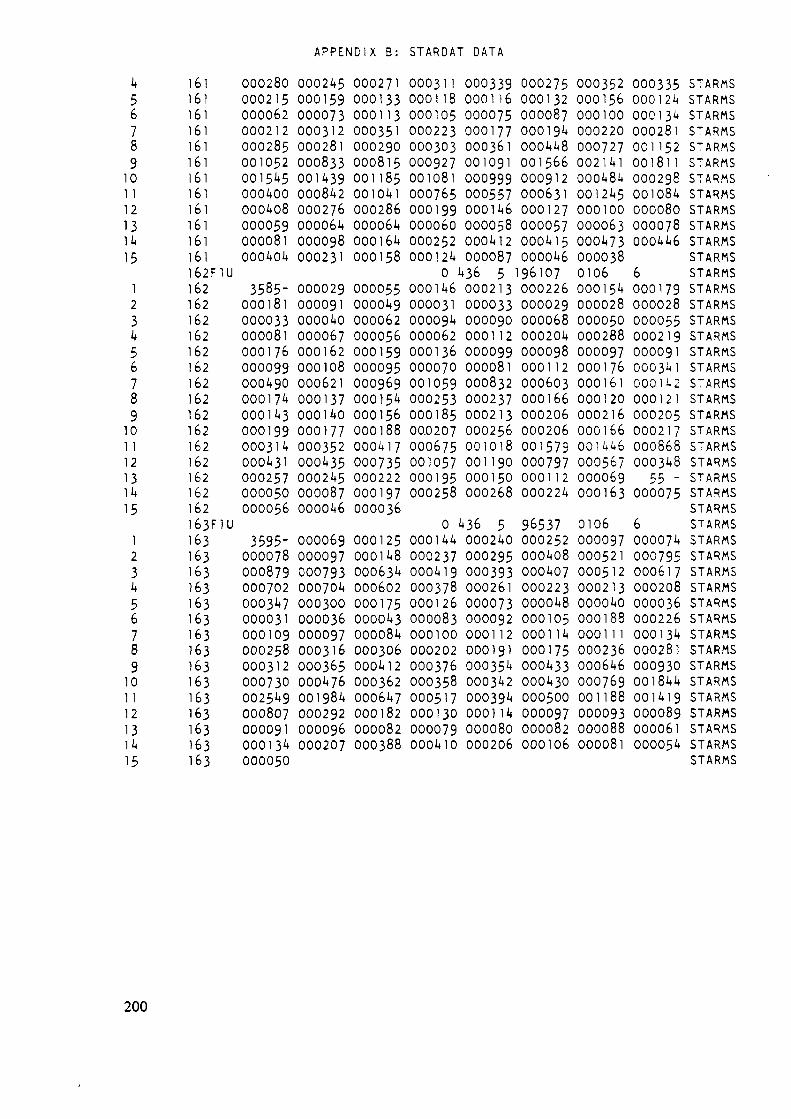
APPENDIX B: STARDAT DATA
k56789101 11213lit15
12345678910
1 112131415
1231*5678910n12131415
16l16116116116l16116116l16l16116l16l162F1U162162162162162162162162162162162162162162162163F1U163163163163163163163163163163163163163163163
000280 000245 000271 000311 000339 000275 000352 000335 STARMS000215 000159 000133 000118 000116 000132 000156 000124 STARMS000062 000073 000113 000105 000075 000087 oooioo 000134 STARMS000212 000312 000351 000223 000177 000194 000220 00028l STARMS000285 000281 000290 000303 000361 000448 000727 001152 STARMS001052 000833 000815 000927 001091 001566 002141 001811 STARMS0015^5 001439 001185 001081 000999 000912 000484 000298 STARMS000400 000842 001041 000765 000557 000631 001245 001084 STARMS000408 000276 000286 000199 000146 000127 000100 000080 STARMS000059 000064 000064 000060 000058 000057 000063 000078 STARMS000081 000098 000164 000252 000412 000415 000473 000446 STARMS000404 000231 000158 000124 00008? 000046 000038 STARMS
0 436 5 196107 0106 6 STARMS3585- 000029 000055 000146 000213 000226 00015^ 000179 STARMS
000181 000091 000049 000031 000033 000029 000028 000028 STARMS000033 000040 000062 000094 000090 000068 000050 000055 STARMS000081 000067 000056 000062 000112 000204 000288 000219 STARMS000176 000162 000159 000136 000099 000098 000097 000091 STARMS000099 000108 000095 000070 000081 000112 000176 000341 STARMS000490 000621 000969 001059 000832 000603 00016l OOOH2 SMARMS000174 000137 000154 000253 000237 000166 000120 000121 STARMS000143 000140 000156 000185 000213 000206 000216 000205 STARMS000199 000177 000188 00.0207 000256 000206 000166 000217 STARMS000314 000352 000417 000675 001018 001579 001446 000868 STARMS000431 000435 000735 001057 001190 000797 000567 000348 STARMS000257 000245 000222 000195 000150 000112 000069 55 - STARMS000050 000087 000197 000258 000268 000224 000163 000075 STARMS000056 000046 000036 STARMSo 436 5 96537 0106 6 STARMS3595- 000069 000125 000144 000240 000252 000097 000074 STARMS000078 000097 000148 000237 000295 000408 000521 000795 STARMS000879 000793 000634 000419 000393 000407 000512 000617 STARMS000702 000704 000602 000378 000261 000223 000213 000208 STARMS000347 000300 000175 000126 000073 000048 000040 000036 STARMS000031 000036 000043 000083 000092 000105 000188 000226 STARMS000109 000097 000084 000100 000112 000114 000111 000134 STARMS000258 000316 000306 000202 000191 000175 000236 000281 STARMS000312 000365 000412 000376 000354 000433 000646 000930 STARMS000730 000476 000362 000358 000342 000430 000769 001844 STARMS002549 001984 000647 000517 000394 000500 001188 001419 STARMS000807 000292 000)82 000130 000114 000097 000093 000089 STARMS000091 000096 000082 000079 000080 000082 000088 000061 STARMS000134 000207 000388 000410 000206 000106 00008l 000054 STARMS000050 STARMS
200
APPENDIX C: URDAT RUN
17.0 APPENDIX C: OUTPUT LISTING FROH URDff RUH
The following example run was made using the programs and data sets providedin the attached diskettes.
201

A P P E N D I X C: URDAT RUN
DATA ANALYSIS OF PRIHARY U-ASSAY FILE "6A1DAT4ID: URDft7 RON Oil TEST FILE 'BAfDAT'.NO INTERMEDIATE FILE OUTPUT REfi'JESTED. RUN BY:PDV
DATE: JAN 88 PA5E 1
tllUltt
COLLAR ! NORTH EAST , PIT ! DPTH! BOT ISMPLlELEV. 1 COORD. CDORD. JDEPTHISNPLIOXDICODE,7000. s! 5000 soooiiso.o! miiuoi 20 i—————————————————————————————————————U308 CHEKICAL OR CORRECTED EQUIV. RADIORETR1C ASSAYS.
BOT DPTH THK. BRADE BOT DPTH THK. 6PADE 'BOT DFTH(FT.) (FT.) U30S IF'.) (FT.) U30B (FT.)51.0 1.00 .050 70.0 5.00 .150» B\0Ï3.C 2.0« .020 '4.0 4.00 .020 89.056.0 3.00 .060 78.0 4.00 .050 91.06t.u 4.00 .020 82.0 4. 00 .0B0 96.065.0 5.00 .100» 84.0 2. 00 .300«« iui.O
COLLAR ! NORTH EAST i PIT ! DFTH! BOT iStlPLiELEV. , lUOfiD. LOOPD.lDEFTHIB^LiOïDiCÛDE,. i tn i i >i i i i i i, 7000.5. 5ooo 5vu>!15i.Ui lloo, Io ./NO ASSAYS Cfi DEPTH RECORDED, ASSUME HOLE (SAMPLE) !£ BARREN.\
COLLAP ' HOfiTH EAST ! T ! DPTH! EOT !SMPLELEV. COORD. COÛRD. IDEPTHjSHPLIÙuDlCÛDES10Û0.5 6000 50001150.0, 4661100! VIU308 EQUIV. RADIOPETPIC (UNCORR. FOR DISEÛUIL.) ANDV205 ASSAY
BOT DFTH W. BRADE BRADE 1BÛÎ DFTH TW. BRADE BRADE(FT.' (FT.) t'308 V205 , (FT.' (FT.' U308 V23Ï401. t l.OÛ .050 1,05t1 414.0 2.00 .02'.' 1. 0004o3.o 2.00 .o2t> I.o2o ! 424.0 lo.oo ,01o ,o5o408.0 5.00 .(.'40 2.000 , 424.5 .50 .200»! 1.000410.0 2.00 .1001 5.550 , 429.5 5.00 .o4u 4.oi't412.0 2.0t' .1501 .500 ; 433.5 4.00 ,5w> 5.55(
COLLAR NORTH EAST ! PIT ! DPTH 1 BOT !SNPL!ELEV. CÜURD. COORD.lDEfTP!SMPL!OlD!COD£!71)00.0 5055 60551150.0! 300ÜOO, 611!U3ÛB EÙUIV. RADIÛKETRIC ASSAYï, UNCÛRRECTED FOP DIEEQUILIBRIU
BOT DPTH W. BRADE BOT DPTH THK. BRADE 1BOT DPTH(FT.) iFT.J U306 (FT.) iFT.) U306 , (FT.)134.0 4.00 .050 170.0 15.00 .25'J»«, 209.0136.5 2.50 .000 175,0 5.00 1.040»», 220.0141.5 5.00 .020 180. t 5.00 .820» 226.0145.0 3.50 .000 , 185.0 5.00 .070 ! 230.0155.U lo.oo .llo» , 200.0 15.00 .ooû 236.0
M. BRADE BÛT DPTH(FT,' U308 (FT.)3,00 .040 105.02. 00 .«SO lO'.O2.00 .200»» 109.05. ou .1001 lll.o5.00 .350»« 113.0
C
!BOT DPTf THK. 5RADE! (FM (FT.' Ü30B435.5 2.00 .0201 437.5 1.00 .OlU441.5 10. 00 .010! 448.0 .5« .250»«
, 44". v 1.9(1 .020
M.
THK. BRADE BOT DPTH(FT.) U306 iFT.I9.00 .020 240.011. OC .0906.00 .480«»4.00 .0006.ÛO .120» ,
T«K. BRADE(FT.) U30B4.00 .300»»2.00 .0662.00 .0402. 00 .100*2.00 .400««
BRADE BOT DV205 (H
.020 4512. oou 453.200 4555.000 465.100 465
THK. BRADE(FT.) U30B4.00 .030
PRPRTYCODE
URDAT
!BOT DPTH! (FT.'! 115.0i 117.0119.0! 121.0
PRPRTYCODEURL'AT
PRPRT-CODE
VDATA
PTh W..' (FT.'.0 2.00.0 2.00.0 2.00.0 10.00.5 .5o
PRPRTYCODEURDAT
AREANO.
AAA
THF..(FT.)2.002.002.002.00
! AREANC.
AREA. NO.
VVV
BRAUEU3Û8.500».020.550».olo. l'2o
! AREA, NO.,' AAA
\' HOLE !MSA1FLEI!! 1 1, TEST 1 ,-IIUIIH \
1
BRADEU3QB.03".020.040.Oit
~mumHOLE'SAMFLE»tTESTA!-mum/mumHOLE !
(SANFLE)1TEST 2-mum
BRADEV2Û51.000.1002.0od.2oo
««»»t, HOLE1 (5HHPLE)1 1, TESTB2-mum
202

A P P E N D I X C: URDAT RUN
/COLLAR NORTH EAST ! PIT 1DPTH!ELEV. COORD. CQORB.lDEfTKiSNPL!
t 1 1
7203.0 7930 93?6! !51B9!
BAfiHA LOB INTERPRETED VALUES; DATA:
BOT DFTH THt. fiRftDE BCT DPTH<FT.» (FT.) U30B FT.)
1591.5 .50 .004 1596.51592.0 .50 .001' 159\01592.5 .5o .','32 159'. 51593.0 .50 .008 1598.01593.5 .50 .000 1598.51594.0 .50 .041 1599.1'1594.5 .50 .035 1599.51595.0 .50 .029 1600.01595.5 .50 .008 ltiT.51596.0 .50 .016 1601.«
COLLAR NORTH EAST ! PIT 'DPTH!ELEV. CÜORB. CDDRD.!DEFTH!SMPL!
! , !7211.0 7780 9196, !5!85i
6A1HA LOB INTERPRETED VALUES; DATA:
BCT DPTH THt. BRADE(FT. > (FT.) U308
1583.5 .50 .UOt,1534.0 .50 .0041584.5 .50 .0071585.0 .50 .0061585.5 .50 .0211586.0 .50 .02415S6.5 .50 .041158'. 0 .50 .110115B'.5 ,5l! .oB91588.0 .5'.' .oot1158B.5 .5u .02v1589.0 .50 .00815S9.5 .50 .029158o.o ,5o .'.'1°1590.5 .50 .0121591.» .50 .013
BUT 5FTH,(FT. )
1592.015°;. 51593.0is«:. 51594.01594.51595.015°5.51596.01596.51597.015°?.:1596. U15°8.51599.01599,5
1591.5 .50 .038 , 16ÛO.O
SDTiSHPLÜXBICODE
l
luol clu
1H20 ! K-FACTOR!iDPTHi (LAST) !» 1 1
i 230 1.00000330!
DEAD !CRIT! H2Q!TINE !FACT!CORR!
! ! !3.0! NO 11.28!
ftlRÜ'S/INCHÜLOB-CQRR! (LAST!
!1.00!
iFULL PRPPTY ,IÎVPE ! SCALE CODE ,|
.A: KIN) !! URDAT !
AREA ,»jo
,BEB .
UNCORRECTED CPS. DATE L066EB: o/ 0
ThC.(FT.)
.50
.50
.5!)
.50
.50,5n.50.50.50.50
BOTlStftDID! CODE
1
loo, Flu
BRADE EOT DPThU3ÛB (FT.)
.022 1601.5
.035 1602.0
.P« 1602.5
.296» 1603.0
.1061 1603.5
.1371 1604.0
.1301 1604.5
.049 1605.0
.081 16C5.5
.035 1606.0
!H20 ! f-cACTORID^TH, iLASTl
, 329;.ooouo33u!
THK. BRADE(FT.) Ü3B8
. 5o . oo2
.50 .006
.50 .005
.50 .005
.50 .003
.50 .005
.50 .006
.50 .006
.50 -Oil
.50 .007
DEAD !CP !T! H2Q!T I »IE IFACT.CORR,
! ! !3.0! NO !l.26i
BOT D'TH(FT.)
1606.5160'. 0lfcl'7.51608.01608.51609.01609.51610.016K-.51623.0 1
THL(FT.'
.So
.50
.5u
.50.50.50.50.50
2. 'SO
AIR!CPS/lf!CH!LÛÉ-CORR, (LAST)
j1.00,
• TYPE|
!A3
BRADE IBOT DPtHU308 (FT.)
.005 1623.5
.003 1624.0
.000 1624.5
.013 1625.0
.059 1625.5
.009 1626."
.000 1626.5
.005 162'.0
.'ooo
IFUL.L ' PRpRTL ;iSCALE, CODEKIN! !
! UFDAT .
M".(FT.'
.50
.50
.50
.50
.50,50.50.50
AREA 'N:. ,
I
EBB '
UNCORRECTED CPS. BATE LOBBED: O/ 0
THL(FT.)
.50
.50
.50
.50
.50
.50
.50
.50
.5o
.5«
.5oSll
is«.50.50.50.5i'
6FADE IPOT DPTH'J30S ! (FT.)
.1251 ! 1600.5
.926* ! 1601.0
.465»! 1601.5
.671* ! 1602.0
.506* ! 1602.5
.012 i 1603.0
.068 i 1603.5
.lull ! 1604.0
.094 , 1604.5
.224»! 1605.0424««, 1605.5
,3i3«t; 1606.0.381»! 1606.5.250*1! 1607.0.086 ! 1607.5.035 , 1608. 0.058 ! 1606.5
TKK. BRADE(FT.) Ü308
.50 .01'
.50 .032
.50 .029
.50 .030
.50 .056
.50 .364»
.50 1.BE2«
.50 2.931*»
.50 3.4'7**
.50 3.407**
.50 3.747$*
.50 1.579**
.50 .433«
.50 .054
.50 .000
.50 .009
.50 .011
ISO' DPTH, (FT. )
! 1609.0, 1609.5, 1610.0! 1610.5! 1611.0! 1611.5, 1612.0, 1612.5! 1613.0! 1613.5! 1614.0! 1614,5! 1615.0! U15.5! 1616.0! 1616.5! 1617.0
T K f .lFT.1
.5'.'
.50
.50
.50
.50
.50
.50
.50
.50
.50
.50
.5'J
.50
.50
.50
.50
.50
5fiftS£U308
.ou5
.006
.004
.«i:
.002
.014
.032
.1151
.066
.522*
.933$
.563$
.833$1.556»*1.065«1.294$»1.404»»
BÛT t'PÏP11.)
141'. 51618.01618.5lél* 01619.516^0 01620.5itzi.o1621.51621.01622.51623.01623.51624.';1624.5
W.IFT.)
"ift!uo.50,5'J.50.5o.So5'i
.50
.50
.50
.50
.50
.5''
.50
\HOLE !
(ShftF'i.E) !t !
TEST 3 ,-Wl»»'
1
6RADE117/10
.001
.00«
.027
.uuB,oo5.006.008.ou2
/_»««m^
HCLEiSAMPLEl.
( ,TEST 4 ,
-mum1
61AKU30b ,
1.464**,1.379»*2.222**,
.626»
.256»1.524**!1.432*»,
.WUO ,
.1281 ,
.053 ,
.091 ,
. 000.033 !.000 !.009 !
203
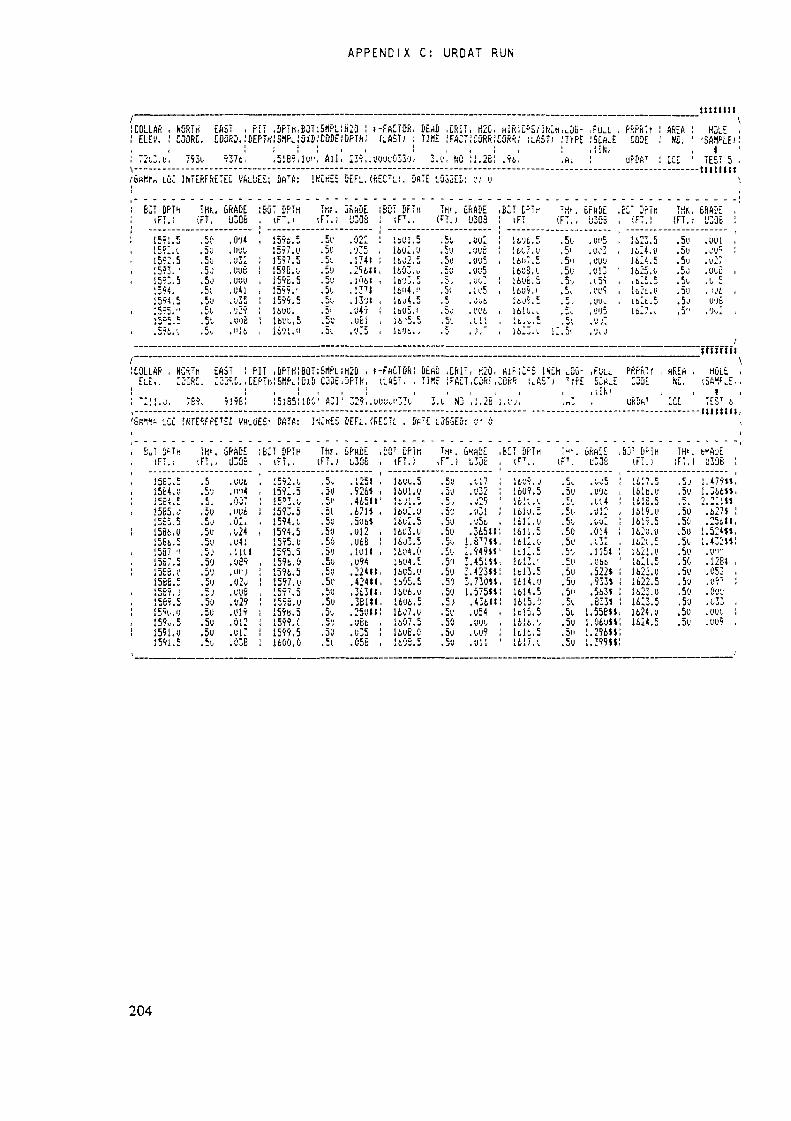
A P P E N D I X C: URDAT RUN
mamCOLLAR ,ELEi'. :72v3.0,
bHHrv Lu
hC'RTri EAST , PIT ,DPTnCOOR£. CDDRJ. ! DEPTH ,'S.IPu793i 93/6 ! '.5189
C INTERPRETEE Vf,i.'jE£; a«7*,
B:T DPTH THK. GRADE(FT.) (FT, Ü3Q61591159215921593159315941594is-.596
.5 .50 ,0'J4
.'. .50 .Hl)v.5 .5o .032.50 .out.5 . 5o . ooo,5i .«41.5 .5o .035
.5 .5'» .006
.1, .5v .»16
BÜ7JPT
1596.1597.1597.1596.1596.1599.1599.Itl1».
,BJT;5«PLjo«: CODE!lui'! All: INCHES
1 ïttt .;FT.)5 .Si-ll . 5(!5 .5ii, . 5u5 ,5o.5',* Cl/c c.,^ . w"-« .DI.
.'H20 ! «-FftCTQR,IIPTH! (LAST; !, I39,.oi)Ol'033'J,J5EFL.(RECTl.!. DR
GhttQE'J308.022/;35.1741.256». i'"!u(,:77«.13'J«loei.1'35
BUT DFTn(F7.,itoi.51602.516Û3.1-l6'J3.516H4.I16J4.5i t .t; c160,.,
DErlS ,CRÏTTJffE ,'FA'T3.1'! hß
TE IÜ3JEI:
H2C,CÜRR;1.26!VI 0
Tur. GRADE/PT i ).7n?I < . J U^uC
5'viSu.5«
isVÇ
.5,.c, u
.oui
.uu5.005.01,:.105, i <
.>.'
rtlRlCPS/lhCh u3b- ,Fu^LCORîi! iLÄST) TVPE ISCHu.9t! Im :""
BCT tPTr "«'. BfHDEiFT (FT. , t'306
16UB.I .5u .1)13160É.5 . 5v ,i59Ito9.5 .5, .ouv, 161 1/ > v 5v . o'j5, fc Ç C. ..."
, 1623.1 !2.5i .'AJ
, PRPftTr iE CODE I
<rC~ DPÏH, (FT.!, 1623.5, 16l4.li1624.5' 1625. t, 1626.1', i62t.5
AREANO.ccc
(FT.;
is«.5o.50.5i,.50.5j
HJLE'SAMPLE)1TEST 5tllilin
BRADE ,U3Ö6 :.IWl ,!u27
we
Hi«««««! COLLAR ,i ELE,. N' TM EAST ! PIT ,OPTf
"JÎK. :231C. ,lEPTr,!5t1P,759, 919E: 15165
!BOT;5,1PLiC;D CjJtiIIO»'1 A3!
iH2ü i f-FrtCTuR!,DPTK, (LAST, ,!
jtV t . UUvv1'---^
DEAD iCRITTi«E iFACT3.o' S3
, H2Ü,,CJRF,1.261
CORPUS? 7?PE 's;*: PftPRTr ,E CODEuRDf,7
«RE« .hi.:cc
_KuLE_l
TEST 6ls. '.CC ÎKrEfFPETE£ VHLiJES- DATA: J'-'CröS DEFL. (fiECTL . Ds7E L3ESEÜ:
6UT J'fTr TH«. GPADE BCT DPThiFT.i iFT., U3D5 lFT.,1 CO" C iint * CO"' ii,jd*i. . J . OvD i J7i. 'v
1584. .5'J .ivi4 1592.515B4. .5. .007 15°3.'v!565. .5v ,i>i>6 1593.51 CC= « ^ y^ 1594 v
Î566! iiiu !v24 159415156t. ,5o .04; 1595.01537 .5,' ,11U 1595.51567. .50 .089 1596.01566. .5'; .«i1; 1596.51566. .5o .u2o 1597.01589. .5; .008 159\51569. .5o .029 1596.01591.. .50 .019 159b.5159». .So .012 1599.C1591. .5u .«i: 1599,51591. .5'v .036 1600.0
Ihr.lFT.)
.5»
.5VC|i
.51
.5o
.50
.50,5','.50.51'5"
.5o
.5o,5otin
.50
.51
bPni'E
.1251
.926*
.4651«
.671*
.506*
.1)12
.066
.lull
.094
.2241«
.424«»
.363««
.361««
.250»!
.O6t
.035
.056
,L'0T DPT M, lFT.!
. l60v.5, 1601.0' liJl.5, 1602.0
1602.5, 1603.0! 1603.5, 1604.0
1604.5, 1605.0, 1605.5, 1 606.0, 1606.5: 16v'7.0, 16Û7.5! 1608.Û, 1603.5
TH' .
.5«
.50c
,5';.5o.5«.5oc,
. JV
.5"
.50
.50
.50
.5)
.5"
.50
.50
.50
rtfll'E13JE
.(.17
.«32
.029.1)31,o5t.365»»,677»*.949».451**.423*«.7301».575$*.436«!.054. 00',lrU9
.Oil
,BCT DPTri, (F7.,
! 1609.J; 1609.5! ii;i-!i! UK!«! 1611.5, 1612.1.' 1612.5, U13.'! ltlî.5, U14.U1 1614.5i 1615.0, 1615.5, 1616.V1 ltlt.51 1617.1
"M*lFT.'
.5v
.5oc (
isC5v
.50,5i'^,. j ,.5o.50.50.5".5i.5v.50.5».50
,1-ncL..UW
. ,C
.O'Jt
.114
.012
.CO'
.014< 7"
Ü15«. 066.522$.933*.563$.6334
1.556$$1.060$*1.296$$l.!99$$
BJT DM H( F T . )
1617.5Ulb.yt if 0 C
1619.«1619.5162U.O162i.:162;,'.'1621.51622.01622.51623.01613.51624.01624.5
TH'.(FT . )
.5J
.5','C
.50
.50
.50
.51,
.50
.5C
.50
.50
.50
.50
.50
.5o
"ÏMB ;1.479«.1.366**,2.221*1.627* i.256««,
1.524$*,1.432**:.(.'']•'.128« ,.053 ,. I'V !.00'.'.(,33 ,. 0',", !.1)09 ,
204
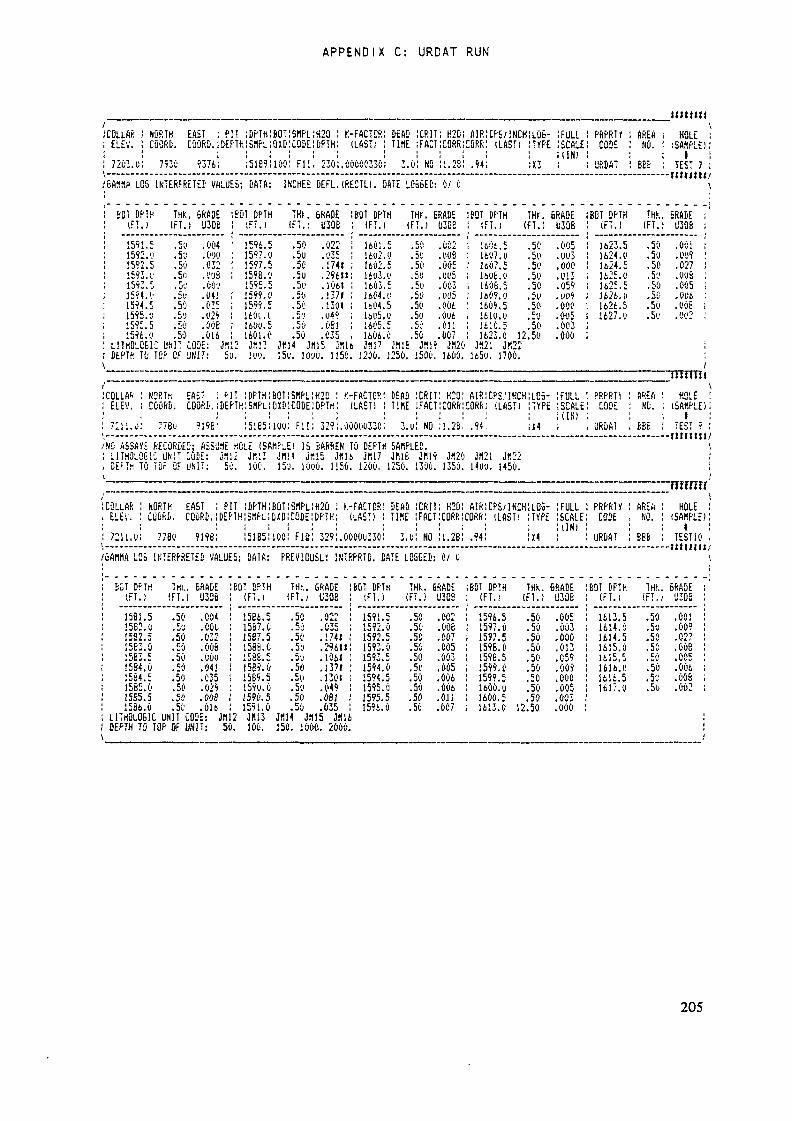
A P P E N D I X C: URDAT RUN
»mi»CDLLAR ! NORTH EAST : PIT ! DPTH ! BOT !SMPL!H2Û ! K-FACTOP.i DEAD iCRIT i H20i flIR!CPS/lNCHiLOb- 1FULL PRPRTl AREA i HOLE
ELEV. ! CÛORD. COORD. !D£FTHiSMPL;OlD:CQDE!DPTH; (LAST; ! TIME ;FACT!CORR;CORf; : (LAST! !TYPE ÜCALE CODE M. ! iSAKPLE)i i i i i i i i i i i i 1 ' i I U t < ii 1 1 1 1 1 1 i i i i i i i u n ! i l
7203. Oi 7930 9376; ;5169ilOO! Fll, 2301.00000330; 3.0! NO 11.28! .94; ;u3 ; URDAT SES i TEST 7——— . —————————————————————————————————————————————————————— flijiittGAMMP LOS INTERPRETE!' VALUES; DATA: INCHES DEFL. (RECTL). DATE LOGGED: O/ 0
EOT DPTH THK, GRADE(FT. ) (FT.) U306
1591.5 .50 .0041592.0 .5S .0001592.5 .50 .0321593.1' .Su .'.'OS1593.5 .5'.' .00'.'1594.'.' .50 .04!1594.5 .50 .0351595. V .5',' .0291595.5 .50 .0061596.0 .50 .016
ÜTHDLD6IC WIT CODE: J«r DEPTH TC TC'P CF UNIT: 5
POT DPTH THK GRADE(FT.! (FT.) U30B
1596.5 .50 .0221597.0 .50 .0351597.5 .50 .174»1598.0 .50 .296»159S.5 .50 .10611599.0 .50 .13711599.5 .50 .13011601.1 .5» .049Î6CW.5 .50 .0811601.0 .50 .035
2 JK13 JtN« JM15 3«!l. im. 150. !0'X'. 1150
BÛT DPTH THK GRADE(FT. ) (FT . ) U3Q8
1601.5 .50 .002!602.<J .50 .U081602.5 .50 .0051603.0 .50 .1)051603.5 .50 .003
1604! 5 !S6 !('06l6l>5.0 .50 .0061605.5 .5-J .01!1606.0 .50 .007W1 3« 16 J«!9 JH20
1200. 3250. 1500. I6ÛO.
SOT DPTH THK GRADE(FT . ) (FT.) 1)308
ItOt.ï .50 .0051607,1.) ,50 ,OU31607.5 .50 .0001608.0 .50 .013160B.5 .50 .0591609.0 .50 .'J091609.5 .50 .0001610.0 .50 .0051610.5 .50 .0031623.0 12.50 .000
J«2l J«22It5o. 1700.
BOT ÛPTH THk. BRADE(FT. ) (FT. : U30B
1623.5 .50 .0011624.0 .50 .0091624.5 .50 .0271625.0 .50 .0061625.5 .50 .005H24.0 .50 .0061626.5 .50 .0081627.1' .50 .002
t t n t u iCOLLA1* NORTtt EAST : PIT : DPTH: BOT !S«PL!H2D ! K-FACTOR iELEV. CDORD. COOfit. iDEPTHlSMPLiOXDjCODEjDPTHi (LAST) !7111.0 7760 9198' I51B5Î1UI): F i l l 329Î.ÙOOUUJÏÛ!
NO ASSAYS RECORDED; ASS'JflE HOLE (SAMPLE! IS BARREN TO DEPTHL1THOL36ÏC UM T CUBE: jflll Jfill JflM Jfl!5 Jflli JR17DE^TM TO Tuf OF UNIT: 50. 100. 15'J. lOoo. 1150. 1200. 1
COLLAR NORTH EAST ! PIT !DPTH!BDT!SHPL!H2D ! k-FACTOR!ELE1,'. CÜÜP.II. COORS.!DEPTH:SMPL:CJ(D:CODE:DPTH; (LAST) ;7211.0 7780 9198! ISlSsilOO! Fit1! 3291.00000330!
GAMMA LOG INTERPRETED VALUES; DATA: PREVIOUSLY INTRPRTD. DA
BGT Df'Tri THu. BRADE(FT.! (FT.) U3081581.5 .50 .0041582.1) .5'J .00015S2.5 .50 .0321583.0 .50 .00815B3.5 .50 .0001564.0 .50 .04!1584.5 .50 .0351585.0 .50 .02915S5.5 .50 .0081586.0 .50 .OHLITHÛL06IC UNIT CODE: JMDEPTH TO TOP OF UNIT: 5(
BUT DPTH THK. 6RADE(FT.i (FT.) U3081586.5 .50 .0221587.0 .50 .0351587.5 .50 .17411588.0 .51) .294»1588.5 .50 .1061J5B9.0 .50 .137115B9.5 .50 .13011590,0 .50 .0491590.5 .50 .0811591.0 .50 .0352 JK13 JM14 JM15 if.ll
). 100. 150. 10ÔÛ. 2600.
BOT DFTH!FT.)1591.51592.01592.51593.01593.51594.01594.51595.01595.5159i.O
DEAD !CRITTIKE !FACTJ.u! NO
SAMPLED.JM1B JN19250. 1300.
DEAD !CRITTIKE IFACT3.0! NO
TE LOGGED;
H.23! AIRICPS/INCHCORRiCORR; (LAST)1.28,' .94'.
J«20 JN21 JK221350. 14UU. 1450.
; H20! AIRICPS/INCHJCORRICORR! (LAST)il. 28! .94!O/ 0
THK. 5RADE(FT.) U3C8.50.50.50.50.50.50.50.50.50.50
.002.006.007
.005.003.005.006.006.011.007
:LCS-:TYPE;i4
! LOG-IT t Kin
iF'JLL PRPRTr! SCALE CODEKIN)! i URDA1
!FULL PRPRTV! SCALE CODEi ' URDAT
BOT DPTH THk. 6RADE(FT.) (FT.) U30E1596.51597.01597.51598.0159E.51599.01599.516ÛÙ.O1600.51613.0 12
.50.50.50.50.50.50.50.50.50.50
.005.Ù03.000.013.059.009.000.005.003.000
BOT DPT(FT.)1613.1614.1614.1615.1615.1616.1616.1617.
H
5050CJt!50
AREANO.EBB
HOLE(SAMPLE)iTEST 9
—— tmrmAREA«C.8B6
THK.(FT.).50.50.50.50.50.50.50.50
HOLE(SAKPLE)TEST 10-mum
GRADE'J3G8.001.009.027.008.005.006.008.002
205
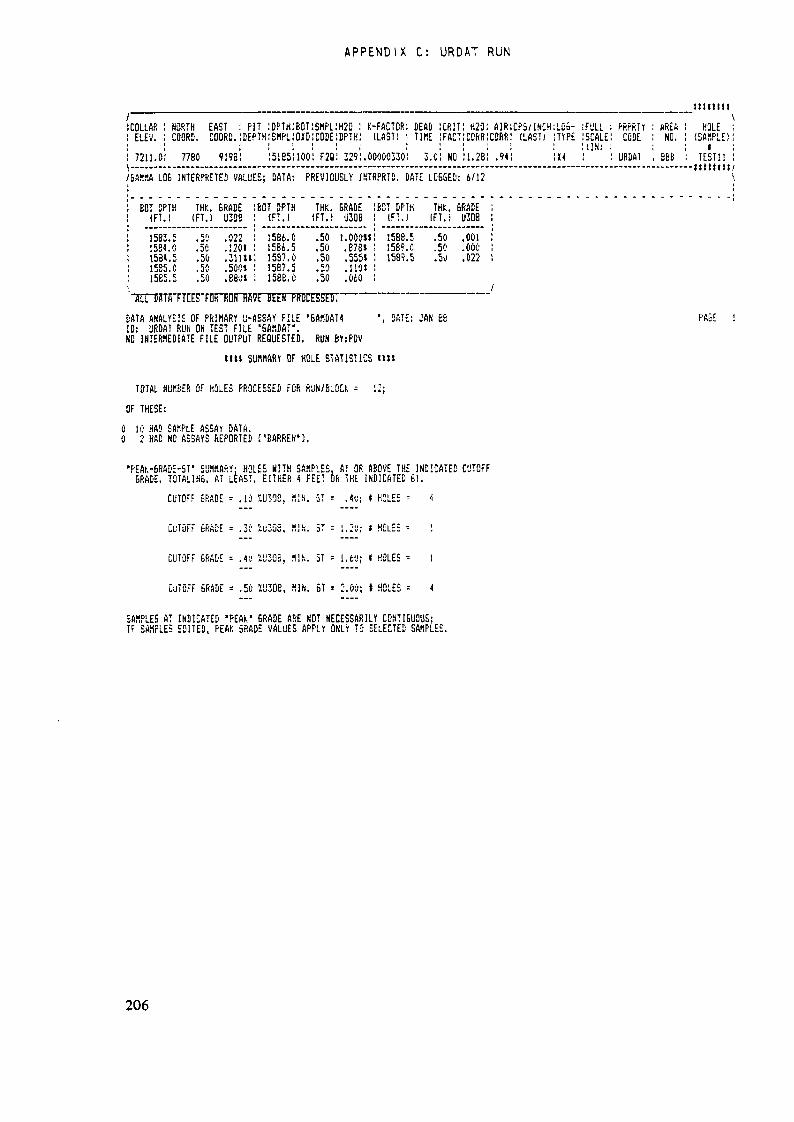
APPENDIX C: URDAT RUN
iwuiiI'-" -~" •--——— ................. ^COLLAR NORTH EAST : PIT :DPTH!BCT:SHPL!H2B ; K-FACTOR! BEAU 1CRIT! ri2u! AIR!CP$/1NCH;LC6- ;FULL PRPRIr «RES HOLEELEV. CQORD. COORB. IDEPTHISMPL.'QXDiCODEIDPTH! (LAST! ! TIKE IFftCT! CORK! CORK! (LAS!) HYPE ISCALE CODE NO. (SAMPLE!; : : : : ; : ; : ; : : : < I N I <7211.0 7780 91931 I5185I100! F2Û! 329!. 00000330! 3.0! NO !1.2B! .94! !K4 ! URÛA1 , BEB TEST11————————————————————————————————————————————————————————————————————————————— - — istttlMBAXMA LS6 INTERPRETE! VALUES; DATA: PREVIOUSLY IfiTRPRTB. DATE LOBBED: 6/12
BOT DPTH M. BRADE(FT.I (FT.) U30BI5B3.5 .50 .02215B4.Ö .50 .120»1584.5 .50 .311»15S5.C .50 .500»1585.5 .50 .880*
EOT DPTH THK. BRACE(FT.) (FT.! U30B1586.0 .50 1.000»«15B4.5 .50 .B7BS15B7.Û .50 .555*1587.5 .50 .110»15BB.O .50 .060
BOT DPTH THfc. 6RABE(FT.I (FT.i U30BÎ588.5 .50 .0011589.0 .50 .0001589.5 .50 .022
/"5LTT!5TB"f'TCETFO[<"ROfi"nS7E BEER PROCESSED——'DATA ANALYSIS OF PRIMARY U-ASSAY FILE '6AKDAT4ID: URDAT RUN ON TEST FILE '6ARDAT'.«C IHTERNEDIATE FILE OUTPUT REQUESTED. RUN 6V:f>DV
DATE: JAN 66 PAGE
till SUftHARY DF HOLE STATISTICS II»
TOTAL NU«Ef! Of HOLES PROCESSES FOR RUN/BLOCK = 12;OF THESE:
0 10 HAD SAÄPLE ASSAY DATA.0 2 HAD NO ASSAYS REPORTED ['BARREN'].
•PEAK-6RADE-5T' SUMMARY: HOLES WITH SAMPLES, AT OR ABOVE THE INDICATED CUTOFFBRADE. TOTAUfiS. AT LEAST. EITHER 4 FEET OR THE INDICATED 61.CUTOFF 5RADE - .lu XU308, AÎN. GT = .4«; I HOLES = 4
CuTûfF 6RADE = .30 ÏU308, (llh. BT = 1.2«; » HÜLE5 = 1
CUTOFF 6RADE = .4« ÏU3ÛB, Î11N. BT = 1.6'J; It HOLES - 1CUTOFF BRADE = .50 ÏUSDB, KIN. BT - 2.00; * HOLES = 4
SAMPLES AT INDICATED "PEAK1 6RA5E ARE MOT NECESSARILY CDNTIBUO'JS;IF SAMPLES EDITED, PEAK BRADE VALUES APPLY ONLY TO SELECTED SAMPLES.
206

INDEX OF TERMS
18.0 IHDEX
AIR CORRECTION FACTOR 36, 5*<ARBITRARY CUTOFF GRADE 11?AREA NUMBER 28, J+8, 50ASSAYS 13, 1J», 17, 18ATTENUATION FACTORS 15, 35, 36, 37, 51*
BACKSLOPE WASTE 117BARREN 20, 21, 33, 3*».BASELINE CHANGE 59BEDDED SANDSTONEBIASED SPACINGBLOCK 6, 117BLOCK OUTLINESBLOCKS 69
ORSAC 69RESUV 69SCOR 69URDAT 69
BOREHOLE LOGGINGBOTTOM ELEVATIONBOTTOM LITHOLOGI
TYPE117117
1U,6
C UNIT
A7, 51, 6059, 117
BREAK-EVEN COST CUTOFF
15, 166
GRADE
17
117
CAPITAL COST 117MINE AND EQUIPMENT COSTS 117OTHER COSTS 117OVERBURDEN REMOVAL COSTS 117PRO-RATED M I N I N G WASTE COSTS 117PROCESSING PLANT CAPITAL COSTS 117UNDERGROUND PRIMARY DEVELOPMENT COSTS 117
COLLAR ELEVATION 15, 33, 31», 35, kj, kB, 50, 51146*9, 55
COMBINING THICKNESSCONTINUATION RECORDSCOORDINATES 32COST-VS-VALUE CUTOFF GRADECOUNTS-PER-SECOND 53CPS 6, U, 15, 16, 17, 55CUTOFF GRADE 117CUTOFF GRADES 138CUTTOFF GRADE
117
207

I N D E X OF TERMSMINIMUM 11*6
DATE LOGGED 57DEAD TIME 5^DEAD TIME CHANGE 58DEAD-TIME FACTOR 6, 15, 29, 37DENSITY 117DEPTH
FIRST READING 56FIRST SAMPLE 33, 3^FIRST SAMPLE INTERVAL 1*8HOLE WATER 35OXD1ZED-NON-OXIDIZED CONTACT 48OXID1ZED-NON-OXIDIZED CONTACT 34PIT BOTTOM 6, 33PIT-BOTTOM A8TOTAL DEPTH '3ATOTAL SAMPLED 21
DEVERGIE, P. 1, 2DILUTING TO MINIMUM M I N I N G THICKNESS 11?DILUTION THICKNESS AND GRADE 117DISCOUNTED CASH FLOW RATE OF RETURN 117DOLLAR 1DOS 1, 14, 19
EAST COORDINATE 48ECONOMIC CRITERIA 11?ECONOMIC RECOVERY COSTS 117
F i l e Name Protocol 8FLUOROMETRIC 13FORPRINT 9FORPRINT.EXE 9FORPRIN2.EXE 9FORTRAN 1FORWARD COSTS 11?FULL-SCALE DEFLECTION 54
GAMDAT 10GAMDATV 10
208
INDEX OF TERMS
GAMLOG 1, 2, It, 7, 18?K-FACTOR 188REAL ANOMALY 189SYNTHETIC ANOMALY 189
GAMLOG METHOD 15, 18?GAMMA-LOG 12, ^k, 15, 20GRADE 1, 2GRADE DISTRIBUTION ANALYSIS 155GRADE-TONNAGE DISTRIBUTION 117, 155GRADEV 2GRUNDY, W.D. 1
HEADER RECORD k$, 51, 53, 55HOLE NUMBER 27, 28, 32, 48, 50
INCHES-OF-DEFLECTION 52, 51*. 55INDEPENDENT OPERATION 1 17INTEGRATED OPERATION 117INTER ORE M I N I N G WASTE 117INTERACTIVE ENTRY 129
ARROW -> 129CAPS LOCK 130DELIMITERS 129F I L E NAMES 130IMBEDDED BLANKS 129NUMERIC ENTRIES 129QUOTES 130
INTERPRETED VALUES 56
K-FACTOR 15, 35, 36, 37, , 57, 188K-FACTOR CHANGE 59
LITHOLOGIC RECORDS 59LOG e 6LOG TYPE 38LOGGING PROBE 30LOGGING SPEED 35, 57LOGGING UNIT TYPE 54LOGGING UNITS 30, 31, 32, 38LOWER DILUTION 117
209

INDEX OF TERMS
MACHINE READABLE 12, 15MARGINAL COST CUTOFF GRADE 11?MAXIMUM STOPE WASTE THICKNESS 11?MDDAT 2MEEHAN, R.J. 1, 2MINE EXTRACTION LOSSES 117MINE SAFETY 117MINE-MILL RECLAMATION COSTS 117MINIMUM INTERMEDIATE WASTE THICKNESSMINIMUM M I N I N G THICKNESS 117MINIMUM WASTE THICKNESS 117
OPEN PIT 117UNDERGROUND 11?
MINING DILUTION 117MINING WASTE 117
OPEN PIT 117UNDERGROUND 117
117
NEUTRON-ACTIVATION 13NON-CONTIGUOUS SAMPLE FORMAT 50NORTH COORDINATE 48
OPEN PIT ANALYSIS 155OPEN PIT FACTORS 117OPERATING COST 117
APPLICABLE INDIRECT COSTS 117DIRECT M I N I N G COSTS 117HAULAGE COSTS 117PROCESSING COSTS 11?ROYALTY COSTS 11?
ORE 117ORE INTERVAL 117ORE INTERVALS 155ORE RESERVE 117
AREA-OF-INFLUENCE 117BLOCK 117DILUTED 117EXTRACTABLE 11?GENERAL OUTLINE 117GENERAL OUTLINE METHOD 11?GEOLOGIC RESERVES 117GEOSTATISTICAL 117IN-PLACE RESERVES 117INFERRED 117
210
INDEX OF TERMS
MEASURED 11?REASONABLY ASSURED RESOURCE 117RECOVERABLE 117UNDILUTED 11?
ORE-INTERVAL ANALYSIS 155ORSAC 1, 2, 4, 1, 9, 117, 132, 146
ALPHA1 CONSTANT 146COMBINED ASSAYS 146COMBINING THICKNESS 146CUTOFF GRADE 146ESTIMATED TONS AND GRADE 146FRACTIONAL TONNAGE 146RESERVES ANALYSIS OPTIONS 146STATISTICAL PARAMETERS 146SUMMARY FOR ALL BLOCKS 146TONNAGE FACTOR 146URANIUM 146VANADIUM 146
ORSAC.EXE 9ORSAC2.EXE 9OVERBURDEN WASTE 117
P-0 files 8PATTERSON, J. 2PEDAT 2PIT AREA 117PRELIMINARY ESTIMATES 117PROCESSING RECOVERY 117PROFIT 117PROPERTY CODE 28, 48, 50PROTORE l 17
RADIOMETRIC 13, 14, 15, 16, 17DISEQUILIBRIUM 1?DISEQUILIBRIUM COEFFICIENTS 18EQUILIBRIUM 13
RANDOM SPACING 11?RANGE CODE 29, 30, 31, 32, 37, 38READOUT INTERVAL 35, 51*, 59RECORD COUNT 47, 50RECORD COUNT OR INDEX 28RECOVERY 117RESTPRN 8, 9RESTPRN.EXE 9RESTPRN2.EXE 9RESUV 2, 4, 7, 117, 132, 138
CUTOFF GRADES 138RESERVES ANALYSIS OPTION 138
211
INDEX OF TERMS
URANIUM 138URANIUM AND VANADIUMURANIUM RESERVES 138VANADIUM 138VANADIUM RESERVES 138
RNGTBL 9, 31, 38
138
SAMPLE 12, 13, U, 18SAMPLE INTERVAL 13, 15, kl, kB, 50
BIMETAL kB, 50FIRST kBUN I METAL 50
SAMPLE SET DENSITY 11?SAMPLE SETS 13, 14SAMPLE-TYPE CODE 1 1*8SAMPLE-TYPE CODE 2 1*8SAMPLE-TYPE CODE 3 kBSAMPLE-TYPE CODES 29, 30, 31, 32SCOR 1, 2, k, 7, 8, 9, 117, 132,
COST-VS-VALUE 155ECONOMIC DATA 155ELEVATION OR DEPTH 155GRADE DISTRIBUTION ANALYSIS 155GRADE-TONNAGE DISTRIBUTION 155OPEN PIT ANALYSIS 155ORE INTERVALS 155ORE-INTERVAL ANALYSIS 155PHYSICAL DATA 155UNDERGROUND ANALYSIS 155
SCOR.EXE 9SCOR2.EXE 9SCOTT, J.H. 1SENSITIVITY 29SKIPPED INTERVAL 56SPECIAL ENTRIES 56SPECTRAL ANALYSIS 13SPLIT SHOOTING 117STARDAT 10STARDATL 10STRIP LOG 12, 14, lé, 17
155
TAX CONSIDERATIONS 117TIME CONSTANT 35TOP ELEVATION 6TOP LITHOLOGIC UNIT 6TOTAL COST-VS-VALUE 11?TYPE 1 M I N I N G WASTE 11?,TYPE 2 M I N I N G WASTE 117,
155155
212
INDEX OF TERMS
UCON 2, 3, 4, 5, 7"!#" INSTRUCTION11 !" INSTRUCTION">#" INSTRUCTION">" INSTRUCTION"A" INSTRUCTION"B" INSTRUCTION"C" INSTRUCTION"E" INSTRUCTION"F" INSTRUCTION"H" INSTRUCTION"L" INSTRUCTION"Q" INSTRUCTION"W" INSTRUCTIONsen 70BCM F I L E CONTROLBCM IDENTIFIER
69,7273,7273,72,72,7572,72,7572,72,72,
132Ik
7b7573, 71»757 , 75757575
MODULE7070
70BCM TERMINATORBLOCK 70BLOCK CONTROL MODULE 70FCM (See BCM) 70FCM IDENTIF 1ER 7 kFCM IDENTIF1ER RECORD 75FCM ITENTIFIER 70FCM TERMINATOR 70FCM TERMINATOR RECORD 75FILE 69F I L E STRUCTURE 70INSTRUCTION CARRY-OVER 76, 77INSTRUCTION NEGATION 76INSTRUCTION SUMMARY 7^INSTRUCTIONS 71PRIMARY OPcodes 72
UCON files 8UDAT 7. 19, 20, 22, kj
BOREHOLE LOG FORMAT 22CONTIGUOUS BIMETAL FORMAT 19, 21CONTIGUOUS FORMAT 19, 21CONTIGUOUS UN I METAL FORMAT 19, 21CONTINUATION RECORD 21, 27, 28DIRECTIONAL DATA RECORD 21DIRECTIONAL RECORD 27, 28FORMAT
"A-E" 16, 19, 22, 29, 31, 52, 53"A" 29, 31"B" 29, 31"C" 29, 31"D" 29, 31"E" 29, 31"FIU" 16"FNQ" 16, 19, 22,"F1C" 16, 19, 22,
35, 5252, 53
53
213

INDEX OF TERMS
" F i l " 16, 19, 22, 29, 31, 52, 53"FID" 16, 19, 22, 52, 53"I" 29, 31CONTIGUOUS 34NON-CONTIGUOUS 16, 29, }k
FREE-FORMAT TEXT 22GEOLOGIC RECORD 2?HEADER RECORD 20, 2?, 28, 29, 30, 35INTERMEDIATE FILES 19, 22LITHOLOGIC RECORD 21, 28NON-CONTIGUOUS FORMAT 19, 22PRIMARY FILES 19, 22
FORMAT 19, 20, 21UDAT files 8UN I METAL SAMPLE INTERVAL DATA k<$UPPER DILUTION 11?URAD 1, 7, 12, 13, 15, 17URDAT 2, 7, 9, 132URDAT.EXE 9URDAT2.EXE 9USUM 8
VALUE 117VANADIUM 138
WATER CORRECTION FACTOR 37,
YOUNG, H.B. 2
214

To: Division of PublicationsInternational Atomic Energy AgencyWagramerstrasse 5, P.O. Box 100A-1AOO Vienna, Austria Date:
ORDER FORM
Please send me ......... copy/copies of the Uranium Ore ReserveCalculation System (URAD) program, including the source code anddocumentât ion.t ] Payment is enclosed or[ ] Enclosed are eleven diskettes of 5.25 inch double sided, doubledensity
NAME: ...............................................
ADDRESS: ............................................CITY: .................................. POSTAL CODE:
COUNTRY: ............................................
Cost per program AS 225.00(in eleven diskettes of 5.25 inch double sided, double density).