user’s guide to gis-based application for traffic inputs...
TRANSCRIPT

Technical Report Documentation Page
1. Report No.
FHWA/TX-03-4377-4
2. Government Accession No. 3. Recipient’s Catalog No.
4. Title and Subtitle User’s Guide to GIS-Based Application for Traffic Inputs to MOBILE6 Emissions Factor Model
5. Report Date
August 31, 2003
6. Performing Organization Code
7. Author(s)
Chandra R. Bhat and Sriharsha Nerella 8. Performing Organization Report No.
0-4377-4
10. Work Unit No. (TRAIS)
9. Performing Organization Name and Address
Center for Transportation Research The University of Texas at Austin 3208 Red River, Suite 200 Austin, TX 78705-2650
11. Contract or Grant No. Project 0-4377
13. Type of Report and Period Covered
Research Report
12. Sponsoring Agency Name and Address
Texas Department of Transportation Research and Technology Implmentation OfficeP.O. Box 5080 Austin, TX 78763-5080
14. Sponsoring Agency Code
15. Supplementary Notes Project conducted in cooperation with the Federal Highway Administration.
16. Abstract This guide familiarizes users with the GIS-based platform for vehicle age distribution and VMT distribution, including installation instructions, system and program requirements, and important guidelines for use of the software package.
17. Key Words MOBILE6, Traffic inputs, VMT distribution, Vehicle registration distribution, GIS, TCM analysis
18. Distribution Statement No restrictions. This document is available to the public through the National Technical Information Service, Springfield, Virginia 22161.
19. Security Classif. (of report) Unclassified
20. Security Classif. (of this page) Unclassified
21. No. of pages 38
22. Price
Form DOT F 1700.7 (8-72) Reproduction of completed page authorized


USER’S GUIDE TO THE GIS-BASED APPLICATION FOR
TRAFFIC INPUTS TO MOBILE6 EMISSIONS FACTOR MODEL
by
Chandra R. Bhat and Sriharsha Nerella
Research Report Number 0-4377-4
PRELIMINARY REVIEW COPY
Research Project 0-4377
Develop GIS-Integrated Traffic Models for MOBILE6-Based
Air Quality Conformity and TCM Analysis
Conducted for the
TEXAS DEPARTMENT OF TRANSPORTATION
in cooperation with the
U.S. DEPARTMENT OF TRANSPORTATION
Federal Highway Administration
by the CENTER FOR TRANSPORTATION RESEARCH
Bureau of Engineering Research
THE UNIVERSITY OF TEXAS AT AUSTIN
August 2003

iv

v
DISCLAIMERS
Author’s Disclaimer: The contents of this report reflect the views of the authors, who
are responsible for the facts and the accuracy of the data present herein. The contents do
not necessarily reflect the official views or policies of the Federal Highway
Administration or the Texas Department of Transportation. This report does not
constitute a standard, specification, or regulation.
Patent Disclaimer: There was no invention or discovery conceived or first actually
reduced to practice in the course of or under this contract, including any art, method,
process, machine, manufacture, design or composition of matter, or any new and useful
improvement thereof, or any variety of plant, which is or may be patentable under the
patent laws of the United States of America or any foreign country.
Engineering Disclaimer
NOT INTENDED FOR CONSTRUCTION, BIDDING, OR PERMIT PURPOSES
Dr. Chandra R. Bhat
Research Supervisor, P.E. License No. 88971
ACKNOWLEDGMENTS
The authors acknowledge the support of TxDOT Project Director William Knowles of
RTI, George Reeves of TxDOT’s Dallas District, Wayne Young of Environmental
Affairs Division, Carol Nixon of TxDOT’s Houston District, Arnold Breedan of the
TxDOT’s Dallas District, and Ken Cervenka, Ken Kirkpatrick, Mahmoud Ahmadi, and
Chris Klaus of NCTCOG for providing documents and data.
Research performed in cooperation with the Texas Department of Transportation and the
U.S. Department of Transportation, Federal Highway Administration.

vi

vii
Table of Contents
1. Getting Started .............................................................................................................. 1
1.1 Pre-Installation Instructions ................................................................................ 1 1.2 System and Software Requirements.................................................................... 1 1.3 Increasing the Virtual Memory of your computer .............................................. 1 1.4 Overview of the GIS Platform ............................................................................ 3 1.5 Installation Instructions ....................................................................................... 4
2. The VMT Module.......................................................................................................... 7
2.1 VMT Mix Representation ................................................................................... 7 2.2 Forecasting VMT Mix for a Future Year .......................................................... 13 2.3 Description of the File System of the Application............................................ 19
3. The Registration Distribution Module ...................................................................... 21
3.1 Age Distribution Representation....................................................................... 21 3.2 Forecasting Age Distribution for a Future Year................................................ 24 3.3 Description of the File System of the Application............................................ 28


1
1. Getting Started This section of the manual is intended to familiarize the user with the GIS platform developed as part of the TxDOT Research Project 0-4377, and to provide the user with instructions for the installation of the GIS-based implementation package. The various system and program requirements are discussed, and step-by-step installation instructions along with some important guidelines for using the package effectively are provided.
1.1 Pre-Installation Instructions
Before proceeding with the installation, copy the entire contents of folder 4377 from the CD-ROM onto the hard drive (C:\) of your computer. Ensure that the path to the folder is C:\4377. This is critical to the execution of the source code. If a different location is desired, the paths in the source code must be correctly modified at multiple locations which is not advisable.
1.2 System and Software Requirements
To use the application developed in this project, you must have TransCAD version 4.0 or higher installed on your computer. The hardware requirements for GISDK are minimal; if you can run TransCAD 4.0 or higher, then you can run GISDK. According to the TransCAD website, the requirements for running TransCAD are a personal computer running on Window 98, ME, NT, 2000, or XP; a CD-ROM drive; 256 MB RAM; and 1 GB hard disk space (more if installing data on hard disk). However, if large files are to be processed by TransCAD, it is advisable to have higher RAM or at least higher Virtual Memory.
1.3 Increasing the Virtual Memory of your computer
In order to change the virtual memory for your computer, follow the steps below: a) Left click on the “My Computer” icon on your desktop. b) Right click and click on “Properties” c) Select “Advanced” from the menu on top.

2
d) Click on “Settings” for “Performance” and select “Advanced.” e) Click the “Change” button for Virtual memory.
f) Select the drive whose memory can be used as Virtual memory. Usually, it is better to select the drive that is expected to have maximum free space.

3
g) Click the “Custom Size” radio button and set the minimum and maximum virtual memory based on the available free space in your selected drive. A maximum of 1000 MB should be adequate for most applications. A minimum of 2 MB is required for windows operations.
h) Click the “Set” button to set the virtual memory to the custom size and click “OK.”
Note: The above instructions can be implemented without any changes on a computer running Windows XP. There might be some minor modifications in the names and locations of the buttons on the menus for other operating systems.
1.4 Overview of the GIS Platform
This GIS application has two modules, the capabilities of which are discussed below:
i. VMT Distribution Analysis
Given the zonal land use characteristics and the link characteristics of the Dallas-Fort Worth area road network, this module can predict the Vehicle Miles Traveled (VMT) fractions of the MOBILE6 vehicle classes for all the links in the network. The product has a very user-friendly interface that allows the user to view the predicted VMT information for any particular link on the road network. This module of the software can also be used for easy representation of the VMT mix information for any road network on a map and facilitates the display of VMT

4
information for any link on the network in the form desired by the user. The links on the road network can be selected interactively on the network map.
ii. Vehicle Age Distribution Analysis
Given the demographic characteristics and land use patterns of each Traffic Analysis Zone (TAZ) for some future year, the product can predict the vehicle age distribution of that TAZ for all the MOBILE6 vehicle classes. The user-friendly interface of the software enables the user to view the vehicle age distribution information of specific TAZs.
1.5 Installation Instructions
To install this application:
a) Start the TransCAD 4.0 application. Choose Tools Add-Ins to display the Add-Ins dialog box.
Note: When you are installing the Add-Ins for the first time, there will be only one Add-In, the GIS Developer’s Kit
b) Click Setup to display the Setup Add-Ins dialog box. c) Click Add to create a new add-in entry. d) Click the macro radio button. e) In the Description text box type “4377 VMT Application”. This description
will be shown in the scroll list in the Add-Ins dialog box. f) Type “VMT Mix Distribution” in the Name text box. The name typed in must
be exactly the same, including capitalization, since this is the name of the macro used in the resource file.
g) In the UI Database text box type the default path of the UI file “C:\\4377\\VMT Distribution\\Inputs\\Embedded\\vmt_dist”.
5
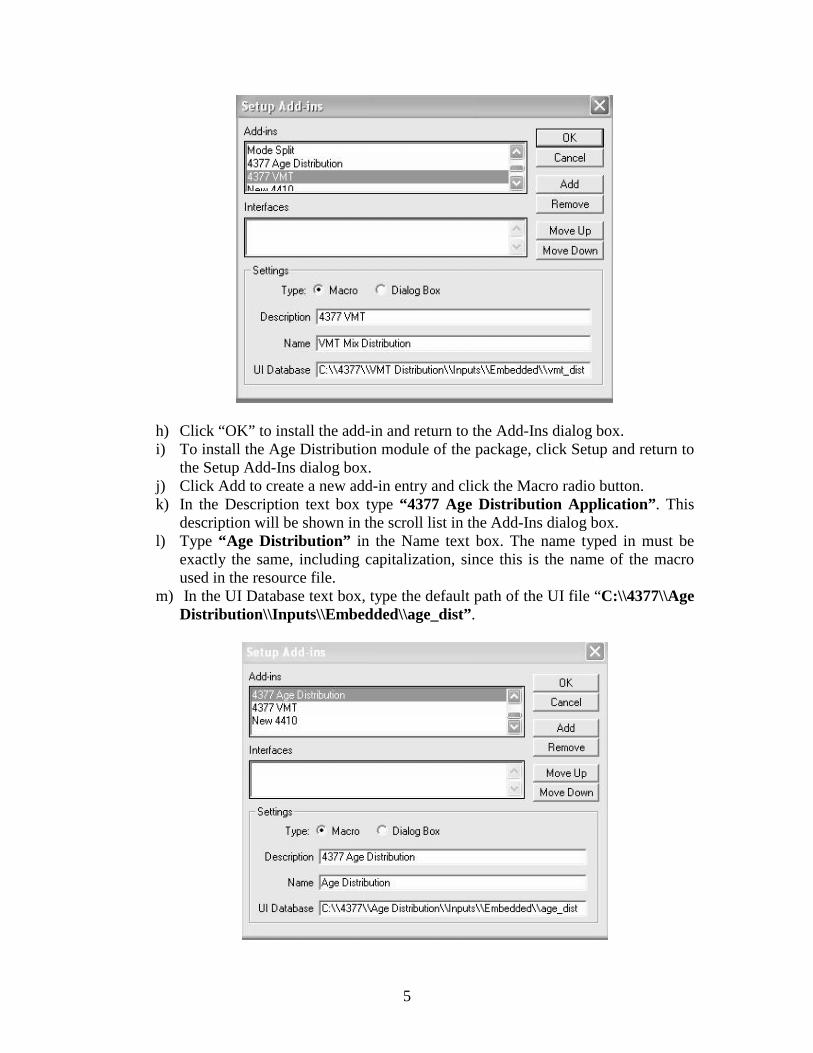
h) Click “OK” to install the add-in and return to the Add-Ins dialog box. i) To install the Age Distribution module of the package, click Setup and return to
the Setup Add-Ins dialog box. j) Click Add to create a new add-in entry and click the Macro radio button. k) In the Description text box type “4377 Age Distribution Application”. This
description will be shown in the scroll list in the Add-Ins dialog box. l) Type “Age Distribution” in the Name text box. The name typed in must be
exactly the same, including capitalization, since this is the name of the macro used in the resource file.
m) In the UI Database text box, type the default path of the UI file “C:\\4377\\Age Distribution\\Inputs\\Embedded\\age_dist”.

6
n) Click “OK” to install the add-in and return to the Add-Ins dialog box. o) Click Cancel to exit the Add-Ins dialog box without running an add-in. p) To run the add-in from TransCAD, choose Tools-Add Ins, and pick the add-in
you wish to run from the Add-Ins dialog box. This completes the installation of both the modules of the package and the software is now ready for use.
7
2. The VMT Module As discussed earlier, the VMT Module can be used for 2 purposes:
1. VMT Mix Representation 2. Forecasting VMT Mix for a Future Year
The input requirements and the steps to be followed to use this module for the two purposes differ slightly, so the two purposes will be dealt separately. The next few sections describe in detail how the module can be used for the two purposes. They also provide some useful information on the system files and the model outputs.
2.1 VMT Mix Representation
i. Using the Application
This part of the module can be used to represent and extract VMT Mix information for a road network. The default VMT information displayed is for the Dallas-Fort Worth area for the year 1998. To use this application, follow the step-by-step instructions given below:
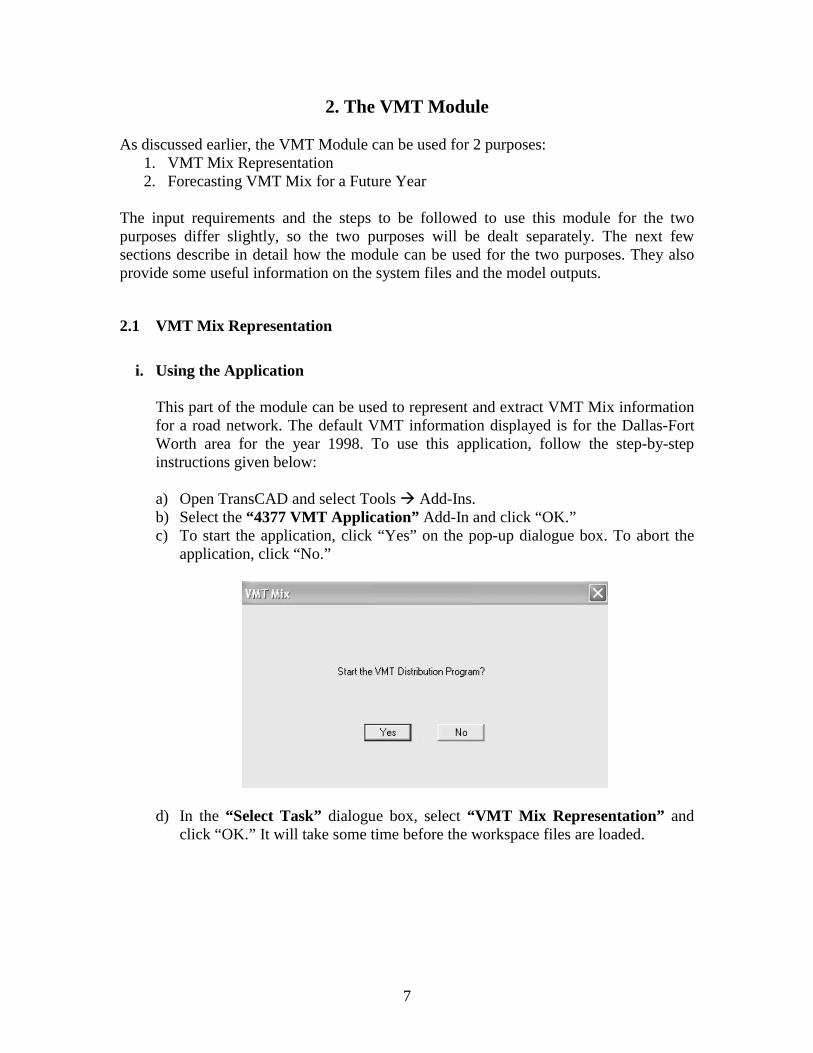
a) Open TransCAD and select Tools Add-Ins. b) Select the “4377 VMT Application” Add-In and click “OK.” c) To start the application, click “Yes” on the pop-up dialogue box. To abort the
application, click “No.”
d) In the “Select Task” dialogue box, select “VMT Mix Representation” and click “OK.” It will take some time before the workspace files are loaded.

8
e) Once the workspace files are loaded, you will find a dialogue box with an “Info” button. Click on the map “Map1–YR95” so that it gets selected (appears in the foreground).
f) To extract the VMT Mix information for any particular link, click the “Info” button and then select that link on the map by clicking on that link using the crosshairs.
g) Once a link is selected, you will find an “Options” dialogue box pop-up that will display the options available to view the VMT data for the selected link. The three options available are: (i) 24-hour averages for the MOBILE5 classes; (ii) 24-hour averages and hourly values of VMT fractions for the 6 vehicle classes: Car, PUV, SUV, Truck, Bus, and Motorcycle; (iii) VMT Mix fractions by vehicle class and by hour for the MOBILE6 classes.

9
h) To view the VMT information for the MOBILE5 classes, click the “MOBILE5” button in the “Options” dialogue box. This will display the 24-hour averages for the VMT fractions for the selected link in the form of a dataview table. The name of the selected link and the adjacent street names are displayed on top of the dataview window.
i) To view the VMT Mix information for the six vehicle classes, click the “6
CLASSES” button in the “Options” dialogue box. This will produce a

10
dialogue box named “Choose” that gives two options for viewing the VMT information: (i) By Hour, and (ii) 24 Hour Averages. To view VMT fractions of the six vehicle classes for a one-hour duration, click the “By Hour” button. From the scroll list, select the hourly duration for which VMT information is desired to display the VMT information of the 6 vehicle classes for the selected link for the selected time period. To view the 24-hour average VMT fractions, click the “24 Hour Averages” button.
j) To view the VMT fractions for the MOBILE6 classes, click the “MOBILE6” button in the “Options” dialogue box. This will display the “Choice” dialogue box, which has 2 options: (i) By hour, and (ii) By vehicle class. If VMT fractions of the MOBILE6 classes are to be viewed for a particular one-hour time period of the day, select the “By Hour” option and then select the desired one-hour duration from the scroll list. If the hourly VMT fractions of a particular MOBILE6 class are to be viewed, then select the “By Vehicle Class” option and then select the desired MOBILE6 class for which the VMT information is desired.

11
k) After viewing the VMT information for a particular link, to view the VMT information for a different link or to view the VMT information for the same link but for a different vehicle class or hour of the day, click the “Info” button again and select the desired link on the map.
Note: It is advisable not to have too many dataviews open at one time, so it is helpful to close the existing dataviews before opening new ones.
ii. Customizing the Application
If the VMT Mix Representation option is chosen, then the VMT information displayed will be for the Dallas-Fort Worth area for the year 1998. If the user wants to use the application to display VMT Mix information for some other road network or for some other year, then he/she needs to create some files containing the VMT information for the desired road network. In the “C:\4377\VMT Distribution\Inputs” folder, you should find a folder named “Representation”. This folder contains all the files necessary to use the VMT Mix Representation application. The folder contains a TransCAD workspace file and some dbf files. The TransCAD workspace file titled, “Final VMT_MIX”, contains all the VMT mix information for the Dallas-Fort Worth area road network for the year 1998. The TransCAD map file titled, “YR95”, is the road network map of the Dallas-Fort Worth area for the year 1995. The “YR95” map file is linked to the workspace file. Similarly, the three dbf files contain all the VMT information for the links on the road network and all of them are linked to the workspace file. The
12
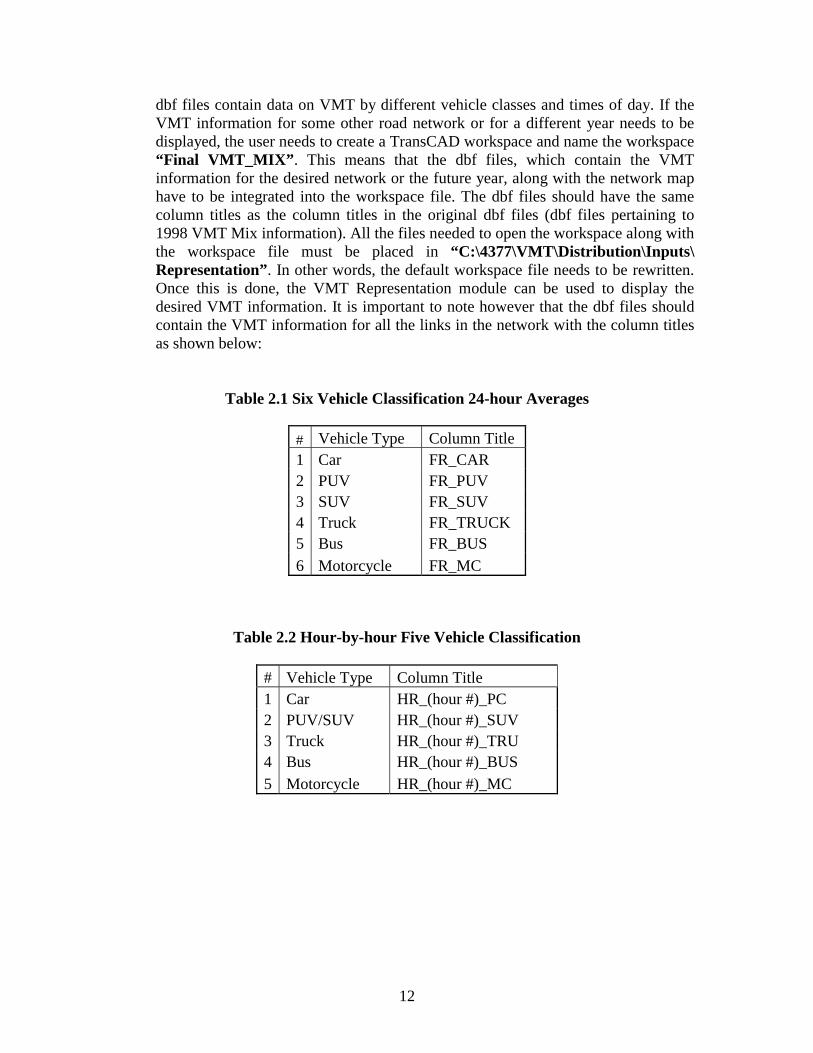
dbf files contain data on VMT by different vehicle classes and times of day. If the VMT information for some other road network or for a different year needs to be displayed, the user needs to create a TransCAD workspace and name the workspace “Final VMT_MIX”. This means that the dbf files, which contain the VMT information for the desired network or the future year, along with the network map have to be integrated into the workspace file. The dbf files should have the same column titles as the column titles in the original dbf files (dbf files pertaining to 1998 VMT Mix information). All the files needed to open the workspace along with the workspace file must be placed in “C:\4377\VMT\Distribution\Inputs\ Representation”. In other words, the default workspace file needs to be rewritten. Once this is done, the VMT Representation module can be used to display the desired VMT information. It is important to note however that the dbf files should contain the VMT information for all the links in the network with the column titles as shown below:
Table 2.1 Six Vehicle Classification 24-hour Averages
Table 2.2 Hour-by-hour Five Vehicle Classification
# Vehicle Type Column Title 1 Car HR_(hour #)_PC 2 PUV/SUV HR_(hour #)_SUV 3 Truck HR_(hour #)_TRU 4 Bus HR_(hour #)_BUS 5 Motorcycle HR_(hour #)_MC
# Vehicle Type Column Title 1 Car FR_CAR 2 PUV FR_PUV 3 SUV FR_SUV 4 Truck FR_TRUCK 5 Bus FR_BUS 6 Motorcycle FR_MC

13
Table 2.3 MOBILE5 Classification 24-hour Averages
Table 2.4 Hour-by-hour Mobile6 Classification
# Vehicle Type Column Title
1 LDV HR_(hour #)_PC 2 LDT1 LD1T(hour #) 3 LDT2 LD2T(hour #) 4 LDT3 LD3T(hour #) 5 LDT4 LD4T(hour #) 6 HDV2b HDV2b(hour #) 7 HDV3 HD3V(hour #) 8 HDV4 HD4V(hour #) 9 HDV5 HD5V(hour #)
10 HDV6 HD6V(hour #) 11 HDV7 HD7V(hour #) 12 HDV8a HDV8a(hour #) 13 HDV8b HDV8b(hour #) 14 HDBS HDBS(hour #) 15 HDBT HDBT(hour #)
16 MC HR_(hour #)_MC
2.2 Forecasting VMT Mix for a Future Year
i. Using the Application a) Open TransCAD and select Tool Add-Ins. b) Select the “4377 VMT Application” Add-In and click “OK”. c) To start the application, click “Yes” on the pop-up dialogue box. To abort the
application, click “No”.
# Vehicle Type Column Title
1 LDGV LDGV 2 LDDV LDDV 3 LDGT1 LDGT1 4 LDGT2 LDGT2 5 LDDT LDDT 6 HDGV HDGV 7 HDDV HDDV 8 MC MC

14
d) Select the “Forecasting VMT Mix for a future year” option in the “Select Task” dialogue box and click “OK.”
e) Click “OK” to proceed with Input file. f) In the “Choose an Input File” dialogue box, browse to the location of the input
file and open the input file. It might take several minutes before you see anything on the screen as the program calculates the VMT fractions.
g) After the VMT fractions are calculated, the network map of the Dallas-Fort Worth area is shown and a tool button “VMT Info” appears on the map. The tool button can be dragged and placed anywhere on the screen. This tool button

15
will allow you to extract the desired VMT information for any link on the network.
h) To extract the VMT Mix information for any particular link, click the tool button and then select that link on the map by clicking on it using the crosshairs.
i) A dialogue box will appear that gives the option of viewing the VMT information of that link for the five vehicles classes (Cars, Utility Vehicles, Trucks, Buses, and Motorcycles) or for the MOBILE6 vehicle classes.

16
j) If the VMT information is desired for the MOBILE6 vehicle classes, click the “MOBILE6” button, which will produce a dialogue box that gives the option of viewing the VMT information of the selected link by a particular vehicle class or for a particular hourly duration of the day. Select the vehicle class or the hourly duration of the day for which the VMT information is desired.
k) The VMT information for the selected link is displayed in the form of a table (dataview).
l) If the VMT information is desired only for the five vehicle classes, click the “5 Classes” tool button, which will produce a dialogue box with options for

17
viewing the VMT information of the selected link for a particular hourly duration of the day or to view the 24-hour average values of VMT fractions of the five vehicles classes. If VMT information by hour is desired, then select the hourly duration for which VMT fractions are required. The results are displayed in a tabular form (dataview).
m) After viewing the VMT information for a particular link, to view the VMT information for a different link or to view the VMT information for the same link but for a different vehicle class or hour of the day, click the “VMT Info” button again and select the desired link on the map.
ii. Description of the Input File
The input file required for forecasting VMT fractions of links for a future year should be of a standardized format that will be discussed in this section.
a) The basic requirement is that the input file should be in dbf format. If working
in Microsoft Excel, one can save an Excel spreadsheet as a dbf file by selecting the file type “DBASE IV.”
b) The second requirement is that the input file should contain the input information for all the links in the network; otherwise, VMT fractions cannot be calculated for all links in the network.
c) The link numbers of the links in the input file should match with the link numbers of the links in the road network map file.
d) The input file should contain information on the link attributes shown in the table below. Care should be taken to ensure that the columns in the input file have titles that match with the column titles as shown in Table 2.5:

18
Table 2.5 Input Table
Link Attribute Column Title Link Number LNKNM
Dummy Variable for major road MAJOR
Dummy Variable for minor road MINOR
Dummy variable for Collector and Local Streets COLL
Dummy Variable for Divided Street DIV
Number of lanes NLANES
Dummy for Low Speed Road (<30 mph) LOWSP
Dummy for Low to Medium Speed Road (31 to 40 mph) LOWMEDSP
Dummy for Medium Speed Road (41 to 55 mph) MEDSP
Dummy for links in CBD area CBD
Dummy for link in Urban area URB
Dummy for links in airport zones AIR
Zonal Manufacturing and Warehousing Acreage MF
Dummy for presence of an institution (school, church, hospital, etc.) INST
Zonal Office Acreage OFFICE
Zonal Retail Acreage RETAIL
iii. Description of Output Files The outputs are stored in the folder “C:\4377\VMT Distribution\Outputs.” This folder contains a lot of dbf files that contain the predicted VMT fractions for all the links in the network. A brief description of each of the output files is as given below:
a) The file “Six_Fractions.dbf” contains the VMT information for all the links for
the six vehicle classes: Auto (Car), PUV, SUV, Bus, Truck, and Motorcycle. These are the 24-hour averages.
b) The files “PC.dbf,” “UV.dbf,” “TRUCK.dbf,” “BUS.dbf,” and “MC.dbf” contain the hourly VMT information for cars, utility vehicles, trucks, buses, and motorcycles respectively.
c) The folder also contains sixteen other dbf files, one each for the sixteen MOBILE6 classes. These files contain the hourly VMT information of the links for the MOBILE6 vehicle classes.
d) The folder contains some other files that are generated by TransCAD while writing the calculated VMT fractions into the dbf files.

19
2.3 Description of the File System of the Application
The folder “C:\4377\VMT Distribution” contains all the files pertaining to the
VMT module of the TransCAD application that has been developed for this project. It contains two main folders, “Inputs” and “Outputs.” The description of the files in the “Outputs” folder has been provided above.
The “Inputs” folder contains four folders. The “1998” folder contains the VMT information for the Dallas-Fort Worth area for the year 1998. It contains the TransCAD workspace that can be used to represent the VMT information on the road network.
The “Representation” folder inside the “Inputs” folder contains all the files necessary to run the “VMT Representation” module of the VMT application. By default, this contains the files pertaining to 1998 data for the Dallas-Fort Worth region. The folder “Factors” inside the “Inputs” folder contains the VMT model specification results for each of the six vehicle classes, namely, SUV, PUV, Truck, Bus, Motorcycle, and Auto. All the files are in dbf format. The folder “Embedded” inside the “Inputs” folder contains the source code of the application and the also the user interface file to which the code was compiled. The source code is titled “vmt_embed.rsc.” It also contains some basic files that are needed to run the application. It is advisable not to tamper with any of the files in this folder. The “Inputs” folder also contains some sample input files that can be used to forecast the VMT fractions.

20

21
3. The Registration Distribution Module As discussed earlier, the Registration distribution Module can be used for two purposes: 1. Age Distribution Representation 2. Forecasting Age Distribution for a Future Year The input requirements and the steps to be followed to use this module for the two purposes differ slightly and hence, the two purposes will be dealt separately. The next few sections describe in detail how the module can be used for the two purposes. They also provide some useful information on the system files and the model outputs.
3.1 Age Distribution Representation
i. Using the Application
This part of the module can be used to represent and obtain the vehicle registration distribution information for a road network. The default registration distribution information displayed is for the Dallas-Fort Worth area for the year 1998. To use this application, follow the step-by-step instructions given below:
a) Open TransCAD and select Tool Add-Ins. b) Select the “4377 Age Distribution Application” Add-In and click “OK.” c) To start the application, click “Yes” on the pop-up dialogue box. To abort the
application, click “No.”
d) In the “Select Task” dialogue box, select “Age Distribution Representation” and click “OK.” It will take some time before the workspace files are loaded.

22
e) Once the workspace files are loaded, you will find a dialogue box with the “Age Info” button. The “Age Info” tool button can be dragged and placed anywhere on the screen. Click on the map “Map1 – TAP919” so that it gets selected (appears in the foreground).
f) To extract the vehicle registration distribution information for any particular zone, click the “Age Info” button and then select that zone on the map by clicking anywhere on that zone using the crosshairs.
g) Once a zone is selected, you will find a “Class” dialogue box pop-up that will display a list of MOBILE6 vehicle classes for which the vehicle registration distribution is available. Select the desired vehicle class.

23
h) The vehicle registration distribution for the selected zone and link combination is displayed in a tabular form (dataview).

24
ii. Customizing the application If the Vehicle Age Distribution Representation option is chosen, then the registration distribution information displayed will be for the Dallas-Fort Worth area for the year 1998. If the user wants to use the application to display registration distribution information for some other zonal divisions or for some other year, then s/he needs to create some files containing the age distribution information of different vehicle classes for the desired zonal divisions. In the “C:\4377\Age Distribution\Inputs” folder, you should find a folder by name “Representation.” This folder contains all the files necessary to use the Registration Distribution Representation application. The folder contains a TransCAD workspace file and some dbf files. The TransCAD workspace file titled “age_distn” contains all the vehicle registration distribution information for the Dallas-Fort Worth area zonal divisions for the year 1998. The TransCAD map file titled “TAP919” is the zonal map of the Dallas-Fort Worth metropolitan area for the year 1995. This map file is linked to the workspace file. Similarly, the dbf files contain all the registration distribution information for different vehicle classes and for all the zones. All of them are linked to the workspace file. If the registration distribution data for some other zonal map or for a different year needs to be displayed, the user needs to create a TransCAD workspace and name the workspace “age_distn”. The workspace should contain the “TAP919” map file and the thirteen dbf files (one each for the thirteen MOBILE6 vehicle classes) that contain the registration distribution information for all the zones. The user must note that the sixteen MOBILE6 vehicle classes have been combined to form just thirteen vehicles classes in the case of vehicle registration distribution (refer to the Final Project Report for a detailed description). The dbf files need to have their columns named as (vehicle class)A(year), where (vehicle class) must be replaced with the corresponding vehicle class and the (year) takes values of 1 to 25 for each of the twenty-five age fraction columns. For example, the fraction of LDV vehicles that are three years old will have a column title “LDVA3.” The zonal numbers column has to be titled “TAPZ.” Once the workspace file is ready, the application can be used to display the new registration distribution information.
3.2 Forecasting Age Distribution for a Future Year
i. Using the Application
a) Open TransCAD and select Tool Add-Ins. b) Select the “4377 Age Distribution Application” Add-In and click “OK.” c) To start the application, click “Yes” on the pop-up dialogue box. To abort the
application, click “No.” d) Select the “Forecasting Age Distribution for a future year” option in the
“Select Task” dialogue box and click “OK.”

25
e) Click “OK” to proceed with Input file. f) In the “Choose an Input File” dialogue box, browse to the location of the input
file and open the input file. It might take some time before you see anything on the screen as the program calculates the age fractions.
g) After the age fractions are calculated, the zonal map of the Dallas-Fort Worth area is shown and a tool button “Age Fractions” appears on the map. The tool button can be dragged and placed anywhere on the screen. This tool button will

26
allow you to extract the desired registration distribution information for any link on the network.
h) To extract the registration distribution information for any particular zone, click the tool button and then select that zone on the map by clicking on that zone using the crosshairs.
i) A dialogue box will appear that lists all the MOBILE6 vehicle classes for which the registration distribution information is available. Select the vehicle class for which information is desired.

27
j) The registration distribution information for the selected zone is displayed in the form of a table (dataview).
k) After viewing the registration distribution information for a particular zone, to view the registration distribution information for a different zone or to view the VMT information for the same zone but for a different vehicle class, click the “Age Fractions” button again and select the desired zone on the map.
ii. Description of the Input File The input file required for forecasting vehicle registration distribution of zones for a
future year should be of a standardized format that will be discussed in this section.
a) The basic requirement is that the input file should be in dbf format. If working in Microsoft Excel, one can save an Excel spreadsheet as a dbf file by selecting the file type “DBASE IV.”
b) The second requirement is that the input file should contain the input information for all the zones in the zonal map; otherwise, age fractions cannot be calculated for all zones in the map.
c) The zone numbers of the zones in the input file should match with the zone numbers of the zones in the zonal map file.
d) The input file should contain information on the zonal attributes shown in the table below. Care should be taken to ensure that the columns in the input file have titles that match with the column titles as shown in Table 3.1:

28
Table 3.1 Input Table
Zonal Attribute Column Title Zonal Number TAPZ Median Income MEDINC Population Density POPULATI Basic Employment BAISC_EM Retail Employment RETAILEM Retail Acreage RETAIL Infrastructure Area (Transportation, Airports, etc.) INFRA Parking Area PARKSP
iii. Description of Output Files
The outputs are stored in the folder “C:\4377\Age Distribution\Outputs.” This folder contains a lot of dbf files that contain the predicted registration distribution of vehicles for all the zones in the metropolitan area. The folder also contains thirteen dbf files, one each for the thirteen combined MOBILE6 classes. These files contain the age fractions for the twenty-five age categories of all the zones for the MOBILE6 vehicle classes. The folder contains some other files that are generated by TransCAD while writing the calculated VMT fractions into the dbf files.
3.3 Description of the File System of the Application
The folder “C:\4377\Age Distribution” contains all the files pertaining to the VMT
module of the TransCAD application that has been developed for this project. It contains two main folders, “Inputs” and “Outputs.” The description of the files in the “Outputs” folder has been provided above. The “Inputs” folder contains four folders. The “1998” folder contains the VMT information for the Dallas-Fort Worth area for the year 1998. It contains the TransCAD workspace that can be used to represent the vehicle registration distribution information on the road network. The “Representation” folder inside the “Inputs” folder contains all the files necessary to run the “Age Representation” module of the Age Distribution application. By default, this contains the files pertaining to 1998 data for the Dallas-Fort Worth region. The “Factors” folder inside the “Inputs” folder contains the model specification results of the fractional split model for vehicle registration distribution for each of the thirteen MOBILE6 vehicle classes. All the files are in dbf format.

29
The “Embedded” folder inside the “Inputs” folder contains the source code of the application and the also the user interface to which the code was compiled. The source code is titled “Final Age.rsc.” It also contains some basic files that are needed to run the application. It is advisable not to tamper with any of the files in this folder.
The “Inputs” folder also contains some sample input files that can be used to forecast the registration distributions.

30