uses - usgs
TRANSCRIPT
uses U.S. Department of the Interior U.S. Geological Survey
science for a changing *f6rid
L
Comparison of NPDES Program Findings for Selected Cities in the United States
T he U.S. Environmental Protection Agency, under
section 402(p) of the Water Quality Act of 1987, has required municipalities with populations of more than 100,000 to obtain National Pollutant Discharge Elimination System (NPDES) permits for urban stormwater discharge. This regulation is intended to minimize pollutant loadings from urbanized areas and preserve the quality of streams that receive stormwater. To apply for a NPDES permit, a municipality must monitor the chemistry of stormwater from basins having residential, commercial, and industrial land uses, and estimate storm- and annual- pollutant loads and event-mean concentrations of 12 selected properties and constituents. The properties and constituents include biochemical
Data Collection
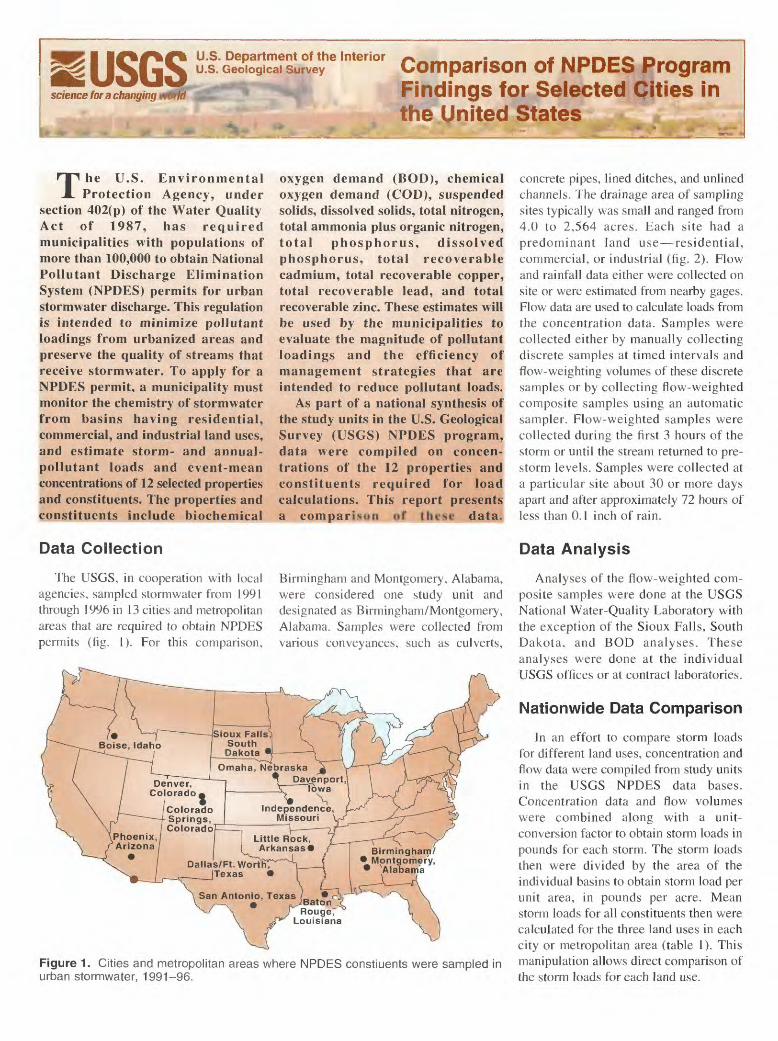
The USGS, in cooperation with local agencies, sampled stormwater from 1991 through 1996 in 13 cities and metropolitan areas that are required to obtain NPDES permits (fig. 1). For this comparison,
oxygen demand (BOD), chemical oxygen demand (COD), suspended solids, dissolved solids, total nitrogen, total ammonia plus organic nitrogen, total phosphorus, dissolved phosphorus, total recoverable cadmium, total recoverable copper, total recoverable lead, and total recoverable zinc. These estimates will be used by the municipalities to evaluate the magnitude of pollutant loadings and the efficiency of management strategies that are intended to reduce pollutant loads.
As part of a national synthesis of the study units in the U.S. Geological Survey (USGS) NPDES program, data were compiled on concen trations of the 12 properties and constituents required for load calculations. This report presents a comparison of these data.
Birmingham and Montgomery, Alabama, were considered one study unit and designated as Birmingham/Montgomery, Alabama. Samples were collected from various conveyances, such as culverts,
IColorado Springs, Colorado
Birmingham/ Montgomery,W AloKorvko
Figure 1. Cities and metropolitan areas where NPDES constiuents were sampled in urban stormwater, 1991-96.
concrete pipes, lined ditches, and unlined channels. The drainage area of sampling sites typically was small and ranged from 4.0 to 2,564 acres. Each site had a predominant land use residential, commercial, or industrial (fig. 2). Flow and rainfall data either were collected on site or were estimated from nearby gages. Flow data are used to calculate loads from the concentration data. Samples were collected either by manually collecting discrete samples at timed intervals and flow-weighting volumes of these discrete samples or by collecting flow-weighted composite samples using an automatic sampler. Flow-weighted samples were collected during the first 3 hours of the storm or until the stream returned to pre- storm levels. Samples were collected at a particular site about 30 or more days apart and after approximately 72 hours of less than 0.1 inch of rain.
Data Analysis
Analyses of the flow-weighted com posite samples were done at the USGS National Water-Quality Laboratory with the exception of the Sioux Falls, South Dakota, and BOD analyses. These analyses were done at the individual USGS offices or at contract laboratories.
Nationwide Data Comparison
In an effort to compare storm loads for different land uses, concentration and flow data were compiled from study units in the USGS NPDES data bases. Concentration data and flow volumes were combined along with a unit- conversion factor to obtain storm loads in pounds for each storm. The storm loads then were divided by the area of the individual basins to obtain storm load per unit area, in pounds per acre. Mean storm loads for all constituents then were calculated for the three land uses in each city or metropolitan area (table 1). This manipulation allows direct comparison of the storm loads for each land use.

Table 1. Mean storm loads in pounds per acre for 11 NPDES properties and constituents in the United States, 1991 [ , not analyzed for; ND, 50 percent or more of values below detection limit]
-96
Biochemical Study oxygen unit demand
Chemical oxygen demand
Suspended Dissolved Total solids solids nitrogen
Total ammonia Total plus organic Total Dissolved recoverable
nitrogen phosphorus phosphorus copper
Total recoverable
lead
Total recoverable
zinc
Residential land useBirmingham/
Montgomery, Alabama
Phoenix, Arizona
Little Rock, Arkansas
Colorado Springs, Colorado
Denver, Colorado
Boise, Idaho
Davenport, Iowa
Baton Rouge, Louisiana
Independence, Missouri
Omaha, Nebraska
Sioux Falls, South Dakota
Dallas/Fort Worth, Texas
San Antonio, Texas
0.30
.41
.75
.60
.08
.57
.49
.23
.09
.22
.46
7.3
1.6
2.6
2.0
2.4
.36
5.5
3.0
1.1
.35
2.9
6.8
1.1
4.1
11
3.1
5.9
.28
63
6.3
2.6
1.5
3.3
12
1.2
1.2
1.2
.86
1.6
.17
4.3
2.4
1.1
1.3
2.8
3.8
0.034
.061
.091
.025
.068
.0013
.013
.36
.032
.042
.030
.068
.11
0.025
.050
.060
.022
.052
.0064
.0085
.34
.020
.028
.025
.047
.092
0.022
.0067
.017
.0048
.013
.0009
.0027
.059
.0074
.0083
.0030
.013
.022
0.022
.0030
.011
.0018
.0035
.0006
.0028
.021
.0024
.0035
.0010
.0089
.012
5.1x10⁻²
2.7X10⁻⁴
1.9x10~4
8.3X10⁻⁵
6.0X10⁻⁴
3.1X10⁻⁵
_
2.8X10⁻³
9.4x10⁻⁴
1.5x10⁻⁴
ND
2.7x10⁻⁴
7.6x10⁻⁴
1.3x10⁻⁴
6.0x10⁻⁴
4.2X10⁻⁴
5.6x10⁻⁴
6.6x10⁻⁵
8.3x10⁻⁵
_
1.1X10⁻²
1.2x10⁻³
3.5x10⁻⁴
ND
5.8x10⁻⁴
2.6x10⁻³
9.6x10⁻⁴
3.0x10⁻³
1.5x10⁻³
1.3x10⁻³
2.9x10⁻³
4.4x10⁻⁴
2.6X10⁻²
4.8x10⁻³
1.4x10⁻³
6.2x10⁻⁴
2.3x10⁻³
8.9x10⁻³
Commercial land useBirmingham/
Montgomery, Alabama
Phoenix, Arizona
Little Rock, Arkansas
Colorado Springs, Colorado
Denver, Colorado
Boise, Idaho
Davenport, Iowa
Baton Rouge, Louisiana
Independence, Missouri
Omaha, Nebraska
Sioux Falls, South Dakota
Dallas/Fort Worth, Texas
San Antonio, Texas
Birmingham/ Montgomery, Alabama
Phoenix, Arizona
Little Rock, Arkansas
Colorado Springs, Colorado
Denver, Colorado
Boise, Idaho
Davenport, Iowa
Baton Rouge, Louisiana
Independence, Missouri
Omaha, Nebraska
Sioux Falls, South Dakota
Dallas/Fort Worth, Texas
San Antonio, Texas
2.2
.81
.89
10
1.4
1.8
1.8
.43
.23
.49
.73
_
5.9
.88
.25
5.4
2.9
3.1
1.7
.05
.53
.50
4.9
14
4.4
6.3
15
3.6
14
14
1.6
.49
4.7
8.9
3.4
5.8
4.6
1.4
9.2
37
5.5
6.7
.17
5.6
6.3
.45
6.7
5.1
8.8
4.5
2.2
33
11
4.5
1.3
4.0
15
2.2
7.7
3.0
3.1
22
41
20
66
.62
19
10
.74
7.2
1.8
2.8
3.2
.68
_
12
3.1
1.8
1.6
4.8
5.5
1.5
2.2
2.3
.52
2.4
_
_
33
250
6.5
.52
5.4
6.0
.019
.33
.076
.075
.099
.21
.030
.32
.13
.046
.024
.11
.15Industrial
.024
.099
.22
.016
.13
_
.036
.54
.033
.16
.017
.11
.10
.014
.26
.049
.050
.065
.21
.020
.25
.094
.028
.019
.068
.12land use
.017
.062
.19
.011
.092
_
.034
.43
.019
.11
.013
.064
.061
.0031
.034
.0097
.0081
.0082
.0079
.0033
.034
.018
.0061
.0022
.012
.028
.0067
.014
.047
.0017
.021
.0009
.074
.014
.025
.0027
.020
.025
.0020
.027
.0072
.0036
.0037
.0043
.0041
.017
.0059
.0037
.0012
.0058
.012
.0045
.0050
.016
.0010
.0084
.0001
.044
.0024
.012
.0010
.010
.018
1.4X10⁻⁴
1.1X10⁻³
6.8x10⁻⁴
3.6x10⁻⁴
2.7x10⁻³
6.3x10⁻⁴
_
2.4x10⁻³
1.1x10⁻³
2.1x10⁻⁴
ND
8.9x10⁻⁴
1.2x10⁻³
9.9x10⁻⁴
1.4x10⁻³
5.3x10⁻⁴
2.0x10⁻⁴
5.9x10⁻³
_
_
6.3x10⁻³
8.8x10⁻⁴
2.2x10⁻³
ND
7.5X10⁻³
7.4x10⁻⁴
2.0x10⁻⁴
6.8x10⁻⁴
1.5x10⁻³
3.1x10⁻³
1.5x10⁻³
9.0x10⁻⁴
_
9.1x10⁻³
4.6x10⁻³
5.1x10⁻⁴
ND
2.4x10⁻³
4.9x10⁻³
1.7x10⁻³
1.6x10⁻³
1.1x10⁻³
1.0x10⁻³
1.2x10⁻²
_
_
3.9x10⁻²
1.5X10⁻²
5.3x10⁻³
ND
4.8x10⁻³
1.1x10⁻³
2.0x10⁻³
1.3x10⁻²
7.6x10⁻³
6.1x10⁻³
7.7x10⁻³
4.6x10⁻³
_
4.2x10⁻²
1.4x10⁻²
2.3x10⁻³
1.1x10⁻³
7.2x10⁻³
1.8x10⁻²
7.2x10⁻³
7.2x10⁻³
9.4x10⁻³
3.7x10⁻³
4.0x10⁻²
_
_
8.3x10⁻²
1.1x10~ 1
2.2x10⁻²
4.9x10⁻⁴
1.5x10⁻²
1.5x10⁻²

Physical Properties
BOD, COD, suspended solids, and dissolved solids were compared for all the cities with the exception of Davenport, Iowa; Boise, Idaho; and Birmingham/Montgomery, Alabama. Samples from Davenport, Iowa, were not analyzed for these properties and constituents. An industrial land-use basin was not sampled in Boise, Idaho. Samples from Birmingham/ Montgomery, Alabama, were not analyzed for BOD.
BOD and COD are determined by measurement of the quantity of oxygen utilized by organic matter and chemicals in stormwater samples and are used to indicate pollution (Hem, 1992). Mean storm loads of BOD varied by two orders of magnitude, from 0.05 to 10 pounds per acre. The largest mean storm loads of BOD were associated with industrial land-use basins, except for the maximum that occurred in commercial land-use basins in Denver, Colorado. Mean storm loads of COD varied by two orders of magnitude, from 0.17 to 37 pounds per acre. The largest mean storm loads of COD were associated with commercial land-use sites, except for the maximum that occurred in industrial land-use basins in Baton Rouge, Louisiana.
Concentrations of suspended solids and dissolved solids are measures of solids loads in stormwater and also may be used as indicators of pollution. Mean storm loads of suspended solids varied by more than two orders of magnitude, from 0.28 to 66 pounds per acre. The largest mean storm loads of suspended solids were associated with the industrial land-use basins; the maximum occurred in Omaha, Nebraska. Mean storm loads of dissolved solids varied by more than three orders of magnitude, from 0.17 to 250 pounds per acre. The largest mean storm loads of dissolved solids were associated with industrial land-use basins; the maximum occurred in Independence, Missouri.
Nutrients
Four nutrient constituents total nitrogen, total ammonia plus organic nitrogen, total phosphorus, and dissolved phosphorus are being analyzed by the USGS NPDES program.
These constituents were compared for all land uses in selected cities, with the exception of industrial land-use basins in Boise, Idaho. An industrial land-use basin was not part of the sampling program in Boise.
Nutrients are essential components in plant growth; however, an overabundance of these constituents will cause undesir able algal blooms in bodies of water that are used for urban drinking- water sup plies (Hem, 1992). These algal blooms cause adverse effects on the taste and odor of drinking water and have the potential to cause more serious health problems.
Mean storm loads of total nitrogen varied by more than two orders of mag nitude, from 0.0013 to 0.54 pounds per acre. The largest mean storm loads of total nitrogen are associated with indus trial land-use basins; the maximum occurred in Baton Rouge, Louisiana.
Mean storm loads of total ammonia plus organic nitrogen varied by almost two orders of magnitude, from 0.0064 to 0.43 pounds per acre. The largest mean storm loads of total ammonia plus organic nitrogen were associated with industrial and commercial land-use basins; the maximum occurred in Baton Rouge, Louisiana.
Mean storm loads of total phosphorus varied by almost two orders of magni tude, from 0.0009 to 0.074 pounds per acre. The largest mean storm loads of total phosphorus were associated with industrial land-use basins; the maximum occurred in Baton Rouge, Louisiana.
Mean storm loads of dissolved phos phorus varied by more than three orders of magnitude, from 0.0001 to 0.044 pounds per acre. The largest mean storm loads of dissolved phosphorus were associated with industrial land-use basins; the maximum occurred in Baton Rouge, Louisiana.
Figure 2. National Pollutant Discharge Elimination System (NPDES) residential land- use site at Glendale, Arizona.

Trace Metals
Concentrations of four trace-metal constituents total recoverable copper, total recoverable zinc, total recoverable cadmium, and total recoverable lead are being analyzed by the USGS NPDES program. These constituents were compared for all land uses in the selected cities with the exception of Davenport, Iowa, and Boise, Idaho. Concentrations of these constituents were not determined in Davenport, Iowa, and an industrial land- use basin was not sampled in Boise, Idaho.
Copper and zinc are essential to plant and animal metabolism and are needed in small amounts by all plants and animals. Large amounts of these metals in drinking water, however, can cause adverse effects on the taste and odor of drinking water.
Mean storm loads of total recoverable copper varied by more than three orders of magnitude, from 3.1 xlO~ 5 to 5.1xl02 pounds per acre. The largest mean storm loads of total recoverable copper were associated with commercial and industrial land-use basins. The excep tion was the maximum that occurred in a residential land-use basin in Birmingham/Montgomery, Alabama.
Mean storm loads of total recoverable zinc varied by almost three orders of magnitude, from 4.4xlO~ 4 to l.lxlO' 1 pounds per acre (fig. 3).
The largest mean storm loads of total recoverable zinc were associated with industrial land-use basins; the maximum occurred in Independence, Missouri.
Cadmium and lead tend to bioaccumulate in plants and animals. Large concentrations of these metals lead to toxicity and health problems in plants and humans (Hem, 1992).
Concentrations of total recoverable cadmium were considered in this analysis of data, but more than 70 percent of the analyses were below detection limits. No mean storm loads of cadmium were included in the data tables.
Mean storm loads of total recoverable lead varied by almost three orders of magnitude, from 8.3 xlO' 5 to 3.9x10'2 pounds per acre. The largest mean storm loads of total recoverable lead were associated with industrial land-use basins; the maximum occurred in Baton Rouge, Louisiana.
The majority of minimum mean storm loads occurred in residential land-use basins and the majority of maximum mean storm loads occurred in industrial land-use basins. The information contained 'in this fact sheet is part of ongoing studies and may be updated upon completion of the NPDES program.
Kenneth D. Possum and Dawn S. McDoniel
_ < LJJ
I- Q
38Oz
1.0
0.1
0.01
0.001
0.0001
[] Residential
U Commercial
J Industrial
> - * of 10 _
Figure 3. Mean storm loads of total recoverable zinc.
January 1998
Selected References
Baldys Stanley, III, Raines, T.H., Mansfield, B.L., and Sandlin, J.T., 1997, Hydrologic data for urban stormwater studies in the Dallas-Fort Worth area, Texas, 1992-94: U.S. Geological Survey Open-File Report 96-482, 254 p.
Barks, C.J., 1995, Verification and adjust ment of regional regression models for urban storm-runoff quality using data collected in Little Rock, Arkansas: U.S. Geological Survey Water-Resources Investigations Report 94-4216, 36 p.
Possum, K.D., and Davis, R.G., 1996, Physical, chemical, biological, and toxicity data from the study of urban stormwater and ephemeral streams, Maricopa County, Arizona, water years 1992-95: U.S. Geological Survey Open- File Report 96-394, 71 p.
Guerard, P.V., and Weiss, W.B., 1995, Water quality of storm runoff and comparison of procedures for estimating storm-runoff loads, volume, event-mean concen trations, and the mean load for a storm for selected properties and constituents for Colorado Springs, southeastern Colorado, 1992: U.S. Geological Survey Water-Resources Investigations Report 94-4194, 68 p.
Hem, J.D., 1992, Study and interpretation of the chemical characteristics of natural water: U.S. Geological Survey Water- Supply Paper 2254, 263 p.
Kjelstrom, L.C., 1995, Data for and adjusted regional regression models of volume and quality of urban storm-water runoff in Boise and Garden City, Idaho, 1993-94: U.S. Geological Survey Water- Resources Investigations Report 95-4228, 36 p.
Niehus. C.A., 1997, Characterization of stormwater runoff in Sioux Falls, South Dakota, 1995-96: U.S. Geological Survey Water-Resources Investigations Report 97-4070, 62 p.
Pearman, J.L., Sedberry, V.E., Stricklin,V.E., and Cole, P.W., 1993, Water-resources data for Alabama, water year 1993: U.S. Geological Survey Water-Data Report AL-93-1, 518 p.
Schalk, G.K., 1994, Quantity and quality of base flow and stormwater runoff in Independence, Missouri October 1991 to February 1993: U.S. Geological Survey Open-File Report 93-495, 69 p.
For more information contact:District ChiefU.S. Geological Survey520 N. Park Ave., Suite 221Tucson, Arizona 85719-5035(520)670-6671http://wwwdaztcn.wr.usgs.gov
USGS Fact Sheet FS-192-97