usg corporation 2008 letter to shareholders · brand aqua-tough fiber-reinforced gypsum board is...
TRANSCRIPT

usg corporation 2 0 0 8 L e t t e r to s h a r e h o L d e r s
58366_USG.indd 1 3/12/09 9:41:29 PM

business overv iew
gypsum ceilings DistributionBusinesses
united states Gypsum Company
CGC inc.
usG Mexico s.a. de C.v.
usG interiors, inc.
usG international
CGC inc.
L&w supply Corporation
products and services
Manufactures and markets
gypsum wallboard, joint treatments and
textures, cement board, gypsum fiber
panels, plaster, shaft wall systems and
industrial gypsum products
Manufactures and markets acoustical
ceiling panels, ceiling suspension grid,
specialty ceilings and other building
products
sells wallboard, steel studs, ceiling
products and other building materials;
specializes in delivering construction
materials to job sites
Best-Known name Brands
sheetroCK gypsum panels; sheetroCK
joint compounds; duroCK cement board;
FiberoCK gypsum fiber panels; seCuroCK
roof board and sheathing; LeveLroCK
floor underlayment; hYdroCaL gypsum
cement; iMPeriaL building plasters;
diaMond building plasters; beadeX
corner bead products; MoLd touGh
gypsum panels; and sheetroCK tools
astro, eCLiPse, Frost and radar
ceiling panels; donn dX, FineLine and
CentriCitee ceiling grid; CoMPÄsso
suspension trim; Curvatura 3-d ceiling
system; GeoMetriX ceiling panels; toPo
3-dimensional system; biLLo 3-dimen-
sional panels; Libretto ceiling systems;
and usG desiGn studio
geographical areas served
united states, Canada, Mexico united states, Canada, Mexico and more
than 125 other countries in all parts of the
world: north, Central and south america,
the Caribbean, europe, the Middle east,
asia, the Pacific rim, africa
united states, Mexico
customers
purchasers: specialty drywall centers,
distributors, hardware cooperatives,
buying groups, home centers, mass
merchandisers; influencers: architects,
specifiers, building owners; end users:
contractors, builders, do-it-yourselfers
purchasers: specialty acoustical
centers, distributors, hardware
cooperatives, home centers, contractors;
influencers: architects, specifiers, interior
designers, building owners, tenants, facility
managers; end users: contractors,
builders, do-it-yourselfers
purchasers and end users:
contractors, builders
58366_USG.indd 2 3/12/09 9:41:29 PM

we are relieved to report that 2008 is finally behind us. we wish we
could say that we are looking forward to 2009, but our customary
optimism is tempered by the economic realities we face today.
what began as a housing problem has grown into a global economic
crisis that has rocked markets, reduced consumer confidence and
spending, and constricted credit around the world.
virtually every company in the united states felt the impact, and
we were no exception.
including several charges, we reported a net loss of $463 million for
2008. sales declined significantly in our north american Gypsum
and building Products distribution segments; both reported
operating losses. one of the few bright spots was the performance
of our worldwide Ceilings business, which, thanks to a strong first
half, reported record sales and strong operating profit.
Managing in turbulent times
our results reflect the weakest economic conditions in a half-century.
although it may be less apparent, our results also show that we
have acted aggressively to manage this enterprise in turbulent
times — and control the things we can.
First and foremost, we have scaled our operations to our markets.
as recently as 2005, new housing starts exceeded 2 million units
on an annualized basis and the commercial, repair and remodeling
and international markets were strong. as we entered 2009,
annualized housing starts had fallen to 466,000 units, the lowest
level recorded in 50 years and less than one-quarter of the peak.
the challenge is to steer the market’s nose dive into a safe landing.
as the market declined we were quick to remove excess capacity
from our manufacturing and distribution networks. since the
beginning of this downturn, we idled or closed eleven wallboard
lines that represented approximately 3.1 billion square feet of
capacity, three paper mills and a duroCK cement board line. we
closed or consolidated over 60 L&w supply distribution locations
and reduced our specialized delivery fleet by 400 vehicles. even so,
L&w continues to have a national footprint, serving its customers
through approximately 200 locations.
we have been just as aggressive in cutting costs and maintaining
our liquidity. in January 2008, we reduced overall expenses by
5 percent and greatly reduced other discretionary spending.
seeing no signs of improvement in our markets, we made further
adjustments in May that included eliminating 10 percent of our
salaried positions.
the financial meltdown in the third quarter signaled that our
markets would probably weaken further, so we implemented an
even more aggressive cost-reduction program that reduced
salaried positions by an additional 20 percent. we also made
significant cuts in marketing and technical services and reduced
overhead spending by another 20 percent. we expect these efforts
to produce more than $150 million in annualized savings in 2009.
Financial flexibility
we also have managed our balance sheet to maintain our
financial flexibility.
during the fourth quarter of 2008, in a time of tight credit, we
raised $400 million through a convertible note offering to
strengthen our capital position. we also successfully negotiated
with our banks to modify our credit agreement. the agreement is
now secured by accounts receivable and inventory and provides
for borrowings of up to $500 million based on a borrowing base
determined by the levels of accounts receivable and inventory. the
revised agreement has only one restrictive financial covenant, and
it applies only if our borrowing availability under the agreement is
less than $75 million. and we have no long-term debt maturities
before 2016, other than annual debt amortization under our ship
mortgage facility.
we are matching our operations to the realities of our markets. we
are actively managing our financial flexibility. and we are ready
to make more changes — except to our basic beliefs. even with the
to our Fellow shareholders:
58366_USG.indd 3 3/12/09 9:41:29 PM

practicing the twin values of service and quality has brought us the strongest relationships with customers that we have ever had.
challenges we are facing today, we have continued to nurture the
core values that are fundamental to our leadership.
safety
our commitment to safety is of the first importance, long-term
and unwavering. in 2008, our safety performance was terrific,
nearly equal to our record performance of 2007. several of our
plants earned the prestigious osha star award for safety, bringing
the current total to eight plants, and 15 others are now being
considered for the award. our overall safety performance is more
than 14 times better than the typical manufacturing company in
the united states.
operational excellence
although volumes are low, we continue to pursue operating
efficiency; it’s been a core value for more than a century.
wallboard operating metrics are at the highest levels we have
achieved in four years, helping us manage costs and improving
our competitive position.
we also completed several important upgrades to our operations
that will enable us to further improve productivity and meet future
demand. we opened a new paper mill in Michigan that is producing
the highest-quality paper in our network and significantly
reducing our paper manufacturing costs. our new wallboard plant
in washingtonville, Pa., is on its way to being the lowest-cost facility
serving the new York metropolitan market. a new wallboard plant
in norfolk, va., replaced a 60-year-old facility and lowers our
manufacturing costs in that location by 25 percent. our new ship,
The Integrity, will carry gypsum rock from Canada to several of our
manufacturing sites in north america at a lower cost and with a
smaller carbon footprint.
these investments, along with others we have completed in recent
years, will enable us to extend our leadership when the economy
recovers. in the meantime, major new capital expenditures can be
curtailed. in 2009, capital spending will be reduced by approximately
$190 million from 2008 levels, to $50 million.
innovation
as the organization that invented wallboard, we have a long
tradition of innovation in our products and processes. in 2008, we
were awarded 126 new patents — 23 in the united states and 103
in other countries. new product successes include neXt Gen,
the latest addition to our line of duroCK brand cement board
products that install more easily than competitors’ products. we
also offer one of the widest selections of ceiling panels that meet
stringent standards for formaldehyde emissions. FiberoCK
brand aQua-touGh fiber-reinforced gypsum board is not only a
lower-cost tile backer option, but it can also be installed as
sheathing in exterior applications. FiberoCK and duroCK
products were successfully rolled out to more than 2,000 retail
outlets in 2008.
strong customer relationships
Practicing the twin values of service and quality has brought us the
strongest relationships with customers that we have ever had. in
2008, each of our key customer satisfaction benchmarks, including
on-time delivery and invoice accuracy, were at all-time highs. day-in
and day-out, face-to-face contact with customers, backed by an
enterprise information management system that was implemented
in 2007, creates real value for contractors, specialty distributors,
large retailers, architects and others. the importance of our efforts
can be measured by the price improvement that sheetroCK
brand gypsum panels achieved during the year, in one of the most
depressed markets in our history. our customers recognize and
appreciate usG’s value proposition and the contributions we
make to their businesses — and reward us.
58366_USG_u2.indd 4 3/17/09 3:49:40 PM
innovation and new product development will help to build our leadership in low-cost operations and in customer service.
Looking ahead
in the toughest times we have faced in our careers we have
achieved some successes, controlled the operating factors that are
within our control and continued to set the stage for an eventual
recovery. but we have always tried to speak with you realistically,
and realistically speaking, there is little to look forward to in the
immediate future. 2009 is likely to offer even fewer opportunities
than 2008. the new residential construction market is expected to
remain weak and we expect the economic recession in the u.s. will
contribute to additional declines in both remodeling and commercial
construction. Meanwhile, Canadian and Mexican markets now seem
poised to follow the u.s. into a recession.
the housing crisis continues and will continue for some time. but
once the nation has worked through the large inventory of unsold
homes, the prospects begin to brighten.
in its February 2009 report, the Joint Center for housing studies at
harvard university said that over the coming decade, the nation’s
housing stock needs to accommodate an additional 14 million to
15 million new households, with nearly half of this demand coming
from people immigrating to the u.s. with the median age of the
nation’s housing stock now at about 34 years and rising, the outlook
for repair and remodel activity also is promising. a third trend — the
growing interest in “green” construction and remodeling — will fuel
demand for new approaches to construction and for many of our
products, which have long used recycled materials.
the challenge is to get from here to there, from a deep recession
to a robust recovery. it’s a challenge that usG has faced before.
in late 1931, when the Great depression was tightening its grip on
the country, united states Gypsum Company’s executive vice
president, oliver M. Knode, wrote, “…the real test of our ability to
manage is at hand. the question (the answer to which is needed
right now) is what are the members of the operating force of this
Company going to do about it?”
the same question is relevant today. and like Mr. Knode’s team
then, we know what needs to be done.
over the short term, we will continue to focus on the essentials
of managing through a downturn: scaling our operations to the
market, managing our capacity, controlling our costs and
maintaining our liquidity. we will concentrate on the elements
within our control, including customer satisfaction and operational
excellence that contribute the most to our performance. we have
shown our willingness to make difficult decisions and remain
ready to react in light of changing conditions.
over the long term, we look forward to accelerating our growth.
innovation and new product development will help to build our
leadership in low-cost operations and in customer service. we will
seek to selectively extend our core businesses.
Just as in the Great depression, the challenges we face today are
significant. but so are our strengths. Leading brand names,
modern, low-cost production, a nationwide distribution network
and strong customer relationships are as valuable now as at any
time. so are the people of usG. over the past months, their work
has been hard and sometimes painful, but they have kept us
moving forward. with their continued faith and confidence — and
yours — we will weather tough times and lead the market’s
eventual recovery. and 107 years of experience says that it will.
William c. Foote
Chairman and
Chief Executive Officer
James s. Metcalf
President and
Chief Operating Officer
58366_USG.indd 5 3/12/09 9:41:29 PM

Jose armario (2, 5) Group President,
Mcdonald’s Canada
and Latin america,
Mcdonald’s Corporation
robert L. Barnett (2*, 4, 5) Former executive
vice President,
Motorola, inc.
Keith a. Brown (2, 4) President,
Chimera Corporation
James c. cotting (3, 5) Former Chairman and
Chief executive officer,
navistar international
Corporation
Lawrence M. crutcher (2, 3, 4*) Member, board of advisors,
veronis suhler stevenson
William c. Foote Chairman and
Chief executive officer
W. Douglas Ford (1, 4, 5*)
Former Chief executive,
refining and Marketing,
BP amoco p.l.c.
steven F. Leer (1*, 3, 4) Chairman and
Chief executive officer,
arch Coal, inc.
Marvin E. Lesser (1, 2) Managing Partner,
sigma Partners, L.P.
James s. Metcalf President and
Chief operating officer
Judith a. sprieser (1, 3*, 4) Former Chief executive officer,
transora, inc.
Committees of the board of directors1 Compensation and organization Committee 2 audit Committee 3 Finance Committee 4 Governance Committee 5 Corporate affairs Committee * denotes Chair
William c. Foote Chairman and
Chief executive officer
James s. Metcalf President and
Chief operating officer
stanley L. Ferguson executive vice President
and General Counsel
richard H. Fleming executive vice President
and Chief Financial officer
Brian J. cook senior vice President,
human resources
D. rick Lowes senior vice President
and Controller
Dominic Dannessa vice President and
Chief technology officer
Brendan J. Deely vice President; President
and Chief executive officer,
L&W supply Corporation
christopher r. griffin vice President; President,
usG international
Fareed a. Khan vice President; President,
usG building systems
Karen L. Leets vice President and treasurer
Donald s. Mueller vice President and
Chief innovation officer
Ellis a. regenbogen vice President, associate
General Counsel and
Corporate secretary
Jennifer F. scanlon vice President and Chief
information officer
Board of Directors corporate officers
direCtors and CorPorate oFF iCers
a note of thanks to david w. Fox,
valerie b. Jarrett, edward M.
bosowski and Clarence b. owen.
their contributions, dedication
and leadership during their ten-
ures with usG are appreciated.
58568_USG_u3.indd 6 3/26/09 10:52:23 AM

the following trademarks used herein are owned by usG Corporation or its subsidiaries: aQua-touGh, astro, Centricitee, Compässo, Curvatura, diamond, donn, durock, dX, eclipse, Fiberock, Fineline, geometrix, hydrocal, imperial, LeveLroCK, mold tough, neXt Gen, radar, seCuroCK, sheetrock, topo, tuff-hide, usG.
annual Meeting of stockholdersthe 2009 annual meeting of stockholders of usG Corporation
will be held at 9:00 am, wednesday, May 13 at usG Corporation,
550 west adams street, Chicago, illinois.
available informationFinancial and other information about the Corporation can be
accessed at its web site: www.usg.com. the Corporation has
made available at its web site, throughout the period covered
by this report, its annual report on Form 10-K, quarterly reports
on Form 10-Q, current reports on Form 8-K and all amendments
to those reports as soon as possible after such material is elec-
tronically filed with or furnished to the securities and exchange
Commission. if you wish to receive a paper copy of any exhibit to
the Corporation’s reports filed with or furnished to the securities
and exchange Commission, such exhibit may be obtained,
upon payment of reasonable expenses, by writing to: Corporate
secretary, usG Corporation, P.o. box 6721, Chicago, illinois
60680-6721.
general officesMailing Address:
P.o. box 6721
Chicago, illinois 60680-6721
Street Address:
550 west adams street
Chicago, illinois 60661-3676
Telephone:
312.436.4000
stock transfer agent and registrarComputershare investor services LLC
877.360.5385
For Regular Mail:
P.o. box 43078
Providence, ri 02940-3078
The Street Address for Overnight Delivery is:
250 royall street, Mail stop 1a
Canton, Ma 02021
The Lockbox Address for
Voluntary Contributions is:
P.o. box 6006
Carol stream, iL 60197-6006
stock ListingsusG Corporation common stock is listed on
the new York and Chicago stock exchanges
and is traded under the symbol usG.
inquiriesInvestment Community:
investor relations
312.436.4125
News Media:
Corporate Communications
312.436.4356
sharehoLder inForMat ion
58366_USG_u2.indd 7 3/17/09 3:49:40 PM

usG Corporation
550 west adams street
Chicago, illinois 60661
X2785/3-09 © 2009, usG Corporation Printed in u.s.a.
Printed on recycled Paper
58366_USG_u2.indd 8 3/17/09 3:49:41 PM

UNITED STATES SECURITIES AND EXCHANGE COMMISSION Washington, D.C. 20549 _________________ FORM 10-K (Mark One) X ANNUAL REPORT PURSUANT TO SECTION 13 OR 15(d) OF THE SECURITIES
EXCHANGE ACT OF 1934 For the fiscal year ended December 31, 2008 OR TRANSITION REPORT PURSUANT TO SECTION 13 OR 15(d) OF THE SECURITIES
EXCHANGE ACT OF 1934 For the transition period from _______________ to _______________
Commission File Number 1-8864
USG CORPORATION (Exact name of Registrant as Specified in its Charter)
Delaware 36-3329400 (State or Other Jurisdiction of (I.R.S. Employer Incorporation or Organization) Identification No.)
550 W. Adams Street, Chicago, Illinois 60661-3676 (Address of Principal Executive Offices) (Zip Code)
Registrant’s Telephone Number, Including Area Code: (312) 436-4000 Securities Registered Pursuant to Section 12(b) of the Act:
Name of Exchange on Title of Each Class Which Registered
New York Stock Exchange
Common Stock, $0.10 par value Chicago Stock Exchange Preferred Stock Purchase Rights (subject to Rights New York Stock Exchange Agreement dated December 21, 2006, as amended) Chicago Stock Exchange
Securities Registered Pursuant to Section 12(g) of the Act: None Indicate by check mark whether the registrant is a well-known seasoned issuer, as defined in Rule 405 of the Securities Act. Yes No Indicate by check mark if the registrant is not required to file reports pursuant to Section 13 or 15(d) of the Exchange Act. Yes No Indicate by check mark whether the registrant (1) has filed all reports required to be filed by Section 13 or 15(d) of the Securities Exchange Act of 1934 during the preceding 12 months (or for such shorter period that the registrant was required to file such reports), and (2) has been subject to such filing requirements for the past 90 days. Yes No Indicate by check mark if disclosure of delinquent filers pursuant to Item 405 of Regulation S-K is not contained herein, and will not be contained, to the best of registrant’s knowledge, in definitive proxy or information statements incorporated by reference in Part III of this Form 10-K or any amendment to this Form 10-K. Indicate by check mark whether the registrant is a large accelerated filer, an accelerated filer, a non-accelerated filer, or a smaller reporting company. See the definitions of “large accelerated filer,” “accelerated filer” and “smaller reporting company” in Rule 12b-2 of the Exchange Act. Large accelerated filer Accelerated filer Non-accelerated filer Smaller reporting company Indicate by check mark whether the registrant is a shell company (as defined in Exchange Act Rule 12b-2). Yes No Indicate by check mark whether the registrant has filed all documents and reports required to be filed by Section 12, 13, or 15(d) of the Securities Exchange Act of 1934 subsequent to the distribution of securities under a plan confirmed by a court. Yes No Not applicable. Although the registrant was involved in bankruptcy proceedings during the preceding five years, it did not distribute securities under its confirmed plan of reorganization. The aggregate market value of the registrant’s common stock held by non-affiliates computed by reference to the New York Stock Exchange closing price on June 30, 2008 (the last business day of the registrant’s most recently completed second fiscal quarter) was approximately $2,912,657,000. The number of shares of the registrant’s common stock outstanding as of January 31, 2009 was 99,178,828. Documents Incorporated By Reference: Certain sections of USG Corporation’s definitive Proxy Statement for use in connection with its 2009 annual meeting of stockholders, to be filed subsequently, are incorporated by reference into Part III of this Form 10-K Report where indicated.

TABLE OF CONTENTS
PART I Page Item 1. Business .............................................................................................................................................. 1 Item 1A. Risk Factors......................................................................................................................................... 6 Item 1B. Unresolved Staff Comments................................................................................................................ 13 Item 2. Properties ............................................................................................................................................ 14 Item 3. Legal Proceedings ............................................................................................................................... 15 Item 4. Submission of Matters to a Vote of Security Holders ......................................................................... 16 PART II Item 5. Market for the Registrant’s Common Equity, Related Stockholder Matters and Issuer Purchases of Equity Securities ......................................................................................................................... 16 Item 6. Selected Financial Data ....................................................................................................................... 18 Item 7. Management’s Discussion and Analysis of Financial Condition and Results of Operations .............. 19 Item 7A. Quantitative and Qualitative Disclosures About Market Risk............................................................. 46 Item 8. Financial Statements and Supplementary Data ................................................................................... 47 Item 9. Changes in and Disagreements With Accountants on Accounting and Financial Disclosure ............. 87 Item 9A. Controls and Procedures...................................................................................................................... 87 Item 9A(T) Controls and Procedures...................................................................................................................... 89 Item 9B. Other Information................................................................................................................................ 89 PART III Item 10. Directors, Executive Officers and Corporate Governance .................................................................. 90 Item 11. Executive Compensation..................................................................................................................... 91 Item 12. Security Ownership of Certain Beneficial Owners and Management and Related Stockholder Matters ........................................................................................................................ 91 Item 13. Certain Relationships and Related Transactions, and Director Independence .................................... 92 Item 14. Principal Accounting Fees and Services ............................................................................................. 92 PART IV Item 15. Exhibits and Financial Statement Schedules ....................................................................................... 93 Signatures ................................................................................................................................................................. 98

1
PART I Item 1. BUSINESS
In this annual report on Form 10-K, “USG,” “we,” “our” and “us” refer to USG Corporation, a Delaware corporation, and its subsidiaries included in the consolidated financial statements, except as otherwise indicated or as the context otherwise requires.
General
USG, through its subsidiaries, is a leading manufacturer and distributor of building materials, producing a wide range of products for use in new residential, new nonresidential, and repair and remodel construction as well as products used in certain industrial processes.
Our businesses are cyclical in nature and sensitive to changes in general economic conditions, including, in particular, conditions in the housing and construction-based markets. The housing market, a major source of demand for our businesses, continued to be very weak in 2008, and is expected to remain very weak throughout 2009. That weakness could extend into 2010, especially if the inventory of unsold homes remains at a historically high level and tight mortgage lending policies continue. The current economic recession is expected to contribute to further declines in residential repair and remodeling expenditures and non-residential construction activity in 2009.
Based on preliminary data issued by the U.S. Bureau of the Census, the rate of new home construction in the United States declined by approximately 33% in 2008 compared with 2007. This followed a 25% decrease in 2007 compared with 2006. The repair and remodel market, which includes renovation of both residential and nonresidential buildings, currently accounts for the largest portion of our sales, ahead of new housing construction. Many buyers begin to remodel an existing home within two years of purchase. According to the National Association of Realtors, sales of existing homes in 2008 declined to an estimated 4.9 million units compared with 5.7 million units in 2007 and 6.5 million units in 2006, which contributed to a decrease in demand for our products from the residential repair and remodel market. Demand for our products from new nonresidential construction is determined by floor space for which contracts are signed. Installation of gypsum and ceilings products typically follows signing of construction contracts by about a year. According to McGraw-Hill Construction, total floor space for which contracts were signed declined 16% in 2008 compared with 2007 after increasing 2% in 2007 compared to 2006.
We have been scaling back our operations in response to market conditions since the downturn began in 2006. Since mid-2006, we have temporarily idled or permanently closed approximately 3.1 billion square feet of our highest cost wallboard manufacturing capacity. In 2008, we closed 54 distribution centers. In the second and fourth quarters of 2008, we implemented salaried workforce reductions that eliminated in total approximately 1,400 salaried positions. We are continuing to adjust our operations for the extended downturn in our markets. Our focus on costs and efficiencies, including capacity closures and overhead reductions, has helped to mitigate the effects of the downturn in all of our markets. If conditions continue to deteriorate in the broader economy, we will evaluate plans to further reduce costs, improve operational efficiency and maintain our liquidity.
The effects of these market conditions on our operations are discussed in this Item 1 and in Part II, Item 7, Management’s Discussion and Analysis of Financial Condition and Results of Operations.
SEGMENTS Our operations are organized into three reportable segments: North American Gypsum, Building Products Distribution and Worldwide Ceilings, the net sales of which accounted for approximately 46%, 38% and 16%, respectively, of our 2008 consolidated net sales.

2
North American Gypsum
BUSINESS North American Gypsum manufactures and markets gypsum and related products in the United States, Canada and Mexico. It includes United States Gypsum Company, or U.S. Gypsum, in the United States, the gypsum business of CGC Inc., or CGC, in Canada, and USG Mexico, S.A. de C.V., or USG Mexico, in Mexico. U.S. Gypsum is the largest manufacturer of gypsum wallboard in the United States and accounted for approximately 29% of total domestic gypsum wallboard sales in 2008. CGC is the largest manufacturer of gypsum wallboard in eastern Canada. USG Mexico is the largest manufacturer of gypsum wallboard in Mexico.
PRODUCTS North American Gypsum’s products are used in a variety of building applications to finish the interior walls, ceilings and floors in residential, commercial and institutional construction and in certain industrial applications. These products provide aesthetic as well as sound-dampening, fire-retarding, abuse-resistance and moisture-control value. The majority of these products are sold under the SHEETROCK® brand name. A line of joint compounds used for finishing wallboard joints is also sold under the SHEETROCK® brand name. The DUROCK® line of cement board and accessories provides water-damage-resistant and fire-resistant assemblies for both interior and exterior construction. The FIBEROCK® line of gypsum fiber panels includes abuse-resistant wall panels and floor underlayment as well as sheathing panels usable as a substrate for most exterior systems. The SECUROCK® line of products includes glass mat sheathing used for building exteriors and gypsum fiber panels used as roof cover board. The LEVELROCK® line of poured gypsum underlayments provides surface leveling and enhanced sound performance for residential and commercial installations. We also produce a variety of construction plaster products used to provide a custom finish for residential and commercial interiors. Like SHEETROCK® brand gypsum wallboard, these products provide aesthetic, sound-dampening, fire-retarding and abuse-resistance value. Construction plaster products are sold under the brand names RED TOP®, IMPERIAL® and DIAMOND®. We also produce gypsum-based products for agricultural and industrial customers to use in a number of applications, including soil conditioning, road repair, fireproofing and ceramics.
MANUFACTURING North American Gypsum manufactures products at 46 plants. North American Gypsum’s plants are located throughout the United States, Canada and Mexico.
Gypsum rock is mined or quarried at 15 company-owned locations in North America. In 2008, these locations provided approximately 67% of the gypsum used by our plants in North America. As of December 31, 2008, our geologists estimated that our recoverable rock reserves are sufficient for more than 26 years of operation based on our average annual production of crude gypsum during the past five years of 9.0 million tons. Proven reserves contain approximately 242 million tons. Additional reserves of approximately 157 million tons are found on four properties not in operation.
Some of our manufacturing plants purchase or acquire synthetic gypsum and natural gypsum rock from outside sources. In 2008, outside purchases or acquisitions of synthetic gypsum and natural gypsum rock accounted for approximately 28% and 5%, respectively, of the gypsum used in our plants.
Synthetic gypsum is a byproduct of flue gas desulphurization carried out by electric generation or industrial plants that burn coal as a fuel. The suppliers of this kind of gypsum are primarily power companies, which are required to operate scrubbing equipment for their coal-fired generating plants under federal environmental regulations. We have entered into a number of long-term supply agreements to acquire synthetic gypsum. We generally take possession of the gypsum at the producer’s facility and transport it to our wallboard plants by ship, river barge, railcar or truck. The supply of synthetic gypsum continues to increase as more power generation plants are fitted with desulphurization equipment. Twelve of our 23 gypsum wallboard plants in operation use synthetic gypsum for some or all of their needs.

3
We own eight paper mills located across the United States. Three of these paper mills have been idled due to the current market environment. Vertical integration in paper helps to ensure a continuous supply of high-quality paper that is tailored to the specific needs of our wallboard production processes. We augment our paper needs through purchases from outside suppliers when necessary. Approximately 1% of our paper supply was purchased from outside suppliers during 2008.
MARKETING AND DISTRIBUTION Our gypsum products are distributed through our wholly owned subsidiary, L&W Supply Corporation, and its subsidiaries, or L&W Supply, other specialty wallboard distributors, building materials dealers, home improvement centers and other retailers, and contractors. Sales of gypsum products are seasonal in the sense that sales are generally greater from spring through the middle of autumn than during the remaining part of the year. Based on our estimates using publicly available data, internal surveys and gypsum wallboard shipment data from the Gypsum Association, we estimate that during 2008:
• Residential and nonresidential repair and remodel activity generated about 48% of volume demand for gypsum wallboard;
• New residential construction generated about 34% of volume demand;
• New nonresidential construction generated about 13% of volume demand; and
• Other activities such as exports and temporary construction generated the remaining 5% of volume demand.
COMPETITION The Gypsum Association estimated that United States industry shipments of gypsum wallboard (including imports) in 2008 were 25.2 billion square feet. U.S. Gypsum shipped 7.2 billion square feet of wallboard in 2008, or approximately 29% of the total industry sales of gypsum wallboard in the United States.
Our competitors in the United States are: National Gypsum Company, CertainTeed Corporation (a subsidiary of Compagnie de Saint-Gobain SA), Georgia-Pacific (a subsidiary of Koch Industries, Inc.), American Gypsum (a unit of Eagle Materials Inc.), Temple-Inland Forest Products Corporation, Lafarge North America, Inc. and PABCO Gypsum. Our competitors in Canada include CertainTeed Corporation, Georgia-Pacific and Lafarge North America, Inc. Our major competitors in Mexico are Panel Rey, S.A. and Comex-Lafarge. The principal methods of competition are quality of products, service, pricing, compatibility of systems and product design features.
Building Products Distribution
BUSINESS Building Products Distribution consists of L&W Supply, the leading specialty building products distribution business in the United States. In 2008, L&W Supply distributed approximately 12% of all gypsum wallboard in the United States, including approximately 36% of U.S. Gypsum’s wallboard production.
MARKETING AND DISTRIBUTION L&W Supply is a service-oriented business that stocks a wide range of construction materials. It delivers less-than-truckload quantities of construction materials to job sites and places them in areas where work is being done, thereby reducing the need for handling by contractors. L&W Supply specializes in the distribution of gypsum wallboard (which accounted for 33% of its 2008 net sales), joint compound and other gypsum products manufactured by U.S. Gypsum and others. It also distributes products manufactured by USG Interiors, Inc., such as acoustical ceiling tile and grid, as well as products of other manufacturers, including drywall metal, insulation, roofing products and accessories. L&W Supply leases approximately 90% of its facilities from third parties. Typical leases have terms of five years and include renewal options.
4
In the current market environment, L&W Supply’s focus is on optimizing its asset utilization. In response to weak market conditions, L&W Supply closed 54 centers in 2008, while opening five new centers and continued to serve its customers from 198 centers in the United States as of December 31, 2008. L&W Supply operated 247 centers in the United States and Mexico as of December 31, 2007 and 220 centers in the United States as of December 31, 2006. L&W Supply also continues to consider opportunities to grow its specialty distribution business taking into account the current market environment.
COMPETITION L&W Supply competes with a number of specialty wallboard distributors, lumber dealers, hardware stores, home improvement centers and acoustical ceiling tile distributors. Its principal competitors include ProBuild Holdings Inc., a national supplier of building materials, Gypsum Management Supply with locations in the southern, central and western United States, KCG, Inc. in the southwestern and central United States, and Allied Building Products Corporation in the northeastern, central and western United States. Principal methods of competition are location, service, range of products and pricing.
Worldwide Ceilings
BUSINESS Worldwide Ceilings manufactures and markets interior systems products worldwide. It includes USG Interiors, Inc., or USG Interiors, the international interior systems business managed as USG International, and the ceilings business of CGC. Worldwide Ceilings is a leading supplier of interior ceilings products used primarily in commercial applications. We estimate that we are the largest manufacturer of ceiling grid and the second-largest manufacturer/marketer of acoustical ceiling tile in the world. Worldwide Ceilings had record net sales in 2008.
PRODUCTS Worldwide Ceilings manufactures ceiling tile in the United States and ceiling grid in the United States, Canada, Europe and the Asia-Pacific region. It markets ceiling tile and ceiling grid in the United States, Canada, Mexico, Europe, Latin America and the Asia-Pacific region. Our integrated line of ceilings products provides qualities such as sound absorption, fire retardation and convenient access to the space above the ceiling for electrical and mechanical systems, air distribution and maintenance. USG Interiors’ significant brand names include the AURATONE® and ACOUSTONE® brands of ceiling tile and the DONN®, DX®, FINELINE®, CENTRICITEE™, CURVATURA™ and COMPASSO™ brands of ceiling grid.
MANUFACTURING Worldwide Ceilings manufactures products at 17 plants located in North America, Europe and the Asia-Pacific region. Principal raw materials used to produce Worldwide Ceilings’ products include mineral fiber, steel, perlite, starch and high-pressure laminates. We produce some of these raw materials and obtain others from outside suppliers.
MARKETING AND DISTRIBUTION Worldwide Ceilings sells products primarily in markets related to the construction and renovation of nonresidential buildings. Ceilings products are marketed and distributed through a network of distributors, installation contractors, L&W Supply locations and home improvement centers.
COMPETITION Our principal competitors in ceiling grid include WAVE (a joint venture between Armstrong World Industries, Inc. and Worthington Industries) and Chicago Metallic Corporation. Our principal competitors in acoustical ceiling tile include Armstrong World Industries, Inc., OWA Faserplattenwerk GmbH (Odenwald), CertainTeed Corporation and AMF Mineralplatten GmbH Betriebs KG (owned by Gebr. Knauf Verwaltungsgellschaft KG). Principal methods of competition are quality of products, service, pricing, compatibility of systems and product design features.

5
Executive Officers of the Registrant
See Part III, Item 10, Directors, Executive Officers and Corporate Governance - Executive Officers of the Registrant (as of February 20, 2009).
Other Information
RESEARCH AND DEVELOPMENT To contribute to our high standards and our leadership in the building materials industry, we perform extensive research and development at the USG Research and Technology Innovation Center in Libertyville, Ill. Research team members provide product support and new product development for our operating units. With unique fire, acoustical, structural and environmental testing capabilities, the research center can evaluate products and systems. Chemical analysis and materials characterization support product development and safety/quality assessment programs. Development activities can be taken to an on-site pilot plant before being transferred to a full-size plant. We also conduct research at a satellite location where industrial designers and fabricators work on new ceiling grid concepts and prototypes. Research and development activities were scaled back in 2008 due to the current market environment. We charge research and development expenditures to earnings as incurred. These expenditures amounted to $19 million in 2008, $23 million in 2007 and $20 million in 2006.
ENERGY Our primary supplies of energy have been adequate, and we have not been required to curtail operations as a result of insufficient supplies. Supplies are likely to remain sufficient for our projected requirements. Currently, we use energy price swap agreements to hedge the cost of a majority of purchased natural gas. Generally, we have a majority of our anticipated purchases of natural gas over the next 12 months hedged; however, we review our positions regularly and make adjustments as market conditions warrant.
SIGNIFICANT CUSTOMER On a worldwide basis, The Home Depot, Inc. accounted for approximately 10% of our consolidated net sales in 2008 and approximately 11% in each of 2007 and 2006.
OTHER Because we fill orders upon receipt, no segment has any significant order backlog.
None of our segments has any special working capital requirements.
Loss of one or more of our patents or licenses would not have a material impact on our business or our ability to continue operations.
No material part of our business is subject to renegotiation of profits or termination of contracts or subcontracts at the election of any government.
As of December 31, 2008, we had approximately 12,800 employees worldwide.
See Note 17 to the Consolidated Financial Statements for financial information pertaining to our segments and Item 1A, Risk Factors, for information regarding the possible effects that compliance with environmental laws and regulations may have on our businesses and operating results.
Available Information
We maintain a Web site at www.usg.com and make available at this Web site our annual report on Form 10-K, quarterly reports on Form 10-Q, current reports on Form 8-K and all amendments to those reports as soon as reasonably practicable after they are electronically filed with or furnished to the Securities and Exchange
6
Commission, or SEC. If you wish to receive a paper copy of any exhibit to our reports filed with or furnished to the SEC, the exhibit may be obtained, upon payment of reasonable expenses, by writing to: Corporate Secretary, USG Corporation, 550 West Adams Street, Chicago, Illinois 60661.
Item 1A. RISK FACTORS
Our business, operations and financial condition are subject to various risks and uncertainties. We have described below significant factors that may adversely affect our business, operations, financial performance and condition or industry. You should carefully consider these factors, together with all of the other information in this annual report on Form 10-K and in other documents that we file with the SEC, before making any investment decision about our securities. Adverse developments or changes related to any of the factors listed below could affect our business, financial condition, results of operations and growth.
Our businesses have been adversely affected by current economic conditions, including the worldwide financial crisis and restrictive lending practices, and are cyclical in nature. Prolonged periods of weak demand or excess supply may have a material adverse effect on our business, financial condition and operating results.
The markets that we serve, including in particular the housing and construction-based markets, are affected by the availability of credit, lending practices, the movement of interest rates, the unemployment rate and consumer confidence. Higher interest and unemployment rates and more restrictive lending practices could have a material adverse effect on our businesses, financial condition and results of operations. Our businesses are also affected by a variety of other factors beyond our control, including the inventory of unsold homes, which currently remains at a record level, housing affordability, office vacancy rates and foreign currency exchange rates.
Our businesses are cyclical in nature and sensitive to changes in general economic conditions, including, in particular, conditions in the North American housing and construction-based markets. Based on preliminary data issued by the U.S. Bureau of the Census, the rate of new home construction in the United States declined by approximately 33% in 2008 compared with 2007. This followed a 25% decrease in 2007 compared with 2006. Industry analysts’ forecasts for new home construction in the United States in 2009 are for a further decline of approximately 20% to 45% from the 2008 level.
The repair and remodel market, which includes renovation of both residential and nonresidential buildings, currently accounts for the largest portion of our sales, ahead of new housing construction. Many buyers begin to remodel an existing home within two years of purchase. According to the National Association of Realtors, sales of existing homes in the United States in 2008 declined to an estimated 4.9 million units compared with 5.7 million units in 2007 and 6.5 million units in 2006, which contributed to a decrease in demand for our products from the residential repair and remodel market. Industry analysts’ forecasts for residential repair and remodel activity in the United States in 2009 are for a further decline of approximately 5% to 10% from the 2008 level.
Demand for our products from new nonresidential construction is determined by floor space for which contracts are signed. Installation of gypsum and ceilings products typically follows signing of construction contracts by about a year. According to McGraw-Hill Construction, total floor space for which contracts were signed in the United States declined 16% in 2008 compared with 2007 after increasing 2% in 2007 compared to 2006. Industry analysts’ forecasts for commercial construction in the United States in 2009 are for a further decline of approximately 15% to 20% from the 2008 level.
Prices for our products and services are affected by overall supply and demand in the markets for our products and for our competitors’ products. Market prices of building products historically have been volatile and cyclical. Currently, there is significant excess wallboard production capacity industry-wide in the United States. Industry capacity in the United States was approximately 40 billion square feet in 2008. Industry shipments of wallboard in the United States (including imports) were an estimated 25.2 billion square feet in 2008, and we expect demand to decrease in 2009. We and other industry participants announced a number of closures near the end of 2008 that we

7
expect will reduce industry capacity in the United States by approximately 3 billion square feet in 2009. We do not expect any new industry capacity will be added in 2009. Prolonged continuation of weak demand or excess supply in any of our businesses may have a material adverse effect on our business, revenues, margins, financial condition and operating results.
We cannot predict the duration of the current market conditions, or the timing or strength of any future recovery of the North American housing and construction-based markets. We also cannot provide any assurances that those markets will not weaken further, or that the operational adjustments we have implemented to address the current market conditions will be successful. Continued weakness in these markets and the homebuilding industry may have a material adverse effect on our business, financial condition and operating results.
Since our operations occur in a variety of geographic markets, our businesses are subject to the economic conditions in each of these geographic markets. General economic downturns or localized downturns in the regions where we have operations may have a material adverse effect on our business, financial condition and operating results.
Our customers and suppliers are exposed to risks associated with the current worldwide downturn and financial crisis which could adversely affect their ability to pay our invoices or continue to operate their businesses.
The businesses of many of our customers and suppliers are exposed to risks related to the current economic environment. A number of our customers and suppliers have been and may continue to be adversely affected by the worldwide financial crisis, disruptions to the capital and credit markets and decreased demand for their products and services. In the event that any of our large customers or suppliers, or a significant number of smaller customers and suppliers, are adversely affected by these risks, we may face disruptions in supply, further reductions in demand for our products and services, failure of customers to pay invoices when due and other adverse effects that may have a material adverse effect on our business, financial condition and operating results.
Our substantial indebtedness may adversely affect our business, financial condition and operating results.
Our substantial indebtedness may have material adverse effects on our business, including to:
• make it more difficult for us to satisfy our debt service obligations;
• limit our ability to obtain additional financing to fund our working capital requirements, capital expenditures, acquisitions, investments, debt service obligations and other general corporate requirements;
• require us to dedicate a substantial portion of our cash flows from operations to payments on our indebtedness, thereby reducing the availability of our cash flows to fund working capital, capital expenditures and other general operating requirements;
• restrict us from making strategic acquisitions or taking advantage of favorable business opportunities;
• place us at a relative competitive disadvantage compared to our competitors that have proportionately less debt;
• limit our flexibility to plan for, or react to, changes in our business and the industries in which we operate, which may adversely affect our operating results and ability to meet our debt service obligations with respect to our outstanding indebtedness;
• increase our vulnerability to the current and potentially more severe adverse general economic and industry conditions; and
• limit our ability, or increase the cost, to refinance indebtedness.

8
If we incur additional indebtedness, the risks related to our substantial indebtedness may intensify.
We require a significant amount of liquidity to service our indebtedness and fund operations, capital expenditures, research and development efforts, acquisitions and other corporate expenses.
Our ability to fund operations, capital expenditures, research and development efforts, acquisitions and other corporate expenses, including repayment of our indebtedness, depends on our ability to generate cash through future operating performance, which is subject to economic, financial, competitive, legislative, regulatory and other factors. Many of these factors are beyond our control. We cannot assure that our business will generate sufficient cash flow from operations or that future borrowings will be available to us in an amount sufficient to fund our needs.
We are required to post letters of credit or cash as collateral primarily in connection with our hedging transactions, insurance programs and bonding activities. The amounts of collateral we are required to post may vary based on our financial position and credit ratings. Use of letters of credit as collateral reduces our borrowing availability under our revolving credit agreement and, therefore, like the use of cash as collateral, reduces our overall liquidity and our ability to fund other business activities.
If we are unable to generate sufficient cash flow to fund our needs, we may need to pursue one or more alternatives, such as to:
• curtail operations further;
• reduce or delay planned capital expenditures, research and development or acquisitions;
• seek additional financing or restructure or refinance all or a portion of our indebtedness at or before maturity;
• sell assets or businesses; and
• sell additional equity.
Any curtailment of operations, reduction or delay in planned capital expenditures, research and development or acquisitions or sale of assets or businesses may materially and adversely affect our future revenue prospects. In addition, we cannot assure that we will be able to raise additional equity capital, restructure or refinance any of our indebtedness or obtain additional financing on commercially reasonable terms or at all.
Covenant restrictions under the agreements governing our indebtedness may limit our ability to pursue business activities or otherwise operate our business.
The agreements governing our indebtedness contain covenants that may limit our ability to finance future operations or capital needs or to engage in other business activities, including, among other things, our ability to:
• incur additional indebtedness;
• make guarantees;
• sell assets or make other fundamental changes;
• engage in mergers and acquisitions;
• make investments;
• enter into transactions with our affiliates;

9
• change our business purposes; and
• enter into sale and lease-back transactions.
In addition, we are subject to agreements that may require us to meet and maintain certain financial ratios and tests, which may require that we take action to reduce our debt or to act in a manner contrary to our current business objectives. General business and economic conditions may affect our ability to comply with these covenants or meet those financial ratios and tests.
A breach of any of our credit agreement or indenture covenants or failure to maintain a required ratio or meet a required test may result in an event of default under those agreements. This may allow the counterparties to those agreements to declare all amounts outstanding thereunder, together with accrued interest, to be immediately due and payable. If this occurs, we may not be able to refinance the accelerated indebtedness on favorable terms, or at all, or repay the accelerated indebtedness.
The loss of sales to one or more of our major customers may have a material adverse effect on our business, financial condition and operating results.
We face strong competition for our major customers. If one or more of our major customers reduces, delays or cancels substantial orders, our business, financial condition and operating results may be materially and adversely affected, particularly for the quarter in which the reduction, delay or cancellation occurs.
We face competition in each of our businesses. If we cannot successfully compete in the marketplace, our business, financial condition and operating results may be materially and adversely affected.
We face competition in each of our businesses. Principal methods of competition include quality and range of products, service, location, pricing, compatibility of systems and product design features. Actions of our competitors, or the entry of new competitors in our markets, could lead to lower pricing by us in an effort to maintain market share and could also lead to lower sales volumes. To achieve and/or maintain leadership positions in key product categories, we must continue to develop brand recognition and loyalty, enhance product quality and performance and develop our manufacturing and distribution capabilities.
We also compete through our use and improvement of information technology. In order to remain competitive, we need to provide customers with timely, accurate, easy-to-access information about product availability, orders and delivery status using state-of-the-art systems. While we have provided manual processes for short-term failures and disaster recovery capability, a prolonged disruption of systems or other failure to meet customers’ expectations regarding the capabilities and reliability of our systems may materially and adversely affect our operating results particularly during any prolonged period of disruption.
We intend to continue making investments in research and development to develop new and improved products and more efficient production methods in order to maintain our market leadership position. If we do not make these investments, or our investments are not successful, our revenues, operating results and market share could be adversely affected. In addition, there can be no assurance that revenue from new products or enhancements will be sufficient to recover the research and development expenses associated with their development.
If costs of key raw materials, energy, fuel or employee benefits increase, or the availability of key raw materials and energy decreases, our cost of products sold will increase, and our operating results may be materially and adversely affected.
The cost and availability of raw materials and energy are critical to our operations. For example, we use substantial quantities of gypsum, wastepaper, mineral fiber, steel, perlite, starch and high-pressure laminates. The cost of certain of these items has been volatile, and availability has sometimes been limited. We obtain some of these materials from

10
a limited number of suppliers, which increases the risk of unavailability. As a result of recent market conditions, our ability to pass increased raw materials prices on to our customers has been limited. We may not be able to pass increased raw materials prices on to our customers in the future if the market or existing agreements with our customers do not allow us to raise the prices of our finished products. If price adjustments for our finished products significantly trail the increase in raw materials prices or if we cannot effectively hedge against price increases, our operating results may be materially and adversely affected.
Wastepaper prices are affected by market conditions, principally supply. We buy various grades of wastepaper, and shortages occur periodically in one or more grades and may vary among geographic regions. As a result, we have experienced, and expect in the future to experience, volatility in wastepaper availability and its cost, affecting the mix of products manufactured at particular locations or the cost of producing them.
Approximately one quarter of the gypsum used in our plants is synthetic gypsum, which is a byproduct resulting primarily from flue gas desulphurization carried out by electric generation or industrial plants burning coal as a fuel. The suppliers of synthetic gypsum are primarily power companies, which are required under federal environmental regulations to operate scrubbing equipment for their coal-fired generating plants. Environmental regulatory changes or changes in methods used to comply with environmental regulations could adversely affect the price and availability of synthetic gypsum.
Energy costs also are affected by various market factors, including the availability of supplies of particular forms of energy, energy prices and local and national regulatory decisions. Prices for natural gas and electrical power, which are significant components of the costs associated with our gypsum and interior systems products, have both become more volatile in recent years. There may be substantial increases in the price, or a decline in the availability, of energy in the future, especially in light of instability or possible dislocations in some energy markets. In addition, significant increases in the cost of fuel can result in material increases in the cost of transportation, which could materially and adversely affect our operating profits. As is the case with raw materials, we may not be able to pass on increased costs through increases in the prices of our products.
In addition, our profit margins are affected by costs related to maintaining our employee benefit plans (pension and medical insurance for active employees and retirees). The recognition of costs and liabilities associated with these plans for financial reporting purposes is affected by assumptions made by management and used by actuaries engaged by us to calculate the projected and accumulated benefit obligations and the annual expense recognized for these plans. The assumptions used in developing the required estimates primarily include discount rates, expected return on plan assets for the funded plans, compensation increase rates, retirement rates, mortality rates and, for postretirement benefits, health-care-cost trend rates. Economic and market factors and conditions could affect any of these assumptions and may affect our estimated and actual employee benefit plan costs and our business, financial condition and operating results.
If the market price of natural gas declines, it may have a material adverse effect on our business, financial condition and operating results as a result of our hedging transactions and fixed-price supply agreements for natural gas.
We use natural gas extensively in the production of gypsum and interior systems products. As a result, our revenues, profitability, operating cash flows and future rate of growth are highly dependent on the price of natural gas, which historically has been very volatile and is affected by numerous factors beyond our control. We are not always able to pass on increases in energy costs to our customers through increases in product prices. In an attempt to reduce our price risk related to fluctuations in natural gas prices, we periodically enter into hedging transactions and fixed-price supply agreements. Although we benefit from those agreements when spot prices exceed contractually specified prices, if the market price for natural gas declines, we may not be able to take advantage of decreasing market prices while our competitors may be able to do so. Any substantial or extended decline in prices of, or demand for, natural gas could cause our production costs to be greater than that of our competitors. As a result, a decline in prices may have a material adverse effect on our business, financial condition and operating results.
11
In addition, the results of our hedging transactions could be positive, neutral or negative in any period depending on price changes in the hedged exposures. Further, changes to the price of natural gas could result in changes to the value of our hedging contracts, which could impact our results of operations for a particular period. Our hedging activities are not designed to mitigate long-term natural gas price fluctuations and, therefore, will not protect us from long-term natural gas price increases.
Certain of our customers have been expanding and may continue to expand through consolidation and internal growth, thereby possibly developing increased buying power over us, which may materially and adversely affect our revenues and results of operations.
Certain of our important customers are large companies with significant buying power over suppliers. In addition, potential further consolidation in the distribution channels could enhance the ability of certain of our customers to seek more favorable terms, including pricing, for the products that they purchase from us. Accordingly, our ability to maintain or raise prices in the future may be limited, including during periods of raw material and other cost increases. If we are forced to reduce prices or to maintain prices during periods of increased costs, or if we lose customers because of pricing or other methods of competition, our revenues and operating results may be materially and adversely affected.
We are subject to environmental and safety regulations that may change and could cause us to make modifications to how we manufacture and price our products.
We are subject to federal, state, local and foreign laws and regulations governing the protection of the environment and occupational health and safety, including laws regulating air emissions, wastewater discharges, the management and disposal of hazardous materials and wastes, and the health and safety of our employees. We are also required to obtain permits from governmental authorities for certain operations. If we were to fail to comply with these laws, regulations or permits, we could incur fines, penalties or other sanctions. In addition, we could be held responsible for costs and damages arising from any contamination at our past or present facilities or at third-party waste disposal sites. We cannot completely eliminate the risk of contamination or injury resulting from hazardous materials.
Environmental laws tend to become more stringent over time, and we could incur material expenses relating to compliance with future environmental laws. In addition, the price and availability of certain of the raw materials that we use, including synthetic gypsum, may vary in the future as a result of environmental laws and regulations affecting our suppliers. An increase in the price of our raw materials, a decline in their availability or future costs relating to our compliance with environmental laws may materially and adversely affect our operating margins or result in reduced demand for our products.
The U.S. Congress and several states are considering proposed legislation to reduce emission of “greenhouse gases,” including carbon dioxide and methane. Some states have already adopted greenhouse gas regulation or legislation. Enactment of climate control legislation or other regulatory initiatives by Congress or various states, or the adoption of regulations by the U.S. Environmental Protection Agency and analogous state or foreign governmental agencies that restrict emissions of greenhouse gases in areas in which we conduct business, could have an adverse effect on our operations and demand for our services or products. Our manufacturing processes, particularly the manufacturing process for wallboard, use a significant amount of energy, especially natural gas. Increased regulation of energy use to address the possible emission of greenhouse gases and climate change could materially increase our manufacturing costs. Energy could also become more expensive, and we may not be able to pass these increased costs on to purchasers of our products. In addition, stricter regulation of emissions might require us to install emissions control equipment at some or all of our manufacturing facilities, requiring significant additional capital investments.
If the downturn in the markets for our businesses does not reverse or is significantly extended, we may incur material impairment charges.

12
We have been scaling back our operations in response to market conditions since the downturn began in 2006. Since mid-2006, we have temporarily idled or permanently closed approximately 3.1 billion square feet of our highest-cost wallboard manufacturing capacity.
Historically, the housing and other construction markets that we serve have been deeply cyclical. Downturns in demand are typically steep and last several years, but they have typically been followed by periods of strong recovery. If this cycle is similar to past cycles in that regard, we believe we will generate significant cash flows when our markets recover. As a result, we currently expect to realize the carrying value of all facilities that are not permanently closed through future cash flows. We regularly monitor forecasts prepared by external economic forecasters and review our facilities and other assets to determine which of them, if any, are impaired under applicable accounting rules.
However, if the downturn in these markets does not reverse or the downturn is significantly extended, material write-downs or impairment charges may be required in the future. If these conditions materialize or worsen, or if there is a fundamental change in the housing market, which individually or collectively lead to a significantly extended downturn or permanent decrease in demand, material impairment charges may be necessary if we permanently close gypsum wallboard production facilities. The magnitude and timing of those charges would be dependent on the severity and duration of the downturn and cannot be determined at this time. Any material cash or noncash impairment charges related to property, plant and equipment would have a material adverse effect on our financial condition and operating results.
A small number of our stockholders could be able to significantly influence our business and affairs.
Based on filings made with the SEC and other information available to us, as of January 31, 2009, we believe that six organizations collectively controlled over 50% of our common stock. Also, all of our 10% contingent convertible senior notes are currently held by two of our largest stockholders. At the current conversion price of $11.40 per share, the notes are convertible into approximately 35.1 million shares of our common stock, or approximately 25% of the shares that would be outstanding if all of the notes were converted at that price. Accordingly, a small number of our stockholders could affect matters requiring approval by stockholders, including the election of directors and the approval of potential business combination transactions.
The seasonal nature of our businesses may materially and adversely affect the trading prices of our securities.
A majority of our businesses are seasonal, with peak sales typically occurring from spring through the middle of autumn. Quarterly results have varied significantly in the past and are likely to vary significantly from quarter to quarter in the future. Those variations may materially and adversely affect our financial performance and the trading prices of our securities.
We may pursue acquisitions, joint ventures and other transactions that complement or expand our businesses. We may not be able to complete proposed transactions, and even if completed, the transactions may involve a number of risks that may result in a material adverse effect on our business, financial condition and operating results.
During the past several years, we have completed a number of acquisitions and joint venture arrangements. As business conditions warrant and our financial resources permit, we may pursue opportunities to acquire businesses or technologies and to form joint ventures that could complement, enhance or expand our current businesses or product lines or that might otherwise offer us growth opportunities. We may have difficulty identifying appropriate opportunities or, if we do identify opportunities, we may not be successful in completing transactions for a number of reasons. Any transactions that we are able to identify and complete may involve one or more of a number of risks, including:
• the diversion of management’s attention from our existing businesses to integrate the operations and personnel of

13
the acquired or combined business or joint venture;
• possible adverse effects on our operating results during the integration process;
• failure of the acquired business or joint venture to achieve expected operational, profitability and investment return objectives; and
• inability to achieve other intended objectives of the transaction.
In addition, we may not be able to successfully or profitably integrate, operate, maintain and manage our newly acquired operations or their employees. We may not be able to maintain uniform standards, controls, procedures and policies, which may lead to operational inefficiencies. In addition, future acquisitions may result in dilutive issuances of equity securities or the incurrence of additional indebtedness.
We depend on our senior management team for their expertise and leadership, and the unexpected loss of any member could adversely affect our operations.
Our success depends on the management and leadership skills of our senior management team. The unexpected loss of any of these individuals or an inability to attract and retain additional personnel could impede or prevent the implementation of our business strategy. Although we have incentives for management to stay with us, we cannot assure that we will be able to retain all of our existing senior management personnel or attract additional qualified personnel when needed.
We do not expect to pay cash dividends on our common stock for the foreseeable future.
We have not paid a dividend on our common stock since the first quarter of 2001 and have no plans to do so in the foreseeable future. Further, our credit agreement limits our ability to pay a dividend or repurchase our stock unless specified borrowing availability and fixed charge coverage ratio tests are met, and it prohibits payment of a dividend if a default exists under the agreement. Because we do not expect to pay dividends on our common stock in the foreseeable future, investors will have to rely on stock appreciation for a return on their investment.
Item 1B. UNRESOLVED STAFF COMMENTS
None

14
Item 2. PROPERTIES
We operate plants, mines, quarries, transport ships and other facilities in North America, Europe and the Asia-Pacific region. In 2008, U.S. Gypsum’s SHEETROCK® brand gypsum wallboard plants operated at 65% of capacity. However, the capacity utilization rate for our gypsum wallboard plants declined as the year progressed and was approximately 51% during the fourth quarter of 2008. USG Interiors’ AURATONE® brand ceiling tile plants operated at 64% of capacity in 2008. However, the capacity utilization rate for these ceiling tile plants also declined as the year progressed and was approximately 55% during the fourth quarter of 2008. The locations of our production properties in operation as of December 31, 2008, grouped by reportable segment, are as follows (plants are owned unless otherwise indicated):
North American Gypsum
GYPSUM WALLBOARD AND OTHER GYPSUM PRODUCTS Aliquippa, Pa.* Plaster City, Calif. Sweetwater, Texas Baltimore, Md.* Rainier, Ore. Washingtonville, Pa.* Bridgeport, Ala.* Shoals, Ind.* Hagersville, Ontario, Canada* East Chicago, Ind.* Sigurd, Utah Montreal, Quebec, Canada * Empire, Nev. Southard, Okla. Monterrey, Nuevo Leon, Mexico Galena Park, Texas* Sperry, Iowa* Puebla, Puebla, Mexico Jacksonville, Fla.* Stony Point, N.Y. Tecoman, Colima, Mexico Norfolk, Va.* * Plants supplied fully or partially by synthetic gypsum JOINT COMPOUND (SURFACE PREPARATION AND JOINT TREATMENT PRODUCTS) Auburn, Wash. Galena Park, Texas Calgary, Alberta, Canada (leased) Baltimore, Md. Gypsum, Ohio Hagersville, Ontario, Canada Bridgeport, Ala. Jacksonville, Fla. Montreal, Quebec, Canada Chamblee, Ga. Phoenix (Glendale), Ariz. (leased) Surrey, British Columbia, Canada Dallas, Texas Port Reading, N.J. Monterrey, Nuevo Leon, Mexico East Chicago, Ind. Sigurd, Utah Puebla, Puebla, Mexico Fort Dodge, Iowa Torrance, Calif. CEMENT BOARD Baltimore, Md. New Orleans, La. Monterrey, Nuevo Leon, Mexico Detroit (River Rouge), Mich. GYPSUM ROCK (MINES AND QUARRIES) Alabaster (Tawas City), Mich. Sigurd, Utah Little Narrows, Nova Scotia, Canada Empire, Nev. Southard, Okla. Windsor, Nova Scotia, Canada Fort Dodge, Iowa Sperry, Iowa Monterrey, Nuevo Leon, Mexico Plaster City, Calif. Sweetwater, Texas San Luis Potosi, San Luis Potosi, Mexico Shoals, Ind. Hagersville, Ontario, Canada Tecoman, Colima, Mexico PAPER FOR GYPSUM WALLBOARD Clark, N.J. North Kansas City, Mo. Otsego, Mich. Galena Park, Texas Oakfield, N.Y. OTHER PRODUCTS We operate a mica-processing plant at Spruce Pine, N.C. We manufacture metal lath, plaster and drywall accessories and light gauge steel framing products at Monterrey, Nuevo Leon, Mexico and Puebla, Puebla, Mexico. We produce

15
plaster products at Puebla, Puebla, Mexico, Saltillo, Coahuila, Mexico, and San Luis Potosi, San Luis Potosi, Mexico. We manufacture gypsum fiber panel products at Gypsum, Ohio, paper-faced metal corner bead at Auburn, Wash., and Weirton, W.Va., and sealants and finishes at La Mirada, Calif.
FACILITY SHUTDOWNS During 2008, we permanently closed our gypsum wallboard and plaster production facilities in Boston, Mass., and one of our gypsum wallboard production facilities in Stony Point, N.Y. We temporarily idled a gypsum wallboard production facility at each of our Plaster City, Calif., Jacksonville, Fla., Baltimore, Md., and Ft. Dodge, Iowa, plants. In addition, we temporarily idled our paper mills in South Gate, Calif., and Gypsum, Ohio, a cement board production facility in Santa Fe Springs, Calif., and a structural cement panel production facility in Delavan, Wis. During 2007, we temporarily idled a gypsum wallboard line at each of our Jacksonville, Fla., Detroit, Mich., and New Orleans, La., plants and a paper mill in Jacksonville, Fla.
NEW FACILITIES In the fourth quarter of 2008, we began operating a new low-cost gypsum wallboard plant in Washingtonville, Pa., that is serving the Northeastern market, including customers of the Boston gypsum wallboard production facility that we closed in the first quarter of 2008. In the second quarter of 2008, we began operating a new high-quality, low-cost paper mill in Otsego, Mich., that will serve U.S. Gypsum’s wallboard plants. Because of the current market environment, commencement of construction of a new, low-cost gypsum wallboard plant in Stockton, Calif., has been delayed until 2012, with production targeted to begin in 2014.
OCEAN VESSELS Gypsum Transportation Limited, our wholly owned subsidiary headquartered in Bermuda, owns and operates two self-unloading ocean vessels. Under a contract of affreightment, these vessels transport gypsum rock from Nova Scotia to our East Coast plants. We offer excess ship time, when available, for charter on the open market to back haul cargo such as coal. We expect to take delivery of our new 40,000-ton self-unloading ship, which is expected to lower the delivered cost of gypsum rock to East Coast wallboard plants, by March 31, 2009.
Worldwide Ceilings CEILING GRID Cartersville, Ga. Dreux, France Shenzhen, China (leased) Stockton, Calif. Oakville, Ontario, Canada St. Petersburg, Russia (leased) Westlake, Ohio Peterlee, England (leased) Viersen, Germany Auckland, New Zealand (leased) A coil coater and slitter plant used in the production of ceiling grid is located in Westlake, Ohio. Slitter plants are located in Stockton, Calif. (leased), and Antwerp, Belgium (leased). CEILING TILE Cloquet, Minn. Greenville, Miss. Walworth, Wis. OTHER PRODUCTS We manufacture mineral fiber products at Red Wing, Minn., and Walworth, Wis., metal specialty systems at Oakville, Ontario, Canada, joint compound at Dreux, France, Peterlee, England (leased), St. Petersburg, Russia (leased), Thessaloniki, Greece, Viersen, Germany, and Port Klang, Malaysia (leased) and gypsum wallboard and joint compound at Lima, Peru.
Item 3. LEGAL PROCEEDINGS
See Part II, Item 8, Financial Statements and Supplementary Data - Notes to Consolidated Financial Statements, Note 21, Litigation, for information on legal proceedings, which information is incorporated herein by reference.

16
Item 4. SUBMISSION OF MATTERS TO A VOTE OF SECURITY HOLDERS
None
PART II
Item 5. MARKET FOR THE REGISTRANT’S COMMON EQUITY, RELATED STOCKHOLDER MATTERS AND ISSUER PURCHASES OF EQUITY SECURITIES
Our common stock trades on the New York Stock Exchange, or NYSE, and the Chicago Stock Exchange under the symbol USG. The NYSE is the principal market for our common stock. As of January 31, 2009, there were 3,235 record holders of our common stock. We currently do not pay dividends on our common stock. Our credit agreement restricts our ability to pay cash dividends on, or repurchase, our common stock. See Part II, Item 8, Financial Statements and Supplementary Data, Note 10, Debt, for more information regarding these restrictions.
See Part III, Item 12, Security Ownership of Certain Beneficial Owners and Management and Related Stockholder Matters, for information regarding common stock authorized for issuance under equity compensation plans.
We did not purchase any of our equity securities during the fourth quarter of 2008.
The high and low sales prices of our common stock in 2008 and 2007 were as follows:
2008 2007 High Low High Low
First quarter $38.38 $29.71 $58.74 $46.22 Second quarter 40.25 29.48 52.75 45.43 Third quarter 35.00 23.12 50.13 35.42 Fourth quarter 26.39 5.50 40.54 34.69
Pursuant to our Stock Compensation Program for Non-Employee Directors, on December 31, 2008, our non-employee directors were entitled to receive an $80,000 annual grant, payable at their election in cash or common stock with an equivalent value. Pursuant to this program, on December 31, 2008, a total of 21,918 shares of common stock were issued to two non-employee directors based on the average of the high and low sales prices of a share of USG common stock on December 30, 2008. The issuance of these shares was effected through a private placement under Section 4(2) of the Securities Act of 1933, as amended, or the Securities Act, and was exempt from registration under Section 5 of the Securities Act.
Pursuant to our Deferred Compensation Program for Non-Employee Directors, four of our non-employee directors deferred their $80,000 annual grant, and three of our non-employee directors deferred their quarterly retainers for service as directors that were payable on December 31, 2008, into a total of approximately 49,579 deferred stock units. These units will increase or decrease in value in direct proportion to the market value of our common stock and will be paid in cash or shares of common stock, at each director’s option, following termination of service as a director. The issuance of these deferred stock units was effected through a private placement under Section 4(2) of the Securities Act and was exempt from registration under Section 5 of the Securities Act.

17
PERFORMANCE GRAPH
The following graph and table compare the cumulative total stockholder return on our common stock with the Standard and Poor’s 500 Index, or S&P 500, and the Dow Jones U.S. Construction and Materials Index, or DJUSCN, in each case assuming an initial investment of $100 and full dividend reinvestment, for the five-year period ended December 31, 2008.
0
50
100
150
200
250
300
350
400
'03 '04 '05 '06 '07 '08
USG Corporation
S&P 500
DJUSCN
Dec. 31, 2003 Dec. 31, 2004 Dec. 31, 2005 Dec. 31, 2006 Dec. 31, 2007 Dec. 31, 2008 USG $100 $243 $392 $331 $253 $57 S&P 500 $100 $111 $116 $135 $142 $90 DJUSCN $100 $132 $147 $172 $212 $122
All amounts rounded to the nearest dollar.

18
Item 6. SELECTED FINANCIAL DATA USG CORPORATION FIVE-YEAR SUMMARY (dollars in millions, except per-share data) Years Ended December 31,
2008 2007(a) 2006(a) 2005(a) 2004(a)
Statement of Operations Data: Net sales $4,608 $5,202 $5,810 $5,139 $4,509 Cost of products sold 4,416 4,601 4,426 4,030 3,643 Gross profit 192 601 1,384 1,109 866 Selling and administrative expenses 380 408 419 352 317 Restructuring and long-lived asset impairment charges 98 26 - - - Goodwill and other intangible asset impairment charges (b) 226 - - - - Asbestos claims provision (reversal) - - (44) 3,100 - Chapter 11 reorganization expenses - - 10 4 12 Operating profit (loss) (512) 167 999 (2,347) 537 Interest expense (c) 86 105 555 5 5 Interest income (7) (22) (43) (10) (6) Other income, net (10) (4) (3) - - Income taxes (benefit) (118) 11 193 (921) 208 Earnings (loss) before cumulative effect of accounting change (463) 77 297 (1,421) 330 Cumulative effect of accounting change - - - (11) - Net earnings (loss) (463) 77 297 (1,432) 330 Net Earnings (Loss) Per Common Share (d):
Cumulative effect of accounting change - - - (0.20) - Basic (4.67) 0.80 4.47 (25.42) 5.93 Diluted (4.67) 0.79 4.46 (25.42) 5.93
Balance Sheet Data (as of the end of the year): Working capital $ 738 $ 717 $ 975 $1,602 $1,239 Current ratio 1.98 2.26 1.55 3.60 3.17 Cash and cash equivalents 471 297 565 936 756 Property, plant and equipment, net 2,562 2,596 2,210 1,946 1,853 Total assets 4,719 4,654 5,397 6,180 4,297 Long-term debt (e) 1,642 1,238 1,439 - 1 Liabilities subject to compromise (e) - - - 5,340 2,242 Total stockholders’ equity (deficit) 1,550 2,226 1,566 (279) 1,043
Other Information: Capital expenditures $ 238 $ 460 $ 393 $ 198 $ 138 Stock price per common share (f) 8.04 35.79 54.80 65.00 40.27 Average number of employees (g) 13,600 14,650 14,700 14,100 13,800
(a) Financial information for 2004 through 2007 has been retrospectively adjusted for our change in 2008 from the last-in, first-out method of inventory accounting to the average cost method. These adjustments reduced cost of products sold by $2 million in 2007, $14 million in 2006, $7 million in 2005 and $29 million in 2004. See Note 1 to the Consolidated Financial Statements.
(b) See Note 3 to the Consolidated Financial Statements for information regarding goodwill and other intangible asset impairment charges. (c) Interest expense for 2006 included post-petition interest and fees of $528 million related to pre-petition obligations in connection with
USG’s five-year reorganization proceeding. See Note 22 to the Consolidated Financial Statements. (d) Net earnings (loss) per common share for 2005 and 2004 were adjusted to reflect the effect of a rights offering implemented in 2006. See
Note 19 to the Consolidated Financial Statements. (e) For 2004 and 2005, debt of $1.005 billion was included in liabilities subject to compromise in connection with USG’s five-year
reorganization proceeding. See Note 22 to the Consolidated Financial Statements. (f) Stock price per common share reflects the final closing price of the year. (g) As a result of workforce reductions, we had approximately 12,800 employees worldwide as of December 31, 2008.

19
Item 7. MANAGEMENT’S DISCUSSION AND ANALYSIS OF FINANCIAL CONDITION AND RESULTS OF OPERATIONS
Overview
SEGMENTS Through our subsidiaries, we are a leading manufacturer and distributor of building materials, producing a wide range of products for use in new residential, new nonresidential, and repair and remodel construction as well as products used in certain industrial processes. Our operations are organized into three reportable segments: North American Gypsum, Building Products Distribution and Worldwide Ceilings.
North American Gypsum: North American Gypsum manufactures and markets gypsum and related products in the United States, Canada and Mexico. It includes United States Gypsum Company, or U.S. Gypsum, in the United States, the gypsum business of CGC Inc., or CGC, in Canada, and USG Mexico, S.A. de C.V., or USG Mexico, in Mexico. North American Gypsum’s products are used in a variety of building applications to finish the walls, ceilings and floors in residential, commercial and institutional construction and in certain industrial applications. Its major product lines include SHEETROCK® brand gypsum wallboard, a line of joint compounds used for finishing wallboard joints also sold under the SHEETROCK® brand name, DUROCK® brand cement board and FIBEROCK® brand gypsum fiber panels.
Building Products Distribution: Building Products Distribution consists of L&W Supply Corporation and its subsidiaries, or L&W Supply, the leading specialty building products distribution business in the United States. It is a service-oriented business that stocks a wide range of construction materials. It delivers less-than-truckload quantities of construction materials to job sites and places them in areas where work is being done, thereby reducing the need for handling by contractors.
Worldwide Ceilings: Worldwide Ceilings manufactures and markets interior systems products worldwide. It includes USG Interiors, Inc., or USG Interiors, the international interior systems business managed as USG International, and the ceilings business of CGC. Worldwide Ceilings is a leading supplier of interior ceilings products used primarily in commercial applications. Worldwide Ceilings manufactures ceiling tile in the United States and ceiling grid in the United States, Canada, Europe and the Asia-Pacific region. It markets ceiling tile and ceiling grid in the United States, Canada, Mexico, Europe, Latin America and the Asia-Pacific region. It also manufactures and markets joint compound in Europe, Latin America and the Asia-Pacific region and gypsum wallboard in Latin America.
Geographic Information: In 2008, approximately 81% of our net sales were attributable to the United States. Canada accounted for approximately 9% of our net sales and other foreign countries accounted for the remaining 10%.
FINANCIAL INFORMATION Consolidated net sales in 2008 were $4.608 billion, down 11% from 2007. An operating loss of $512 million and a net loss of $463 million, or $4.67 per diluted share, were incurred in 2008. These results compared with operating profit of $167 million and net earnings of $77 million, or $0.79 per diluted share, in 2007. Results for 2008 included goodwill and other intangible asset impairment charges of $226 million pretax, restructuring and long-lived asset impairment charges of $98 million pretax and start-up costs for new manufacturing facilities totaling $26 million pretax. The net loss for 2008 also reflected an increase in the valuation allowance, primarily on certain state net operating loss and tax credit carryforwards, that had the impact of reducing our income tax benefit by $71 million, net of tax. Results for 2007 included restructuring and long-lived asset impairment charges of $26 million pretax. The restructuring and long-lived asset impairment charges in 2008 and 2007 primarily related to salaried workforce reductions, facility shutdowns and the closure of distribution locations.
As of December 31, 2008, we had $471 million of cash and cash equivalents compared with $297 million as of

20
December 31, 2007. The increase was primarily attributable to our issuance of $400 million of 10% contingent convertible senior notes in November 2008. Subsequent to December 31, 2008, we used $190 million of cash to repay all outstanding borrowings under our revolving credit facility in connection with its amendment and restatement, as discussed below under “Liquidity and Capital Resources.” The remaining proceeds from the issuance of the contingent convertible senior notes are being used for general corporate purposes.
In the fourth quarter of 2008, we recorded impairment charges of $226 million pretax associated with goodwill and other intangible assets. Based on impairment testing performed as of October 31, 2008, we determined that impairment existed for goodwill related to the L&W Supply reporting unit that comprises our Building Products Distribution segment, the Latin America reporting unit within our Worldwide Ceilings segment and the USG Mexico reporting unit within our North American Gypsum segment. These charges also include an impairment charge for the partial write-off of certain trade names related to L&W Supply.
Financial information for 2007 and 2006 has been retrospectively adjusted for our change in 2008 from the last-in, first-out method of inventory accounting to the average cost method. See Note 1 to the Consolidated Financial Statements for additional information regarding this change in accounting principle.
MARKET CONDITIONS AND OUTLOOK Our businesses are cyclical in nature and sensitive to changes in general economic conditions, including, in particular, conditions in the North American housing and construction-based markets. Housing starts in the United States, which are a major source of demand for our products and services, continued to decline during 2008. Based on preliminary data issued by the U.S. Bureau of the Census, U.S. housing starts in 2008 were an estimated 904,300 units, compared with actual housing starts of 1.355 million units in 2007 and 1.801 million units in 2006. In December 2008, the annualized rate of housing starts was reported to have decreased to 550,000 units, the lowest level recorded in the last 50 years. Industry analysts’ forecasts for housing starts in the United States in 2009 are for a range from 500,000 to 700,000.
The repair and remodel market, which includes renovation of both residential and nonresidential buildings, currently accounts for the largest portion of our sales, ahead of new housing construction. Many buyers begin to remodel an existing home within two years of purchase. According to the National Association of Realtors, sales of existing homes in the United States in 2008 declined to an estimated 4.9 million units compared with 5.7 million units in 2007 and 6.5 million units in 2006, which contributed to a decrease in demand for our products from the residential repair and remodel market. Industry analysts’ forecasts for residential repair and remodel activity in the United States in 2009 are for a further decline of approximately 5% to 10% from the 2008 level.
Demand for our products from new nonresidential construction is determined by floor space for which contracts are signed. Installation of gypsum and ceilings products typically follows signing of construction contracts by about a year. According to McGraw-Hill Construction, total floor space for which contracts were signed in the United States declined 16% in 2008 compared with 2007 after increasing 2% in 2007 compared to 2006. Industry analysts’ forecasts for commercial construction in the United States in 2009 are for a further decline of approximately 15% to 20% from the 2008 level.
The markets that we serve, including in particular the housing and construction-based markets, are affected by the availability of credit, lending practices, the movement of interest rates, the unemployment rate and consumer confidence. Higher interest and unemployment rates and more restrictive lending practices could have a material adverse effect on our businesses, financial condition and results of operations. Our businesses are also affected by a variety of other factors beyond our control, including the inventory of unsold homes, which currently remains at a record level, housing affordability, office vacancy rates and foreign currency exchange rates. Since our operations occur in a variety of geographic markets, our businesses are subject to the economic conditions in each of these geographic markets. General economic downturns or localized downturns in the regions where we have operations may have a material adverse effect on our businesses, financial condition and results of operations.
21
Our results of operations have been adversely affected by the economic downturn in North America, which recently has been exacerbated by substantial turmoil in the financial markets. In 2008, our North American Gypsum segment continued to be adversely affected by the sharp drop in the residential housing market and high raw material and energy costs. Our Building Products Distribution segment, which serves both the residential and commercial markets, has been adversely affected by lower product shipments and tighter margins. Our Worldwide Ceilings segment recorded year-over-year sales growth in 2008. However, the commercial market has begun to weaken and fourth quarter 2008 results for our Worldwide Ceilings segment were significantly below its results for the fourth quarter of 2007 and the third quarter of 2008.
Industry shipments of gypsum wallboard in the United States (including imports) were an estimated 25.2 billion square feet in 2008, down approximately 18% compared with 30.7 billion square feet in 2007, which was down approximately 15% from 36.2 billion square feet in 2006. U.S. Gypsum shipped 7.2 billion square feet of SHEETROCK® brand gypsum wallboard in 2008, a 20% decrease from 9.0 billion square feet in 2007, which was down 17% from 10.8 billion square feet in 2006. The percentage decline of U.S. Gypsum’s wallboard shipments in each of 2008 and 2007 exceeded the declines for the industry primarily due to our decisions to maintain or increase our selling prices despite losing volume and market share and to reduce our sales efforts in geographic markets where we believed the gross margin was inadequate. Because the housing market continues to be very weak and is expected to remain very weak throughout 2009 and the economic recession is expected to contribute to further declines in residential repair and remodeling expenditures and nonresidential construction activity in 2009, we expect demand for gypsum wallboard to decline further in 2009 for USG and the industry as a whole. We estimate that the industry capacity utilization rate was approximately 62% during 2008 and approximately 54% in the fourth quarter of 2008. We expect that rate to remain below 60% in 2009. At such a low level of capacity utilization, we expect there to be continued pressure on wallboard gross margins. For the fourth quarter of 2008, our shipments of SHEETROCK® brand gypsum wallboard were 1.4 billion square feet, down 33% from 2.1 billion square feet in the fourth quarter of 2007.
Currently, there is significant excess wallboard production capacity industry-wide in the United States. Approximately 500 million square feet of additional capacity, net of closures, became operational in the United States in 2008. Industry capacity in the United States was approximately 40 billion square feet in 2008. We and other industry participants announced a number of closures near the end of 2008 that we expect will reduce industry capacity by approximately 3 billion square feet in 2009. We do not expect any new industry capacity will be added in 2009.
RESTRUCTURING AND OTHER INITIATIVES We have been scaling back our operations in response to market conditions since the downturn began in 2006. During the fourth quarter of 2008, we permanently closed a gypsum wallboard production facility in Stony Point, N.Y., and a plaster production facility in Boston, Mass., and we temporarily idled a gypsum wallboard production facility at each of our Plaster City, Calif., Jacksonville, Fla., and Baltimore, Md., plants, a cement board production facility in Santa Fe Springs, Calif., and a structural cement panel production facility in Delavan, Wis. Earlier in 2008, we permanently closed our 80-year-old Boston gypsum wallboard production facility and temporarily idled the gypsum wallboard production facility in Ft. Dodge, Iowa and paper mills in South Gate, Calif., and Gypsum, Ohio. Since mid-2006, we have temporarily idled or permanently closed approximately 3.1 billion square feet of our highest-cost wallboard manufacturing capacity.
Historically, the housing and other construction markets that we serve have been deeply cyclical. Downturns in demand are typically steep and last several years, but they have typically been followed by periods of strong recovery. If this cycle is similar to past cycles in that regard, we believe we will generate significant cash flows when our markets recover. As a result, we currently expect to realize the carrying value of all facilities that are not permanently closed through future cash flows. We regularly monitor forecasts prepared by external economic forecasters and review our facilities and other assets to determine which of them, if any, are impaired under applicable accounting rules. Because we believe that a recovery in the housing and other construction markets we

22
serve will begin in the next two to three years, we determined that there have been no material impairments of our long-lived assets.
However, if the downturn in these markets does not reverse or the downturn is significantly extended, material write-downs or impairment charges may be required in the future. If these conditions were to materialize or worsen, or if there is a fundamental change in the housing market, which individually or collectively lead to a significantly extended downturn or permanent decrease in demand, material impairment charges may be necessary if we permanently close gypsum wallboard production facilities. The magnitude and timing of those charges would be dependent on the severity and duration of the downturn and cannot be determined at this time. Any material cash or noncash impairment charges related to property, plant and equipment would have a material adverse effect on our financial condition and results of operations, but material noncash impairment charges would have no effect on compliance with the financial covenant under our amended and restated secured credit facility or other terms of our outstanding indebtedness.
As part of L&W Supply’s ongoing efforts to reduce its cost structure in light of market conditions, it closed 54 centers during 2008, 30 of which were closed during the fourth quarter. These closures have been widely dispersed throughout the markets L&W Supply serves. L&W Supply opened five new centers during 2008, but none was opened during the fourth quarter.
In the second and fourth quarters of 2008, we implemented salaried workforce reductions that eliminated in total approximately 1,400 salaried positions. We are continuing to adjust our operations for the extended downturn in our markets.
Our focus on costs and efficiencies, including capacity closures and overhead reductions, has helped to mitigate the effects of the downturn in all of our markets. If economic and market conditions continue to deteriorate, we will evaluate plans to further reduce costs, improve operational efficiency and maintain our liquidity.
Our new gypsum wallboard plant at Norfolk, Va., and new paper mill at Otsego, Mich., are operating at significantly lower costs than the operations they replaced. A new, low-cost gypsum wallboard plant in Washingtonville, Pa., that will serve the northeastern United States, began operating in the fourth quarter of 2008.
In the fourth quarter of 2008, we completed the sale of $400 million aggregate principal amount of 10% contingent convertible senior notes due 2018. Early in the first quarter of 2009, we amended and restated our unsecured credit facility to convert it into a secured credit facility that contains a single restrictive financial covenant that only applies if borrowing availability under the facility is below $75 million. Please refer to the discussion under “Liquidity and Capital Resources” below for information regarding our cash position and this credit facility.
See Part I, Item 1A, Risk Factors, for additional information regarding the conditions affecting our businesses and other risks and uncertainties that affect us.
KEY OBJECTIVES In order to perform as efficiently as possible during this challenging business cycle, we are focusing on the following key objectives:
. extend our customer satisfaction leadership;
. achieve significant cost reductions; and
. maintain financial flexibility.

23
Consolidated Results of Operations
Increase Increase (Decrease) (Decrease) (dollars in millions, except per-share data) 2008 2007(a) 2006(a) 2008 vs. 2007 2007 vs. 2006
Net sales $4,608 $5,202 $5,810 (11)% (10)% Cost of products sold 4,416 4,601 4,426 (4)% 4% Gross profit 192 601 1,384 (68)% (57)% Selling and administrative expenses 380 408 419 (7)% (3)% Restructuring and long-lived asset impairment charges 98 26 - 277% - Goodwill and other intangible asset impairment charges 226 - - - - Asbestos claims provision (reversal) - - (44) - - Chapter 11 reorganization expenses - - 10 - - Operating profit (loss) (512) 167 999 - (83)% Interest expense 86 105 555 (18)% (81)% Interest income (7) (22) (43) (68)% (49)% Other income, net (10) (4) (3) 150% 33% Income taxes (benefit) (118) 11 193 - (94)% Net earnings (loss) (463) 77 297 - (74)% Diluted earnings (loss) per share (4.67) 0.79 4.46 - (82)%
(a) Information for 2007 and 2006 has been retrospectively adjusted for our change in 2008 from the last-in, first-out method of inventory accounting to the average cost method. See Note 1 to the Consolidated Financial Statements for information regarding this change in accounting principle.
NET SALES Consolidated net sales were $4.608 billion in 2008, $5.202 billion in 2007 and $5.810 billion in 2006. Net sales declined for the second consecutive year in 2008 following the record level of 2006 primarily due to the steep downturn in United States residential construction that began in mid-2006. This downturn resulted in lower demand and selling prices for gypsum wallboard, which had a significant adverse effect on our North American Gypsum and Building Products Distribution segments.
Consolidated net sales for 2008 were down $594 million, or 11%, compared with 2007. This decrease reflected a 17% decline in net sales for North American Gypsum and a 13% decline in net sales for Building Products Distribution. The lower level of net sales in 2008 for North American Gypsum was largely attributable to declines in U.S. Gypsum’s SHEETROCK® brand gypsum wallboard volume (down 20%) and selling prices (down 18%) compared with 2007. Net sales for Building Products Distribution were down also due primarily to lower volume (down 23%) and selling prices (down 13%) for gypsum wallboard. Worldwide Ceilings continued its trend of year-over-year sales growth with a 4% increase compared with 2007, primarily reflecting USG Interiors’ higher selling prices for ceiling grid (up 9%) and ceiling tile (up 2%). However, demand from the commercial construction market that Worldwide Ceilings serves began to deteriorate in the second half of the year resulting in lower volume levels for USG Interiors’ ceiling grid (down 4%) and ceiling tile (down 1%) in 2008 compared with 2007.
Consolidated net sales for 2007 were down $608 million, or 10%, compared with 2006. This decrease reflected a 22% decline in net sales for North American Gypsum and an 8% decline in net sales for Building Products Distribution. The lower level of net sales in 2007 for North American Gypsum was largely attributable to declines in U.S. Gypsum’s SHEETROCK® brand gypsum wallboard volume (down 17%) and selling prices (down 25%) compared with 2006. Net sales for Building Products Distribution were down also due primarily to lower volume (down 11%) and selling prices (down 16%) for gypsum wallboard. Worldwide Ceilings net sales increased 8% compared with 2006, primarily reflecting increased volume for USG Interiors’ ceiling grid (up 4%) and higher selling prices for its ceiling grid (up 2%) and ceiling tile (up 6%).

24
COST OF PRODUCTS SOLD Cost of products sold totaled $4.416 billion in 2008, $4.601 billion in 2007 and $4.426 billion in 2006.
Cost of products sold decreased $185 million, or 4%, in 2008 compared with 2007 primarily reflecting the lower product volumes discussed above, partially offset by higher raw material and energy costs and higher fixed costs due to lower production volumes. For U.S. Gypsum’s SHEETROCK® brand gypsum wallboard, higher per unit manufacturing costs reflected an 8% increase in raw material costs, a 10% increase in energy costs, and a 28% increase in fixed costs due to lower gypsum wallboard production volume. Cost of products sold in 2008 included charges totaling $26 million for start-up costs related to our new gypsum wallboard plants in Washingtonville, Pa., and Norfolk, Va., and our new paper mill in Otsego, Mich. For USG Interiors, manufacturing costs per unit increased 5% for ceiling tile primarily due to higher raw materials costs, but decreased 3% for ceiling grid primarily due to lower steel costs.
Cost of products sold increased $175 million, or 4%, in 2007 compared with 2006 primarily reflecting higher raw material and energy costs and higher fixed costs due to lower production volumes. For U.S. Gypsum’s SHEETROCK® brand gypsum wallboard, higher per unit manufacturing costs reflected a 13% increase in raw material costs, a 4% increase in energy costs, and an 11% increase in fixed costs due to lower gypsum wallboard volume. Approximately half of the increase in raw materials costs was attributable to a 37% increase in wastepaper costs. For USG Interiors, manufacturing costs per unit increased 4% for ceiling tile primarily due to higher raw materials costs and 11% for ceiling grid primarily due to higher steel costs.
GROSS PROFIT Gross profit was $192 million in 2008, $601 million in 2007 and $1.384 billion in 2006. Gross profit as a percentage of net sales was 4.2% in 2008, 11.6% in 2007 and 23.8% in 2006. Gross profit was down in 2008 and 2007 compared with each respective prior year primarily due to lower demand for gypsum wallboard, lower gypsum wallboard selling prices, higher costs for raw materials, energy and transportation and higher fixed costs due to lower production volumes, as discussed above.
SELLING AND ADMINISTRATIVE EXPENSES Selling and administrative expenses totaled $380 million in 2008, $408 million in 2007 and $419 million in 2006. The decrease in selling and administrative expenses in 2008 compared with 2007 primarily reflected a company-wide emphasis on reducing expenses, including salaried workforce reductions. The decrease in selling and administrative expenses in 2007 compared with 2006 primarily reflected lower accruals for incentive compensation and a company-wide emphasis on reducing expenses, which more than offset a higher level of salaries and related benefits. As a percentage of net sales, selling and administrative expenses were 8.2% in 2008. 7.8% in 2007 and 7.2% in 2006. These expenses as a percentage of net sales increased for the second consecutive year in 2008 due to the declining levels of net sales.
RESTRUCTURING AND LONG-LIVED ASSET IMPAIRMENT CHARGES In response to adverse market conditions, we implemented restructuring activities in 2008 and 2007. In 2008, we recorded restructuring and impairment charges totaling $98 million pretax ($61 million after-tax, or $0.62 per diluted share) primarily associated with salaried workforce reductions, the temporary idling or permanent closure of production facilities and the closure of 54 distribution centers. In 2007, we recorded restructuring and impairment charges totaling $26 million pretax ($16 million after-tax, or $0.16 per diluted share) associated with salaried workforce reductions and the temporary idling or permanent closure of production facilities. See Note 2 to the Consolidated Financial Statements for additional information related to these charges. Total cash payments charged against the restructuring reserve in 2008 amounted to $37 million. We expect future payments to be approximately $42 million in 2009, $6 million in 2010 and $2 million beyond 2010. All restructuring-related payments in 2008 were funded with cash from operations. We expect that the future payments also will be funded with cash from operations. Annual savings from the 2008 restructuring initiatives are estimated to be approximately $150 million beginning in 2009.

25
GOODWILL AND OTHER INTANGIBLE ASSET IMPAIRMENT CHARGES In the fourth quarter of 2008, we recorded impairment charges of $226 million pretax ($177 million after-tax, or $1.78 per diluted share) associated with goodwill and other intangible assets. Based on impairment testing performed as of October 31, 2008, we determined that impairment existed for goodwill related to the L&W Supply reporting unit that comprises our Building Products Distribution segment, the Latin America reporting unit within our Worldwide Ceilings segment and the USG Mexico reporting unit within our North American Gypsum segment. Of the total charge for goodwill impairment, $201 million related to Building Products Distribution, $12 million related to Worldwide Ceilings and $1 million related to North American Gypsum. We also recorded an impairment charge of $12 million pretax for the partial write-off of certain trade names related to L&W Supply. See Note 3 to the Consolidated Financial Statements for additional information related to these charges.
ASBESTOS CLAIMS REVERSAL In 2006, we reversed $44 million pretax ($27 million after-tax, or $0.41 per diluted share) of our reserve for asbestos-related liabilities. This included pretax reversals of $27 million in the second quarter and an additional $17 million in the third quarter. These reversals, which are reflected as income in the consolidated statement of operations, were based on our evaluation in each quarter of the settlements of asbestos property damage claims. See Note 21 to the Consolidated Financial Statements.
INTEREST EXPENSE Interest expense was $86 million in 2008, $105 million in 2007 and $555 million in 2006. Interest expense in 2007 included charges totaling $14 million pretax ($9 million after-tax, or $0.09 per diluted share) to write off deferred financing fees primarily due to the first-quarter repayment of our tax bridge loan and the third-quarter repayment of our bank term loan. Interest expense in 2006 included charges totaling $528 million pretax ($325 million after-tax, or $4.88 per diluted share) for post-petition interest and fees related to pre-petition obligations.
INTEREST INCOME Interest income was $7 million in 2008, $22 million in 2007 and $43 million in 2006. Interest income in 2008 and 2007 was generated primarily from money market investments. Interest income in 2006 was generated primarily from investments in marketable securities. The lower levels of interest income in 2007 and 2008 primarily reflect lower average levels of cash and cash equivalents during each year and lower interest rates.
OTHER INCOME, NET
Other income, net was $10 million in 2008 and included $11 million of income for a change in the fair value of an interest rate step-up derivative related to our contingent convertible senior notes. Other income, net was $4 million in 2007 and $3 million in 2006.
INCOME TAXES (BENEFIT) Income tax benefit was $118 million in 2008. Income tax expense was $11 million in 2007 and $193 million in 2006. Our effective tax rates were 20.4% for 2008, 12.2% for 2007 and 39.4% for 2006. The 2008 tax benefit results from our anticipated carryforward of most of the 2008 net operating loss to offset U.S. federal and state income taxes in future years and reflects a reduction in tax benefit due to an increase in the valuation allowance, primarily on state net operating loss and tax credit carryforwards, in the amount of $71 million. The increase in the valuation allowance recognizes the difficulty in estimating when certain state net operating losses and tax credit carryforwards will be realized given the current challenging economic environment. The effective rate for 2008 also includes the tax impact of goodwill impairment charges. The difference in the 2008 and 2007 effective tax rates was primarily attributable to the favorable effect of items in the 2007 tax provision including, state and foreign tax law changes enacted, the reversal of valuation allowances on net operating loss and investment credit carryovers in our Worldwide Ceilings and Canadian businesses and the effect of a larger portion of our consolidated earnings arising in lower taxed foreign jurisdictions.
NET EARNINGS (LOSS) A net loss of $463 million, or $4.67 per diluted share, was recorded in 2008. These amounts included the after-tax
26
charges of $177 million, or $1.78 per diluted share, for goodwill and intangible asset impairments and $61 million, or $0.62 per diluted share, for restructuring and long-lived asset impairments.
Net earnings in 2007 were $77 million, or $0.79 per diluted share. These amounts included the after-tax charge of $16 million, or $0.16 per diluted share, for restructuring and impairment charges. Net earnings and earnings per share for 2007 also included the after-tax charge of $9 million, or $0.09 per diluted share, for the write-off of deferred financing fees.
Net earnings in 2006 were $297 million, or $4.46 per diluted share. These amounts included the after-tax charge of $325 million, or $4.88 per diluted share, for post-petition interest and fees related to pre-petition obligations. Net earnings and earnings per share for 2006 also included after-tax income of $27 million, or $0.41 per diluted share, as a result of the reversal of the reserve for asbestos-related claims.

27
Core Business Results of Operations
Net Sales Operating Profit (Loss) (a) (millions) 2008 2007 2006 2008 2007 (b) 2006 (b)
North American Gypsum: United States Gypsum Company $ 1,933 $ 2,417 $3,215 $ (261) $ 30 $ 749 CGC Inc. (gypsum) 332 324 341 (8) 15 46 USG Mexico, S.A. de C.V. 201 193 177 20 26 31 Other subsidiaries (c) 74 83 89 8 13 17 Eliminations (182) (180) (201) - - -
Total 2,358 2,837 3,621 (241) 84 843
Building Products Distribution: L&W Supply Corporation 1,993 2,291 2,477 (243) 91 205
Worldwide Ceilings: USG Interiors, Inc. 531 523 507 61 54 57 USG International 304 273 235 (4) 12 13 CGC Inc. (ceilings) 61 61 57 11 9 11 Eliminations (50) (44) (43) - - -
Total 846 813 756 68 75 81
Corporate - - - (97) (110) (117) Eliminations (589) (739) (1,044) 1 27 (3) Chapter 11 reorganization expenses - - - - - (10)
Total USG Corporation $4,608 $5,202 $5,810 $ (512) $ 167 $ 999
(a) Consolidated operating loss in 2008 included restructuring and long-lived asset impairment charges of $98 million pretax. On a segment basis, $48 million of the total amount related to North American Gypsum, $34 million related to Building Products Distribution, $5 million related to Worldwide Ceilings and $11 million related to Corporate.
Consolidated operating loss in 2008 also included goodwill and other intangible asset impairment charges of $226 million pretax. On a
segment basis, $213 million of the total amount related to Building Products Distribution, $12 million related to Worldwide Ceilings and $1 million related to North American Gypsum.
Consolidated operating profit in 2007 included restructuring and long-lived asset impairment charges of $26 million pretax. On a segment
basis, $18 million of the total amount related to North American Gypsum, $1 million related to Building Products Distribution, $2 million related to Worldwide Ceilings and $5 million related to Corporate.
Operating profit in 2006 for North American Gypsum included a reversal of our reserve for asbestos-related liabilities. This reversal
increased operating profit for North American Gypsum by $44 million. (b) Information for 2007 and 2006 has been retrospectively adjusted for our change in 2008 from the last-in, first-out method of inventory
accounting to the average cost method. See Note 1 to the Consolidated Financial Statements for information regarding this change in accounting principle.
(c) Includes a shipping company in Bermuda and a mining operation in Nova Scotia, Canada.

28
NORTH AMERICAN GYPSUM Net sales for North American Gypsum were $2.358 billion in 2008, $2.837 billion in 2007 and $3.621 billion in 2006. Net sales in 2008 were down 17% from 2007 following a decline of 22% in 2007 compared with 2006. An operating loss of $241 million was incurred in 2008. This loss included restructuring and long-lived asset impairment charges of $48 million. Operating profit of $84 million in 2007 included restructuring and long-lived asset impairment charges of $18 million. Operating profit of $843 million in 2006 included a $44 million reversal of our reserve for asbestos-related liabilities.
United States Gypsum Company - 2008 Compared With 2007: Net sales in 2008 declined $484 million, or 20%, from 2007. Approximately $253 million of the decrease in net sales was attributable to a 20% decrease in SHEETROCK® brand gypsum wallboard volume and $170 million was attributable to an 18% decrease in average gypsum wallboard selling prices. Net sales for SHEETROCK® brand joint treatment products declined $67 million and net sales of other products increased $6 million compared with 2007.
An operating loss of $261 million was recorded in 2008 compared with operating profit of $30 million in 2007. The $291 million decline in operating profit was primarily attributable to a 95% decrease in gypsum wallboard gross margin, which lowered operating profit by $248 million, and the decline in gypsum wallboard volume, which lowered operating profit by $68 million. Gross profit for SHEETROCK® brand joint treatment products declined $34 million. Restructuring and long-lived asset impairment charges of $43 million pretax were recorded in 2008 compared with charges of $15 million pretax in 2007. The factors that contributed to the lower level of operating profit in 2008 were partially offset by a net gross profit increase for other product lines, lower information technology, promotional and other expenditures and lower selling and administrative expenses, which aggregated $87 million in operating profit improvement.
New housing construction was very weak throughout 2008 resulting in reduced demand for gypsum wallboard, as discussed above, and lower selling prices. U.S. Gypsum shipped 7.2 billion square feet of SHEETROCK® brand gypsum wallboard in 2008, a 20% decrease from 9.0 billion square feet in 2007. We estimate that industry capacity utilization rates were approximately 62%, while U.S. Gypsum’s capacity utilization rate averaged 65%, during 2008. For the fourth quarter of 2008, we estimate that the industry operated at 54% of capacity, while U.S. Gypsum’s wallboard plants operated at approximately 51% of capacity.
In 2008, our nationwide average realized selling price for SHEETROCK® brand gypsum wallboard was $111.15 per thousand square feet, down 18% from $134.93 in 2007. During the fourth quarter of 2008, our average realized selling price for SHEETROCK® brand gypsum wallboard was $118.98 per thousand square feet, up 4% from the third quarter of 2008 and 8% compared with the fourth quarter of 2007.
Manufacturing costs for U.S. Gypsum increased 11% in 2008 compared with 2007 primarily due to an 8% increase in raw materials costs, a 10% increase in energy costs and a 28% increase in fixed costs due to lower gypsum wallboard production volume. Raw materials costs increased in 2008 despite a 4% decrease in wastepaper costs.
Net sales and gross profit for SHEETROCK® brand joint treatment products declined by $67 million and $34 million, respectively, in 2008 compared with 2007 primarily due to lower joint compound volume (down 17%), partially offset by higher average realized selling prices (up 4%). Gross profit for joint compound products also was adversely affected by higher manufacturing costs (up 11%). Net sales for DUROCK® brand cement board were down in 2008 compared with 2007 primarily due to a 17% decrease in volume. Gross profit for cement board was adversely affected by higher manufacturing costs (up 3%). Net sales and gross profit for FIBEROCK® brand gypsum fiber panels improved in 2008 compared with 2007 reflecting higher selling prices (up 5%) and slightly lower manufacturing costs (down 1%), while volume was down 2%.
United States Gypsum Company - 2007 Compared With 2006: Net sales in 2007 decreased $798 million, or 25%, from 2006. Approximately $412 million of the decrease in net sales was attributable to a 25% decrease in average

29
gypsum wallboard selling prices and $328 million was attributable to a 17% decrease in gypsum wallboard volume. Net sales for joint treatment products declined by $61 million. Net sales of other products increased $3 million compared with 2007.
Operating profit for 2007 decreased $719 million, or 96%, compared with 2006. A 60% decline in gypsum wallboard gross margin lowered operating profit by $489 million and the decline in gypsum wallboard shipments lowered operating profit by $164 million. Operating profit for 2007 also reflected restructuring and long-lived asset impairment charges of $15 million pretax. Operating profit for other products combined with other costs and selling and administrative expenses accounted for an additional decrease of $7 million. Operating profit for 2006 included the reversal of $44 million of our reserve for asbestos-related liabilities.
Operating results in 2007 were adversely affected by lower average selling prices, lower volume and higher manufacturing costs for SHEETROCK® brand gypsum wallboard. New housing construction was weak throughout 2007 resulting in reduced demand for gypsum wallboard and lower selling prices. Industry shipments of gypsum wallboard in the United States (including imports) were an estimated 30.7 billion square feet in 2007, which was down approximately 15% from 36.2 billion square feet in 2006. U.S. Gypsum shipped 9.0 billion square feet of SHEETROCK® brand gypsum wallboard in 2007, which was down 17% from 10.8 billion square feet in 2006. The percentage decline of U.S. Gypsum’s wallboard shipments in 2007 exceeded the decline for the industry primarily due to our decisions to maintain or increase our selling prices despite losing volume and market share and to reduce our sales efforts in geographic markets where we believed the gross margin was inadequate. U.S. Gypsum’s capacity utilization for gypsum wallboard averaged 78% in 2007, down from 92% in 2006.
In 2007, our nationwide average realized selling price for SHEETROCK® brand gypsum wallboard was $134.93 per thousand square feet, down 25% from $180.59 in 2006.
Manufacturing costs for U.S. Gypsum increased 9% in 2007 compared with 2006 primarily due to a 13% increase in raw materials costs, a 4% increase in energy costs and an 11% increase in fixed costs due to lower gypsum wallboard production volume. Approximately half of the increase in raw materials costs in 2007 was attributable to a 37% increase in wastepaper costs.
Net sales and gross profit for SHEETROCK® brand joint treatment products declined by $61 million and $20 million, respectively, in 2007 compared with 2006 primarily due to lower joint compound volume (down 12%), partially offset by higher average realized selling prices (up 2%). Gross profit for joint compound products also was adversely affected by higher manufacturing costs (up 4%). Net sales for DUROCK® brand cement board were down in 2007 compared with 2006 primarily due to lower volume (down 6%). However, gross profit for cement board improved due to higher average realized selling prices (up 5%) and lower manufacturing costs (down 5%). Net sales and gross profit for FIBEROCK® brand gypsum fiber panels improved versus 2006 due to higher selling prices (up 6%) and lower manufacturing costs (down 3%), while volume was down 1%.
CGC Inc.: Net sales increased $8 million, or 2%, in 2008 compared with 2007 primarily due to increased sales of joint treatment and other nonwallboard products, increased sales for CGC’s distribution subsidiary, higher outbound freight and the favorable effects of currency translation (together up $13 million), partially offset by a $5 million decrease in sales of SHEETROCK® brand gypsum wallboard due to a 12% decline in selling prices, partially offset by a 10% increase in volume. An operating loss of $8 million was recorded in 2008 compared with operating profit of $15 million in 2007. This $23 million decline in operating profit primarily reflected a $19 million decrease in gross profit for gypsum wallboard. Operating profit also was adversely affected by a higher cost of imported gypsum products (up $10 million) due to the decline of the Canadian dollar versus the U.S. dollar in the fourth quarter of 2008. Restructuring charges related to salaried workforce reductions totaled $4 million in 2008 compared with $3 million in 2007. Gross profit for joint treatment and other products increased $5 million and selling and administrative expenses decreased $2 million in 2008 compared with 2007.

30
Comparing 2007 with 2006, net sales declined $17 million, or 5%. This decrease reflected lower net sales for SHEETROCK® brand gypsum wallboard, which declined $36 million due to an 8% decrease in average selling prices and a 9% decrease in volume. This decline was partially offset by the favorable effects of currency translation, increased sales of joint treatment and lower outbound freight (together up $19 million). Operating profit declined $31 million, or 67%, primarily due to a $35 million decrease in gross profit for gypsum wallboard due to the lower average selling prices and volume and a 9% increase in manufacturing costs that primarily reflected higher costs for wastepaper and other raw materials. In addition, operating profit for 2007 included a restructuring charge of $3 million. These negative factors were partially offset by a $6 million increase in gross profit for joint treatment and other products and a $1 million decrease in selling and administrative expenses in 2007 compared with 2006.
USG Mexico, S.A. de C.V.: Net sales in 2008 for our Mexico-based subsidiary were up $8 million, or 4%, compared with 2007 largely due to increased sales of drywall steel (up $6 million), DUROCK® brand cement board (up $2 million) and other products (up $3 million), partially offset by lower sales of gypsum wallboard (down $3 million). However, operating profit declined $6 million, or 23%, compared with 2007 principally due to a 24% decrease in gross profit for gypsum wallboard as a result of lower selling prices and higher manufacturing costs. Gross profit for other product lines also were adversely affected by higher manufacturing costs. A restructuring charge of $1 million related to salaried workforce reductions was recorded in 2008. A goodwill impairment charge of $1 million also was recorded in 2008.
Comparing 2007 with 2006, net sales increased $16 million, or 9%, principally due to increased sales of construction plasters (up $6 million), drywall steel (up $4 million), DUROCK® brand cement board (up $3 million) and other products (up $4 million), partially offset by lower sales of gypsum wallboard (down $1 million). However, operating profit was down $5 million, or 16%, compared with 2006 principally due to a 16% decrease in gross profit for gypsum wallboard as a result of higher manufacturing costs. Gross profit for other product lines also was adversely affected by higher manufacturing costs.
BUILDING PRODUCTS DISTRIBUTION L&W Supply’s net sales in 2008 were $1.993 billion, down $298 million, or 13%, compared with 2007. This decline was primarily attributable to a 23% decrease in gypsum wallboard shipments and a 13% decline in average gypsum wallboard selling prices as a result of the weak residential construction market. The lower shipments adversely affected net sales by $225 million and the lower selling prices adversely affected net sales by $101 million. Net sales of construction metal products increased $90 million, or 21%, and net sales of ceilings products increased $27 million, or 10%. However, net sales of all other nonwallboard products fell $89 million, or 14%. As a result of lower product volumes and gypsum wallboard selling prices, same-location net sales for 2008 were down 18% compared with 2007.
An operating loss of $243 million was incurred in 2008 compared with operating profit of $91 million in 2007. The $334 million decline in operating profit reflected goodwill and other intangible asset impairment charges of $213 million pretax and restructuring and long-lived asset impairment charges of $34 million pretax primarily related to the closure of 54 distribution centers and salaried workforce reductions. In addition, the decline in gypsum wallboard shipments adversely affected operating profit by $63 million and a 24% decline in gypsum wallboard gross margin and the impact of rebates adversely affected operating profit by $59 million. Gross profit from other product lines increased $4 million and center overhead and delivery expense decreased $31 million. L&W Supply’s gypsum wallboard price and volume trends in the fourth quarter of 2008 were similar to those for our North American Gypsum segment due to the weakened conditions in the United States construction markets.
Comparing 2007 with 2006, L&W Supply’s net sales were $2.291 billion in 2007, down $186 million, or 8%, compared with 2006. This decline was primarily attributable to an 11% decrease in gypsum wallboard shipments and a 16% decrease in average gypsum wallboard selling prices as a result of the weak residential construction market. Lower shipments adversely affected net sales by $152 million and lower selling prices adversely affected net sales by $193 million. The benefit of acquisitions and increased sales related to nonresidential construction activity partially offset those negative factors. Sales of ceilings products increased $73 million, or 41%, and sales of other products
31
increased $86 million, or 9%. Wallboard shipments and sales of nonwallboard products were favorably affected by the acquisitions of California Wholesale Material Supply, Inc., or CALPLY, in late March 2007, and All Interiors Supply, in the fourth quarter of 2006. These acquired businesses contributed $460 million to 2007 net sales. As a result of lower product volumes and gypsum wallboard prices, same-location net sales for 2007 decreased 26% compared with 2006.
Operating profit in 2007 was $91 million, a decrease of $114 million, or 56%, compared with 2006. The decline in operating profit was primarily attributable to the decrease in gypsum wallboard shipments, which lowered operating profit by $38 million, and a 7% decline in the gross margin for gypsum wallboard and the impact of rebates, which lowered operating profit by $41 million. Center overhead and delivery expense increased $47 million in 2007, principally due to the acquisition of CALPLY. Amortization expense related to intangible assets associated with recent acquisitions was $6 million in 2007, while amortization expense for 2006 was immaterial. L&W Supply’s operating profit for 2007 included a restructuring charge of $1 million related to salaried workforce reductions. These unfavorable factors were partially offset by a $19 million increase in gross profit for other product lines in 2007.
In response to weak market conditions, L&W Supply closed 54 centers in 2008, while opening five new centers and continued to serve its customers from 198 centers in the United States as of December 31, 2008. L&W Supply operated 247 centers in the United States and Mexico as of December 31, 2007 and 220 centers in the United States as of December 31, 2006.
WORLDWIDE CEILINGS Worldwide Ceilings had record net sales of $846 million in 2008 which represented an increase of $33 million, or 4%, compared with 2007. Operating profit in 2008 was $68 million, a decrease of $7 million, or 9%, compared with 2007. Operating profit in 2008 was adversely affected by goodwill and other intangible asset impairment charges of $12 million and restructuring charges of $5 million related to salaried workforce reductions. Net sales in 2007 of $813 million increased 8% compared with 2006, while operating profit of $75 million, which included restructuring charges of $2 million related to salaried workforce reductions, was down $6 million.
USG Interiors, Inc.: Net sales in 2008 for our domestic ceilings business rose to $531 million, an increase of $8 million, or 2%, compared with 2007. Operating profit increased to $61 million, an increase of $7 million, or 13%, compared with 2007. These results primarily reflected higher selling prices for ceiling grid and tile in 2008. However, demand from the commercial construction market that USG Interiors serves began to deteriorate in the second half of the year, resulting in lower volume levels for ceiling grid and ceiling tile in 2008 compared with 2007.
Net sales in 2008 increased $8 million for ceiling grid and $1 million for AURATONE® brand ceiling tile while sales of other products declined $1 million compared with 2007. Net sales for ceiling grid benefited from higher selling prices (up 9%) that contributed a $14 million increase in sales and more than offset a 4% decrease in volume, which adversely affected sales by $6 million. Net sales for AURATONE® brand ceiling tile benefited from higher selling prices (up 2%) that contributed a $3 million increase in sales and more than offset a 1% decrease in volume, which adversely affected sales by $2 million.
A 37% increase in gross margin for ceiling grid in 2008 increased gross profit by $17 million, reflecting the higher selling prices and lower manufacturing costs (down 3%) compared with 2007. The decrease in costs primarily reflected lower steel costs. This increase in gross profit for ceiling grid more than offset a $2 million decline as a result of the lower volume. An 11% decrease in gross margin for ceiling tile in 2008 decreased gross profit by $5 million, reflecting higher manufacturing costs (up 5%), partially offset by the higher selling prices compared with 2007. The increase in ceiling tile costs primarily reflected higher raw material costs. Gross profit for other products were down $2 million in 2008. Restructuring charges of $2 million were recorded in 2008 compared with $1 million in 2007.
Net sales in 2007 for USG Interiors rose to $523 million, an increase of $16 million, or 3%, compared with

32
2006. However, operating profit of $54 million was down $3 million, or 5%, compared with 2006. Net sales for ceiling grid increased $9 million compared with 2006. Sales of ceiling grid benefited from higher volume (up 4%) that contributed $6 million in increased sales and higher selling prices (up 2%) that contributed a $3 million increase in sales. Net sales for AURATONE® brand ceiling tile increased $7 million, reflecting higher selling prices (up 6%) that contributed a $10 million increase in sales and more than offset a 1% decrease in volume, which adversely affected sales by $3 million.
A 16% decrease in gross margin for ceiling grid in 2007 compared with 2006 adversely affected gross profit by $9 million, reflecting higher manufacturing costs (up 11%) primarily due to higher steel costs, which more than offset the higher selling prices. The decrease in the gross profit for ceiling grid more than offset a $2 million increase as a result of the higher volume. A 13% increase in gross margin for ceiling tile in 2007 compared with 2006 contributed $4 million to gross profit, reflecting the higher selling prices that more than offset higher manufacturing costs (up 4%). The increase in costs primarily reflected higher raw material costs.
USG International: Net sales in 2008 for USG International increased $31 million, or 11%, compared with 2007. However, an operating loss of $4 million was recorded in 2008 compared with operating profit of $12 million in 2007. The improvement in net sales primarily reflected increased demand for ceiling grid and joint treatment in Europe and ceiling tile in the Asia-Pacific region as well as the favorable effects of currency translation. However, demand for ceiling grid and joint treatment in Europe decreased in the fourth quarter of 2008 compared with prior 2008 quarters and the fourth quarter of 2007. Operating profit fell in 2008 largely due to goodwill and other intangible asset impairment charges of $12 million and restructuring charges of $3 million related to salaried workforce reductions.
Net sales in 2007 for USG International increased $38 million, or 16%, while operating profit of $12 million was down $1 million compared with 2006. The improvement in net sales primarily reflected increased demand for USG ceiling grid and joint treatment in Europe and the favorable effects of currency translation. Operating profit fell largely due to lower volume and selling prices in Latin America and higher selling and administrative expenses.
CGC Inc.: Net sales in 2008 of $61 million were unchanged from 2007. However, operating profit increased $2 million to $11 million primarily due to higher selling prices for ceiling grid and ceiling tile.
Net sales in 2007 increased $4 million, or 7%, compared with 2006 primarily due to improved pricing for ceiling grid, partially offset by lower selling prices for ceiling tile. However, operating profit of $9 million was down $2 million primarily due to higher grid manufacturing costs.
Liquidity and Capital Resources
LIQUIDITY As of December 31, 2008, we had cash and cash equivalents of $471 million. Subsequent to December 31, 2008, $190 million of cash was used to repay borrowings under our revolving credit facility in connection with its amendment and restatement, as discussed below.
Since the beginning of the fourth quarter of 2008, we have implemented several financing arrangements to improve our financial flexibility and liquidity. In November 2008, we sold $400 million of 10% contingent convertible senior notes due 2018. The notes bear interest at a rate of 10% per annum and are convertible into shares of our common stock at an initial conversion ratio of 87.7193 shares per $1,000 principal amount of notes, which is equivalent to an initial conversion price of $11.40 per share. During the fourth quarter of 2008, we also finalized a ship mortgage facility under which we borrowed $29 million in the fourth quarter and expect to borrow an additional $25 million to $35 million in the first quarter of 2009.
In January 2009, we amended and restated our unsecured revolving credit facility. The amended and restated facility, which is guaranteed by, and secured by trade receivables and inventory of, our significant domestic

33
subsidiaries, matures in 2012 and provides for revolving loans of up to $500 million based upon a borrowing base determined by reference to the levels of trade receivables and inventory securing the facility. The amended and restated facility has a single financial covenant that will only apply if borrowing availability under the facility is less than $75 million. Availability under the credit facility will increase or decrease depending on changes to the borrowing base over time. In conjunction with the amendment and restatement of the revolving credit facility, our separate $170 million secured credit agreement was terminated.
Upon completion of the revolving credit facility amendment, we had about $550 million of available borrowing capacity and cash to fund operations, including approximately $250 million of borrowing capacity under the revolving credit facility, taking into account the borrowing base, outstanding letters of credit and the $75 million availability requirement for the minimum fixed charge coverage ratio not to apply. We do not satisfy the fixed charge coverage ratio as of the date of this report. As of the most recent borrowing base report delivered under the credit facility, which reflects trade receivables and inventory as of December 31, 2008, our borrowing availability under the revolving credit facility had declined by about $60 million since completion of the facility amendment. Inventories and trade receivables are typically at their lowest levels at year end.
We have taken significant actions to reduce the cash needed to operate our businesses. We expect operating cash inflows to improve in 2009 from 2008 levels as a result of the approximately $150 million of cost savings from our 2008 restructuring actions. These operating cash inflows are expected to largely fund our cash requirements. Any shortfall is expected to be funded by cash on hand, borrowings under our revolving credit facility and ship mortgage facility, other potential borrowings and potential sales of surplus property. We expect to lower our level of capital expenditures to approximately $50 million in 2009, reflecting the substantial completion of a number of strategic investments. Interest payments will increase to $137 million in 2009 due to the higher level of debt outstanding, but we have no term debt maturities until 2016, other than approximately $4 million of annual debt amortization under our ship mortgage facility, which will increase to approximately $9 million annually following the additional borrowing under that facility expected to occur in the first quarter of 2009. Due to significant tax loss carryforwards, our income tax payments are expected to be very low for the next several years.
We believe that cash on hand, cash available from future operations and the sources of funding described above will provide sufficient liquidity to fund our operations for the next 12 months. However, operating cash flows are expected to continue to be negative and reduce our liquidity in the near term. Cash requirements include, among other things, capital expenditures, working capital needs, interest, pension funding and other contractual obligations.
Notwithstanding the above, if a significantly extended downturn or further significant decrease in demand materializes, there will exist a material uncertainty as to whether we will have sufficient cash flows to be able to weather such a downturn or decrease in demand. As discussed above, during 2008 we took actions to reduce costs, increase our liquidity and improve our operations. We will continue our efforts to increase financial flexibility during the recession. There can be no assurance that the efforts taken to date and future actions will be sufficient to withstand the impact of any economic downturn that extends deeper or longer than we currently anticipate. Under these conditions, our operations and other sources of funds may not be sufficient to fund our operations, and we may be required to seek alternative sources of funding. There is no assurance, however, that we will be able to obtain financing on acceptable terms, or at all, especially in light of the ongoing turmoil in the financial markets discussed under “Risk Factors” above.
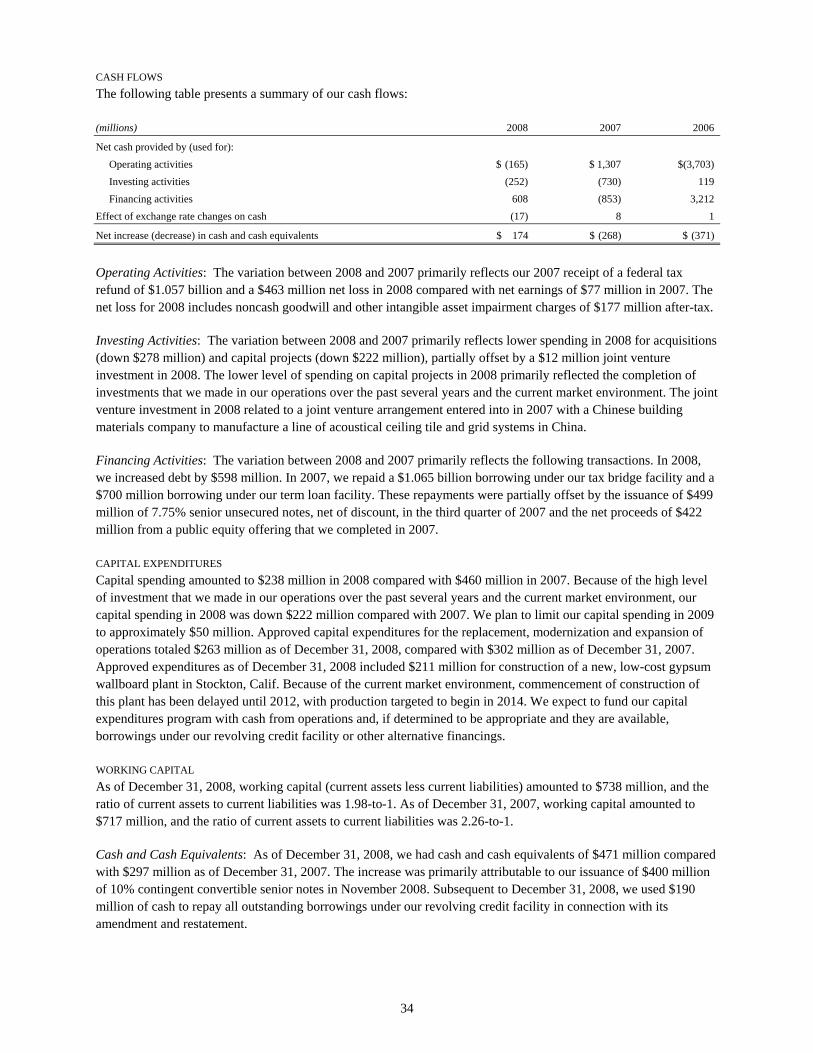
34
CASH FLOWS The following table presents a summary of our cash flows:
(millions) 2008 2007 2006
Net cash provided by (used for): Operating activities $ (165) $ 1,307 $(3,703) Investing activities (252) (730) 119 Financing activities 608 (853) 3,212 Effect of exchange rate changes on cash (17) 8 1
Net increase (decrease) in cash and cash equivalents $ 174 $ (268) $ (371)
Operating Activities: The variation between 2008 and 2007 primarily reflects our 2007 receipt of a federal tax refund of $1.057 billion and a $463 million net loss in 2008 compared with net earnings of $77 million in 2007. The net loss for 2008 includes noncash goodwill and other intangible asset impairment charges of $177 million after-tax.
Investing Activities: The variation between 2008 and 2007 primarily reflects lower spending in 2008 for acquisitions (down $278 million) and capital projects (down $222 million), partially offset by a $12 million joint venture investment in 2008. The lower level of spending on capital projects in 2008 primarily reflected the completion of investments that we made in our operations over the past several years and the current market environment. The joint venture investment in 2008 related to a joint venture arrangement entered into in 2007 with a Chinese building materials company to manufacture a line of acoustical ceiling tile and grid systems in China.
Financing Activities: The variation between 2008 and 2007 primarily reflects the following transactions. In 2008, we increased debt by $598 million. In 2007, we repaid a $1.065 billion borrowing under our tax bridge facility and a $700 million borrowing under our term loan facility. These repayments were partially offset by the issuance of $499 million of 7.75% senior unsecured notes, net of discount, in the third quarter of 2007 and the net proceeds of $422 million from a public equity offering that we completed in 2007.
CAPITAL EXPENDITURES Capital spending amounted to $238 million in 2008 compared with $460 million in 2007. Because of the high level of investment that we made in our operations over the past several years and the current market environment, our capital spending in 2008 was down $222 million compared with 2007. We plan to limit our capital spending in 2009 to approximately $50 million. Approved capital expenditures for the replacement, modernization and expansion of operations totaled $263 million as of December 31, 2008, compared with $302 million as of December 31, 2007. Approved expenditures as of December 31, 2008 included $211 million for construction of a new, low-cost gypsum wallboard plant in Stockton, Calif. Because of the current market environment, commencement of construction of this plant has been delayed until 2012, with production targeted to begin in 2014. We expect to fund our capital expenditures program with cash from operations and, if determined to be appropriate and they are available, borrowings under our revolving credit facility or other alternative financings.
WORKING CAPITAL As of December 31, 2008, working capital (current assets less current liabilities) amounted to $738 million, and the ratio of current assets to current liabilities was 1.98-to-1. As of December 31, 2007, working capital amounted to $717 million, and the ratio of current assets to current liabilities was 2.26-to-1.
Cash and Cash Equivalents: As of December 31, 2008, we had cash and cash equivalents of $471 million compared with $297 million as of December 31, 2007. The increase was primarily attributable to our issuance of $400 million of 10% contingent convertible senior notes in November 2008. Subsequent to December 31, 2008, we used $190 million of cash to repay all outstanding borrowings under our revolving credit facility in connection with its amendment and restatement.

35
Receivables: As of December 31, 2008, receivables were $467 million, up $37 million, or 9%, from $430 million as of December 31, 2007. This increase primarily reflected (1) our requirement to provide $43 million of collateral to our derivative counterparties as a result of changes in the market value of our derivatives and our credit rating and (2) an $11 million increase related to cross-currency swaps, partially offset by a $25 million decrease in customer receivables primarily due to a 13% decrease in consolidated net sales in December 2008 compared with December 2007.
Inventories: As of December 31, 2008, inventories were $404 million, down $27 million, or 6%, from $431 million as of December 31, 2007. The lower level of inventories primarily reflected a $35 million decrease in U.S. Gypsum’s inventories principally resulting from the idling of production facilities due to the lower level of demand, as discussed above, partially offset by a $10 million increase in USG International’s inventories. The increase in USG International’s inventories primarily reflected a 30% increase in steel costs in Europe in December 2008 compared with December 2007 combined with our fixed contracts with vendors to purchase steel and the downturn in demand for ceiling grid products in Europe in the fourth quarter.
Accounts Payable: As of December 31, 2008, accounts payable were $220 million, down $108 million, or 33%, from $328 million as of December 31, 2007. The lower level of accounts payable largely reflected (1) a $32 million decrease related to capital spending as a result of the substantial completion of several strategic investments, including our new, low-cost wallboard plants and a paper mill combined with reduced capital spending subsequent to the completion of those projects, (2) a $32 million decrease in plant accruals largely reflecting the idling of production facilities due to the lower level of demand and (3) a $23 million decrease in non-plant year-end accruals due to the lower level of business and a company-wide emphasis on reducing expenses.
Accrued Expenses: As of December 31, 2008, accrued expenses were $338 million, up $104 million, or 44%, from $234 million as of December 31, 2007. The higher level of accrued expenses primarily reflected (1) a $43 million increase in restructuring-related accruals, (2) a $38 million increase in the fair value of outstanding hedge contracts and (3) a $15 million increase in accrued interest.
DEBT Total debt, consisting of senior notes, contingent convertible senior notes, industrial revenue bonds, a ship mortgage credit facility and outstanding borrowings under our revolving credit facility, amounted to $1.836 billion as of December 31, 2008. Subsequent to December 31, 2008, $190 million of cash was used to repay borrowings under our revolving credit facility in connection with its amendment and restatement discussed above. Total debt, consisting of senior notes and industrial revenue bonds, amounted to $1.238 billion as of December 31, 2007. See Note 10 to the Consolidated Financial Statements for additional information about our debt.
Realization of Deferred Tax Asset
Our consolidated balance sheet as of December 31, 2008 included a gross deferred tax asset of $577 million relating to U.S. federal, state and foreign income tax benefits available for use in future periods with respect to various net operating loss, or NOL, and tax credit carryforwards. The NOL and tax credit carryforwards are a result of the amounts paid to the asbestos trust in 2006, as well as additional losses incurred in 2007 and 2008. We have concluded, based on the weight of available evidence, that all but $166 million of these tax benefits are more likely than not to be realized in the future.
In arriving at this conclusion, we evaluated all available evidence, including our past operating results, the existence of cumulative losses in the most recent fiscal years and our forecast of future taxable income. In determining future taxable income, assumptions were utilized, including the amount of pre-tax operating income in particular jurisdictions, reversal of temporary differences and the implementation of feasible and prudent tax planning strategies. The assumptions utilized in forecasting pre-tax operating income are consistent with the plans and estimates used to determine the fair value of our reporting units for purposes of testing for impairment of goodwill and intangible assets. In projecting pre-tax income, we have relied upon historical data and forecasted

36
business cycles. Historically, the housing and other construction markets that we serve are deeply cyclical. Downturns in demand are typically steep and last several years, but are typically followed by periods of strong recovery. We believe this trend will occur again and that we will generate significant pre-tax profits when our markets recover. We also assumed that any deferred tax liabilities relied upon will reverse in the same period and jurisdiction and are of the same character as the temporary differences giving rise to the deferred tax asset related to the NOL and tax credit carryforwards.
As of December 31, 2008, we had deferred tax assets related to federal NOL and tax credit carryforwards of $336 million. We have federal NOLs of approximately $781 million that are available to offset federal taxable income and will expire in the years 2026 - 2028. In addition, we have federal alternative minimum tax credit carryforwards of approximately $69 million that are available to reduce future regular federal income taxes over an indefinite period. In order to fully realize the U.S. federal net deferred tax assets, taxable income of approximately $979 million would need to be generated during the period before their expiration. We currently anticipate that taxable income during that period will be in excess of the amount required in order to realize the U.S. deferred tax assets. As a result, management has concluded that it is more likely than not that these U.S. federal net deferred tax assets will be realized. In addition, we have federal foreign tax credit carryforwards of $6 million that will expire in 2015. Based on projections of future foreign tax credit usage, we concluded that, at December 31, 2008, a valuation allowance against the federal foreign tax credit carryforwards in the amount of $3 million was required.
In contrast to the results under the Internal Revenue Code, many U.S. states do not allow the carryback of an NOL in any significant amount. As a result, in these states our NOL carryforwards are significantly higher than our federal NOL carryforward. As of December 31, 2008, we had a gross deferred tax asset related to our state NOLs and tax credit carryforwards of $233 million, of which $12 million expires in years 2009-2011, $12 million expires in 2012-2014, $30 million expires in 2015-2017, $14 million expires in 2018-2020, $43 million expires in 2021-2023, $86 million expires in 2026, $7 million expires in 2027, $11 million expires in 2028 and $18 million does not expire. To the extent that we do not generate sufficient state taxable income within the statutory carryforward periods to utilize the loss carryforwards in these states, the loss carryforwards will expire unused. Based on projections of future taxable income in the states in which we conduct business operations and the loss carryforward periods allowed by current state laws (generally 5 to 20 years), we concluded that, at December 31, 2008, a valuation allowance in the amount of $163 million is required.
We also had deferred tax assets related to NOL and tax credit carryforwards in various foreign jurisdictions in the amount of $7 million at December 31, 2008, against a portion of which we had historically maintained a valuation allowance. During 2007, we reversed the entire $8 million valuation allowance on our Worldwide Ceilings business due to a change in judgment regarding the continued profitability of that business. Our profitability in that business in recent years, and our projections of future taxable income, have increased significantly due to cost-reduction activities and the introduction of new products, which has resulted in our concluding that it was more likely than not that we would be able to realize the deferred tax assets related to the NOLs in our Worldwide Ceilings business. During 2007, we reversed all $2 million of a valuation allowance on our Canadian businesses due to a planned amalgamation of entities, which as a combined entity is a historically profitable business. As a result, we believe it is more likely than not that we will be able to realize the deferred tax asset related to the NOLs and tax credit carryforwards in our Canadian businesses.
Section 382 of the Internal Revenue Code, or Section 382, imposes limitations on a corporation’s ability to utilize NOLs if it experiences an “ownership change.” In general terms, an ownership change may result from transactions increasing the ownership of certain stockholders in the stock of a corporation by more than 50 percentage points over a three year period. If we were to experience an “ownership change,” utilization of our NOLs would be subject to an annual limitation under Section 382 determined by multiplying the market value of our outstanding shares of stock at the time of the ownership change by the applicable long-term tax-exempt rate (which was 5.4% for December 2008). Any unused annual limitation may be carried over to later years within the allowed NOL carryforward period. The amount of the limitation may, under certain circumstances, be increased or decreased by built-in gains or losses held by us at the time of the change that are recognized in the five-year period after the

37
change. Based on information available as of December 31, 2008, we estimate our current ownership change to be between 39% and 41%. If an ownership change had occurred as of December 31, 2008, our annual NOL utilization would have been limited to approximately $43 million per year.
During the fourth quarter of 2008, we amended our shareholder rights plan to reduce, until September 30, 2009, the threshold at which a person or group becomes an “Acquiring Person” under the rights plan from 15% to 4.99% of our outstanding common stock. The rights plan, as amended, exempts certain stockholders as long as they do not acquire additional shares of our common stock, except as otherwise provided by existing agreements. Common shares that otherwise would be deemed beneficially owned under the rights plan by reason of ownership of our 10% contingent convertible senior notes are exempted during the period in which the threshold is reduced to 4.99%. The amendment to the rights plan is intended to maximize the value of our NOL carryforwards and related tax benefits. The amendment does not, however, ensure that use of NOLs will not be limited by an ownership change, and there can be no assurance that an ownership change will not occur.
Contractual Obligations and Other Commitments
CONTRACTUAL OBLIGATIONS As of December 31, 2008, our contractual obligations and commitments were as follows:
Payments Due by Period 2010- 2012- There-
(millions) Total 2009 2011 2013 after
Debt obligations (a) $1,858 $194 $ 8 $ 6 $1,650 Other long-term liabilities (b) 593 18 14 16 545 Interest payments (c) 1,416 137 268 262 749 Purchase obligations (d) 532 77 73 91 291 Capital expenditures (e) 263 37 35 182 9 Operating leases 428 91 136 77 124 Unrecognized tax benefits (f) 47 3 10 34 -
Total $5,137 $557 $544 $668 $3,368
(a) Excludes debt discount of $22 million. Debt obligations for 2009 include $190 million that was due in 2012, but was paid in January 2009 in connection with the amendment and restatement of our revolving credit facility.
(b) Other long-term liabilities primarily consist of asset retirement obligations that principally extend over a 50-year period. The majority of associated payments are due toward the latter part of that period.
(c) Reflects estimated interest payments on debt obligations as of December 31, 2008. (d) Purchase obligations primarily consist of contracts to purchase energy and certain raw materials. (e) Reflects estimates of future spending on capital projects that were approved prior to December 31, 2008 but were not completed by that date. (f) Reflects estimated payments (if required) of gross unrecognized tax benefits.
For 2009, our defined benefit pension plans have no minimum funding requirements under the Employee Retirement Income Security Act of 1974, or ERISA. We are evaluating our level of funding for pension plans and currently estimate that we will contribute approximately $34 million to $46 million of cash to our pension plans in 2009.
The above table excludes liabilities related to postretirement benefits (retiree health care and life insurance). We voluntarily provide postretirement benefits for eligible employees and retirees. The portion of benefit claim payments we made in 2008 was $19 million. See Note 14 to the Consolidated Financial Statements for additional information on future expected cash payments for pension and other postretirement benefits.
OFF-BALANCE-SHEET ARRANGEMENTS With the exception of letters of credit, it is not our business practice to use off-balance-sheet arrangements, such as third-party special-purpose entities.

38
GUARANTEES USG is party to a variety of agreements under which it may be obligated to indemnify a third party with respect to certain matters. We do not consider the maximum potential amount of future payments that we could be required to make under these agreements to be material.
Legal Contingencies
We are named as defendants in litigation arising from our operations, including claims and lawsuits arising from the operation of our vehicles, product warranties, personal injury and commercial disputes. Two of those cases, which were recently filed in Florida, were brought against L&W Supply seeking unspecified damages for certain drywall L&W Supply sold in Florida in 2006 that was manufactured in China by Knauf Plasterboard (Tianjin) Co. Ltd., also named as a defendant. In those two cases, the plaintiffs allege that the drywall is defective and emits excessive sulfur compounds which have caused, among other things, property damage to the homes in which the drywall was installed.
We have also been notified by state and federal environmental protection agencies of possible involvement as one of numerous “potentially responsible parties” in a number of Superfund sites in the United States. As a potentially responsible party, we may be responsible to pay for some part of the cleanup of hazardous waste at those sites. In most of these sites, our involvement is expected to be minimal. In addition, we are involved in environmental cleanups of other property that we own or owned.
We believe that appropriate reserves have been established for our potential liability in connection with these matters, taking into account the probability of liability, whether our exposure can be reasonably estimated and, if so, our estimate of our liability or the range of our liability. However, we continue to review these accruals as additional information becomes available and revise them as appropriate. We do not expect the environmental matters or any other litigation matters involving USG to have a material adverse effect upon our results of operations, financial position or cash flows. See Note 21 to the Consolidated Financial Statements for additional information regarding litigation matters.
Critical Accounting Policies
Our consolidated financial statements are prepared in conformity with accounting policies generally accepted in the United States of America. The preparation of these financial statements requires management to make estimates, judgments and assumptions that affect the reported amounts of assets, liabilities, revenues and expenses during the periods presented. The following is a summary of the accounting policies we believe are the most important to aid in understanding our financial results.
GOODWILL, OTHER INTANGIBLE ASSETS AND PROPERTY, PLANT AND EQUIPMENT Goodwill: In the fourth quarter of 2008, we recorded goodwill impairment charges of $214 million which were included in goodwill and other intangible asset impairment charges in the 2008 consolidated statement of operations. These charges left a remaining balance of goodwill of $12 million at December 31, 2008, as described in Note 3 to the Consolidated Financial Statements. As a result, we no longer believe that accounting for goodwill impairment represents a critical accounting policy for us.
Other Intangible Assets: We have both indefinite and definite lived other intangible assets. Other intangible assets determined to have indefinite useful lives, primarily comprised of trade names, are not amortized. We perform impairment tests for intangible assets with indefinite useful lives annually, or more frequently if events or circumstances indicate they might be impaired. The impairment test consists of a comparison of the fair value of an intangible asset with its carrying amount. If the carrying amount of an intangible asset exceeds its fair value, an impairment loss is recognized in an amount equal to that excess. An income approach is used for valuing trade names. Assumptions used in the income approach include projected revenues and assumed royalty, long-term growth and discount rates.
39
In 2008, our impairment tests for trade names resulted in $13 million of impairment charges, of which $12 million were included in goodwill and other intangible asset impairment charges in the 2008 consolidated statement of operations. These charges related to our Building Products Distribution segment. The pretax royalty rate of 1.25% was used based on comparable royalty agreements. The long-term growth rate that was applied was 2.5% based on our historical revenue growth. If the long-term growth rate decreased by 0.5%, the fair value of our trade names would have been $1.0 million lower. If the long-term growth rate increased by 0.5%, the fair value of our trade names would have been $1.0 million higher. We applied a discount rate of 15.5% based on our current cost of capital of 14.0% plus an adjustment of 1.5% for risk related to trade name valuation. If the discount rate decreased by 0.5%, the fair value of our trade names would have been $2.2 million higher. If the discount rate increased by 0.5%, the fair value of our trade names would have been $2.1 million lower.
We recorded $3 million of impairment charges related to trade names in 2007.
Other intangible assets with definite lives, primarily comprised of customer relationships, are amortized over their useful lives. Judgment is used in assessing whether the carrying amount is not expected to be recoverable over the assets’ estimated remaining useful lives and whether conditions exist to warrant a revision to the remaining periods of amortization. An asset impairment would be indicated if the sum of the expected future net pretax cash flows from the use of an asset (undiscounted and without interest charges) is less than the carrying amount of the asset. An impairment loss would be measured based on the difference between the fair value of the asset and its carrying value. Customer relationships are currently being amortized over 10 years using annualized attrition rates. We periodically compare the current attrition rate of existing customers with the attrition rates assumed in the initial determination of the useful life to ensure that the useful life is still appropriate. At December 31, 2008, we determined that no impairment of customer relationships existed nor was a revision to the remaining useful life necessary.
Property, Plant and Equipment: We assess our property, plant and equipment for possible impairment in accordance with Statement of Financial Accounting Standards, or SFAS, No. 144, “Accounting for the Impairment or Disposal of Long-Lived Assets,” whenever events or changes in circumstances indicate that the carrying value of the assets may not be recoverable or a revision of remaining useful lives is necessary. Such indicators may include economic and competitive conditions, changes in our business plans or management’s intentions regarding future utilization of the assets or changes in our commodity prices. An asset impairment would be indicated if the sum of the expected future net pretax cash flows from the use of an asset (undiscounted and without interest charges) is less than the carrying amount of the asset. An impairment loss would be measured based on the difference between the fair value of the asset and its carrying value. The determination of fair value is based on an expected present value technique in which multiple cash flow scenarios that reflect a range of possible outcomes and a risk-free rate of interest are used to estimate fair value or on a market appraisal.
Determination as to whether and how much an asset is impaired involves significant management judgment involving highly uncertain matters, including estimating the future success of product lines, future sales volumes, future selling prices and costs, alternative uses for the assets, and estimated proceeds from disposal of the assets. However, the impairment reviews and calculations are based on estimates and assumptions that take into account our business plans and long-term investment decisions.
We regularly evaluate the recoverability of assets idled or at risk of being idled. In most cases, the idled assets are relatively older and higher-cost production plants or lines, which we refer to as facilities, that have relatively low carrying values. The last downturn during which we idled production facilities occurred in 1981 and 1982. At that time, we idled three facilities, all of which were restarted during the subsequent recovery. We consider idled facilities to be unimpaired because we plan to reopen them to meet future demand and the estimated future undiscounted cash flows exceed the carrying values of those facilities. We record impairment charges for facilities that we permanently close. Because we believe that a recovery in the housing and other construction markets that we serve will begin in the next two to three years and result in significantly higher demand than today’s conditions, it is our current intention to restart all facilities that are currently idled. As a result, estimated future undiscounted cash

40
flows for the idled facilities significantly exceed their carrying values.
In 2008, we permanently closed two gypsum wallboard production facilities and one plaster production facility and we temporarily idled four gypsum wallboard production facilities, two paper production facilities and two facilities that produced other products. U.S. Gypsum recorded impairment charges totaling $9 million in 2008 related to the permanent closing of one gypsum wallboard production facility, one plaster production facility and a plant site. The impairment charge for one of the gypsum wallboard production facilities closed in 2008 was recorded in 2007. As of December 31, 2008, the aggregate carrying value of the production facilities permanently closed and temporarily idled in 2008 was $58 million after impairment charges. L&W Supply recorded an impairment charge of $2 million in 2008 related to the closing of 54 distribution centers, most of which were leased properties.
In 2007, we permanently closed one framing products facility and temporarily idled four gypsum wallboard production facilities and one paper production facility. U.S. Gypsum recorded impairment charges totaling $6 million in 2007 related to one gypsum wallboard production facility that was permanently closed in the first quarter of 2008 and the framing products facility. As of December 31, 2008, the aggregate carrying value of the production facilities permanently closed and temporarily idled in 2007 was $22 million after impairment charges.
On a segment basis, most of the closed and idled facilities and impairment charges relate to U.S. Gypsum within the North American Gypsum segment, and U.S. Gypsum’s business is currently generating negative cash flows. As of December 31, 2008, the total carrying value of U.S. Gypsum’s net property, plant and equipment was $1.902 billion.
Our gypsum wallboard business is cyclical in nature and prolonged periods of weak demand or excess supply may have a material adverse effect on our business, financial condition and operating results. This business is also sensitive to changes in general economic conditions, including, in particular, conditions in the North American housing and construction-based markets. The rate of new home construction in the United States declined by approximately 33% in 2008 compared with 2007. This followed a 25% decrease in 2007 compared with 2006.
Currently, there is significant excess wallboard production capacity industry-wide in the United States. Approximately 500 million square feet of additional capacity, net of closures, became operational in the United States in 2008. Industry capacity in the United States was approximately 40 billion square feet in 2008. We and other industry participants announced a number of closures near the end of 2008 that we expect will reduce industry capacity by approximately 3 billion square feet in 2009. We do not expect any new industry capacity will be added in 2009.
The markets that we serve, including in particular the housing and construction-based markets, are affected by the availability of credit, lending practices, the movement of interest rates, the unemployment rate and consumer confidence. Higher interest and unemployment rates and more restrictive lending practices could have a material adverse effect on our businesses, financial condition and results of operations. Our businesses are also affected by a variety of other factors beyond our control, including the inventory of unsold homes, which currently remains at a record level, housing affordability, office vacancy rates and foreign currency exchange rates. Since our operations occur in a variety of geographic markets, our businesses are subject to the economic conditions in each of these geographic markets. General economic downturns or localized downturns in the regions where we have operations may have a material adverse effect on our businesses, financial condition and results of operations.
If the downturn in these markets does not reverse or the downturn is significantly extended, material write-downs or impairment charges may be required. If these conditions were to materialize or worsen, or if there is a fundamental change in the housing market, which individually or collectively lead to a significantly extended downturn or permanent decrease in demand, material impairment charges may be necessary if we permanently close gypsum wallboard production facilities. The magnitude and timing of those charges would be dependent on the severity and duration of the downturn and cannot be determined at this time. Any material cash or noncash impairment charges related to property, plant and equipment would have a material adverse effect on our financial

41
condition and results of operations, but material noncash impairment charges would have no effect on compliance with the financial covenant under our amended and restated secured credit facility or other terms of our outstanding indebtedness.
SHARE-BASED COMPENSATION We account for share-based compensation in accordance with SFAS No. 123(R), “Share-Based Payment.” Under the fair value recognition provisions of this statement, we measure share-based compensation cost at the grant date based on the value of the award, which is recognized as expense over the vesting period. We use the Black-Scholes option valuation model to determine the fair value of USG stock options and stock appreciation rights and a Monte Carlo simulation to determine the fair value of performance shares. Determining the fair value of share-based awards at the grant date requires several assumptions, and a change in these assumptions could impact our share-based compensation expense and our results of operations. These assumptions include the expected volatility of our common stock, the risk-free interest rate, the expected dividend yield on our common stock, the expected option and performance share grant terms and the amount of share-based awards that are expected to be forfeited. If we use different assumptions to value share-based awards granted in future periods, share-based compensation expense and our results of operations could be impacted in future periods. See Note 15 to the Consolidated Financial Statements for additional information.
EMPLOYEE RETIREMENT PLANS We maintain defined benefit pension plans for most of our employees. Most of these plans require employee contributions in order to accrue benefits. We also maintain plans that provide postretirement benefits (retiree health care and life insurance) for eligible employees. For accounting purposes, these plans depend on assumptions made by management, which are used by actuaries we engage to calculate the projected and accumulated benefit obligations and the annual expense recognized for these plans. The assumptions used in developing the required estimates primarily include discount rates, expected return on plan assets for the funded plans, compensation increase rates, retirement rates, mortality rates and, for postretirement benefits, health-care-cost trend rates.
We determined the assumed discount rate based on a hypothetical AA yield curve represented by a series of annualized individual discount rates. Each underlying bond issue is required to have a credit rating of Aa or better by Moody’s Investor Service, Inc. or a credit rating of AA or better by Standard & Poor’s Ratings Services. We consider the underlying types of bonds and our projected cash flows of the plans in evaluating the yield curve selected. The use of a different discount rate would impact net pension and postretirement benefit costs and benefit obligations. In determining the expected return on plan assets, we use a “building block” approach, which incorporates historical experience, our pension plan investment guidelines and expectations for long-term rates of return. The use of a different rate of return would impact net pension costs. A one-half-percentage-point change in the assumed discount rate and return-on-plan-asset rate would have the following effects (dollars in millions):
Increase (Decrease) in 2008 2009 Projected Percentage Net Annual Benefit Assumptions Change Benefit Cost Obligation
Pension Benefits: Discount rate 0.5% increase $(2) $(53) Discount rate 0.5% decrease 4 58 Asset return 0.5% increase (5) - Asset return 0.5% decrease 5 -
Postretirement Benefits: Discount rate 0.5% increase $(1) $(23) Discount rate 0.5% decrease 1 26
Compensation increase rates are based on historical experience and anticipated future management actions.

42
Retirement rates are based primarily on actual plan experience, while standard actuarial tables are used to estimate mortality rates. We developed health-care-cost trend rate assumptions based on historical cost data and an assessment of likely long-term trends.
Results that differ from these assumptions are accumulated and amortized over future periods and, therefore, generally affect the net benefit cost of future periods. The sensitivity of assumptions reflects the impact of changing one assumption at a time and is specific to conditions at the end of 2008. Economic factors and conditions could affect multiple assumptions simultaneously, and the effects of changes in assumptions are not necessarily linear.
See Note 14 to the Consolidated Financial Statements for additional information regarding costs, plan obligations, plan assets and assumptions including the health-care-cost trend rate.
SELF-INSURANCE RESERVES We purchase insurance from third parties for workers’ compensation, automobile, product and general liability claims that exceed certain levels. However, we are responsible for the payment of claims up to those levels. In estimating the obligation associated with incurred and incurred-but-not-reported losses, we use our historical data to project the future development of losses. We monitor and review all estimates and related assumptions for reasonableness. Loss estimates are adjusted based upon actual claims settlements and reported claims.
INCOME TAXES We reduce the recorded amount of our deferred tax assets by a valuation allowance if, based on the weight of available evidence, it is more likely than not that some portion or all of the deferred tax assets will not be realized. We evaluate all available evidence to determine whether, based on the weight of that evidence, a valuation allowance is needed. Information about our current financial position and our results of operations for the current and preceding years is taken into account, supplemented by all currently available information about future years. As of December 31, 2008, we have recorded valuation allowances totaling $166 million with respect to various U.S. federal and state net operating loss and tax credit carryforwards, the substantial majority of which arose from the funding of the asbestos trust in 2006. Under “Realization of Deferred Tax Asset” above, we describe the amount and nature of these carryforwards and our conclusions regarding the need for valuation allowances on the related deferred tax assets. Our conclusions are based in large part on our best available projections of future taxable income. If the estimates and assumptions on which these projections are based change in the future or actual results differ from our projections, we may be required to adjust our valuation allowances. This could result in a charge to, or an increase in, income in the period such determination is made.
In addition, we operate within multiple taxing jurisdictions and are subject to audit in these jurisdictions. We record accruals for the estimated outcomes of these audits, and these accruals may change in the future due to new developments in each matter. In each of the prior two years, we have experienced adjustments to our accruals for the settlement of tax audits as described in Note 16 to the Consolidated Financial Statements. Such adjustments could result in a charge to, or an increase in, income in the period such determination is made.
On January 1, 2007, we adopted Financial Accounting Standards Board, or FASB, Interpretation No. 48, “Accounting for Uncertainty in Income Taxes - an Interpretation of Financial Accounting Standards Board Statement No. 109.” Under this interpretation, we recognize the tax benefits of an uncertain tax position only if those benefits have a greater than 50% likelihood of being sustained upon examination by the relevant taxing authorities. Unrecognized tax benefits are subsequently recognized at the time the more-likely-than-not recognition threshold is met, the tax matter is effectively settled or the statute of limitations for the relevant taxing authority to examine and challenge the tax position has expired, whichever is earlier.
Recent Accounting Pronouncements
In September 2006, the FASB issued SFAS No. 157, “Fair Value Measurements.” This statement defines fair value in generally accepted accounting principles and expands disclosures about fair value measurements that are required
43
or permitted under other accounting pronouncements. This statement is effective for financial statements issued for fiscal years beginning after November 15, 2007 and interim periods within those fiscal years. Our adoption of this statement effective January 1, 2008 had an immaterial impact on our financial statements and we have complied with the disclosure provisions of this statement. We also adopted the deferral provisions of FASB Staff Position, or FSP, SFAS No. 157-2, “Effective Date of FASB Statement No. 157,” which delays the effective date of SFAS No. 157 for all nonrecurring fair value measurements of non-financial assets and liabilities until fiscal years beginning after November 15, 2008. We also adopted FSP SFAS No. 157-3, “Determining the Fair Value of a Financial Asset When the Market for That Asset is Not Active.” This FSP, which provides guidance on measuring the fair value of a financial asset in an inactive market, had no impact on our financial statements (see Note 12 to the Consolidated Financial Statements).
In February 2007, the FASB issued SFAS No. 159, “The Fair Value Option for Financial Assets and Financial Liabilities – Including an Amendment of FASB Statement No. 115.” This statement permits entities to choose to measure many financial instruments and certain other items at fair value. This statement is effective as of the beginning of the first fiscal year beginning after November 15, 2007. Upon our adoption of this statement effective January 1, 2008, we elected not to fair value financial instruments and certain other items under SFAS No. 159. Therefore, this statement had no impact on our financial statements.
In December 2007, the FASB issued SFAS No. 141(R), “Business Combinations.” The objective of this statement is to improve the relevance and comparability of the information that a reporting entity provides in its financial reports about a business combination and its effects. SFAS No. 141(R) presents several significant changes from current accounting practices for business combinations, most notably the following: revised definition of a business; a shift from the purchase method to the acquisition method; expensing of acquisition-related transaction costs; recognition of contingent consideration and contingent assets and liabilities at fair value; and capitalization of acquired in-process research and development. This statement applies prospectively to business combinations for which the acquisition date is on or after the beginning of the first annual reporting period beginning on or after December 15, 2008. We will adopt this statement for acquisitions consummated after its effective date and for deferred tax adjustments for acquisitions completed before its effective date.
In December 2007, the FASB issued SFAS No. 160, “Noncontrolling Interests in Consolidated Financial Statements.” The objective of this statement is to improve the relevance, comparability, and transparency of the financial information that a reporting entity provides in its consolidated financial statements. Under the new standard, noncontrolling interests are to be treated as a separate component of stockholders’ equity, not as a liability or other item outside of stockholders’ equity. The practice of classifying minority interests within the mezzanine section of the balance sheet will be eliminated and the current practice of reporting minority interest expense also will change. The new standard also requires that increases and decreases in the noncontrolling ownership amount be accounted for as equity transactions. This statement is effective for fiscal years, and interim periods within those fiscal years, beginning on or after December 15, 2008. We are currently reviewing this pronouncement to determine the impact, if any, that it may have on our financial statements.
In March 2008, the FASB issued SFAS No. 161, “Disclosures about Derivative Instruments and Hedging Activities,” which amends SFAS No. 133, “Accounting for Derivative Instruments and Hedging Activities.” SFAS No. 161 requires companies with derivative instruments to disclose information that should enable financial statement users to understand how and why a company uses derivative instruments, how derivative instruments and related hedged items are accounted for under SFAS No. 133, and how derivative instruments and related hedged items affect a company’s financial position, financial performance, and cash flows. The required disclosures include the fair value of derivative instruments and their gains or losses in tabular format, information about credit risk related contingent features in derivative agreements, counterparty credit risk, and a company’s strategies and objectives for using derivative instruments. The Statement expands the current disclosure framework in SFAS No. 133. SFAS No. 161 is effective prospectively for periods beginning on or after November 15, 2008. We will comply with the disclosure provisions of this statement after its effective date.
44
In December 2008, the FASB issued FASB Staff Position, or FSP, No. 132(R)-1, “Employers’ Disclosures about Postretirement Benefit Plan Assets.” This FSP amends SFAS 132(R), “Employer’s Disclosures about Pensions and Other Postretirement Benefits,” to require additional disclosures about assets held in an employer’s defined benefit pension or other postretirement plan. This FSP replaces the requirement to disclose the percentage of the fair value of total plan assets for each major category of plan assets, such as equity securities, debt securities, real estate and all other assets, with the fair value of each major asset category as of each annual reporting date for which a financial statement is presented. It also amends SFAS No. 132(R) to require disclosure of the level within the fair value hierarchy in which each major category of plan assets falls, using the guidance in SFAS No. 157, “Fair Value Measurements.” This FSP is applicable to employers that are subject to the disclosure requirements of SFAS No. 132(R) and is generally effective for fiscal years ending after December 15, 2009. We will comply with the disclosure provisions of this FSP after its effective date.
In December 2008, the Emerging Issues Task Force, or EITF, of the FASB issued EITF No. 07-5, “Determining Whether an Instrument (or Embedded Feature) Is Indexed to an Entity’s Own Stock.” Under this pronouncement, companies must evaluate whether an equity-linked financial instrument (or embedded feature) is indexed to its own stock using a two-step approach. Step 1 requires an evaluation of the instrument’s contingent exercise provisions. Step 2 requires the evaluation of the instrument’s settlement provisions. This pronouncement is effective for financial statements issued for fiscal years beginning after December 15, 2008 and interim periods within those fiscal years. We will comply with this pronouncement upon the effective date.
Forward-Looking Statements
This report contains forward-looking statements within the meaning of the Private Securities Litigation Reform Act of 1995 related to management’s expectations about future conditions. Actual business, market or other conditions may differ from management’s expectations and, accordingly, may affect our sales and profitability or other results and liquidity. Actual results may differ due to various other factors, including:
• economic conditions, such as the levels of new home and other construction activity, employment levels, the availability of mortgage, construction and other financing, mortgage and other interest rates, housing affordability and supply, currency exchange rates and consumer confidence;
• capital markets conditions, the availability of borrowings under our credit agreement or other financings;
• competitive conditions, such as price, service and product competition;
• shortages in raw materials;
• changes in raw material, energy, transportation and employee benefit costs;
• the loss of one or more major customers and our customers’ ability to meet their financial obligations to us;
• capacity utilization rates;
• the results of a review by the Congressional Joint Committee on Taxation relating to the tax refund we received related to the payments we made to the asbestos trust;
• our success in integrating acquired businesses;
• changes in laws or regulations, including environmental and safety regulations;
• the effects of acts of terrorism or war upon domestic and international economies and financial markets; and

45
• acts of God.
We assume no obligation to update any forward-looking information contained in this report.

46
Item 7A. QUANTITATIVE AND QUALITATIVE DISCLOSURES ABOUT MARKET RISK
We use derivative instruments from time to time to manage selected commodity price and foreign currency exposures. We do not use derivative instruments for speculative trading purposes. In addition, we use financial instruments, including fixed and variable rate debt, to finance our operations in the normal course of business.
COMMODITY PRICE RISK We use swap contracts to manage our exposure to fluctuations in commodity prices associated with anticipated purchases of natural gas. Generally, we have a majority of our anticipated purchases of natural gas over the next 12 months hedged; however, we review our positions regularly and make adjustments as market and business conditions warrant. A sensitivity analysis was prepared to estimate the potential change in the fair value of our natural gas swap contracts assuming a hypothetical 10% change in market prices. Based on the results of this analysis, which may differ from actual results, the potential change in the fair value of our natural gas swap contracts is $15 million. This analysis does not consider the underlying exposure.
FOREIGN CURRENCY EXCHANGE RISK We have cross-currency swaps and foreign exchange forward agreements in place to hedge changes in the value of intercompany loans to certain foreign subsidiaries due to changes in foreign exchange rates. The notional amount of these hedges is $55 million, and all contracts mature by December 23, 2009. As of December 31, 2008, the fair value of these hedges was a $10 million pretax gain that was recorded to earnings. We also have foreign currency forward agreements to hedge a portion of our net investment in certain foreign subsidiaries. The notional amount of these hedges is $18 million, and all contracts mature by June 8, 2012. As of December 31, 2008, the fair value of these hedges, which was a gain of $2 million, was recorded to accumulated other comprehensive income, or AOCI.
INTEREST RATE RISK As of December 31, 2008, most of our outstanding debt was fixed-rate debt. A sensitivity analysis was prepared to estimate the potential change in interest expense assuming a hypothetical 100 basis-point increase in interest rates. Based on results of this analysis, which may differ from actual results, the potential change in interest expense would be approximately $2 million.
See Notes 1 and 11 to the Consolidated Financial Statements for additional information on our financial exposures.

47
Item 8. FINANCIAL STATEMENTS AND SUPPLEMENTARY DATA
Page CONSOLIDATED FINANCIAL STATEMENTS:
Statements of Operations................................................................................................................. 48 Balance Sheets................................................................................................................................. 49 Statements of Cash Flows................................................................................................................ 50 Statements of Stockholders’ Equity................................................................................................. 51
NOTES TO CONSOLIDATED FINANCIAL STATEMENTS:
1. Significant Accounting Policies.............................................................................................. 52 2. Restructuring and Long-Lived Asset Impairment Charges..................................................... 57 3. Goodwill and Other Intangible Assets.................................................................................... 58 4. Acquisitions............................................................................................................................ 60 5. Earnings Per Share.................................................................................................................. 61 6. Inventories .............................................................................................................................. 62 7. Property, Plant and Equipment ............................................................................................... 62 8. Asset Retirement Obligations ................................................................................................. 62 9. Accrued Expenses................................................................................................................... 63
10. Debt ........................................................................................................................................ 63 11. Derivative Instruments............................................................................................................ 65 12. Fair Value Measurements ....................................................................................................... 66 13. Accumulated Other Comprehensive Income (Loss) ............................................................... 67 14. Employee Retirement Plans.................................................................................................... 67 15. Share-Based Compensation .................................................................................................... 71 16. Income Taxes.......................................................................................................................... 74 17. Segments................................................................................................................................. 78 18. Stockholder Rights Plan ......................................................................................................... 80 19. Equity and Rights Offerings ................................................................................................... 80 20. Commitments and Contingencies ........................................................................................... 81 21. Litigation ................................................................................................................................ 81 22. Resolution of Reorganization Proceedings ............................................................................. 82 23. Quarterly Financial Data (unaudited) ..................................................................................... 84
Report of Independent Registered Public Accounting Firm ................................................................... 85 Schedule II - Valuation and Qualifying Accounts .................................................................................. 86 All other schedules have been omitted because they are not required or applicable or the information is included in the consolidated financial statements or notes thereto.

48
USG CORPORATION CONSOLIDATED STATEMENTS OF OPERATIONS (millions, except per-share data) Years Ended December 31, 2008 2007 2006 Net sales $ 4,608 $ 5,202 $ 5,810 Cost of products sold 4,416 4,601 4,426 Gross profit 192 601 1,384 Selling and administrative expenses 380 408 419 Restructuring and long-lived asset impairment charges 98 26 - Goodwill and other intangible asset impairment charges 226 - - Asbestos claims provision (reversal) - - (44) Chapter 11 reorganization expenses - - 10 Operating profit (loss) (512) 167 999 Interest expense 86 105 555 Interest income (7) (22) (43) Other income, net (10) (4) (3) Earnings (loss) before income taxes (581) 88 490 Income taxes (benefit) (118) 11 193 Net earnings (loss) $ (463) $ 77 $ 297 Earnings (Loss) Per Common Share: Basic $(4.67) $ 0.80 $ 4.47 Diluted $(4.67) $ 0.79 $ 4.46 The notes to consolidated financial statements are an integral part of these statements.

49
USG CORPORATION CONSOLIDATED BALANCE SHEETS (millions, except share data) As of December 31, 2008 2007 Assets Current Assets: Cash and cash equivalents $ 471 $ 297 Restricted cash 1 - Receivables (net of reserves: 2008 - $15; 2007 - $17) 467 430 Inventories 404 431 Income taxes receivable 15 37 Deferred income taxes 68 32 Other current assets 68 57
Total current assets 1,494 1,284 Property, plant and equipment, net 2,562 2,596 Deferred income taxes 374 228 Goodwill 12 226 Other assets 277 320 Total assets $ 4,719 $ 4,654 Liabilities and Stockholders’ Equity Current Liabilities: Accounts payable $ 220 $ 328 Accrued expenses 338 234 Short-term debt 190 - Current portion of long-term debt 4 - Income taxes payable 4 5
Total current liabilities 756 567 Long-term debt 1,642 1,238 Deferred income taxes 7 10 Other liabilities 764 613 Commitments and contingencies Stockholders’ Equity: Preferred stock (000) - $1 par value, $1.80 convertible preferred stock (initial series); authorized 36,000 shares; outstanding - none - - Common stock (000) - $0.10 par value; authorized 200,000 shares; issued: 2008 – 103,972 shares; 2007 – 103,972 shares 10 10 Treasury stock at cost (000) - 2008- 4,793 shares; 2007 – 4,921 shares (199) (204) Capital received in excess of par value 2,625 2,607 Accumulated other comprehensive (loss) income (227) 9 Retained earnings (deficit) (659) (196)
Total stockholders’ equity 1,550 2,226 Total liabilities and stockholders’ equity $ 4,719 $ 4,654 The notes to consolidated financial statements are an integral part of these statements.
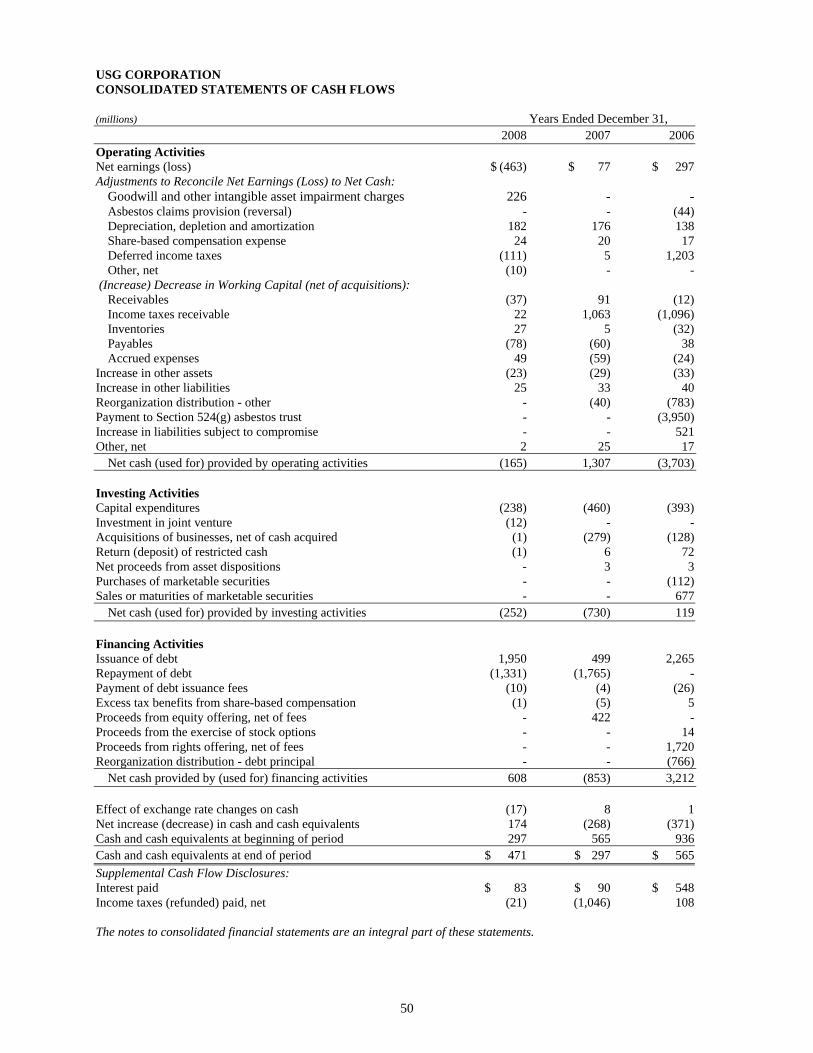
50
USG CORPORATION CONSOLIDATED STATEMENTS OF CASH FLOWS (millions) Years Ended December 31, 2008 2007 2006 Operating Activities Net earnings (loss) $ (463) $ 77 $ 297 Adjustments to Reconcile Net Earnings (Loss) to Net Cash: Goodwill and other intangible asset impairment charges 226 - - Asbestos claims provision (reversal) - - (44) Depreciation, depletion and amortization 182 176 138 Share-based compensation expense 24 20 17 Deferred income taxes (111) 5 1,203 Other, net (10) - - (Increase) Decrease in Working Capital (net of acquisitions):
Receivables (37) 91 (12) Income taxes receivable 22 1,063 (1,096) Inventories 27 5 (32) Payables (78) (60) 38 Accrued expenses 49 (59) (24)
Increase in other assets (23) (29) (33) Increase in other liabilities 25 33 40 Reorganization distribution - other - (40) (783) Payment to Section 524(g) asbestos trust - - (3,950) Increase in liabilities subject to compromise - - 521 Other, net 2 25 17 Net cash (used for) provided by operating activities (165) 1,307 (3,703) Investing Activities Capital expenditures (238) (460) (393) Investment in joint venture (12) - - Acquisitions of businesses, net of cash acquired (1) (279) (128) Return (deposit) of restricted cash (1) 6 72 Net proceeds from asset dispositions - 3 3 Purchases of marketable securities - - (112) Sales or maturities of marketable securities - - 677 Net cash (used for) provided by investing activities (252) (730) 119 Financing Activities Issuance of debt 1,950 499 2,265 Repayment of debt (1,331) (1,765) - Payment of debt issuance fees (10) (4) (26) Excess tax benefits from share-based compensation (1) (5) 5 Proceeds from equity offering, net of fees - 422 - Proceeds from the exercise of stock options - - 14 Proceeds from rights offering, net of fees - - 1,720 Reorganization distribution - debt principal - - (766) Net cash provided by (used for) financing activities 608 (853) 3,212 Effect of exchange rate changes on cash (17) 8 1 Net increase (decrease) in cash and cash equivalents 174 (268) (371) Cash and cash equivalents at beginning of period 297 565 936 Cash and cash equivalents at end of period $ 471 $ 297 $ 565 Supplemental Cash Flow Disclosures: Interest paid $ 83 $ 90 $ 548 Income taxes (refunded) paid, net (21) (1,046) 108 The notes to consolidated financial statements are an integral part of these statements.

51
USG CORPORATION CONSOLIDATED STATEMENTS OF STOCKHOLDERS’ EQUITY Common Capital Accumulated
Shares Treasury Received in Retained Other
Issued Shares Common Treasury Excess of Earnings Comprehensive
(millions, except share data) (000) (000) Stock Stock Par Value (Deficit) Income (Loss) Total
Balance at January 1, 2006, as previously stated
49,985
(5,348)
$5
$(219)
$ 435
$ (595)
$ 72
$ (302)
Impact of adopting change in accounting related to inventory
23
23
Balance at January 1, 2006, as restated 49,985 (5,348) $5 $(219) $ 435 $ (572) $ 72 $ (279) Net earnings 297 297 Foreign currency translation 3 3 Change in fair value of derivatives, net of tax benefit of $56
(86)
(86)
Gain on marketable securities, net of tax of $1
1
1
Minimum pension liability, net of tax benefit of $10
(5)
(5)
Total comprehensive income 210 Adjustment to initially apply SFAS No. 158, net of tax benefit of $97
(121)
(121)
Proceeds from exercise of stock options
309
11
3
14
Rights offering 44,923 4 1,716 1,720 Share-based compensation 17 17 Other (4) 5 5 Balance at December 31, 2006 94,908 (5,043) $9 $(208) $2,176 $ (275) $(136) $1,566 Net earnings 77 77 Foreign currency translation, net of tax benefit of $1
53
53
Change in fair value of derivatives, net of tax of $15
21
21
Change in pension and postretirement benefit plans, net of tax of $48
72
72
Unrealized loss on marketable securities, net of tax benefit of $0.1
(1)
(1)
Total comprehensive income 222 Adoption of new accounting pronouncements, net of tax of $2
2
2
Equity offering 9,064 1 421 422 Share-based compensation 20 20 Stock issuances 122 4 (4) - Other (6) (6) Balance at December 31, 2007 103,972 (4,921) $10 $(204) $2,607 $ (196) $ 9 $2,226 Net loss (463) (463) Foreign currency translation, net of tax benefit of $1
(100)
(100)
Change in fair value of derivatives, net of tax benefit of $20
(30)
(30)
Change in pension and postretirement benefit plans, net of tax benefit of $49
(107)
(107)
Unrealized loss on marketable securities, net of tax of $0.1
1
1
Total comprehensive income (loss) (699) Share-based compensation 24 24 Stock issuances 128 5 (5) - Other (1) (1) Balance at December 31, 2008 103,972 (4,793) $10 $(199) $2,625 $(659) $(227) $1,550
The notes to consolidated financial statements are an integral part of these statements.

52
NOTES TO CONSOLIDATED FINANCIAL STATEMENTS
In the following Notes to Consolidated Financial Statements, “USG,” “we,” “our” and “us” refer to USG Corporation, a Delaware corporation, and its subsidiaries included in the consolidated financial statements, except as otherwise indicated or as the context otherwise requires.
1. Significant Accounting Policies
NATURE OF OPERATIONS USG, through its subsidiaries, is a leading manufacturer and distributor of building materials, producing a wide range of products for use in new residential, new nonresidential, and repair and remodel construction as well as products used in certain industrial processes. Our operations are organized into three reportable segments: North American Gypsum, which manufactures SHEETROCK® brand gypsum wallboard and related products in the United States, Canada and Mexico; Building Products Distribution, which distributes gypsum wallboard, drywall metal, ceilings products, joint compound and other building products throughout the United States; and Worldwide Ceilings, which manufactures ceiling tile in the United States and ceiling grid in the United States, Canada, Europe and the Asia-Pacific region. Our products also are distributed through building materials dealers, home improvement centers and other retailers, specialty wallboard distributors, and contractors.
CONSOLIDATION Our consolidated financial statements include the accounts of USG Corporation and its majority-owned subsidiaries. Entities in which we have more than a 20% but not more than 50% ownership interest are accounted for on the equity basis of accounting and are not material to consolidated operations. All intercompany balances and transactions are eliminated in consolidation.
USE OF ESTIMATES The preparation of our consolidated financial statements in conformity with accounting principles generally accepted in the United States of America requires management to make estimates and assumptions. These estimates and assumptions affect the reported amounts of assets, liabilities, revenues and expenses. Actual results could differ from these estimates.
REVENUE RECOGNITION With the exception of our Building Products Distribution segment, we recognize revenue upon the shipment of products to customers, which is when title and risk of loss are transferred to customers. For Building Products Distribution, revenue is recognized and title and risk of loss are transferred when customers receive products, either through delivery by company trucks or customer pickup. We record provisions for discounts to customers based on the terms of sale in the same period in which the related sales are recorded. We record estimated reductions to revenue for customer programs and incentive offerings, including promotions and other volume-based incentives. With the exception of Building Products Distribution, our products are generally shipped free on board, commonly called FOB, shipping point.
SHIPPING AND HANDLING COSTS Shipping and handling costs are included in cost of products sold.
ADVERTISING Advertising expenses consist of media advertising and related production costs and sponsorships. We charge advertising expenses to earnings as incurred. These expenses amounted to $23 million in 2008, $30 million in 2007 and $29 million in 2006.
RESEARCH AND DEVELOPMENT We charge research and development expenditures to earnings as incurred. These expenditures amounted to $19 million in 2008, $23 million in 2007 and $20 million in 2006.

53
INCOME TAXES We account for income taxes using the asset and liability method. Deferred tax assets and liabilities are recognized for the expected future tax consequences of temporary differences between the carrying amounts and the tax bases of assets and liabilities and for net operating loss carryforwards. Deferred tax assets are evaluated for realizability and a valuation allowance is established if it is more likely than not that some portion or all of the deferred tax assets will not be realized. Tax provisions include estimates of amounts that are currently payable, plus changes in deferred tax assets and liabilities.
INVENTORY VALUATION All of our inventories are stated at the lower of cost or market. Virtually all of our inventories are valued under the average cost method with the remainder valued under the first-in, first-out cost method. Inventories include material, labor and applicable factory overhead costs. Depreciation associated with manufacturing assets is excluded from inventory cost, but is included in cost of products sold.
Prior to the fourth quarter of 2008, we valued our inventories in the United States under the last-in, first-out (LIFO) cost method. As of October 1, 2008, we changed our method of accounting for these inventories from the LIFO method to the average cost method. As of September 30, 2008, the inventories in the United States for which the LIFO method of accounting was applied represented approximately 79% of total gross inventories. We believe that this change is to a preferable method which better reflects the current cost of inventory on our consolidated balance sheets. Additionally, this change conforms virtually all of our worldwide inventories to a consistent inventory costing method and provides better comparability to our peers. We applied this change in accounting principle retrospectively to all prior periods presented herein in accordance with Statement of Financial Accounting Standards, or SFAS, No. 154, “Accounting Changes and Error Corrections.” As a result of this accounting change, our retained earnings (deficit) as of January 1, 2006 decreased to $(572) million using the average cost method from $(595) million as originally reported using the LIFO method for inventories in the United States. The following table summarizes the effect of the accounting change on our consolidated financial statements.
2008 2007 2006 Computed under Effect of As Originally Effect of As Originally Effect of As (millions, except per share data) Prior Method Change Reported Reported Change Adjusted Reported Change Adjusted Statement of Operations for the year ended December 31: Cost of products sold $4,443 $(27) $4,416 $4,603 $ (2) $4,601 $4,440 $ (14) $4,426 Income taxes (benefit) (128) 10 (118) 10 1 11 188 5 193 Net earnings (loss) (480) 17 (463) 76 1 77 288 9 297 Per common share: Basic earnings (loss) (4.84) 0.17 (4.67) 0.78 0.02 0.80 4.34 0.13 4.47 Diluted earnings (loss) (4.84) 0.17 (4.67) 0.78 0.01 0.79 4.33 0.13 4.46 Balance Sheet as of December 31: Inventories 323 81 404 377 54 431 Deferred income taxes 99 (31) 68 53 (21) 32 Retained earnings (deficit) (709) 50 (659) (229) 33 (196) Statement of Cash Flows for the year ended December 31: Net earnings (loss) (480) 17 (463) 76 1 77 288 9 297 Deferred income taxes (121) 10 (111) 4 1 5 1,198 5 1,203 Inventory working capital change 54 (27) 27 7 (2) 5 (18) (14) (32) Net cash (used for) provided by operating activities (165) - (165) 1,307 - 1,307 (3,703) - (3,703)

54
EARNINGS PER SHARE Basic earnings per share are based on the weighted average number of common shares outstanding. Diluted earnings per share are based on the weighted average number of common shares outstanding, the dilutive effect, if any, of restricted stock units, or RSUs, and performance shares and the potential exercise of outstanding stock options and the potential conversion of our 10% contingent convertible senior notes. Average common shares and average diluted common shares outstanding are calculated in accordance with SFAS No. 128, “Earnings Per Share,” and reflect the effect of the rights offering described in Note 19.
CASH AND CASH EQUIVALENTS Cash and cash equivalents consist of highly liquid investments with maturities of three months or less at the time of purchase.
PROPERTY, PLANT AND EQUIPMENT Property, plant and equipment is recorded at cost. We determine provisions for depreciation of property, plant and equipment on a straight-line basis over the expected average useful lives of composite asset groups. We determine estimated useful lives to be 50 years for buildings and improvements, a range of 10 to 25 years for machinery and equipment, and five years for computer software and systems development costs. Leasehold improvements are capitalized and amortized over the shorter of the remaining lease term or remaining economic useful life. We capitalize interest during the active construction period of major capital projects. Capitalized interest is added to the cost of the underlying assets and is amortized over the useful lives of the assets. Facility start-up costs that cannot be capitalized are expensed as incurred and are recorded in cost of products sold. We compute depletion on a basis calculated to spread the cost of gypsum and other applicable resources over the estimated quantities of material recoverable. We review property, plant and equipment for impairment when indicators of a potential impairment are present by comparing the carrying value of the assets with their estimated future undiscounted cash flows or fair value, as appropriate. If we determine an impairment exists, the asset is written down to estimated fair value.
GOODWILL AND OTHER INTANGIBLE ASSETS We review goodwill and other indefinite lived intangible assets annually for impairment or when indicators of a potential impairment are present by comparing asset carrying values to fair values. Historically, we performed our annual impairment test as of May 31 of each year. In the first quarter of 2008, we decided to change our annual impairment testing date from May 31 to October 31 of each year to coincide with the timing of our annual forecasting process and thus allow for the use of more current information in the goodwill and other intangible assets impairment testing. We believe this change in the method of applying an accounting principle is preferable. This change did not result in the delay, acceleration or avoidance of recording an impairment (see Note 3), and we determined that this change did not result in any adjustment to our prior-period consolidated financial statements when applied retroactively. For 2008, so that no more than 12 months would elapse between testing dates, we performed the impairment testing as of May 31 and updated it as of October 31. The impairment testing performed as of May 31, 2008 indicated that no impairment existed as of that date. However, the impairment testing performed as of October 31, 2008 indicated the existence of impairment that resulted in impairment charges in the fourth quarter of 2008. See Note 3 for additional information on the October 31, 2008 impairment testing and impairment charges.
SHARE-BASED COMPENSATION Effective January 1, 2006, we adopted SFAS No. 123(R), “Share-Based Payment,” which requires companies to recognize in the income statement the grant-date fair value of stock options and other equity-based compensation issued to employees.
DERIVATIVE INSTRUMENTS We use derivative instruments to manage selected commodity price and foreign currency exposures. We do not use derivative instruments for speculative trading purposes. All derivative instruments must be recorded on the balance sheet at fair value. For derivatives designated as fair value hedges, the changes in the fair values of both the derivative instrument and the hedged item are recognized in earnings in the current period. For derivatives

55
designated as cash flow hedges, the effective portion of changes in the fair value of the derivative is recorded to accumulated other comprehensive income, or AOCI, and is reclassified to earnings when the underlying transaction has an impact on earnings. The ineffective portion of changes in the fair value of the derivative is reported in cost of products sold. For derivatives designated as net investment hedges, we record changes in value to AOCI. For derivatives not classified as fair value, cash flow or net investment hedges, all changes in market value are recorded to earnings.
Commodity Derivative Instruments: Currently, we are using swap contracts to hedge a major portion of our anticipated purchases of natural gas to be used in our manufacturing operations. Generally, we have a substantial majority of our anticipated purchases of natural gas over the next 12 months hedged; however, we review our positions regularly and make adjustments as market conditions warrant. The current contracts, all of which mature by December 31, 2012, are designated as cash flow hedges.
Foreign Exchange Derivative Instruments: We have operations in a number of countries and use forward contracts and cross-currency swaps from time to time to hedge selected risk of changes in cash flows resulting from forecasted intercompany and third-party sales or purchases, as well as intercompany loans, denominated in non-U.S. currencies, or to hedge selected risk of changes in our net investment in foreign subsidiaries. These contracts are designated as either cash flow hedges or hedges of net investment or are not designated as hedges.
EMBEDDED DERIVATIVES We issued $400 million of 10% contingent convertible senior notes due 2018 in the fourth quarter of 2008. We determined that the notes contained multiple embedded derivatives that were required to be analyzed under SFAS No. 133 and related accounting standards. Except for the embedded derivative described in Note 11, the other embedded derivatives that were identified either were immaterial or did not need to be bifurcated and valued separately. These derivatives are recorded on the consolidated balance sheet at fair value with changes in market value recorded to earnings.
FOREIGN CURRENCY TRANSLATION We translate foreign-currency-denominated assets and liabilities into U.S. dollars at the exchange rates existing as of the respective balance sheet dates. We record translation adjustments resulting from fluctuations in exchange rates to AOCI on our consolidated balance sheets. We translate income and expense items at the average exchange rates during the respective periods. The total transaction (gain) loss was $8 million in 2008, less than $1 million in 2007 and $(2) million in 2006.
RECENT ACCOUNTING PRONOUNCEMENTS In September 2006, the Financial Accounting Standards Board, or FASB, issued SFAS No. 157, “Fair Value Measurements.” This statement defines fair value in generally accepted accounting principles and expands disclosures about fair value measurements that are required or permitted under other accounting pronouncements. This statement is effective for financial statements issued for fiscal years beginning after November 15, 2007 and interim periods within those fiscal years. Our adoption of this statement effective January 1, 2008 had an immaterial impact on our financial statements and we have complied with the disclosure provisions of this statement. We also adopted the deferral provisions of FASB Staff Position, or FSP, SFAS No. 157-2, “Effective Date of FASB Statement No. 157,” which delays the effective date of SFAS No. 157 for all nonrecurring fair value measurements of non-financial assets and liabilities until fiscal years beginning after November 15, 2008. We also adopted FSP SFAS No. 157-3, “Determining the Fair Value of a Financial Asset When the Market for That Asset is Not Active.” This FSP, which provides guidance on measuring the fair value of a financial asset in an inactive market, had no impact on our financial statements (see Note 12 to the Consolidated Financial Statements).
In February 2007, the FASB issued SFAS No. 159, “The Fair Value Option for Financial Assets and Financial Liabilities – Including an Amendment of FASB Statement No. 115.” This statement permits entities to choose to measure many financial instruments and certain other items at fair value. This statement is effective as of the beginning of the first fiscal year beginning after November 15, 2007. Upon our adoption of this statement effective

56
January 1, 2008, we elected not to fair value financial instruments and certain other items under SFAS No. 159. Therefore, this statement had no impact on our financial statements.
In December 2007, the FASB issued SFAS No. 141(R), “Business Combinations.” The objective of this statement is to improve the relevance and comparability of the information that a reporting entity provides in its financial reports about a business combination and its effects. SFAS No. 141(R) presents several significant changes from current accounting practices for business combinations, most notably the following: revised definition of a business; a shift from the purchase method to the acquisition method; expensing of acquisition-related transaction costs; recognition of contingent consideration and contingent assets and liabilities at fair value; and capitalization of acquired in-process research and development. This statement applies prospectively to business combinations for which the acquisition date is on or after the beginning of the first annual reporting period beginning on or after December 15, 2008. We will adopt this statement for acquisitions consummated after its effective date and for deferred tax adjustments for acquisitions completed before its effective date.
In December 2007, the FASB issued SFAS No. 160, “Noncontrolling Interests in Consolidated Financial Statements.” The objective of this statement is to improve the relevance, comparability, and transparency of the financial information that a reporting entity provides in its consolidated financial statements. Under the new standard, noncontrolling interests are to be treated as a separate component of stockholders’ equity, not as a liability or other item outside of stockholders’ equity. The practice of classifying minority interests within the mezzanine section of the balance sheet will be eliminated and the current practice of reporting minority interest expense also will change. The new standard also requires that increases and decreases in the noncontrolling ownership amount be accounted for as equity transactions. This statement is effective for fiscal years, and interim periods within those fiscal years, beginning on or after December 15, 2008. We are currently reviewing this pronouncement to determine the impact, if any, that it may have on our financial statements.
In March 2008, the FASB issued SFAS No. 161, “Disclosures about Derivative Instruments and Hedging Activities,” which amends SFAS No. 133, “Accounting for Derivative Instruments and Hedging Activities.” SFAS No. 161 requires a company with derivative instruments to disclose information that should enable financial statement users to understand how and why the company uses derivative instruments, how derivative instruments and related hedged items are accounted for under SFAS No. 133, and how derivative instruments and related hedged items affect the company’s financial position, financial performance, and cash flows. The required disclosures include the fair value of derivative instruments and their gains or losses in tabular format, information about credit risk related contingent features in derivative agreements, counterparty credit risk, and a company’s strategies and objectives for using derivative instruments. The Statement expands the current disclosure framework in SFAS No. 133. SFAS No. 161 is effective prospectively for periods beginning on or after November 15, 2008. We will comply with the disclosure provisions of this statement after its effective date.
In December 2008, the FASB issued FASB Staff Position, or FSP, No. 132(R)-1, “Employers’ Disclosures about Postretirement Benefit Plan Assets.” This FSP amends SFAS 132(R), “Employer’s Disclosures about Pensions and Other Postretirement Benefits,” to require additional disclosures about assets held in an employer’s defined benefit pension or other postretirement plan. This FSP replaces the requirement to disclose the percentage of the fair value of total plan assets for each major category of plan assets, such as equity securities, debt securities, real estate and all other assets, with the fair value of each major asset category as of each annual reporting date for which a financial statement is presented. It also amends SFAS No. 132(R) to require disclosure of the level within the fair value hierarchy in which each major category of plan assets falls, using the guidance in SFAS No. 157, “Fair Value Measurements.” This FSP is applicable to employers that are subject to the disclosure requirements of SFAS No. 132(R) and is generally effective for fiscal years ending after December 15, 2009. We will comply with the disclosure provisions of this FSP after its effective date.
In December 2008, the Emerging Issues Task Force, or EITF, of the FASB issued EITF No. 07-5, “Determining Whether an Instrument (or Embedded Feature) Is Indexed to an Entity’s Own Stock.” Under this pronouncement, companies must evaluate whether an equity-linked financial instrument (or embedded feature) is indexed to its own

57
stock using a two-step approach. Step 1 requires an evaluation of the instrument’s contingent exercise provisions. Step 2 requires the evaluation of the instrument’s settlement provisions. This pronouncement is effective for financial statements issued for fiscal years beginning after December 15, 2008 and interim periods within those fiscal years. We will comply with this pronouncement upon the effective date.
2. Restructuring and Long-Lived Asset Impairment Charges
In response to adverse market conditions in 2008 and 2007, we implemented restructuring activities that resulted in the restructuring and long-lived asset impairment charges described below in 2008 and 2007.
2008 RESTRUCTURING AND LONG-LIVED ASSET IMPAIRMENT CHARGES In 2008, we recorded restructuring and impairment charges totaling $98 million pretax primarily associated with salaried workforce reductions, the temporary idling or permanent closure of production facilities and the closure of 54 distribution centers. Permanent closures included our gypsum wallboard and plaster production facilities in Boston, Mass., and a gypsum wallboard production facility at Stony Point, N.Y. Temporary idlings included a gypsum wallboard production facility at each of our Plaster City, Calif., Jacksonville, Fla., Baltimore, Md., and Ft. Dodge, Iowa, plants, paper mills in South Gate, Calif., and Gypsum, Ohio, a cement board production facility in Santa Fe Springs, Calif., and a structural cement panel production facility in Delavan, Wis. On a segment basis, $48 million of the total related to North American Gypsum, $34 million to Building Products Distribution, $5 million to Worldwide Ceilings and $11 million to Corporate.
The total charge for severance was $50 million. This charge included $39 million for salaried workforce reductions and $11 million for severance associated with the closure or idling of production facilities and distribution centers. The number of salaried employees terminated and open positions eliminated was approximately 1,400. The number of hourly employees terminated and open positions eliminated was approximately 1,000. Payments totaling $23 million for severance, related benefits and outplacement services were made in 2008. Most of the remaining payments are expected to be made in 2009.
The total charge for lease terminations was $24 million. This charge related to the closure or idling of production facilities, closure of distribution centers and excess leased office space to be sublet. Most of the payments associated with these charges are expected to be made in 2009.
The total charge for asset impairments was $18 million. This charge reflected the write-down of the value of machinery and equipment of the plaster production facility in Boston, Mass., and the gypsum wallboard production facility at Stony Point, N.Y., that were permanently closed. It also included the write-down of leasehold improvements and write-off of receivables and inventory at the closed distribution centers. An impairment charge related to the gypsum wallboard production facility in Boston, Mass., that was permanently closed in the first quarter of 2008 was recorded in 2007, as discussed below.
The total charge for other exit costs related to 2008 restructuring activities was $4 million. This charge primarily related to the clean-up of closed or idled production facilities, cross-training for retained employees and other exit activities. Additional expenses of $2 million were incurred in 2008 for production facilities that were closed in 2007. All payments for these activities were made in 2008.
2007 RESTRUCTURING AND LONG-LIVED ASSET IMPAIRMENT CHARGES In 2007, we recorded restructuring and long-lived asset impairment charges totaling $26 million pretax. These charges included $18 million for salaried workforce reductions and $2 million for severance and other exit costs related to the permanent closure of our framing products plant in Tuscaloosa, Ala., and the temporary idling of the gypsum wallboard production facility at our New Orleans, La., plant and the paper mill at our Jacksonville, Fla., plant. The 2007 charges also included $6 million for long-lived asset impairments. The number of employees terminated and open positions eliminated during 2007 as a result of our salaried workforce reductions was approximately 500. The exit costs primarily reflected severance for approximately 130 employees at the closed or

58
idled production facilities and lease-termination costs for the Tuscaloosa plant. The impairment charges reflected the write-down of the value of machinery and equipment at the Tuscaloosa plant and at our Boston, Mass., gypsum wallboard production facility that we closed in the first quarter of 2008.
On a segment basis, $18 million of the total amount related to North American Gypsum, $2 million to Worldwide Ceilings, $1 million to Building Products Distribution, and $5 million to Corporate. All payments associated with 2007 restructuring activities not made in 2007 were made in 2008.
RESTRUCTURING RESERVE A restructuring reserve of $50 million was included in accrued expenses on the consolidated balance sheet as of December 31, 2008. We expect future payments to be approximately $42 million in 2009, $6 million in 2010 and $2 million after 2010. All restructuring-related payments in 2008 were funded with cash from operations. We expect that the future payments also will be funded with cash from operations. The restructuring reserve is summarized as follows:
Balance 2008 Activity Balance as of Cash Asset as of (millions) 1/1/08 Charges Payments Impairment 12/31/08
2008 Restructuring Activities: Severance $ - $ 50 $ (23) $ - $ 27 Lease terminations - 24 (1) - 23 Asset impairments - 18 - (18) - Other exit costs - 4 (4) - -
Subtotal - 96 (28) (18) 50
2007 Restructuring Activities: Salaried workforce reductions 6 - (6) - - Facility shutdowns 1 2 (3) - -
Subtotal 7 2 (9) - -
Total $ 7 $ 98 $ (37) $ (18) $ 50
3. Goodwill and Other Intangible Assets
In the fourth quarter of 2008, we recorded impairment charges of $226 million pre-tax associated with goodwill and other intangible assets related to L&W Supply Corporation and its subsidiaries, or L&W Supply, the reporting unit that comprises our Building Products Distribution segment, the Latin America reporting unit within our Worldwide Ceilings segment and the USG Mexico S.A de C.V. reporting unit within our North American Gypsum segment. As noted in the goodwill table below, most of the goodwill relates to the Building Products Distribution segment. This charge was measured and recognized following the guidance in SFAS No. 142, “Goodwill and Other Intangible Assets,” or SFAS No. 142, which requires that the carrying value of goodwill and indefinite lived other intangible assets be tested annually for impairment or when indicators of a potential impairment are present.
As part of our annual impairment testing, we identified that an impairment existed. The conditions that contributed to the impairment included our sustained low stock price and reduced market capitalization relative to the book value of our equity, which was adversely affected by generally weak economic conditions, macroeconomic factors impacting industry business conditions, recent and forecasted segment operating performance, the increased competitive environment, and continued tightening of the credit markets, along with other factors, such as a significant decline in housing starts.
Under SFAS No. 142, the measurement of impairment of goodwill consists of two steps. In the first step, we compare the fair value of each reporting unit to its carrying value. As part of our impairment analysis, we determined the fair value of each of our reporting units with goodwill using a combination of the income approach and the

59
market approach. The income approach uses a discounted cash flow methodology to determine fair value. This methodology recognizes value based on the expected receipt of future economic benefits. Key assumptions in the income approach include a free cash flow projection, an estimated discount rate, a long-term growth rate and a terminal value. These assumptions are based upon our historical experience, current market trends and future expectations. The market approach uses the “guideline public company” methodology to determine fair value. This methodology recognizes value by applying valuation multiples of similar companies’ trailing 12-month revenue and earnings before interest, taxes, depreciation and amortization, or EBITDA, adjusted for various performance metrics. Our assessment also considered indicators of potential impairment that have occurred in our business, including declining U.S. residential housing starts, declining gross margins, curtailment of gypsum wallboard operations and closing of distribution centers. Based on this evaluation, we determined that the fair value of each reporting unit was less than its carrying value. Following this assessment, SFAS No. 142 required us to perform a second step in order to determine the implied fair value of goodwill in each reporting unit and to compare it to its carrying value. The activities in the second step included hypothetically valuing all of the tangible and intangible assets of the impaired reporting unit as if the reporting unit had been acquired in a business combination.
We have both indefinite and definite lived other intangible assets. Other intangible assets determined to have indefinite useful lives, primarily comprised of trade names, are not amortized. We perform impairment tests for intangible assets with indefinite useful lives annually, or more frequently if events or circumstances indicate they might be impaired. The impairment test consists of a comparison of the fair value of an intangible asset with its carrying amount. If the carrying amount of an intangible asset exceeds its fair value, an impairment loss is recognized in an amount equal to that excess. An income approach is used for valuing trade names. Assumptions used in the income approach include projected revenues and assumed royalty, long-term growth and discount rates.
As a result of these assessments, we recorded noncash charges of $226 million to goodwill and other intangible asset impairment charges in the consolidated statement of operations. The components of these noncash impairment charges consisted of $214 million of goodwill and $12 million related to trade names. The portion of the charges related to goodwill is shown in the table below by segment. A portion of the charges related to goodwill was not deductible for tax purposes, resulting in a tax benefit of $49 million, or approximately 22% of the pre-tax charges amount.
GOODWILL Changes in the carrying amount of goodwill by segment during 2008 and 2007 were as follows:
North Building American Products Worldwide (millions) Gypsum Distribution Ceilings Total
Balance as of January 1, 2007 $ - $ 154 $ - $ 154 Acquisitions 6 197 - 203 Purchase accounting adjustments - 6 - 6 Transfer between segments - (12) 12 - Transfer to other intangible assets (5) (132) - (137)
Balance as of December 31, 2007 $ 1 $ 213 $ 12 $ 226 Impairment charges (1) (201) (12) (214)
Balance as of December 31, 2008 $ - $ 12 $ - $ 12
Goodwill increased $72 million in 2007 primarily as a result of the acquisitions of California Wholesale Material Supply, Inc. and related entities, referred to collectively as CALPLY, by L&W Supply and the assets of Grupo Supremo by USG Mexico. See Note 4 for information related to these acquisitions.
OTHER INTANGIBLE ASSETS Other intangible assets, which are included in long-term other assets on the consolidated balance sheets, are summarized as follows:

60
As of December 31, 2008 As of December 31, 2007 Gross Gross Carrying Impairment Accumulated Carrying Impairment Accumulated (millions) Amount Charges Amortization Net Amount Charges Amortization Net
Amortized Intangible Assets: Customer relationships $ 70 $ - $ (13) $ 57 $ 70 $ - $ (6) $ 64 Other 9 - (3) 6 10 - (2) 8
Total 79 - (16) 63 80 - (8) 72
Unamortized Intangible Assets: Trade names 66 (13) - 53 69 (3) - 66 Other 9 - - 9 8 - - 8
Total 75 (13) - 62 77 (3) - 74
Total Other Intangible Assets $ 154 $ (13) $ (16) $ 125 $ 157 $ (3) $ (8) $ 146 Intangible assets with definite lives are amortized and those with indefinite lives are not amortized. The weighted-average amortization periods are 10 years for customer relationships and 12 years for other intangible assets with definite lives. Total amortization expense was $8 million in 2008 and $7 million in 2007. The amount in 2006 was immaterial. Estimated annual amortization expense for other intangible assets is $8 million for each of the years 2009 and 2010 and $7 million for each of the years 2011 through 2013.
In 2007 and 2008, we determined that certain trade names used in our L&W Supply business were impaired. In 2008, we recorded $13 million of impairment charges, of which $12 million was recorded to goodwill and other intangible asset impairment charges in the 2008 consolidated statement of operations. We recorded $3 million of impairment charges in 2007.
4. Acquisitions
We record acquisitions using the purchase method of accounting and include the results of operations of the businesses acquired in our consolidated results as of the date of acquisition. We allocate the purchase price of acquisitions to the tangible assets, liabilities and intangible assets acquired based on fair values. The excess purchase price over those fair values is recorded as goodwill. The fair value assigned to assets acquired is based on valuations using management’s estimates and assumptions. Pro forma combined results of operations for the 2007 and 2006 periods would not be materially different as a result of the acquisitions described below and, therefore, are not presented.
2007 ACQUISITIONS California Wholesale Material Supply, Inc.: On March 30, 2007, L&W Supply purchased the outstanding stock of CALPLY for approximately $268 million. This amount included debt repaid at closing and acquisition-related expenses and was net of CALPLY’s cash at closing. CALPLY sold building products and provided services to acoustical contractors, drywall contractors, plaster contractors, roofing companies, manufactured housing companies, countertop fabricators, government institutions and exporters from 20 locations in six Western states as of December 31, 2008.
During the first quarter of 2008, we finalized the allocation of the purchase price for this acquisition. The final allocation of the purchase price for CALPLY, which reflects a third quarter tax adjustment of $2 million to goodwill, is summarized below:

61
(millions)
Cash $ 4 Accounts receivable 73 Inventories 37 Property, plant and equipment 6 Goodwill 82 Other intangible assets 115 Other assets acquired 8
Total assets acquired 325 Total liabilities assumed 53
Total net assets acquired $ 272
The amount shown for other intangible assets consists principally of $58 million related to customer relationships, which is amortizable over 10 years, and $56 million related to trade names, which have an indefinite life.
Grupo Supremo: On March 28, 2007, USG Mexico, S.A. de C.V., or USG Mexico, an indirect, wholly owned subsidiary of USG Corporation, purchased the assets of Grupo Supremo, located in the central north region of Mexico, whose businesses included extracting gypsum rock from several mines and manufacturing plaster products. The total purchase price was approximately $12 million including acquisition-related expenses. Of this amount, $6 million was allocated to intangible assets subject to amortization over periods of 10 to 20 years.
5. Earnings Per Share
The reconciliation of basic earnings per share to diluted earnings per share is shown in the following table:
Weighted Net Average (millions, except Earnings Shares Per-Share share data) (Loss) (000) Amount
2008: Basic loss $ (463) 99,100 $ (4.67)
Diluted loss $ (463) 99,100 $ (4.67)
2007: Basic earnings $ 77 97,088 $ 0.80 Dilutive effect of stock options 215
Diluted earnings $ 77 97,303 $ 0.79
2006: Basic earnings $ 297 66,476 $ 4.47 Dilutive effect of stock options 87
Diluted earnings $ 297 66,563 $ 4.46
The diluted loss per share in 2008 was computed using the weighted average number of common shares outstanding during the year.
Net earnings and earnings-per-share information for 2007 and 2006 has been retrospectively adjusted for our change in 2008 from the LIFO method of inventory accounting to the average cost method. See Note 1 for information on this change in accounting principle.
The approximately 35.1 million shares issuable upon conversion of the $400 million of 10% contingent convertible senior notes we issued in 2008 at the initial conversion price of $11.40 per share were not included in the

62
computation of the diluted loss per share for 2008 because their inclusion was anti-dilutive. Stock options, RSUs and performance shares with respect to 3.3 million common shares and 1.6 million common shares were not included in the computation of diluted (loss) earnings per share for 2008 and 2007, respectively, because they were anti-dilutive. Stock options and RSUs with respect to 1.5 million common shares were not included in the computation of diluted earnings per share for 2006 because they were anti-dilutive.
6. Inventories Inventories as of December 31 consisted of the following: (millions) 2008 2007 Finished goods and work in progress $ 312 $ 339 Raw materials 92 92
Total $ 404 $ 431
Inventory information for 2007 has been retrospectively adjusted for our change in 2008 from the LIFO method of inventory accounting to the average cost method. See Note 1 for information on this change in accounting principle.
7. Property, Plant and Equipment
Property, plant and equipment as of December 31 consisted of the following:
(millions) 2008 2007
Land and mineral deposits $ 136 $ 146 Buildings and improvements 1,133 1,078 Machinery and equipment 2,661 2,621
3,930 3,845 Reserves for depreciation and depletion (1,368) (1,249)
Total $ 2,562 $ 2,596
Capitalized interest was $19 million in 2008 and $15 million in 2007.
8. Asset Retirement Obligations
Changes in our liability for asset retirement obligations during 2008 and 2007 consisted of the following:
(millions) 2008 2007
Balance as of January 1 $ 85 $ 78 Accretion expense 5 5 Liabilities incurred 3 1 Liabilities settled - (1) Retirements (1) - Foreign currency translation (3) 2
Balance as of December 31 $ 89 $ 85
Our asset retirement obligations include reclamation requirements as regulated by government authorities related principally to assets such as our mines, quarries, landfills, ponds and wells. The accounting for asset retirement obligations requires estimates by management about the timing of asset retirements, the cost of retirement obligations, discount and inflation rates used in determining fair values and the methods of remediation associated

63
with our asset retirement obligations. We generally use assumptions and estimates that reflect the most likely remediation method on a site-by-site basis.
Asset retirement obligations are included in other liabilities on the consolidated balance sheets.
9. Accrued Expenses
Accrued expenses as of December 31 consisted of the following:
(millions) 2008 2007
Employee compensation $ 49 $ 51 Self-insurance reserves 58 56 Restructuring 50 7 Derivatives 45 7 Other 136 113
Total $ 338 $ 234
10. Debt
Total debt as of December 31 consisted of the following:
(millions) 2008 2007
6.3% senior notes $ 500 $ 500 7.75% senior notes, net of discount 499 499 10% contingent convertible senior notes, net of discount 379 - Revolving credit facility 190 - Ship mortgage facility 29 - Industrial revenue bonds 239 239
Total $ 1,836 $ 1,238
CREDIT FACILITY In 2006, we entered into a credit agreement with a syndicate of banks. JPMorgan Chase Bank, N.A. serves as administrative agent under the agreement. The credit agreement was amended and restated in July 2007 and amended further in February 2008. In January 2009, the credit agreement was again amended and restated in order to convert it into a secured facility that allowed us to remove most of the restrictive financial covenants contained in the prior unsecured facility. The credit agreement currently is secured by the trade receivables and inventory of USG and its significant domestic subsidiaries and allows for revolving loans and letters of credit (up to $250 million, in aggregate) in an aggregate principal amount not to exceed the lesser of (i) $500 million and (ii) a borrowing base determined by reference to the trade receivables and inventory of USG and its significant domestic subsidiaries. This facility is available to fund working capital needs and for other general corporate purposes. Borrowings under the credit facility bear interest at a floating rate based upon an alternate base rate or, at our option, at adjusted LIBOR plus 3.00%. We are also required to pay annual facility fees of 0.75% on the entire facility, whether drawn or undrawn, and fees on outstanding letters of credit. We have the ability to repay amounts outstanding under the credit agreement at any time without prepayment premium or penalty. The credit facility matures on August 2, 2012.
The credit agreement contains a single financial covenant that would require us to maintain a minimum fixed charge coverage ratio of 1.1 to 1.0 if and for so long as the excess of the borrowing base over the outstanding borrowings under the credit agreement is less than $75 million. Because we do not currently satisfy the required fixed charge coverage ratio, we must maintain borrowing availability of at least $75 million under the credit facility. The credit agreement contains other covenants and events of default that are customary for similar agreements and may limit our ability to take various actions. Our significant domestic subsidiaries have guaranteed our obligations
64
under the credit agreement.
Taking into account the most recent borrowing base calculation delivered under the credit facility which reflects trade receivables and inventory as of December 31, 2008, outstanding letters of credit and the $75 million availability requirement for the fixed charge coverage ratio not to apply, borrowings available under the credit facility are approximately $200 million.
In connection with amending and restating the credit agreement in January 2009, we terminated the $170 million secured credit agreement that we entered into in the third quarter of 2008. There were no borrowings under this facility as of December 31, 2008, or at the time of its termination.
As of December 31, 2008, we had outstanding borrowings of $190 million and outstanding letters of credit of $80 million. The $190 million of borrowings were classified as short-term debt on our December 31, 2008 consolidated balance sheet and were repaid in January 2009. The weighted average interest rate for borrowings under the facility during 2008 was 4.3%.
CONTINGENT CONVERTIBLE SENIOR NOTES In November 2008, we completed the private placement of $400 million aggregate principal amount of 10% contingent convertible senior notes due 2018 that are recorded on the consolidated balance sheet at $379 million, which is net of debt discount of $21 million as a result of the embedded derivative discussed in Note 11. The notes bear cash interest at the rate of 10% per year until maturity, redemption or conversion. Pursuant to rules of the New York Stock Exchange, on which our common stock is listed, the issuance of shares of our common stock upon conversion of the notes required approval of our stockholders. On February 9, 2009, our stockholders approved the issuance of shares of our common stock upon conversion of the notes. If our stockholders had not given that approval, the interest rate on the notes would have increased to 20%. The notes are initially convertible into 87.7193 shares of our common stock per $1,000 principal amount of notes, which is equivalent to an initial conversion price of $11.40 per share. The notes contain anti-dilutive provisions that are customary for convertible notes issued in transactions similar to that in which the notes were issued. The notes mature on December 1, 2018 and are not callable until December 1, 2013, after which we may elect to redeem all or part of the notes at stated redemption prices, plus accrued and unpaid interest.
The notes are senior unsecured obligations and rank equally with all of our other existing and future unsecured senior indebtedness. The indenture governing the notes contains events of default, covenants and restrictions that are customary for similar transactions, including a limitation on our ability and the ability of certain of our subsidiaries to create or incur secured indebtedness. The notes also contain a provision requiring us to offer to purchase the notes at a premium of 105% of their principal amount (plus accrued and unpaid interest) in the event of a change in control or the termination of trading of our common stock on a national securities exchange.
SENIOR NOTES We have $500 million of 7.75% senior notes due 2018 that are recorded on the consolidated balance sheet at $499 million, which is net of debt discount of $1 million. The interest rate payable on these notes is subject to adjustment from time to time by up to 2% in the aggregate if the debt ratings assigned to the notes decrease or thereafter increase. At our current credit ratings, the interest rate on these notes is 9.25%. We also have $500 million of 6.3% senior notes due 2016.
The 7.75% senior notes and the 6.3% senior notes are senior unsecured obligations and rank equally with all of our other existing and future unsecured senior indebtedness. The indentures governing the notes contain events of default, covenants and restrictions that are customary for similar transactions, including a limitation on our ability and the ability of certain of our subsidiaries to create or incur secured indebtedness. The notes also contain a provision requiring us to offer to purchase the notes at a premium of 101% of their principal amount (plus accrued and unpaid interest) in the event of a change in control and a rating on the notes at below investment grade by both Moody’s Investor Services Inc. and Standard & Poor’s Ratings Services.

65
SHIP MORTGAGE FACILITY In October 2008, our subsidiary, Gypsum Transportation Limited, or GTL, entered into a secured loan facility agreement with DVB Bank SE, as lender, agent and security trustee. The secured loan facility agreement provides for two separate advances to GTL in amounts not exceeding (1) the lesser of $40 million and 50% of the market value of GTL’s ship, the Gypsum Centennial (“Tranche A”), and (2) the lesser of $50 million and 50% of the market value of GTL’s ship, the Gypsum Integrity, that is currently under construction and expected to be delivered in March 2009 (“Tranche B”). As of December 31, 2008, the outstanding loan balance drawn under Tranche A of the ship mortgage facility was $29 million, of which $4 million was classified as short-term debt on our consolidated balance sheet. Tranche B may be drawn until March 31, 2009 following delivery of the Gypsum Integrity to GTL.
Advances under the secured loan facility bear interest at a floating rate based on LIBOR plus a margin of 1.65%. The interest rate as of December 31, 2008 was 6.3%. Tranche A and Tranche B are each repayable in quarterly installments in amounts determined in accordance with the secured loan facility agreement beginning three months after advance of that Tranche, with the balance repayable eight years after the date of advance of that Tranche. The secured loan facility agreement contains affirmative and negative covenants affecting GTL, including financial covenants requiring it to maintain or not exceed specified levels of net worth, borrowings to net worth, cash reserves and EBITDA to debt service. The secured loan facility agreement also contains certain customary events of default.
In connection with the advance of Tranche A, GTL granted DVB Bank SE a security interest in the Gypsum Centennial and related insurance, contract, account and other rights as security for borrowings under the secured loan facility. GTL will enter into similar agreements with respect to the Gypsum Integrity in connection with the advance of Tranche B.
INDUSTRIAL REVENUE BONDS Our $239 million of industrial revenue bonds have fixed interest rates ranging from 5.5% to 6.4%. The weighted average rate of interest on our industrial revenue bonds is 5.875%. The average maturity of these bonds is 22 years.
OTHER INFORMATION The fair market value of our debt was $1.407 billion as of December 31, 2008 and $1.183 billion as of December 31, 2007. The fair market values were based on quoted market prices or, where quoted market prices were not available, on instruments with similar terms and maturities or internal valuation models. Excluding the $190 million of borrowings on the revolving credit facility as of December 31, 2008 that we repaid in January 2009, the amounts of total debt outstanding as of December 31, 2008 maturing during the next five years and beyond were: $4 million in each year 2009 through 2012, $2 million in 2013 and $1.65 billion after 2013.
11. Derivative Instruments
COMMODITY DERIVATIVE INSTRUMENTS As of December 31, 2008, we had swap contracts to exchange monthly payments on notional amounts of natural gas amounting to $185 million. As of December 31, 2008, the fair value of these swap contracts, which remained in AOCI, was a $62 million unrealized loss. These swap contracts are designated as cash flow hedges and had no ineffectiveness for 2008. Additionally, there were no gains or losses reclassified into earnings as a result of the discontinuance of cash flow hedges because the forecasted transactions were not probable of occurring.
FOREIGN EXCHANGE DERIVATIVE INSTRUMENTS We have cross-currency swaps and foreign exchange forward agreements in place to hedge changes in the value of intercompany loans to certain foreign subsidiaries due to changes in foreign exchange rates. The notional amount of these hedges is $55 million, and all contracts mature by December 23, 2009. As of December 31, 2008, the fair value of these hedges was a $10 million pretax gain that was recorded to earnings. We also have foreign currency forward agreements to hedge a portion of our net investment in certain foreign subsidiaries. The notional amount of these hedges is $18 million, and all contracts mature by June 8, 2012. As of December 31, 2008, the fair value of these hedges, which remained in AOCI, was a $2 million unrealized gain.
66
EMBEDDED DERIVATIVE INSTRUMENTS We issued $400 million of 10% contingent convertible senior notes due 2018 in the fourth quarter of 2008. We determined that the notes contained multiple embedded derivatives that were required to be analyzed under SFAS No. 133 and related accounting standards. Except for the embedded derivative described below, the other embedded derivatives that were identified either were immaterial or did not need to be bifurcated and valued separately.
The notes bear interest at the rate of 10% per year. If, however, our stockholders had not approved the issuance of shares of our common stock upon conversion of the notes within 135 days from the date of issuance of the notes, the interest rate on the notes would have increased to 20% per annum. This interest rate increase feature was evaluated under the criteria of SFAS No. 133 and related accounting standards and was determined to be an embedded derivative that was required to be bifurcated and valued separately as of November 26, 2008, the date of issuance of the notes. The fair value of this embedded derivative was determined to be $21 million on the issuance date of the notes. This amount was recorded as a current liability and as a reduction to the initial carrying amount of the notes that will be amortized to interest expense over the life of the notes using the effective interest rate method. As of December 31, 2008, the fair value of this embedded derivative liability was $10 million and the $11 million change in value was recorded as income in other income, net in the fourth quarter. As a result of the approval of the conversion feature of the notes by our stockholders on February 9, 2009, the remaining $10 million liability will be reversed to income in other income, net in the first quarter of 2009.
COUNTERPARTY RISK We use derivatives to hedge a portion of our exposures with respect to commodity price risk, foreign exchange risk, or interest rate risk. These derivatives are governed by master netting agreements negotiated between us and our counterparties. The agreements outline the conditions upon which the counterparties are required to post collateral (primarily driven by credit ratings and derivative market values). Based on the market values of our derivatives by counterparty and our credit rating, we were required to provide $43 million of collateral to our counterparties as of December 31, 2008.
We have not adopted an accounting policy to offset fair value amounts related to derivative contracts under our master netting arrangements, as permitted by FASB Interpretation No. 39 “Offsetting of Amounts Related to Certain Contracts.” As a result, amounts paid as cash collateral are included in receivables on our consolidated balance sheets.
12. Fair Value Measurements
Effective January 1, 2008, we adopted SFAS No. 157, “Fair Value Measurements,” which provides a framework for measuring fair value under accounting principles generally accepted in the United States of America. The adoption of this statement had an immaterial impact on our financial statements. We also adopted the deferral provisions of FSP SFAS No. 157-2, which delays the effective date of SFAS No. 157 for all nonrecurring fair value measurements of non-financial assets and liabilities until fiscal years beginning after November 15, 2008.
Fair value is defined as the exchange price that would be received for an asset or paid to transfer a liability (an exit price) in the principal or most advantageous market for the asset or liability in an orderly transaction between market participants on the measurement date. SFAS No. 157 also expands disclosures about instruments measured at fair value and establishes a fair value hierarchy which requires an entity to maximize the use of observable inputs and minimize the use of unobservable inputs when measuring fair value. The standard describes three levels of inputs that may be used to measure fair value:
• Level 1 – Quoted prices for identical assets and liabilities in active markets;
• Level 2 – Quoted prices for similar assets and liabilities in active markets; quoted prices for identical or similar assets and liabilities in markets that are not active; and model-derived valuations in which all significant inputs and significant value drivers are observable in active markets; and

67
• Level 3 – Valuations derived from valuation techniques in which one or more significant inputs or significant value drivers are unobservable.
When valuing our derivative portfolio, we primarily use readily observable market data in conjunction with internally developed valuation models and, consequently, we designate most of our derivatives as Level 2. The Level 3 derivative shown below represents the interest rate increase embedded derivative we identified in connection with the issuance of $400 million of 10% contingent convertible senior notes due 2018 in the fourth quarter of 2008. We had no Level 3 derivatives prior to the fourth quarter. As of December 31, 2008, our assets and liabilities measured at fair value on a recurring basis were as follows:
Quoted Prices in Active Significant Markets for Other Significant As of Identical Observable Unobservable December 31, Assets Inputs Inputs (millions) 2008 (Level 1) (Level 2) (Level 3)
Derivative assets $ 8 $ - $ 8 $ - Derivative liabilities (65) - (55) (10)
Upon issuance of the 10% contingent convertible senior notes, the fair value of the embedded derivative was determined to be $21 million. As of December 31, 2008, the fair value of this embedded derivative liability was $10 million and the $11 million change in value was recorded as income in other income, net in the fourth quarter. Changes in the fair value of this liability are generally related to our stock price performance and volatility, the passage of time and changes in interest rates.
13. Accumulated Other Comprehensive Income (Loss)
AOCI as of December 31 consisted of the following:
(millions) 2008 2007
Foreign currency translation, net of tax $ (23) $ 77 Loss on derivatives, net of tax (35) (5) Unrecognized loss on pension and postretirement benefit plans, net of tax (169) (62) Unrealized loss on marketable securities, net of tax - (1)
Total $ (227) $ 9
Reclassifications of net after-tax gains or losses from AOCI to earnings during 2008 were as follows:
(millions) 2008
Gain on derivatives, net of tax of $5 million $ 7 Gain on unrecognized pension and postretirement benefit costs, net of tax of $1 million 1
Total $ 8
We estimate that we will reclassify a net $28 million after-tax loss on derivatives from AOCI to earnings within the next 12 months.
14. Employee Retirement Plans
We maintain defined benefit pension plans for most of our employees. Most of these plans require employee contributions in order to accrue benefits. Benefits payable under the plans are based on employees’ years of service and compensation during specified years of employment.

68
We also maintain plans that provide postretirement benefits (retiree health care and life insurance) for eligible employees. Employees hired before January 1, 2002 generally become eligible for the postretirement benefit plans when they meet minimum retirement age and service requirements. The cost of providing most postretirement benefits is shared with retirees.
The components of net pension and postretirement benefits costs are summarized in the following table:
(millions) 2008 2007 2006
Pension Benefits: Service cost of benefits earned $ 34 $ 40 $ 39 Interest cost on projected benefit obligation 69 67 62 Expected return on plan assets (77) (73) (63) Net amortization 8 12 18
Net pension cost $ 34 $ 46 $ 56
Postretirement Benefits: Service cost of benefits earned $ 14 $ 15 $ 15 Interest cost on projected benefit obligation 26 24 21 Net amortization (8) (3) (2)
Net postretirement cost $ 32 $ 36 $ 34
We use a December 31 measurement date for our plans. The accumulated benefit obligation, or ABO, for the defined benefit pension plans was $881 million as of December 31, 2008 and $886 million as of December 31, 2007. The following table summarizes projected pension and accumulated postretirement benefit obligations, plan assets and funded status as of December 31:
Pension Postretirement (millions) 2008 2007 2008 2007 Change in Benefit Obligation: Benefit obligation as of January 1 $ 1,125 $ 1,142 $ 411 $ 416 Service cost 34 40 14 15 Interest cost 69 67 26 24 Participant contributions 12 14 5 5 Benefits paid (99) (83) (19) (17) Medicare Part D subsidy receipts - - 2 3 Plan amendment 3 (1) (29) - Actuarial gain (132) (83) (53) (40) Foreign currency translation (37) 29 (6) 5
Benefit obligation as of December 31 $ 975 $ 1,125 $ 351 $ 411
Change in Plan Assets: Fair value as of January 1 $ 1,152 $ 1,057 $ - $ - Actual return on plan assets (299) 68 - - Employer contributions 22 67 14 12 Participant contributions 12 14 5 5 Benefits paid (99) (83) (19) (17) Foreign currency translation (38) 29 - -
Fair value as of December 31 $ 750 $ 1,152 $ - $ -
Funded status $ (225) $ $27 $ (351) $ (411)

69
Pension Postretirement (millions) 2008 2007 2008 2007 Components on the Consolidated Balance Sheets: Noncurrent assets $ 10 $ 64 $ - $ - Current liabilities (2) (1) (16) (13) Noncurrent liabilities (233) (36) (335) (398)
Net asset (liability) as of December 31 $ (225) $ 27 $ (351) $ (411)
Pretax Components in AOCI: Net actuarial loss $ 326 $ 94 $ 7 $ 65 Prior service cost (credit) 13 13 (73) (56) Net transition obligation - 1 - -
Total as of December 31 $ 339 $ 108 $ (66) $ 9
For the defined benefit pension plans, we estimate that during the 2009 fiscal year we will amortize from AOCI into net pension cost a net actuarial loss of $1 million and prior service cost of $2 million. For the postretirement benefit plans, we estimate that during the 2009 fiscal year we will amortize from AOCI into net postretirement cost prior service credit of $9 million.
ASSUMPTIONS The following tables reflect the assumptions used in the accounting for our plans:
Pension Postretirement 2008 2007 2008 2007 Weighted-average assumptions used to determine benefit obligations as of December 31: Discount rate 6.85% 6.55% 6.85% 6.65% Compensation increase rate 3.50% 4.00% - -
Weighted-average assumptions used to determine net cost for years ended December 31: Discount rate 6.55% 5.90% 6.65% 5.95% Expected return on plan assets 7.00% 7.00% - - Compensation increase rate 4.00% 4.00% - -
The assumed health-care-cost trend rates used to measure the postretirement plans’ obligations as of December 31 were as follows:
2008 2007
Health-care-cost trend rate assumed for next year 7.95% 8.65% Rate to which the cost trend rate is assumed to decline (the ultimate trend rate) 5.25% 5.25% Year that the rate reaches the ultimate trend rate 2013 2013
A one-percentage-point change in the assumed health-care-cost trend rate for the postretirement plans would have the following effects:
One-Percentage- One-Percentage- (millions) Point Increase Point Decrease
Effect on total service and interest cost $ 6 $ (5) Effect on postretirement benefit obligation 54 (43)
We established our assumption for the expected long-term rate of return on plan assets for our pension plans by

70
using a “building block” approach. In this approach, we estimate ranges of long-term expected returns for the various asset classes in which the plans invest. Our estimated ranges are primarily based upon observations of historical asset returns and their historical volatility. In determining expected returns, we also consider consensus estimates of certain market and economic factors that influence returns such as inflation, gross domestic product growth and dividend yields. We then calculate an overall range of likely expected rates of return by applying the expected returns to the plans’ target asset allocation. We determine the most likely rate of return and adjust it for investment management fees.
PLAN ASSETS Our pension plans’ asset allocations by asset categories as of December 31 were as follows:
Asset Categories: 2008 2007
Equity securities 54% 68% Debt securities 27% 20% Other 19% 12%
Total 100% 100%
We established our investment policies and strategies for the pension plans’ assets with a goal of maintaining fully funded plans (on an ABO basis) and maximizing returns on the plans’ assets while prudently considering the plans’ tolerance for risk. Factors influencing the level of risk assumed include the demographics of the plans’ participants, the liquidity requirements of the plans and our financial condition. Based upon these factors, we determined that our plans can tolerate a moderate level of risk.
To maximize long-term returns, we invest our plans’ assets primarily in a diversified mix of equity and debt securities. The portfolio of equity securities includes both foreign and domestic stocks representing a range of investment styles and market capitalizations. Investments in domestic and foreign equities and debt securities are actively and passively managed. Other assets are managed by investment managers using strategies with returns normally expected to have a low correlation to the returns of equities. As of December 31, 2008, the plans’ target asset allocation percentages were 61% for equity securities, 23% for debt securities and 16% for other assets. The actual allocation to equity securities was notably below the target allocation at year end due to the significant declines in equity asset valuations in 2008 relative to the valuations of other asset classes. Conversely, the allocations to debt and other investments were above their targeted allocation as their valuations were relatively stronger than equity valuations. We expect actual asset allocations to be more in line with targeted levels as equity market values recover and the portfolio is rebalanced toward target levels.
We monitor investment risk on an ongoing basis, in part through the use of quarterly investment portfolio reviews, compliance reporting by investment managers, and periodic asset/liability studies and reviews of the plan’s funded status.
CASH FLOWS
For 2009, our defined benefit pension plans have no minimum funding requirements under the Employee Retirement Income Security Act of 1974, or ERISA. We are evaluating our level of funding for pension plans and currently estimate that we will contribute approximately $34 million to $46 million of cash to our pension plans in 2009. Total benefit payments we expect to pay to participants, which include payments funded from USG’s assets as well as payments from our pension plans and the Medicare subsidy we expect to receive, are as follows (in millions):
71
Health-Care Years ended Pension Postretirement Subsidy December 31 Benefits Benefits Receipts
2009 $ 82 $ 16 $ (2) 2010 55 17 (2) 2011 54 18 (2) 2012 54 19 (3) 2013 78 20 (3) 2014 – 2018 442 121 (16) 15. Share-Based Compensation
We grant share-based compensation to eligible participants under our Long-Term Incentive Plan, or LTIP. The LTIP was approved by our Board of Directors and stockholders in 2006. A total of 8.2 million shares of common stock were authorized for grants under the LTIP, of which 4.9 million shares were reserved for future grants as of December 31, 2008. The LTIP authorizes the Board, or the Board’s Compensation and Organization Committee, to provide equity-based compensation in the form of stock options, stock appreciation rights, or SARs, restricted stock, RSUs, performance shares and units, and other cash and share-based awards for the purpose of providing our officers and employees incentives and rewards for performance. We may issue common shares upon option exercises and upon the vesting of other awards under the LTIP from our authorized but unissued shares or from treasury shares.
Our expense for share-based arrangements was $24 million in 2008, $20 million in 2007 and $17 million in 2006. The income tax benefit recognized for share-based arrangements in the consolidated statements of earnings was $9 million in 2008, $7 million in 2007 and $6 million in 2006. We recognize expense on all share-based awards over the service period, which is the shorter of the period until the employees’ retirement eligibility dates or the service period of the award for awards expected to vest. Accordingly, expense is generally reduced for estimated forfeitures. SFAS No. 123(R) requires forfeitures to be estimated at the time of grant and revised, if necessary, in subsequent periods if actual forfeitures differ from those estimates. In our consolidated statements of cash flows, we presented excess tax benefits associated with the exercise of stock options as operating cash flows prior to the adoption of SFAS No. 123(R) and as financing cash flows following adoption.
STOCK OPTIONS We granted stock options under the LTIP in 2008, 2007 and 2006 at the closing price of USG common stock on the date of grant. The stock options generally become exercisable in four or five equal annual installments beginning one year from the date of grant, although they may become exercisable earlier in the event of death, disability, retirement or a change in control. The stock options generally expire 10 years from the date of grant, or earlier in the event of death, disability or retirement.
We estimated the fair value of each stock option granted under the LTIP on the date of grant using a Black-Scholes option valuation model that uses the assumptions noted in the following table. We based expected volatility on a 50% weighting of peer volatilities and 50% weighting of implied volatilities. We did not consider historical volatility of our common stock price to be an appropriate measure of future volatility because of the impact of our Chapter 11 proceedings on our historical stock price. The risk-free rate was based on zero coupon U.S. government issues at the time of grant. The expected term was developed using the simplified method, as permitted by the Securities and Exchange Commission’s Staff Accounting Bulletin No. 110, because there is not sufficient historical stock option exercise experience available.

72
Assumptions: 2008 2007 2006
Expected volatility 37.59% 35.45% 42.60% Risk-free rate 3.20% 4.55% 4.87% Expected term (in years) 6.25 6.25 6.50 Expected dividends - - -
A summary of stock options outstanding under the LTIP and our prior stock option plans as of December 31, 2008 and of stock option activity during the fiscal year then ended is presented below:
Weighted Weighted Average Aggregate Number of Average Remaining Intrinsic Options Exercise Contractual Value (000) Price Term (years) (millions)
Outstanding at January 1, 2008 1,709 $45.73 7.98 $1 Granted 927 34.67 Exercised (12) 27.28 Canceled (23) 45.78 Forfeited (132) 43.14
Outstanding at December 31, 2008* 2,469 $41.81 7.68 $- Exercisable at December 31, 2008 720 $43.37 6.04 $- Vested or expected to vest at December 31, 2008 1,813 $40.41 8.35 $-
* Includes 17,060 SARs that are payable in cash upon exercise and, therefore, are accounted for as a liability on the consolidated balance sheets. The weighted-average grant date fair value of stock options granted was $14.78 for options granted during the year ended December 31, 2008, $21.73 for options granted during the year ended December 31, 2007 and $23.36 for options granted during the year ended December 31, 2006.
Intrinsic value for stock options is defined as the difference between the current market value of our common stock and the exercise price of the stock options. The total intrinsic value of stock options exercised was less than $1 million in 2008 and 2007 and was $15 million in 2006. Cash received from the exercise of stock options was less than $1 million in each of 2008 and 2007 and was $14 million in 2006. As a result of the net operating loss we reported for federal tax purposes for 2008, 2007 and 2006, none of the tax benefit with respect to these exercises has been reflected in capital received in excess of par value as of December 31, 2008. Included in our net operating loss carryforwards is $15 million for which a tax benefit of $5 million will be recorded in capital received in excess of par value when the loss carryforward is utilized.
As of December 31, 2008, there was $12 million of total unrecognized compensation cost related to nonvested share-based compensation awards represented by stock options granted under the LTIP. We expect that cost to be recognized over a weighted average period of 3.2 years. The total fair value of stock options vested was $7 million during the year ended December 31, 2008 and $5 million during the year ended December 31, 2007. No stock options vested in 2006.
RESTRICTED STOCK UNITS We granted RSUs under the LTIP during 2008, 2007 and 2006. RSUs generally vest in four equal annual installments beginning one year from the date of grant. RSUs granted as special retention awards generally vest 100% after either four or five years from the date of grant. RSUs may vest earlier in the case of death, disability, retirement or a change in control. Each RSU is settled in a share of our common stock after the vesting period. The fair value of each RSU granted is equal to the closing market price of our common stock on the date of grant.
RSUs outstanding as of December 31, 2008 and RSU activity during 2008 were as follows:

73
Weighted Number Average of Shares Grant Date (000) Fair Value
Nonvested at January 1, 2008 531 $ 47.09 Granted 141 33.47 Vested (143) 46.43 Forfeited (37) 46.25
Nonvested at December 31, 2008 * 492 $43.44
* Includes 4,526 RSUs that are payable in cash upon vesting and, therefore, are accounted for as a liability on the consolidated balance sheets. Cash paid in respect of RSUs that vested during 2008 was less than $1 million.
As of December 31, 2008, there was $9 million of total unrecognized compensation cost related to nonvested share-based compensation awards represented by RSUs granted under the LTIP. We expect that cost to be recognized over a weighted average period of 2.2 years. The total fair value of RSUs that vested was $7 million during the year ended December 31, 2008 and $6 million during the year ended December 31, 2007. No RSUs vested in 2006.
PERFORMANCE SHARES We granted performance shares under the LTIP during 2008 and 2007. The performance shares generally vest after a three-year period based on our total stockholder return relative to the performance of the Dow Jones U.S. Construction and Materials Index, with adjustments to that Index in certain circumstances, for the three-year period. The number of performance shares earned will vary from 0% to 200% of the number of performance shares awarded depending on that relative performance. Vesting will be pro-rated based on the number of full months employed during the performance period in the case of death, disability, retirement or a change in control, and pro-rated awards earned will be paid at the end of the three-year period. Each performance share earned will be settled in a share of our common stock.
We estimated the fair value of each performance share granted under the LTIP on the date of grant using a Monte Carlo simulation that uses the assumptions noted in the following table. Expected volatility is based on implied volatility of our traded options and the daily historical volatilities of our peer group. The risk-free rate was based on zero coupon U.S. government issues at the time of grant. The expected term represents the period from the grant date to the end of the three-year performance period.
Assumptions: 2008 2007
Expected volatility 35.16% 30.69% Risk-free rate 2.20% 4.55% Expected term (in years) 2.92 2.78 Expected dividends - -
Nonvested performance shares outstanding as of December 31, 2008 and performance share activity during 2008 were as follows:
Weighted Weighted Number Average of Shares Grant Date (000) Fair Value
Nonvested at January 1, 2008 87 $ 45.17 Granted 140 44.42 Forfeited (10) 44.88
Nonvested at December 31, 2008 217 $ 44.70

74
Total unrecognized compensation cost related to nonvested share-based compensation awards represented by performance shares granted under the LTIP was $5 million as of December 31, 2008. We expect that cost to be recognized over a weighted average period of 1.8 years.
NON-EMPLOYEE DIRECTOR DEFERRED STOCK UNITS Our non-employee directors may elect to take a portion of their compensation as deferred stock units which increase or decrease in value in direct relation to the market price of our common stock. Deferred stock units earned through December 31, 2007 will be paid in cash upon termination of board service. Deferred stock units earned thereafter will be paid in cash or shares of USG common stock, at the election of the director, upon termination of board service.
The numbers of deferred stock units held by non-employee directors were approximately as follows: 76,877 as of December 31, 2008; 21,085 as of December 31, 2007; and 18,035 as of December 31, 2006. Amounts recorded to expenses in 2008, 2007 and 2006 related to these units were immaterial.
Pursuant to our Stock Compensation Program for Non-Employee Directors, on December 31, 2008, our non-employee directors were entitled to receive an $80,000 annual grant, payable at their election in cash or shares of USG common stock with an equivalent value. Pursuant to this provision, a total of 21,918 shares of common stock were issued to two non-employee directors based on the average of the high and low sales prices of a share of USG common stock on December 30, 2008.
16. Income Taxes
Earnings (loss) before income taxes consisted of the following:
(millions) 2008 2007 2006
U.S. $ (618) $ 11 $ 382 Foreign 37 77 108
Total $ (581) $ 88 $ 490
Income tax expense (benefit) consisted of the following: (millions) 2008 2007 2006
Current: Federal $ (4) $ 8 $ (1,049) Foreign 4 19 29 State (2) (5) (16)
(2) 22 (1,036)
Deferred: Federal (195) 2 1,096 Foreign 4 (11) (3) State 75 (2) 136
(116) (11) 1,229
Total $(118) $ 11 $ 193
75
Differences between actual provisions for income taxes and provisions for income taxes at the U.S. federal statutory rate (35%) were as follows:
(millions) 2008 2007 2006
Taxes on income at U.S. federal statutory rate $(203) $31 $172 Foreign earnings subject to different tax rates (4) (8) (8) State income tax, net of federal benefit (21) (2) 20 Change in valuation allowance 71 (10) 7 Goodwill impairment charges 34 - - Change in unrecognized tax benefits 3 10 - Tax law changes - (10) - Reduction of tax reserves - - (3) Chapter 11 reorganization expenses - - 4 Other, net 2 - 1
Provision for income taxes (benefit) (118) $11 $193 Effective income tax rate 20.4% 12.2% 39.4%
Significant components of deferred tax assets and liabilities as of December 31 were as follows:
(millions) 2008 2007 Deferred Tax Assets: Net operating loss and tax credit carryforwards $ 577 $ 455 Pension and postretirement benefits 244 176 Goodwill and other intangible assets 37 - Reserves not deductible until paid 35 18 Self insurance 11 10 Capitalized interest 12 14 Derivative instruments 23 1 Share-based compensation 19 13 Other - 6
Deferred tax assets before valuation allowance 958 693 Valuation allowance (166) (63)
Total deferred tax assets $ 792 $ 630
Deferred Tax Liabilities: Property, plant and equipment 307 280 State taxes 29 58 Inventories 19 28 Goodwill and other intangible assets - 14 Other 2 -
Total deferred tax liabilities 357 380
Net deferred tax assets $ 435 $ 250
We have established a valuation allowance in the amount of $166 million consisting of $163 million for deferred tax assets relating to certain state net operating loss, or NOL, and tax credit carryforwards and $3 million relating to federal foreign tax credits because of uncertainty regarding their ultimate realization.
As of December 31, 2008, we had deferred tax assets related to federal NOL and tax credit carryforwards of $336 million. We have federal NOLs of approximately $781 million that are available to offset federal taxable income and will expire in the years 2026 - 2028. In addition, we have federal alternative minimum tax credit carryforwards of approximately $69 million that are available to reduce future regular federal income taxes over an

76
indefinite period. In order to fully realize the U.S. federal net deferred tax assets, taxable income of approximately $979 million would need to be generated during the period before their expiration. We currently anticipate that taxable income during that period will be in excess of the amount required in order to realize the U.S. deferred tax assets. As a result, management has concluded that it is more likely than not that these U.S. federal net deferred tax assets will be realized. In addition, we have federal foreign tax credit carryforwards of $6 million that will expire in 2015. Based on projections of future foreign tax credit usage, we concluded that, at December 31, 2008, a valuation allowance against the federal foreign tax credit carryforwards in the amount of $3 million was required.
In contrast to the results under the Internal Revenue Code, many U.S. states do not allow the carryback of an NOL in any significant amount. As a result, in these states our NOL carryforwards are significantly higher than our federal NOL carryforward. As of December 31, 2008, we had a gross deferred tax asset related to our state NOLs and tax credit carryforwards of $233 million, of which $12 million expires in years 2009-2011, $12 million expires in 2012-2014, $30 million expires in 2015-2017, $14 million expires in 2018-2020, $43 million expires in 2021-2023, $86 million expires in 2026, $7 million expires in 2027, $11 million expires in 2028 and $18 million does not expire. To the extent that we do not generate sufficient state taxable income within the statutory carryforward periods to utilize the loss carryforwards in these states, the loss carryforwards will expire unused. Based on projections of future taxable income in the states in which we conduct business operations and the loss carryforward periods allowed by current state laws (generally 5 to 20 years), we concluded that, at December 31, 2008, a valuation allowance in the amount of $163 million is required.
We also had deferred tax assets related to NOL and tax credit carryforwards in various foreign jurisdictions in the amount of $7 million at December 31, 2008, against a portion of which we had historically maintained a valuation allowance. During 2007, we reversed the entire $8 million valuation allowance on our Worldwide Ceilings business due to a change in judgment regarding the continued profitability of that business. Our profitability in that business in recent years, and our projections of future taxable income, have increased significantly due to cost-reduction activities and the introduction of new products, which has resulted in our concluding that it was more likely than not that we would be able to realize the deferred tax assets related to the NOLs in our Worldwide Ceilings business. During 2007, we reversed all $2 million of a valuation allowance on our Canadian businesses due to a planned amalgamation of entities, which as a combined entity is a historically profitable business. As a result, we believe it is more likely than not that we will be able to realize the deferred tax asset related to the NOLs and tax credit carryforwards in our Canadian businesses.
Section 382 of the Internal Revenue Code, or Section 382, imposes limitations on a corporation’s ability to utilize NOLs if it experiences an “ownership change.” In general terms, an ownership change may result from transactions increasing the ownership of certain stockholders in the stock of a corporation by more than 50 percentage points over a three year period. If we were to experience an “ownership change,” utilization of our NOLs would be subject to an annual limitation under Section 382 determined by multiplying the market value of our outstanding shares of stock at the time of the ownership change by the applicable long-term tax-exempt rate (which was 5.4% for December 2008). Any unused annual limitation may be carried over to later years within the allowed NOL carryforward period. The amount of the limitation may, under certain circumstances, be increased or decreased by built-in gains or losses held by us at the time of the change that are recognized in the five-year period after the change. Based on information available as of December 31, 2008, we estimate our current ownership change to be between 39% and 41%. If an ownership change had occurred as of December 31, 2008, our annual NOL utilization would have been limited to approximately $43 million per year.
During the fourth quarter of 2008, we amended our shareholder rights plan to reduce, until September 30, 2009, the beneficial ownership threshold at which a person or group becomes an “Acquiring Person” under the rights plan from 15% to 4.99% of our outstanding voting stock. The rights plan, as amended, exempts certain stockholders as long as they do not become beneficial owners of additional shares of our voting stock, except as otherwise provided by then-existing agreements. Common shares that otherwise would be deemed beneficially owned under the rights plan by reason of ownership of our 10% contingent convertible senior notes are exempted during the period in which the threshold is reduced to 4.99%. The amendment to the rights plan is intended to maximize the value of our NOL

77
carryforwards and related tax benefits. The amendment does not, however, ensure that use of NOLs will not be limited by an ownership change, and there can be no assurance that an ownership change will not occur.
During the fourth quarter of 2008, the Internal Revenue Service, or IRS, concluded its audit of our federal income tax returns for the years 2005 and 2006. Upon final joint committee approval, which we expect to receive in the first quarter of 2009, the IRS audit will be considered effectively settled. As a result of the audit, we expect our federal taxable income for these years will be increased by $8 million in the aggregate, most of which will result in a decrease to the amount of our NOL at December 31, 2008. In addition, we expect a portion of our recorded FIN 48 reserves will become unnecessary.
In June 2007, the FASB issued Financial Accounting Standards Board Interpretation No. 48, “Accounting for Uncertainty in Income Tax – an Interpretation of Financial Accounting Standards Board Statement No. 109.” This interpretation clarifies the accounting and disclosures relating to the uncertainty about whether a tax return position will ultimately be sustained by the tax authorities. We adopted this interpretation on January 1, 2007. As part of the adoption, we recorded an increase in our liability for unrecognized tax benefits of $19 million, $18 million of which was accounted for as an increase in long-term deferred income taxes and $1 million of which reduced our January 1, 2007 balance of retained earnings (deficit). A reconciliation of the beginning and ending amount of unrecognized tax benefits is as follows:
(millions) 2008 2007
Balance as of January 1 $56 $55 Tax positions related to the current period: Gross increase 4 6 Gross decrease - - Tax positions related to prior periods: Gross increase 2 6 Gross decrease (13) (8) Settlements (1) (1) Lapse of statutes of limitations (1) (2)
Balance as of December 31 $47 $56
We classify interest expense and penalties related to unrecognized tax benefits and interest income on tax overpayments as components of income taxes (benefit). As of December 31, 2008, the total amount of interest expense and penalties recognized on our consolidated balance sheet was $6 million and $1 million, respectively. The total amount of interest income recognized on our consolidated balance sheet as of December 31, 2008 was $6 million related to federal interest receivable upon final joint committee approval of the IRS examination for years 2005 and 2006. The total amount of interest and penalties recognized in our consolidated statement of operations for 2008 was $7 million. The total amount of unrecognized tax benefit that, if recognized, would affect our effective tax rate was $46 million.
Our federal income tax returns for 2006 and prior years have been examined by the IRS. The U.S. federal statute of limitations remains open for the year 2003 and later years. We are also under examination in various U.S. state and foreign jurisdictions. It is possible that these examinations may be resolved within the next 12 months. Due to the potential for resolution of the state and foreign examinations and the expiration of various statutes of limitation, it is reasonably possible that our gross unrecognized tax benefit may change within the next 12 months by a range of $15 million to $20 million. Foreign and U.S. state jurisdictions have statutes of limitations generally ranging from three to five years.
We do not provide for U.S. income taxes on the portion of undistributed earnings of foreign subsidiaries that is intended to be permanently reinvested. The cumulative amount of such undistributed earnings totaled approximately $479 million as of December 31, 2008. These earnings would become taxable in the United States upon the sale or

78
liquidation of these foreign subsidiaries or upon the remittance of dividends. It is not practicable to estimate the amount of the deferred tax liability on such earnings.
17. Segments
REPORTABLE SEGMENTS (millions) 2008 2007 2006
Net Sales: North American Gypsum $ 2,358 $ 2,837 $ 3,621 Building Products Distribution 1,993 2,291 2,477 Worldwide Ceilings 846 813 756 Eliminations (589) (739) (1,044)
Total $ 4,608 $ 5,202 $ 5,810
Operating Profit (Loss): North American Gypsum $ (241) $ 84 $ 843 Building Products Distribution (243) 91 205 Worldwide Ceilings 68 75 81 Corporate (97) (110) (117) Eliminations 1 27 (3) Chapter 11 reorganization expenses - - (10)
Total $ (512) $ 167 $ 999
Depreciation, Depletion and Amortization: North American Gypsum $ 141 $ 124 $ 111 Building Products Distribution 13 14 4 Worldwide Ceilings 19 17 18 Corporate 9 21 5
Total $ 182 $ 176 $ 138
Capital Expenditures: North American Gypsum $ 213 $ 425 $ 336 Building Products Distribution 6 6 2 Worldwide Ceilings 19 15 18 Corporate - 14 37
Total $ 238 $ 460 $ 393
Assets: North American Gypsum $ 2,677 $ 2,738 $ 2,361 Building Products Distribution 571 801 430 Worldwide Ceilings 455 466 628 Corporate 1,068 713 2,104 Eliminations (52) (64) (126)
Total $ 4,719 $ 4,654 $ 5,397
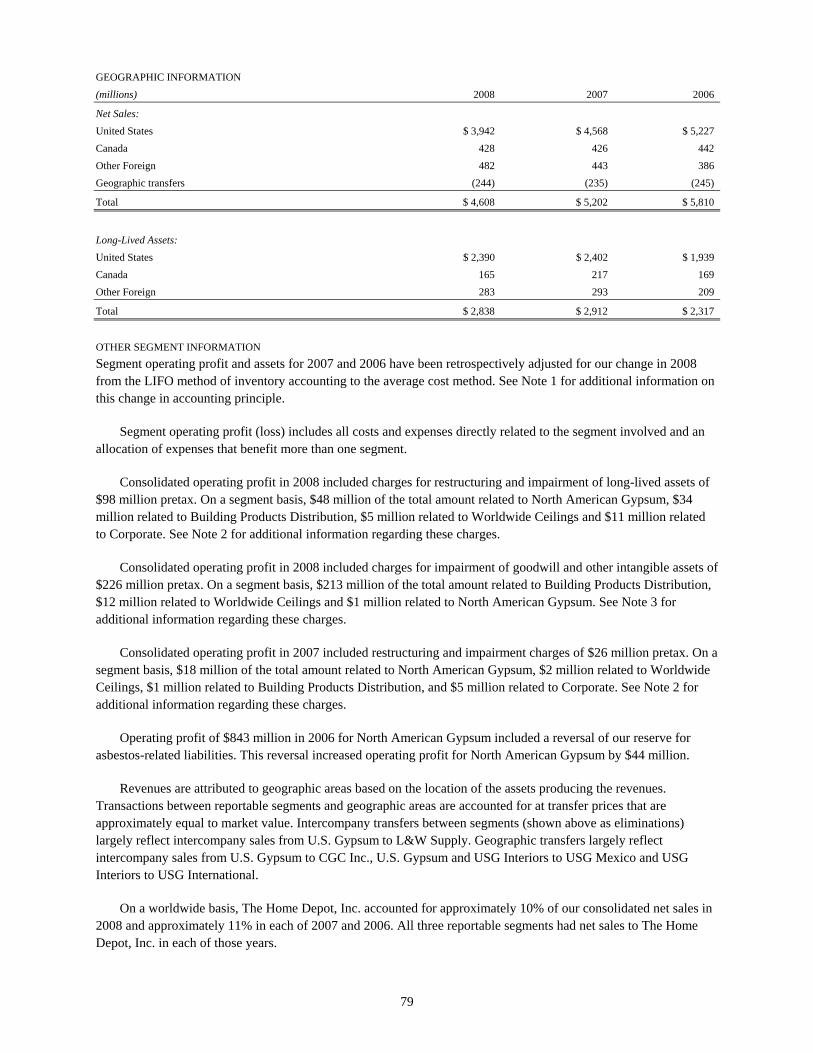
79
GEOGRAPHIC INFORMATION (millions) 2008 2007 2006
Net Sales: United States $ 3,942 $ 4,568 $ 5,227 Canada 428 426 442 Other Foreign 482 443 386 Geographic transfers (244) (235) (245)
Total $ 4,608 $ 5,202 $ 5,810
Long-Lived Assets: United States $ 2,390 $ 2,402 $ 1,939 Canada 165 217 169 Other Foreign 283 293 209
Total $ 2,838 $ 2,912 $ 2,317 OTHER SEGMENT INFORMATION Segment operating profit and assets for 2007 and 2006 have been retrospectively adjusted for our change in 2008 from the LIFO method of inventory accounting to the average cost method. See Note 1 for additional information on this change in accounting principle.
Segment operating profit (loss) includes all costs and expenses directly related to the segment involved and an allocation of expenses that benefit more than one segment.
Consolidated operating profit in 2008 included charges for restructuring and impairment of long-lived assets of $98 million pretax. On a segment basis, $48 million of the total amount related to North American Gypsum, $34 million related to Building Products Distribution, $5 million related to Worldwide Ceilings and $11 million related to Corporate. See Note 2 for additional information regarding these charges.
Consolidated operating profit in 2008 included charges for impairment of goodwill and other intangible assets of $226 million pretax. On a segment basis, $213 million of the total amount related to Building Products Distribution, $12 million related to Worldwide Ceilings and $1 million related to North American Gypsum. See Note 3 for additional information regarding these charges.
Consolidated operating profit in 2007 included restructuring and impairment charges of $26 million pretax. On a segment basis, $18 million of the total amount related to North American Gypsum, $2 million related to Worldwide Ceilings, $1 million related to Building Products Distribution, and $5 million related to Corporate. See Note 2 for additional information regarding these charges.
Operating profit of $843 million in 2006 for North American Gypsum included a reversal of our reserve for asbestos-related liabilities. This reversal increased operating profit for North American Gypsum by $44 million.
Revenues are attributed to geographic areas based on the location of the assets producing the revenues. Transactions between reportable segments and geographic areas are accounted for at transfer prices that are approximately equal to market value. Intercompany transfers between segments (shown above as eliminations) largely reflect intercompany sales from U.S. Gypsum to L&W Supply. Geographic transfers largely reflect intercompany sales from U.S. Gypsum to CGC Inc., U.S. Gypsum and USG Interiors to USG Mexico and USG Interiors to USG International.
On a worldwide basis, The Home Depot, Inc. accounted for approximately 10% of our consolidated net sales in 2008 and approximately 11% in each of 2007 and 2006. All three reportable segments had net sales to The Home Depot, Inc. in each of those years.

80
18. Stockholder Rights Plan
On December 21, 2006, our Board of Directors approved the adoption of a new stockholder rights plan. The plan was amended on December 5, 2008. Under the rights plan, as amended, if any person or group acquires beneficial ownership of 4.99% or more of our then-outstanding voting stock, stockholders other than the 4.99% triggering stockholder will have the right to purchase additional shares of our common stock at half the market price, thereby diluting the triggering stockholder. The 4.99% threshold will return to 15%, the threshold under the plan prior to its amendment, after September 30, 2009 unless our Board of Directors determines otherwise. Stockholders who owned more than 4.99% or more of our common stock as of 4:00 PM, New York City time, on December 4, 2008 will not trigger these rights so long as they do not become the beneficial owner of additional shares of our voting stock while the plan is in effect, except as permitted by then-existing agreements. Shares of our common stock that otherwise would be deemed to be beneficially owned by reason of ownership of our convertible notes (including ownership of shares of common stock into which the notes are convertible) are exempted during the period in which the 4.99% threshold is applicable. During a seven-year standstill period that expires in August 2013, Berkshire Hathaway Inc. (and certain of its affiliates) will not trigger the rights so long as Berkshire Hathaway complies with the terms of a shareholder’s agreement we entered into with Berkshire Hathaway in connection with its backstop commitment referred to in Note 19 and that following that seven-year standstill period, the term “Acquiring Person” will not include Berkshire Hathaway (and certain of its affiliates) unless Berkshire Hathaway and its affiliates acquire beneficial ownership of more than 50% of our voting stock on a fully diluted basis. Among other things, the shareholder’s agreement limits during the standstill period Berkshire Hathaway’s acquisitions of beneficial ownership of our voting stock to 40% of our voting stock on a fully diluted basis, except in limited circumstances, and the manner in which it may seek to effect an acquisition or other extraordinary transaction involving USG.
The rights issued pursuant to the stockholder rights plan will expire on January 2, 2017. However, our Board of Directors has the power to accelerate or extend the expiration date of the rights. In addition, a Board committee composed solely of independent directors will review the rights plan at least once every three years to determine whether to modify the plan in light of all relevant factors.
19. Equity and Rights Offerings
PUBLIC EQUITY OFFERING In March 2007, we completed a public offering of 9.06 million shares of our common stock at a price of $48.60 per share. The net proceeds of the offering, after deducting underwriting discounts and commissions and offering expenses, were approximately $422 million. We used the net proceeds of the equity offering to pay for the CALPLY acquisition and for general corporate purposes.
RIGHTS OFFERING In connection with the plan of reorganization described in Note 22, we issued to our stockholders as of June 30, 2006 one transferable right for each common share owned on that date, entitling the holder to purchase one share of common stock for $40.00 in cash. The rights expired on July 27, 2006. In connection with the rights offering, Berkshire Hathaway agreed through a backstop commitment to purchase from us, at $40.00 per share, all of the shares of common stock offered pursuant to the rights offering that were not issued pursuant to the exercise of rights. In the first quarter of 2006, we paid Berkshire Hathaway a fee of $67 million for its backstop commitment. On August 2, 2006, we issued 6.97 million shares of common stock to Berkshire Hathaway in accordance with the backstop agreement. These shares include 6.5 million shares underlying rights distributed to Berkshire Hathaway in connection with the shares it beneficially owned as of June 30, 2006 and 0.47 million shares underlying rights distributed to other stockholders that were not exercised in the rights offering. A total of 44.92 million shares of our common stock were distributed in connection with the rights offering, including the 6.97 million shares issued to Berkshire Hathaway. We received net proceeds of approximately $1.7 billion in connection with the rights offering. We used the net proceeds from the rights offering, together with other available funds, to make payments required by our plan of reorganization and for general corporate purposes.

81
20. Commitments and Contingencies
We lease some of our offices, buildings, machinery and equipment, and autos under noncancelable operating leases. These leases have various terms and renewal options. Lease expense amounted to $107 million in 2008, $123 million in 2007 and $112 million in 2006. Future minimum lease payments required under operating leases with initial or remaining noncancelable terms in excess of one year as of December 31, 2008 were $91 million in 2009, $77 million in 2010, $59 million in 2011, $43 million in 2012 and $34 million in 2013. The aggregate obligation after 2013 was $124 million.
21. Litigation
ENVIRONMENTAL LITIGATION We have been notified by state and federal environmental protection agencies of possible involvement as one of numerous “potentially responsible parties” in a number of Superfund sites in the United States. As a potentially responsible party, we may be responsible to pay for some part of the cleanup of hazardous waste at those sites. In most of these sites, our involvement is expected to be minimal. In addition, we are involved in environmental cleanups of other property that we own or owned. We believe that appropriate reserves have been established for our potential liability in connection with these matters. Our reserves take into account all known or estimated undiscounted costs associated with these sites, including site investigations and feasibility costs, site cleanup and remediation, certain legal costs, and fines and penalties, if any. However, we continue to review these accruals as additional information becomes available and revise them as appropriate.
CHINESE-MANUFACTURED DRYWALL LAWSUITS L&W Supply Corporation was recently named as a defendant in two lawsuits relating to wallboard sold by L&W Supply in Florida in 2006 that was manufactured in China by Knauf Plasterboard (Tianjin) Co. Ltd., also named as a defendant. One lawsuit, filed on January 22, 2009, in the federal district court for the Southern District of Florida, seeks unspecified damages on behalf of a class of home buyers, claiming that the Chinese-manufactured wallboard is defective and emits high levels of sulfur compounds causing, among other things, alleged property damage and exposure to health risks. The other lawsuit, filed on January 30, 2009, in the state court in Miami-Dade County, Florida, was brought by Lennar Homes against Knauf Tianjin, L&W Supply, and numerous other distributors, importers and contractors. In that lawsuit, Lennar Homes seeks unspecified damages allegedly associated with repairing homes in Florida that were built using the Chinese-manufactured wallboard. L&W Supply was one of several distributors who resold Chinese-manufactured wallboard in Florida during 2006. Although these cases are in a preliminary stage, and it is possible that additional similar suits will be filed, we do not believe that these lawsuits will have a material adverse effect on our results of operations, financial position or cash flows.
ASBESTOS LITIGATION Asbestos Personal Injury Litigation: Our plan of reorganization confirmed in 2006 resolved the debtors’ liability for all present and future asbestos personal injury and related claims. Pursuant to the plan, we created and funded a trust under Section 524(g) of the United States Bankruptcy Code for the payment of all of the present and future asbestos personal injury liabilities of the debtors, as described in Note 22. In 2006, we made payments totaling $3.95 billion to the asbestos personal injury trust. We have no further payment obligations to the trust. The asbestos personal injury trust is administered by independent trustees appointed under the plan. The trust will pay qualifying asbestos personal injury and related claims against the debtors pursuant to trust distribution procedures that are part of the confirmed plan. A key component of our plan of reorganization is the channeling injunction which provides that all present and future asbestos personal injury claims against the debtors must be brought against the trust and no one may bring such a claim against the debtors. This channeling injunction applies to all present and future asbestos personal injury claims for which any debtor is alleged to be liable, including any asbestos personal injury claims against U.S. Gypsum, L&W Supply or Beadex, as well as any asbestos personal injury claims against the debtors relating to A.P. Green Refractories Co., which was formerly one of our subsidiaries. Our plan of reorganization and the channeling injunction do not apply to any of our non-U.S. subsidiaries, any companies we acquired during our

82
reorganization proceedings, or any companies that we acquired or may acquire after our emergence from reorganization.
Asbestos Property Damage Litigation: Asbestos property damage claims against the debtors were not part of the asbestos trust or the channeling injunction. Our plan of reorganization provided that all settled or otherwise resolved asbestos property damage claims that were timely filed in our reorganization proceedings would be paid in full. During our reorganization proceedings, the court set a deadline for filing asbestos property damage claims against the debtors. In response to that deadline, approximately 1,400 asbestos property damage claims were timely filed. More than 950 of those claims were disallowed or withdrawn. In 2006 and 2007, we reached agreements to settle all of the open asbestos property damage claims filed in our reorganization proceedings. In 2006, we made total payments of approximately $99 million for certain of these settlements. Based on our evaluation of our asbestos property damage settlements, we reversed $44 million of our reserve for asbestos-related claims in 2006. We made total payments of approximately $3 million in 2008 and $40 million in 2007 for asbestos property damage settlements. The current estimate of the cost of the one remaining asbestos property damage settlement that has not yet been paid, and associated legal fees, is approximately $5 million and is included in accrued expenses and other liabilities on the consolidated balance sheet as of December 31, 2008.
PATENT AND TRADE SECRETS LAWSUIT Our subsidiary, United States Gypsum Company, or U.S. Gypsum, is the plaintiff in a lawsuit against Lafarge North America Inc., or Lafarge, a manufacturer and seller of gypsum wallboard in the United States and a subsidiary of Lafarge S.A., a French corporation, also a defendant. The lawsuit, filed in 2003 in the federal district court for the Northern District of Illinois, alleges that Lafarge misappropriated our trade secrets and other information through hiring certain U.S. Gypsum employees (a number of whom are also defendants), and that Lafarge infringed one of our patents regarding a method for producing gypsum wallboard. We seek to recover damages measured by the amount of the unlawful benefit Lafarge received and U.S. Gypsum’s lost profits, as well as exemplary damages. Lafarge and the other defendants deny liability and contend that, even if they are liable, any damages are minimal. The case has not been scheduled for trial. We believe that if we recover the full, or a substantial, amount of our claimed damages, that amount would be material to our cash flows and results of operations in the period received. However, as with any lawsuit, there can be no assurance as to either the outcome or the amount of damages recovered, if any.
OTHER LITIGATION We are named as defendants in other claims and lawsuits arising from our operations, including claims and lawsuits arising from the operation of our vehicles, product warranties, personal injury and commercial disputes. We believe that we have recorded appropriate reserves for these claims and suits, taking into account the probability of liability, whether our exposure can be reasonably estimated and, if so, our estimate of our liability or the range of our liability. We do not expect these or any other litigation matters involving USG to have a material adverse effect upon our results of operations, financial position or cash flows.
22. Resolution of Reorganization Proceedings
In the second quarter of 2006, USG Corporation and 10 of its United States subsidiaries, collectively referred to as the debtors, emerged from a five-year Chapter 11 proceeding as a result of a plan of reorganization that was confirmed by the United States Bankruptcy Court for the District of Delaware and the United States District Court for the District of Delaware. The following subsidiaries were debtors in the Chapter 11 proceedings: United States Gypsum Company; USG Interiors, Inc.; USG Interiors International, Inc.; L&W Supply Corporation; Beadex Manufacturing, LLC; B-R Pipeline Company; La Mirada Products Co., Inc.; Stocking Specialists, Inc.; USG Industries, Inc.; and USG Pipeline Company. Pursuant to the plan of reorganization, we resolved the present and future asbestos personal injury liabilities of the debtors by creating and funding a trust under Section 524(g) of the United States Bankruptcy Code. In 2006, we made payments totaling $3.95 billion to the asbestos trust. We have no further payment obligations to the trust. During the time the debtors were operating under the protection of Chapter 11 of the United States Bankruptcy Code, our consolidated financial statements were prepared in accordance with

83
American Institute of Certified Public Accountants Statement of Position 90-7. Interest expense for 2006 included charges totaling $528 million ($325 million after-tax) for post-petition interest and fees related to pre-petition obligations.

84
23. Quarterly Financial Data (unaudited) Quarter (millions, except share data) First Second Third Fourth
2008 (a): Net sales $1,165 $1,251 $1,211 $981 Gross profit 46 76 64 6 Operating loss (b) (60) (39) (32) (381) Net loss (b) (41) (37) (36) (349) Loss Per Common Share: Basic (b) (0.42) (0.37) (0.36) (3.52) Diluted (b) (0.42) (0.37) (0.36) (3.52)
2007 (a): Net sales $1,259 $1,408 $1,335 $1,200 Gross profit 217 202 121 61 Operating profit (loss) 100 88 28 (49) Net earnings (loss) 44 56 9 (32) Earnings (Loss) Per Common Share: Basic (c) (d) 0.49 0.56 0.09 (0.32) Diluted (c) (d) 0.49 0.56 0.09 (0.32)
(a) Information for the first, second and third quarters of 2008 and all four quarters of 2007 has been retrospectively adjusted for our change in
the fourth quarter of 2008 from the last-in, first-out method of inventory accounting to the average cost method. The favorable impact on gross profit and operating profit in 2008 was $5 million for the first quarter, $5 million for the second quarter and $8 million for the third quarter. The favorable impact on net loss and loss per common share in 2008 was $4 million and $0.03 per share for the first quarter, $3 million and $0.03 per share for the second quarter and $4 million and $0.04 per share for the third quarter. The impact on gross profit, operating profit, net earnings (loss) and earnings (loss) per common share in each quarter of 2007 was immaterial. See Note 1 for additional information regarding this change in accounting principle.
(b) The operating loss and net loss for the fourth quarter of 2008 include goodwill and other intangible asset impairment charges of $226
million pretax ($177 million, or $1.78 per diluted share, after-tax). The net loss for the fourth quarter of 2008 also includes a tax valuation allowance charge of $61 million, or $0.62 per diluted share.
(c) The sum of the four quarters is not necessarily the same as the total for the year. (d) Earnings per common share for the 2007 quarters reflect the issuance of 9.06 million shares of common stock in the first quarter of 2007 in
connection with the public equity offering.

85
REPORT OF INDEPENDENT REGISTERED PUBLIC ACCOUNTING FIRM
To the Board of Directors and Stockholders of USG Corporation:
We have audited the accompanying consolidated balance sheets of USG Corporation and subsidiaries (the “Corporation”) as of December 31, 2008 and 2007, and the related consolidated statements of operations, stockholders’ equity, and cash flows for each of the three years in the period ended December 31, 2008. Our audits also included the financial statement schedule, Schedule II-Valuation and Qualifying Accounts. These consolidated financial statements and financial statement schedule are the responsibility of the Corporation's management. Our responsibility is to express an opinion on the financial statements and financial statement schedule based on our audits.
We conducted our audits in accordance with the standards of the Public Company Accounting Oversight Board (United States). Those standards require that we plan and perform the audit to obtain reasonable assurance about whether the financial statements are free of material misstatement. An audit includes examining, on a test basis, evidence supporting the amounts and disclosures in the financial statements. An audit also includes assessing the accounting principles used and significant estimates made by management, as well as evaluating the overall financial statement presentation. We believe that our audits provide a reasonable basis for our opinion.
In our opinion, such consolidated financial statements present fairly, in all material respects, the financial position of USG Corporation and subsidiaries as of December 31, 2008 and 2007, and the results of their operations and their cash flows for each of the three years in the period ended December 31, 2008, in conformity with accounting principles generally accepted in the United States of America. Also, in our opinion, such financial statement schedule, when considered in relation to the basic consolidated financial statements taken as a whole, presents fairly, in all material respects, the information set forth therein.
As discussed in Note 16, effective January 1, 2007, the Corporation adopted Financial Accounting Standards Board Interpretation No. 48, Accounting for Uncertainty in Income Taxes – an Interpretation of Financial Accounting Standards Board Statement No. 109. As discussed in Note 1, in 2008, the Corporation changed its method of accounting for its United States inventories from the last-in, first-out (LIFO) method to the average cost method and, retrospectively, adjusted the 2007 and 2006 financial statements for the change.
We have also audited, in accordance with the standards of the Public Company Accounting Oversight Board (United States), the Corporation's internal control over financial reporting as of December 31, 2008, based on the criteria established in Internal Control—Integrated Framework issued by the Committee of Sponsoring Organizations of the Treadway Commission and our report dated February 20, 2009, expressed an unqualified opinion on the Corporation’s internal control over financial reporting.
DELOITTE & TOUCHE LLP Chicago, Illinois February 20, 2009

86
USG CORPORATION SCHEDULE II - VALUATION AND QUALIFYING ACCOUNTS Beginning Ending (millions) Balance Additions (a) Deductions (b) Balance Year ended December 31, 2008:
Doubtful accounts $12 $ 6 $ (7) $ 11 Cash discounts 5 43 (44) 4
Year ended December 31, 2007:
Doubtful accounts 11 7 (c) (6) 12 Cash discounts 5 50 (50) 5
Year ended December 31, 2006:
Doubtful accounts 10 6 (c) (5) 11 Cash discounts 4 57 (56) 5
(a) Reflects provisions charged to earnings (b) Reflects receivables written off as related to doubtful accounts and discounts allowed as related to cash discounts (c) Includes doubtful accounts from acquisitions of $3 million in 2007 and $1 million in 2006

87
Item 9. CHANGES IN AND DISAGREEMENTS WITH ACCOUNTANTS ON ACCOUNTING AND FINANCIAL DISCLOSURE
None
Item 9A. CONTROLS AND PROCEDURES
Evaluation of Disclosure Controls and Procedures Our Chief Executive Officer and Chief Financial Officer, after evaluating the effectiveness of our “disclosure controls and procedures” (as defined in Rule 13a-15(e) promulgated under the Securities Exchange Act of 1934, or the Act), have concluded that, as of the end of the fiscal year covered by this report, our disclosure controls and procedures were effective to provide reasonable assurance that information required to be disclosed by us in the reports that we file or submit under the Act is recorded, processed, summarized and reported within the time periods specified in the Securities and Exchange Commission’s rules and forms. Disclosure controls and procedures include, without limitation, controls and procedures designed to ensure that information required to be disclosed by an issuer in the reports that it files or submits under the Act is accumulated and communicated to the issuer’s management, including its principal executive officer or officers and principal financial officer or officers, or persons performing similar functions, as appropriate to allow timely decisions regarding required disclosure.
(a) MANAGEMENT REPORT ON INTERNAL CONTROL OVER FINANCIAL REPORTING
Our management is responsible for establishing and maintaining adequate internal control over financial reporting. Our internal control system was designed to provide reasonable assurance to management and our Board of Directors regarding the preparation and fair presentation of published financial statements.
All internal control systems, no matter how well designed, have inherent limitations. Therefore, even those systems determined to be effective can provide only reasonable assurance with respect to financial statement preparation and presentation.
Management assessed the effectiveness of our internal control over financial reporting as of December 31, 2008. In making this assessment, management used the criteria set forth by the Committee of Sponsoring Organizations of the Treadway Commission, or COSO, in Internal Control – Integrated Framework. Based on its assessment, management believes that, as of December 31, 2008, our internal control over financial reporting is effective based on those criteria.
Our independent registered public accounting firm has issued an attestation report on our internal control over financial reporting. This report appears below.
February 20, 2009
88
(b) REPORT OF INDEPENDENT REGISTERED PUBLIC ACCOUNTING FIRM
To the Board of Directors and Stockholders of USG Corporation:
We have audited the internal control over financial reporting of USG Corporation and subsidiaries (the “Corporation”) as of December 31, 2008, based on criteria established in Internal Control — Integrated Framework issued by the Committee of Sponsoring Organizations of the Treadway Commission. The Corporation's management is responsible for maintaining effective internal control over financial reporting and for its assessment of the effectiveness of internal control over financial reporting, included in the accompanying Management Report on Internal Control Over Financial Reporting. Our responsibility is to express an opinion on the Corporation’s internal control over financial reporting based on our audit.
We conducted our audit in accordance with the standards of the Public Company Accounting Oversight Board (United States). Those standards require that we plan and perform the audit to obtain reasonable assurance about whether effective internal control over financial reporting was maintained in all material respects. Our audit included obtaining an understanding of internal control over financial reporting, assessing the risk that a material weakness exists, testing and evaluating the design and operating effectiveness of internal control based on the assessed risk, and performing such other procedures as we considered necessary in the circumstances. We believe that our audit provides a reasonable basis for our opinion.
A corporation's internal control over financial reporting is a process designed by, or under the supervision of, the corporation's principal executive and principal financial officers, or persons performing similar functions, and effected by the corporation's board of directors, management, and other personnel to provide reasonable assurance regarding the reliability of financial reporting and the preparation of financial statements for external purposes in accordance with generally accepted accounting principles. A corporation's internal control over financial reporting includes those policies and procedures that (1) pertain to the maintenance of records that, in reasonable detail, accurately and fairly reflect the transactions and dispositions of the assets of the corporation; (2) provide reasonable assurance that transactions are recorded as necessary to permit preparation of financial statements in accordance with generally accepted accounting principles, and that receipts and expenditures of the corporation are being made only in accordance with authorizations of management and directors of the corporation; and (3) provide reasonable assurance regarding prevention or timely detection of unauthorized acquisition, use, or disposition of the corporation's assets that could have a material effect on the financial statements.
Because of the inherent limitations of internal control over financial reporting, including the possibility of collusion or improper management override of controls, material misstatements due to error or fraud may not be prevented or detected on a timely basis. Also, projections of any evaluation of the effectiveness of the internal control over financial reporting to future periods are subject to the risk that the controls may become inadequate because of changes in conditions, or that the degree of compliance with the policies or procedures may deteriorate.
In our opinion, the Corporation maintained, in all material respects, effective internal control over financial reporting as of December 31, 2008, based on the criteria established in Internal Control — Integrated Framework issued by the Committee of Sponsoring Organizations of the Treadway Commission.

89
We have also audited, in accordance with the standards of the Public Company Accounting Oversight Board (United States), the consolidated financial statements and financial statement schedule as of and for the year ended December 31, 2008 of the Corporation and our report dated February 20, 2009, expressed an unqualified opinion on those financial statements and financial statement schedule and included an explanatory paragraph referring to the Corporation’s adoption of Financial Accounting Standards Board Interpretation No. 48, Accounting for Uncertainty in Income Taxes – an interpretation of Financial Accounting Standards Board Statement No. 109 in 2007 and a change in the method of accounting for United States inventories from the last-in, first-out (LIFO) method to the average cost method in 2008.
DELOITTE & TOUCHE LLP Chicago, Illinois February 20, 2009
(c) Changes in Internal Control over Financial Reporting
There were no changes in our “internal control over financial reporting” (as defined in Rule 13a-15(f) promulgated under the Act) identified in connection with the evaluation required by Rule 13a-15(d) promulgated under the Act that occurred during the fiscal quarter ended December 31, 2008 that have materially affected, or are reasonably likely to materially affect, our internal control over financial reporting.
Item 9A(T). CONTROLS AND PROCEDURES
Not applicable
Item 9B. OTHER INFORMATION
None

90
PART III Item 10. DIRECTORS, EXECUTIVE OFFICERS AND CORPORATE GOVERNANCE Executive Officers of the Registrant (as of February 20, 2009): Name Age Present Position and Business Experience During the Last Five Years William C. Foote 57 Chairman and Chief Executive Officer since January 2006. Chairman, Chief Executive Officer and President prior thereto. James S. Metcalf 51 President and Chief Operating Officer since January 2006. Executive Vice President; President, USG Building Systems prior thereto. Stanley L. Ferguson 56 Executive Vice President and General Counsel since March 2004. Senior Vice President and General Counsel prior thereto. Richard H. Fleming 61 Executive Vice President and Chief Financial Officer. Brian J. Cook 51 Senior Vice President, Human Resources, since February 2005. Vice President, Human Resources, prior thereto. Marcia S. Kaminsky 50 Senior Vice President, Communications, since February 2005. Vice President, Communications, prior thereto. D. Rick Lowes 54 Senior Vice President and Controller since May 2007. Vice President and Controller prior thereto. Dominic A. Dannessa 52 Vice President and Chief Technology Officer since July 2008. Vice President, Supply Chain, Information Technology and Corporate Efficiency
Initiatives to July 2008. Vice President; Executive Vice President, Manufacturing, USG Building Systems to January 2008. Senior Vice President, Manufacturing, United States Gypsum Company prior thereto.
Brendan J. Deely 43 Vice President; President and Chief Executive Officer, L&W Supply
Corporation, since May 2007. Vice President; President and Chief Operating Officer, L&W Supply
Corporation, to May 2007. Senior Vice President and Chief Operating Officer, L&W Supply Corporation, to June 2005. Vice President, Operations, L&W Supply Corporation, to April 2004.
Christopher R. Griffin 47 Vice President; President, USG International; President, CGC Inc., since January
2008. President, CGC Inc., prior thereto. Fareed A. Khan 43 Vice President; President, USG Building Systems since January 2008. Vice President; Executive Vice President, Sales and Marketing, USG Building
Systems to January 2008. Senior Vice President, Supply Chain and CRM and IT, United States Gypsum Company, to January 2006.
Karen L. Leets 52 Vice President and Treasurer

91
Name Age Present Position and Business Experience During the Last Five Years Donald S. Mueller 61 Vice President and Chief Innovation Officer since September 2007. Vice President, Research and Technology Innovation to September 2007. Vice President, Research and Technology to May 2006. Director, Industrial and
State Relations for Environmental Science Institute, Ohio State University to December 2004.
Ellis A. Regenbogen 62 Vice President since February 2008 and Corporate Secretary and Associate
General Counsel since October 2006. Associate General Counsel and Assistant Secretary to October 2006. Associate General Counsel – Securities and Governance, Sears Holdings
Corporation, to April 2006. Assistant General Counsel – Corporate and Securities, Sears, Roebuck and Co., to April 2005. Law Offices of Ellis A. Regenbogen to April 2005.
Jennifer F. Scanlon 42 Vice President and Chief Information Officer since February 2008. Director, Information Technology, and Chief Information Officer to February
2008. Director, CRM/SCM Strategy and Implementation, USG Building Systems to May 2007.
Committee Charters and Code of Business Conduct
Our Code of Business Conduct (applicable to directors, officers and employees), our Corporate Governance Guidelines and the charters of the committees of our Board of Directors, including the Audit Committee, Governance Committee and Compensation and Organization Committee, are available through the “Resources” and “Corporate Governance” links in the “Investor Information” section of our website at www.usg.com. Stockholders may request a copy of these documents by writing to: Corporate Secretary, USG Corporation, 550 West Adams Street, Chicago, Illinois 60661. Any waivers of, or changes to, our Code of Business Conduct applicable to executive officers, directors or persons performing similar functions will be promptly disclosed in the “Investor Information” section of our website.
Following the annual meeting of stockholders held on May 14, 2008, our Chief Executive Officer certified to the NYSE that he was not aware of any violation by us of the NYSE’s Corporate Governance Listing Standards.
Other information required by this Item 10 is included under the headings “Director Nominees and Directors Continuing in Office,” “Committees of the Board of Directors,” “Audit Committee” and “Section 16(a) Beneficial Ownership Reporting Compliance” in the definitive Proxy Statement for our annual meeting of stockholders scheduled to be held on May 13, 2009, which information is incorporated herein by reference.
Item 11. EXECUTIVE COMPENSATION
Information required by this Item 11 is included under the heading “Compensation of Executive Officers and Directors” in the definitive Proxy Statement for our annual meeting of stockholders scheduled to be held on May 13, 2009, which information is incorporated herein by reference.
Item 12. SECURITY OWNERSHIP OF CERTAIN BENEFICIAL OWNERS AND MANAGEMENT AND RELATED STOCKHOLDER MATTERS
The following table sets forth information about our common stock that may be issued upon exercise of options under all of our equity compensation plans as of December 31, 2008, including the Long-Term Incentive and Omnibus Management Incentive Plans, both of which were approved by our stockholders.
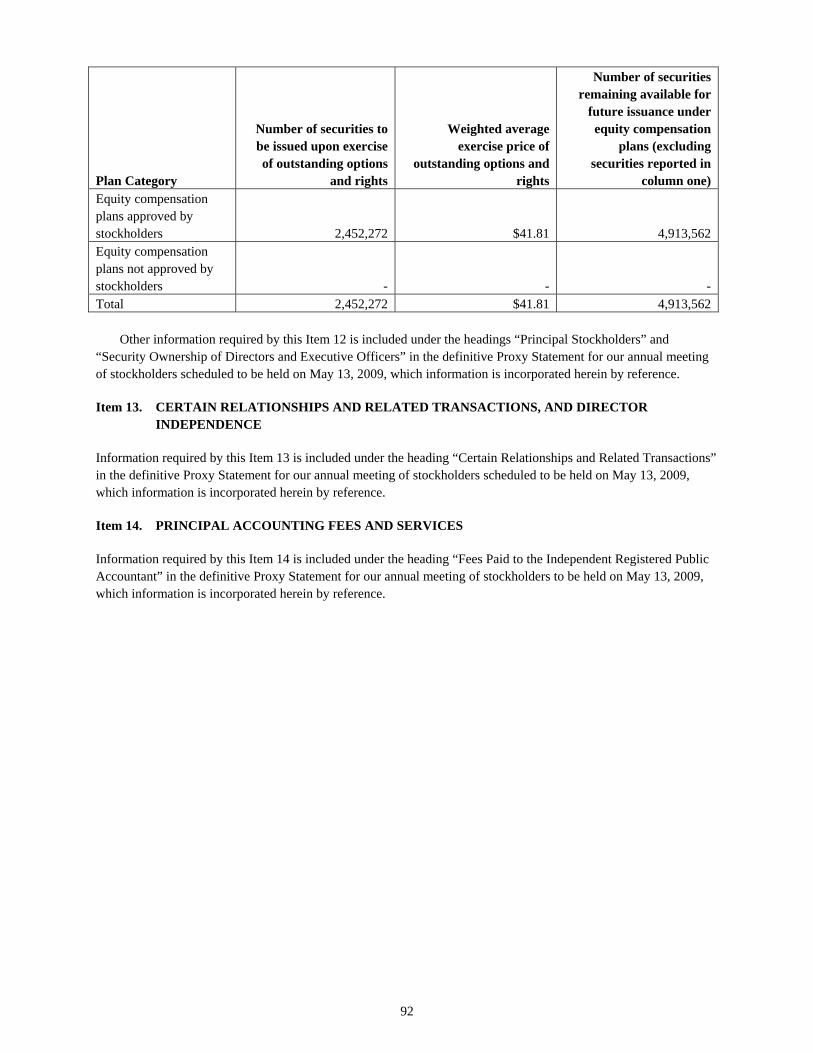
92
Plan Category
Number of securities to be issued upon exercise of outstanding options
and rights
Weighted average exercise price of
outstanding options and rights
Number of securities remaining available for
future issuance under equity compensation
plans (excluding securities reported in
column one) Equity compensation plans approved by stockholders 2,452,272 $41.81 4,913,562 Equity compensation plans not approved by stockholders - - - Total 2,452,272 $41.81 4,913,562 Other information required by this Item 12 is included under the headings “Principal Stockholders” and “Security Ownership of Directors and Executive Officers” in the definitive Proxy Statement for our annual meeting of stockholders scheduled to be held on May 13, 2009, which information is incorporated herein by reference.
Item 13. CERTAIN RELATIONSHIPS AND RELATED TRANSACTIONS, AND DIRECTOR INDEPENDENCE
Information required by this Item 13 is included under the heading “Certain Relationships and Related Transactions” in the definitive Proxy Statement for our annual meeting of stockholders scheduled to be held on May 13, 2009, which information is incorporated herein by reference.
Item 14. PRINCIPAL ACCOUNTING FEES AND SERVICES
Information required by this Item 14 is included under the heading “Fees Paid to the Independent Registered Public Accountant” in the definitive Proxy Statement for our annual meeting of stockholders to be held on May 13, 2009, which information is incorporated herein by reference.

93
PART IV Item 15. EXHIBITS AND FINANCIAL STATEMENT SCHEDULES (a) 1 and 2. See Part II, Item 8, Financial Statements and Supplementary Data, for an index of our consolidated
financial statements and supplementary data schedule. 3. Exhibits Exhibit Number Exhibit Plan of Reorganization:
2.1 First Amended Joint Plan of Reorganization of USG Corporation and its Debtor Subsidiaries (incorporated by reference to Exhibit 2.01 to USG Corporation’s Current Report on Form 8-K filed June 21, 2006, or the June Form 8-K)
2.2 Order Confirming First Amended Joint Plan of Reorganization (incorporated by reference to Exhibit 2.02 to the June Form 8-K)
Articles of Incorporation and By-Laws:
3.1 Restated Certificate of Incorporation of USG Corporation (incorporated by reference to Exhibit 3.0 to the June Form 8-K)
3.2 Certificate of Designation of Junior Participating Preferred Stock, Series D, of USG Corporation (incorporated by reference to Exhibit A of Exhibit 4 to USG Corporation’s Current Report on Form 8-K dated March 27, 1998)
3.3 Amended and Restated By-Laws of USG Corporation, dated as of January 1, 2007 (incorporated by reference to Exhibit 3.3 to USG Corporation’s Annual Report on Form 10-K dated February 16, 2007, or the 2006 10-K)
Instruments Defining the Rights of Security Holders, Including Indentures:
4.1 Form of Common Stock certificate (incorporated by reference to Exhibit 4.1 to the 2006 10-K)
4.2 Rights Agreement, dated as of December 21, 2006, between USG Corporation and Computershare Investor Services, LLC, as Rights Agent (incorporated by reference to Exhibit 4.1 to USG Corporation’s Registration Statement on Form 8-A dated December 21, 2006)
4.3 Amendment to Rights Agreement, dated as of December 5, 2008, to the Rights Agreement, dated as of December 21, 2006, by and between USG Corporation and Computershare Investor Services, LLC, as Rights Agent (incorporated by reference to Exhibit 4.1 to USG Corporation’s Amendment No. 1 to Form 8-A dated December 5, 2008)
4.4 Indenture, dated as of November 1, 2006, by and between USG Corporation and Wells Fargo Bank, National Association, as trustee (incorporated by reference to Exhibit 4.01 to USG Corporation’s Current Report on Form 8-K dated November 20, 2006, or the November 2006 8-K)
4.5 Supplemental Indenture No. 1, dated as of November 17, 2006, by and between USG Corporation and Wells Fargo Bank, National Association, as trustee (incorporated by reference to Exhibit 4.02 to the

94
November 2006 8-K)
4.6 Form of 7.750% Senior Note due 2018 (incorporated by reference to USG Corporation’s Current Report on Form 8-K dated September 26, 2007)
4.7 Indenture, dated as of November 1, 2008, by and between USG Corporation and Wells Fargo Bank, National Association, as trustee (incorporated by reference to Exhibit 4.1 to USG Corporation’s Current Report on Form 8-K dated November 26, 2008, or the November 2008 8-K)
4.8 Supplemental Indenture No. 1, dated as of November 26, 2008, by and between USG Corporation and Wells Fargo Bank, National Association, as trustee (incorporated by reference to Exhibit 4.2 to the November 2008 8-K)
USG Corporation and certain of its consolidated subsidiaries are parties to other long-term debt instruments under which the total amount of securities authorized does not exceed 10% of the total assets of USG Corporation and its subsidiaries on a consolidated basis. Pursuant to paragraph (b)(4)(iii)(A) of Item 601 of Regulation S-K, USG Corporation agrees to furnish a copy of such instruments to the Securities and Exchange Commission upon request.
Material Contracts:
10.1 Amendment and Restatement of USG Corporation Supplemental Retirement Plan, effective as of January 1, 2007 and dated December 10, 2008 * **
10.2 Form of Employment Agreement (incorporated by reference to Exhibit 10.1 to USG Corporation’s Current Report on Form 8-K dated October 2, 2008, or the First October 2008 8-K) *
10.3 Form of Change in Control Severance Agreement (Tier 1 Benefits) (incorporated by reference to Exhibit 10.2 to the First October 2008 8-K) *
10.4 Form of Change in Control Severance Agreement (Tier 2 Benefits) (incorporated by reference to Exhibit 10.3 to the First October 2008 8-K) *
10.5 Form of Indemnification Agreement (incorporated by reference to Exhibit 10.14 to USG Corporation’s Annual Report on Form 10-K dated February 15, 2008, or the 2007 10-K) *
10.6 Stock Compensation Program for Non-Employee Directors (as Amended and Restated Effective as of January 1, 2005) of USG Corporation (incorporated by reference to Exhibit 10.2 to USG Corporation’s Current Report on Form 8-K dated November 14, 2005) *
10.7 Amendment No. 1 to the USG Corporation Stock Compensation Program for Non-Employee Directors (as Amended and Restated as of January 1, 2005) (incorporated by reference to Exhibit 10.1 to USG Corporation’s Quarterly Report on Form 10-Q dated August 3, 2006, or the second quarter 2006 10-Q) *
10.8 Amendment No. 2 to the USG Corporation Stock Compensation Program for Non-Employee Director (as Amended and Restated as of January 1, 2005) (incorporated by reference to Exhibit 10.8 to USG Corporation’s Quarterly Report on Form 10-Q dated April 30, 2007, or the first quarter 2007 10-Q) *
10.9 USG Corporation Non-Employee Director Compensation Program (Amended and Restated February 13, 2008) (incorporated by reference to Exhibit 10.18 to the 2007 10-K) *
10.10 USG Corporation Deferred Compensation Program for Non-Employee Directors (As Amended and Restated effective December 31, 2008) * **
95
10.11 Contingent Non-Negotiable Promissory Note of USG Corporation and its Debtor Subsidiaries payable to the Asbestos Personal Injury Trust dated June 20, 2006 in the principal amount of $3,050,000,000 (incorporated by reference to Exhibit 10.2 to the second quarter 2006 10-Q)
10.12 Non-Negotiable Promissory Note of USG Corporation and its Debtor Subsidiaries payable to the Asbestos Personal Injury Trust dated June 20, 2006 in the principal amount of $10,000,000 (incorporated by reference to Exhibit 10.3 to the second quarter 2006 10-Q)
10.13 Pledge Agreement Regarding Contingent Payment Note dated as of June 20, 2006 by and among USG Corporation and certain individuals in their capacities as the Asbestos Personal Injury Trustees (the “Trustees”) (incorporated by reference to Exhibit 10.4 to the second quarter 2006 10-Q)
10.14 Pledge Agreement Regarding Non-Contingent Note dated as of June 20, 2006 by and between USG Corporation and the Trustees (incorporated by reference to Exhibit 10.5 to the second quarter 2006 10-Q)
10.15 Second Amended and Restated Credit Agreement, dated as of January 7, 2009 among USG Corporation, the Lenders Party thereto, JPMorgan Chase Bank, N.A., as Administrative Agent, and Goldman Sachs Credit Partners, L.P., as Syndication Agent (incorporated by reference to Exhibit 10.2 to USG Corporation’s Current Report on Form 8-K dated January 12, 2009, or the January 2009 8-K)
10.16 Guarantee Agreement, dated as of January 7, 2009 among USG Corporation, the subsidiary guarantors party thereto and JPMorgan Chase Bank, N.A., as administrative agent (incorporated by reference to Exhibit 10.3 to the January 2009 8-K)
10.17 Pledge and Security Agreement, dated as of January 7, 2009 among USG Corporation, the other grantors party thereto and JPMorgan Chase Bank, N.A., as administrative agent (incorporated by reference to Exhibit 10.4 to the January 2009 8-K)
10.18 2008 Annual Management Incentive Program of USG Corporation (Corporate Officers Only) (incorporated by reference to Exhibit 10.46 to the 2007 10-K) *
10.19 Annual Base Salaries of Named Executive Officers of USG Corporation (incorporated by reference to Exhibit 10.3 to USG Corporation’s Quarterly Report on Form 10-Q dated April 29, 2008) *
10.20 Omnibus Management Incentive Plan (incorporated by reference to Annex A to USG Corporation’s Proxy Statement dated March 28, 1997) *
10.21 First Amendment to Omnibus Management Incentive Plan, dated November 11, 1997 (incorporated by reference to Exhibit 10(p) to USG Corporation’s Annual Report on Form 10-K dated February 20, 1998) *
10.22 Second Amendment to Omnibus Management Incentive Plan, dated as of June 27, 2000 (incorporated by reference to Exhibit 10(c) to USG Corporation’s Quarterly Report on Form 10-Q dated November 6, 2000) *
10.23 Third Amendment to Omnibus Management Incentive Plan, dated as of March 25, 2004 (incorporated by reference to Exhibit 10.24 to USG Corporation’s Annual Report on Form 10-K dated February 18, 2005) *
10.24 USG Corporation Deferred Compensation Plan (incorporated by reference to Exhibit 10.31 to the 2006 10-K) *
10.25 First Amendment of USG Corporation Deferred Compensation Plan, effective as of April 1, 2007 and dated December 10, 2008 * **
10.26 Key Employee Retention Plan (July 1, 2004 – December 31, 2005), dated July 1, 2004 (incorporated by
96
reference to Exhibit 10 to USG Corporation’s Quarterly Report on Form 10-Q dated July 30, 2004) *
10.27 USG Corporation 2006 Corporate Performance Plan, dated January 25, 2006 (incorporated by reference to Exhibit 10 to USG Corporation’s Current Report on Form 8-K dated January 25, 2006) *
10.28 USG Corporation Long-Term Incentive Plan (incorporated by reference to Annex C to the Proxy Statement for the Annual Meeting of Stockholders of USG Corporation held on May 10, 2006, or the 2006 Proxy Statement) *
10.29 Amendment No. 1 to the USG Corporation Long-Term Incentive Plan (incorporated by reference to Exhibit 10.8 to the second quarter 2006 10-Q) *
10.30 Form of USG Corporation Nonqualified Stock Option Agreement (incorporated by reference to Exhibit 10.9 to the second quarter 2006 10-Q) *
10.31 Form of USG Corporation Nonqualified Stock Option Agreement (incorporated by reference to Exhibit 10.1 to USG Corporation’s Current Report on Form 8-K dated March 28, 2007, or the March 2007 8-K) *
10.32 Form of USG Corporation Restricted Stock Units Agreement (incorporated by reference to Exhibit 10.10 to the second quarter 2006 10-Q) *
10.33 Form of USG Corporation Restricted Stock Units Agreement (Annual Grant) (incorporated by reference to Exhibit 10.2 to the March 2007 8-K) *
10.34 Form of USG Corporation Restricted Stock Units Agreement (Retention Grant) (incorporated by reference to Exhibit 10.3 to the March 2007 8-K) *
10.35 Form of USG Corporation Performance Shares Agreement (incorporated by reference to Exhibit 10.4 to the March 2007 8-K) *
10.36 Form of USG Corporation Nonqualified Stock Option Agreement * **
10.37 Form of USG Corporation Restricted Stock Units Agreement * **
10.38 Form of USG Corporation Performance Shares Agreement * **
10.39 Changes to Equity Awards for Compliance With Section 409A * **
10.40 USG Corporation Management Incentive Plan (incorporated by reference to Annex B to the 2006 Proxy Statement) *
10.41 Equity Commitment Agreement, dated January 30, 2006, by and between USG Corporation and Berkshire Hathaway Inc. (incorporated by reference to Exhibit 10.2 to USG Corporation’s Current Report on Form 8-K dated January 30, 2006, or the January 2006 8-K)
10.42 Shareholder’s Agreement, entered into as of January 30, 2006, by and between USG Corporation and Berkshire Hathaway Inc. (incorporated by reference to Exhibit 10.3 to the January 2006 8-K)
10.43 Amended and Restated Registration Rights Agreement, dated as of November 26, 2008, by and between USG Corporation and Berkshire Hathaway Inc. (incorporated by reference to Exhibit 10.1 to the November 2008 8-K)
10.44 Equity Purchase Agreement dated as of February 25, 2007 among L&W Supply Corporation, Joseph

97
George Zucchero, JCSG Holdings Corporation, the Joseph G. Zucchero Family Trust dated September 12, 1998 and the entities listed on Exhibit A-1 thereto (incorporated by reference to Exhibit 10.1 to USG Corporation’s Current Report on Form 8-K dated February 27, 2007)
10.45 Secured Loan Facility Agreement, dated October 21, 2008, between Gypsum Transportation Limited and DVB Bank SE, as lender, agent and security trustee (incorporated by reference to Exhibit 10.1 to USG Corporation’s Current Report on Form 8-K dated October 27, 2008, or the Second October 2008 8-K)
10.46 Guarantee and Indemnity Agreement, dated October 21, 2008, between USG Corporation and DVB Bank SE, as agent (incorporated by reference to Exhibit 10.2 to the Second October 2008 8-K)
10.47 Form of Deed of Covenants between Gypsum Transportation Limited and DVB Bank SE, as mortgagee (incorporated by reference to Exhibit 10.3 to the Second October 2008 8-K)
10.48 Form of Deed of Assignment between Gypsum Transportation Limited and DVB Bank SE, as assignee (incorporated by reference to Exhibit 10.4 to the Second October 2008 8-K)
10.49 Securities Purchase Agreement, dated November 21, 2008, between USG Corporation and Berkshire Hathaway Inc. (incorporated by reference to Exhibit 1.1 to the November 2008 8-K)
10.50 Securities Purchase Agreement, dated November 21, 2008, between USG Corporation and Fairfax Financial Holdings Limited (incorporated by reference to Exhibit 1.2 to the November 2008 8-K)
10.51 Registration Rights Agreement, dated as of November 26, 2008, between USG Corporation and Fairfax Financial Holdings Limited (incorporated by reference to Exhibit 10.2 to the November 2008 8-K)
Other:
18 Letter from Deloitte and Touche LLP regarding change in accounting principle ** 21 Subsidiaries ** 23 Consent of Independent Registered Public Accounting Firm ** 24 Power of Attorney ** 31.1 Rule 13a - 14(a) Certifications of USG Corporation’s Chief Executive Officer ** 31.2 Rule 13a - 14(a) Certifications of USG Corporation’s Chief Financial Officer ** 32.1 Section 1350 Certifications of USG Corporation’s Chief Executive Officer ** 32.2 Section 1350 Certifications of USG Corporation’s Chief Financial Officer ** * Management contract or compensatory plan or arrangement ** Filed or furnished herewith

98
SIGNATURES Pursuant to the requirements of Section 13 or 15(d) of the Securities Exchange Act of 1934, the Registrant has duly caused this report to be signed on its behalf by the undersigned, thereunto duly authorized.
USG CORPORATION February 20, 2009
By: /s/ Richard H. Fleming Richard H. Fleming Executive Vice President and
Chief Financial Officer Pursuant to the requirements of the Securities Exchange Act of 1934, this report has been signed below by the following persons on behalf of the Registrant and in the capacities and on the date indicated. /s/ William C. Foote February 20, 2009 WILLIAM C. FOOTE Director, Chairman and Chief Executive Officer (Principal Executive Officer) /s/ Richard H. Fleming February 20, 2009 RICHARD H. FLEMING Executive Vice President and Chief Financial Officer (Principal Financial Officer) /s/ D. Rick Lowes February 20, 2009 D. RICK LOWES Senior Vice President and Controller (Principal Accounting Officer) JOSE ARMARIO, ROBERT L. BARNETT, ) By: /s/ Richard H. Fleming KEITH A. BROWN, JAMES C. COTTING, ) Richard H. Fleming LAWRENCE M. CRUTCHER, W. DOUGLAS FORD, ) Attorney-in-fact STEVEN F. LEER, MARVIN E. LESSER, ) February 20, 2009 JAMES S. METCALF, JUDITH A. SPRIESER ) Directors ) )