usgs 3dep - lcso.com · usgs 3dep . the national map + ... (ned) with new lidar and ifsar elevation...
TRANSCRIPT
+
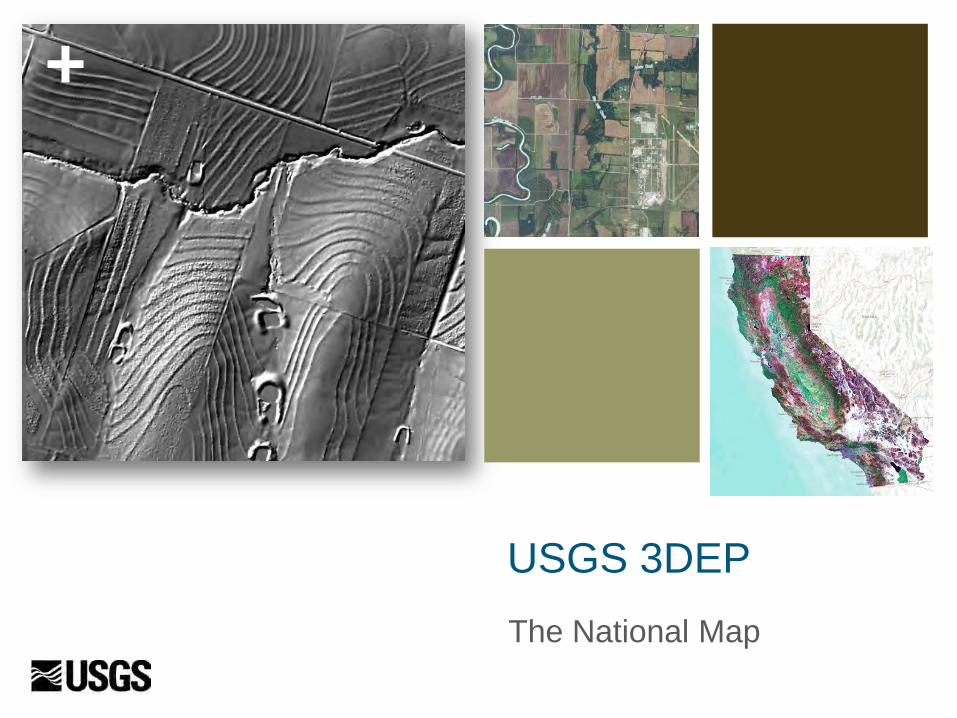
USGS 3DEP The National Map

+ What is the 3D Elevation Program?
Accelerate the acquisition of high quality light detection and ranging (lidar) data in the conterminous U.S. (CONUS), Hawaii, and the U.S. Territories; and interferometric synthetic aperture radar (ifsar) data in Alaska
Completely refresh the National Elevation Dataset (NED) with new lidar and ifsar elevation data products and services
Leverage collaboration among federal, states, local and tribal partners to systematically complete national 3D elevation data coverage in eight years
Raise governance to the executive level and build on the structure already in place at the operational level under the National Digital Elevation Program (NDEP)
Increase the overall investment in 3D elevation to $146 million annually to return more than $690 million annually in new benefits
2
A call for action to…
Natural Resource Conservation
Infrastructure Management
Flood Risk Mitigation Precision Farming Land Navigation and Safety
Geologic Resources and Hazards Mitigation

+ USGS Lead Agency for Terrestrial Elevation
Business Requirements
Define
Inventory Evaluate
Obtain
Access Maintain
Use Evaluate
Archive
3
Geospatial Data Lifecycle
Office of Management and Budget Circular A-16
For more than 15 years, the USGS has managed the National Elevation Dataset (NED) and coordinated acquisition through the National Digital Elevation Program (NDEP) on a project-by-project basis
We are at a point in the data lifecycle of defining the next generation national elevation program

+ U.S. Interagency Elevation Inventory 4
2013 Status Map of Publically Available Lidar and Ifsar
Lidar: 38% of the lower 49 states has coverage Only 4 percent
meets the 3DEP goal of QL2 or better
Ifsar: 43.5% of Alaska has coverage More than half the
State needs ifsar data to complete the 3DEP goal for coverage
To view the inventory go to: www.csc.noaa.gov/inventory
4
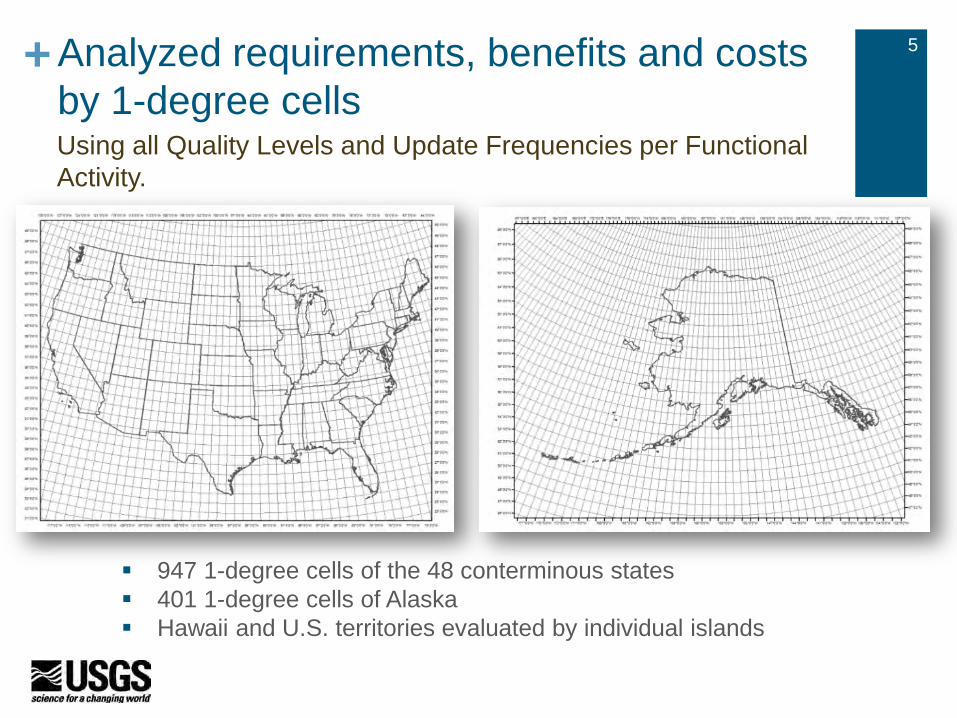
+ Analyzed requirements, benefits and costs by 1-degree cells
5
947 1-degree cells of the 48 conterminous states 401 1-degree cells of Alaska Hawaii and U.S. territories evaluated by individual islands
Using all Quality Levels and Update Frequencies per Functional Activity.

+ Currently in Progress: revision and alignments of specifications (USGS and ASPRS)
6
Due out June, 2014

+ CA 3DEP activities, thus far…. Initial NEEA Survey and interviews Yearly inventory updates Workshop to reach consensus for
highest quality need for each 1-degree cell to meet all agency needs
Opportunistic partnerships for Q1 and Q2 lidar

+ Data Quality Level Choices
Bathymetric LiDAR requirements assessed for three Quality Levels to include Low, Standard and High. Standard Quality Level (3-5 meter post spacing; RMSEz ~ 20 cm)
Note – USGS LiDAR base acquisition specification version 13 is for QL3 data
8
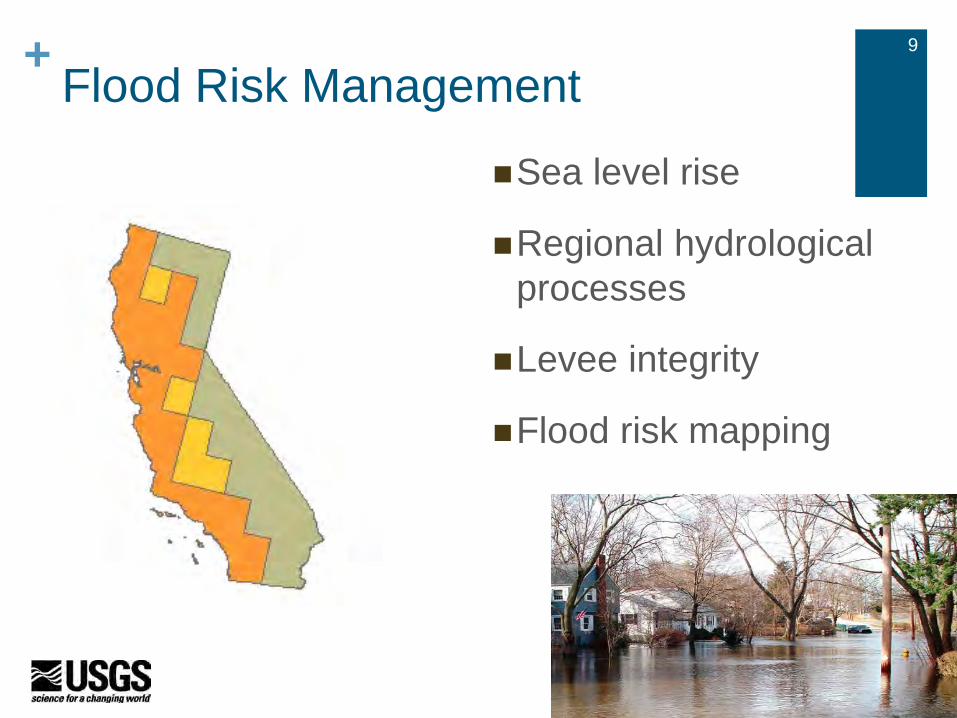
+ Flood Risk Management Sea level rise
Regional hydrological processes
Levee integrity
Flood risk mapping
9

+ Wildfire Management, Planning, and Response
Fire behavior modeling
Damage assessment
Post-fire litigation
Estimated benefits: 16M
10

+ Coastal Zone management Improved monitoring
Improved modeling--Climate, sediment transport, tsunami behavior
Restoration and fish passages
11

+ Infrastructure and Construction Management
Road, culvert, bridge design
Transportation planning: high speed rail
Hydraulic modeling
12

+ Forest Resource Management
Vegetation mapping
Habitat analysis
Change detection
13

+ River and Stream Resource Management
Water conveyance
Fish passage
NHD stewardship
14

+ Geologic Resource Assessment and Hazard Mitigation
15
Geologic mapping
Seismic, tsunami, landslide hazard mapping and zonation

+ Mission critical use: Identify areas, level of activity and risk associated with earth hazards to reduce losses and increase public safety Data requirement: Predominantly quality level 1 Update frequencies: 4-10 years Expected combined benefits: $31.25M/year Example applications: Identify faults/landslides under thick vegetation Enhance infrastructure engineering design Estimate size, speed and effects of landslides Create loss mitigation strategies Provide maps and models to emergency planners
16
Example: USGS Geologic Resource Assessment and Hazards Mitigation
Volcanos Landslides
16
Seismic

+ Urban and Regional Planning
Land use planning
Coastal protection
Economic development; energy
Local slope analysis
17

+ California Lidar /Ifsar Inventory

+
For point cloud download….

+ California LiDAR Estimated Costs, 163,695 mi2
Quality Level $/mi2 Total Costs
QL1 LiDAR $547.30 $89,590,274 QL2 LiDAR $334.48 $52,870,000 QL3 LiDAR $252.67 $41,360,816

+ Steps in progress at the Federal Level
Formalize program recommendation(s) and 3DEP strategic plan
Sync USGS deliverables to better meet needs (for example, build out 1-m elevation model for the country)
One-stop shop: National Map Intensify outreach Develop outreach materials Engage key professions, industries, states, etc. Coordination with partner agencies (NOAA, FEMA, states)
Develop 3DEP funding strategy and implementation timeline
Summer 2014: first funding announcement
21

Products– 3DEP
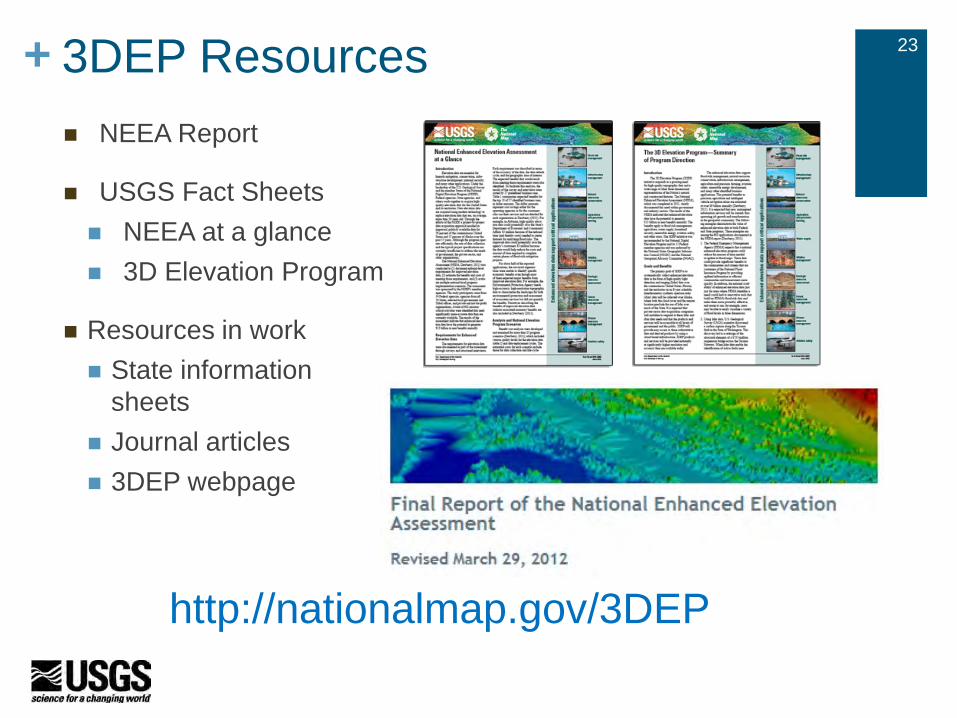
+ 3DEP Resources NEEA Report
USGS Fact Sheets NEEA at a glance 3D Elevation Program
Resources in work State information
sheets Journal articles 3DEP webpage
23
http://nationalmap.gov/3DEP

+
24

+ Next Steps for California Identify lead state agency and working group
Continue to build inventory and understanding about existing data
Refine state requirements, add program costs and determine real $$ benefits
Consider added business needs from county/regional requirements
Respond to Federal implementation and partnership strategies
Identify state sources of funding
Bring it all together: strategic planning
25
+
Carol Ostergren US Geological Survey National Geospatial Program 6000 J Street, CSUS Placer Hall Sacramento, CA 95819-6129 916-278-9510 (office); 916-278-9546 (fax) [email protected]
Drew Decker U.S. Geological Survey National Geospatial Program 4165 Spruance Road, Suite 200 San Diego, CA 92101 619-225-6430 619-417-2879 cell 619-225-6101 fax [email protected]
26

Questions?