using a regional index of biotic integrity (ibi) to ... · thank george sutton, barry harris, ......
TRANSCRIPT
Technical Note 190–13–1
Using a Regional Index of BioticIntegrity (IBI) to Characterizethe Condition of NorthernVirginia Streams, With Emphasison the Occoquan Watershed:
A Case StudyWetlandScienceInstitute

(Technical Note 190–13–1, WLI IBI Case Study, December 2001)
Using Regional IBI to Characterize Condition of Northern Virginia Streams: A case study
December 2001
The U.S. Department of Agriculture (USDA) prohibits discrimination in allits programs and activities on the basis of race, color, national origin, sex,religion, age, disability, political beliefs, sexual orientation, or marital orfamily status. (Not all prohibited bases apply to all programs.) Persons withdisabilities who require alternative means for communication of programinformation (Braille, large print, audiotape, etc.) should contact USDA’sTARGET Center at (202) 720-2600 (voice and TDD).
To file a complaint of discrimination, write USDA, Director, Office of CivilRights, Room 326W, Whitten Building, 14th and Independence Avenue, SW,Washington, DC 20250-9410 or call (202) 720-5964 (voice and TDD). USDAis an equal opportunity provider and employer.

(Technical Note 190–13–1, WLI IBI Case Study, December 2001) i
Using A Regional Index of Biotic Integrity(IBI) to Characterize the Condition of
Northern Virginia Streams, With Emphasison the Occoquan Watershed: A Case Study
Technical Note 190–13–1
Billy M. Teels1 and Thomas J. Danielson2,3
1U.S. Department of AgricultureNatural Resources Conservation Service
Wetland Science InstituteBuilding 109 Beech Forest Road
Laurel, MD 20708
2U.S. Environmental Protection AgencyOffice of Wetlands, Oceans, and Watersheds
401 M Street, SWWashington, DC 20460
3 now with
Maine Department of Environmental Protection17 State House Station
Augusta, ME 04333
ii (Technical Note 190–13–1, WLI IBI Case Study, December 2001)
We are greatly indebted to the Virginia Natural Resources ConservationService (NRCS) for their interest in this project and their significant help inall phases of the assessment. Specifically, we thank John Myers for hisliaison with the NRCS Wetland Science Institute and help in coordinatingschedules during the busy sampling season. We thank George Sutton andthe staff of the John Marshall Conservation District in Warrenton, Virginia,for their assistance in all aspects of the study and for allowing us to rendez-vous in their parking lot and offices with wet clothes and muddy feet. Wethank George Sutton, Barry Harris, Larry Wilkinson, David Weeks,
and Joe Thompson for helping locate property owner information so thatpermission could be secured for stream access. We thank Fred Garst forproviding GIS maps and reports that were critical in evaluating metricperformance and in developing the Index of Biotic Integrity (IBI). We ap-preciate the help of Rob Vreeland and the staff of the NRCS NationalCartography and Geospatial Center, Fort Worth, Texas, for developingmaps and assisting with GIS analysis. We appreciate the review of theproject's study design by Drs. Jim Karr and Paul Angermeier and reviewof the manuscript from NRCS scientists Bruce Newton, Betty McQuaid,
Kathryn Staley, and Charlie Rewa.
We thank the many landowners who afforded access to their properties andfor their interest in the outcome of this study.
Lastly, and most importantly, we thank the many people who helped dragthe seine over miles of Virginia stream, helping to form the reference baseand making the study possible, namely: Chris Swan, Steve Pugh, Shanna
Hamilton, Jay Vignola, the many staff of Virginia NRCS and ConservationDistricts, and the technicians and summer interns working at the PatuxentWildlife Research Center.
Acknowledgments

(Technical Note 190–13–1, WLI IBI Case Study, December 2001) iii
Introduction 1
The Occoquan Watershed 2
Land use trends ................................................................................................ 2
Watershed streams........................................................................................... 6
Methods 7
Classification of watershed streams .............................................................. 8
Targeted selection of sample sites ................................................................. 8
Collection of stream habitat and land use information............................... 8
Establishment of human disturbance gradient .......................................... 11
Identification of watershed fish fauna ........................................................ 13
Designation of guilds ..................................................................................... 15
Sampling of fish community ......................................................................... 15
Summarization of fish data by attributes .................................................... 19
Evaluation of attribute performance across gradient of human .............. 19
disturbance
Selection of metrics from best performing attributes ............................... 19
Scoring of metrics .......................................................................................... 19
Calculation of total IBI scores for all sites ................................................. 21
Interpretation of IBI; e.g., evaluation of project impacts .......................... 21
Metric evaluation and selection 23
Species composition and richness ............................................................... 23
Tolerance/intolerance .................................................................................... 26
Trophic structure ........................................................................................... 28
Fish reproduction, growth, and condition .................................................. 32
Results 35
Discussion 39
Efficacy of the IBI .......................................................................................... 39
Condition of the Streams .............................................................................. 39
Occoquan Watershed ........................................................................ 39
Goose Creek Watershed .................................................................... 40
Rappahannock Watershed ................................................................ 40
Use of IBI results in management decisions .............................................. 41
Technical Note 190–13–1 Using A Regional Index of BioticIntegrity (IBI) to Characterize theCondition of Northern VirginiaStreams, With Emphasis on theOccoquan Watershed: A Case Study

iv (Technical Note 190–13–1, WLI IBI Case Study, December 2001)
Using Regional IBI to Characterize Condition of Northern Virginia Streams: A case study
Literature cited 42
Appendix 45
Tables Table 1 List of species collected by watershed 13
Table 2 Biological groupings for fish species collected across 15
the three watersheds
Table 3 Metric evaluation process used to screen attributes to 20
select the 12 metrics that would best compose the IBI
Table 4 Study area sites and IBI scores by watershed and size class 21
Table 5 Biological Integrity classification system for study area 37
sites
Table 6 Pearson's correlation coefficients for individual SVAP 37
components and the IBI
Table 7 Location descriptions of fish sampling sites 47
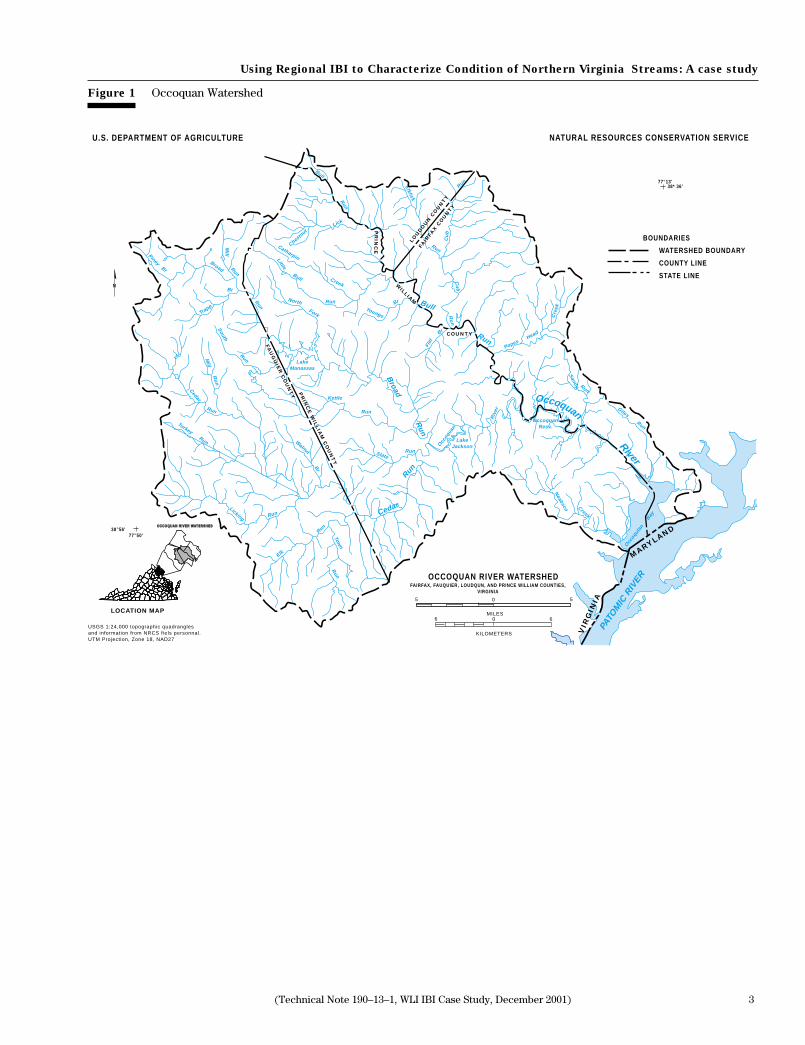
Figures Figure 1 Occoquan Watershed 3
Figure 2 Urban and non-urban land use in the Occoquan Basin: 4
1977–2020
Figure 3 Distribution of urban land use in the Occoquan Basin: 1989 5
Figure 4 Growth in impervious surface in the Occoquan Basin: 5
1977–2020
Figure 5 Growth of urban land and high-input turf in the Occoquan 6
Basin: 1977–2020
Figure 6 Loss of forest, pasture, and cropland in the Occoquan 6
Basin: 1977–2020
Figure 7 Sequence of activities in developing IBI 7
Figure 8 Study area watershed boundaries 9
Figure 9 Study area and fish sampling locations 10

(Technical Note 190–13–1, WLI IBI Case Study, December 2001) v
Using Regional IBI to Characterize Condition of Northern Virginia Streams: A case study
Figure 10 Criteria and scoring for Human Disturbance Index (HDI) 12
Figure 11 Sampling method: clockwise from upper left: (1) probing 17
undercut bank microhabitat, (2) sorting and recording fish,
(3) observing SVAP evaluation components within sample
reach, and (4) completing SVAP forms
Figure 12 Species-area curve patterns for selected sites ranging from 18
small, most-impaired (Bowens) to large, least-impaired
streams (Rappahannock)
Figure 13 River chub (Nocomis micropogon), representative for the 23
number of native species metric, and charts of metric
evaluation results
Figure 14 Tesselated darter (Etheostoma olmstedi), representative 24
for the number of darter species metric, and charts of
metric evaluation results
Figure 15 Common shiner (Luxilis cornutus), representative for 25
number of minnow species metric, and charts of metric
evaluation results
Figure 16 Fallfish (Semotilus corporalis) to creek chub (Semotilus 26
atromaculatus), examples of species typically involved
in retrogression of dominance, and charts of metric
evaluation results
Figure 17 Redfin pickerel (Esox americanus), representative for 27
number of intolerant species metric, and charts of
metric evaluation results
Figure 18 Green sunfish (Lepomis cyanellus), representative for 28
percent tolerant individuals metric and charts of metric
evaluation results
Figure 19 Silverjaw minnow (Notropis buccatus), representative for 29
percent omnivorous individuals metric, and charts of
metric evaluation results
Figure 20 Potomac sculpin (Cottus girardi), representative for 30
percent benthic invertivore metric, and charts of metric
evaluation results
Figure 21 Rockbass (Ambloplites rupestris), representative for 31
percent specialist carnivores - tolerants metric, and charts
of metric evaluation results

vi (Technical Note 190–13–1, WLI IBI Case Study, December 2001)
Using Regional IBI to Characterize Condition of Northern Virginia Streams: A case study
Figure 22 Stripeback darter (Percina notograma), representative 32
for percent simple lithophils - tolerants metric, and charts
of metric evaluation results
Figure 23 Northern hogsucker (Hypentelium nigricans), 33
representative for number of late maturing species
metric, and charts of metric evaluation results
Figure 24 Open lesion and blackspot disease, representing the 34
anomalies metric, and charts of metric evaluation results
Figure 25 Distribution of IBI scores by stream size, watershed, 35
and integrity class
Figure 26 Relationship of the IBI and Human Disturbance Index 36
(disturbance increases as Human Disturbance Index
values diminish)
Figure 27 Location of drainages classified as poor and very poor 36
Figure 28 Location of drainages classified as good and excellent 38
Figure 29 Correlation of IBI and SVAP scores 38

(Technical Note 190–13–1, WLI IBI Case Study, December 2001) 1
Using a Regional Index of Biotic Integrityto Characterize the Condition of Northern
Virginia Streams, With Emphasis on theOccoquan Watershed
A case study
Introduction
In his 1998 State of the Union Address, PresidentClinton announced a major new Clean Water Initiativeto speed the restoration of the Nation’s waterways(EPA 1998). This new initiative aims to achieve cleanwater by strengthening public health protections,targeting community-based watershed protectionefforts at high priority areas, and providing communi-ties with new resources to control polluted runoff. Theplan focuses on a watershed approach through whichunits of government, the public, and the private sectorwill work together to sustain the health of watershedsof the nation. In the plan, watersheds are recognizedas the key to future water resource improvementbecause clean water is the product of a healthy water-shed. Focusing on the whole watershed helps strikethe best balance among efforts to control point sourcepollution, polluted runoff, and protect drinking watersources and sensitive natural resources, such as wet-lands. Working at the watershed level also encouragesthe public to get involved in efforts to restore andprotect their water resources and is the foundation forbuilding strong, clean water partnerships.
Watersheds are ecosystems composed of a mosaic ofdifferent land cover patches that are connected by anetwork of streams. Watersheds function hydrologi-cally by collecting, storing, and discharging water, andecologically by providing diverse sites and pathwaysalong which environmental reactions take place andby providing habitat for flora and fauna. As our humanpopulation grows we affect our watersheds in manyways. The adverse effects of human influence havecaused major reductions in the ability of many water-sheds to sustain their functions and have resulted inthe marked decline or decimation of many aquaticspecies (Miller et al. 1989; Minckley and Deacon 1991;Warren et al. 1997).
The ability to measure and monitor watershed healthis key to identifying and solving natural resourceproblems. Although health of a watershed is an
abstract concept that cannot be measured directly, itcan be characterized by the stability of its aquaticecosystems, their ability to function within their poten-tial, and their ability for self-repair and maintenance.In most cases, the most direct and effective way toassess the health of a waterbody is to (1) measure thecondition of its biological communities, and (2) sup-port those data by measuring its physical and chemicalcharacteristics (Danielson 1998).
During the past century, biological monitoring hasevolved from the use of simple diversity indexes into avariety of approaches. One of the more recent andsuccessful approaches has been the development ofthe Index of Biotic Integrity (IBI), a multimetric ap-proach that uses species assemblages to assess thebiological condition of streams (Karr et al. 1986). Nowwell documented and widely used, the IBI combinesmultiple metrics with appropriate sampling design andstatistical analysis to evaluate a stream’s ability tosupport undisturbed living systems. Metrics, in contextof the IBI, are defined measurable components of abiological system that are empirically shown to changein value along a gradient of human disturbance (Karrand Chu 1997). Metrics are chosen for the IBI on thebasis of how well they reflect specific and predictableresponses of fish assemblages to human activities inthe watershed.
In addition to assessing the condition of streams, theIBI has also been used to assess conditions contribut-ing watersheds (Fausch et al. 1990; Roth et al. 1996;Wang et al. 1997). Several authors have used it toassess the impacts of various human disturbances onwatershed health (Berkman et al. 1986; Leonard andOrth 1986; Steedman 1988; and Hughes and Gammon1987). The technique, because of its firm ecologicalfoundation, is well suited for assessing the recovery ofaquatic ecosystems (Hughes et al. 1990). In addition,the IBI can help watershed managers make betterdecisions through an accurate evaluation of the healthfor each watershed sub-basin. Most of the UnitedStates (48 States) and Canadian provinces currentlyuse various versions of the IBI (Davis et al. 1996).

2 (Technical Note 190–13–1, WLI IBI Case Study, December 2001)
Using Regional IBI to Characterize Condition of Northern Virginia Streams: A case study
The Occoquan River Watershed in northern Virginia isthe focus of this study. It currently has the distinctionof having the water supply reservoir (Occoquan Reser-voir) with the greatest amount of wastewater inflowsand urban runoff of any in North America (Schueler1996). By 1996, the population of the watershed hadrisen three times above the suggested threshold forsafe drinking water, and projected growth is nearlyfive times the threshold by 2020. Urban land use hasclimbed from less than 7 percent of the watershedarea in the 1970s to a present level of 31 percent, andis projected to grow significantly more over the nextseveral years (Schueler 1996).
Because of the grave environmental concerns withinthe watershed, several studies have been commis-sioned to examine the problems and make recommen-dations for improvement. In a report to the AudubonNaturalist Society of the Mid-Atlantic States, Schueler(1996) recommended a comprehensive inventory ofthe physical and biological quality of the basin'sstreams and a plan for the protection of the ecologicalintegrity of those streams. This study, in part, ad-dresses that need by calculating an IBI for streamreaches that represent the majority of the watershed'ssub-basins and relating that information to humandisturbances. The study also provides an example ofhow the IBI can be used to determine a baseline condi-tion for watershed planning purposes and identifyproblem areas in need of remediation. The study alsoprovides a foundation for assessing the effectivenessof specific conservation practices and programs de-signed to improve the condition of streams in theChesapeake Bay Watershed (e.g., Conservation Re-serve Enhancement Program). With information fromthe IBI, watershed managers can more effectively andefficiently target activities to address natural resourceconcerns (Danielson 1998).
The Occoquan Watershed
Land use trends
The Occoquan Watershed is about 30 to 50 miles to thesouth and west of the Nation’s Capital (fig. 1). Theboundaries of the watershed lie in the counties ofLoudoun, Fairfax, Fauquier, and Prince William. Thedrainage area of the watershed is approximately416,000 acres, with basin elevations rising from nearlysea level at the mouth of the Occoquan River to about1,300 feet above sea level at Bull Run Mountain to thewest. Most of the watershed occurs within the Pied-mont physiographic province.
Since the 1950s, the watershed has been evolving froma rural landscape into a series of edge cities and subur-ban developments surrounding the Washington, D.C.,metropolitan area. Because of concerns with the watersupply, land use tracking within the basin has been aroutine element of the Occoquan Basin NonpointPollution Management Program since the late 1970s.Since that time, populations within the watershed haverisen dramatically. According to census records,approximately 255,000 people lived in the watershed in1990, twice the population recorded in 1977. Today,the watershed's population stands at about 300,000.Recent Census Bureau figures show Washington,D.C.'s, western fringe to be one of the fastest growingareas in the nation. For example, among counties withmore than 10,000 people, Loudoun County’s 7.7 per-cent growth for 1996-97 ranked eighth in the nation,and for 1998-99, its 8.1 percent growth ranked fifth.Since 1990, the human population in Loudoun Countyhas increased by more than 55 percent.
Urban land uses in the watershed in 1989 consisted ofover 78,000 acres of residential development, over4,000 acres of commercial development, and over8,000 acres of industrial development. In the 12 yearsbetween 1977 and 1989, more than 50,000 acres offorest and idle lands and 58,000 acres of agricultureand pasturelands were converted to urban use. In1989, about 25 percent of the watershed consisted ofurban development, which was concentrated primarilyin the watershed's eastern third.
Based on conservative estimates of future growthfrom the Center for Watershed Protection (Schueler1996), the trend toward suburban sprawl in theOccoquan Watershed will continue to increase. Forexample, urban land use comprised less than 10 per-cent of the total watershed area in 1977. Presently,
(Technical Note 190–13–1, WLI IBI Case Study, December 2001) 3
Using Regional IBI to Characterize Condition of Northern Virginia Streams: A case study
Figure 1 Occoquan Watershed
Occoquan
River
Giles
Run
Run
Sandy
OccoquanResv.
Occ
oqua
n
Riv
er
LakeJackson
Kettle
Broad
Run
Slate Run
LakeManassas
Run
Walnut
Br
South
RunMill
Run
Cedar
Run
TurkeyRun
Licking Run
Trapp
Br
Piney
Br
Broad
Run
Mill
Run
Catharpin
Creek
Little
Bull
RunNorth Fork
Chestnut
Lick
Bull
Run
Elklick
Run
Cu
b
Run
Youngs
Br
Flat
Br
Bull
RunPopes
Head
Cre
ek
Cu
bR
un
Elk
Run
Town
Run
Cedar
Run
Neabsco Creek
Occ
oqul
an
Bay
PATO
MIC
RIV
ER
FAU
GU
IER
CO
UN
TY PR
INC
E W
ILLIA
M C
OU
NT
Y
FAIR
FAX C
OU
NTY
LOU
DO
UN
CO
UN
TY
MARYLAND
VIR
GIN
IA
LOCATION MAP
USGS 1:24,000 topographic quadranglesand information from NRCS fiels personnal.UTM Projection, Zone 18, NAD27
KILOMETERS
MILES6 0 6
05 5
FAIRFAX, FAUQUIER, LOUDQUN, AND PRINCE WILLIAM COUNTIES,VIRGINIA
OCCOQUAN RIVER WATERSHED
PR
INC
E
COUNTY
WILLIAM
WATERSHED BOUNDARY
COUNTY LINE
STATE LINE
BOUNDARIES
38°56'77°50'
OCCOQUAN RIVER WATERSHED
77°13'38* 36'
NATURAL RESOURCES CONSERVATION SERVICEU.S. DEPARTMENT OF AGRICULTURE
N
4 (Technical Note 190–13–1, WLI IBI Case Study, December 2001)
Using Regional IBI to Characterize Condition of Northern Virginia Streams: A case study
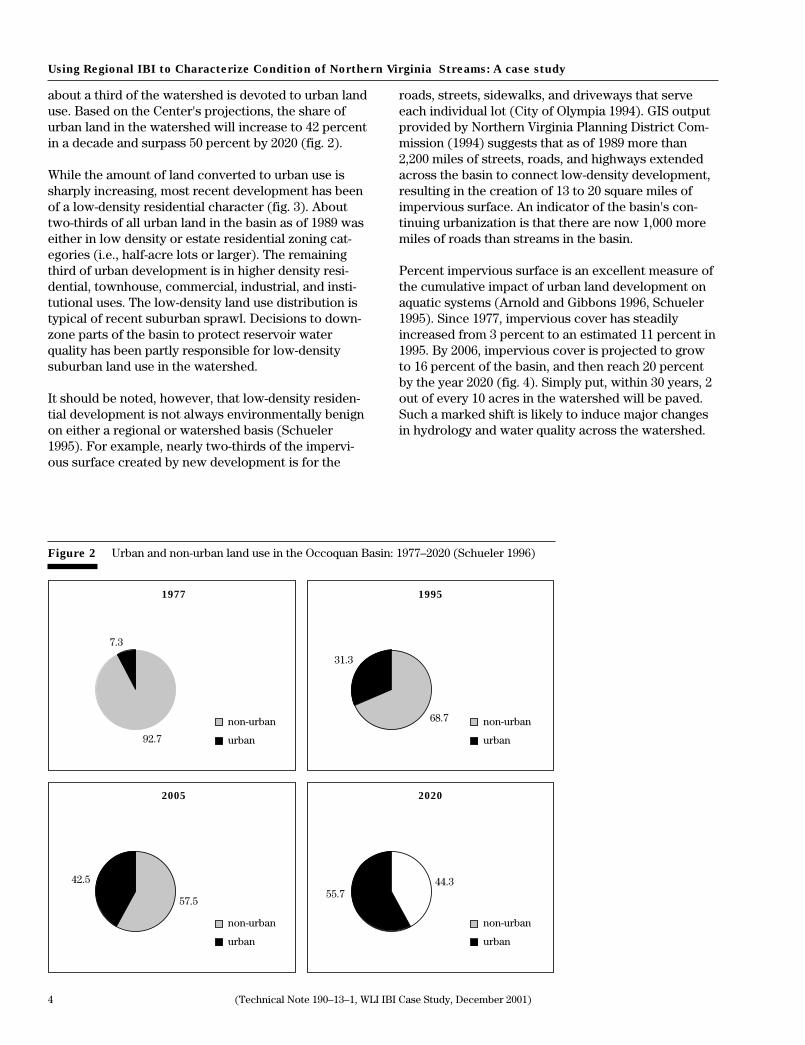
about a third of the watershed is devoted to urban landuse. Based on the Center's projections, the share ofurban land in the watershed will increase to 42 percentin a decade and surpass 50 percent by 2020 (fig. 2).
While the amount of land converted to urban use issharply increasing, most recent development has beenof a low-density residential character (fig. 3). Abouttwo-thirds of all urban land in the basin as of 1989 waseither in low density or estate residential zoning cat-egories (i.e., half-acre lots or larger). The remainingthird of urban development is in higher density resi-dential, townhouse, commercial, industrial, and insti-tutional uses. The low-density land use distribution istypical of recent suburban sprawl. Decisions to down-zone parts of the basin to protect reservoir waterquality has been partly responsible for low-densitysuburban land use in the watershed.
It should be noted, however, that low-density residen-tial development is not always environmentally benignon either a regional or watershed basis (Schueler1995). For example, nearly two-thirds of the impervi-ous surface created by new development is for the
roads, streets, sidewalks, and driveways that serveeach individual lot (City of Olympia 1994). GIS outputprovided by Northern Virginia Planning District Com-mission (1994) suggests that as of 1989 more than2,200 miles of streets, roads, and highways extendedacross the basin to connect low-density development,resulting in the creation of 13 to 20 square miles ofimpervious surface. An indicator of the basin's con-tinuing urbanization is that there are now 1,000 moremiles of roads than streams in the basin.
Percent impervious surface is an excellent measure ofthe cumulative impact of urban land development onaquatic systems (Arnold and Gibbons 1996, Schueler1995). Since 1977, impervious cover has steadilyincreased from 3 percent to an estimated 11 percent in1995. By 2006, impervious cover is projected to growto 16 percent of the basin, and then reach 20 percentby the year 2020 (fig. 4). Simply put, within 30 years, 2out of every 10 acres in the watershed will be paved.Such a marked shift is likely to induce major changesin hydrology and water quality across the watershed.
Figure 2 Urban and non-urban land use in the Occoquan Basin: 1977–2020 (Schueler 1996)
7.3
92.7
non-urban
urban
31.3
68.7 non-urban
urban
1977 1995
42.5
57.5
non-urban
urban
55.744.3
non-urban
urban
2005 2020

(Technical Note 190–13–1, WLI IBI Case Study, December 2001) 5
Using Regional IBI to Characterize Condition of Northern Virginia Streams: A case study
Figure 4 Growth in impervious surface in the OccoquanBasin: 1977–2020 (Schueler 1996)
25
20
15
10
5
01977 1997 2005
Year
Percen
t im
pervio
us c
over
2020
Despite the rapid suburban development,the watershed is still predominantlyrural, especially the western portion.Currently, approximately 70 percent ofthe entire watershed is either classifiedas agriculture, pasture, or forested/idlelands. Future development is expected tosharply reduce the acreage of forest,crops, and pasture in the basin (fig. 5).Collectively, these three rural land usesare projected to dwindle by 40 percent bythe year 2020. Cropland, in particular, isexpected to be reduced to less than40,000 acres in the next decade. On thepositive side, farmers are increasinglyusing conservation practices on theirland to reduce erosion and nutrientexport. For example, as of 1989, farmerswere employing conservation tillagepractices on nearly half the cropland inthe watershed. At the same time that
cropland is declining across the watershed, intensivelymanaged turf (lawns, golf courses) is rapidly increas-ing (fig. 6).
As the watershed takes on a more urban character,industrial land uses are expected to increase substan-tially. In 1989, more than 12 square miles of the water-shed were already classified as industrial. Industrialsites have the potential to become hotspots for manystormwater pollutants, such as hydrocarbons, tracemetals, and toxic pollutants. As this land use categorybecomes greater in size, the risk is higher for spills,leaks, and pollutant washoff and infiltration that couldaffect water quality.
Figure 3 Distribution of urban land use in the Occoquan Basin: 1989(Schueler 1996)
25
14
8
5
4
3
2
39
low density residential
estate residential
medium density residential
industrial
institutional
townhomes
commercial
golf courses

6 (Technical Note 190–13–1, WLI IBI Case Study, December 2001)
Using Regional IBI to Characterize Condition of Northern Virginia Streams: A case study
Watershed streams
Three major stream systems of approxi-mately equal proportions combine tocompose the Occoquan River: Bull Run,Broad Run, and Cedar Run. All begin inthe watershed's western rural portionand flow eastward where they unitenear the upper end of Occoquan Reser-voir. Land use patterns within thewestern portions of the three majorsystems are similar. The streams flowthrough three separate zones of thePiedmont before reaching the Potomacestuary (Hack 1982). The headwatersarise in the prominent ridges (e.g., BullRun Mountain) of the Outer Piedmontin predominantly forested landscapes.As the streams flow eastward, theytraverse a rural, rolling landscape ofinterspersed pasture and woodlandswith occasional cropland. Streams inthis part of the watershed generallyhave moderate gradient with frequentriffles composed of substrates of gravelor rubble, and sometimes boulder orbedrock. As the streams leave theFoothill Zone, they enter the more levellandscape of the Culpeper Basin, whereland use intensifies from both agricul-ture and suburban development.Streams within the Basin have gentlerslopes. Riffles and runs decrease infrequency and generally consist ofloose gravel composed of reddish shaleor sandstone derived from the parentmaterials that underlie the basin. Siltand embeddedness that are a result ofmodest land relief and two centuries offarming are common features of basinstreams. As the three main streamsflow eastward, they join in the InnerPiedmont. First, Cedar and Broad Rununite near the upper end of Lake Jack-son to form Occoquan Creek, whichlater joins Bull Run in the upper end ofOccoquan Reservoir to become theOccoquan River. This part of the water-shed is primarily residential with low tomedium density housing toward thecity of Manassas and higher densitydevelopments toward the watershed'seastern edge near Woodbridge (seefig. 1).
Figure 6 Loss of forest, pasture, and cropland in the Occoquan Basin: 1977–2020 (Schueler 1996)
1977
200,000
250,000
150,000
100,000
50,000
0
1979 1984 1989 1995 2005 2020
Urban
Cropland
Pasture
Forest
Year
Acres
Figure 5 Growth of urban land and high-input turf in the OccoquanBasin: 1977–2020 (Schueler 1996)
Year
Acres
1977 1979 1984 1989 1995 20052020
Turf
Urban
200
250
150
100
50
0

(Technical Note 190–13–1, WLI IBI Case Study, December 2001) 7
Using Regional IBI to Characterize Condition of Northern Virginia Streams: A case study
Methods
The IBI is a widely used approach for evaluating the health of streams.However, an IBI developed in one region generally cannot be applied inanother region without modification because of regional differences in fishfauna and environmental conditions. Essentially, an IBI must be built foreach regional assemblage based on knowledge of the range of observableresponses in the area and reference conditions derived from the region'sleast disturbed streams. The following hierarchical process was used todevelop the IBI for this study (fig. 7).
Figure 7 Sequence of activities in developing IBI (adapted from Karr et al. 1986)
Classification of watershedstreams
Targeted selection of samplesites
Collection of land use andstream habitat information
Establishment of humandisturbance gradient
Identification ofwatershed fish fauna
Designation of guilds
Sampling of fishcommunity
Summarization of fishdata by attributes
Evaluation of attributeperformance acrossgradient of human
disturbance
Selection of metrics frombest performing attributes
Rating of IBI metrics
Calculation of total IBIscore for all sites
Interpretation of IBI, e.g.,evaluation of project
impacts

8 (Technical Note 190–13–1, WLI IBI Case Study, December 2001)
Using Regional IBI to Characterize Condition of Northern Virginia Streams: A case study
Classification of watershedstreams
The process of developing an IBIbegins by selecting an appropri-ate sampling design, which isinfluenced by the scale at whichthe IBI is expected to function.A study area must be largeenough to represent the fullrange of human influence, butsmall enough to minimize theeffects from natural variables,such as stream size. One major
challenge is that there are few, if any, places left thathave not been influenced by human actions, particu-larly in the area surrounding the Washington suburbs.Some common pitfalls in sizing a study area andestablishing an appropriate reference include
• using local sites that are degraded rather thanlooking over a wide area of minimally disturbedsites,
• arbitrarily defining reference sites without ad-equate screening site evaluation, and
• classifying sites inaccurately so that degradedsites are put into reference sets (Karr and Chu1997).
The goal of this study was to inventory streams in theOccoquan River Watershed to determine their biologi-cal condition; however, as previously described thewatershed is rapidly developing, raising issue withwhether any streams in the watershed retain enoughintegrity to be used as least-impaired reference. Toaddress this issue, the study area was expanded intothe neighboring upper Rappahannock River and GooseCreek Watersheds. Those watersheds lie immediatelywest of the Occoquan and have much in common withit except for comparably less urban and suburbandevelopment. Thus, the IBI in this study was based ona 1997 to 1999 fish survey that included 157 sites ontributaries of the Occoquan River, upper Rappahan-nock River, and Goose Creek (fig. 8 and 9).
Stream drainage area size classes of less 17 squarekilometers, 17 to 34 square kilometers, and more than34 square kilometers were established within the studyarea to ensure the inclusion and even distribution ofdifferent size streams. The size of the three classeswas determined by 4 years of previous sampling in theOccoquan Watershed, which demonstrated similarityin species richness within those classes. ArcViewgeographic information system was used to delineateand calculate the drainage area above each sample siteon digital raster graph (DRG) topographic maps.
Targeted selection of sample sites
Since human influences arisefrom varied and complexsources, it may be virtuallyimpossible to represent thegradient of human disturbanceor select reference sites throughan entirely random approach.Rather, a targeted approach isrecommended to ensure that theends of the disturbance gradientare adequately reflected and that
relatively secure and accessible reference sites areavailable for sampling (Karr and Chu 1997). To helpcapture the ends of the gradient in the study area, fiveleast- and most-impaired sites from each stream sizeclass were identified prior to fish sampling based onan assessment of impairment using local land usemaps, aerial photography, and a field reconnaissance.Other sites were later added to ensure that the fullrange of disturbance was included, as well as a rela-tively even distribution of sample sites across thestudy area. Specific locations for each of the 157 sitesare listed and illustrated in the appendix (appendixtable 7 and fig. 35–37).
Collection of stream habitat andland use information
The need to test and validatebiological responses of indi-vidual metrics across degrees ofhuman influence is a core as-sumption of IBI (Karr and Chu1997). A metric is a measurablecomponent of a fish assemblagethat is empirically shown tochange in value along a gradientof human influence (e.g., totalnumber of species or the per-
centage of individuals that are omnivores) (Karr andChu 1997). Metrics are chosen on the basis of howwell they reflect specific and predictable biologicalresponses to human activities. Before starting the fieldsampling, enough information should be gatheredabout the watershed so that potential locations for fishsampling can be targeted and ranked from least tomost impaired along a gradient of disturbance. Suchinformation is generally gathered from both publishedinformation and field reconnaissance. In addition, theinformation gathered during this stage can help verifythat streams are classified correctly and provideinsights into why biological communities are damagedduring the IBI interpretation phase.

(Technical Note 190–13–1, WLI IBI Case Study, December 2001) 9
Using Regional IBI to Characterize Condition of Northern Virginia Streams: A case study
Fig
ure 8
Stud
y ar
ea w
ater
shed
bou
ndar
ies
Lees
burg
Mid
dleb
urg
Man
assa
s
War
rent
on
Was
hingt
on D
.C.
Woo
dbrid
ge
Spe
rryv
ille
Pur
cellv
ille
Rappa
hann
ock
R.
Hwy 21
1
I-66
Hwy 29
Potomac
I-95
River
Occ
oqua
n R
.
Hw
y 7
Hw
y 50
Goo
se C
k.
I-49
5
Virg
inia
Stu
dy A
rea
Map
laye
rs
1020
Mile
s0
10
Citi
es
Riv
ers
Wat
ersh
ed B
ound
ary
Inte
rsta
te
Prim
ary
road

10 (Technical Note 190–13–1, WLI IBI Case Study, December 2001)
Using Regional IBI to Characterize Condition of Northern Virginia Streams: A case study
Figure 9 Study area and fish sampling locations
The collection of habitat and land use information maybe greatly aided by a Geographic Information System(GIS). For example, several recent GIS studies havefound significant negative correlations between water-shed-wide agricultural or urban land uses and streamhealth, as represented by the IBI (Lenat and Crawford1994, Richards et al. 1996, Roth et al. 1996, Wang et al.1997). Although GIS can be a powerful tool for helpingdefine a disturbance gradient, it is not a replacement,or even a good surrogate, for the IBI itself or for bio-logical monitoring (Karr and Chu 1997). In addition tothe broad spatial relationships examined by GIS, on-site visits are generally required to define more localimpacts.
A number of onsite techniques have been developed toassess the habitat of streams; for example: USEPA,Rapid Bioassessment Procedures (RBP) and EMAP;Ohio EPA, Qualitative Habitat Evaluation Index
(QHEI); and NRCS, Stream Visual Assessment Proto-col (SVAP) (USDA 1998). SVAP was chosen as theonsite assessment technique. This technique is de-signed to assess on-farm reach impairments withprivate landowners based primarily on physical condi-tions of the stream, which aligns closely with the goalsof our study. The SVAP technique was independentlyapplied by three members of the crew after conductingthe fish survey at each site.
ArcView was used to delineate drainage areas aboveeach sample site and overlaid data layers to calculatethe percentage of cropland, pastureland, rural nonagri-cultural land, and urban land within those drainages.Land use information was obtained from the VirginiaGeographic Information System (VirGIS) and theVirginia Gap Analysis.

(Technical Note 190–13–1, WLI IBI Case Study, December 2001) 11
Using Regional IBI to Characterize Condition of Northern Virginia Streams: A case study
Establishment of human distur-bance gradient
Once sites have been targetedfor selection into the referenceand land use and habitat infor-mation have been gathered, thesites should be ranked accordingto degrees of human distur-bance. This is important toensure that metrics are sensi-tive. Human disturbance servesas the gradient along the X-axisto which biological attribute
data along the Y-axis are compared. Determining thedisturbance gradient must be done before samplingbegins, rather than as an afterthought. The reason forthis is that post-hoc categorization may reveal that thefull range of human disturbance was not captured,thus requiring additional sampling or limiting theusefulness of the IBI.
In most circumstances, diverse human activities inter-act to affect conditions in watersheds, waterbodies, orstream reaches (Karr and Chu 1997). In fact, it isvirtually impossible to find regions influenced by onlya single human activity, thus making the disturbancegradient difficult to construct. Where there is adequateinformation, the development and use of a HumanDisturbance Index (HDI) may greatly help to definethe disturbance gradient (Karr and Chu 1997). Such anindex should incorporate values representing variousdegrees and combinations of prevailing human distur-bances for all sites, not just the least- and most-dis-turbed. Although a standard protocol for constructingsuch an index does not exist, it should be derived froma variety of disturbances rather than from a singlesource. Furthermore, the disturbances should berepresented from both watershed and local scales. Forexample, scores from the landscape (e.g., percentcropland, pastureland and urban land) should becombined with scores from onsite assessments.
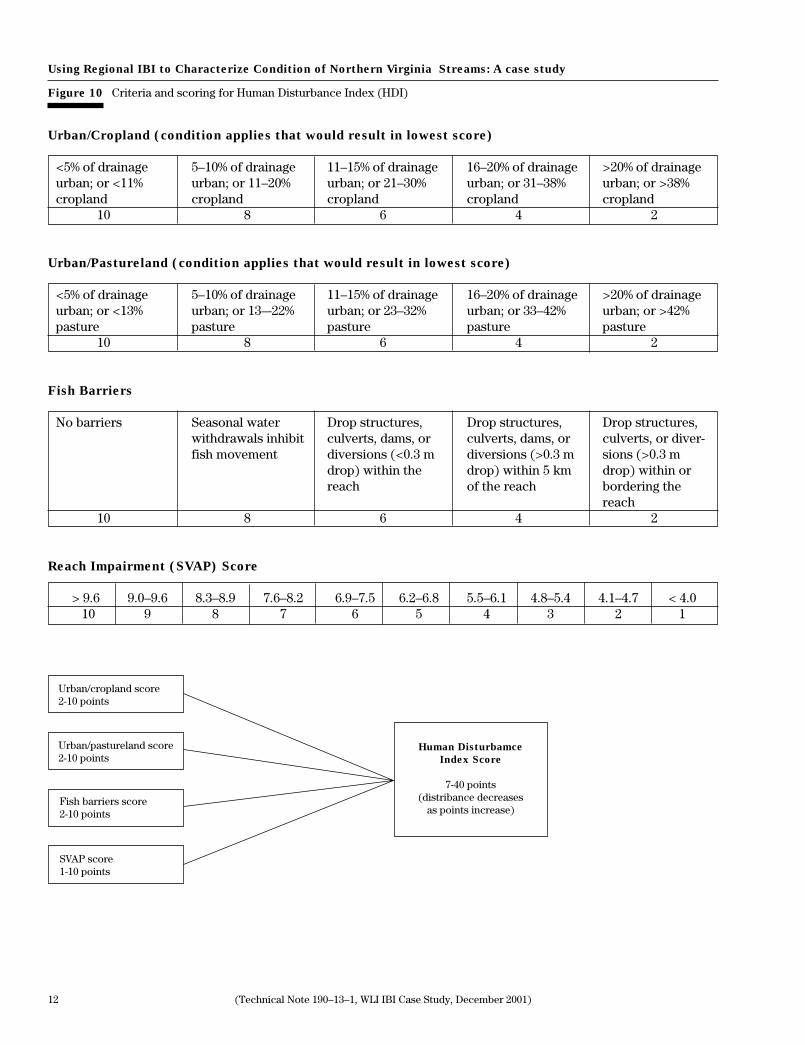
In this study, an HDI was developed for the regionbased on
• percent of drainage above each sample reach incropland, pasture, or urban land uses;
• proximity of the sample reach to fish barriers;and
• an assessment of onsite impairments within eachreach using results from the NRCS Stream VisualAssessment Protocol (1998) (fig. 10).
Land use scores were assigned by determining thepercentage of urban land, cropland, and pastureland inthe drainage area above each fish sampling location.Criteria for land use scoring were then established bydividing the minimum and maximum percentages overall the drainages into equal fifths for each land use.Scoring was then accomplished by assigning scores tothe resulting categories, with categories having thegreatest land use intensity receiving the lowest score,following the process illustrated in figure 10. Becausea combination of percentages of land use could occurwithin each drainage, the process used the combina-tion and percentage that was most limiting to deter-mine the score. For example, if greater than 20 percentof a drainage was urban, then it would score only 2points for both the cropland/urban land andpastureland/urban land components, without regard tohow much cropland or pastureland was actuallypresent. Likewise, if less than 5 percent of a drainagewas urban, and between 21 and 30 percent was crop-land, then it would score 4 for the urban/croplandcomponent. Scores for proximity to fish barriers wereassigned based on the Stream Visual Assessment Pro-tocol (USDA 1998). Proximity of sample locations tofish barriers was determined through interpretation ofUSGS topography maps and USDA aerial photographyand by observations made during the reach assess-ments. Stream Visual Assessment Protocol scoreswere determined by dividing the range of SVAP resultsover all sites into equal tenths and assigning scoresbased on the process illustrated in figure 10.
12 (Technical Note 190–13–1, WLI IBI Case Study, December 2001)
Using Regional IBI to Characterize Condition of Northern Virginia Streams: A case study
Urban/cropland score2-10 points
Urban/pastureland score2-10 points
Human Disturbamce
Index Score
7-40 points(distribance decreases
as points increase)Fish barriers score2-10 points
SVAP score1-10 points
Urban/Cropland (condition applies that would result in lowest score)
<5% of drainage 5–10% of drainage 11–15% of drainage 16–20% of drainage >20% of drainageurban; or <11% urban; or 11–20% urban; or 21–30% urban; or 31–38% urban; or >38%cropland cropland cropland cropland cropland
10 8 6 4 2
Urban/Pastureland (condition applies that would result in lowest score)
<5% of drainage 5–10% of drainage 11–15% of drainage 16–20% of drainage >20% of drainageurban; or <13% urban; or 13–-22% urban; or 23–32% urban; or 33–42% urban; or >42%pasture pasture pasture pasture pasture
10 8 6 4 2
Fish Barriers
No barriers Seasonal water Drop structures, Drop structures, Drop structures,withdrawals inhibit culverts, dams, or culverts, dams, or culverts, or diver-fish movement diversions (<0.3 m diversions (>0.3 m sions (>0.3 m
drop) within the drop) within 5 km drop) within orreach of the reach bordering the
reach10 8 6 4 2
Reach Impairment (SVAP) Score
> 9.6 9.0–9.6 8.3–8.9 7.6–8.2 6.9–7.5 6.2–6.8 5.5–6.1 4.8–5.4 4.1–4.7 < 4.010 9 8 7 6 5 4 3 2 1
Figure 10 Criteria and scoring for Human Disturbance Index (HDI)
(Technical Note 190–13–1, WLI IBI Case Study, December 2001) 13
Using Regional IBI to Characterize Condition of Northern Virginia Streams: A case study
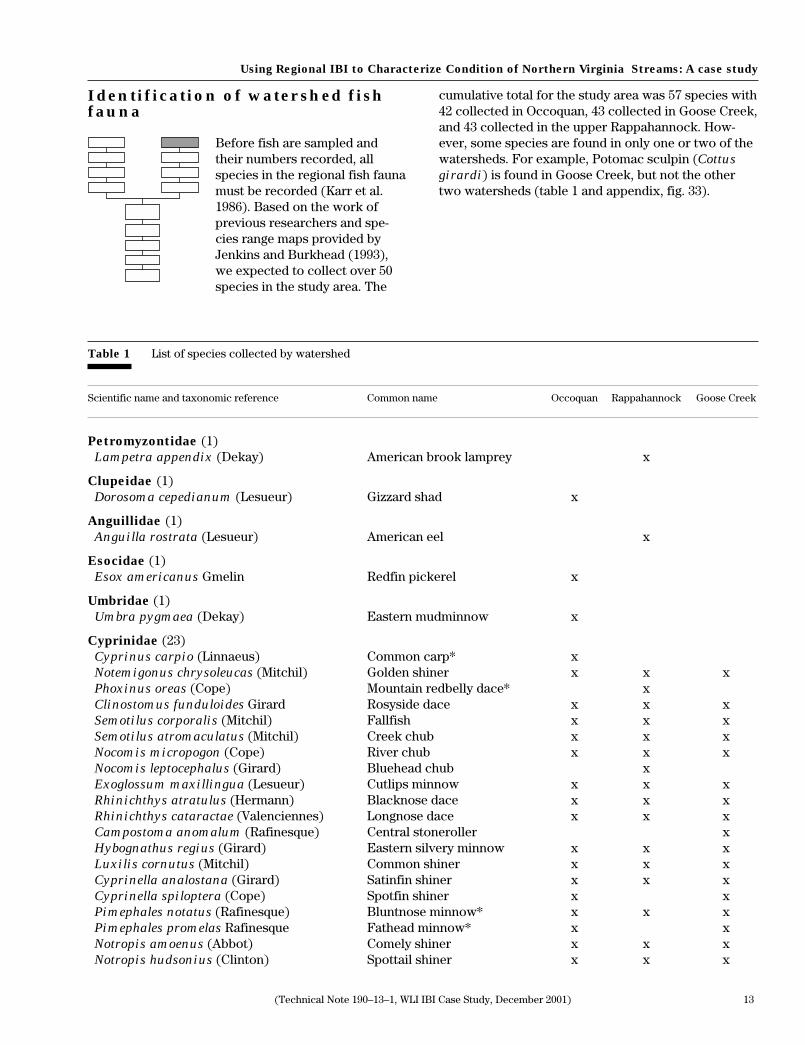
Identification of watershed fishfauna
Before fish are sampled andtheir numbers recorded, allspecies in the regional fish faunamust be recorded (Karr et al.1986). Based on the work ofprevious researchers and spe-cies range maps provided byJenkins and Burkhead (1993),we expected to collect over 50species in the study area. The
cumulative total for the study area was 57 species with42 collected in Occoquan, 43 collected in Goose Creek,and 43 collected in the upper Rappahannock. How-ever, some species are found in only one or two of thewatersheds. For example, Potomac sculpin (Cottus
girardi) is found in Goose Creek, but not the othertwo watersheds (table 1 and appendix, fig. 33).
Table 1 List of species collected by watershed
Scientific name and taxonomic reference Common name Occoquan Rappahannock Goose Creek
Petromyzontidae (1)Lampetra appendix (Dekay) American brook lamprey x
Clupeidae (1)Dorosoma cepedianum (Lesueur) Gizzard shad x
Anguillidae (1)Anguilla rostrata (Lesueur) American eel x
Esocidae (1)Esox americanus Gmelin Redfin pickerel x
Umbridae (1)Umbra pygmaea (Dekay) Eastern mudminnow x
Cyprinidae (23)Cyprinus carpio (Linnaeus) Common carp* xNotemigonus chrysoleucas (Mitchil) Golden shiner x x xPhoxinus oreas (Cope) Mountain redbelly dace* xClinostomus funduloides Girard Rosyside dace x x xSemotilus corporalis (Mitchil) Fallfish x x xSemotilus atromaculatus (Mitchil) Creek chub x x xNocomis micropogon (Cope) River chub x x xNocomis leptocephalus (Girard) Bluehead chub xExoglossum maxillingua (Lesueur) Cutlips minnow x x xRhinichthys atratulus (Hermann) Blacknose dace x x xRhinichthys cataractae (Valenciennes) Longnose dace x x xCampostoma anomalum (Rafinesque) Central stoneroller xHybognathus regius (Girard) Eastern silvery minnow x x xLuxilis cornutus (Mitchil) Common shiner x x xCyprinella analostana (Girard) Satinfin shiner x x xCyprinella spiloptera (Cope) Spotfin shiner x xPimephales notatus (Rafinesque) Bluntnose minnow* x x xPimephales promelas Rafinesque Fathead minnow* x xNotropis amoenus (Abbot) Comely shiner x x xNotropis hudsonius (Clinton) Spottail shiner x x x

14 (Technical Note 190–13–1, WLI IBI Case Study, December 2001)
Using Regional IBI to Characterize Condition of Northern Virginia Streams: A case study
Table 1 List of species collected by watershed—Continued
Scientific name and taxonomic reference Common name Occoquan Rappahannock Goose Creek
Cyprinidae (continued)Notropis procne (Cope) Swallowtail shiner x x xNotropis rubellus (Agassiz) Rosyface shiner x x xNotropis buccatus (Cope) Silverjaw minnow x x
Catostomidae (6)Catostomus commersoni (Lacepede) White sucker x x xErimyzon oblongus (Mitchil) Creek chubsucker x x xHypentelium nigricans (Lesueur) Northern hogsucker x x xThoburnia rhothoeca (Thoburn) Torrent sucker* xMoxostoma erythrurum (Rafinesque) Golden redhorse* x xMoxostoma macrolepidotum (Lesueur) Shorthead redhorse x
Ictaluridae (4)Ictalurus punctatus (Rafinesque) Channel catfish* xAmeiurus natalis (Lesueur) Yellow bullhead x x xAmeiurus nebulosus (Lesueur) Brown bullhead x x xNoturus insignis (Richardson) Margined madtom x x x
Fundulidae (1)Fundulus diaphanus (Lesueur) Banded killifish x x
Poeciliidae (1)Gambusia holbrooki (Girard) Eastern mosquitofish x x x
Cottidae (2)Cotus bairdi (Girard) Mottled sculpin xCottus girardi Robins Potomac sculpin x
Centrarchidae (9)Lepomis auritus (Linnaeus) Redbreast sunfish x x xLepomis cyanellus (Rafinesque) Green sunfish* x x xLepomis gibbosus (Linnaeus) Pumpkinseed x x xLepomis macrochirus (Rafinesque) Bluegill* x x xLepomis microlophus (Gunther) Redear sunfish* xAmbloplites rupestris (Rafinesque) Rock bass* x xPomoxis annularis (Rafinesque) White crappie* x x xMicropterus dolomieu (Lacepede) Smallmouth bass* x x xMicropterus salmoides (Lacepede) Largemouth bass* x x x
Percidae (6)Percina peltata (Stauffer) Shield darter x x xPercina notogramma (Raney) Stripeback darter xEtheostoma olmstedi Storer Tesselated darter x x xEtheostoma vitreum (Cope) Glassy darter xEtheostoma flabellare (Rafinesque) Fantail darter x xEtheostoma blennioides (Rafinesque) Greenside darter* x
* Indicates non-native species.

(Technical Note 190–13–1, WLI IBI Case Study, December 2001) 15
Using Regional IBI to Characterize Condition of Northern Virginia Streams: A case study
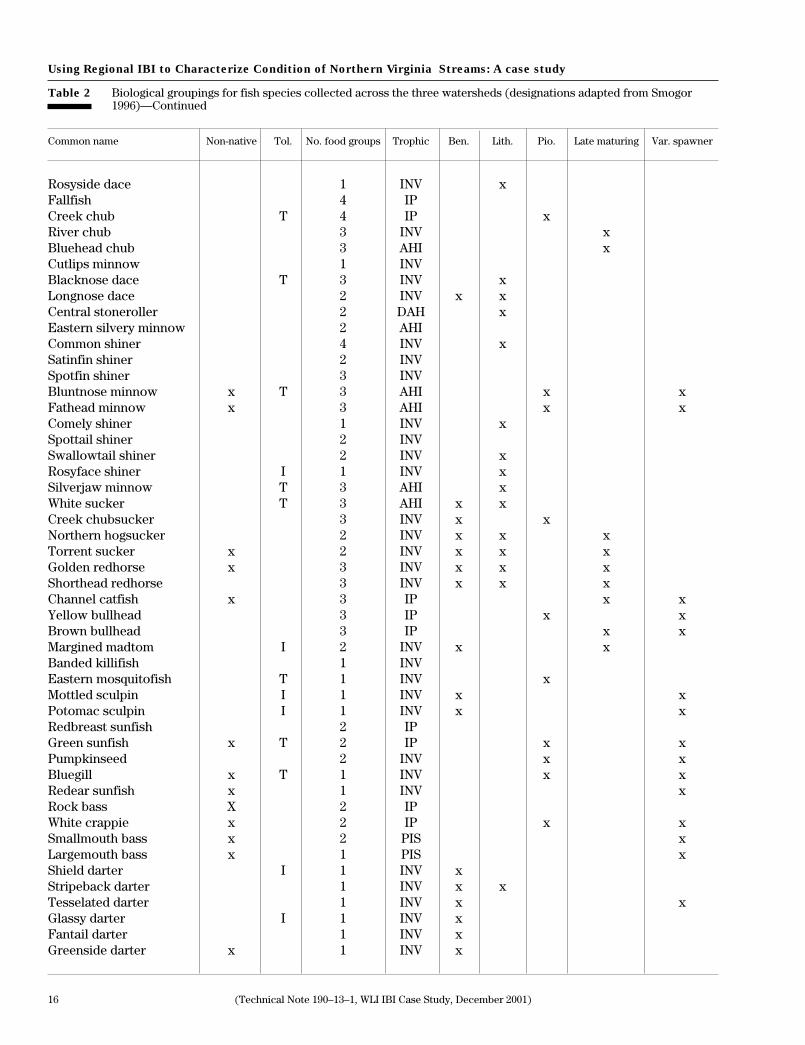
Designation of guilds
The IBI requires the classifica-tion of species from the regionalfish fauna into a number ofbiological groupings, or guilds,from which potential metrics(attributes) are proposed,tested, and selected as metricsfor the IBI. Before fish aresampled and their numbersrecorded, all species in theregional fish fauna must be
characterized according to food requirements, toler-ance status, and other such characteristics (table 2).With few exceptions, the biological groupings for thisstudy follow Smogor (1996), who classified freshwaterfish species in over 140 Virginia collections for pur-poses of IBI development. One notable exception isthe classification for tolerant and intolerant species. Inthis case, only the species collected in the study areawere used as the basis for designations, whereasSmogor used species collected over the entire state.Karr and Chu (1997) recommended including no morethan 5 to 15 percent of the species in the regionalfauna to be designated as tolerant or intolerant. Since57 species were collected in the study area (Occoquan,upper Rappahannock, and Goose Creek combined), 8species were designated as tolerant and intolerant forthe study area (approximately 14%) (table 2).
Sampling of fish community
A basic premise of IBI is that theentire fish fauna has beensampled in its true relativeabundance without bias towardtaxa or size of fish (Karr et al.1986). As this assumption isrelaxed, the reliability of infer-ences based on the IBI is re-duced. However, with anymethod there are certain inher-ent biases that affect the quality
of the sample. Therefore, it is important to understandmethod limitations and adhere as strictly as possibleto sampling protocols to maintain consistency of dataand reduce sampling variability.
Seines were chosen as the method to collect fish inthis study. Seines are reportedly the best tool forsampling fish in small, relatively simple streams (Karret al. 1986). They are inexpensive, simple, easy to use,and seldom break down. In addition, seining can beemployed with less fish mortality than certain othertechniques, such as electrofishing. Seines are alsorelatively nonselective for different sizes of fish,whereas a higher rate of capture of large fish thansmall fish may occur in electrofishing (Cooper 1952,Johnson 1965). However, as several studies havesuggested, seining also has a number of disadvantages
Table 2 Biological groupings for fish species collected across the three watersheds (designations adapted from Smogor1996)
Non-native: Species considered by Jenkins and Burkhead (1993) to be non-native to the above drainages.Tol: Species designated as tolerant or intolerant (each limited to 15% of the total fauna).No. food groups: Number of food groups upon which a species normally relies.Trophic groups: PIS = piscivore, INV = invertivore, AHI = algivore/herbivore/invertivore,
IP = invertivore/piscivore, DAH = detritivore/algivore/herbivoreBen: Species considered benthic (bottom dwelling).Lith: Species considered simple lithophils (scatter their eggs in gravel and provide no care for their young).Late maturing: Species that normally do not breed until at least their third year.Var. spawner: Species that can manipulate various substrates to spawn.
Common name Non-native Tol. No. food groups Trophic Ben. Lith. Pio. Late maturing Var. spawner
American brook lamprey I 2 DAH x xGizzard shad 2 AHI xAmerican eel 2 IP xRedfin pickerel I 1 PISEastern mudminnow 1 INV xCommon carp x 4 AHI x x xGolden shiner 2 AHI xMountain redbelly dace x 3 DAH x
16 (Technical Note 190–13–1, WLI IBI Case Study, December 2001)
Using Regional IBI to Characterize Condition of Northern Virginia Streams: A case study
Table 2 Biological groupings for fish species collected across the three watersheds (designations adapted from Smogor1996)—Continued
Common name Non-native Tol. No. food groups Trophic Ben. Lith. Pio. Late maturing Var. spawner
Rosyside dace 1 INV xFallfish 4 IPCreek chub T 4 IP xRiver chub 3 INV xBluehead chub 3 AHI xCutlips minnow 1 INVBlacknose dace T 3 INV xLongnose dace 2 INV x xCentral stoneroller 2 DAH xEastern silvery minnow 2 AHICommon shiner 4 INV xSatinfin shiner 2 INVSpotfin shiner 3 INVBluntnose minnow x T 3 AHI x xFathead minnow x 3 AHI x xComely shiner 1 INV xSpottail shiner 2 INVSwallowtail shiner 2 INV xRosyface shiner I 1 INV xSilverjaw minnow T 3 AHI xWhite sucker T 3 AHI x xCreek chubsucker 3 INV x xNorthern hogsucker 2 INV x x xTorrent sucker x 2 INV x x xGolden redhorse x 3 INV x x xShorthead redhorse 3 INV x x xChannel catfish x 3 IP x xYellow bullhead 3 IP x xBrown bullhead 3 IP x xMargined madtom I 2 INV x xBanded killifish 1 INVEastern mosquitofish T 1 INV xMottled sculpin I 1 INV x xPotomac sculpin I 1 INV x xRedbreast sunfish 2 IPGreen sunfish x T 2 IP x xPumpkinseed 2 INV x xBluegill x T 1 INV x xRedear sunfish x 1 INV xRock bass X 2 IPWhite crappie x 2 IP x xSmallmouth bass x 2 PIS xLargemouth bass x 1 PIS xShield darter I 1 INV xStripeback darter 1 INV x xTesselated darter 1 INV x xGlassy darter I 1 INV xFantail darter 1 INV xGreenside darter x 1 INV x
(Technical Note 190–13–1, WLI IBI Case Study, December 2001) 17
Using Regional IBI to Characterize Condition of Northern Virginia Streams: A case study
that may, if not properly addressed, inappropriatelyinfluence the IBI. For example, in several studiesseining was found to underestimate species richnessin streams with slab boulders and cobbles, whichinterfered with efficient use of the seine (Hoover 1938;Yoder and Smith 1999).
In addition, in Ohio seining was found to producevariable results caused by differing levels of skillbetween field crews (Ohio EPA 1998). Finally, thenumber of large fish may be underestimated becausethey are more likely to evade the seine.
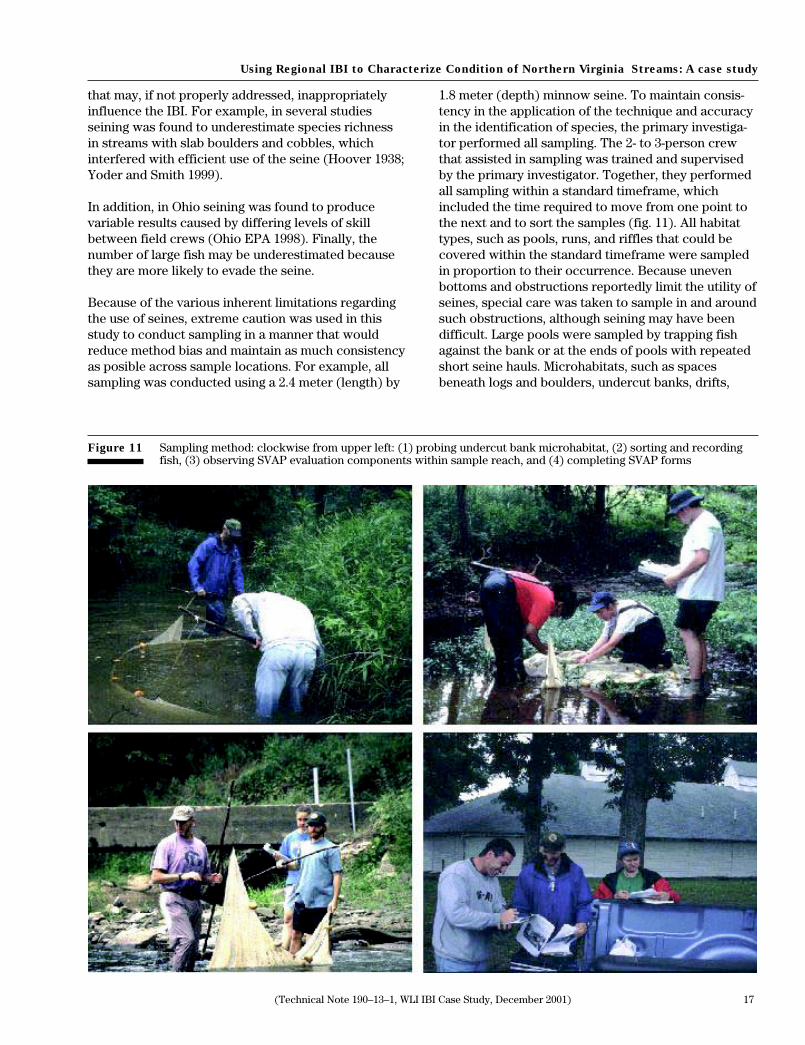
Because of the various inherent limitations regardingthe use of seines, extreme caution was used in thisstudy to conduct sampling in a manner that wouldreduce method bias and maintain as much consistencyas posible across sample locations. For example, allsampling was conducted using a 2.4 meter (length) by
Figure 11 Sampling method: clockwise from upper left: (1) probing undercut bank microhabitat, (2) sorting and recordingfish, (3) observing SVAP evaluation components within sample reach, and (4) completing SVAP forms
1.8 meter (depth) minnow seine. To maintain consis-tency in the application of the technique and accuracyin the identification of species, the primary investiga-tor performed all sampling. The 2- to 3-person crewthat assisted in sampling was trained and supervisedby the primary investigator. Together, they performedall sampling within a standard timeframe, whichincluded the time required to move from one point tothe next and to sort the samples (fig. 11). All habitattypes, such as pools, runs, and riffles that could becovered within the standard timeframe were sampledin proportion to their occurrence. Because unevenbottoms and obstructions reportedly limit the utility ofseines, special care was taken to sample in and aroundsuch obstructions, although seining may have beendifficult. Large pools were sampled by trapping fishagainst the bank or at the ends of pools with repeatedshort seine hauls. Microhabitats, such as spacesbeneath logs and boulders, undercut banks, drifts,

18 (Technical Note 190–13–1, WLI IBI Case Study, December 2001)
Using Regional IBI to Characterize Condition of Northern Virginia Streams: A case study
logjams, gravel riffles, and aquatic vegetation, weresampled by disturbing the area and then quickly sein-ing through. Each microhabitat was sampled as com-prehensively as possible to avoid missing species ormisrepresenting relative abundance.
To reduce identification error and temporal bias toyoung-of-the-year fish, only specimens more than 25mm long were enumerated and included in the data(Angermeier and Karr 1986). These were identified tospecies, counted, recorded, and then released backinto the stream. Specimens that could not be identifiedwere preserved in 10 percent formalin and taken to thelaboratory for identification. All sampling was con-ducted between late May and mid-September, indaylight hours, and during periods of low flow. In thispart of the country, we are well into the growingseason by late May. The trees all have leaves, and it isthe peak migration period for songbirds. Observationsof hybrids and, anomalies were also enumerated andrecorded on data sheets.
Our level of sample effort was determined interac-tively by sampling some of the watersheds’ lesserimpaired streams prior to the 1997-99 fish survey toassess the length of stream or amount of time neces-sary to secure an adequate sample. Through thatprocess, we found that we were unable to achieveconsistent results and frequently underestimatedspecies richness when the sample reach was based onfixed lengths of various dimensions (up to 300meters). Other studies have demonstrated that stan-dard sample lengths may not always be long enough toaccount for discontinuity in fish distributions(Angermeier and Smogor 1994, Lyons 1992). There-fore, species composition or relative abundanceshould not be misrepresented because sampling efforthas been too little. Angermeier and Smoger (1994)recommend interactive approaches to ensure that thelength of the sample reach is adequate. For example,they suggest maintaining a cumulative list of speciesfound and to stop sampling when a predeterminednumber of additional sampling efforts fail to yieldadditional species. Lyons (1992) concludes that mean-ingful estimates of species richness for assessmentscan be achieved only if the length of each streamsegment sampled approaches or exceeds the length atwhich the cumulative species number becomes asymp-totic. Accordingly, for electrofishing, he recommendedsampling 35 times the mean stream width to yield an
acceptable estimate of species richness. However, heacknowledged that that distance might not be appro-priate for all sampling gears.
Because seining is generally considered to be a morepassive sampling technique and because all of ourefforts to produce consistent results using fixedlengths met with failure, we tested a 2-hour time limitas a standard for sampling instead. The 2-hour limitwas set by sampling some of the region's least im-paired and most physically complex streams anddetermining the amount of time it would take for thecumulative species number to become asymptotic(species/area curve begins to level off indicatingdiminishing returns per sample effort). In our analysis,the amount of time required to reach diminishingreturns differed somewhat among streams; however, itwas always encountered well before the 2-hour framehad elapsed. In addition, during the 1997-99 fish sur-vey, species-area curves were plotted for streamsfrom a variety of size classes and degrees of impair-ment to help confirm our previous analysis (fig. 12). Inall instances, sampling within the specified timeframeproduced an asymptotic curve. Although no standarddistances were covered with this method, the length ofstream sampled for all sites was generally well inexcess of 300 meters (range = 237.3 – 955.4, mean =662.3, sd. = 117.1).
Figure 12 Species-area curve patterns for selected sitesranging from small, most-impaired (Bowens)to large, least-impaired streams(Rappahannock)
30
25
20
15
10
5
00 20 40 60 80 100 120
Nu
mb
er o
f sp
ecie
s
Time (minutes)
Bowens
Marsh
Tuscarora
Indian
Sycoline
Rappahannock
xxxxx
xxxx
x
xx
xxxxxxxxxx
xx
x
x

(Technical Note 190–13–1, WLI IBI Case Study, December 2001) 19
Using Regional IBI to Characterize Condition of Northern Virginia Streams: A case study
Summarization of fish data byattributes
After defining the regional fishfauna and classifying speciesinto the appropriate biologicalgroupings, attributes were thendeveloped. Attributes, in thecontext of biological assess-ments, are defined as measur-able components of a biologicalsystem that are expected toincrease or decrease along agradient of human disturbance
(Karr and Chu 1997). Our attributes were chosenbased on the original Karr et al. 1986 metrics andmetrics proven to be successful in neighboring regions(Ohio EPA 1988, Hall et al. 1996, and Smogor 1996).We identified 28 attributes of the fish assemblage touse as candidate metrics (table 3). Using a MicrosoftExcel spreadsheet, values for the 28 attributes werecalculated for each of the 157 sampling locations.
Evaluation of attribute perform-ance across gradient of humandisturbance
The need to test and validatebiological responses of metricsacross degrees of human influ-ence is a core assumption of IBI(Karr and Chu 1997). Metrics areattributes empirically shown tochange in value along that gradi-ent. The biological metricsincorporated into a multimetricindex are selected because they
• reflect specific and predictable responses oforganisms to changes in landscape condition,
• are minimally affected by natural variability,• are sensitive to a range of factors that stress
biological systems, and• are relatively easy to measure and interpret (Karr
and Chu 1997).
Metric selection involved a screening process in whicheach of the 28 attributes were tested against the fol-lowing criteria in the listed sequence:
1. Did the attribute distinctly separate (p <0.05)the least from the most impaired sites (appendix,fig. 30)?
2. Was the attribute closely correlated (r >.25,p <0.1) with the Human Disturbance Index(appendix, fig. 31)?
3. Did the metric perform, within a given metriccategory, substantially better than one of theoriginal Karr et al. (1986) metrics?
After certain metrics had been eliminated through thisprocess, the remaining were assessed for redundancyby comparing the similarity in species composition ofmetrics within each metric category (table 3). Even ifcertain metrics survived the initial screening steps, asindicated by the Yes mark in the first three columns oftable 3, only the least redundant were chosen for theIBI, as indicated by the checkmark in the last column.
Selection of metrics from bestperforming attributes
Ideally, metrics selected for anIBI should be sensitive to arange of biological stresses andnot narrowly focused on oneparticular aspect of the commu-nity or another (e.g., speciesrichness). Each chosen metricshould reflect the quality of adifferent aspect of biota thatresponds in a different mannerto stream disturbances (Hughes
and Noss 1992). In selecting metrics, all the criterialisted in the previous step were considered in view ofachieving some overall balance by having each of thecategories (e.g., species composition and richness,trophic balance) represented in the IBI. Thus, metricswere selected based on how well they performedwithin the categories, rather than in the IBI overall. Adescription of metric function and the rationale forinclusion of each metric into the IBI are in the Resultssection.
Scoring of metrics
The selected metrics werescored by assigning values of 5,3, or 1 depending on whether thedata they represent are compa-rable to, deviate somewhat from,or deviate greatly from valuesexhibited by the watersheds'least-impaired streams, respec-tively (Karr et al. 1986). Sincecertain metrics tend to increaseor decrease in value with in-
creasing stream size (Smogor and Angermeier 1999),scoring for all metrics were based on the trisection

20 (Technical Note 190–13–1, WLI IBI Case Study, December 2001)
Using Regional IBI to Characterize Condition of Northern Virginia Streams: A case study
technique described by Lyons (1992) that considerssize of drainage in the scoring process (appendix, fig.32). For metrics positively correlated to the HDI,values falling in the higher range scored a 5, those inthe middle scored a 3, and those in the lower thirdscored a 1. For negatively correlated metrics, thescoring was reversed.
Table 3 Metric evaluation process used to screen attributes to select the 12 metrics that would best compose the IBI
Species richness and composition Separates Correlates Performs Selectedleast from with Human notably metrics
most Disturbance better thanimpaired Index one of Karr’s
sites (r >0.25) (1986) origi- (p <0.05) nal metrics
1. Total # of species yes yes *2. # of native species yes yes yes x3. # of non-native species no no no4. # of darter species yes yes * x5. # of darter and sculpin sp. yes no no6. # of sunfish species no no *7. # of sucker species no no *8. # of minnow species yes yes yes x
Tolerance/intolerance
9. % dominant species yes yes yes x10. % pioneers yes yes yes11. # of intolerant species yes yes * x12. % tolerant individuals yes yes * x
Trophic
13. % omnivores (AHI) yes yes * x14. % AHI + DAH yes yes no15. % generalist feeders no no no16. % insectivorous minnows yes yes *17. % benthic invertivores yes yes yes x18. % specialist carnivores yes no no19. % specialist carn. - tol yes yes yes x20. % piscivores no no *
Abundance, condition, and reproduction
21. % simple lithophils yes no no22. % simple lith. - tol yes yes yes x23. # late maturing species yes yes yes x24. % manipulative spawners yes yes yes25. Total individuals yes no *26. % anomalies yes yes * x27. % hybrids yes no *28. % anomalies + hybrids yes yes no
AHI algivore/herbivore/invertivore trophic groupDAH detritivore/algivore/herbivore trophic group* one of the Karr et al. 1986 original metrics

(Technical Note 190–13–1, WLI IBI Case Study, December 2001) 21
Using Regional IBI to Characterize Condition of Northern Virginia Streams: A case study
Calculation of total IBI scores forall sites
An IBI is composed of thesummed response signatures ofthe individual metrics thatcollectively provide a relativemeasure of biological conditionand individually point to likelycauses of degradation at differ-ent sites (Karr et al. 1986, Yoderand Rankin 1995). IBI scoreswere calculated for each site by
adding the scores of the 12 selected metrics (table 4).
Interpretation of IBI; e.g., evalua-tion of project impacts
Once IBI scores were calculatedfor each sample location, vari-ous interpretations were made.For example, sites and theircontributing watersheds werecategorized by degrees of im-pairment by establishing IBIintegrity classes (table 5), andcauses of impairment wereexamined using GIS to define
spatial relationships (Results section).
Table 4 Study area sites and IBI scores by watershed and size class
Goose Creek Watershed
- - - - - - - - - Drainage area < 17 km2 - - - - - - - - - - - - - - - - - -Drainage area 17–34 km2- - - - - - - - - - - - - - - - - -Drainage area > 34 km2- - - - - - - - -Site # Site name Size km2 IBI Site # Site name Size km2 IBI Site # Site name Size km2 IBI
38 Sim 719 11.61 24 88 Goose 688 24.79 44 143 Crook 623 38.63 4639 Jacks 690 3.77 34 89 Big 55 17.18 24 144 Goose 17 115.98 5040 Crom 702 11.32 20 90 Crom 715 20.65 24 145 Gap 623 34.77 4441 Buch 626 16.05 38 91 Jeff 719 24.18 30 146 Panth 623 57.00 4642 Dog 630 11.44 24 92 Beav 790 25.85 32 147 N Fk. 722 60.19 2643 N. fk(b) 725 11.64 32 93 N.Fkg 791 28.47 34 148 N.Fkb 611 48.66 3844 Crook 848 11.41 24 94 Crook 727 28.36 42 149 N Fk. 729 96.85 3245 Dry Mill 699 12.73 26 95 Tusc 621 20.13 32 150 Beav 734 123.55 3046 Cattail 773 6.49 26 96 Syco 621 23.03 38 151 Goose733 701.82 4447 Big 650 6.28 42 97 Little 705 20.92 36 152 Goose 710 208.26 4848 Hungry 632 16.93 34 98 Crook 688 19.55 28 153 Goose 611 318.09 4249 Burnt 626 10.80 26 99 Gap 710 20.38 36 154 Little 776 65.72 2850 Syco 15 10.25 18 100 Tusc 643 30.53 28 155 Little 50 106.37 4051 Chat 624 16.63 28 156 Goose 55 43.14 32
157 Syc 643 36.20 36
Occoquan River Watershed
- - - - - - - - - Drainage area < 17 km2 - - - - - - - - - - - - - - - - - -Drainage area 17–34 km2- - - - - - - - - - - - - - - - - -Drainage area > 34 km2- - - - - - - - -Site # Site name Size km2 IBI Site # Site name Size km2 IBI Site # Site name Size km2 IBI
1 Airlie up 9.06 26 52 Mill 605 18.06 44 101 Cedar 674 49.91 422 Airlie mit 9.06 20 53 Turk 602 27.23 44 102 Lick up 40.69 323 Airlie dn 9.06 20 54 Lick 674 23.11 36 103 Lick dn 40.69 304 Gup 602 6.33 32 55 Town 639 21.89 28 104 Elk 806 53.56 345 Owl 616 13.29 22 56 Slate 649 30.38 24 105 Town 611 36.18 426 Wal 767 15.10 24 57 Trapp 55 24.38 30 106 Broad Avnl 47.90 427 Broad GM 14.51 42 58 S. Fk 684 17.35 32 107 Kett 611 59.50 388 Pine 246 8.92 38 59 Kett 604 22.39 40 108 Cat 704 51.49 549 Mill up 14.79 30 60 L Bull 676 19.42 26 109 Cat 234 68.32 46

22 (Technical Note 190–13–1, WLI IBI Case Study, December 2001)
Using Regional IBI to Characterize Condition of Northern Virginia Streams: A case study
Table 4 Study area sites and IBI scores by watershed and size class—Continued
Occoquan River Watershed—Continued
- - - - - - - - - Drainage area < 17 km2 - - - - - - - - - - - - - - - - - -Drainage area 17–34 km2- - - - - - - - - - - - - - - - - -Drainage area > 34 km2- - - - - - - - -Site # Site name Size km2 IBI Site # Site name Size km2 IBI Site # Site name Size km2 IBI
10 Mill dn 14.79 36 61 Cat 676 19.75 48 110 Cedar 602 85.23 4611 N. Fk 15 11.82 32 62 Chest 686 20.73 46 111 Town 806 90.36 3812 S. Fk up 12.22 32 63 Bull 624 21.88 50 112 Broad 55 98.95 3813 S. Fk dn 12.22 28 64 Flat Lmnd 18.21 16 113 Bull 659 96.20 4414 L Bull up 5.97 32 65 Slate 611 17.11 32 114 Cedar 806 242.94 4215 L Bull dn 5.97 32 66 Chest 701 30.09 48 115 Broad 619 232.90 4016 Cat 15 10.31 44 67 Bull 705 28.31 52 116 Bull RP 242.43 5017 Black 15 7.06 48 68 E. Fk 660 17.76 30 117 Cub 620 41.48 3218 Young 234 14.48 40 69 Elklick 609 27.40 28 118 Cub 29 105.77 2619 Flatlick 50 7.57 22 70 Flatlic 620 18.01 34 119 Cub RP 134.61 4620 Rocky 645 13.20 34 71 L. Roc 658 17.59 46 120 Popes Clif. 44.16 3821 Piney 660 11.32 30 72 Popes 612 29.75 3422 Hooes 641 9.09 3023 Long 695 8.29 3624 Cannon 28 8.05 3425 Purcel 643 10.06 3026 Elk 607 16.38 3027 Wolf 643 14.22 2628 Sandy 647 15.62 40
Rappahannock River Watershed
- - - - - - - - - Drainage area < 17 km2 - - - - - - - - - - - - - - - - - -Drainage area 17–34 km2- - - - - - - - - - - - - - - - - -Drainage area > 34 km2- - - - - - - - -Site # Site name Size km2 IBI Site # Site name Size km2 IBI Site # Site name Size km2 IBI
29 Horner 691 13.90 30 73 South 737 29.82 42 121 Carter 681 130.40 5030 South 738 8.92 32 74 Buck 735 18.03 36 122 Carter 738 39.75 5231 E. Th. 647 13.06 42 75 Fiery 635 23.99 34 123 Carter up 35.74 4432 Bowens 28 7.17 20 76 Battle 633 26.07 34 124 Great 687 63.68 5233 Great 678 14.95 34 77 Tinpot 657 22.64 24 125 W. Th. 647 43.96 4034 Muddy 729 8.18 34 78 Brown 653 28.99 20 126 Th. R. 736 77.96 4435 Waterf 229 11.33 36 79 Indian 626 18.30 36 127 Jordan 637 88.76 4836 Piney 600 16.62 46 80 Jacob 626 26.62 40 128 Rapah 647 192.89 5037 Rap 635 16.22 42 81 Jordan 522 21.88 40 129 Rush 211 37.13 46
82 Marsh 17 25.06 20 130 Cov 626 107.80 4883 Craig 805 21.35 20 131 Hugh 707 35.47 3884 Hazel 231 24.07 46 132 Thor 622 134.49 4685 Thorn 522 26.04 46 133 Hazel 707 60.35 4886 Cov 522 27.09 30 134 Hugh 644 120.23 4687 Hittles 522 20.44 42 135 Hazel 522 200.01 48
136 Black 615 36.53 44137 Rap W'loo 475.26 48138 Indian 624 35.16 36139 Thor 618 261.41 48140 Muddy 630 57.61 36141 Marsh 668 94.76 24142 Hazel 628 726.55 48

(Technical Note 190–13–1, WLI IBI Case Study, December 2001) 23
Using Regional IBI to Characterize Condition of Northern Virginia Streams: A case study
Metric evaluation andselection
Because the effects of human actions on the environ-ment are varied and complex, multiple levels of infor-mation are generally needed to accurately assessbiological condition. As previously described, theprocess for selecting metrics into a multimetric indexinvolves the testing of a larger set of biological at-tributes and reducing them to the metrics that workbest. The purpose of this process is to cull attributes,even those that may show some relationship to thehuman disturbance gradient, to select those few thatare highly sensitive yet not redundant, to form the IBI.The following section describes the metrics selected inthis study, their biological function, and the rationalefor their inclusion into the IBI. Results of tests forselected metrics and a representative fish species areillustrated by the figures that follow the metric de-scriptions. Test results for all attributes are illustratedin the appendix, figures 30 and 31.
Species composition and richness
In general, attributes in this category display a declin-ing response to added human disturbance (Karr 1981).Usually, a population must be viable at a site for someperiod before one can consistently detect a species'presence (Karr and Chu 1997). The absence of a spe-cies at a site may suggest that viable populations arenot being maintained. Over time, species assemblageshave evolved that are capable of withstanding orrapidly recovering from most natural perturbations.However, changes in the environment caused byhumans often cannot be tolerated, and thus one ormore species declines in abundance or becomesextirpated (Karr et al. 1986).
Metric 1. Number of native species
The total number of native species per sample makeup metric 1 (fig. 13) . If other features are similar, thenumber of species supported by streams of a givensize in a given region decreases with environmentaldegradation, with the effect more pronounced forspecies that are native to the region (Karr et al. 1986).
Figure 13 River chub (Nocomis micropogon), representative for the number of native species metric, and charts of metricevaluation results
25
10
5
0
Least-impaired Most-impaired
<17 17-34 >34
Watershed size (km2)
Nu
mb
er o
f n
ati
ve s
pecie
s
20
15
35
30
25
20
15
10
5
010 20 30 40
Human disturbance index
Nu
mb
er o
f n
ati
ve s
pecie
s
24 (Technical Note 190–13–1, WLI IBI Case Study, December 2001)
Using Regional IBI to Characterize Condition of Northern Virginia Streams: A case study
Fortunately for the state of Virginia, river-basin spe-cific information is available for the native and non-native status for all freshwater fish species (Jenkinsand Burkhead 1993), enabling the added sensitivity forthis metric. In this study, 57 fish species were col-lected between the three watersheds: 42 in theOccoquan, 43 in the Rappahannock, and 43 in GooseCreek. Of the 57 species collected, 42 are considerednative (or probably native) by Jenkins and Burkhead(1993), 32 in the Occoquan, 34 in the Rappahannock,and 32 in Goose Creek (see table 1).
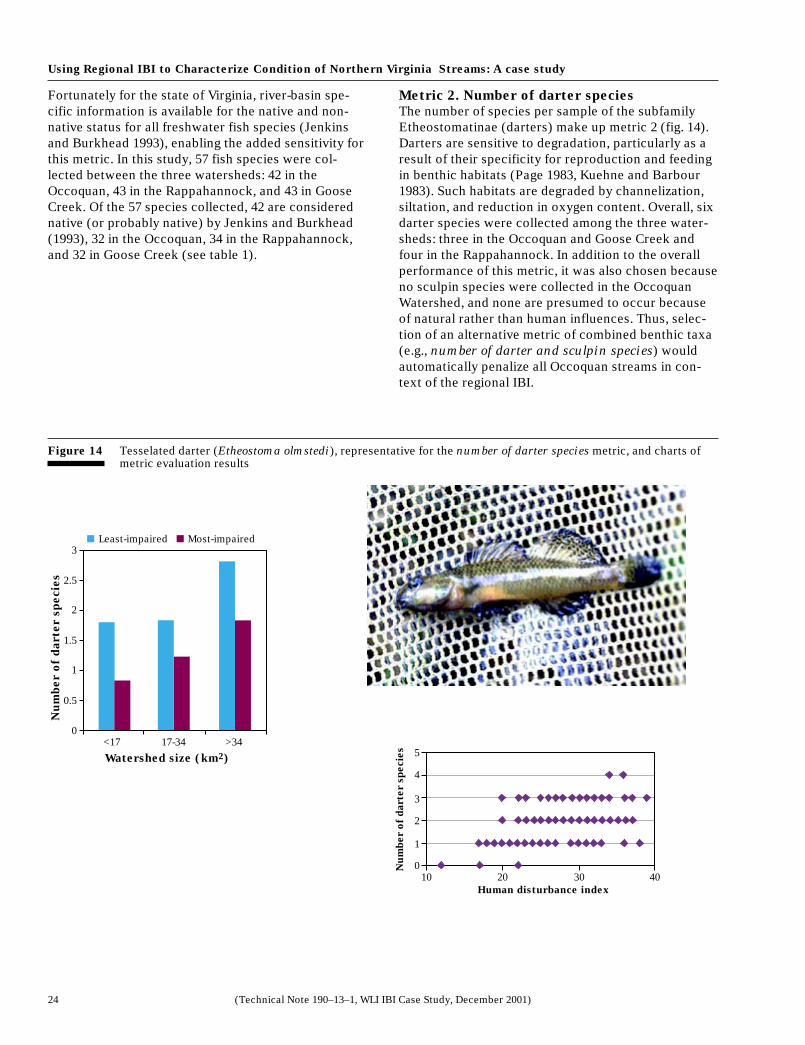
Metric 2. Number of darter species
The number of species per sample of the subfamilyEtheostomatinae (darters) make up metric 2 (fig. 14).Darters are sensitive to degradation, particularly as aresult of their specificity for reproduction and feedingin benthic habitats (Page 1983, Kuehne and Barbour1983). Such habitats are degraded by channelization,siltation, and reduction in oxygen content. Overall, sixdarter species were collected among the three water-sheds: three in the Occoquan and Goose Creek andfour in the Rappahannock. In addition to the overallperformance of this metric, it was also chosen becauseno sculpin species were collected in the OccoquanWatershed, and none are presumed to occur becauseof natural rather than human influences. Thus, selec-tion of an alternative metric of combined benthic taxa(e.g., number of darter and sculpin species) wouldautomatically penalize all Occoquan streams in con-text of the regional IBI.
Figure 14 Tesselated darter (Etheostoma olmstedi), representative for the number of darter species metric, and charts ofmetric evaluation results
3
1.5
1
0.5
0
Least-impaired Most-impaired
<17 17-34 >34
Watershed size (km2)
Nu
mb
er o
f d
arte
r s
pecie
s 2.5
2
5
4
3
2
1
010 20 30 40
Human disturbance index
Nu
mber o
f darte
r s
pecie
s

(Technical Note 190–13–1, WLI IBI Case Study, December 2001) 25
Using Regional IBI to Characterize Condition of Northern Virginia Streams: A case study
Metric 3. Number of minnow species
The number of species per sample from the familyCyprinidae (minnows) was evaluated against thenumber of sunfish species and the number of sucker
species, both original Karr et al. 1986 metrics. Unex-pectedly, a negative relationship between number of
sunfish species and the Human Disturbance Indexwas observed. In Wisconsin, Lyons (1992) concludedthat the proximity of lakes or ponds enable sunfish tofrequent streams in which they would not ordinarilyoccur, thus influencing the IBI. In the three water-sheds of our study, only two of the six sunfish speciesare considered by Jenkins and Burkhead (1993) to benative (Lepomis auritis and L. gibbosus). The othersare considered introductions or probable introduc-tions and may have displaced native fauna. Also, twoof the six species that occur in the watersheds areconsidered by Smogor (1996) and our study team to be
tolerant (L. macrochirus and L. cyanellus). Althoughthe "sucker metric" did respond to the disturbancegradient as predicted, it did not perform as well as the“minnow metric.” Because of the asymmetric distribu-tion of sucker species in Virginia, Smogor (1996) alsosuggested excluding the sucker metric.
Conversely, minnows are the dominant taxonomicgroup in all three watersheds, both in terms of relativeabundance and species richness. Twenty-three specieswere collected overall: 19 in the Occoquan, 19 in theRappahannock, and 20 in Goose Creek. The minnowmetric has been successfully used in IBIs in a numberof other locations (Hughes and Gammon 1987, OhioEPA 1988), owing its utility to the variety of habitats inwhich minnows occur and their sensitivity to physicaland chemical disturbances (Hall et al. 1996) (fig. 15).
Figure 15 Common shiner (Luxilis cornutus), representative for number of minnow species metric, and charts of metricevaluation results
14
6
4
2
0
Least-impaired Most-impaired
<17 17-34 >34
Watershed size (km2)
Nu
mb
er o
f m
inn
ow
sp
ecie
s
12
10
8
20
15
10
5
010 20 30 40
Human disturbance index
Num
ber
of
min
now
specie
s

26 (Technical Note 190–13–1, WLI IBI Case Study, December 2001)
Using Regional IBI to Characterize Condition of Northern Virginia Streams: A case study
Tolerance/intolerance
Tolerance and intolerance, as it relates to IBI develop-ment, implies the general tolerance of a species, orgroup of species, to a variety of human influences,rather than tolerance or intolerance to a specificvariable. Therefore, in attribute development, theconcept is applied to any fish species, or group, thatare particularly sensitive or insensitive to the com-bined effects of human disturbance. Because of theirclose functional relationship, tolerance, intolerance,dominance, and pioneering species have been treatedcollectively in this group.
Metric 4. Percent of the dominant species
The proportion (percent) of the most abundant spe-cies per sample make up metric 4 (Hall et al. 1996,Ohio EPA 1988). This metric is based on many studiesthat have demonstrated a retrogression in dominanceby opportunistic species in response to environmentalstress (Karr et al. 1986, Ohio EPA 1988, and Hall et al.1996). In his recommendations for IBI development inVirginia streams, Smogor (1996) suggested includingbalance among metrics, not overly relying on taxo-nomic metrics and placing adequate emphasis onmetrics that incorporate independent signal. All at-tributes within this category performed reasonablywell; however, according to a factor analysis of ourdata (Hatcher 1994) the percent dominant species wasthe least redundant and therefore selected (fig. 16).
Figure 16 Fallfish (Semotilus corporalis) to creek chub (Semotilus atromaculatus), examples of species typically involvedin retrogression of dominance, and charts of metric evaluation results
70
30
20
10
0
Least-impaired Most-impaired
<17 17-34 >34
Watershed size (km2)
Percen
t o
f d
om
inan
t sp
ecie
s
60
50
40
100
80
60
40
20
010 20 30 40
Human disturbance index
Percen
t of
dom
inan
t specie
s

(Technical Note 190–13–1, WLI IBI Case Study, December 2001) 27
Using Regional IBI to Characterize Condition of Northern Virginia Streams: A case study
Metric 5. Number of intolerant species
Metric 5 (fig. 17) is the number of species per samplethat are intolerant to effects of human disturbance,such as siltation, turbidity, lowered flows, inundation,riparian alteration, low dissolved oxygen, pollution.Intolerant species are among the first to be decimatedafter perturbation (Karr et al. 1986). The mere pres-ence of very sensitive taxa is a strong indicator ofgood biological condition; however, the relative abun-dance of these taxa, because they are relatively rare, isoften difficult to estimate. Therefore, the number ofspecies, rather than proportion of individuals, is used
as this metric’s measure. To improve the discrimina-tory ability of this metric, Karr and Chu (1997) recom-mend designating no more than 5 to 15 percent of theregional fauna as tolerant or intolerant. We considered8 (about 14%) of the 57 species collected among thethree watersheds to be intolerant. The higher end ofrecommended range was chosen to provide opportu-nity for the metric to function equally across the threewatersheds and provide the ability to include at leastsome intolerant species that occur in only one water-shed or another.
Figure 17 Redfin pickerel (Esox americanus), representative for number of intolerant species metric, and charts of metricevaluation results
4
1.5
1
0.5
0
Least-impaired Most-impaired
<17 17-34 >34
Watershed size (km2)
Nu
mb
er o
f in
tole
ran
t sp
ecie
s
3.5
3
2
2.5
6
5
4
3
1
2
010 20 30 40
Human disturbance index
Nu
mber o
f in
tole
ran
tspecie
s

28 (Technical Note 190–13–1, WLI IBI Case Study, December 2001)
Using Regional IBI to Characterize Condition of Northern Virginia Streams: A case study
Figure 18 Green sunfish (Lepomis cyanellus), representative for percent tolerant individuals metric, and charts of metricevaluation results
100
80
60
40
20
010 20 30 40
Human disturbance index
Percen
t to
leran
tin
div
idu
als
Metric 6. Percent tolerant individuals
The proportion (percent) per sample of individuals ofspecies that are tolerant (least susceptible to impair-ment) make up metric 6. Under the same rationaledescribed for number of intolerant species, we choseonly 8 (about 14%) of the most tolerant species torepresent this category from Smogor’s (1996) largerlist of tolerants. Percent tolerant individuals wasselected over percent pioneering species because ofits better overall performance and because similarityin species composition between the two metricsprecluded selecting them both into the IBI (fig. 18).
Trophic structure
The energy base and the trophic dynamics of a streamcommunity are assessed by the metrics in this cat-egory. Species groupings for these metrics followSmogor (1996), who based his designations on thefeeding patterns of freshwater adults. Because thefood base is central to the maintenance of a commu-nity, information about trophic composition is impor-tant to an IBI (Karr et al. 1986). All organisms require areliable source of energy. Fish assemblages are af-fected dramatically by changes or reductions in thoseenergy sources. The dominance of trophic generalistsoccurs as specific components of the food base be-come less reliable and the opportunistic foraginghabits of the generalists make them more successfulthan specialized foragers (Karr et al. 1986). Thus, thetrophic structure of a community can provide informa-tion on the production and consumption patterns thatare affected by impairment. Alterations in water qual-ity or other habitat conditions, including land use inthe watershed, commonly result in changes in the fishcommunity because of fluctuating food resources(Karr et al. 1986).
80
40
30
20
0
Least-impaired Most-impaired
<17 17-34 >34
Watershed size (km2)
Percen
t to
leran
t in
div
idu
als
70
60
50

(Technical Note 190–13–1, WLI IBI Case Study, December 2001) 29
Using Regional IBI to Characterize Condition of Northern Virginia Streams: A case study
Metric 7. Percent omnnivores (AHI - algivore/
herbivore/invertivore) feeding group
Excessive instream production of many herbivorousfishes are characteristic of heavily grazed landscapes,where riparian corridors may be damaged and exces-sive nutrients from livestock waste are entering thestream (Karr and Chu 1997). Similar relationships havebeen observed in intensively cultivated areas withaltered riparian zones and heavy nutrient input fromexcessive fertilization. Karr et al. (1986) included asimilar metric in their original study that was ex-pressed as proportion of individuals as omnivores.Omnivores were considered to be species that takesignificant quantities of both plant and animal materi-als (including detritus) and have the ability, usuallyindicated by the presence of a long gut and dark peri-toneum, to utilize both. In their study, Karr et al.defined omnivores as species whose diets contain atleast 25 percent plant and 25 percent animal foods.
Because of the difficulty in determining which speciesactually consume the requisite percentages of plantand animal matter to be considered omnivorous, inthis study we have chosen to use three of Smogor'sclassifications (proportion of individuals as: algivore/herbivore/invertivore (AHI), AHI plus detritivore/algivore/herbivore (DAH), and generalist feeders) asdifferent means of expressing Karr's ominivore metric.In this study, proportion of individuals as AHI wasevaluated against proportion of individuals as AHI andDAH and proportion of individuals as generalist feed-ers. Both AHI and DAH + AHI metrics performed wellagainst all performance tests; however, the AHI metricperformed somewhat better overall (fig. 19).
Figure 19 Silverjaw minnow (Notropis buccatus), representative for percent omnivorous individuals metric, and charts ofmetric evaluation results
60
50
40
30
10
20
010 20 30 40
Human disturbance index
Percen
t o
min
ivo
res
(A
HI)
35
15
10
5
0
Least-impaired Most-impaired
<17 17-34 >34Watershed size (km2)
Percen
t o
min
ivo
res (
AH
I)
30
20
25
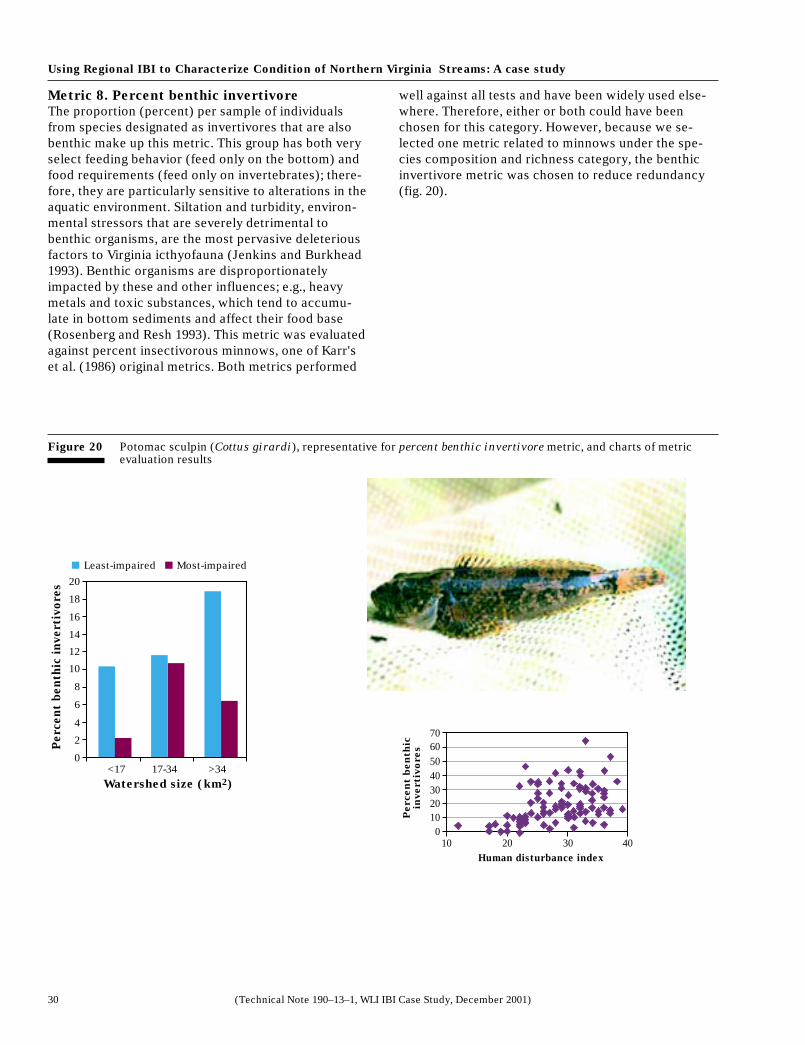
30 (Technical Note 190–13–1, WLI IBI Case Study, December 2001)
Using Regional IBI to Characterize Condition of Northern Virginia Streams: A case study
Metric 8. Percent benthic invertivore
The proportion (percent) per sample of individualsfrom species designated as invertivores that are alsobenthic make up this metric. This group has both veryselect feeding behavior (feed only on the bottom) andfood requirements (feed only on invertebrates); there-fore, they are particularly sensitive to alterations in theaquatic environment. Siltation and turbidity, environ-mental stressors that are severely detrimental tobenthic organisms, are the most pervasive deleteriousfactors to Virginia icthyofauna (Jenkins and Burkhead1993). Benthic organisms are disproportionatelyimpacted by these and other influences; e.g., heavymetals and toxic substances, which tend to accumu-late in bottom sediments and affect their food base(Rosenberg and Resh 1993). This metric was evaluatedagainst percent insectivorous minnows, one of Karr'set al. (1986) original metrics. Both metrics performed
well against all tests and have been widely used else-where. Therefore, either or both could have beenchosen for this category. However, because we se-lected one metric related to minnows under the spe-cies composition and richness category, the benthicinvertivore metric was chosen to reduce redundancy(fig. 20).
Figure 20 Potomac sculpin (Cottus girardi), representative for percent benthic invertivore metric, and charts of metricevaluation results
20
6
4
2
0
Least-impaired Most-impaired
<17 17-34 >34Watershed size (km2)
Percen
t b
en
thic
in
verti
vo
res
12
14
16
18
8
10
7060504030
1020
010 20 30 40
Human disturbance index
Percen
t b
en
th
icin
vertiv
ores

(Technical Note 190–13–1, WLI IBI Case Study, December 2001) 31
Using Regional IBI to Characterize Condition of Northern Virginia Streams: A case study
Metric 9. Percent specialist carnivores minus
tolerant species
This metric is the proportion (percent) per sample ofindividuals from species designated as piscivores orinvertivore/piscivores, minus the tolerant species.Viable and healthy populations of carnivorous speciesindicate a healthy, trophically diverse community(Karr et al. 1986). This metric includes individuals ofall species in which the adults are predominantlypiscivores or as adults feed on the combination of fishand invertebrates. Tolerant species that fit this profilehave been subtracted to improve the metric's discrimi-natory power. This metric was evaluated againstproportion of individuals as piscivores, one of theoriginal Karr et al. metrics, and proportion of indi-
viduals as specialist carnivores without subtractingthe tolerants. Specialist carnivores minus tolerants
performed better than either of those comparisons(fig. 21).
Figure 21 Rockbass (Ambloplites rupestris), representative for percent specialist carnivores - tolerants metric, and chartsof metric evaluation results
25
10
5
0
Least-impaired Most-impaired
<17 17-34 >34
Watershed size (km2)
Percen
t sp
ecia
list
carn
ivo
res-t
ole
ran
ts 20
15
70
60
50
40
30
10
20
010 20 30 40
Human disturbance index
Percen
t sp
ecia
list
carn
ivo
res-t
ole
ran
ts

32 (Technical Note 190–13–1, WLI IBI Case Study, December 2001)
Using Regional IBI to Characterize Condition of Northern Virginia Streams: A case study
Fish reproduction, growth, andcondition
The three metrics in this category evaluate such at-tributes of populations as reproduction, growth, andcondition of individual fishes. Ecosystems can main-tain health only if its living members are able to com-pensate for population loss through reproduction.Under normal circumstances (disregarding stocking)new members are added only through natural repro-duction, meaning that conditions must be favorable forreproduction to occur and for the young to survive. Inaddition, conditions must be favorable for individualsto grow and reach sexual maturity and thus enable thecontinuance of the reproductive cycle.
Metric 10. Percent simple lithophilic spawners
minus tolerants
Metric 10 is the proportion (percent) per sample ofindividuals from species designated as simplelithophils (species that scatter their eggs over rock,rubble, or gravel substrates without nest preparationor parental care to the eggs) minus the tolerant spe-cies of that group. This metric is sensitive to the ad-verse effects of siltation and is designed to assess theeffects of human impairments on fish reproduction(Hall et al. 1996). Metric 10 was compared with total
number of individuals and percent simple lithophils
(without subtracting the tolerants) against which itperformed better in all tests (fig. 22).
Figure 22 Stripeback darter (Percina notograma), representative for percent simple lithophils - tolerants metric, and chartsof metric evaluation results
30
20
10
0
Least-impaired Most-impaired
<17 17-34 >34
Watershed size (km2)
Percen
t sim
ple
lith
op
hil
s-t
ole
ran
ts
60
50
40
70
60
50
40
30
10
20
010 20 30 40
Human disturbance index
Percen
t sim
ple
lith
op
hil
s-t
ole
ran
ts

(Technical Note 190–13–1, WLI IBI Case Study, December 2001) 33
Using Regional IBI to Characterize Condition of Northern Virginia Streams: A case study
Metric 11. Number of late-maturing species
The number of species per sample that normally donot breed until their third year or after make up thismetric. Species that require longer periods to completetheir reproductive cycle are disproportionately af-fected by environmental degradation. Often streamimpairments are short-term, and recovery is morelikely for those species that are able to quickly repro-duce and recolonize. However, that task is much moredifficult for species that require a number years toreach sexual maturity. If long-lived taxa are present,one can infer that the spatial and temporal compo-nents they require are also present (Karr and Chu1997). This metric was evaluated against variable
substrate manipulative spawners, a reproductivemetric designed to assess the quality of spawninghabitat. Both metrics met all performance criteria;however, number of late maturing species performedsomewhat better overall (fig. 23).
Figure 23 Northern hogsucker (Hypentelium nigricans), representative for number of late maturing species metric, andcharts of metric evaluation results
5
1.5
1
0.5
0
Least-impaired Most-impaired
<17 17-34 >34
Watershed size (km2)
Nu
mb
er o
f la
te m
atu
rin
g s
pecie
s
3.5
4
4.5
3
2
2.5
7
6
5
4
3
1
2
010 20 30 40
Human disturbance index
Nu
mb
er o
f la
tem
atu
rin
g s
pecie
s

34 (Technical Note 190–13–1, WLI IBI Case Study, December 2001)
Using Regional IBI to Characterize Condition of Northern Virginia Streams: A case study
Metric 12. Percent of individuals with disease,
tumors, fin damage, and skeletal anomalies
The proportion (percent) per sample of individualswith externally visible abnormalities represent metric12 (fig. 24). Sites with especially severe degradationoften yield a high number of individuals in poor health(Mills et al. 1966, Brown et al. 1973, and Baumann etal. 1982). Parasitism has been shown to reflect bothpoor environmental condition and reduction in repro-ductive capacity (sterility) in fish (Mahon 1976). Indi-cations of poor health include tumors, fin damage orother deformities, heavy infestations of parasites,discoloration, excessive mucus, and hemorrhaging. Inthis study the number of individuals with anomalies
was extremely small except for streams in the GooseCreek system, which contained a relatively high inci-dence of black spot disease (caused by the larval stageof a trematode parasite; e.g., Uvulifer ambloplitis andCrassiphiala bulboglossa). Leonard and Orth (1986)also found increases in the incidence of disease andanomalies only after substantial degradation wasevident, indicating that this metric may be sensitiveonly at the most severely impacted sites. However, inthis study the metric did function in detecting severalof the watershed’s most degraded streams, and overallanomalies were present in sufficient quantities tocorrelate with the disturbance gradient.
Figure 24 Open lesion and blackspot disease, representing the anomalies metric, and charts of metric evaluation results
30
25
20
15
5
10
010 20 30 40
Human disturbance index
Percen
t an
om
ali
es
Open lesion
Blackspot disease
5
6
7
1
0
Least-impaired Most-impaired
<17 17-34 >34
Watershed size (km2)
Percen
t an
om
ali
es
4
3
2

(Technical Note 190–13–1, WLI IBI Case Study, December 2001) 35
Using Regional IBI to Characterize Condition of Northern Virginia Streams: A case study
Results
In this study a total of 57 fish species were collectedacross the three watersheds: 42 in the Occoquan, 43 inthe Rappahannock, and 43 in Goose Creek. Of the 57species collected, 42 are considered native (or prob-ably native) by Jenkins and Burkhead (1993): 32 in theOccoquan, 34 in the Rappahannock, and 32 in GooseCreek (see table 1). The number of species per siteranged from 5 to 24 for sites where drainage is less 17square kilometers, 9 to 27 for those with drainage of 17to 34 square kilometers, and 11 to 30 for those morethan 34 square kilometers. Total number of individualsper site ranged from 124 to 1,325 (mean = 483.8, s.d. =221.6) (appendix, table 7 and 8). Most of the speciescollected were represented in each of the three water-sheds; however, a few species were collected in onlyone watershed or another (see table 1 and appendixfig. 33). IBI scores ranged from 16 to 54 with similarranges in values observed for each of the three water-sheds: Occoquan 16 to 54, Rappahannock 20 to 52, andGoose Creek 18 to 50 (see table 4 and fig. 25).
It follows that if individual metrics have been selectedbecause they were highly correlated to degrees ofhuman impairment, then the composite score of thosemetrics (the IBI) would be also. If the scores from theHDI are plotted against the IBI, a close relationship isobserved (r = 0.71) indicating high sensitivity of theIBI in detecting combined effects of human distur-bances (fig. 26).
Integrity classes were determined for the study areaaccording to a system devised by Karr et al. (1986) bydividing the range of IBI scores for all sites into equalfifths (table 5). A clear pattern is detected when thedrainages of the sites with poor and very poor classifi-cations are observed spatially through GIS (fig. 27). Asprojected, a higher incidence of drainages classified aspoor and very poor occur in the eastern portion of thestudy area, where human populations and pressuresfrom urban development are greatest. Conversely, agreater percentage of drainages with good to excellentintegrity ratings occur in the study area's westernportion. A significant number of the sites in theOccoquan watershed received low integrity ratings. Ofthe 69 Occoquan drainages sampled, 30 (43.5%) wereclassified as poor or very poor, compared to 52.4percent of the Goose Creek sites and 19.6 percent ofthe Rappahanncock sites.
Most of the drainages with low integrity ratings wereclumped in four distinct areas (fig. 27):
• highly developed Washington suburbs in thenortheastern portion of the Occoquan watershed,
• drainage’s intensively used for agriculture alongthe Highway 28 corridor southwest of Manassas,
• developing rural landscape along the Interstate66 corridor west of Manassas, and
• agricultural and developing land in the vicinity ofLeesburg and Purcellville.
With the exception of Marsh Run and its tributaries,the upper Rappahannock watershed had only a fewdrainages classified as poor or very poor.
Figure 25 Distribution of IBI scores by stream size, watershed, and integrity class
60
10
0
Least-impaired Most-impaired Most-impaired
1 10 100 1,000Sq km
Ind
ex
of
Bio
tic I
nte
rgrit
y (
IBI)
40
50
30
20
Excellent
Good
Fair
Poor
Very poor
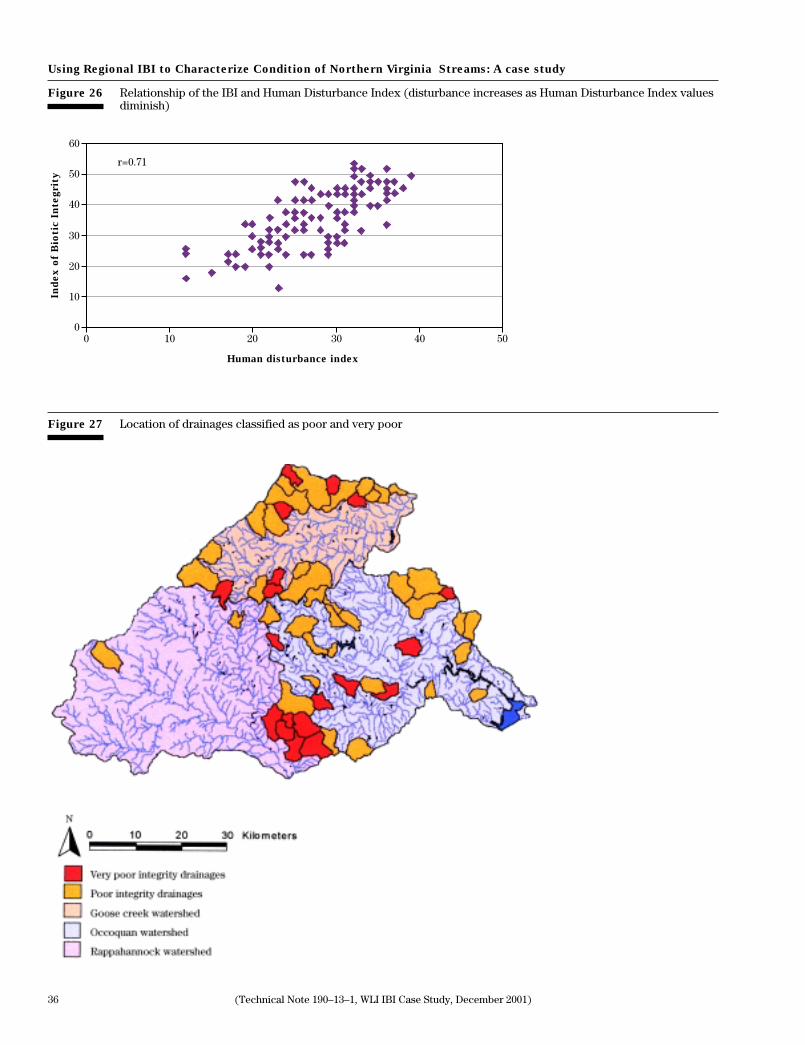
36 (Technical Note 190–13–1, WLI IBI Case Study, December 2001)
Using Regional IBI to Characterize Condition of Northern Virginia Streams: A case study
Figure 26 Relationship of the IBI and Human Disturbance Index (disturbance increases as Human Disturbance Index valuesdiminish)
Figure 27 Location of drainages classified as poor and very poor
60
50
40
30
20
10
00 10 20 30 40 50
Human disturbance index
Ind
ex
of
Bio
tic I
nte
grit
y
r=0.71

(Technical Note 190–13–1, WLI IBI Case Study, December 2001) 37
Using Regional IBI to Characterize Condition of Northern Virginia Streams: A case study
In general, the western portion of the study areaexhibited better quality streams, with most drainagesoriginating in the Blue Ridge receiving good to excel-lent impairment ratings (fig. 28). However, theOccoquan Watershed also contains some high qualitystreams; for example, the Bull Run system above thecity of Manassas and the upper portions of the Cedarand Broad Run systems. The Rappahannock Water-shed had the highest percentage of drainages ratedgood to excellent (52.2%), followed by the Occoquan(30.4%), and then Goose Creek (23.8%).
The biological integrity of the fish assemblage, asmeasured by the IBI, was closely correlated with thereach assessment scores of the SVAP, consistent witha number of others studies relating fish assemblagesto habitat quality (Roth et al. 1996, Matthews 1987)(fig. 29). SVAP is designed to assess impairments of aspecific stream reach, particularly those impacts thatare associated with agriculture and land management(livestock grazing, channel alterations, riparian width).Of the four components used to construct the HumanDisturbance Index (percent cropland/urban; percentpasture/urban; fish barriers; and SVAP), the SVAP hadthe highest correlation with the IBI (r = 0.64). BecauseIBI is an integrated assessment technique that incorpo-rates many influences in combination, it is not ex-pected that each individual SVAP component would behighly correlated with the IBI. However, the single
component macroinvertebrates observed was morecorrelated to the IBI individually (r = 0.66) than wasthe SVAP overall (r = 0.64). Other SVAP componentswith relatively high degrees of correlation (r ≥ 0.35)were riffle embeddedness, invertebrate habitat, waterappearance, and instream fish cover (table 6).
Table 6 Pearson's correlation coefficients for individualSVAP components and the IBI
SVAP assessment component Pearson's coefficient
Channel condition 0.3Hydrologic alteration 0.2Riparian quality 0.18Bank stability 0.19Water appearance 0.43Nutrient enrichment 0.32Instream fish cover 0.36Pool quality 0.31Invertebrate habitat 0.49Canopy cover 0.15Manure presence 0.09Riffle embeddedness 0.52Macroinvertebrates observed 0.66
Table 5 Biological Integrity classification system for study area sites (adapted from Karr et al. 1986)
Total IBI score Integrity Attributes(sum of the 12 classmetric ratings)
49–54 Excellent Comparable to the best situations across the three watersheds with minimaldisturbance; contains all species expected for the watershed for the habitat andstream size, including the most intolerant forms; exhibits balanced trophic struc-ture and reproductive success.
41–48 Good Species richness somewhat below expectation, especially due to the loss of themost intolerant forms; some species are present with less than optimal abun-dances; trophic structure and reproduction shows some sign of stress.
33–40 Fair Signs of additional deterioration include loss of intolerant forms, fewer species,highly skewed trophic structure (e.g., increasing frequency of omnivores or toler-ant species); older age classes of top predators may be rare.
25–32 Poor Dominated by omnivores, tolerant forms, and habitat generalists; few top carni-vores; reproductive and condition factors commonly depressed; diseased fishoften present.
16–24 Very Poor Dominated by highly tolerant forms (e.g., green sunfish, creek chubs etc.); dis-ease, lesions, parasites, fin damage, and other anomalies may be regular.

38 (Technical Note 190–13–1, WLI IBI Case Study, December 2001)
Using Regional IBI to Characterize Condition of Northern Virginia Streams: A case study
Figure 28 Location of drainages classified as good and excellent
20
10
Goose Occoquan Rappahannock
2 4 6 8 10
SVAP
Index o
f B
ioti
c I
nte
rgri
ty(IB
I)
60
50
40
30
Figure 29 Correlation of IBI and SVAP scores
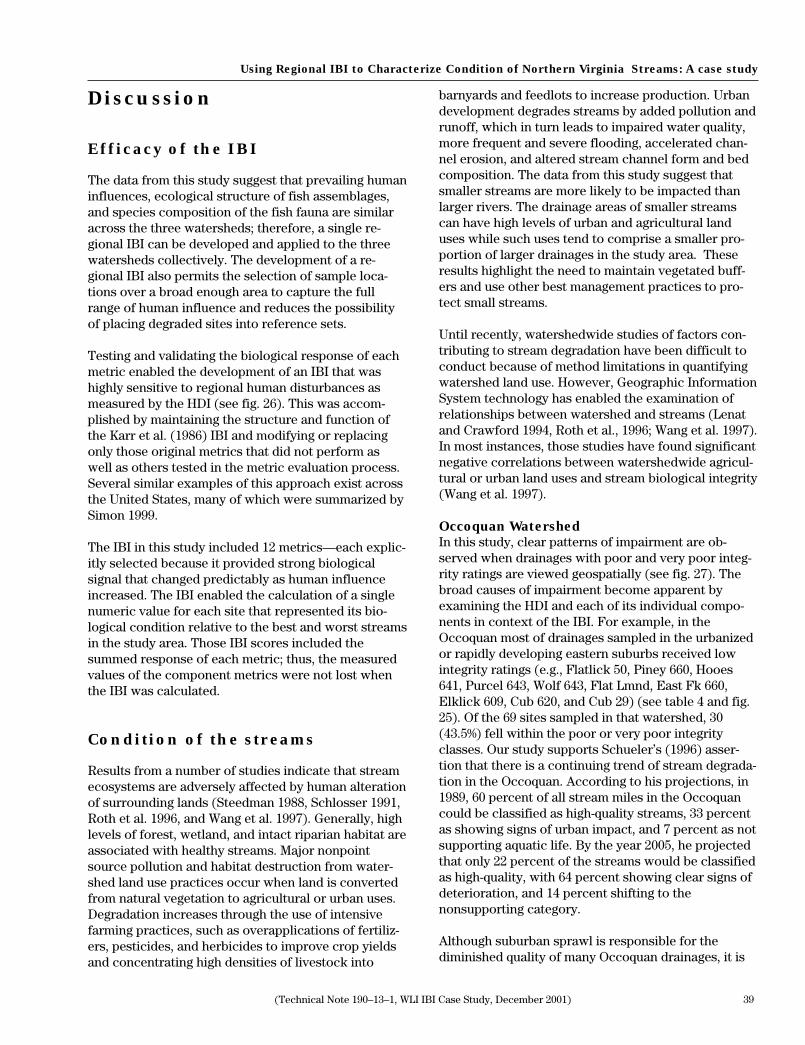
(Technical Note 190–13–1, WLI IBI Case Study, December 2001) 39
Using Regional IBI to Characterize Condition of Northern Virginia Streams: A case study
Discussion
Efficacy of the IBI
The data from this study suggest that prevailing humaninfluences, ecological structure of fish assemblages,and species composition of the fish fauna are similaracross the three watersheds; therefore, a single re-gional IBI can be developed and applied to the threewatersheds collectively. The development of a re-gional IBI also permits the selection of sample loca-tions over a broad enough area to capture the fullrange of human influence and reduces the possibilityof placing degraded sites into reference sets.
Testing and validating the biological response of eachmetric enabled the development of an IBI that washighly sensitive to regional human disturbances asmeasured by the HDI (see fig. 26). This was accom-plished by maintaining the structure and function ofthe Karr et al. (1986) IBI and modifying or replacingonly those original metrics that did not perform aswell as others tested in the metric evaluation process.Several similar examples of this approach exist acrossthe United States, many of which were summarized bySimon 1999.
The IBI in this study included 12 metrics—each explic-itly selected because it provided strong biologicalsignal that changed predictably as human influenceincreased. The IBI enabled the calculation of a singlenumeric value for each site that represented its bio-logical condition relative to the best and worst streamsin the study area. Those IBI scores included thesummed response of each metric; thus, the measuredvalues of the component metrics were not lost whenthe IBI was calculated.
Condition of the streams
Results from a number of studies indicate that streamecosystems are adversely affected by human alterationof surrounding lands (Steedman 1988, Schlosser 1991,Roth et al. 1996, and Wang et al. 1997). Generally, highlevels of forest, wetland, and intact riparian habitat areassociated with healthy streams. Major nonpointsource pollution and habitat destruction from water-shed land use practices occur when land is convertedfrom natural vegetation to agricultural or urban uses.Degradation increases through the use of intensivefarming practices, such as overapplications of fertiliz-ers, pesticides, and herbicides to improve crop yieldsand concentrating high densities of livestock into
barnyards and feedlots to increase production. Urbandevelopment degrades streams by added pollution andrunoff, which in turn leads to impaired water quality,more frequent and severe flooding, accelerated chan-nel erosion, and altered stream channel form and bedcomposition. The data from this study suggest thatsmaller streams are more likely to be impacted thanlarger rivers. The drainage areas of smaller streamscan have high levels of urban and agricultural landuses while such uses tend to comprise a smaller pro-portion of larger drainages in the study area. Theseresults highlight the need to maintain vegetated buff-ers and use other best management practices to pro-tect small streams.
Until recently, watershedwide studies of factors con-tributing to stream degradation have been difficult toconduct because of method limitations in quantifyingwatershed land use. However, Geographic InformationSystem technology has enabled the examination ofrelationships between watershed and streams (Lenatand Crawford 1994, Roth et al., 1996; Wang et al. 1997).In most instances, those studies have found significantnegative correlations between watershedwide agricul-tural or urban land uses and stream biological integrity(Wang et al. 1997).
Occoquan Watershed
In this study, clear patterns of impairment are ob-served when drainages with poor and very poor integ-rity ratings are viewed geospatially (see fig. 27). Thebroad causes of impairment become apparent byexamining the HDI and each of its individual compo-nents in context of the IBI. For example, in theOccoquan most of drainages sampled in the urbanizedor rapidly developing eastern suburbs received lowintegrity ratings (e.g., Flatlick 50, Piney 660, Hooes641, Purcel 643, Wolf 643, Flat Lmnd, East Fk 660,Elklick 609, Cub 620, and Cub 29) (see table 4 and fig.25). Of the 69 sites sampled in that watershed, 30(43.5%) fell within the poor or very poor integrityclasses. Our study supports Schueler’s (1996) asser-tion that there is a continuing trend of stream degrada-tion in the Occoquan. According to his projections, in1989, 60 percent of all stream miles in the Occoquancould be classified as high-quality streams, 33 percentas showing signs of urban impact, and 7 percent as notsupporting aquatic life. By the year 2005, he projectedthat only 22 percent of the streams would be classifiedas high-quality, with 64 percent showing clear signs ofdeterioration, and 14 percent shifting to thenonsupporting category.
Although suburban sprawl is responsible for thediminished quality of many Occoquan drainages, it is

40 (Technical Note 190–13–1, WLI IBI Case Study, December 2001)
Using Regional IBI to Characterize Condition of Northern Virginia Streams: A case study
not the only cause. For example, along Highway 28corridor southwest of Manassas, intensive agriculturehas severely impacted most of that area's streams(Gup 602, Owl 616, Elk 607, Wal 767, Town 639, Slate649, Slate 611, Lick up, and Lick dn) (see table 4 andfig. 27). To help put the problem in perspective, thatpart of the watershed is relatively level, fertile, andconducive to intensive farming, and most of it hasbeen actively cultivated for more than 200 years.Therefore, the problem is not new, nor is it likely tointensify with added urban pressures. In 1996, crop-land was the largest single source of nutrients in theOccoquan (Schueler 1996). Although cropland isexpected to decline significantly in the area over thenext 3 decades, it is still projected to be a majorsource of nutrients and sediments to watershedstreams. In addition to cropping, that part of thewatershed contains the region's highest concentrationof dairy and livestock operations, which contributesnot only to the nutrient problem, but also to erodedstreambanks, sedimentation, and diminished riparianquality.
The other clump of drainages with low integrity rat-ings in the Occoquan occur along the Interstate 66corridor west of Manassas (Trapp 55, Mill up, L. Bullup, L. Bull dn, N. Fk 15) and extends westward intothe Rappahannock and Goose Creek Watersheds.Causes of impairment in that portion of the watershedare complex and varied; for example, the combinedeffects of suburban development, reservoirs andimpoundments, and agriculture. Although, the inci-dence and degree of impairment is not as high in thisportion of the watershed as that in the two areaspreviously described, the rate of suburban develop-ment is rapid in certain locations (e.g., the Gainesvillevicinity) and stream condition is expected to deterio-rate rapidly as well.
The adverse impact of impoundments on fish popula-tions has been well documented in other studies(Avery 1978, Etnier and Starnes 1993, Minckley andDeacon 1991, Winston et al. 1991) and is clearly illus-trated by our results in the Occoquan. For example, anumber of sample sites in this study were strategicallylocated above and below impoundments to examinethe effect of dams on the IBI (i.e., S. Fk 684 and N. Fk15 above Lake Manassas, S. Fk up and S. Fk dn aboveand below Lake Brittle, L. Bull up and L. Bull dn aboveand below Silver Lake, Lick up and Lick dn above andbelow Germantown Lake, and Airlie up and Airlie dnabove and below Airlie Lake). The locations of thosesites were determined solely by their proximity toimpoundments, without regard to other factors thatmay have influenced the IBI. With the exception ofMill dn, each of those sample locations had scores in
the poor or very poor integrity classes. Although otherfactors may have contributed to the low scores atthose sites, the preponderance of scores in the lowintegrity classes strongly suggests that impoundmentsnegatively influence the IBI. This observation providesadditional rationale for why the negative effects ofimpoundments should be considered while construct-ing regional disturbance gradients.
Although the focus of this report is the OccoquanWatershed, patterns of impairment were also observedin the other watersheds. As stated, the Interstate 66corridor west of Manassass displays a clump of scat-tered drainages of poor or very poor integrity along itsroute all the way to the Blue Ridge (Horner 691, Crom702, Crom 715, Chat 624, Big 55, and Goose 55). Al-though the highway itself, scattered housing develop-ments, and the small towns (Plains, Marshall, Mark-ham) may contribute pollutants, livestock access tostreams is probably the principal cause of impairmentto that group of streams. SVAP scores for each ofthose sites are low and indicate that unimpeded live-stock access to the streams is the main cause.
Goose Creek Watershed
Another band of impaired drainages occurs at thenorthern border of the Goose Creek Watershed (Cat-tail 773, Tusc 643, Tusc 621, Dry Mill 699, Syco 15, N.Fk 729, N. Fk 722, Crook 848, Sim 719, Beav 734, andDog 630). Suburban sprawl around the city ofLeesburg is probably responsible for low scores in theTuscarora system (Tusc 643, Tusc 621, and Dry Mill699) and in Cattail Branch. A combination of sprawlaround the towns of Hamilton, Purcellville, and RoundHill, in addition to livestock impairments, are morethan likely responsible for the low scores at N. Fk 729,N. Fk 722, and Crook 848. Isolation from Sleeter Lakeand sprawl from the towns of Round Hill and Purcell-ville are most likely responsible for the low score atSim 719. Livestock are probably responsible for theremaining low scores at Syco 15, Beav 734, and Dog630.
Rappahannock Watershed
In the Rappahannock watershed, few drainages dis-played significant signs of impairment. However, theMarsh Run mainstem, each of its contributing drain-ages, and neighboring Tinpot Run were all classified asvery poor, suggesting that that area is perhaps themost impaired of the entire region. Like the intensivelyfarmed portion of the Occoquan, those Rappahannockdrainages occur in the relatively flat terrain of theCulpeper Basin and have been cultivated for manyyears. Agricultural nonpoint pollution from bothcropping and concentrated livestock are most likelyresponsible for their low scores.

(Technical Note 190–13–1, WLI IBI Case Study, December 2001) 41
Using Regional IBI to Characterize Condition of Northern Virginia Streams: A case study
Use of IBI results in managementdecisions
With this study, a baseline condition that is benched ina regional IBI has been constructed for the Occoquanand its neighboring watersheds. This and other studiesdemonstrate that fine-tuning and regionalization of themetrics that compose the IBI can provide an accurateassessment of the condition of streams and theircontributing drainages, particularly at local levels. Thisstudy also helps achieve Schueler's (1996) recommen-dation to undertake a comprehensive inventory of thephysical and biological quality of the 1,300 miles ofstreams that drain the basin to determine their currentstatus and restoration potential.
The study also provides a direct linkage between thewatershed’s biology and its broadly based humaninfluences. The IBI has been used similarly in otherstudies to identify land use problems and causes ofimpairment. For example, Roth et al. (1996) found thatstream biotic integrity was more strongly influencedby broad land use patterns. Sites whose upstreamdrainages were dominated by agriculture rankedlowest by both the IBI and their measure of humaninfluence, whereas sites with land areas that containedhigher percentage of naturally vegetated land, particu-larly wetlands, tended to rank higher. Although Rothet al. found watershedwide land use patterns tended tobe a better predictor of biological integrity, otherstudies point to local impairments as a greater influ-ence. For example, in Wisconsin, Wang et al. (1997)found in a number of sites that grazing had removedgrasses and woody vegetation from riparian areas,resulting in higher stream temperature and loss ofoverhanging cover for fish. Along with high watershedslope, livestock grazing and trampling had destabilizedthe banks, leading to extensive erosion and sedimenta-tion.
Although this and several other studies have usedmultimetric indexes to identify watershed problems,application of specific management approaches basedon the IBI has yet to mature much beyond past uses ofphysical and chemical water quality modeling (Yoderand Smith 1999). However, using this report as a basis,further analysis of land use data and site informationcould help pinpoint sources of impairment and pro-vide targeted solutions to the identified problems. Forexample, some of the streams damaged by livestock,as identified by the IBI, would improve dramatically iffences were built to restrict or eliminate livestockaccess. Local planning officials could also analyzerelationships between degrees of urban developmentand the IBI scores of associated streams. This type of
analysis could help with several other managementactivities, including
• identifying land use patterns with the least im-pact on the environment,
• establishing thresholds on the amount of imper-vious surfaces allowed in subwatersheds,
• identifying problem areas in need of need resto-ration (e.g., riparian areas),
• locating sites for the purchase of conservationeasements, and
• evaluating the performance of conservationpractices, such as riparian buffers.
Although the IBI and HDI are expected to agree inmost instances, there will be some instances wherethey will not. For example, the HDI cannot possiblyaccount for all causes of impairment (e.g., toxicchemical spills, historical pesticide use) and does noteffectively deal with temporary disturbances. How-ever, such impacts are integrated and should be de-tectable by the IBI. If low IBI scores should occurwithout HDI agreement, then some disturbing factor isstill more than likely responsible. In such instances,the metrics that are most affected should be identifiedand reasons for their impairment should be explored.In some cases a full explanation may not be revealedwithout examining historical land use practices (e.g.,the application of persistent pesticides) or designingmore comprehensive monitoring of current physicaland chemical stream parameters.
A key objective in conducting this study was to evalu-ate IBI as a technique for assessing the effects ofconservation. Because the IBI is able to integrate bothpositive and negative effects of human influence, itmay afford a unique measure of the combined effectsof conservation practices (e.g., buffer strips, conserva-tion tillage, terraces, windbreaks) typical of thoserecommended by NRCS in cooperation with privatelandowners. In this context, it may also serve as auseful tool to assess the effectiveness of conservationprograms that are targeted to solve specific watershedproblems (e.g., the Conservation Reserve Enhance-ment Program). For example, in the Occoquan Water-shed, Schueler (1996) states that one of the majordifficulties in achieving greater nutrient reductionfrom the agricultural sector is poor participation inavailable conservation cost-sharing programs. How-ever, recent implementation of the ConservationReserve Enhancement Program has significantlyimproved those incentives statewide. The program'sgoal is to establish 35,000 acres of buffers consisting oftrees and native grasses next to streams to reducesediment, nutrients, and other polluted runoff. Farm-ers will be eligible for 75 to 100 percent cost-share for

42 (Technical Note 190–13–1, WLI IBI Case Study, December 2001)
Using Regional IBI to Characterize Condition of Northern Virginia Streams: A case study
taking land out of production and placing it in tempo-rary and permanent easements. Having a regional IBIestablished prior to implementation will provide theability to conduct before and after assessments of thatprogram’s practices and lead to the improved design ofspecific conservation measures. In this way, the IBIcan be used not only as a tool to assess watershedcondition, but as an endpoint to measure the achieve-ment of watershed goals.
Literature cited
Angermeier, P.L., and J.R. Karr. 1986. An index ofbiotic integrity based on stream fish communi-ties: considerations in sampling andinterpretation. N. Am. J. Fish. Mgt, 6:418-429.
Angermeier, P.L., and R. Smogor. 1994. Estimatingnumber of species and relative abundance instream-fish communities: effects of samplingeffort and discontinuous spatial distributions.Can. J. Fish. Aquat. Sci. 52:936-949.
Arnold, C., and C. Gibbons. 1996. Impervious surfacecoverage: the emergence of a key environmentalindicator. J. Am. Plan. Assoc. 62(2):243-258.
Avery, E.L. 1978. The influence of chemical reclama-tion on a small trout stream in southwesternWisconsin. Techn. Bull. No. 110. Wisconsin Dep.Natural Resourc., Madison, Wisconsin, 35 pp.
Baumann, P.C., W.D. Smith, and M. Ribick. 1982.Hepatic tumor rates and poly-nuclear aromatichydrocarbon levels in two populations of brownbullhead (Ictalurus nebulosus). In M.W. Cooke,A.J. Dennis, and G.L. Fisher, eds., PolynuclearAromatic Hydrocarbons: Sixtieth InternationalSymposium on Physical and Biological Chemis-try, Batelle Press, Columbus, Ohio, pp. 93-102.
Berkman, H.E., C.F. Rabeni, and T.P. Boyle. 1986.Biomonitors of stream quality in agriculturalareas: fish versus invertebrates. Environ. Mgt.10:413-419.
Brown, R.E., J.J. Hazdra, L. Keith, I. Greenspan, andJ.B.G. Kwapiniski. 1973. Frequency of fish tu-mors in a polluted watershed as compared tonon-polluted Canadian waters. Cancer Research33:189-198.
City of Olympia. 1994. Impervious surface reductionstudy. Final report. Water Resources Program.Public Works Dep., City of Olympia.
Cooper, E.L. 1952. Rate of exploitation of wild easternbrook trout and brown trout populations in thePigeon River, Otsego County, Michagan. Trans.Am. Fish. Soc. 81:224-234.
Danielson, T.J. 1998. Wetland bioassessment factsheets. EPA843-f-98-001. U.S. Environ. ProtectionAgency, Office of Wetlands, Oceans, and Water-sheds, Wetlands Division, Washington, D.C.

(Technical Note 190–13–1, WLI IBI Case Study, December 2001) 43
Using Regional IBI to Characterize Condition of Northern Virginia Streams: A case study
Davis, W.S., B.D. Snyder, J.B. Stribling, and C.Stoughton. 1996. Summary of state biologicalassessment programs for streams and rivers.EPA 230-R-96-007. U.S. Environmental ProtectionAgency, Office of Policy, Planning, and Evalua-tion, Washington, D.C.
Etnier, D.A., and W.C. Starnes. 1993. The fishes ofTennessee. Univ. Tenn. Press. Knoxville, Tennes-see, 681 pp.
Fausch, K.D., J. Lyons, J.R. Karr, and P.L. Angermeier.1990. Fish communities as indicators of environ-mental degradation. Am. Fish. Soc. Symp.8:123-144.
Hack, J.T. 1982. Physiographic division and differentialuplift in the Piedmont and Blue Ridge. U.S.Geological Survey Prof. Pap. 1265.
Hall, L.W. Jr., M.C. Scott, W.D. Killen, Jr., and R.D.Anderson. 1996. The effects of land-use charac-teristics and acid sensitivity on the ecologicalstatus of Maryland coastal plain streams.Environ. Toxicol. and Chem., 15:384-394.
Hatcher, L. 1994. A step-by-step approach to using theSAS® system for factor analysis and structuralequation modeling. SAS Inst., Inc., Cary, NorthCarolina.
Hoover, E.E. 1938. Fish populations of primitive brooktrout streams of northern New Hampshire.Trans. N. Am. Wildl. Conf. 3:486-496.
Hughes, R.M., and J.R. Gammon. 1987. Longitudinalchanges in fish assemblages and water quality inthe Willamette River, Oregon. Trans. Am. Fish.Soc. 116:196-209.
Hughes, R.M., and R.F. Noss. 1992. Biological diversityand biological integrity: current concerns forlakes and streams. Fisheries 17(3):11-19.
Hughes, R.M., T.R. Whittier, and C.M. Rohm. 1990. Aregional framework for establishing recoverycriteria. Environ. Mgt. 14:673-683.
Jenkins, R.E., and N.M. Burkhead. 1993. The freshwa-ter fishes of Virginia. Am. Fish. Soc., Bethesda,Maryland.
Johnson, M.G. 1965. Estimates of fish populations inwarmwater streams by the removal method.Trans. Am. Fish. Soc. 94:351-357.
Karr, J.R. 1981. Assessment of biotic integrity usingfish communities. Fisheries (Bethesda) 6(6):21-27.
Karr, J.R., and E.W. Chu. 1997. Biological monitoringand assessment: using multimetric indexeseffectively. EPA 235-297-001. University of Wash-ington, Seattle.
Karr, J.R., K.D. Fausch, P.L. Angermeier, P.R. Yant,and I.J. Schlosser. 1986. Assessing biologicalintegrity in running waters: a method and itsrationale. Ill. Nat. Hist. Survey Spec. Publ. 5,Urbana, Illinois.
Kuehne, Robert A., and R.W. Barbour. 1983. TheAmerican Darters. The Univ. Press of KY, Lexing-ton, Kentucky.
Lenat, D.R., and J.K. Crawford. 1994. Effects of landuse on water quality and aquatic biota of threeNorth Carolina Piedmont streams. Hydrobiologia294:185-199.
Leonard, P.M., and D.J. Orth. 1986. Application andtesting of an index of biotic integrity in small,coolwater streams. Trans. Am. Fish. Soc.115:401-415.
Lyons, J. 1992. Using the indexes of biotic integrity(IBI) to measure environmental quality inwarmwater streams of Wisconsin. Gen. Tech.Rep. NC-149. St. Paul, MN, U.S. Dep. Agric.,Forest Serv., N.Cen. Forest Exp. Sta.
Mahon, R. 1976. Effect of the cestode Ligula
intestinalis on spottail shiners, Notropis
hudsonius. Can. J. Zoology 54:2227-2229.
Matthews, W.J. 1987. Community and evolutionaryecology of North American stream fishes. Univ.Okla. Press, Norman, Oklahoma.
Miller, R.R., J.D. Williams, and J.E. Williams. 1989.Extinctions of North American fishes during thepast century. Fisheries 14(6):22-38.
Mills, H.B., W.C. Starrett, and F.C. Bellrose. 1966.Man's effect on the fish and wildlife of the IllinoisRiver. Ill. Nat. Hist. Surv. Biol. Notes 57:1-24.
Minckley, W.L., and J.E. Deacon. 1991. Battle againstextinction. Univ. Ariz. Press, Tuscon, Arizona.

44 (Technical Note 190–13–1, WLI IBI Case Study, December 2001)
Using Regional IBI to Characterize Condition of Northern Virginia Streams: A case study
Northern Virginia Planning District Commission. 1994.U.S. EPA clean lakes report for the OccoquanWatershed. N. Va. Plan. Dist. Comm., Annandale,Virginia.
Ohio Environmental Protection Agency. 1988. Biologi-cal criteria for the protection of aquatic life. Div.Water Qual. Monitor. and Assess., Surface WaterSec., Columbus, Ohio.
Page, L.M. 1983. Handbook of darters. TFH Publ., Inc.,Neptune City, New Jersey.
Richards, C.L., L.B. Johnson, and G.E. Host. 1996.Landscape-scale influences on stream habitatsand biota. Can. J. Fish. Aquat. Sci. 53 (suppl. 1):295-311.
Rosenberg, David M., and Vincent H. Resh, eds. 1993.Freshwater biomonitoring and benthic macro-invertebrates. Chapman & Hall, New York, NewYork.
Roth, N.E., J.D. Allan, and D.E. Erickson. 1996. Land-scape influences on stream biotic integrityassessed at multiple spatial scales. LandscapeEcol. 11:141-156.
Schlosser, I.J. 1982. Fish community structure andfunction along two habitat gradients in a headwa-ter stream. Ecol. Monogr. 52:395-414.
Schlosser, I.J. 1991. Stream fish ecology: a landscapeperspective. BioScience 41:704-711.
Schueler, T. 1995. Site planning for urban streamprotection. Ctr. for Watershed Protec., Metro.Washington Council Gov., Silver Spring, Mary-land.
Schueler, T. 1996. The limits to growth: sustainabledevelopment in the Occoquan Basin. Ctr. forWatershed Protec., Metro. Washington CouncilGov., Silver Spring, Maryland.
Simon, T.P., ed. 1999. Assessing the sustainability andbiological integrity of water resources using fishassemblages. CRC Press, Boca Raton, Florida.
Smogor, R. 1996. Developing an index of biotic integ-rity (IBI) for warmwater wadeable streams inVirginia. MS thesis, Va. Poly. Insti. and StateUniv., Blacksburg, Virginia.
Smogor, R.A., and P.L. Angermeier. 1999. Relationsbetween fish metrics and measures of anthropo-genic disturbance in three IBI regions of Virginia.In T.P. Simon, ed., Assessing the sustainabilityand biological integrity of water resources usingfish assemblages, CRC Press, Boca Raton,Florida, pp. 585-610.
Steedman, R.J. 1988. Modification and assessment ofan index of biotic integrity to quantify streamquality in southern Ontario. Can. J. Fish. andAquatic Sci. 45:492-501.
United States Department of Agriculture, NaturalResources Conservation Service. 1998. Streamvisual assessment protocol. Nat. Water andClimate Ctr. NWCC-TN-99-1, Portland, Oregon.
United States Environmental Protection Agency. 1998.Clean water action plan: Restoring and protect-ing America's waters. EPA-840-R-98-001, Ntl.Cen. Environ. Publ. and Info., Cincinnati, Ohio.
Wang, L., J. Lyons, P. Kanehl, and R. Gatti. 1997. Influ-ences of watershed land use on habitat qualityand biotic integrity in Wisconsin streams. Fisher-ies 22(6):6-12.
Warren, M.J., P.L. Angermeier, B.M. Burr, and W.R.Haag. 1997. Decline of a diverse fish fauna:patterns of imperilment and protection in thesoutheastern United States. In Aquatic Fauna inPeril. S.E. Aquatic Inst. Spec. Publ. 1. Decatur,Georgia, pp. 105-164.
Winston, M.W., C. Taylor, and J. Pigg. 1991. Upstreamextirpation of four minnow species due to dam-ming of a prairie stream. Trans. Am. Fish. Soc.120:98-105.
Yoder, C.O., and E.T. Rankin. 1995. Biological criteriadevelopment and implementation in Ohio. InW.S. Davis and T.P. Simon, eds., Biologicalassessment and criteria: tools for water resourceplanning and decision making, Lewis, BocaRaton, Florida, pp. 109-144 .
Yoder, C.O., and M.A. Smith. 1999. Using fish assem-blages in a state biological assessment andcriteria program: essential concepts and consid-erations. In T.P. Simon, ed., Assessing thesustainability and biological integrity of waterresources using fish communities, CRC Press,Boca Raton, Florida, pp. 17-56.

(Technical Note 190–13–1, WLI IBI Case Study, December 2001) 45
Tables Table 7 Location descriptions of fish sampling sites
Table 8 Raw fish data for 157 sites in study
Figures Figure 30 Metric Evaluation: Separation of least from most impaired sites
Figure 31 Correlation of individual metrics/attributes with the Human
Disturbance Index
Figure 32 Metric scoring
Figure 33 Distribution maps for species collected in the study area
Figure 34 Integrity classification for fish sample locations
Figure 35 Goose Creek Watershed sample locations
Figure 36 Occoquan River Watershed sample locations
Figure 37 Rappahannock River Watershed sample locations
Appendix Tables and Figures Developed in theStudy

46 (Technical Note 190–13–1, WLI IBI Case Study, December 2001)
Using Regional IBI to Characterize Condition of Northern Virginia Streams: A case study

(Technical Note 190–13–1, WLI IBI Case Study, December 2001) 47
Using Regional IBI to Characterize Condition of Northern Virginia Streams: A case study
Table 7 Location descriptions of fish sampling sites
Site names are based on the intersection of the specified stream and route number of the state or county road,unless otherwise indicated. Reach locations begin immediately downstream or upstream of the crossing, account-ing for a safe distance beyond the bridge or similar structure that may affect the results.
Drainage area <17 km2
Occoquan River Watershed
Site # Site name Location
1 Airlie up Cedar Run between route 628 and private road immediately above Airlie mitigation area2 Airlie mit the mitigation cells on Cedar Run at Airlie3 Airlie dn Cedar Run below the multi-purpose dam at Airlie4 Gup 602 Gupton Run above crossing5 Owl 616 Owl Run above crossing6 Wal 767 Walnut Run above crossing7 Broad GM Broad Run at Great Meadows, upstream of fence at the lower end of property8 Pine 246 Piney Branch of Broad Run above crossing9 Mill up Mill Run above lake at Kinloch Farm10 Mill dn Mill Run below dam at Kinloch Farm11 N. Fk 15 North Fork of Broad Run above crossing12 S. Fk up South Fork of Broad Run above Lake Brittle13 S. Fk dn South Fork of Broad Run below dam of Lake Brittle14 L Bull up Little Bull Run above Silver Lake15 L Bull dn Little Bull Run below dam of Silver Lake16 Cat 15 Catharpin Creek below crossing17 Black 15 Black Branch below crossing18 Young 234 Youngs Branch above crossing19 Flatlick 50 Flatlick Branch below crossing20 Rocky 645 Rocky Run above crossing21 Piney 660 Piney Branch of Popes Head Creek above crossing22 Hooes 641 Hooes Run above crossing23 Long 695 Long Branch above confluence of Occoquan Creek (Lake Jackson)24 Cannon 28 Cannon Run below crossing25 Purcel 643 Purcell Run below crossing26 Elk 607 Elk Run below crossing27 Wolf 643 Wolf Run below crossing28 Sandy 647 Sandy Run below crossing
Rappahannock River Watershed
29 Horner 691 Horner Run below crossing30 South 738 South Run below crossing31 E. Th. 647 East Branch of Thumb Run below crossing32 Bowens 28 Bowens Run below crossing33 Great 678 Great Run above crossing34 Muddy 729 Muddy Run below crossing35 Waterf 229 Waterford Run below crossing36 Piney 600 Piney Falls Fork of the Thornton River below crossing37 Rap 635 Rappahannock River below crossing

48 (Technical Note 190–13–1, WLI IBI Case Study, December 2001)
Using Regional IBI to Characterize Condition of Northern Virginia Streams: A case study
Table 7 Location descriptions of fish sampling sites—Continued
Drainage area <17 km2—Continued
Goose Creek Watershed
Site # Site name Location
38 Sim 719 Simpsons branch above crossing39 Jacks 690 Jacks Branch below crossing40 Crom 702 Cromwells Run below crossing41 Buch 626 Butchers Branch below crossing42 Dog 630 Dog Branch above crossing43 N. fk(b) 725 North Fork of Beaverdam Creek below crossing44 Crook 848 Crooked Run of lower Goose Creek below crossing45 Dry Mill 699 Dry Mill Branch above crossing46 Cattail 773 Cattail Branch below crossing47 Big 650 Big Branch of lower Goose Creek below crossing48 Hungry 632 Hungry Run above bridge at barn about 1 mile north of confluence with Little River49 Burnt 626 Burnt Mill Run below crossing50 Syco 15 South Branch of Sycoline Creek below crossing51 Chat 624 Chattin's Run above crossing
Drainage area 17 to 34 km2
Occoquan River Watershed
52 Mill 605 Mill Run below crossing53 Turk 602 Turkey Run above crossing54 Lick 674 Licking Run above crossing55 Town 639 Town Run above crossing56 Slate 649 Slate Run above crossing57 Trapp 55 Trap Branch above crossing58 S. Fk 684 South Fork of Broad Run above crossing59 Kett 604 Kettle Run below crossing60 L Bull 676 Little Bull Run above crossing61 Cat 676 Catharpin Creek above crossing62 Chest 686 Chestnut Lick below crossing63 Bull 624 Bull Run below crossing64 Flat Lmnd Flat Branch below bridge of Lomond Drive in the city of Manassas65 Slate 611 Slate Run above crossing66 Chest 701 Chestnut Lick below crossing67 Bull 705 Bull Run above the confluence with Chestnut Lick68 E. Fk 660 East Fork of Popes Head Creek above crossing69 Elklick 609 Elklick Run above crossing70 Flatlick 620 Flatlick Branch above crossing71 L. Roc 658 Little Rocky Run above crossing72 Popes 612 Popes Head Creek above crossing

(Technical Note 190–13–1, WLI IBI Case Study, December 2001) 49
Using Regional IBI to Characterize Condition of Northern Virginia Streams: A case study
Table 7 Location descriptions of fish sampling sites—Continued
Drainage area 17 to 34 km2—Continued
Rappahannock River Watershed
Site # Site name Location
73 South 737 South Run below crossing74 Buck 735 Buck Run below crossing75 Fiery 635 Fiery Run below crossing76 Battle 633 Battle Run below crossing77 Tinpot 657 Tinpot Run above crossing78 Brown 653 Browns Run above crossing79 Indian 626 Indian Run below crossing80 Jacob 626 Jacob's run above crossing81 Jordan 522 Jordan River above crossing82 Marsh 17 Marsh Run above crossing83 Craig 805 Craig Run below crossing84 Hazel 231 Hazel River below crossing85 Thorn 522 Thornton River below crossing86 Cov 522 Covington River above crossing87 Hittles 522 Hittles Mill Run below crossing
Goose Creek Watershed
88 Goose 688 Goose Creek below crossing89 Big 55 Big Branch of upper Goose Creek above crossing90 Crom 715 Cromwells Run above crossing91 Jeff 719 Jeffries Branch above crossing92 Beav 790 Beaverdam Creek above crossing93 N.Fkg 791 North Fork of Goose Creek below crossing94 Crook 727 Crooked Run of lower Goose Creek above crossing95 Tusc 621 Tuscarora Creek below bridge on old route 621 in city of Leesburg96 Syco 621 Sycoline Creek above crossing97 Little 705 Little River below crossing98 Crook 688 Crooked Run of upper Goose Creek below crossing99 Gap 710 Gap Run above crossing100 Tusc 643 Tuscarora Creek below crossing
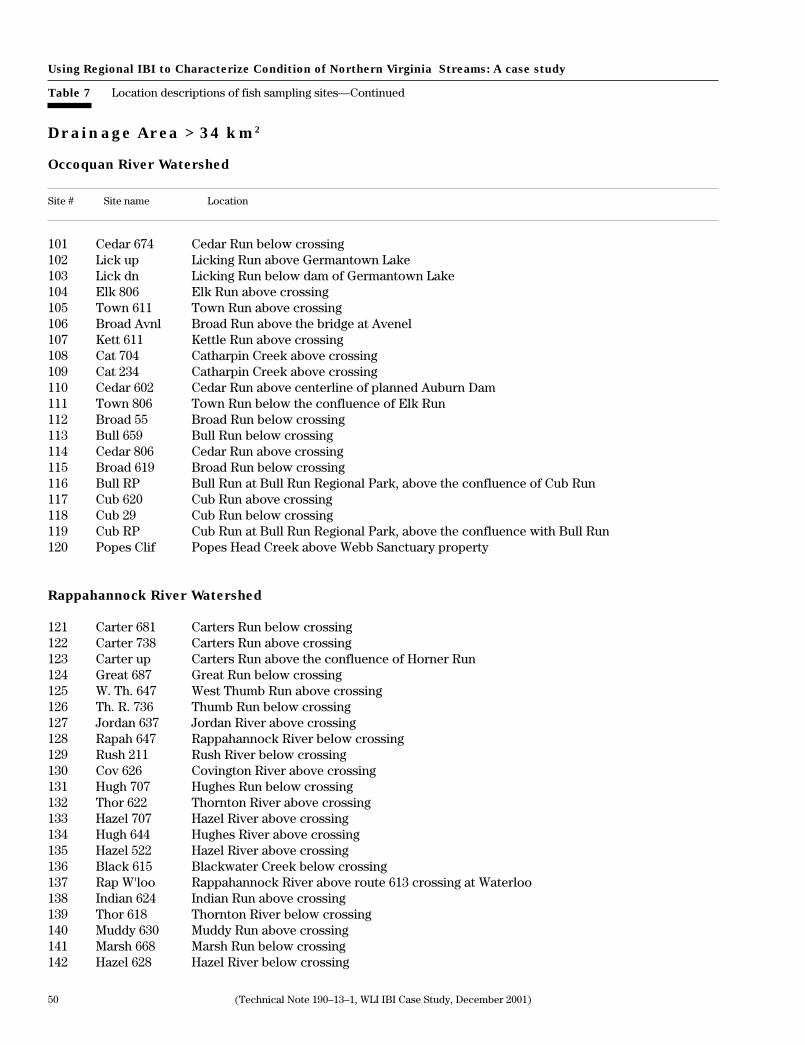
50 (Technical Note 190–13–1, WLI IBI Case Study, December 2001)
Using Regional IBI to Characterize Condition of Northern Virginia Streams: A case study
Table 7 Location descriptions of fish sampling sites—Continued
Drainage Area > 34 km2
Occoquan River Watershed
Site # Site name Location
101 Cedar 674 Cedar Run below crossing102 Lick up Licking Run above Germantown Lake103 Lick dn Licking Run below dam of Germantown Lake104 Elk 806 Elk Run above crossing105 Town 611 Town Run above crossing106 Broad Avnl Broad Run above the bridge at Avenel107 Kett 611 Kettle Run above crossing108 Cat 704 Catharpin Creek above crossing109 Cat 234 Catharpin Creek above crossing110 Cedar 602 Cedar Run above centerline of planned Auburn Dam111 Town 806 Town Run below the confluence of Elk Run112 Broad 55 Broad Run below crossing113 Bull 659 Bull Run below crossing114 Cedar 806 Cedar Run above crossing115 Broad 619 Broad Run below crossing116 Bull RP Bull Run at Bull Run Regional Park, above the confluence of Cub Run117 Cub 620 Cub Run above crossing118 Cub 29 Cub Run below crossing119 Cub RP Cub Run at Bull Run Regional Park, above the confluence with Bull Run120 Popes Clif Popes Head Creek above Webb Sanctuary property
Rappahannock River Watershed
121 Carter 681 Carters Run below crossing122 Carter 738 Carters Run above crossing123 Carter up Carters Run above the confluence of Horner Run124 Great 687 Great Run below crossing125 W. Th. 647 West Thumb Run above crossing126 Th. R. 736 Thumb Run below crossing127 Jordan 637 Jordan River above crossing128 Rapah 647 Rappahannock River below crossing129 Rush 211 Rush River below crossing130 Cov 626 Covington River above crossing131 Hugh 707 Hughes Run below crossing132 Thor 622 Thornton River above crossing133 Hazel 707 Hazel River above crossing134 Hugh 644 Hughes River above crossing135 Hazel 522 Hazel River above crossing136 Black 615 Blackwater Creek below crossing137 Rap W'loo Rappahannock River above route 613 crossing at Waterloo138 Indian 624 Indian Run above crossing139 Thor 618 Thornton River below crossing140 Muddy 630 Muddy Run above crossing141 Marsh 668 Marsh Run below crossing142 Hazel 628 Hazel River below crossing

(Technical Note 190–13–1, WLI IBI Case Study, December 2001) 51
Using Regional IBI to Characterize Condition of Northern Virginia Streams: A case study
Table 7 Location descriptions of fish sampling sites—Continued
Drainage Area > 34 km2—Continued
Goose Creek Watershed
Site # Site name Location
143 Crook 623 Crooked Run of upper Goose Creek above crossing144 Goose 17 Goose Creek below crossing145 Gap 623 Gap Run above crossing146 Panth 623 Pantherskin Creek below crossing147 N Fk. 722 North Fork of Goose Creek above crossing148 N.Fkb 611 North Fork of Beaverdam Creek below crossing149 N Fk. 729 North Fork of Goose Creek below crossing150 Beav 734 Beaverdam Creek below crossing151 Goose733 Goose Creek above bridge at Limestone Kiln farm152 Goose 710 Goose Creek above crossing153 Goose 611 Goose Creek below crossing154 Little 776 Little River above crossing155 Little 50 Little River below crossing156 Goose 55 Goose Creek below crossing157 Syc 643 Sycoline Creek below crossing

52 (Technical Note 190–13–1, WLI IBI Case Study, December 2001)
Using Regional IBI to Characterize Condition of Northern Virginia Streams: A case study
Table 8 Raw fish data for 157 sites in study
Common name 1 2 3 4 5 6 7 8 9 10 11Airlie up Airlie mit Airlie dn Gup 602 Owl 616 Wal 767 Broad GM Pine 246 Mill up Mill dn N. Fk 15
American brook lamprey 0 0 0 0 0 0 0 0 0 0 0Gizzard shad 0 0 0 0 0 0 0 0 0 0 0American eel 0 0 0 0 0 0 0 0 0 0 0Redfin pickerel 0 0 0 0 0 0 0 0 0 0 0Eastern mudminnow 0 0 0 0 0 0 0 0 0 0 11Common carp 0 0 0 0 0 0 0 0 0 0 0Golden shiner 0 1 0 0 10 8 23 2 0 0 5Mountain redbelly dace 0 0 0 0 0 0 0 0 0 0 0Rosyside dace 11 0 0 2 0 0 35 0 73 5 0Fallfish 3 0 0 11 0 3 0 0 3 69 0Creek chub 0 0 0 0 0 0 0 0 0 0 0River chub 0 0 0 0 0 0 0 0 9 3 0Bluehead chub 0 0 0 0 0 0 0 0 0 0 0Cutlips minnow 50 0 0 0 0 0 1 0 5 1 0Blacknose dace 115 0 0 0 0 0 5 0 99 4 0Longnose dace 0 0 0 0 0 0 0 0 0 0 0Central stoneroller 0 0 0 0 0 0 0 0 0 0 0Eastern silvery minnow 0 0 0 16 27 8 0 0 0 0 0Common shiner 2 0 0 3 0 3 16 0 57 48 0Satinfin shiner 0 0 0 87 0 0 90 14 0 0 0Spotfin shiner 0 0 0 0 0 0 0 0 0 0 0Bluntnose minnow 68 12 2 19 10 10 98 7 45 1 0Fathead minnow 0 0 0 0 7 1 0 0 0 0 0Comely shiner 0 0 0 0 0 0 0 0 0 0 0Spottail shiner 0 0 0 0 0 0 0 0 0 0 0Swallowtail shiner 0 0 0 3 4 0 4 0 0 0 0Rosyface shiner 0 0 0 0 0 0 0 0 0 0 0Silverjaw minnow 0 0 0 0 0 0 0 0 0 0 0White sucker 3 0 0 47 4 39 1 0 10 19 0Creek chubsucker 0 0 0 7 5 3 2 3 0 0 3Northern hogsucker 0 0 0 0 0 0 0 0 0 4 0Torrent sucker 0 0 0 0 0 0 0 0 0 0 0Golden redhorse 0 0 0 0 0 0 0 0 0 0 0Shorthead redhorse 0 0 0 0 0 0 0 0 0 0 0Channel Catfish 0 0 0 0 0 0 0 0 0 0 0Yellow bullhead 0 1 1 2 0 0 30 3 0 0 6Brown bullhead 0 0 0 0 0 1 0 0 0 0 0Margined madtom 0 0 0 0 0 0 21 3 0 0 0Banded killifish 0 0 0 0 0 0 0 0 0 0 0Eastern mosquitofish 0 0 0 0 0 0 0 0 0 0 0Mottled sculpin 0 0 0 0 0 0 0 0 0 0 0Potomac sculpin 0 0 0 0 0 0 0 0 0 0 0Redbreast sunfish 0 6 0 3 1 3 52 47 1 5 14Green sunfish 65 127 11 1 8 1 24 8 0 3 0Pumpkinseed 2 29 6 0 20 2 3 0 1 0 5Bluegill 0 6 138 19 88 54 27 15 14 9 30Redear sunfish 0 0 0 0 0 0 0 0 0 0 0Rock bass 0 0 0 0 0 0 0 0 0 0 0White crappie 0 0 0 0 0 1 0 0 0 0 0Smallmouth bass 0 0 0 0 0 0 0 0 0 0 0Largemouth bass 0 1 0 11 4 5 1 15 0 0 1Shield darter 0 0 0 0 0 0 1 0 0 0 0Stripeback darter 0 0 0 0 0 0 0 0 0 0 0Tesselated darter 4 0 0 5 2 1 192 46 0 4 37Glassy darter 0 0 0 0 0 0 0 0 0 0 0Fantail darter 38 0 0 1 0 0 47 15 39 1 12Greenside darter 0 0 0 0 0 0 0 0 0 0 0Hybrids 0 0 6 0 2 1 0 0 0 0 0
Total 361 183 164 237 192 144 673 178 356 176 124
Anomalies 0 1 0 2 4 0 0 0 0 0 0

(Technical Note 190–13–1, WLI IBI Case Study, December 2001) 53
Using Regional IBI to Characterize Condition of Northern Virginia Streams: A case study
Table 8 Raw fish data for 157 sites in study—Continued
Common name 12 13 14 15 16 17 18 19 20 21 22S. Fk up S. Fk dn L Bull up L Bull dn Cat 15 Black 15 Young Flatlick Rocky Piney Hooes
234 50 645 660 641
American brook lamprey 0 0 0 0 0 0 0 0 0 0 0Gizzard shad 0 0 0 0 0 0 0 0 0 0 1American eel 0 0 0 0 0 0 0 0 0 0 0Redfin pickerel 0 0 0 0 1 0 0 0 0 0 0Eastern mudminnow 0 0 0 0 0 0 0 0 0 0 0Common carp 0 0 0 0 0 0 0 0 0 0 0Golden shiner 8 3 0 0 0 1 0 0 2 0 0Mountain redbelly dace 0 0 0 0 0 0 0 0 0 0 0Rosyside dace 1 0 421 4 171 4 72 0 9 11 0Fallfish 0 0 187 0 41 0 39 0 0 2 0Creek chub 80 0 0 5 0 3 17 72 33 6 11River chub 0 0 0 0 0 0 0 0 0 0 0Bluehead chub 0 0 0 0 0 0 0 0 0 0 0Cutlips minnow 0 0 0 4 15 27 0 0 1 1 0Blacknose dace 5 1 223 0 24 0 5 8 19 291 73Longnose dace 0 0 0 0 8 0 0 1 22 6 0Central stoneroller 0 0 0 0 0 0 0 0 0 0 0Eastern silvery minnow 0 0 0 0 0 2 1 0 1 0 0Common shiner 0 0 0 0 71 71 2 0 5 19 0Satinfin shiner 2 0 0 0 16 7 17 0 113 0 224Spotfin shiner 0 0 0 0 0 0 0 0 0 0 0Bluntnose minnow 3 4 0 16 2 5 0 226 30 28 0Fathead minnow 0 0 0 0 0 0 0 0 0 0 0Comely shiner 0 0 0 0 0 46 16 0 0 0 0Spottail shiner 0 0 0 0 0 7 1 7 0 0 3Swallowtail shiner 0 0 0 0 21 22 138 0 89 61 333Rosyface shiner 0 0 0 0 0 0 0 0 0 0 0Silverjaw minnow 0 0 0 0 0 0 0 0 0 0 0White sucker 7 3 4 5 4 2 11 5 0 8 5Creek chubsucker 0 0 0 6 0 0 0 2 0 0 1Northern hogsucker 0 0 0 0 5 0 0 0 1 1 0Torrent sucker 0 0 0 0 0 0 0 0 0 0 0Golden redhorse 0 0 0 0 0 0 0 0 0 0 0Shorthead redhorse 0 0 0 0 0 0 0 0 0 0 0Channel Catfish 0 0 0 0 0 0 0 0 0 0 0Yellow bullhead 7 50 0 7 0 5 0 0 0 0 0Brown bullhead 0 0 0 0 0 0 0 0 0 0 0Margined madtom 0 0 0 0 0 2 0 0 0 0 0Banded killifish 0 0 0 0 0 0 0 0 0 0 0Eastern mosquitofish 0 0 0 37 0 0 0 0 0 0 0Mottled sculpin 0 0 0 0 0 0 0 0 0 0 0Potomac sculpin 0 0 0 0 0 0 0 0 0 0 0Redbreast sunfish 0 47 0 2 14 7 16 2 29 3 0Green sunfish 0 0 0 15 2 3 26 1 10 11 13Pumpkinseed 1 4 0 1 0 1 0 0 2 0 0Bluegill 24 52 1 60 0 4 4 16 20 7 34Redear sunfish 0 0 0 0 0 0 0 0 0 0 0Rock bass 0 0 0 0 0 0 0 0 0 0 0White crappie 32 12 0 0 0 0 0 0 0 0 0Smallmouth bass 0 0 0 0 0 0 0 0 0 0 0Largemouth bass 0 6 0 18 0 6 0 4 0 0 0Shield darter 0 0 0 0 0 0 0 0 0 0 0Stripeback darter 0 0 0 0 0 0 0 0 0 0 0Tesselated darter 0 13 4 1 18 23 66 7 6 25 29Glassy darter 0 0 0 0 0 0 0 0 0 0 0Fantail darter 53 0 24 6 30 17 13 9 28 41 0Greenside darter 0 0 0 0 0 0 0 0 0 0 0Hybrids 0 0 0 0 0 1 0 0 4 1 0
Total 223 195 864 187 443 266 444 360 424 522 727
Anomalies 0 0 0 0 0 1 0 6 5 0 1

54 (Technical Note 190–13–1, WLI IBI Case Study, December 2001)
Using Regional IBI to Characterize Condition of Northern Virginia Streams: A case study
Table 8 Raw fish data for 157 sites in study—Continued
Common name 23 24 25 26 27 28 29 30 31 32 33Long Cannon Purcel Elk Wolf Sandy Horner South E. Th. Bowens Great695 28 643 607 643 647 691 738 647 28 678
American brook lamprey 0 0 0 0 0 0 0 0 0 0 0Gizzard shad 0 0 0 0 0 0 0 0 0 0 0American eel 0 0 0 0 0 0 0 0 0 0 0Redfin pickerel 0 0 0 0 0 0 0 0 0 0 0Eastern mudminnow 0 0 0 0 0 0 0 0 0 0 0Common carp 0 0 0 0 0 3 0 0 0 0 0Golden shiner 1 0 0 0 0 0 6 0 0 2 8Mountain redbelly dace 0 0 0 0 0 0 0 0 0 0 0Rosyside dace 10 0 197 3 2 0 33 220 48 0 2Fallfish 28 3 15 0 5 8 2 35 94 0 1Creek chub 7 0 44 169 33 9 8 3 3 0 6River chub 0 1 0 0 0 0 3 9 2 0 0Bluehead chub 0 0 0 0 0 0 0 0 0 0 25Cutlips minnow 0 3 0 0 0 0 3 1 2 0 0Blacknose dace 36 0 69 0 201 11 109 176 134 0 15Longnose dace 0 0 0 0 0 1 7 6 38 0 0Central stoneroller 0 0 0 0 0 0 0 0 0 0 0Eastern silvery minnow 0 2 0 30 0 2 0 0 0 0 0Common shiner 1 1 0 0 1 0 16 45 23 0 19Satinfin shiner 7 0 0 113 1 0 17 0 23 0 0Spotfin shiner 0 0 0 0 0 0 0 0 0 0 0Bluntnose minnow 14 62 0 20 0 0 137 0 0 0 113Fathead minnow 0 0 0 0 0 0 0 0 0 0 0Comely shiner 0 0 0 4 0 0 0 0 0 0 0Spottail shiner 0 8 0 101 9 129 0 0 0 0 0Swallowtail shiner 96 86 0 35 68 88 24 0 13 0 0Rosyface shiner 0 0 0 4 0 0 0 0 0 0 0Silverjaw minnow 0 0 0 0 0 0 8 121 13 0 0White sucker 4 22 28 55 27 4 80 3 52 0 9Creek chubsucker 0 9 0 3 0 3 6 0 0 1 2Northern hogsucker 1 0 0 0 13 0 1 0 23 0 0Torrent sucker 0 0 0 0 0 0 0 0 0 0 0Golden redhorse 0 0 0 0 0 0 0 0 0 0 0Shorthead redhorse 0 0 0 0 0 0 0 0 0 0 0Channel Catfish 0 0 0 0 0 0 0 0 0 0 0Yellow bullhead 1 3 1 14 0 5 0 0 0 0 0Brown bullhead 0 0 0 0 0 0 0 0 0 0 0Margined madtom 0 0 0 0 0 2 0 0 0 0 3Banded killifish 0 2 0 0 0 0 0 0 0 0 0Eastern mosquitofish 0 2 0 0 4 0 0 0 0 574 0Mottled sculpin 0 0 0 0 0 0 0 6 0 0 0Potomac sculpin 0 0 0 0 0 0 0 0 0 0 0Redbreast sunfish 7 23 0 2 0 0 17 0 2 0 25Green sunfish 8 15 30 23 3 24 2 2 1 17 2Pumpkinseed 0 0 1 5 0 1 1 0 1 5 61Bluegill 37 55 4 4 14 35 0 5 6 42 35Redear sunfish 0 0 0 0 0 0 0 0 0 0 0Rock bass 0 0 0 0 0 0 0 0 0 0 1White crappie 0 0 0 0 0 0 0 0 0 19 0Smallmouth bass 0 0 0 0 0 0 0 0 0 0 0Largemouth bass 1 12 0 3 2 12 0 0 1 0 11Shield darter 0 0 0 0 0 0 0 0 0 0 0Stripeback darter 0 0 0 0 0 0 1 0 1 0 1Tesselated darter 6 6 33 61 38 13 53 33 161 0 16Glassy darter 0 0 0 0 0 0 0 0 0 0 0Fantail darter 8 5 4 0 4 3 0 0 0 0 0Greenside darter 0 0 0 0 0 0 0 0 0 0 0Hybrids 0 0 0 0 1 3 0 0 0 3 0
Total 273 320 426 649 426 356 534 665 641 663 355
Anomalies 0 0 2 0 43 1 33 0 1 0 2

(Technical Note 190–13–1, WLI IBI Case Study, December 2001) 55
Using Regional IBI to Characterize Condition of Northern Virginia Streams: A case study
Table 8 Raw fish data for 157 sites in study—Continued
Common name 34 35 36 37 38 39 40 41 42 43 44Muddy Waterf Piney Rap Sim Jacks Crom Buch Dog N. fk(b) Crook
729 229 600 635 719 690 702 626 630 725 848
American brook lamprey 0 0 0 0 0 0 0 0 0 0 0Gizzard shad 0 0 0 0 0 0 0 0 0 0 0American eel 0 0 1 0 0 0 0 0 0 0 0Redfin pickerel 0 0 0 0 0 0 0 0 0 0 0Eastern mudminnow 0 0 0 0 0 0 0 0 0 0 0Common carp 0 0 0 0 0 0 0 0 0 0 0Golden shiner 0 0 0 0 0 0 0 1 0 5 0Mountain redbelly dace 11 73 48 0 0 0 0 0 0 0 0Rosyside dace 112 6 197 69 1 126 0 300 18 78 74Fallfish 40 56 51 18 0 0 0 0 0 0 0Creek chub 87 53 0 2 14 138 99 28 18 28 45River chub 0 0 12 21 0 0 0 0 0 0 0Bluehead chub 77 105 0 0 0 0 0 0 0 0 0Cutlips minnow 0 0 2 12 0 0 0 0 0 0 0Blacknose dace 42 5 88 19 30 135 248 293 21 65 212Longnose dace 4 3 7 0 0 0 0 0 0 0 37Central stoneroller 0 0 0 0 0 0 0 0 0 0 3Eastern silvery minnow 5 1 0 0 0 0 0 0 0 0 0Common shiner 104 34 69 138 0 0 0 16 4 13 3Satinfin shiner 33 282 0 5 0 0 0 0 0 0 0Spotfin shiner 0 0 0 0 1 0 0 0 0 0 0Bluntnose minnow 1 76 0 0 1 11 138 0 53 85 115Fathead minnow 0 0 0 0 0 0 7 0 0 0 0Comely shiner 0 1 0 1 0 0 0 0 0 0 0Spottail shiner 0 0 0 0 1 28 0 2 0 0 4Swallowtail shiner 79 18 0 1 0 0 0 0 0 0 0Rosyface shiner 0 1 1 0 0 0 0 0 0 0 0Silverjaw minnow 239 326 0 0 0 8 80 0 18 9 154White sucker 20 20 8 27 20 42 11 9 6 5 69Creek chubsucker 0 0 0 0 0 0 0 1 5 5 2Northern hogsucker 1 0 1 10 0 0 0 0 0 0 0Torrent sucker 0 0 0 1 0 0 0 0 0 0 0Golden redhorse 0 0 0 0 0 0 0 0 0 0 0Shorthead redhorse 0 0 0 0 0 0 0 0 0 0 0Channel Catfish 0 0 0 0 0 0 0 0 1 0 0Yellow bullhead 0 2 0 0 0 3 0 0 0 0 4Brown bullhead 0 0 0 0 0 0 0 0 0 0 0Margined madtom 0 6 2 1 0 0 0 0 0 0 0Banded killifish 0 0 0 0 0 0 0 0 0 0 0Eastern mosquitofish 0 0 0 0 0 0 0 0 1 0 0Mottled sculpin 0 0 18 1 0 0 0 0 0 0 0Potomac sculpin 0 0 0 0 0 0 0 36 0 5 1Redbreast sunfish 9 10 0 1 0 0 5 8 0 8 39Green sunfish 0 6 0 0 2 0 4 0 4 10 0Pumpkinseed 0 0 0 0 2 1 1 0 2 7 0Bluegill 12 2 0 3 104 41 6 0 70 26 0Redear sunfish 0 0 0 0 0 0 0 0 0 0 0Rock bass 0 1 9 12 0 0 0 0 0 0 0White crappie 0 0 0 0 0 4 0 0 0 0 0Smallmouth bass 0 3 6 9 0 0 0 0 0 0 0Largemouth bass 4 0 2 3 13 15 0 0 2 3 0Shield darter 0 0 0 0 0 0 0 0 0 0 0Stripeback darter 3 0 0 0 0 0 0 0 0 0 0Tesselated darter 38 26 13 4 0 0 15 5 0 5 0Glassy darter 0 0 0 0 0 0 0 0 0 0 0Fantail darter 0 0 0 0 22 5 25 25 2 5 15Greenside darter 0 0 0 0 0 0 0 4 0 0 1Hybrids 0 0 0 0 0 0 0 0 0 2 0
Total 921 1116 535 358 211 557 639 728 225 364 778
Anomalies 4 2 0 2 2 3 25 17 0 2 51

56 (Technical Note 190–13–1, WLI IBI Case Study, December 2001)
Using Regional IBI to Characterize Condition of Northern Virginia Streams: A case study
Table 8 Raw fish data for 157 sites in study—Continued
Common name 45 46 47 48 49 50 51 52 53 54 55Dry Mill Cattail Big Hungry Burnt Syco Chat Mill Turk Lick Town
699 773 650 632 626 15 624 605 602 674 639
American brook lamprey 0 0 0 0 0 0 0 0 0 0 0Gizzard shad 0 0 0 0 0 0 0 0 0 0 0American eel 0 0 0 0 0 0 0 0 0 0 0Redfin pickerel 0 0 0 0 0 0 0 0 0 12 0Eastern mudminnow 0 0 0 0 0 0 0 0 0 0 0Common carp 0 0 0 0 0 0 0 0 0 0 0Golden shiner 0 0 0 0 0 8 0 1 0 0 14Mountain redbelly dace 0 0 0 0 0 0 0 0 0 0 0Rosyside dace 3 0 60 24 35 0 9 33 12 31 2Fallfish 0 0 4 0 0 0 1 15 10 0 0Creek chub 45 33 31 14 31 41 26 0 0 0 41River chub 0 0 0 0 0 0 0 0 0 0 0Bluehead chub 0 0 0 0 0 0 0 0 0 0 0Cutlips minnow 0 0 0 0 0 0 0 3 13 0 0Blacknose dace 47 9 123 105 160 22 131 24 1 3 0Longnose dace 2 0 15 20 1 1 0 0 0 0 0Central stoneroller 190 74 52 0 0 13 6 0 0 0 0Eastern silvery minnow 0 1 0 0 0 0 0 0 7 0 0Common shiner 0 0 9 0 0 2 5 4 21 0 0Satinfin shiner 0 0 1 0 0 0 4 10 229 0 59Spotfin shiner 0 13 0 0 0 0 8 0 0 0 0Bluntnose minnow 71 82 44 100 9 318 122 25 2 0 65Fathead minnow 0 0 0 0 0 0 2 0 0 0 0Comely shiner 0 0 0 0 0 0 0 15 40 0 0Spottail shiner 0 0 2 0 0 2 8 8 8 0 0Swallowtail shiner 0 0 0 0 0 0 0 20 154 0 81Rosyface shiner 0 0 0 0 0 0 0 1 0 0 0Silverjaw minnow 0 6 44 0 25 0 14 0 0 0 0White sucker 30 5 6 7 1 48 14 31 32 5 9Creek chubsucker 3 0 0 1 1 4 16 0 0 53 3Northern hogsucker 0 0 0 1 0 0 3 9 15 0 0Torrent sucker 0 0 0 0 0 0 0 0 0 0 0Golden redhorse 0 0 0 0 0 0 0 0 0 0 0Shorthead redhorse 0 0 0 0 0 0 0 0 0 0 0Channel Catfish 0 0 0 0 0 0 0 0 0 0 0Yellow bullhead 0 1 2 1 2 11 2 0 0 27 3Brown bullhead 0 0 0 0 0 0 0 0 0 0 0Margined madtom 0 0 0 0 0 0 0 0 0 1 0Banded killifish 0 0 0 0 0 0 0 0 0 0 0Eastern mosquitofish 0 0 0 0 0 0 0 0 0 0 0Mottled sculpin 0 0 0 0 0 0 0 0 0 0 0Potomac sculpin 0 0 37 5 6 0 0 0 0 0 0Redbreast sunfish 25 4 2 128 66 28 26 20 54 25 22Green sunfish 0 44 10 0 11 100 2 3 2 5 1Pumpkinseed 1 10 1 0 0 0 0 0 0 4 3Bluegill 9 84 5 0 4 1 4 20 2 35 21Redear sunfish 0 0 0 0 0 0 0 0 0 0 0Rock bass 10 0 0 0 0 0 0 0 0 0 0White crappie 0 0 0 0 0 0 0 0 0 0 0Smallmouth bass 0 0 1 0 0 0 0 0 0 0 0Largemouth bass 0 0 0 0 4 4 2 26 1 1 2Shield darter 0 0 0 0 0 0 0 0 2 0 0Stripeback darter 0 0 0 0 0 0 0 0 0 0 0Tesselated darter 0 0 1 2 0 0 51 27 6 66 76Glassy darter 0 0 0 0 0 0 0 0 0 0 0Fantail darter 23 11 12 2 3 7 6 67 49 0 0Greenside darter 1 3 1 14 3 0 3 0 0 0 0Hybrids 2 3 0 1 3 2 1 0 0 0 0
Total 462 383 463 425 365 612 466 362 660 268 402
Anomalies 49 29 3 103 29 125 40 1 0 1 0

(Technical Note 190–13–1, WLI IBI Case Study, December 2001) 57
Using Regional IBI to Characterize Condition of Northern Virginia Streams: A case study
Table 8 Raw fish data for 157 sites in study—Continued
Common name 56 57 58 59 60 61 62 63 64 65 66Slate Trapp S. Fk Kett L Bull Cat Chest Bull Flat Slate Chest649 55 684 604 676 676 686 624 Lmnd 611 701
American brook lamprey 0 0 0 0 0 0 0 0 0 0 0Gizzard shad 0 0 0 0 0 0 0 0 0 0 0American eel 0 0 0 0 0 0 0 0 0 0 0Redfin pickerel 0 0 0 0 0 1 6 4 0 0 0Eastern mudminnow 0 0 0 0 0 0 0 0 0 0 0Common carp 0 0 0 0 0 0 0 0 0 0 0Golden shiner 17 0 0 2 9 0 8 0 0 4 4Mountain redbelly dace 0 0 0 0 0 0 0 0 0 0 0Rosyside dace 0 2 0 0 4 6 12 0 0 0 6Fallfish 1 2 0 0 0 15 1 4 9 0 10Creek chub 4 0 0 0 0 0 0 0 188 5 0River chub 0 49 0 0 0 0 0 0 0 0 0Bluehead chub 0 0 0 0 0 0 0 0 0 0 0Cutlips minnow 0 10 0 0 0 10 17 8 0 0 37Blacknose dace 0 44 6 0 0 9 0 1 57 0 0Longnose dace 0 0 0 0 0 11 0 1 0 0 0Central stoneroller 0 0 0 0 0 0 0 0 0 0 0Eastern silvery minnow 0 0 0 9 8 1 2 43 0 0 93Common shiner 0 43 0 0 0 9 58 38 0 0 21Satinfin shiner 0 2 0 44 0 61 11 13 0 0 4Spotfin shiner 0 0 0 0 0 0 0 0 0 0 0Bluntnose minnow 75 6 1 34 61 5 1 3 7 7 0Fathead minnow 0 0 0 0 0 0 0 0 0 0 0Comely shiner 0 0 0 20 0 20 3 70 0 0 87Spottail shiner 0 0 0 10 0 0 1 14 0 60 8Swallowtail shiner 18 1 0 18 1 75 18 14 0 41 18Rosyface shiner 0 0 0 0 0 0 0 0 0 13 0Silverjaw minnow 0 0 0 0 0 0 0 0 0 0 0White sucker 6 151 3 34 184 38 11 16 10 1 25Creek chubsucker 2 0 0 5 17 2 3 0 12 0 1Northern hogsucker 0 0 1 3 0 5 3 3 0 0 14Torrent sucker 0 0 0 0 0 0 0 0 0 0 0Golden redhorse 0 0 0 0 0 0 0 0 0 0 0Shorthead redhorse 0 0 0 0 0 0 0 0 0 0 0Channel Catfish 0 0 0 0 0 0 0 0 0 0 0Yellow bullhead 7 6 3 13 24 4 20 5 0 0 1Brown bullhead 0 0 0 0 0 0 0 0 0 0 0Margined madtom 0 4 0 0 0 1 0 8 0 0 12Banded killifish 0 0 0 2 0 0 0 0 0 11 0Eastern mosquitofish 27 1 2 0 0 0 0 0 0 95 0Mottled sculpin 0 0 0 0 0 0 0 0 0 0 0Potomac sculpin 0 0 0 0 0 0 0 0 0 0 0Redbreast sunfish 4 7 8 36 22 75 36 18 8 3 33Green sunfish 7 0 0 15 20 5 1 8 1 1 4Pumpkinseed 1 0 0 1 0 1 1 2 0 1 0Bluegill 8 8 44 24 0 6 2 9 1 18 1Redear sunfish 0 0 1 0 0 0 0 0 0 0 0Rock bass 0 0 0 0 0 0 0 0 0 0 0White crappie 0 0 3 0 0 0 0 0 0 0 0Smallmouth bass 0 0 0 1 0 2 0 0 0 0 2Largemouth bass 10 0 7 62 0 5 12 15 0 1 3Shield darter 0 0 0 0 0 3 0 2 0 0 5Stripeback darter 0 0 0 0 0 0 0 0 0 0 0Tesselated darter 26 42 123 67 24 29 14 3 0 16 10Glassy darter 0 0 0 0 0 0 0 0 0 0 0Fantail darter 19 38 20 18 105 19 8 52 0 1 3Greenside darter 0 0 0 0 0 0 0 0 0 0 0Hybrids 0 0 0 0 0 0 0 0 0 0 0
Total 232 416 222 418 479 418 249 354 293 278 402
Anomalies 0 0 0 0 0 0 0 2 22 4 0

58 (Technical Note 190–13–1, WLI IBI Case Study, December 2001)
Using Regional IBI to Characterize Condition of Northern Virginia Streams: A case study
Table 8 Raw fish data for 157 sites in study—Continued
Common name 67 68 69 70 71 72 73 74 75 76 77Bull E. Fk. Elklick Flatlick L. Rock Popes South Buck Fiery Battle Tinpot705 660 609 620 658 612 737 735 635 633 657
American brook lamprey 0 0 0 0 0 0 0 0 0 0 0Gizzard shad 0 0 0 0 0 0 0 0 0 0 0American eel 0 0 0 0 0 0 0 0 0 0 0Redfin pickerel 4 0 2 0 0 0 0 0 0 0 0Eastern mudminnow 0 0 0 0 0 0 0 0 0 0 0Common carp 0 0 0 0 0 0 0 0 0 0 0Golden shiner 4 0 6 0 5 0 0 6 0 0 34Mountain redbelly dace 0 0 0 0 0 0 0 0 0 0 0Rosyside dace 18 70 0 0 0 107 158 11 75 0 0Fallfish 9 0 0 4 40 3 113 49 59 9 6Creek chub 1 24 2 4 4 23 5 0 0 51 7River chub 0 0 0 0 1 0 28 0 3 110 0Bluehead chub 0 0 0 0 0 0 0 0 0 0 2Cutlips minnow 24 2 0 0 3 7 1 0 2 7 0Blacknose dace 4 258 0 2 6 27 70 120 142 54 0Longnose dace 0 3 4 16 11 1 15 11 7 71 0Central stoneroller 0 0 0 0 0 0 0 0 0 0 0Eastern silvery minnow 20 0 3 0 0 0 0 0 0 0 22Common shiner 137 9 0 0 5 60 248 51 103 52 12Satinfin shiner 18 0 0 0 1 0 2 11 4 40 0Spotfin shiner 0 0 0 0 1 0 0 0 0 0 0Bluntnose minnow 3 83 6 14 46 87 1 0 0 0 8Fathead minnow 0 0 0 0 0 0 0 0 0 0 0Comely shiner 38 0 0 0 0 0 0 0 0 0 0Spottail shiner 20 0 0 6 1 0 0 0 0 0 0Swallowtail shiner 5 58 0 0 6 117 19 50 2 39 7Rosyface shiner 0 0 0 0 0 0 0 0 0 0 0Silverjaw minnow 0 0 0 0 0 0 84 0 0 122 4White sucker 17 13 3 2 8 21 32 4 7 25 5Creek chubsucker 2 0 1 0 0 1 0 0 0 0 0Northern hogsucker 13 4 0 0 2 9 7 3 0 14 0Torrent sucker 0 0 0 0 0 0 0 0 4 0 0Golden redhorse 0 0 0 0 0 0 0 0 0 0 0Shorthead redhorse 0 0 0 0 0 0 0 0 0 0 0Channel Catfish 0 0 0 0 0 0 0 0 0 0 0Yellow bullhead 3 0 6 1 0 0 0 0 0 0 13Brown bullhead 0 0 0 0 0 0 0 0 0 0 0Margined madtom 3 0 0 0 0 0 0 0 0 0 0Banded killifish 0 0 0 0 0 0 0 0 0 0 0Eastern mosquitofish 0 0 0 0 13 0 0 0 0 0 0Mottled sculpin 0 0 0 0 0 0 10 0 0 0 0Potomac sculpin 0 0 0 0 0 0 0 0 0 0 0Redbreast sunfish 14 31 40 4 42 31 2 0 0 3 0Green sunfish 6 5 47 3 5 1 0 0 0 9 54Pumpkinseed 0 0 0 0 0 0 1 0 0 0 32Bluegill 4 4 3 33 2 2 16 17 1 16 12Redear sunfish 0 0 0 0 0 0 0 0 0 0 0Rock bass 0 0 0 0 0 0 0 0 0 7 0White crappie 0 0 0 0 0 0 0 0 0 0 0Smallmouth bass 1 0 0 0 3 0 0 0 0 0 0Largemouth bass 5 1 12 25 3 0 0 0 2 1 9Shield darter 17 0 0 0 0 0 2 0 0 0 0Stripeback darter 0 0 0 0 0 0 0 0 0 0 0Tesselated darter 11 44 0 14 42 57 62 140 15 35 0Glassy darter 0 0 0 0 0 0 0 0 0 0 0Fantail darter 18 40 0 4 13 31 0 0 0 0 0Greenside darter 0 0 0 0 0 0 0 0 0 0 0Hybrids 0 0 0 1 1 0 0 0 0 0 1
Total 419 649 135 133 264 585 876 473 426 665 228
Anomalies 0 0 0 1 0 109 0 0 0 0 37

(Technical Note 190–13–1, WLI IBI Case Study, December 2001) 59
Using Regional IBI to Characterize Condition of Northern Virginia Streams: A case study
Table 8 Raw fish data for 157 sites in study—Continued
Common name 78 79 80 81 82 83 84 85 86 87 88Brown Indian Jacob Jordan Marsh Craig Hazel Thorn Cov Hittles Goose
653 626 626 522 17 805 231 522 522 522 688
American brook lamprey 0 0 1 1 0 0 0 0 0 0 0Gizzard shad 0 0 0 0 0 0 0 0 0 0 0American eel 0 0 0 0 0 0 0 0 0 0 0Redfin pickerel 0 0 0 0 0 0 0 0 0 0 0Eastern mudminnow 0 0 0 0 0 0 0 0 0 0 0Common carp 0 0 0 0 0 0 0 0 0 0 0Golden shiner 23 1 1 1 47 77 0 0 0 0 0Mountain redbelly dace 0 4 0 0 0 0 0 0 0 0 0Rosyside dace 0 50 4 24 0 0 13 9 42 0 21Fallfish 2 13 67 32 0 0 67 73 12 3 0Creek chub 0 53 110 8 0 1 9 0 5 3 8River chub 0 0 0 20 0 0 40 33 7 34 0Bluehead chub 0 54 65 21 0 0 9 0 20 2 0Cutlips minnow 0 11 1 8 0 0 1 2 49 4 0Blacknose dace 0 0 7 75 0 0 42 25 346 15 22Longnose dace 0 0 0 1 0 0 10 19 17 0 12Central stoneroller 0 0 0 0 0 0 0 0 0 0 0Eastern silvery minnow 33 0 0 0 0 0 0 0 0 0 0Common shiner 0 203 137 151 0 0 142 38 507 50 0Satinfin shiner 0 0 150 73 0 0 12 0 0 10 9Spotfin shiner 0 0 0 0 0 0 0 0 0 0 17Bluntnose minnow 59 83 1 0 33 23 0 0 0 0 16Fathead minnow 0 0 0 0 0 0 0 0 0 0 0Comely shiner 0 0 0 0 0 0 1 1 0 1 0Spottail shiner 36 0 16 0 0 1 0 0 0 0 0Swallowtail shiner 0 26 5 10 0 0 0 0 0 2 0Rosyface shiner 0 0 0 0 0 0 27 1 0 0 0Silverjaw minnow 0 121 89 3 0 0 0 0 0 0 0White sucker 6 31 18 22 9 3 2 1 20 9 6Creek chubsucker 0 0 0 0 16 2 0 0 0 0 1Northern hogsucker 2 5 0 1 0 0 17 4 5 0 17Torrent sucker 0 0 0 12 0 0 0 0 0 13 0Golden redhorse 0 0 0 0 0 0 0 0 0 0 0Shorthead redhorse 0 0 0 0 0 0 0 0 0 0 0Channel Catfish 0 0 0 0 0 0 0 0 0 0 0Yellow bullhead 31 0 1 0 3 0 0 0 0 0 0Brown bullhead 0 1 0 0 0 0 0 0 0 0 0Margined madtom 0 1 1 2 0 0 1 3 0 6 0Banded killifish 0 0 0 0 0 0 0 0 0 0 0Eastern mosquitofish 34 0 0 0 815 553 0 0 0 0 0Mottled sculpin 0 0 0 2 0 0 2 3 0 0 0Potomac sculpin 0 0 0 0 0 0 0 0 0 0 20Redbreast sunfish 0 36 4 18 6 0 10 1 13 33 17Green sunfish 100 25 1 31 169 110 0 0 0 18 1Pumpkinseed 18 0 0 0 0 1 0 0 0 0 0Bluegill 6 3 4 234 1 5 1 0 0 41 38Redear sunfish 0 0 0 0 0 0 0 0 0 0 0Rock bass 0 0 1 4 0 0 6 12 1 43 0White crappie 0 0 0 0 0 0 0 0 0 0 0Smallmouth bass 0 0 2 0 0 0 2 9 8 8 5Largemouth bass 10 0 0 8 1 0 0 0 0 0 0Shield darter 0 0 0 0 0 0 0 0 0 0 0Stripeback darter 0 16 0 0 0 2 0 0 0 0 0Tesselated darter 20 73 6 16 1 18 20 13 23 8 0Glassy darter 0 0 0 0 0 0 0 0 0 0 0Fantail darter 0 0 0 0 0 0 0 0 0 0 23Greenside darter 0 0 0 0 0 0 0 0 0 0 2Hybrids 1 0 1 1 0 0 0 0 0 0 0
Total 381 810 693 779 1101 796 434 247 1075 303 235
Anomalies 34 13 7 44 1 1 0 2 73 1 4

60 (Technical Note 190–13–1, WLI IBI Case Study, December 2001)
Using Regional IBI to Characterize Condition of Northern Virginia Streams: A case study
Table 8 Raw fish data for 157 sites in study—Continued
Common name 89 90 91 92 93 94 95 96 97 98 99Big 55 Crom Jeff Beav N.Fkg Crook Tusc Syco Little Crook Gap
715 719 790 791 727 621 621 705 688 710
American brook lamprey 0 0 0 0 0 0 0 0 0 0 0Gizzard shad 0 0 0 0 0 0 0 0 0 0 0American eel 0 0 0 0 0 0 0 0 0 0 0Redfin pickerel 0 0 0 0 0 0 0 0 0 0 0Eastern mudminnow 0 0 0 0 0 0 0 0 0 0 0Common carp 0 0 0 0 0 0 0 0 0 0 0Golden shiner 0 0 0 5 2 0 0 8 0 0 0Mountain redbelly dace 0 0 0 0 0 0 0 0 0 0 0Rosyside dace 153 0 15 65 6 67 0 0 179 271 41Fallfish 0 0 0 0 0 0 0 0 0 0 0Creek chub 71 24 22 16 4 34 33 17 0 83 60River chub 0 0 0 0 0 0 0 0 0 0 0Bluehead chub 0 0 0 0 0 0 0 0 0 0 0Cutlips minnow 0 0 0 0 0 0 0 0 0 0 0Blacknose dace 310 124 153 79 42 84 69 64 107 664 204Longnose dace 0 0 2 7 14 97 33 202 14 52 24Central stoneroller 0 0 4 0 0 6 24 71 0 0 49Eastern silvery minnow 0 0 0 0 0 0 0 0 0 0 0Common shiner 2 0 12 23 3 3 0 2 0 35 3Satinfin shiner 0 0 46 0 14 1 0 0 0 2 421Spotfin shiner 0 0 8 0 12 5 1 5 0 1 3Bluntnose minnow 0 56 76 60 55 42 56 56 18 50 121Fathead minnow 0 0 0 0 0 0 0 0 0 0 0Comely shiner 0 0 0 0 0 1 0 0 0 0 0Spottail shiner 0 0 56 1 19 55 0 45 0 0 0Swallowtail shiner 0 1 0 0 207 1 50 1 0 11 15Rosyface shiner 0 0 0 0 0 0 0 0 4 0 0Silverjaw minnow 1 97 0 67 0 84 6 0 21 2 23White sucker 27 42 10 10 10 20 11 12 48 17 0Creek chubsucker 0 0 3 3 2 0 4 1 4 2 1Northern hogsucker 0 0 7 0 7 8 3 1 15 3 6Torrent sucker 0 0 0 0 0 0 0 0 0 0 0Golden redhorse 0 0 0 0 0 0 0 1 0 0 0Shorthead redhorse 0 0 0 0 0 0 0 0 0 0 0Channel Catfish 0 0 0 0 0 0 0 0 0 0 0Yellow bullhead 0 0 1 1 3 1 0 2 0 2 3Brown bullhead 0 0 0 0 0 0 0 0 0 0 1Margined madtom 0 0 0 0 0 0 0 0 0 0 0Banded killifish 0 0 0 0 0 0 0 0 0 12 28Eastern mosquitofish 0 0 0 0 0 0 0 0 0 0 0Mottled sculpin 0 0 0 0 0 0 0 0 0 0 0Potomac sculpin 6 0 1 1 0 15 0 12 9 22 1Redbreast sunfish 0 4 26 8 24 17 12 20 29 21 219Green sunfish 6 0 3 1 0 0 28 17 0 0 21Pumpkinseed 0 0 9 0 2 0 12 0 0 0 3Bluegill 9 6 44 26 61 7 73 2 3 0 25Redear sunfish 0 0 0 0 0 0 0 0 0 0 0Rock bass 0 0 0 0 0 0 0 0 0 0 0White crappie 0 0 0 1 4 2 0 0 0 0 0Smallmouth bass 0 0 0 0 0 0 0 0 0 0 0Largemouth bass 6 3 0 19 13 3 0 6 0 0 0Shield darter 0 0 0 0 0 0 0 0 0 0 0Stripeback darter 0 0 0 0 0 0 0 0 0 0 0Tesselated darter 0 58 12 10 0 4 0 9 11 0 23Glassy darter 0 0 0 0 0 0 0 0 0 0 0Fantail darter 25 41 35 7 3 10 53 51 9 43 30Greenside darter 0 0 4 2 1 5 8 14 15 0 0Hybrids 0 0 0 0 1 0 2 0 0 0 0
Total 616 456 549 412 509 572 478 619 486 1293 1325
Anomalies 0 0 30 4 11 68 73 57 31 118 10

(Technical Note 190–13–1, WLI IBI Case Study, December 2001) 61
Using Regional IBI to Characterize Condition of Northern Virginia Streams: A case study
Table 8 Raw fish data for 157 sites in study—Continued
Common name 100 101 102 103 104 105 106 107 108 109 110Tusc Cedar Lick up Lick dn Elk Town Broad Kett Cat Cat Cedar643 674 806 611 Avnl 611 704 234 602
American brook lamprey 0 0 0 0 0 0 0 0 0 0 0Gizzard shad 0 0 0 0 0 0 0 0 0 0 0American eel 0 0 0 0 0 0 0 0 0 0 0Redfin pickerel 0 0 2 0 0 0 1 0 12 5 0Eastern mudminnow 0 0 0 0 0 0 0 0 0 0 0Common carp 0 0 0 0 0 0 0 0 0 0 0Golden shiner 0 0 2 26 7 4 1 1 0 0 0Mountain redbelly dace 0 0 0 0 0 0 0 0 0 0 0Rosyside dace 0 0 0 0 2 14 0 0 1 0 9Fallfish 0 5 0 0 0 9 7 4 49 93 9Creek chub 18 0 0 0 10 28 0 0 0 0 0River chub 0 9 0 0 0 0 45 0 1 1 86Bluehead chub 0 0 0 0 0 0 0 0 0 0 0Cutlips minnow 0 2 2 0 0 0 93 0 9 3 23Blacknose dace 9 14 0 0 0 0 0 0 21 5 1Longnose dace 5 0 0 0 0 0 0 0 8 1 0Central stoneroller 38 0 0 0 0 0 0 0 0 0 0Eastern silvery minnow 0 0 0 0 9 19 2 51 76 40 5Common shiner 0 15 0 0 0 2 184 4 43 51 110Satinfin shiner 0 98 0 268 23 125 65 21 7 54 60Spotfin shiner 5 0 0 0 0 0 0 0 0 0 0Bluntnose minnow 64 49 0 10 20 14 13 16 0 11 42Fathead minnow 1 0 0 0 0 0 0 0 0 0 0Comely shiner 0 7 0 0 11 4 19 22 20 21 15Spottail shiner 109 0 0 0 7 82 0 69 1 11 2Swallowtail shiner 0 29 2 53 16 71 20 45 33 2 20Rosyface shiner 0 1 0 0 8 1 0 1 5 0 1Silverjaw minnow 8 0 0 0 0 0 0 0 0 0 0White sucker 11 10 19 4 65 21 27 14 12 15 6Creek chubsucker 0 4 3 1 1 0 0 10 2 4 1Northern hogsucker 4 13 0 1 5 9 8 5 1 7 22Torrent sucker 0 0 0 0 0 0 0 0 0 0 0Golden redhorse 0 0 0 0 0 0 0 0 0 0 0Shorthead redhorse 0 0 0 0 0 0 0 0 0 0 0Channel Catfish 0 0 0 0 0 0 0 0 0 0 0Yellow bullhead 0 3 8 29 9 1 3 35 0 2 4Brown bullhead 0 0 1 0 0 0 0 0 0 0 0Margined madtom 0 1 1 0 0 0 0 0 2 0 1Banded killifish 0 0 0 0 0 0 0 9 0 0 0Eastern mosquitofish 0 0 0 0 0 0 0 0 0 0 0Mottled sculpin 0 0 0 0 0 0 0 0 0 0 0Potomac sculpin 0 0 0 0 0 0 0 0 0 0 0Redbreast sunfish 23 40 23 109 5 2 68 8 34 23 13Green sunfish 3 2 5 0 10 1 2 12 0 1 2Pumpkinseed 7 0 3 0 0 0 0 0 0 0 0Bluegill 3 43 32 9 1 1 19 5 2 0 10Redear sunfish 0 1 1 0 1 0 0 0 0 1 0Rock bass 31 0 0 0 0 0 0 0 0 0 0White crappie 0 0 0 0 0 0 0 0 0 0 0Smallmouth bass 0 0 0 0 0 0 6 1 4 8 1Largemouth bass 0 2 12 0 13 1 0 29 1 2 0Shield darter 0 4 0 0 1 3 0 0 1 1 13Stripeback darter 0 0 0 0 0 0 0 0 0 0 0Tesselated darter 0 26 8 1 15 95 16 26 23 7 9Glassy darter 0 0 0 0 0 0 0 0 0 0 0Fantail darter 12 29 0 0 10 22 48 21 17 5 31Greenside darter 11 0 0 0 0 0 0 0 0 0 0Hybrids 1 0 0 0 0 0 0 0 0 0 0
Total 363 407 124 511 249 529 647 409 385 374 496
Anomalies 33 0 0 0 2 3 0 0 0 0 0

62 (Technical Note 190–13–1, WLI IBI Case Study, December 2001)
Using Regional IBI to Characterize Condition of Northern Virginia Streams: A case study
Table 8 Raw fish data for 157 sites in study—Continued
Common name 111 112 113 114 115 116 117 118 119 120 121Town 806 Broad 55 Bull 659 Cedar Broad Bull RP Cub 620 Cub 29 Cub Popes Carter
806 619 RP Clif. 681
American brook lamprey 0 0 0 0 0 0 0 0 0 0 1Gizzard shad 0 0 0 0 0 0 0 0 0 0 0American eel 0 0 0 0 0 0 0 0 0 0 0Redfin pickerel 0 0 0 0 0 0 0 0 0 0 0Eastern mudminnow 0 0 0 0 0 0 0 0 0 0 0Common carp 0 0 0 0 0 0 0 0 0 0 0Golden shiner 0 0 0 3 1 3 0 1 0 0 0Mountain redbelly dace 0 0 0 0 0 0 0 0 0 0 0Rosyside dace 0 0 0 0 0 0 0 0 0 19 8Fallfish 31 44 33 45 4 42 39 0 100 81 190Creek chub 16 0 0 0 0 2 0 0 7 11 6River chub 0 144 0 10 5 28 0 2 21 25 14Bluehead chub 0 0 0 0 0 0 0 0 0 0 0Cutlips minnow 0 4 15 5 0 24 0 1 3 8 0Blacknose dace 0 19 5 0 4 1 0 0 3 63 10Longnose dace 0 0 17 0 0 49 13 1 6 13 53Central stoneroller 0 0 0 0 0 0 0 0 0 0 0Eastern silvery minnow 69 33 34 5 1 25 4 0 4 0 0Common shiner 3 24 32 38 30 48 0 18 56 66 52Satinfin shiner 92 70 28 91 58 19 10 0 28 0 52Spotfin shiner 0 0 0 0 0 0 0 0 2 0 0Bluntnose minnow 26 8 24 25 8 28 50 23 2 0 0Fathead minnow 0 0 0 0 0 0 0 0 0 0 0Comely shiner 4 3 26 9 14 4 0 0 1 0 18Spottail shiner 67 6 15 14 19 14 61 104 4 0 0Swallowtail shiner 104 21 41 37 92 38 42 20 40 37 1Rosyface shiner 1 0 1 0 3 2 0 0 0 0 2Silverjaw minnow 0 0 0 0 0 0 0 0 0 0 10White sucker 36 35 15 7 2 1 6 0 4 16 3Creek chubsucker 1 0 2 1 0 1 1 2 1 0 0Northern hogsucker 11 14 8 17 5 6 0 0 1 11 18Torrent sucker 0 0 0 0 0 0 0 0 0 0 0Golden redhorse 0 0 0 0 0 3 0 0 0 0 0Shorthead redhorse 0 0 0 0 0 0 0 0 0 0 0Channel Catfish 0 0 0 0 0 0 0 0 0 0 0Yellow bullhead 4 6 3 1 16 1 0 3 2 1 0Brown bullhead 0 0 0 0 0 0 0 0 0 0 0Margined madtom 0 0 0 0 0 0 0 0 0 1 0Banded killifish 0 0 0 0 2 0 0 0 0 0 0Eastern mosquitofish 0 0 0 0 0 1 9 6 5 0 0Mottled sculpin 0 0 0 0 0 0 0 0 0 0 3Potomac sculpin 0 0 0 0 0 0 0 0 0 0 0Redbreast sunfish 13 11 35 23 52 7 32 18 7 15 8Green sunfish 2 0 1 1 0 15 36 6 6 2 0Pumpkinseed 0 0 0 0 0 0 0 0 0 0 0Bluegill 4 4 1 13 0 1 1 5 1 3 0Redear sunfish 0 0 1 0 0 0 0 0 0 0 0Rock bass 0 0 0 0 0 0 0 0 0 0 2White crappie 0 0 0 0 0 0 0 0 0 0 0Smallmouth bass 0 4 22 0 4 4 0 1 0 4 2Largemouth bass 5 3 1 4 0 1 2 4 2 0 2Shield darter 14 0 2 2 0 12 0 0 1 0 22Stripeback darter 0 0 0 0 0 0 0 0 0 0 0Tesselated darter 39 20 12 25 15 14 16 7 21 23 104Glassy darter 0 0 0 0 0 0 0 0 0 0 24Fantail darter 10 38 22 28 17 16 3 2 1 24 0Greenside darter 0 0 0 0 0 0 0 0 0 0 0Hybrids 0 0 0 0 0 0 0 0 0 1 0
Total 552 511 396 404 352 410 325 224 329 424 605
Anomalies 0 0 0 0 0 0 1 0 51 0

(Technical Note 190–13–1, WLI IBI Case Study, December 2001) 63
Using Regional IBI to Characterize Condition of Northern Virginia Streams: A case study
Table 8 Raw fish data for 157 sites in study—Continued
Common name 122 123 124 125 126 127 128 129 130 131 132Carter Carter Great W. Th. Th. R. Jordan Rapah Rush Cov Hugh Thor
738 up 687 647 736 637 647 211 626 707 622
American brook lamprey 0 0 0 0 1 0 1 0 0 0 0Gizzard shad 0 0 0 0 0 0 0 0 0 0 0American eel 0 0 0 0 0 1 0 0 0 0 0Redfin pickerel 0 0 0 0 0 0 0 0 0 0 0Eastern mudminnow 0 0 0 0 0 0 0 0 0 0 0Common carp 0 0 0 0 0 0 0 0 0 0 0Golden shiner 0 6 0 0 0 0 0 0 0 0 0Mountain redbelly dace 0 0 0 0 0 0 0 0 0 12 0Rosyside dace 46 70 2 22 3 0 0 5 0 387 0Fallfish 110 53 87 167 83 102 178 33 56 1 99Creek chub 5 30 0 1 0 0 1 12 0 3 6River chub 19 13 11 2 4 66 83 25 89 17 60Bluehead chub 0 0 0 0 0 0 0 0 0 3 0Cutlips minnow 2 2 1 0 0 3 1 5 8 2 5Blacknose dace 29 184 3 28 1 4 5 30 7 109 2Longnose dace 14 20 25 26 30 25 102 28 113 19 6Central stoneroller 0 0 0 0 0 0 0 0 0 0 0Eastern silvery minnow 0 0 12 0 0 0 0 0 0 0 0Common shiner 81 117 29 32 100 81 35 80 108 106 44Satinfin shiner 41 23 79 31 79 84 109 0 26 0 24Spotfin shiner 0 0 0 0 0 0 0 0 0 0 0Bluntnose minnow 4 29 7 0 0 4 0 0 0 0 2Fathead minnow 0 0 0 0 0 0 0 0 0 0 0Comely shiner 22 1 76 0 1 13 5 0 2 0 0Spottail shiner 0 0 3 0 0 0 1 0 19 0 7Swallowtail shiner 16 12 5 20 3 24 20 8 4 0 42Rosyface shiner 0 0 1 7 54 65 76 0 40 1 126Silverjaw minnow 4 36 3 8 0 23 5 0 0 0 6White sucker 24 26 4 1 4 3 8 5 0 4 5Creek chubsucker 0 0 0 0 0 0 0 0 0 0 0Northern hogsucker 16 6 13 3 2 3 7 9 7 0 4Torrent sucker 0 0 0 0 0 19 21 0 0 48 0Golden redhorse 0 0 0 0 0 0 0 0 0 0 0Shorthead redhorse 2 0 0 0 0 0 0 0 0 0 0Channel Catfish 0 0 0 0 0 0 0 0 0 0 0Yellow bullhead 0 0 0 0 0 0 3 0 1 0 5Brown bullhead 0 0 0 0 0 0 0 0 0 0 0Margined madtom 0 0 1 0 0 0 0 1 1 0 7Banded killifish 0 0 0 0 0 0 0 0 0 0 0Eastern mosquitofish 0 0 0 0 0 0 0 0 0 0 0Mottled sculpin 0 1 0 0 0 14 3 2 0 19 0Potomac sculpin 0 0 0 0 0 0 0 0 0 0 0Redbreast sunfish 8 5 8 0 3 1 4 1 6 0 16Green sunfish 0 0 3 0 0 9 7 0 0 0 3Pumpkinseed 0 2 0 0 0 0 3 1 0 0 0Bluegill 0 2 10 3 5 3 9 3 3 0 8Redear sunfish 0 0 0 0 0 0 0 0 0 0 0Rock bass 2 0 4 0 0 16 0 3 8 1 84White crappie 0 0 0 0 0 0 0 0 0 0 0Smallmouth bass 1 0 1 0 2 13 8 7 5 3 15Largemouth bass 0 0 0 4 2 0 5 1 0 0 2Shield darter 10 3 3 0 0 12 10 0 3 0 3Stripeback darter 13 6 0 0 0 0 0 0 0 0 0Tesselated darter 26 95 31 47 22 78 60 46 133 14 35Glassy darter 51 0 0 0 0 0 0 0 0 0 0Fantail darter 0 0 0 0 0 0 0 0 0 0 0Greenside darter 0 0 0 0 0 0 0 0 0 0 0Hybrids 0 0 0 0 0 0 0 0 0 1 0
Total 546 742 422 402 399 666 770 305 639 750 616
Anomalies 3 4 11 0 1 1 0 1 1 1 3

64 (Technical Note 190–13–1, WLI IBI Case Study, December 2001)
Using Regional IBI to Characterize Condition of Northern Virginia Streams: A case study
Table 8 Raw fish data for 157 sites in study—Continued
Common name 133 134 135 136 137 138 139 140 141 142 143Hazel Hugh Hazel Black Rap Indian Thor Muddy Marsh Hazel Crook707 644 522 615 W’loo 624 618 630 668 628 623
American brook lamprey 0 0 0 0 0 0 0 0 0 1 0Gizzard shad 0 0 0 0 0 0 0 0 0 0 0American eel 0 0 0 0 0 0 0 0 0 1 0Redfin pickerel 0 0 0 0 0 0 0 0 0 0 0Eastern mudminnow 0 0 0 0 0 0 0 0 0 0 0Common carp 0 0 0 0 0 0 0 0 0 0 0Golden shiner 3 0 0 0 0 1 0 9 17 0 0Mountain redbelly dace 0 0 0 0 0 0 0 0 0 0 0Rosyside dace 0 0 0 4 0 8 0 0 0 0 13Fallfish 43 80 137 40 64 90 29 32 4 16 5Creek chub 6 19 1 5 0 12 1 1 0 0 6River chub 93 69 89 45 62 35 33 0 1 15 0Bluehead chub 0 0 0 0 0 0 0 20 0 0 0Cutlips minnow 1 5 3 2 5 0 15 0 0 2 5Blacknose dace 0 0 1 11 0 2 1 0 0 0 13Longnose dace 20 32 60 16 5 15 105 19 0 3 15Central stoneroller 0 0 0 0 0 0 0 0 0 0 5Eastern silvery minnow 0 0 0 0 0 1 0 18 79 0 0Common shiner 92 37 35 99 15 119 31 41 2 35 43Satinfin shiner 23 52 32 7 72 57 39 354 0 43 25Spotfin shiner 0 0 0 0 0 0 0 0 0 0 146Bluntnose minnow 0 0 0 0 0 53 5 4 117 0 16Fathead minnow 0 0 0 0 0 0 0 0 0 0 0Comely shiner 0 0 2 1 3 4 7 35 26 1 3Spottail shiner 0 0 0 0 2 37 1 0 17 9 35Swallowtail shiner 13 1 6 17 65 15 6 17 2 26 18Rosyface shiner 65 70 143 2 49 0 32 0 0 114 0Silverjaw minnow 11 0 8 18 16 23 19 0 0 21 5White sucker 2 2 2 3 0 14 1 5 10 1 8Creek chubsucker 0 0 0 0 0 0 0 0 2 0 0Northern hogsucker 7 2 6 9 4 9 1 7 1 4 7Torrent sucker 0 6 1 0 3 0 0 0 0 0 0Golden redhorse 0 0 0 0 0 0 0 0 0 0 0Shorthead redhorse 0 0 0 0 0 0 0 0 0 0 0Channel Catfish 0 0 0 0 0 0 0 0 0 0 0Yellow bullhead 0 0 0 0 3 0 1 0 3 3 1Brown bullhead 0 0 0 0 0 0 0 0 0 0 0Margined madtom 7 1 0 0 4 0 1 0 0 9 1Banded killifish 0 0 0 0 0 0 0 0 0 0 3Eastern mosquitofish 0 0 0 0 0 0 0 0 75 0 0Mottled sculpin 5 13 1 5 2 0 0 0 0 0 0Potomac sculpin 0 0 0 0 0 0 0 0 0 0 8Redbreast sunfish 13 3 8 3 32 14 28 20 0 29 32Green sunfish 7 1 0 1 2 8 3 1 125 9 12Pumpkinseed 0 0 0 0 0 0 0 1 8 1 0Bluegill 0 1 0 5 6 30 5 8 33 6 13Redear sunfish 0 0 0 0 0 0 0 0 0 0 0Rock bass 34 22 22 8 10 0 48 0 0 23 0White crappie 0 0 0 0 0 0 0 0 3 0 0Smallmouth bass 27 18 9 4 23 2 8 0 0 1 0Largemouth bass 11 0 0 0 2 2 0 1 7 1 0Shield darter 1 1 2 0 22 0 8 0 0 11 0Stripeback darter 0 0 0 0 1 0 0 6 1 0 0Tesselated darter 31 25 36 19 43 24 73 36 16 23 0Glassy darter 0 0 0 0 4 0 0 0 0 6 0Fantail darter 0 0 0 0 0 0 0 0 0 0 13Greenside darter 0 0 0 0 0 0 0 0 0 0 8Hybrids 0 0 0 0 0 0 0 0 0 1 0
Total 515 460 604 324 519 575 501 635 549 415 459
Anomalies 2 15 1 1 1 0 3 1 26 2 2
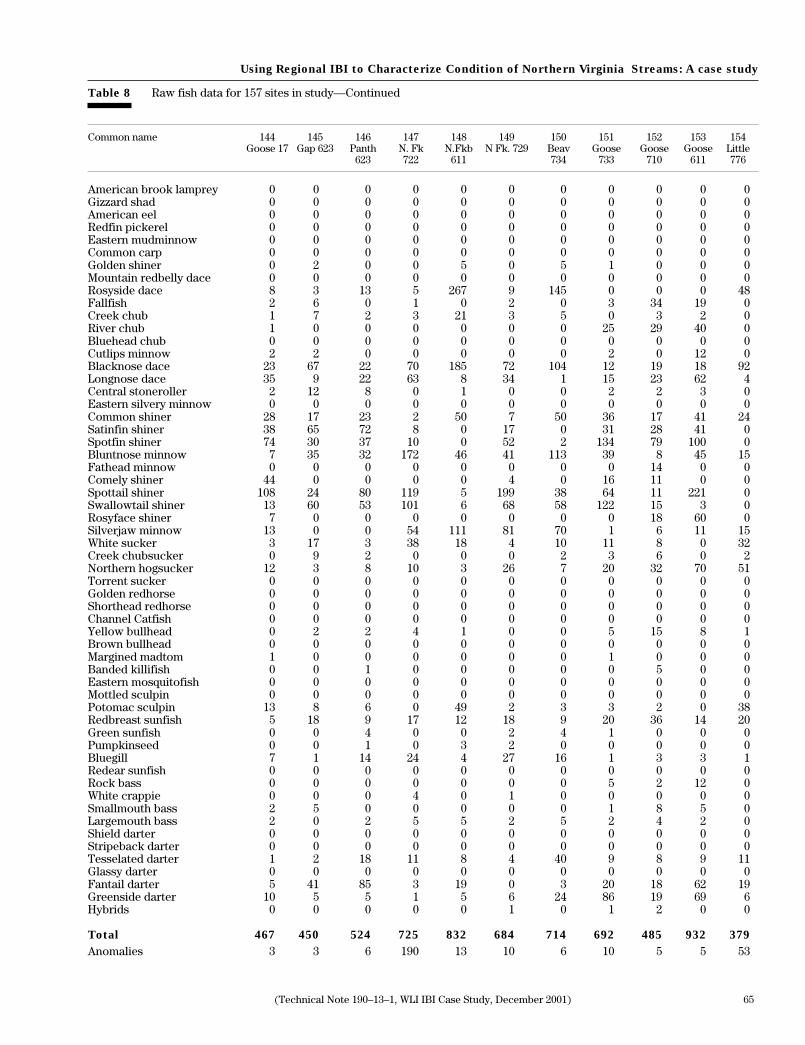
(Technical Note 190–13–1, WLI IBI Case Study, December 2001) 65
Using Regional IBI to Characterize Condition of Northern Virginia Streams: A case study
Table 8 Raw fish data for 157 sites in study—Continued
Common name 144 145 146 147 148 149 150 151 152 153 154Goose 17 Gap 623 Panth N. Fk N.Fkb N Fk. 729 Beav Goose Goose Goose Little
623 722 611 734 733 710 611 776
American brook lamprey 0 0 0 0 0 0 0 0 0 0 0Gizzard shad 0 0 0 0 0 0 0 0 0 0 0American eel 0 0 0 0 0 0 0 0 0 0 0Redfin pickerel 0 0 0 0 0 0 0 0 0 0 0Eastern mudminnow 0 0 0 0 0 0 0 0 0 0 0Common carp 0 0 0 0 0 0 0 0 0 0 0Golden shiner 0 2 0 0 5 0 5 1 0 0 0Mountain redbelly dace 0 0 0 0 0 0 0 0 0 0 0Rosyside dace 8 3 13 5 267 9 145 0 0 0 48Fallfish 2 6 0 1 0 2 0 3 34 19 0Creek chub 1 7 2 3 21 3 5 0 3 2 0River chub 1 0 0 0 0 0 0 25 29 40 0Bluehead chub 0 0 0 0 0 0 0 0 0 0 0Cutlips minnow 2 2 0 0 0 0 0 2 0 12 0Blacknose dace 23 67 22 70 185 72 104 12 19 18 92Longnose dace 35 9 22 63 8 34 1 15 23 62 4Central stoneroller 2 12 8 0 1 0 0 2 2 3 0Eastern silvery minnow 0 0 0 0 0 0 0 0 0 0 0Common shiner 28 17 23 2 50 7 50 36 17 41 24Satinfin shiner 38 65 72 8 0 17 0 31 28 41 0Spotfin shiner 74 30 37 10 0 52 2 134 79 100 0Bluntnose minnow 7 35 32 172 46 41 113 39 8 45 15Fathead minnow 0 0 0 0 0 0 0 0 14 0 0Comely shiner 44 0 0 0 0 4 0 16 11 0 0Spottail shiner 108 24 80 119 5 199 38 64 11 221 0Swallowtail shiner 13 60 53 101 6 68 58 122 15 3 0Rosyface shiner 7 0 0 0 0 0 0 0 18 60 0Silverjaw minnow 13 0 0 54 111 81 70 1 6 11 15White sucker 3 17 3 38 18 4 10 11 8 0 32Creek chubsucker 0 9 2 0 0 0 2 3 6 0 2Northern hogsucker 12 3 8 10 3 26 7 20 32 70 51Torrent sucker 0 0 0 0 0 0 0 0 0 0 0Golden redhorse 0 0 0 0 0 0 0 0 0 0 0Shorthead redhorse 0 0 0 0 0 0 0 0 0 0 0Channel Catfish 0 0 0 0 0 0 0 0 0 0 0Yellow bullhead 0 2 2 4 1 0 0 5 15 8 1Brown bullhead 0 0 0 0 0 0 0 0 0 0 0Margined madtom 1 0 0 0 0 0 0 1 0 0 0Banded killifish 0 0 1 0 0 0 0 0 5 0 0Eastern mosquitofish 0 0 0 0 0 0 0 0 0 0 0Mottled sculpin 0 0 0 0 0 0 0 0 0 0 0Potomac sculpin 13 8 6 0 49 2 3 3 2 0 38Redbreast sunfish 5 18 9 17 12 18 9 20 36 14 20Green sunfish 0 0 4 0 0 2 4 1 0 0 0Pumpkinseed 0 0 1 0 3 2 0 0 0 0 0Bluegill 7 1 14 24 4 27 16 1 3 3 1Redear sunfish 0 0 0 0 0 0 0 0 0 0 0Rock bass 0 0 0 0 0 0 0 5 2 12 0White crappie 0 0 0 4 0 1 0 0 0 0 0Smallmouth bass 2 5 0 0 0 0 0 1 8 5 0Largemouth bass 2 0 2 5 5 2 5 2 4 2 0Shield darter 0 0 0 0 0 0 0 0 0 0 0Stripeback darter 0 0 0 0 0 0 0 0 0 0 0Tesselated darter 1 2 18 11 8 4 40 9 8 9 11Glassy darter 0 0 0 0 0 0 0 0 0 0 0Fantail darter 5 41 85 3 19 0 3 20 18 62 19Greenside darter 10 5 5 1 5 6 24 86 19 69 6Hybrids 0 0 0 0 0 1 0 1 2 0 0
Total 467 450 524 725 832 684 714 692 485 932 379
Anomalies 3 3 6 190 13 10 6 10 5 5 53

66 (Technical Note 190–13–1, WLI IBI Case Study, December 2001)
Using Regional IBI to Characterize Condition of Northern Virginia Streams: A case study
Table 8 Raw fish data for 157 sites in study—Continued
Common name 155 156 157Little 50 Goose 55 Syco 643
American brook lamprey 0 0 0Gizzard shad 0 0 0American eel 0 0 0Redfin pickerel 0 0 0Eastern mudminnow 0 0 0Common carp 0 0 0Golden shiner 0 0 0Mountain redbelly dace 0 0 0Rosyside dace 90 3 0Fallfish 8 0 0Creek chub 58 5 13River chub 0 0 0Bluehead chub 0 0 0Cutlips minnow 7 0 0Blacknose dace 144 0 18Longnose dace 22 0 16Central stoneroller 8 3 67Eastern silvery minnow 0 0 0Common shiner 43 0 13Satinfin shiner 0 0 0Spotfin shiner 2 82 12Bluntnose minnow 16 28 53Fathead minnow 0 0 0Comely shiner 23 1 0Spottail shiner 21 0 57Swallowtail shiner 31 0 0Rosyface shiner 5 0 0Silverjaw minnow 4 14 0White sucker 30 2 3Creek chubsucker 2 36 0Northern hogsucker 28 2 3Torrent sucker 0 0 0Golden redhorse 0 0 0Shorthead redhorse 0 0 0Channel Catfish 0 0 0Yellow bullhead 0 12 1Brown bullhead 0 0 0Margined madtom 0 0 0Banded killifish 0 1 0Eastern mosquitofish 0 0 0Mottled sculpin 0 0 0Potomac sculpin 35 1 3Redbreast sunfish 7 161 27Green sunfish 0 28 7Pumpkinseed 0 0 1Bluegill 1 26 7Redear sunfish 0 0 0Rock bass 0 18 8White crappie 0 0 1Smallmouth bass 4 0 0Largemouth bass 0 0 2Shield darter 0 0 0Stripeback darter 0 0 0Tesselated darter 20 0 2Glassy darter 0 0 0Fantail darter 4 0 7Greenside darter 26 0 19Hybrids 0 1 0
Total 639 424 340
Anomalies 23 7 42

(Technical Note 190–13–1, WLI IBI Case Study, December 2001) 67
Using Regional IBI to Characterize Condition of Northern Virginia Streams: A case study
Figure 30 Metric evaluation: Separation of least from most impaired sites
1. Number of species
0
5
10
15
20
25
30
< 17 17-34 >34
Watershed size (km2)
Watershed size (km2) Watershed size (km2) Watershed size (km2)
Watershed size (km2) Watershed size (km2) Watershed size (km2)
Watershed size (km2) Watershed size (km2)
Nu
mb
er o
f sp
ecie
s
Nu
mb
er o
f sp
ecie
s
Nu
mb
er o
f n
on
-nati
ve s
pecie
s
2. Number of native species
0
5
10
15
20
25
< 17 17-34 >34
3. Number of non-native species
0
0.51
1.5
22.5
3
3.54
4.5
< 17 17-34 >34
4. Number of darter species
0
0.5
1
1.5
2
2.5
3
< 17 17-34 >34
Nu
mb
er o
f d
arte
r s
pecie
sN
um
ber o
f su
ck
er s
pecie
s
Nu
mb
er o
f m
inn
ow
sp
ecie
s
Percen
t d
om
inan
t sp
ecie
s
Nu
mb
er o
f d
arte
r a
nd
scu
lpin
sp
ecie
s
Nu
mb
er o
f su
nfi
sh
sp
ecie
s
Least impaired
Most impaired
5. Number of darter + sculpin species 6. Number of sunfish species
0
0.5
1
1.5
2
2.5
3
3.5
4
< 17 17-34 >340
0.5
1
1.5
2
2.5
3
3.5
< 17 17-34 >34
7. Number of sucker species 8. Number. of minnow species 9. Percent dominant species
0
0.5
1
1.5
2
2.5
3
< 17 17-34 >340
2
4
6
8
10
12
14
< 17 17-34 >340
10
20
30
40
50
60
70
< 17 17-34 >34

68 (Technical Note 190–13–1, WLI IBI Case Study, December 2001)
Using Regional IBI to Characterize Condition of Northern Virginia Streams: A case study
Figure 30 Metric evaluation: Separation of least from most impaired sites—Continued
10. Percent pioneers 11. Number of intolerant species 12. Percent tolerant individuals
0102030405060708090
100
< 17 17-34 >34
Watershed size (km2)
0
0.5
1
1.5
2
2.5
3
3.5
4
< 17 17-34 >34
Watershed size (km2)
0
1020
30
4050
60
7080
90
< 17 17-34 >34
Watershed size (km2)
Percen
t p
ion
eers
Nu
mb
er o
f in
tole
ran
t sp
ecie
s
Percen
t to
leran
t in
div
idu
als
13. Percent AHI 14. Percent AHI and DAH 15. Percent generalist feeders
0
0.05
0.1
0.15
0.2
0.25
0.3
0.35
< 17 17-34 >34
Watershed size (km2)
0
5
10
15
20
25
30
35
< 17 17-34 >34
Watershed size (km2)
0
10
20
30
40
50
60
< 17 17-34 >34
Watershed size (km2)
Percen
t A
HI
an
d D
AH
Percen
t A
HI
Percen
t gen
erali
st
feed
ers
16. Percent insectivorous cyprinids
10
0
20
30
40
50
60
70
80
< 17 17-34 >34
Watershed size (km2)
Percen
t in
secti
vo
ro
us
cyp
rin
ids
17. Percent benthic invertivores 18. Percent specialist carnivores
02468
10
1214161820
< 17 17-34 >340
5
10
15
20
25
< 17 17-34 >34Watershed size (km2) Watershed size (km2)
Percen
t b
en
thic
in
verti
vo
res
Percen
t sp
ecia
list
carn
ivo
res

(Technical Note 190–13–1, WLI IBI Case Study, December 2001) 69
Using Regional IBI to Characterize Condition of Northern Virginia Streams: A case study
Figure 30 Metric evaluation: Separation of least from most impaired sites—Continued
Least impaired
Most impaired
Least impaired
Most impaired
21. Percent simple lithophils
22. Percent simple lithophils - tol.
19. Percent specialist carnivores - tol. 20. Percent piscivores
0
5
10
15
20
25
< 17 17-34 >34
0
10
20
30
40
50
60
70
80
< 17 17-34 >340
5
10
15
20
25
< 17 17-34 >34
Watershed size (km2) Watershed size (km2)Watershed size (km2)
Percen
t sp
ecia
list
carn
. -
tol.
Percen
t sp
ecia
list
pis
civ
ores
Percen
t sim
ple
lit
ho
ph
ils
23. Number of late maturing species 24. Perc. var. substrate manip. spawners
0
10
20
30
40
50
60
< 17 17-34 >34
00.5
11.5
22.5
33.5
44.5
5
< 17 17-34 >34
0
10
20
30
40
50
60
70
< 17 17-34 >34
Watershed size (km2) Watershed size (km2)
Watershed size (km2)Watershed size (km2) Watershed size (km2)
Watershed size (km2)
To
tal
ind
ivid
uals
Percen
t an
om
ali
es
Percen
t h
yb
rid
s
Nu
mb
er o
f la
te m
atu
rin
g
sp
ecie
s
Percen
t sim
ple
lit
ho
ph
ils
tote
ran
t
Percem
t var.
su
bstr
ate
man
ip.
sp
aw
ners
25. Total individuals 26. Percent anomalies 27. Percent hybrids
0
100
200
300
400
500
600
< 17 17-34 >340
1
2
3
4
5
6
7
< 17 17-34 >34 0
2.0
4.0
6.0
8.0
1.0
1.2
< 17 17-34 >34
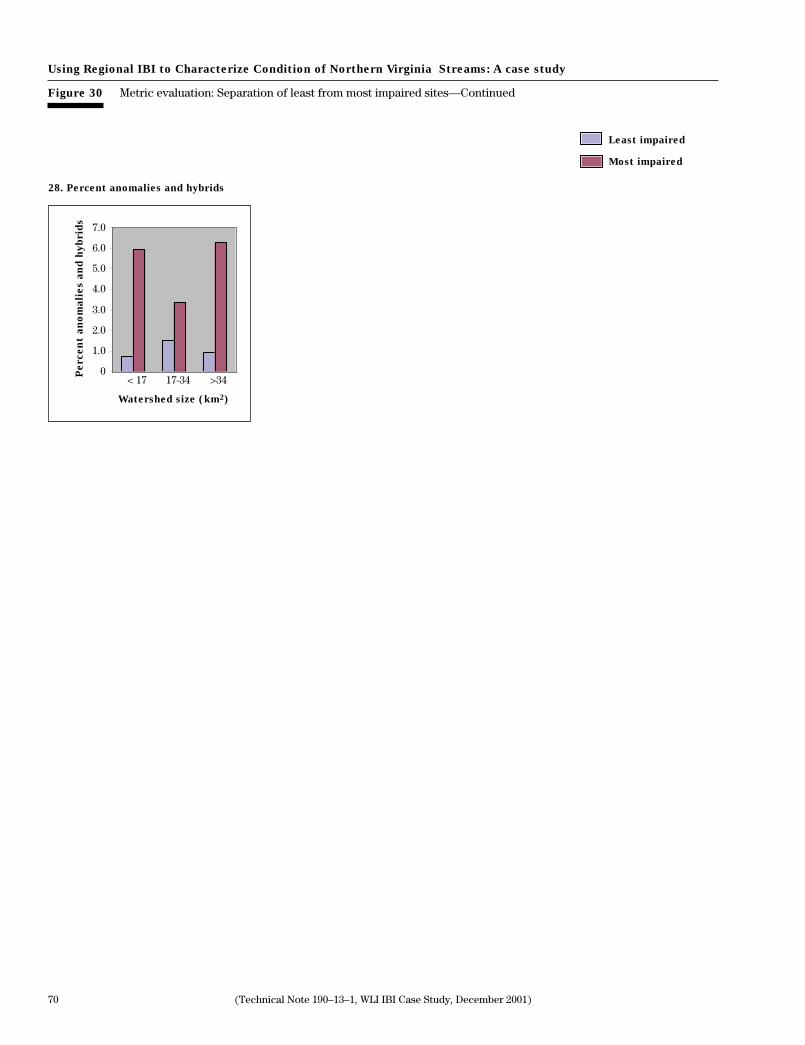
70 (Technical Note 190–13–1, WLI IBI Case Study, December 2001)
Using Regional IBI to Characterize Condition of Northern Virginia Streams: A case study
Figure 30 Metric evaluation: Separation of least from most impaired sites—Continued
Least impaired
Most impaired
28. Percent anomalies and hybrids
0
1.0
2.0
3.0
4.0
5.0
6.0
7.0
< 17 17-34 >34
Percen
t an
om
ali
es a
nd
hyb
rid
s
Watershed size (km2)

(Technical Note 190–13–1, WLI IBI Case Study, December 2001) 71
Using Regional IBI to Characterize Condition of Northern Virginia Streams: A case study
Figure 31 Correlation of individual attributes/metrics with the Human Disturbance Index (r = Pearson's correltationcoefficient)
1. Number of species (r = 0.44) 2. Number of native species (r = 0.49)
4. Number of darter species (r = 0.35)
5. Number of darter and sculpin species (r = 0.33)
05
101520253035
10 20 30 40Human Disturbance Index
0
5
10
15
20
25
10 20 30 40Human Disturbance Index
3. Number of non-native species (r = 0.07)
012345678
10 20 30 40
Human Disturbance Index
0
1
2
3
4
5
10 20 30 40
Human Disturbance Index
Nu
mb
er o
f sp
ecie
s
Nu
mb
er o
f su
nfi
sh
sp
ecie
s
Nu
mb
er o
f m
inn
ow
sp
ecie
s
Nu
mb
er o
f su
ck
er
sp
ecie
s
Nu
mb
er o
f d
arte
rsp
ecie
sN
um
ber o
f n
ati
ve
sp
ecie
s
Nu
mb
er o
f n
on
-nati
ve
sp
ecie
s
Nu
mb
er o
f d
arte
r a
nd
scu
lpin
sp
ecie
s
6. Number of sunfish species (r = - 0.12)
0
1
2
3
4
5
6
10 20 30 40
Human Disturbance Index
0
1
2
3
4
5
6
10 20 30 40
Human Disturbance Index
7. Number of sucker species (r = 0.23) 8. Number of minnow species (r = 0.40)
0
1
2
3
4
5
10 20 30 40
Human Disturbance Index
0
5
10
15
20
10 20 30 40
Human Disturbance Index

72 (Technical Note 190–13–1, WLI IBI Case Study, December 2001)
Using Regional IBI to Characterize Condition of Northern Virginia Streams: A case study
Figure 31 Correlation of individual attributes/metrics with the Human Disturbance Index (r = Pearson's correltationcoefficient)
9. Percent dominant species (r = - 0.41) 10. Percent pioneers (r = - 0.60)
11. Number of intolerant species (r = 0.54) 12. Percent tolerant individuals (r = - 0.62)
0
20
40
60
80
100
0
20
40
60
80
100
10 20 30 40
Human Disturbance Index
0
20
40
60
80
100
120
10 20 30 40
Human Disturbance Index
0
1
2
3
4
5
6
0 10 20 30 40 50Human Disturbance Index
10 20 30 40Human Disturbance Index
13. Percent AHI (r = - 0.39) 14. Percent AHI and DAH (r = - 0.37)
15. Percent generalist feeders (r = - 0.09)
10 20 30 40Human Disturbance Index
0
10
20
30
40
50
60
0
10
20
30
40
50
60
10 20 30 40Human Disturbance Index
020406080
100120
10 20 30 40Human Disturbance Index
Percen
t d
om
inan
tsp
ecie
sN
um
ber o
f in
tole
ran
t
sp
ecie
s
Percen
t A
HI
Percen
t gen
erali
st
feed
ers
Percen
t in
secti
v
Cyp
rin
ids
Percen
t p
ion
eers
Percen
t to
leran
tin
div
idu
als
Percen
t A
HI
an
d D
AH
16. Percent insectiv. Cyprinids (r = 0.37)
0
20
40
60
80
100
10 20 30 40Human Disturbance Index
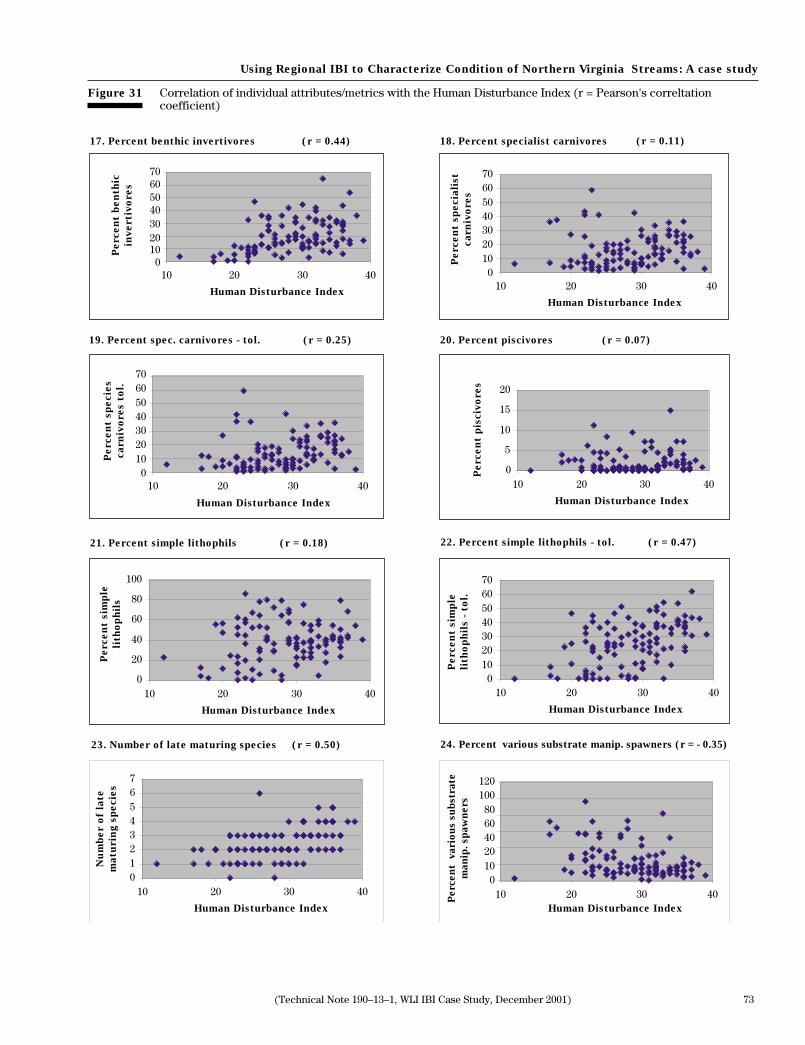
(Technical Note 190–13–1, WLI IBI Case Study, December 2001) 73
Using Regional IBI to Characterize Condition of Northern Virginia Streams: A case study
Figure 31 Correlation of individual attributes/metrics with the Human Disturbance Index (r = Pearson's correltationcoefficient)
17. Percent benthic invertivores (r = 0.44) 18. Percent specialist carnivores (r = 0.11)
10 20 30 40
Human Disturbance Index10 20 30 40
Human Disturbance Index
19. Percent spec. carnivores - tol. (r = 0.25) 20. Percent piscivores (r = 0.07)
0
5
10
15
20
10 20 30 40
Human Disturbance Index
10 20 30 40
Human Disturbance Index
21. Percent simple lithophils (r = 0.18) 22. Percent simple lithophils - tol. (r = 0.47)
10 20 30 40
Human Disturbance Index
0
20
40
60
80
100
10 20 30 40
Human Disturbance Index
23. Number of late maturing species (r = 0.50) 24. Percent various substrate manip. spawners (r = - 0.35)
10 20 30 40Human Disturbance Index
01234567
01020406080
100120
010203040506070
010203040506070
010203040506070
010203040506070
10 20 30 40
Human Disturbance Index
Percen
t b
en
thic
inverti
vo
res
Percen
t sp
ecie
s
carn
ivo
res t
ol.
Percen
t sim
ple
lith
op
hil
s
Nu
mb
er o
f la
te
matu
rin
g s
pecie
s
Percen
t sim
ple
lith
op
hil
s -
to
l.
Percen
t v
ario
us s
ubstr
ate
man
ip. spaw
ners
Percen
t p
isciv
ores
Percen
t sp
ecia
list
carn
ivo
res

74 (Technical Note 190–13–1, WLI IBI Case Study, December 2001)
Using Regional IBI to Characterize Condition of Northern Virginia Streams: A case study
Figure 31 Correlation of individual attributes/metrics with the Human Disturbance Index (r = Pearson's correltationcoefficient)
25. Total individuals (r = - 0.11) 25. Percent anomalies (r = - 0.36)
27. Percent hybrids (r = - 0.22) 28. Percent anomalies and hybrids (r = - 0.38)
0
5
10
15
20
25
30
10 20 30 40Human Disturbance Index
05
10152025303540
10 20 30 40Human Disturbance Index
0
5
10
15
20
2530
10 20 30 40Human Disturbance Index
0
200
400
600
800
1000
10 20 30 40Human Disturbance Index
To
tal
ind
ivid
uals
Percen
t h
yb
rid
s
Percen
t an
om
ali
es
an
d h
yb
rid
sP
ercen
t an
om
ali
es
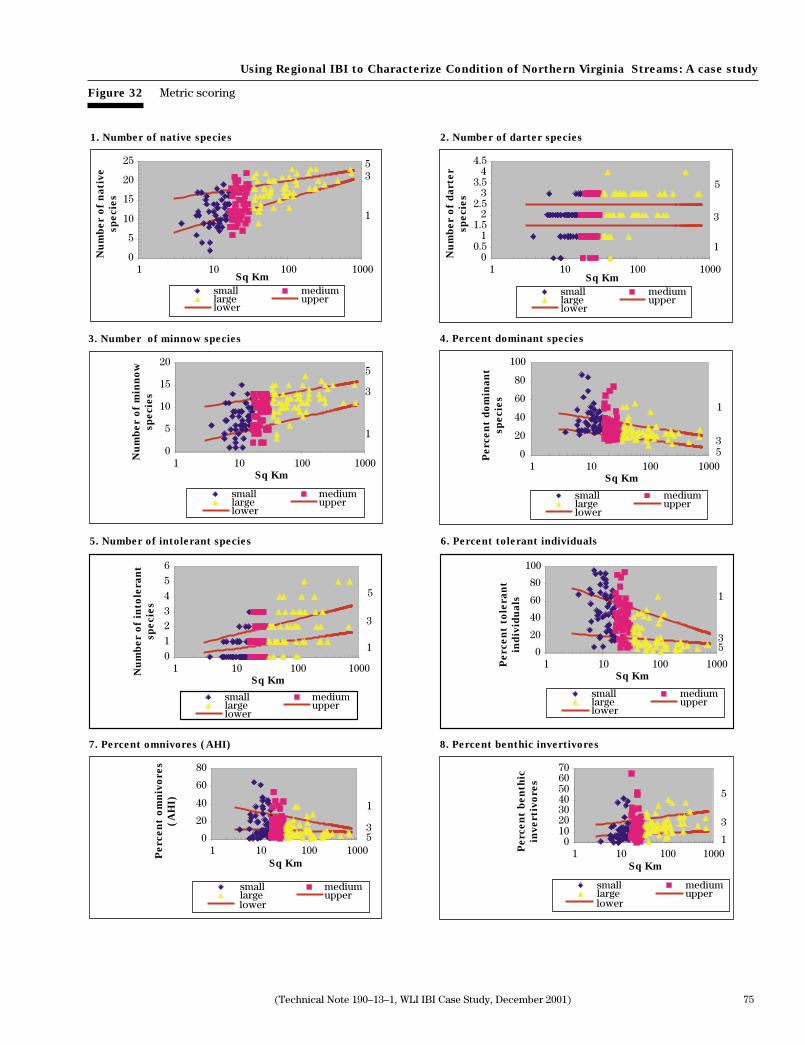
(Technical Note 190–13–1, WLI IBI Case Study, December 2001) 75
Using Regional IBI to Characterize Condition of Northern Virginia Streams: A case study
Figure 32 Metric scoring
1. Number of native species 2. Number of darter species
0
5
10
15
20
25
1 10 100 1000Sq Km
small mediumlarge upperlower
00.5
11.5
22.5
33.5
44.5
1 10 100 1000Sq Km
small mediumlarge upperlower
53
1
5
3
1
3. Number of minnow species 4. Percent dominant species
0
5
10
15
20
1 10 100 1000Sq Km
small mediumlarge upperlower
0
20
40
60
80
100
1 10 100 1000Sq Km
5
3
1
53
1
small mediumlarge upperlower
5. Number of intolerant species 6. Percent tolerant individuals
0
1
23
4
5
6
1 10 100 1000Sq Km
small mediumlarge upperlower
lower lower
0
20
40
60
80
100
1 10 100 1000Sq Km
small mediumlarge upperlower
5
3
1
1
35
7. Percent omnivores (AHI) 8. Percent benthic invertivores
0
20
40
60
80
1 10 100 1000Sq Km
small mediumlarge upper
010203040506070
1 10 100 1000Sq Km
small mediumlarge upper
1
35
5
3
1
Nu
mb
er o
f n
ati
ve
sp
ecie
s
Nu
mb
er o
f m
inn
ow
sp
ecie
s
Nu
mb
er o
f d
arte
r
sp
ecie
s
Percen
t d
om
inan
t
sp
ecie
s
Nu
mb
er o
f in
tole
ran
t
sp
ecie
s
Percen
t to
leran
t
ind
ivid
uals
Percen
t b
en
thic
inverti
vo
res
Percen
t o
mn
ivo
res
(A
HI)

76 (Technical Note 190–13–1, WLI IBI Case Study, December 2001)
Using Regional IBI to Characterize Condition of Northern Virginia Streams: A case study
Figure 32 Metric scoring
9. Percent specialist carnivores - tolerants 10. Percent simple lithophils - tolerants
11. Number of late maturing species 12. Percent anomalies
0
10
20
30
40
50
60
1 10 100 1000Sq Km
01020304050607080
1 10 100 1000Sq Km
012345678
1 10 100 1000Sq Km
0
5
10
15
20
25
30
1 10 100 1000Sq Km
5
3
1
1
35
5
3
1
5
3
1
lower
small mediumlarge upper
lower
small mediumlarge upper
lower
small mediumlarge upper
lower
small mediumlarge upper
Nu
mb
er o
f la
te
matu
rin
g s
pecie
s
Percen
t sim
ple
lith
op
hil
s -
to
leran
ts
Percen
t an
om
ali
es
Percen
t sp
ecia
list
carn
ivo
res -
to
leran
ts

(Technical Note 190–13–1, WLI IBI Case Study, December 2001) 77
Using Regional IBI to Characterize Condition of Northern Virginia Streams: A case study
Figure 33 Distribution charts for species collected in the study area
N
Species collected at site
Species not collected at site
Goose Creek watershec
Occoquan watershed
Rappahannock watershed
American Brook Lamprey
American Eel
Gizzard Shad
Redfin Pickerel
Eastern Mudminnow

78 (Technical Note 190–13–1, WLI IBI Case Study, December 2001)
Using Regional IBI to Characterize Condition of Northern Virginia Streams: A case study
Figure 33 Distribution charts for species collected in the study area—Continued
Common Carp Golden Shiner
Mountain Redbelly Dace Roseyside Dace
Fallfish
N
Species collected at site
Species not collected at site
Goose Creek watershec
Occoquan watershed
Rappahannock watershed

(Technical Note 190–13–1, WLI IBI Case Study, December 2001) 79
Using Regional IBI to Characterize Condition of Northern Virginia Streams: A case study
Figure 33 Distribution charts for species collected in the study area—Continued
Creek Chub River Chub
Bluehead Chub Cutlips Minnow
Blacknose Dace
N
Species collected at site
Species not collected at site
Goose Creek watershec
Occoquan watershed
Rappahannock watershed

80 (Technical Note 190–13–1, WLI IBI Case Study, December 2001)
Using Regional IBI to Characterize Condition of Northern Virginia Streams: A case study
Figure 33 Distribution charts for species collected in the study area—Continued
Longnose Dace Central Stoneroller
Eastern Silvery Minnow Common Shiner
Satinfin Shiner
N
Species collected at site
Species not collected at site
Goose Creek watershec
Occoquan watershed
Rappahannock watershed

(Technical Note 190–13–1, WLI IBI Case Study, December 2001) 81
Using Regional IBI to Characterize Condition of Northern Virginia Streams: A case study
Figure 33 Distribution charts for species collected in the study area—Continued
Spotfin Shiner Bluntnose Minnow
Fathead Minnow Comely Shiner
Spottail Shiner
N
Species collected at site
Species not collected at site
Goose Creek watershec
Occoquan watershed
Rappahannock watershed

82 (Technical Note 190–13–1, WLI IBI Case Study, December 2001)
Using Regional IBI to Characterize Condition of Northern Virginia Streams: A case study
Figure 33 Distribution charts for species collected in the study area—Continued
Swallowtail Shiner Roseyface Shiner
Silverjaw Minnow White Sucker
Creek Chubsucker
N
Species collected at site
Species not collected at site
Goose Creek watershec
Occoquan watershed
Rappahannock watershed

(Technical Note 190–13–1, WLI IBI Case Study, December 2001) 83
Using Regional IBI to Characterize Condition of Northern Virginia Streams: A case study
Figure 33 Distribution charts for species collected in the study area—Continued
Northern Hogsucker Torrent Sucker
Golden Redhorse Shorthead Redhorse
Channel Catfish
N
Species collected at site
Species not collected at site
Goose Creek watershec
Occoquan watershed
Rappahannock watershed

84 (Technical Note 190–13–1, WLI IBI Case Study, December 2001)
Using Regional IBI to Characterize Condition of Northern Virginia Streams: A case study
Figure 33 Distribution charts for species collected in the study area—Continued
Yellow Bullhead Brown Bullhead
Margined Madtom Banded Killfish
Eastern Mosquitofish
N
Species collected at site
Species not collected at site
Goose Creek watershec
Occoquan watershed
Rappahannock watershed

(Technical Note 190–13–1, WLI IBI Case Study, December 2001) 85
Using Regional IBI to Characterize Condition of Northern Virginia Streams: A case study
Figure 33 Distribution charts for species collected in the study area—Continued
Mottled Sculpin Potomac Sculpin
Redbreast Sunfish Green Sunfish
Pumpkinseed
N
Species collected at site
Species not collected at site
Goose Creek watershec
Occoquan watershed

86 (Technical Note 190–13–1, WLI IBI Case Study, December 2001)
Using Regional IBI to Characterize Condition of Northern Virginia Streams: A case study
Figure 33 Distribution charts for species collected in the study area—Continued
Bluegill Redear Sunfish
Rock Bass White Crappie
Smallmouth Bass
N
Species collected at site
Species not collected at site
Goose Creek watershec
Occoquan watershed
Rappahannock watershed

(Technical Note 190–13–1, WLI IBI Case Study, December 2001) 87
Using Regional IBI to Characterize Condition of Northern Virginia Streams: A case study
Figure 33 Distribution charts for species collected in the study area—Continued
Largemouth Bass Sheild Darter
Stripeback Darter Tesselated Darter
Glassy Darter
N
Species collected at site
Species not collected at site
Goose Creek watershec
Occoquan watershed
Rappahannock watershed
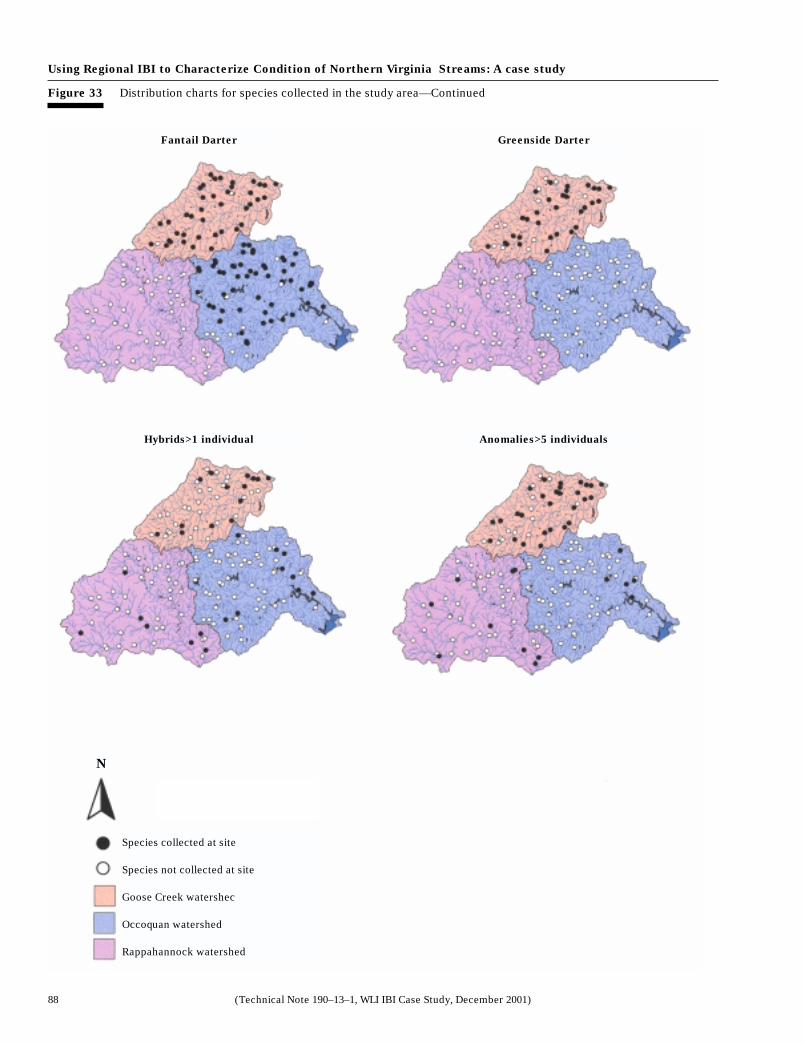
88 (Technical Note 190–13–1, WLI IBI Case Study, December 2001)
Using Regional IBI to Characterize Condition of Northern Virginia Streams: A case study
Figure 33 Distribution charts for species collected in the study area—Continued
Fantail Darter Greenside Darter
Hybrids>1 individual Anomalies>5 individuals
N
Species collected at site
Species not collected at site
Goose Creek watershec
Occoquan watershed
Rappahannock watershed

(Technical Note 190–13–1, WLI IBI Case Study, December 2001) 89
Using Regional IBI to Characterize Condition of Northern Virginia Streams: A case study
Figure 34 Integrity classification for fish sampling locations
Integrity Class
Excellent
Good
Fair
Poor
Very-poor

90 (Technical Note 190–13–1, WLI IBI Case Study, December 2001)
Using Regional IBI to Characterize Condition of Northern Virginia Streams: A case study
Figure 35 Goose Creek Watershed sample locations
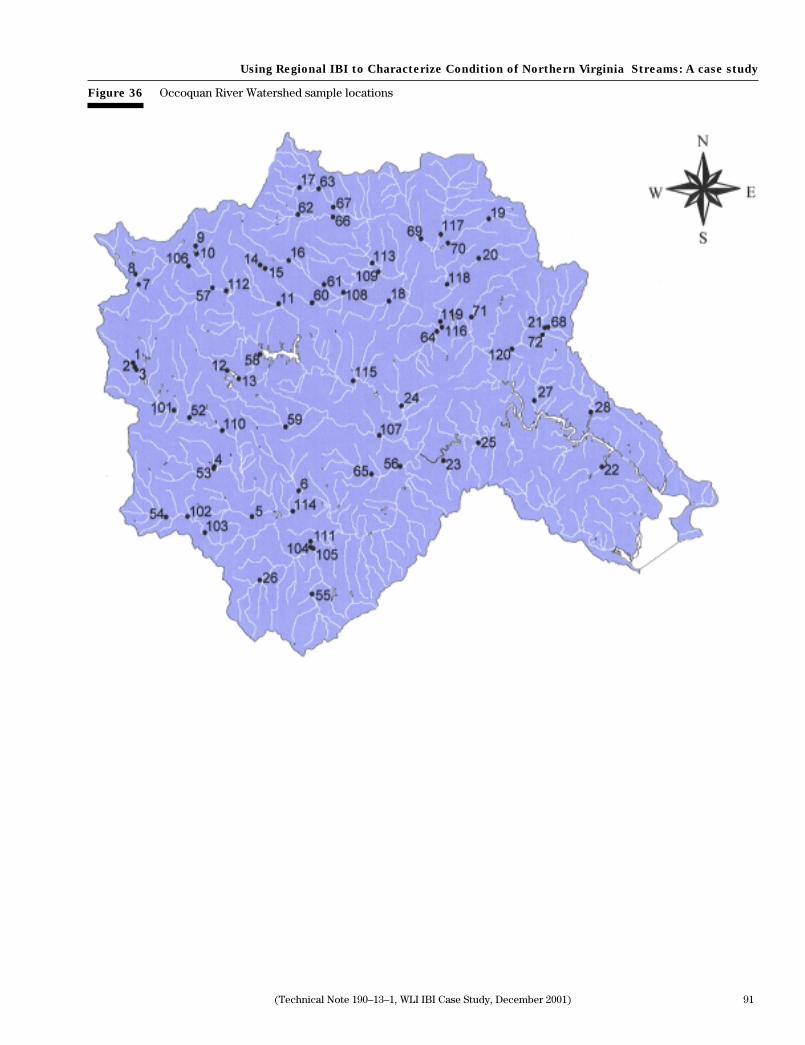
(Technical Note 190–13–1, WLI IBI Case Study, December 2001) 91
Using Regional IBI to Characterize Condition of Northern Virginia Streams: A case study
Figure 36 Occoquan River Watershed sample locations

92 (Technical Note 190–13–1, WLI IBI Case Study, December 2001)
Using Regional IBI to Characterize Condition of Northern Virginia Streams: A case study
Figure 37 Rappahannock River Watershed sample locations